
Abstract
Adolescent idiopathic scoliosis (AIS) is a three-dimensional curvature of spine. Children with AIS and low bone quality have higher chance to get curve progression leading to bigger spinal curvature. In addition, bone quality affects acoustic impedance of bone, thus influencing the reflection coefficient of ultrasound signal from the soft tissue–bone interface. This study aimed to estimate the bone quality of AIS patients based on the reflection coefficients to determine the correlation of the bone quality with curve severity. A simple bone model was used to develop an equation to calculate the reflection coefficient value. Experiments were conducted on five different phantoms. Acrylic was used to design a vertebral shape to study the effect of surface roughness and inclination, including: smooth flat surface (SFS), smooth curved surface (SCS), rough curved surface (RCS), and the rough curved inclined surface (RCIS). A clinical study with 37 AIS patients were recruited. The estimated reflection coefficient values of plate phantoms agreed well with the predicted values and the maximum error was 6.7%. The reflection coefficients measured from the acrylic-water interface for the SFS, SCS, RCS, RCIS (3° and 5°) were 0.37, 0.33, 0.28, (0.23 and 0.12), respectively. The surface roughness and inclination increased the reflection loss. From the clinical data, the average reflection coefficients for children with AIS were 0.11 and 0.07 for the mild curve group and the moderate curve group, respectively. A moderate linear correlation was found between the reflection coefficients and curve severity (
Keywords
Introduction
Scoliosis is a three-dimensional spinal deformity characterized by a lateral curvature of the spine. Adolescent idiopathic scoliosis (AIS) is the most commonly diagnosed form of scoliosis with unknown etiology, 1 affecting 1%–4% adolescent population especially children from 10 to 16 years old.2,3 The severely progressed curves can have negative impact not only on patients’ psychosocial health but also on their physical well-being such as back pain, diminished pulmonary function, and increased mortality rate.4,5 The standard method to measure the severity and monitor the progression of scoliosis is to measure the curvature on the frontal radiograph, which is called the Cobb angle. However, taking radiographs has a significant negative impact on patient well-being. The radiation dose received by a scoliosis patient during radiographic examination has been estimated at between 150 and 678 µSv.6,7 On average, a 10-year-old child who is diagnosed with scoliosis may require 10–22 radiographs during the entire treatment period.8,9 The lifetime risk of radiation is also more pronounced in children than in adults.
From literature, osteopenia or low bone density, quantified by bone mineral density (BMD), is more commonly observed in children with AIS than the normal children.10–13 BMD measures the amount of calcium and is usually tested by dual-energy X-ray absorptiometry (DXA). Furthermore, children with AIS not only have lower BMD, but also have lower bone quality. 14 Bone quality, which is related to bone strength, describes its microarchitecture, mineralization, turnover rate, and micro-fractures. 15 Bone quality can be assessed by radiographic methods. 4 Again, the ionizing radiation exposure to children is a concern. Studies have revealed that the AIS groups have deteriorated bone quality and lower bone mass when compared with the control groups.14,16–19 Lee et al. also found the Cobb angle of scoliosis was inversely and independently associated with BMD. 12 Furthermore, researchers have reported that bone quality could be a risk factor and used to predict the progression of AIS.20–22 Improving children’s bone strength could reduce the risk of curve progression. Treatment management may be provided more effectively if the child has a higher risk of curve progression.
On the other hand, quantitative ultrasound (QUS) is a non-invasive and ionizing radiation-free technique to evaluate bone quality. Lam et al. used the ultrasound transmission-through technique to measure bone properties at calcanei on healthy group as well as both mild and moderate AIS subjects.14,23 Two measured QUS parameters, namely speed of sound (SOS) and broadband ultrasound attenuation (BUA), and the third derived stiffness index (SI), which is a combination of BUA and SOS, were found statistically lower in AIS group than the healthy control group. Further, they suggested that SI was an independent and prognostic factor for curve progression and treatment planning. 23 Similar to the study of finding the relationship between BMD and severity of AIS, 12 Du et al. attempted to correlate SOS with Cobb angles. 24 They found AIS subjects had lower SOS-values compared to non-scoliotic controls; however, they concluded no significant correlation between SOS and Cobb angles. So far, research findings have shown consistently that both bone quantity (BMD) and bone quality (SOS, BUA, and SI) could be found lower in AIS patients as compared to those of normal controls. The findings of low bone quality or BMD in patients with AIS implied that low bone quality could be concurrent with AIS. Studying bone quality in AIS could gain a better understanding of the etiology and bone health in AIS. Furthermore, bone quality was also used as a risk factor to predict progression of AIS,23,24 which could assist in the prevention of curve progression and treatment plans of AIS.12–14 However, a positive correlation between bone quantity or quality and curve severity has not been assertively established yet. In addition, the QUS usually uses transmission method to assess bone quality at peripheral sites other than spines, namely calcaneus and radius.14,24 The use of reflected echoes from spinal scans to evaluate bone quality of the spines is limited.
When ultrasound propagates into the tissue, energy is reflected by any scatter which has a contrast of acoustic impedance with the surrounding, and the strength of the echo mainly depends upon the magnitude of the contrast. Soft tissue–bone interface is an example of strong reflector.25,26 Given that the acoustic impedance of bone, which is a product of SOS and density, is related to the bone stiffness, and thus bone quality. Zheng et al. proposed to measure the ultrasound echoes directly from spines to assess bone quality and correlated with spinal severity of AIS. 27 They introduced a reflection index (RI), which is a ratio of the received echo from the vertebra and a reference echo from a referenced phantom. The results showed that the RI decreased with the increase of curve severity; however, the correlation coefficient was small and the thickness of the soft tissue was ignored. Due to the limited fundamental work and experimental justification in the study of Zheng et al. we would like to develop a framework to explain the fundamental phenomenon of ultrasound echo from spine to assess bone properties.
Therefore, this study aimed to (a) develop the theoretical framework to explore the feasibility of determining reflection coefficients from the ultrasound echoes acquired directly from spines, and (b) investigate if there are correlations between the reflection coefficient with the curve severity in children with AIS.
Materials and methods
Reflection coefficient and bone properties
In this study, the clinical application of the reflection coefficient is to estimate the bone properties of spine. The elastic modulus of cortical bone, E, varies with its density
Theoretical formulation
A simple bone model with the cortex overlaid by soft tissue (Figure 1(a)) was used to develop the correlation of the reflection coefficient and the amplitude of the ultrasound signals. Both cortex and soft tissue are assumed to be homogeneous and isotropic. The thickness of soft tissue is

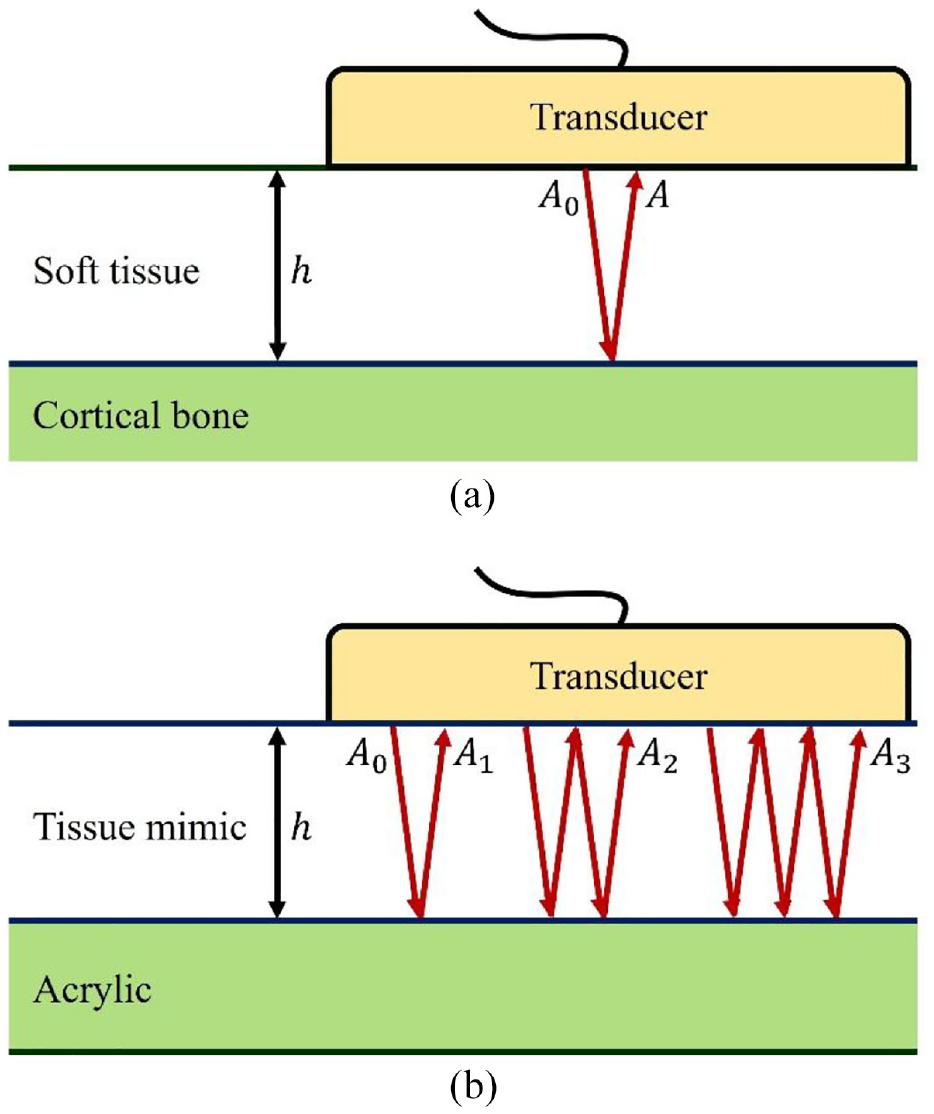
(a) A simple bone model with a transducer on top of soft tissue which covers the cortical bone and (b) the primary and multiple reflections within the tissue mimicking layer used to estimate
where A0 and A are the amplitudes of the ultrasound source and echo signals, respectively;
The relationship between bone properties and the reflection coefficient is expressed as
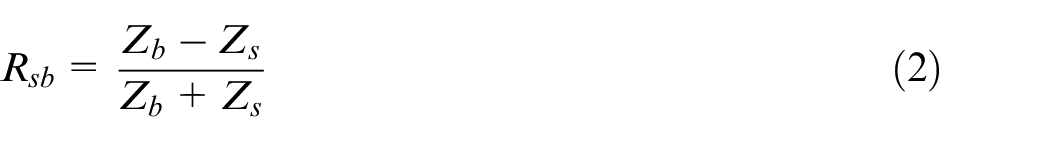
where
The extraction of
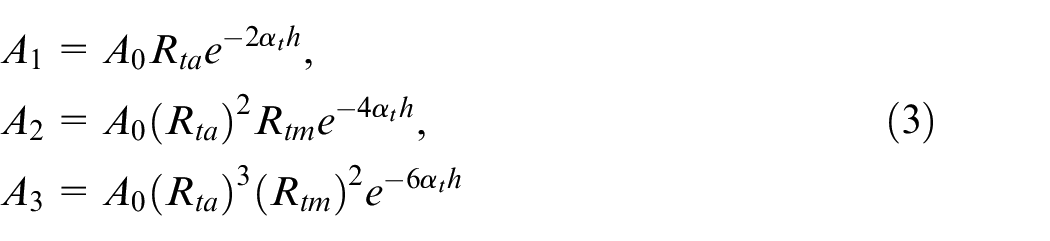
where A0, A1, A2, A3 are the magnitude of the source signal, first, second and third reflected signals. The subscripts
By defining
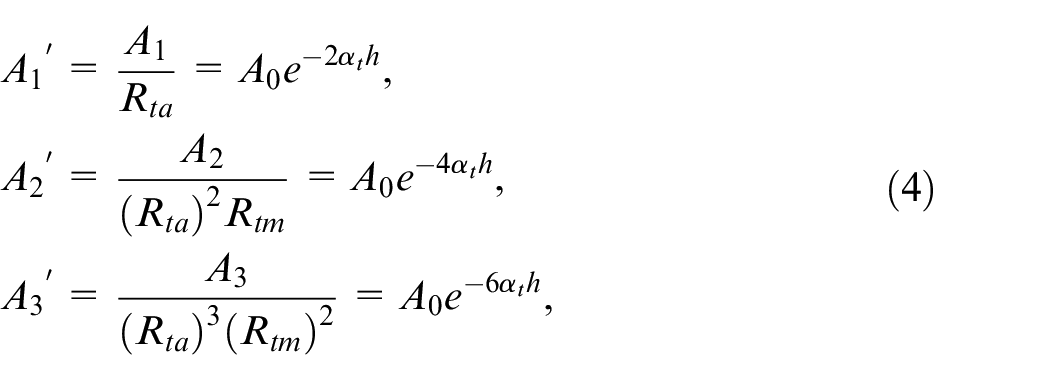
equation (4) can be generalized as

Taking logarithm of both sides linearizes the above equation

where
Plated phantom study
Experimental setup
The SonixTouch Q+ultrasound system equipped with a 128-element C5-2/60 convex transducer (BK Medical, MA, USA) was employed for the study. The center frequency of the transducer was set at 3.3 MHz for the whole study unless otherwise stated.
Figure 2(a) shows the experimental setup on one of the testing materials, acrylic plate. The transducer was mounted on an aluminum frame and placed in contact with a piece of 2.9-cm thick blue phantom (BP) (CAE Healthcare, FL, USA) overlying an acrylic plate, which was supported by two rubber corks. BP was used because it has ultrasound properties similar to those of soft tissue. Ultrasonic gel (Parker Laboratories, NJ, USA) was applied to all contacting surfaces between the transducer and the BP as well as between the BP and the test plate to ensure good coupling. The thickness of BP after being compressed by the transducer was approximately 2.2 cm. The received RF ultrasound signal was recorded and used to determine the
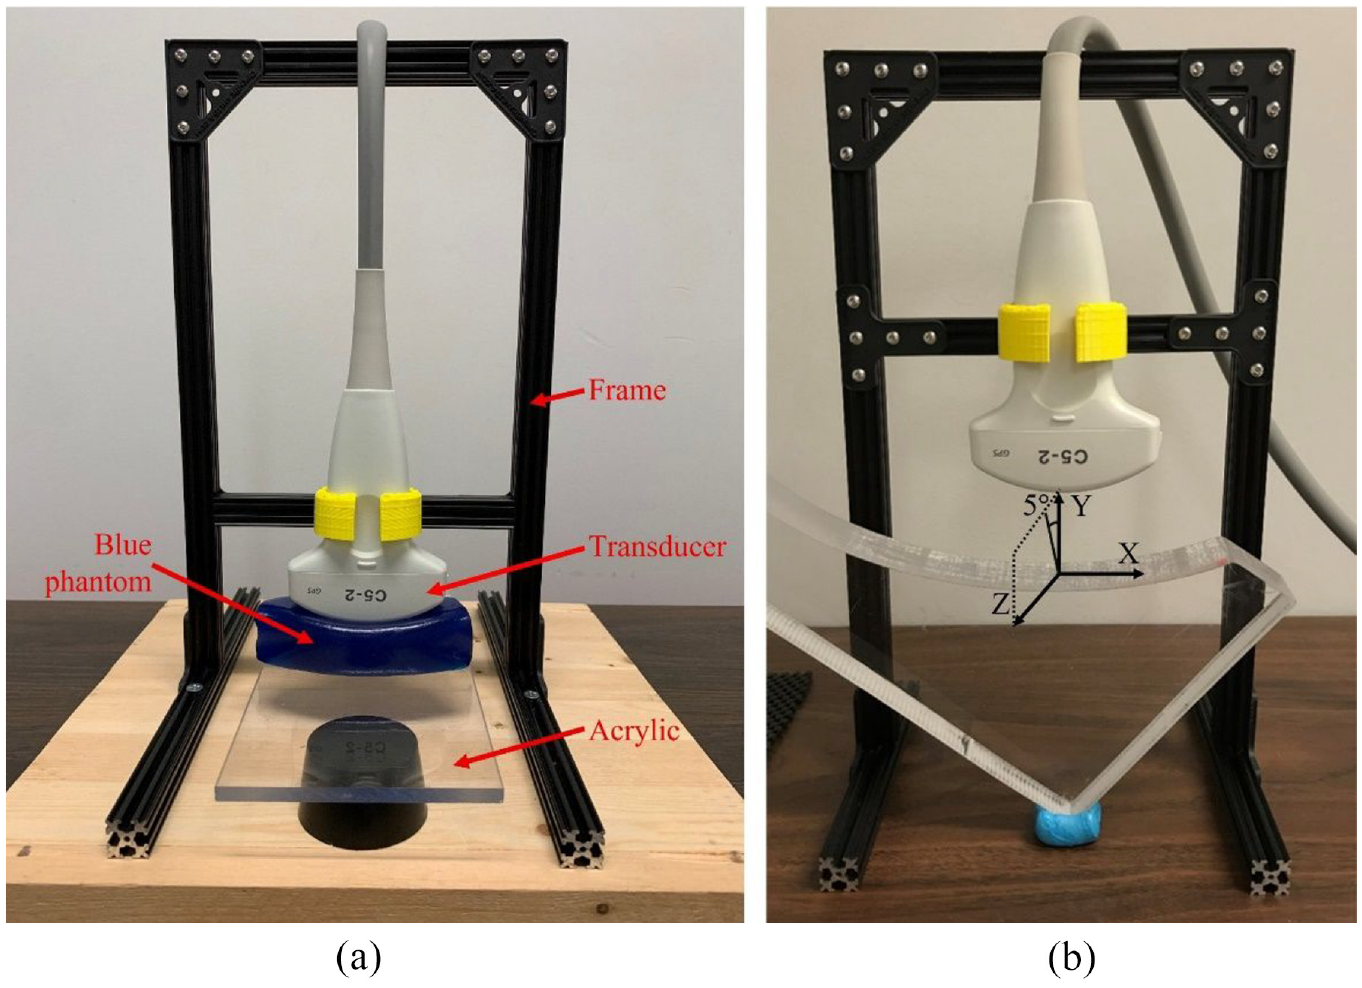
(a) Experimental setup to measure the ultrasound properties of Blue Phantom and an acrylic plate and (b) experimental setup to measure the reflection from a rough curved surface. The surface is also tilted about 5° around the X axis (in YZ plane).
Reflection coefficient (
) of five different materials
Various phantoms were used to validate the theory and to study the affecting factors on the ultrasound signals. Based on the previous experimental setup, the acrylic plate was also replaced by different metal plates such as aluminum, brass, copper, and steel to estimate their reflection coefficients with BP. The stiffness of the tested materials ranged from soft to hardest (related to density) while the acoustic impedance of bone should be between that of acrylic and aluminum. Equation (1) was used to determine the reflection coefficient of the five materials based on the measured ultrasound signals.
The determination of theoretical reflection coefficients is based on equation (2) and requires the predetermined densities, velocities, or acoustic impedance. The density of the BP was measured by the Archimedes’ principle while the densities of the five plates were referenced from the literature. The velocities of the used materials, i.e. BP and five plates, were measured by the ultrasonic pulse-echo method using the previous described framework. We obtained the travel time from the RF signals and measured the thicknesses by caliper. The velocity is the ratio between the travel time and the thickness. Regarding the matching layer of the transducer, its acoustic impedance is pooled from reference. 35 These values used for the calculation of reflection coefficients are listed in Table 1.
Properties of the materials used in the study.
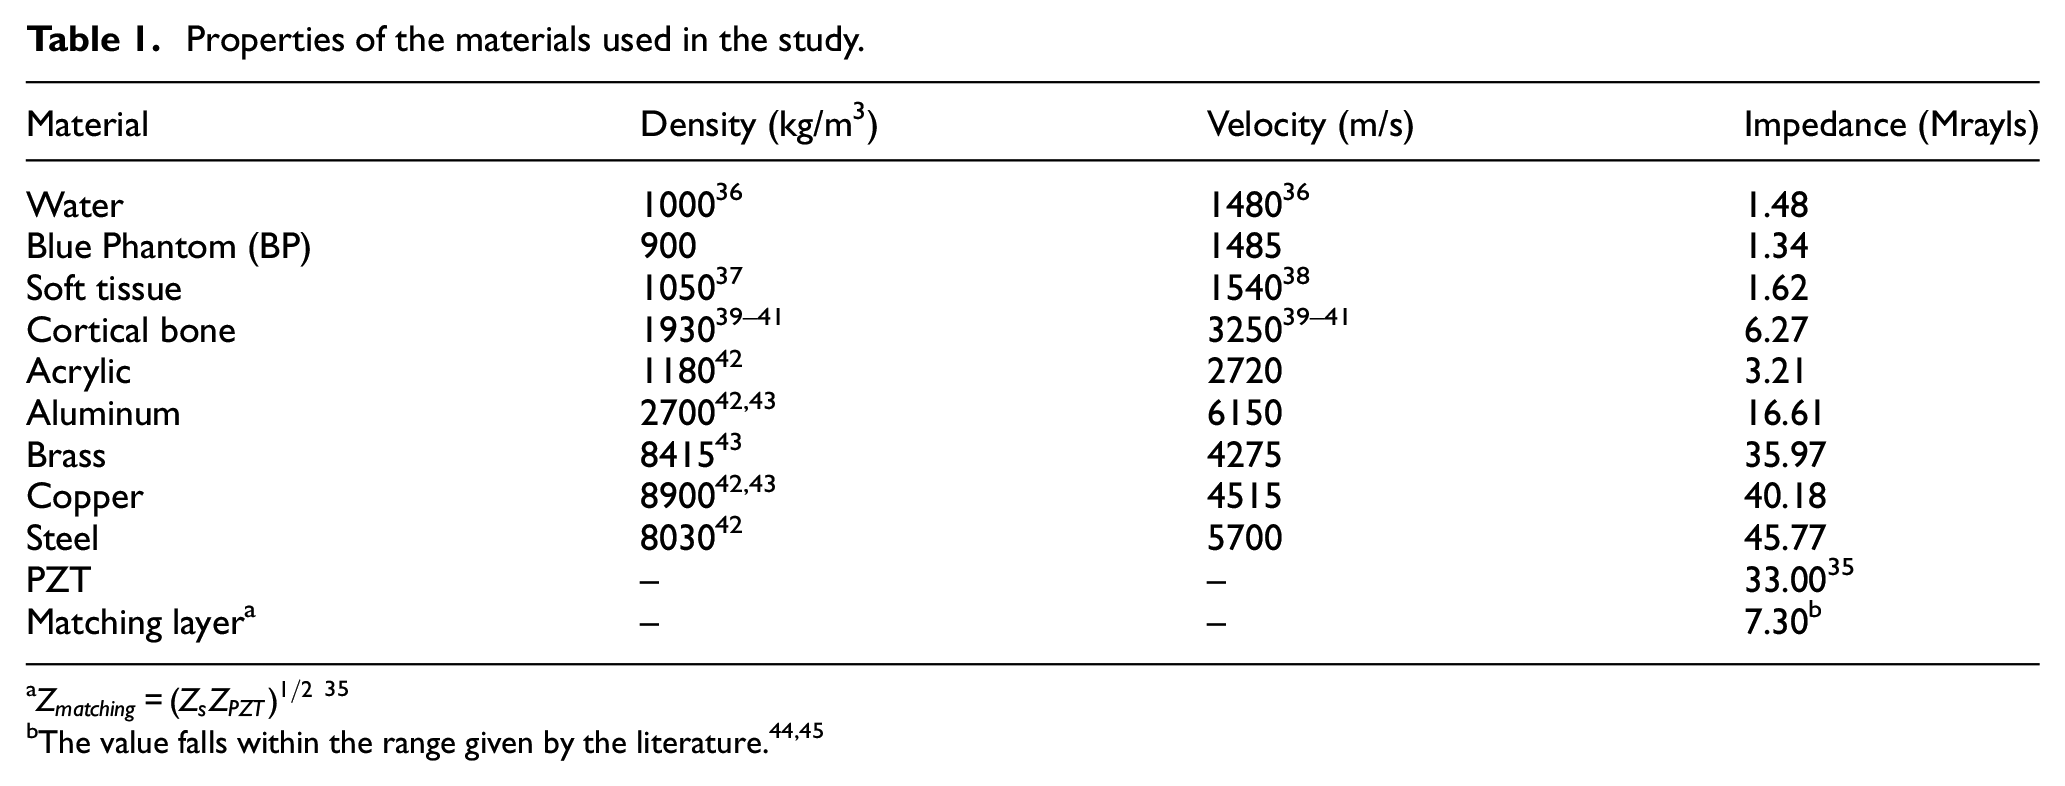
a
Effect of surface roughness and inclination upon the echo-amplitude
Beside the plate study, a 2.4-cm thick acrylic plate with a 19-cm diameter arc on one side (Figure 2(b)) was used to mimic the posterior arch of a vertebra. The surface of the arc was rough, which was caused by the circular-saw cutting. The transducer was placed at 3.5 cm from the rough surface of the phantom, which was similar to a normal distance from an ultrasound transducer to a lamina when the ultrasound was used to scan a scoliotic patient. To investigate the influence of the surface roughness, three scans were performed on (a) a smooth flat surface (SFS), (b) rough curved surface (RCS), and (c) a smooth curved surface (SCS) which was created by sanding the rough curved surface. The phantom at RCS was also tilted at about 3° and 5° in the direction perpendicular to the long axis of the transducer array, named RCIS, to examine the effect of inclination on the recorded echo amplitudes (Figure 2(b)). The experiments were carried out in a water tank with both the transducer and the phantom immersed in water.
Cadaveric vertebral phantom study
A second phantom study was performed on a cadaveric dry lumbar vertebra. The vertebra phantom was fixed to the bottom of the water tank with LePage® Fun-Tak® mounting putty (Lepage, Canada). Similar to the acrylic arch phantom experiment, the vertebra was submerged in water with the transducer set at 3.5 cm from the laminae. Again, the reflection coefficient of the cortical bone surface was calculated using equation (1) with the measured ultrasound signal amplitudes.
In vivo pilot study
The in vivo pilot study was to further validate the proposed approach and to investigate if there was a correlation between the reflection coefficient with the curve severity in children with AIS.
Study participants
Thirty-seven children (9 M; 28 F), aged 14.0 ± 1.6 years old (ranged between 11 and 17), were recruited from the local scoliosis clinic. Ethics approval was obtained from the University of Alberta Health Research Ethics Board (Pro00005707). All participants signed the written consents prior to participation. The inclusion criteria were participants who (1) were diagnosed with AIS, (2) had the age ranging from 10 to 18 years old, (3) had Cobb angle between 10° and 45° (mild to moderate cases), and (4) had no prior surgeries.
Data acquisition
The same ultrasound system described in the phantom study with the convex transducer was used for the in vivo study. The scanning parameters used were: −15 dB power, 6-cm imaging depth, and 50% gain with linear time gain compensation (TGC). These parameters were selected based on the previous studies with some minor adjustments to ensure optimal image quality. 46 Data was obtained by an operator with 2-year experience in using the ultrasound system to scan AIS subjects. The participants were asked to stand in a standard upright posture (Figure 3(a)) within a frame to prevent twisting of the body. The ultrasound gel was applied to their backs prior to scanning. During scanning, the transducer was positioned perpendicular to the coronal profile of the subjects and moved along the spinal curve. Transverse B-mode images (cross-section image of a vertebra) (Figure 3(b)) were displayed in real-time, this allowed the operator to ensure the transducer was almost perpendicular to the lamina region. In this study, we used the low lumbar region (either L4 or L5) for analyses because these two vertebrae usually had little axial rotation in the spinal axis. Approximately 50–100 B-mode images and the corresponding radio-frequency (RF) data were exported for further analysis.
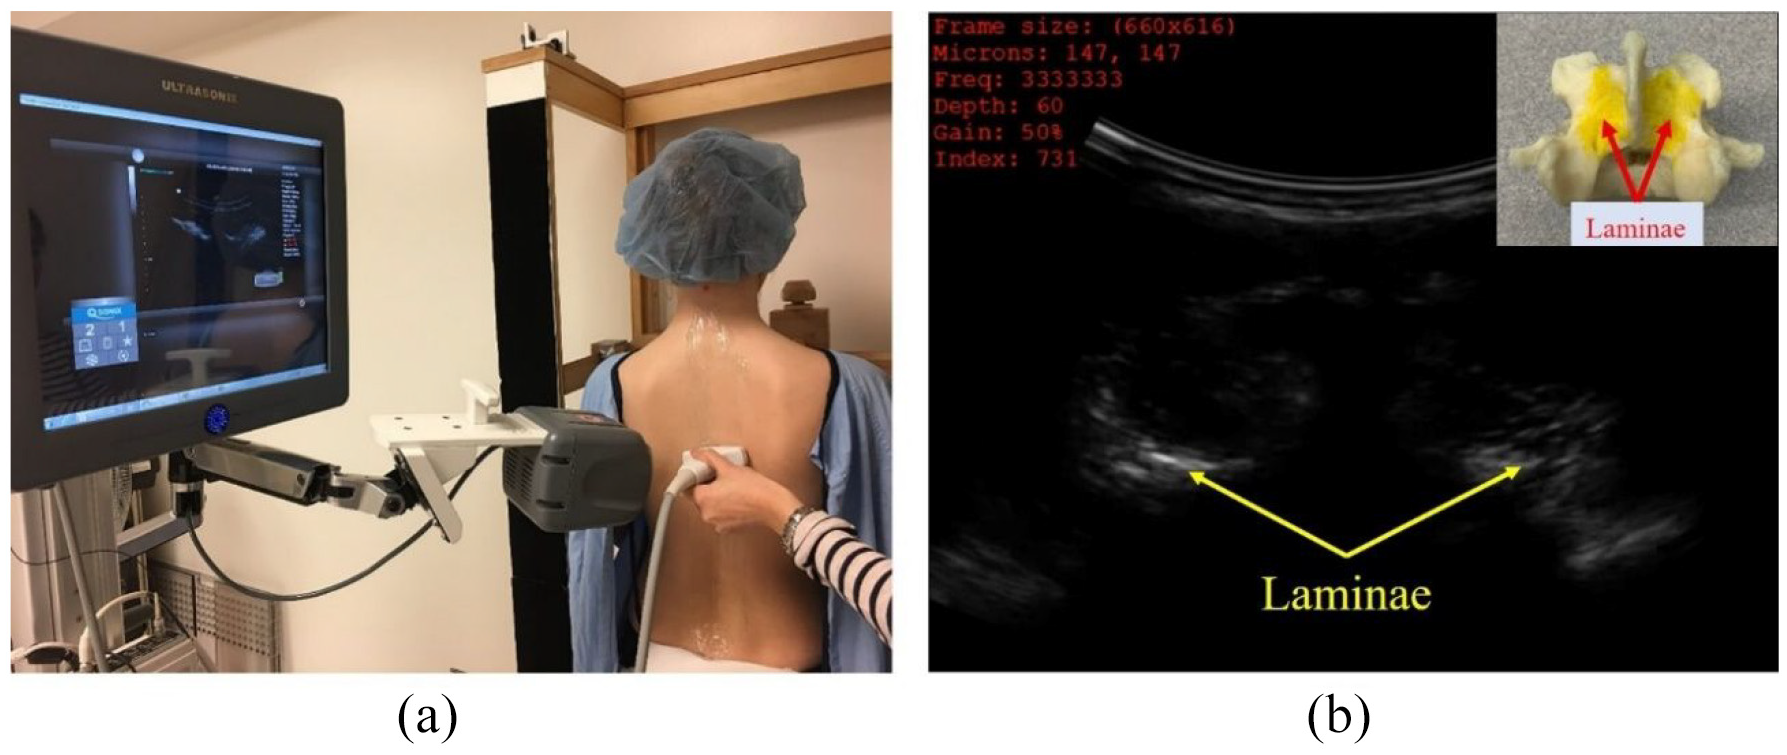
(a) The ultrasound scan of children with AIS in standing position and (b) a B-mode image of a vertebra. A cadaver vertebra is shown in the inset.
Selection of B-mode frames
The lamina has been identified as a strong ultrasound reflector because the lamina area is usually a relatively flatten surface. 25 This was similar to the arch phantom and the linear plate studies. The middle of the lumbar vertebra L5 was first identified. If the quality of image on L5 was poor, L4 was then used. Five consecutive B-mode frames around the middle of the vertebra with the most leveled pair of laminae were used.
Signal processing for both phantoms and in vivo studies
The acquired RF data was exported by Matlab software (R2019a, MathWorks, MA, USA). Each ultrasound frame had 256 time series (A-lines). Hilbert transform was applied to the series to obtain the envelopes of the signals.
47
The peaks of the envelopes were used as amplitudes to calculate the reflection coefficients. The envelope technique has been shown to be robust in facilitating the detection of the peaks of noisy signals, thereby yielding more consistent and stable results. For the studies of plate phantoms, three records with maximum amplitudes from the center of the transducer were used. In the vertebral phantom and in vivo studies, about3–5 records of maximum echo-magnitudes corresponding to each lamina were exploited to measure the
Results
Phantom studies
Determination of
,
, and
The primary echo and two reverberations traveling within the BP are shown in Figure 4(a) with the envelope peaks (
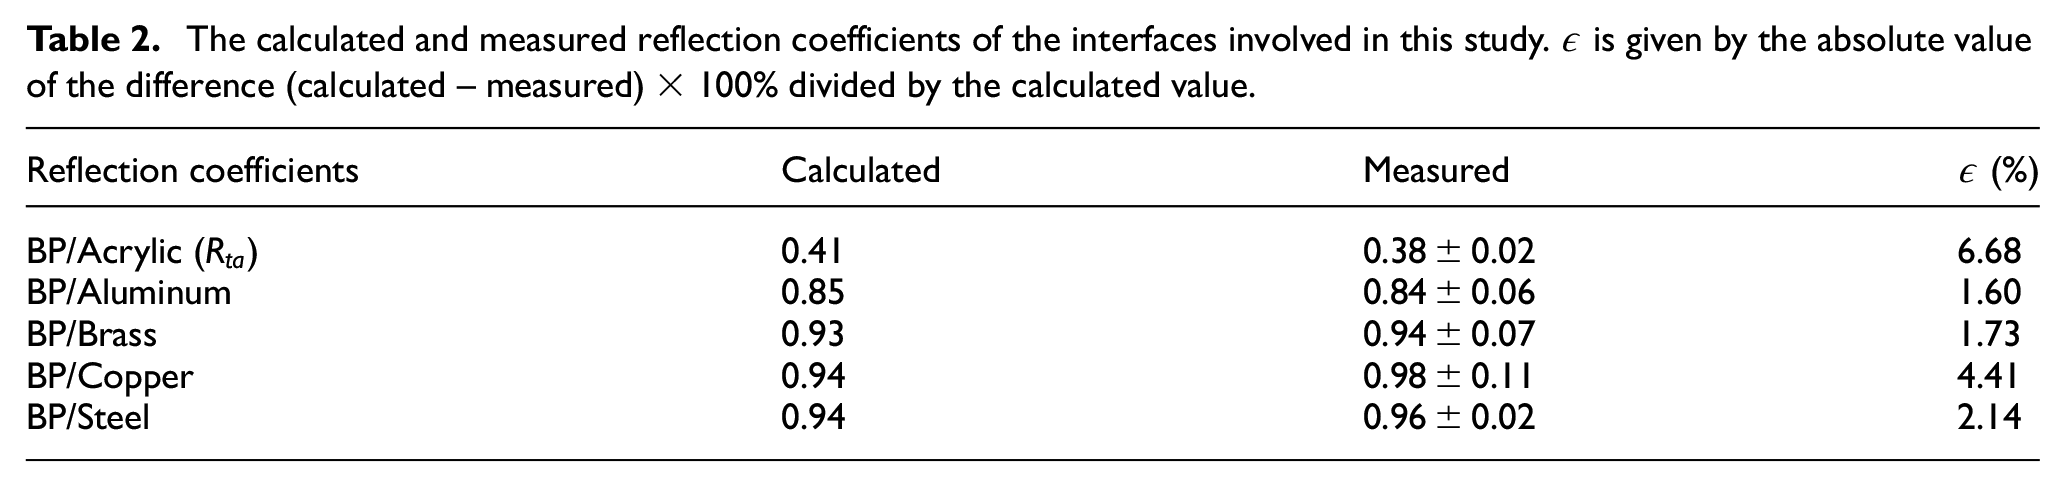
The calculated and measured reflection coefficients of the interfaces involved in this study.
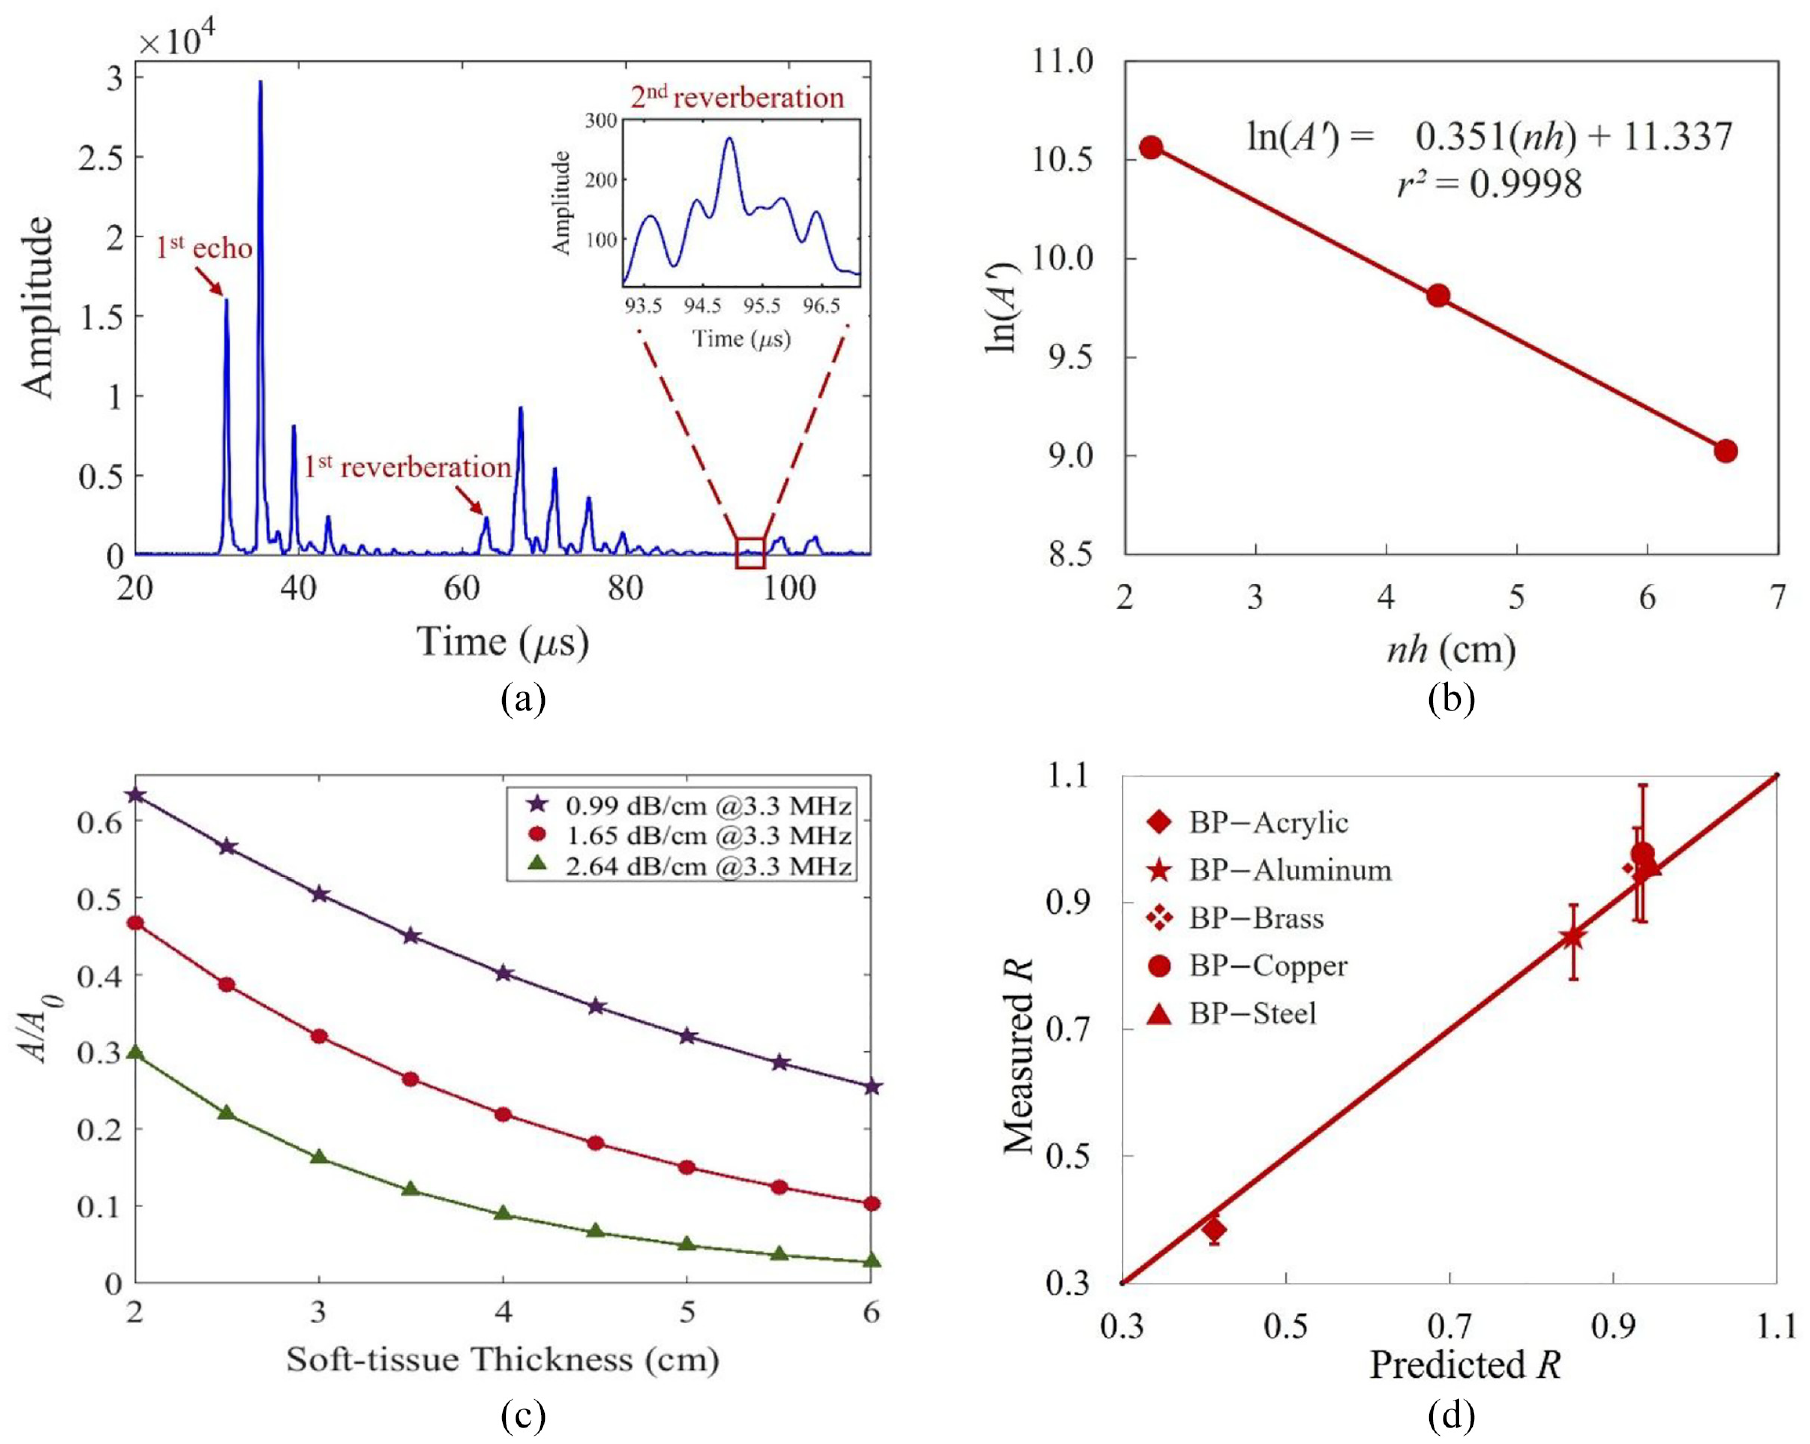
(a) Envelopes of the recorded echo and two reverberations within the BP. The amplitude of the second reverberation is small and the zoomed signal is shown in the inset. (b) The linear regression line of the three data points. (c) The simulated amplitude ratio with change of soft-tissue thickness for three
Reflection coefficient (
) of five different materials
Based on the received reflection signals and equation (1), the measured reflection coefficients,
Influence of surface roughness and inclination
Using the signals from the smooth flat surface (SFS) as the reference, the measured
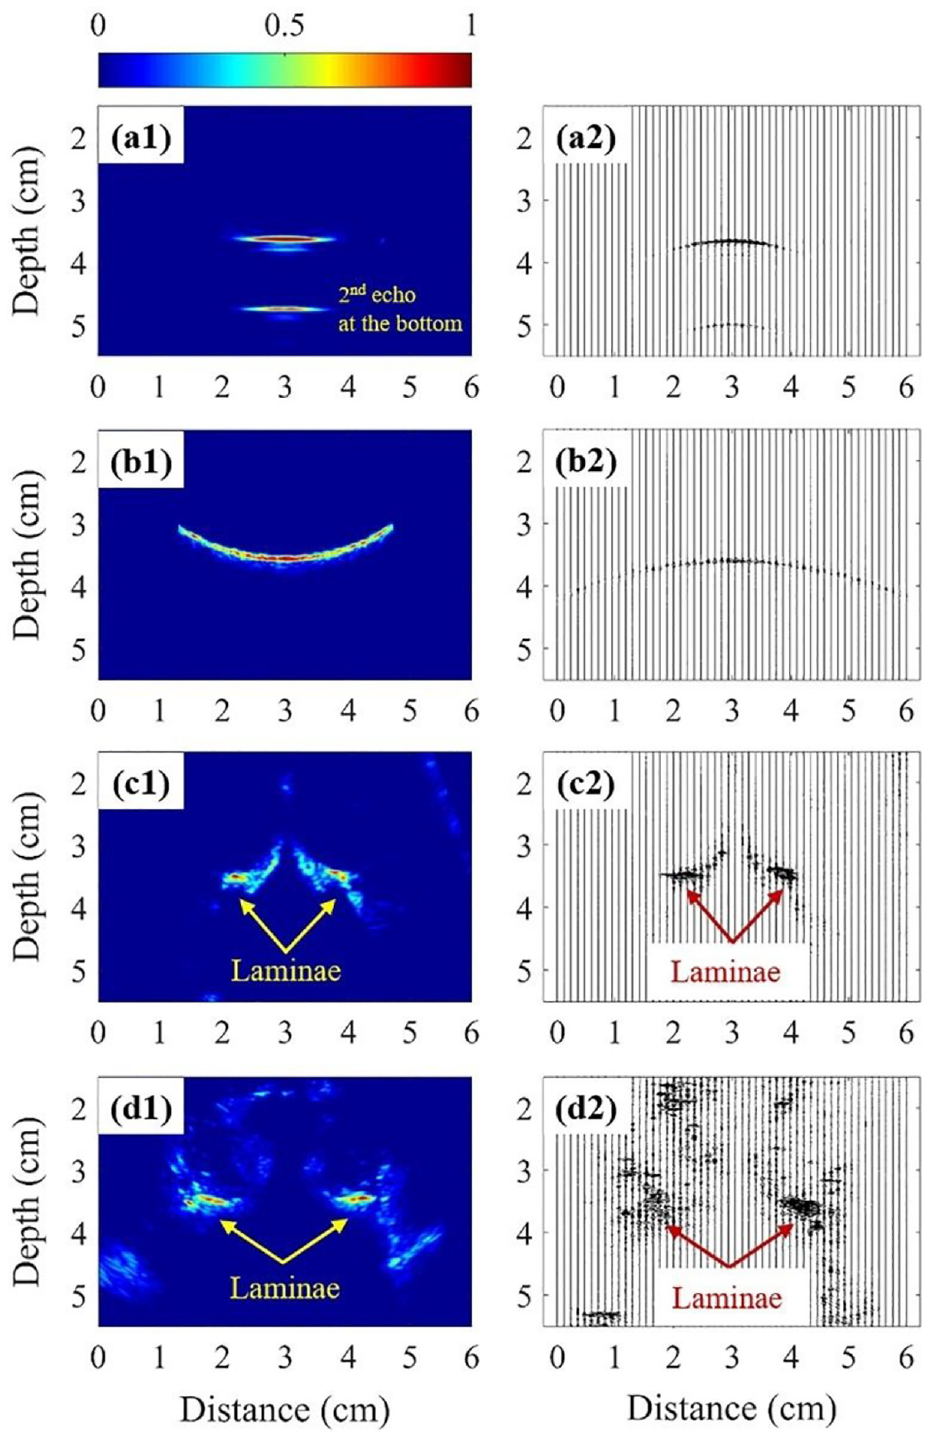
The ultrasonographs (Left) and the corresponding RF data (Right) of the following target: (a) acrylic phantom with the SFS, (b) acrylic phantom with the RCIS, (c) lumbar vertebra phantom, and (d) lumbar vertebra of a subject.
In vivo Study
The decay in echo-amplitude due to the attenuation of ultrasound in the soft tissue was compensated using an
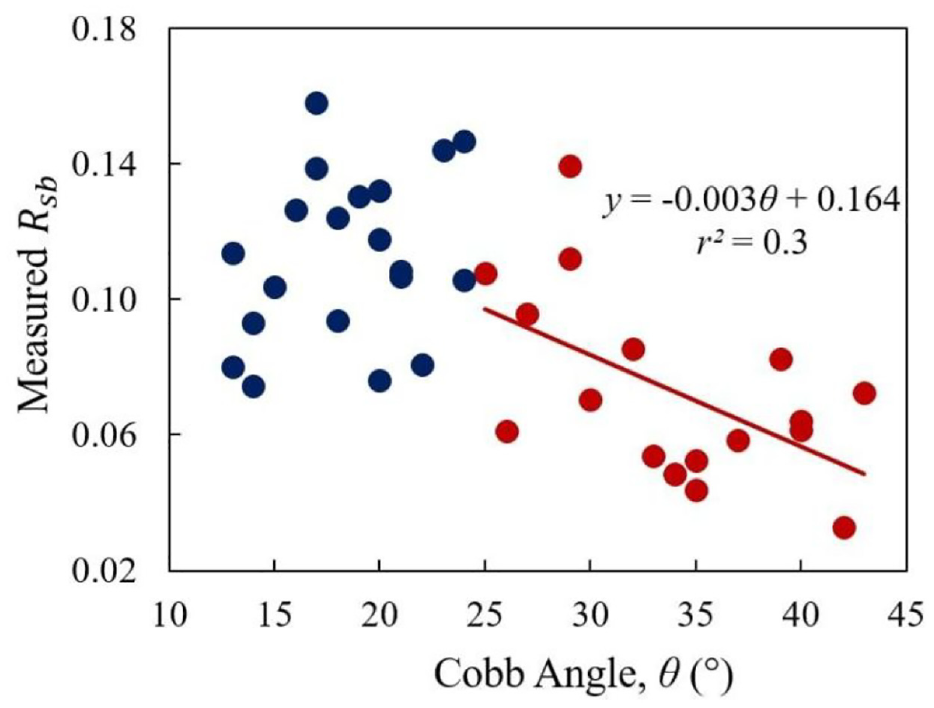
The correlation between the
Discussion
The theoretical calculation of the reflection coefficients of the BP and five different materials’ interfaces (acrylic, aluminum, brass, copper, and steel) was matched to the measured values with maximum discrepancy of 6.7% (Table 2). As the stiffness of cortical bone lies between the stiffness values of acrylic and aluminum, it is expected that the reflection coefficient of BP-cortical bone interface is between 0.38 and 0.84.
The surface roughness accounted for approximately 25% of the signal loss while the total effect due to the surface roughness and inclination together caused about 64% loss. When the surface was smoothened, the received signal was back to nearly 90% of the original. The small curve on the surface (SCS) had a small effect on signal loss when compared to the flat surface (SFS). Furthermore, the effect of the tilt angle is actually more significant. Together with the surface roughness, a 3° tilt demonstrated about 40% signal loss while a 5° tilt demonstrated a nearly 70% loss. These experiments demonstrated that a significant amount of energy loss was expected due to both the inclination and roughness of the surface.
From the cadaveric vertebra study, the recovered coefficient is 0.23 ± 0.06, only 33% of the predicted
The effect of absorption upon the reflection coefficient was also studied. The first-order approximation of the amplitude acoustic reflection coefficient for two lossy biological tissues is given by 51
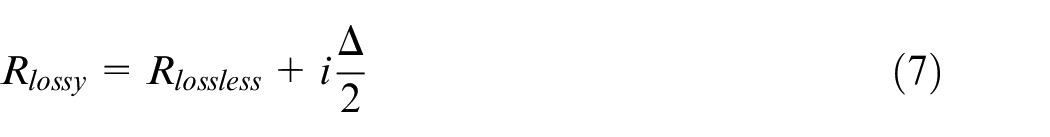
where
After an approximate compensation of the attenuation in the soft tissue, the measured
Conclusion
This preliminary study has demonstrated the feasibility of using ultrasonic reflection coefficients for the estimation of material properties and its application in estimating bone properties of AIS patient groups. The total loss in echo amplitude due to the absorptive soft tissue layer, surface roughness and inclination is significant and difficult to quantify. However, although these losses hindered the recovery of true bone properties, the average
Footnotes
Declaration of conflicting interests
The author(s) declared no potential conflicts of interest with respect to the research, authorship, and/or publication of this article.
Funding
The author(s) disclosed receipt of the following financial support for the research, authorship, and/or publication of this article: The research was supported by the Natural Sciences and Engineering Research Council of Canada and the Scoliosis Research Society.