
Abstract
Turbulent ship airwakes can present a major challenge for a pilot landing a helicopter to the ship. A recent study has proposed modifications to the hangar of a simple ship, the SFS2, to improve the air flow over the deck. To assess the effect of the proposed hangar modification on the helicopter and pilot, the unsteady air flow over the modified ship has been computed using time-accurate CFD, and then integrated with a full-motion flight simulator for a pilot to conduct deck landings to the original and modified ship geometries in wind speeds from 30 kt to 50 kt. The effectiveness of the proposed modification was assessed through pilot workload ratings for the landing task, and by recording pilot control inputs and helicopter states. The study has shown that there are some benefits from the hangar modifications. In the headwind the helicopter was deemed to be at the safe limit at 50 kt when operating to the original SFS2, while the limit was not reached in the 50 kt wind for the modified ship. In an oblique wind, the safe wind speed limit was found to be 40 kt for the original ship and 50 kt for the modified version. Although the improvements are not substantial, they do represent a positive outcome.
Introduction
Naval frigates routinely deploy maritime helicopters from a landing deck at the stern of the ship. Flying above the deck, particularly when recovering the aircraft to the ship in strong winds, is a difficult and dangerous task for the pilot as the helicopter is buffeted by the unsteady air flow shedding from the bluff geometry of the ship, while at the same time operating close to the superstructure and descending to a moving deck. The disturbed air flow over the ship is known as the ship airwake, and the flying environment around the deck is often called the Helicopter-Ship Dynamic Interface (HSDI). The HSDI has been the subject of numerous research investigations; see, for example the reviews by Shukla et al. 1 and Cao et al. 2 Studies of the air flow over flight decks have involved both experimental wind tunnel studies and Computational Fluid Dynamics (CFD).
One of the earlier characterisations of the air flow over the flight deck was reported by Shafer and Ghee
3
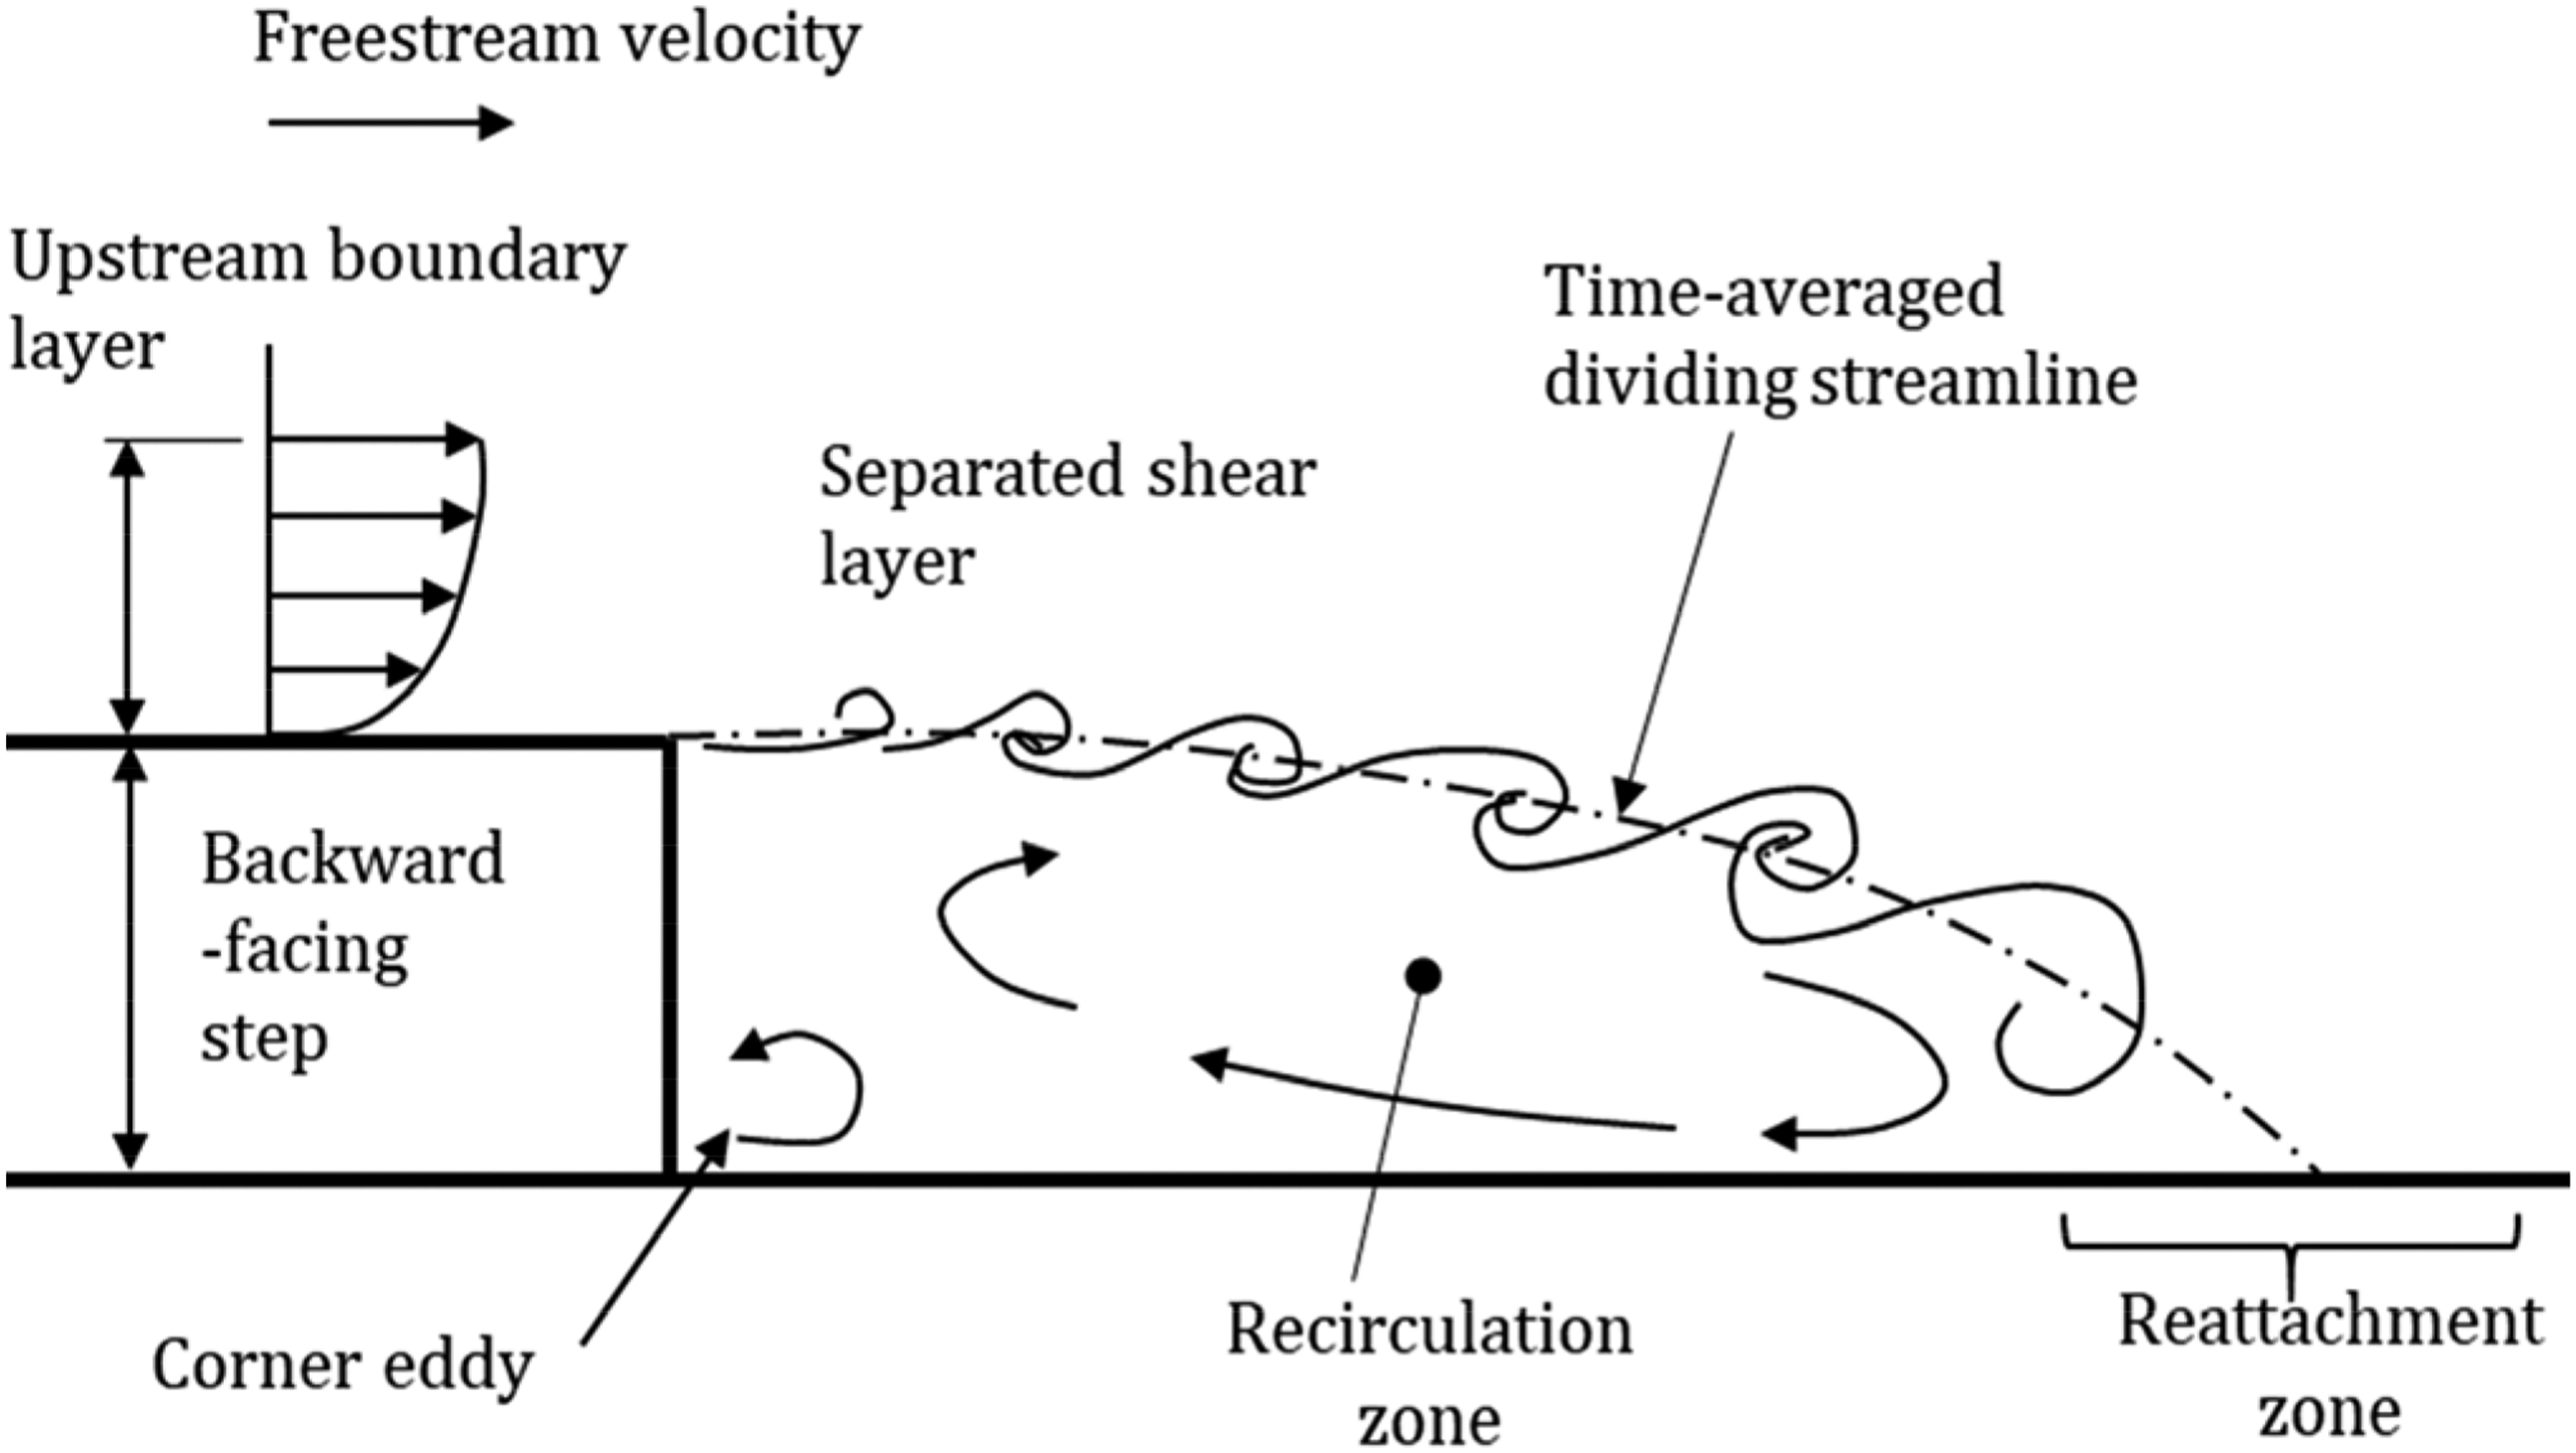
who related the air flow to that over a backward-facing step as illustrated in Figure 1, extracted from Driver et al.
4
Brownell et al.
5
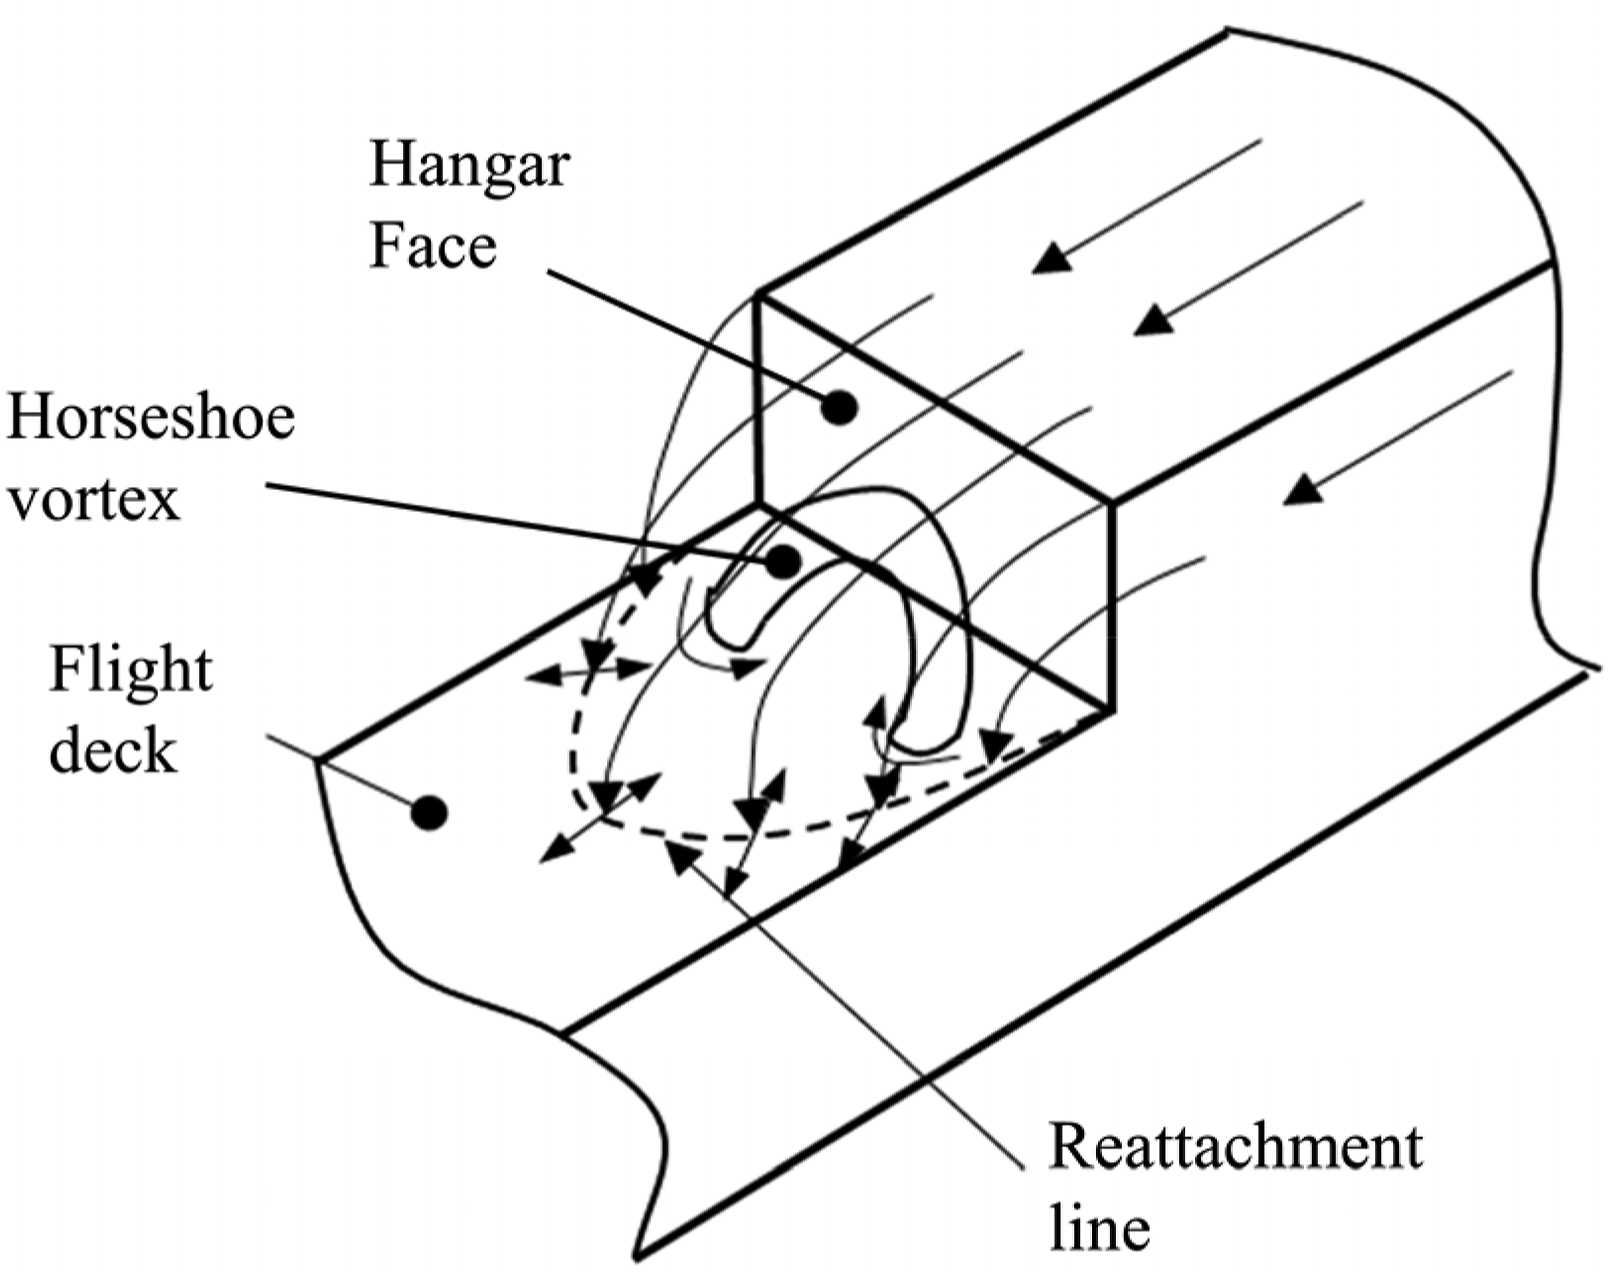
also measured separation of the flow over the hangar of a 108 ft naval vessel with a persistent recirculation zone immediately aft of the step face consistent with the flow over a backward facing step. The backward-facing step represents the ship’s hangar immediately ahead of the flight deck. In this two-dimensional depiction, the flow separates from the top edge of the hangar and reattaches to the deck downstream. A recirculation zone forms over the forward part of the deck and a steep turbulent shear layer separates the slower recirculating flow from the faster moving air above. In practice, the flow over the length of the ship superstructure, that is the airwake, is highly turbulent and both the shear layer and reattachment point are unsteady. The flow is also highly three-dimensional as seen in Figure 2, again reproduced from Shafer and Ghee.
3
In this three-dimensional view the reattachment point is shown as a line and a horseshoe vortex is formed within the recirculation zone. Again, the shear layer, the recirculation zone and the reattachment line are all unsteady. Idealised air flow over flight deck.
3
Simplified sketch of three-dimensional flow over flight deck.
3
For a helicopter hovering over the landing spot, typically halfway down the flight deck, the main rotor will often be at, or slightly above, the height of the hangar. Therefore, the aircraft, particularly the main rotor, can be partly immersed in the highly chaotic unsteady air flow, and partly in the faster undisturbed flow. The non-uniform and rapidly fluctuating air flow will impose unsteady forces and moments on the helicopter, while at the same time the reversed flow in the recirculation zone may be pulling the aircraft towards the hangar and the deck will be moving in roll and heave. These effects can persist while the helicopter is descending to land on the deck. It is recognised that the helicopter downwash will significantly alter the flow field, but the main characteristics will still be present.
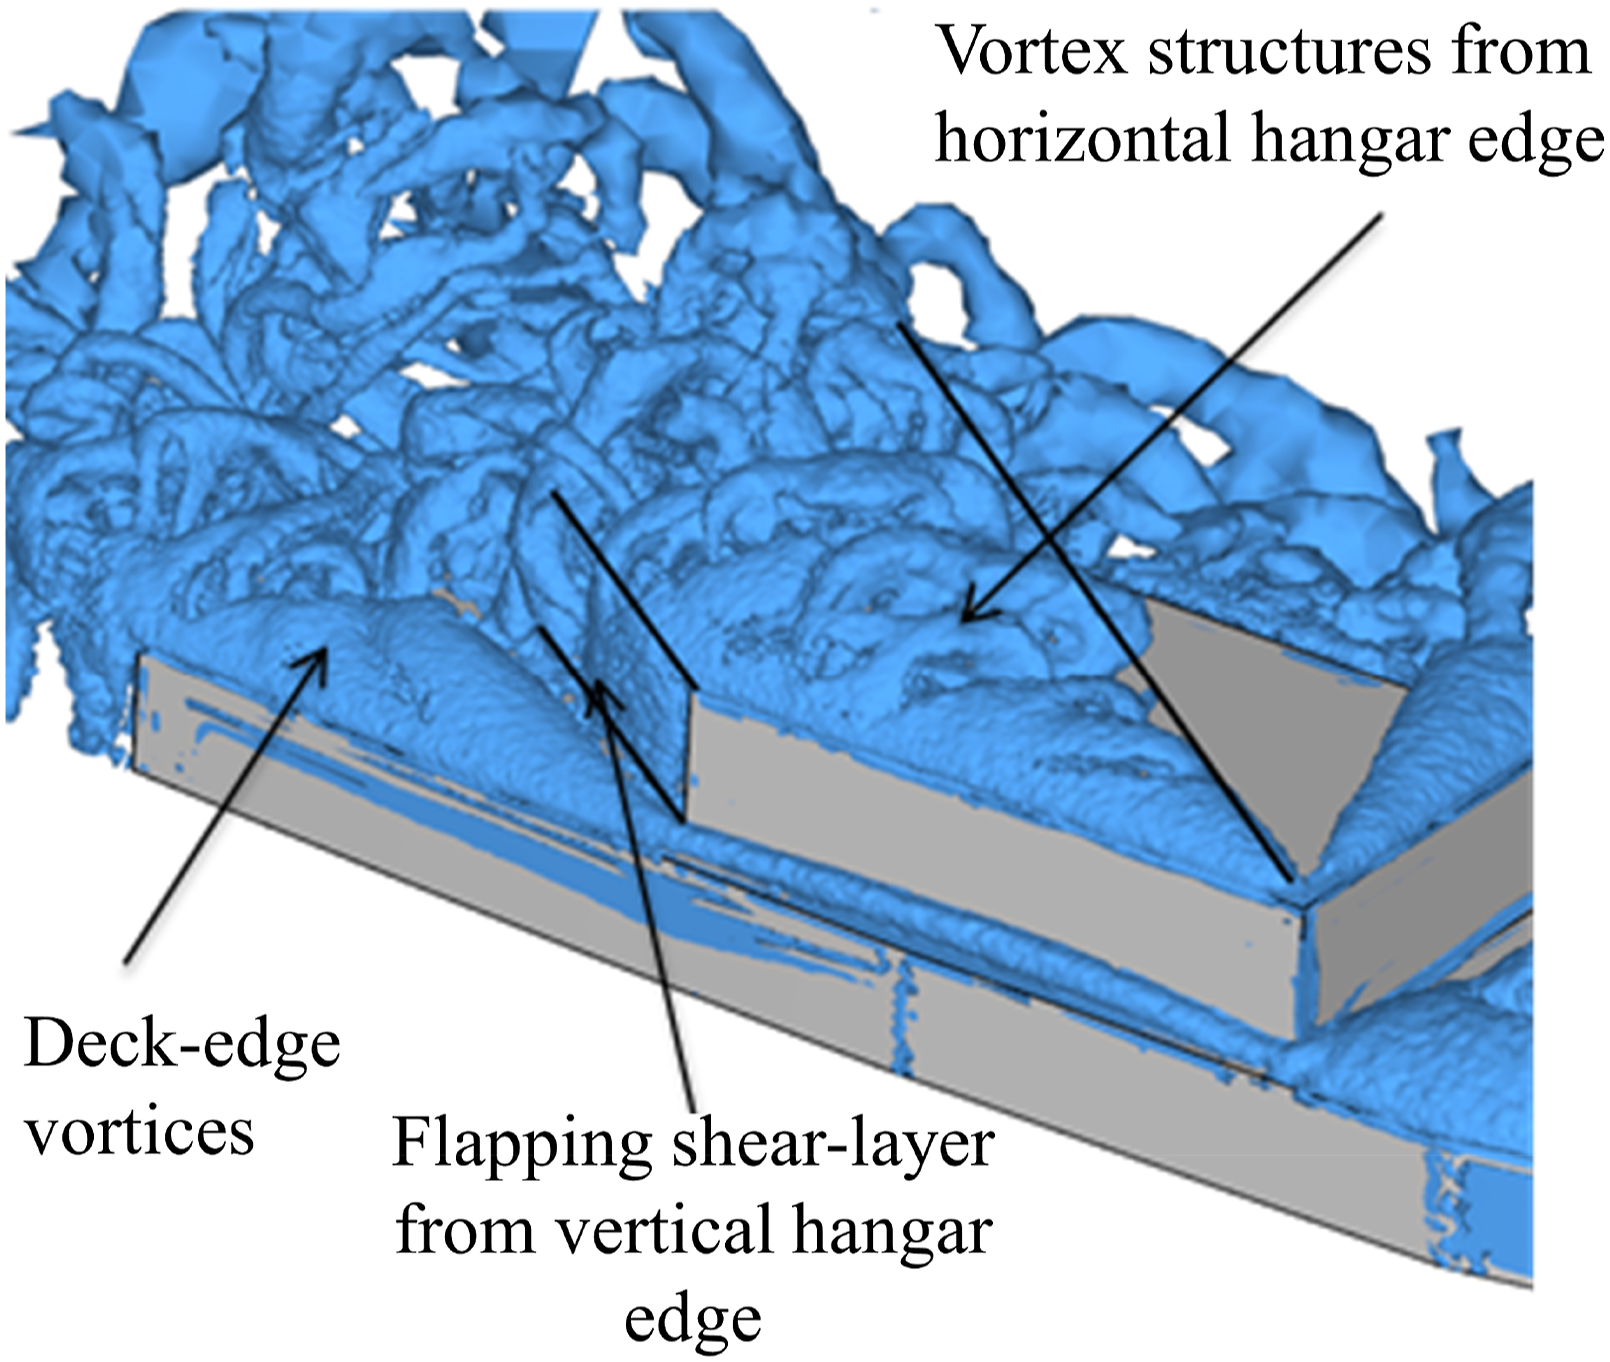
Oblique winds can cause even greater disturbances on the aircraft and further increase the difficulty of the landing task. Figure 3 shows a CFD-generated air flow over a simplified ship which is aligned at 45° with the air flow.
6
The mean flow is illustrated using Q-criterion, a vortex-identification method. The image shows how the shear layer from the vertical windward hangar edge cuts diagonally across the flight deck. Also, the top horizontal windward edge sheds vortices above the height of the hangar and over the flight deck. In such flow, the helicopter hovering over the landing spot will now be exposed to the flapping shear layer and the main rotor will be drawing in the turbulent structures from above. The pilot will have to contend with the unsteady forces and moments generated by these flow features while resisting the sideways and yawing loads created by the oblique wind. Air flow over simplified flight deck in an oblique wind illustrated by surfaces of iso-vorticity.
6
Recognising the influence of ship geometry on the severity of the airwake, a number of studies have been conducted into modifying the superstructure ahead of the flight deck. An early review of air flow control over ship landing decks, which included aircraft carriers and helicopter assault ships, was reported by NATO Task Group AVT-102 in 2007. 7 A particular line of research was the use of wind tunnel experiments to study the effect of adding various devices to the hangar edges, such as porous, serrated or notched fences, as well as turning-vanes and vortex generators, along with blowing devices and porous surfaces.3,8–11 The effects of vortex generators, plasma actuators and localised air suction/blowing have also been reported.12–15 As well as adding appendages to the hangar edges, other studies have looked at altering the shape of the hangar, such as adding rounded or angles edges.16–19 Many of these studies were conducted for a headwind only and, as discussed above, oblique winds can be more challenging for the pilot. A more fundamental issue with many of the studies conducted, and recognised by AVT-102, 7 is that even when the air flow over the flight deck is modified, the effect on the helicopter is uncertain.
There have been studies where the helicopter has been included in the airwake to assess the effect on the helicopter loads 20 and the effect of the rotor on the airwake.21–23 The effect of hangar modifications on a helicopter operating with the airwake has also been examined, both experimentally 24 and computationally. 25 Another method for assessing the effect of the ship airwake on a helicopter and pilot workload is through flight simulation using ship airwakes created by CFD.26–32 Forrest et al. 6 generated ship airwakes using unsteady viscous CFD and integrated the airwakes within a piloted flight simulation environment to assess the effect of hangar modifications on the helicopter and pilot workload. When the helicopter was included in the assessment of the ship hangar modifications, it was seen that although a modification could provide benefits for one wind direction, these were often lost for other wind directions. A particular study of interest is that by Bardera et al., 19 who investigated a range of geometric modifications to the hangar of a simplified frigate. The outcome was a specific geometry that appeared to offer potential benefits for the ship’s helicopter when flying over the deck. The purpose of the study reported in this paper, therefore, was to investigate how the recommended hangar modifications would affect a helicopter landing to the ship by conducting simulated deck landings using time-accurate CFD generated airwakes in a full-motion flight simulator.
Modified simple frigate shape (SFS2)
The Simple Frigate Shape 2 (SFS2), Figure 4, was proposed in the 1990s for researchers of the day to have a common geometry upon which to develop their airwake CFD capability and to conduct wind tunnel studies.
33
The dimensions in Figure 4 are in feet, as originally specified, and are for a full-scale ship (138.6 m long). As can be seen, the geometry is a very simplistic representation of a frigate, but at the time it was sufficiently complex for the numerical modellers to develop their CFD codes, to the point where it is nowadays routine to produce time-accurate CFD computations of airwakes for more complex and realistic full-scale ship geometries.34–36 The Simple Frigate Shape 2 (dimensions in ft).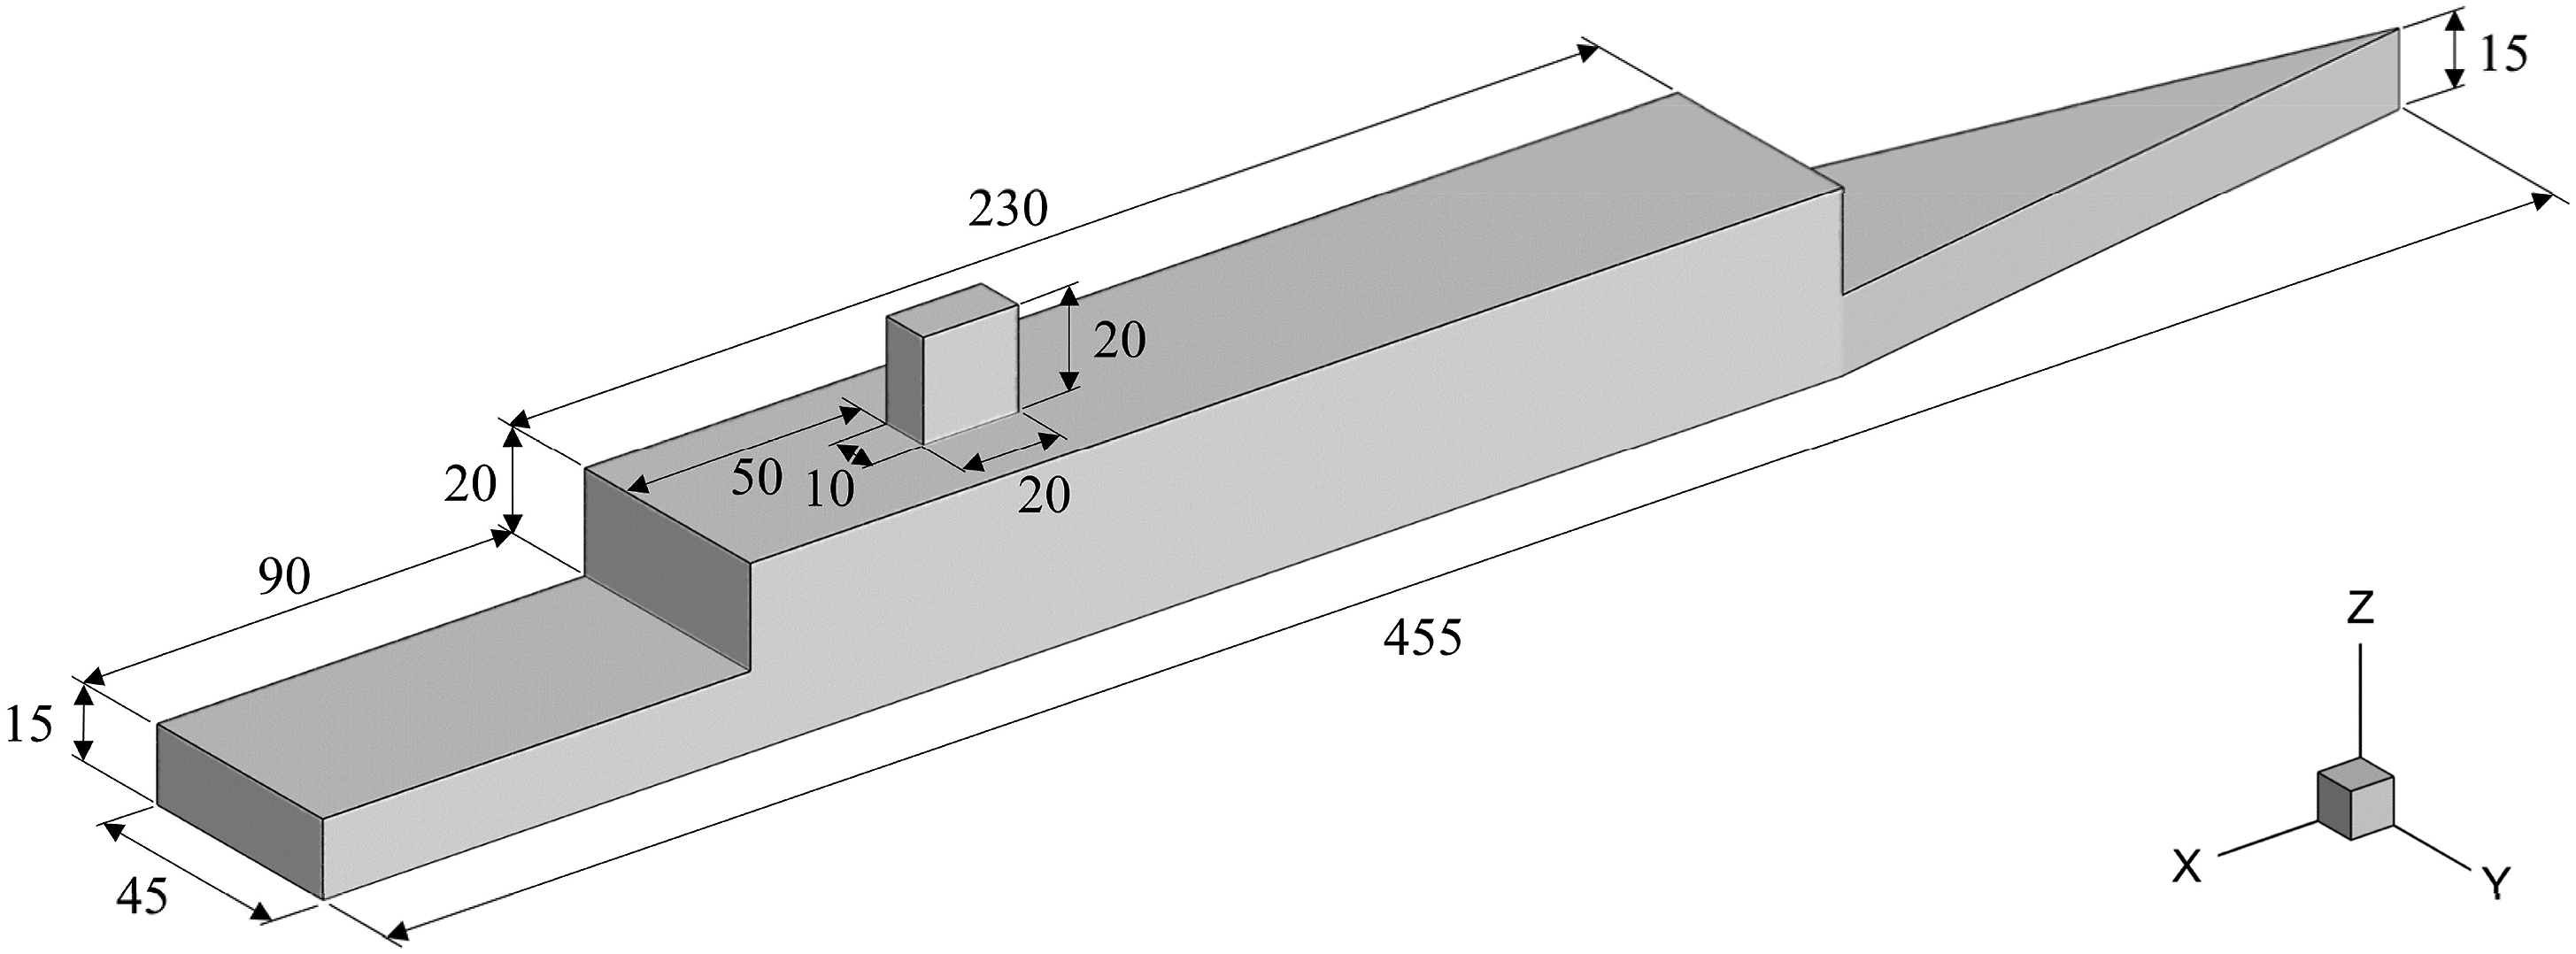
Bardera et al.
19
used Particle Imaging Velocimetry (PIV) in a series of wind tunnel experiments to measure the flow over the flight deck of the SFS2 for nine different geometric modifications to the back of the SFS2 hangar, as well as for the base case shown in Figure 4. The geometry illustrated in Figure 5 deemed to be the most effective in modifying the airwake for the wind angles used in their study, which were from Ahead, 15° and 30°. The method by which the most effective hangar geometry was assessed was to measure the effect of each modification on three parameters: the reduction in the size of the recirculation zone, the variation in the velocity at rotor height, and the loss of interior volume of the modified hangar. A scorecard approach was used to assign values to these parameters for the three wind directions and to rank the different geometries accordingly. The changes in the hangar geometry did not affect the available flight deck area. Modified SFS2 Hangar (dimensions in ft).
19
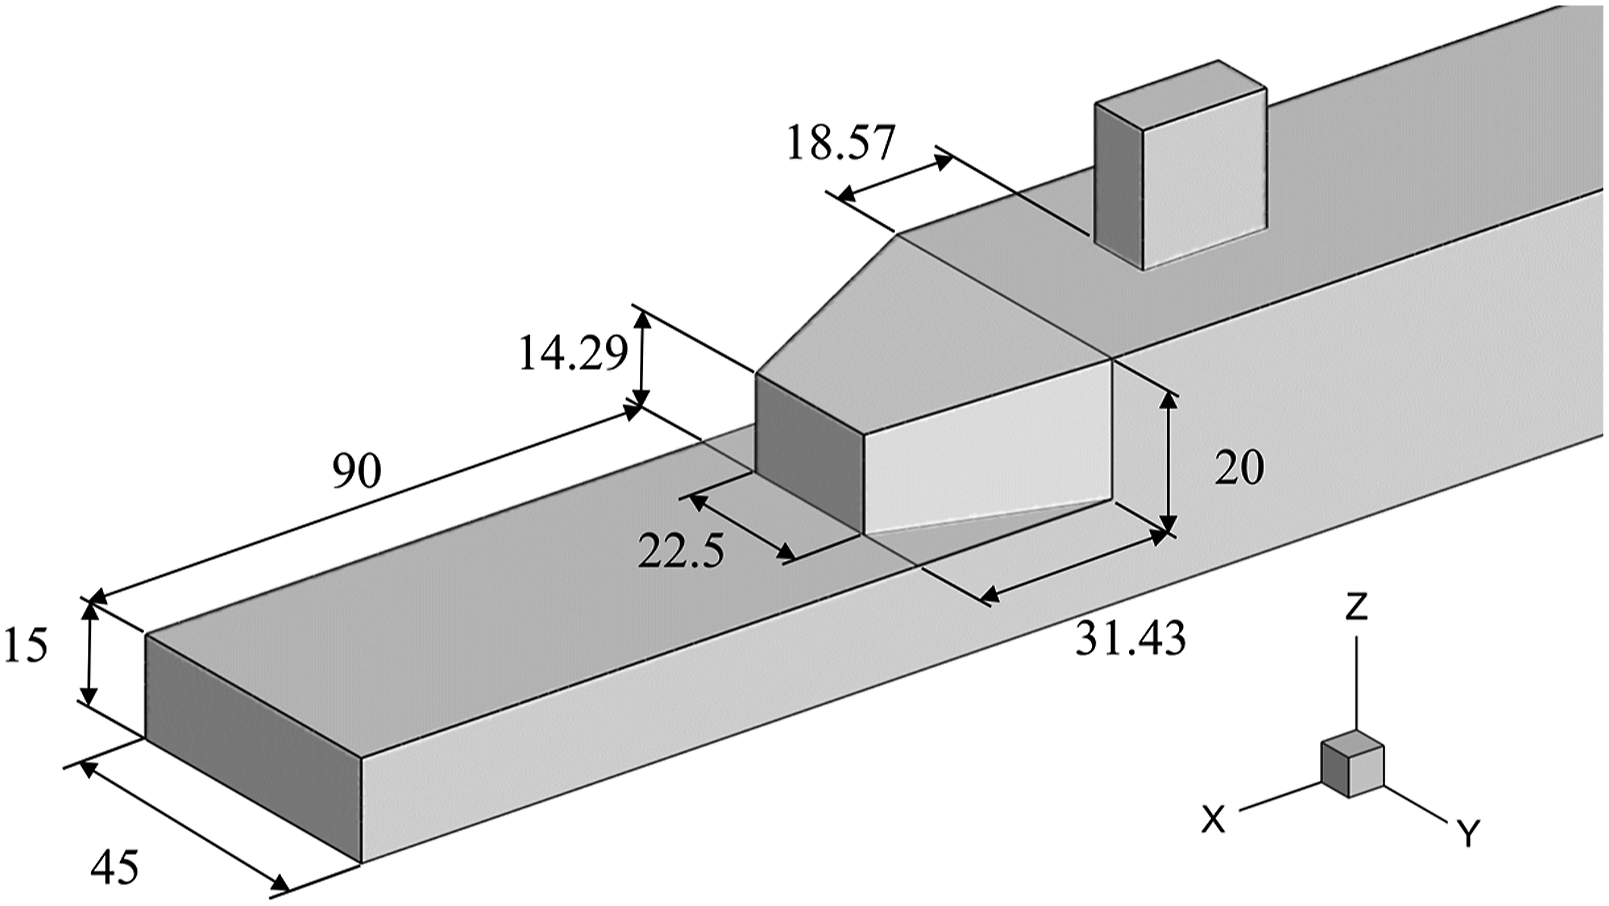
In the study being reported in this paper, the modified geometry shown in Figure 5 was used in a CFD analysis to create unsteady airwakes for the same three wind angles used by Bardera et al., that is Ahead, 15°, and 30°. The full-scale CFD airwakes were compared with the experimental PIV data presented by Bardera et al. 19 and were then implemented in a full-motion flight simulator. A pilot conducted a series of simulated deck landings to assess the effect of the geometric modification through pilot workload ratings; the pilot’s control activity was also recorded as well as the helicopter’s states in six axes.
CFD airwakes
Because the airwakes were to be used with flight simulation, it was necessary to compute time-varying three-dimensional velocities using a time-accurate CFD method. The method by which the CFD airwakes were generated is that recommended by Forrest and Owen,
34
where Delayed Detached Eddy Simulation (DDES) with a Shear Stress Transport (SST) k-
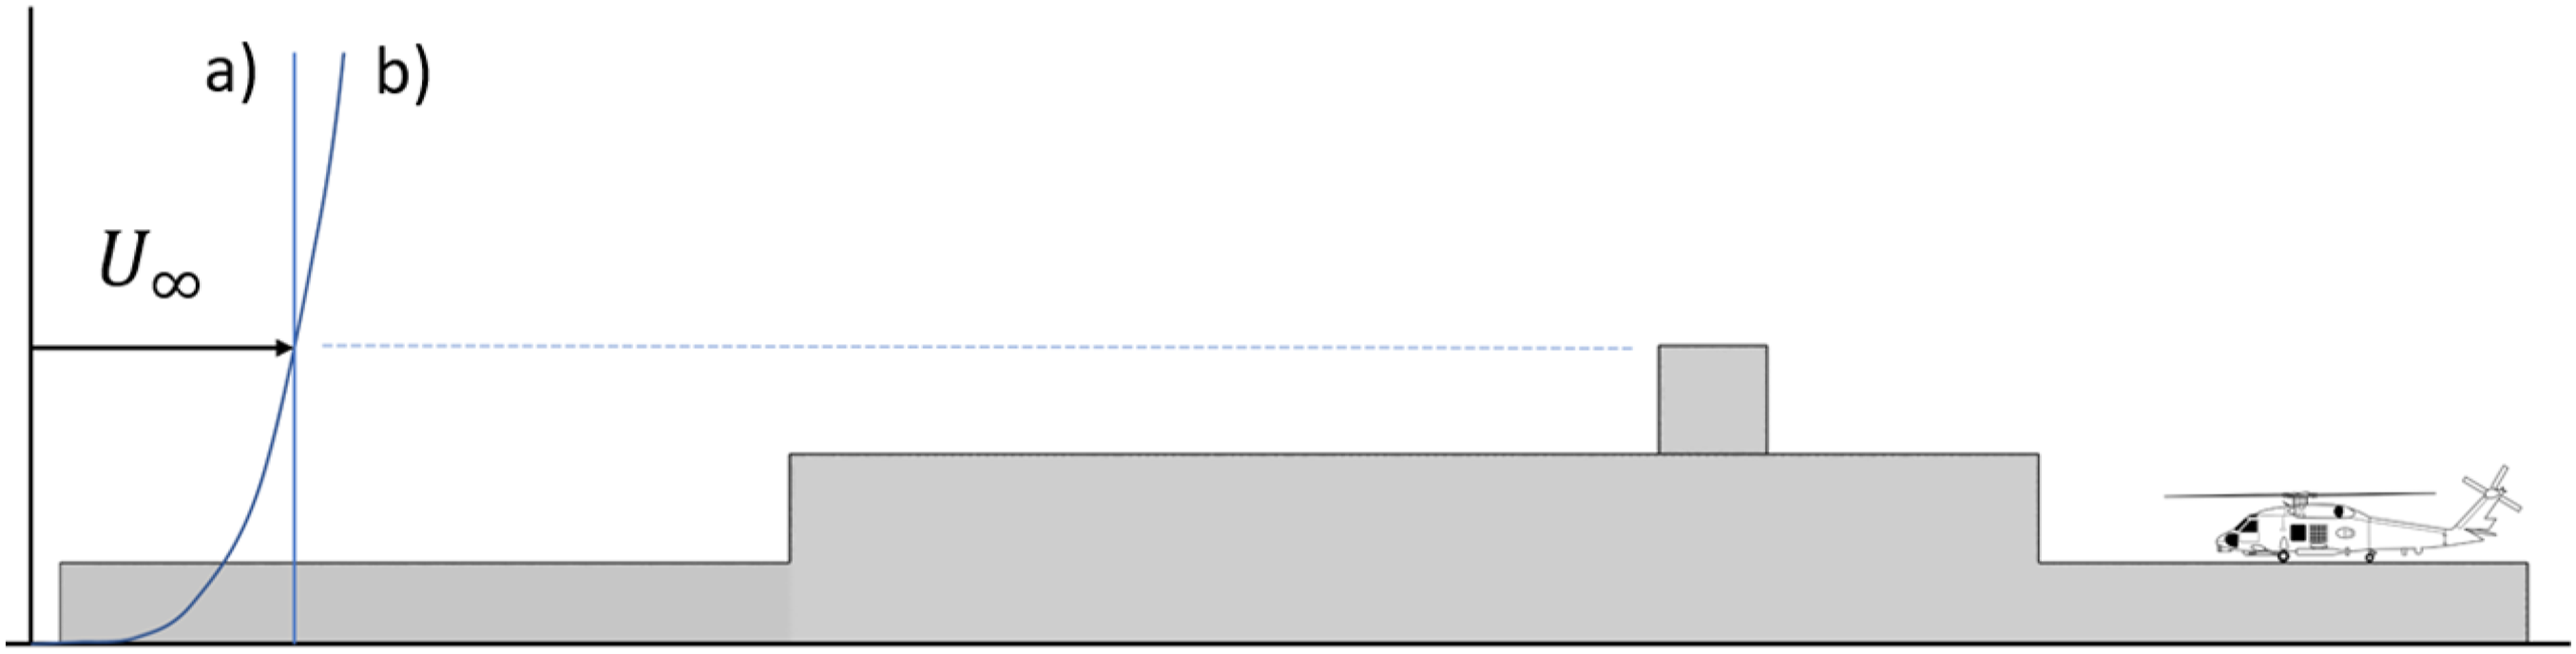
Each SFS2 configuration was placed at the centre of a cylindrical computational domain with the height set at 0.75 ship lengths (104 m), and the radius set to 4.5 ship lengths (624 m). The sides and top of the cylindrical domain were set as a pressure far-field boundary, while the ship surface was defined as a no-slip wall. The sea surface was set as a slip wall to allow the inlet conditions to propagate throughout the domain. 12 prism layers were grown from the ship and the sea-surface. Using a non-dimensional first layer height ( Computational grid over modified SFS2 showing the density box over flight deck. Uniform (a) and Atmospheric Boundary Layer (b) ahead of SFS2.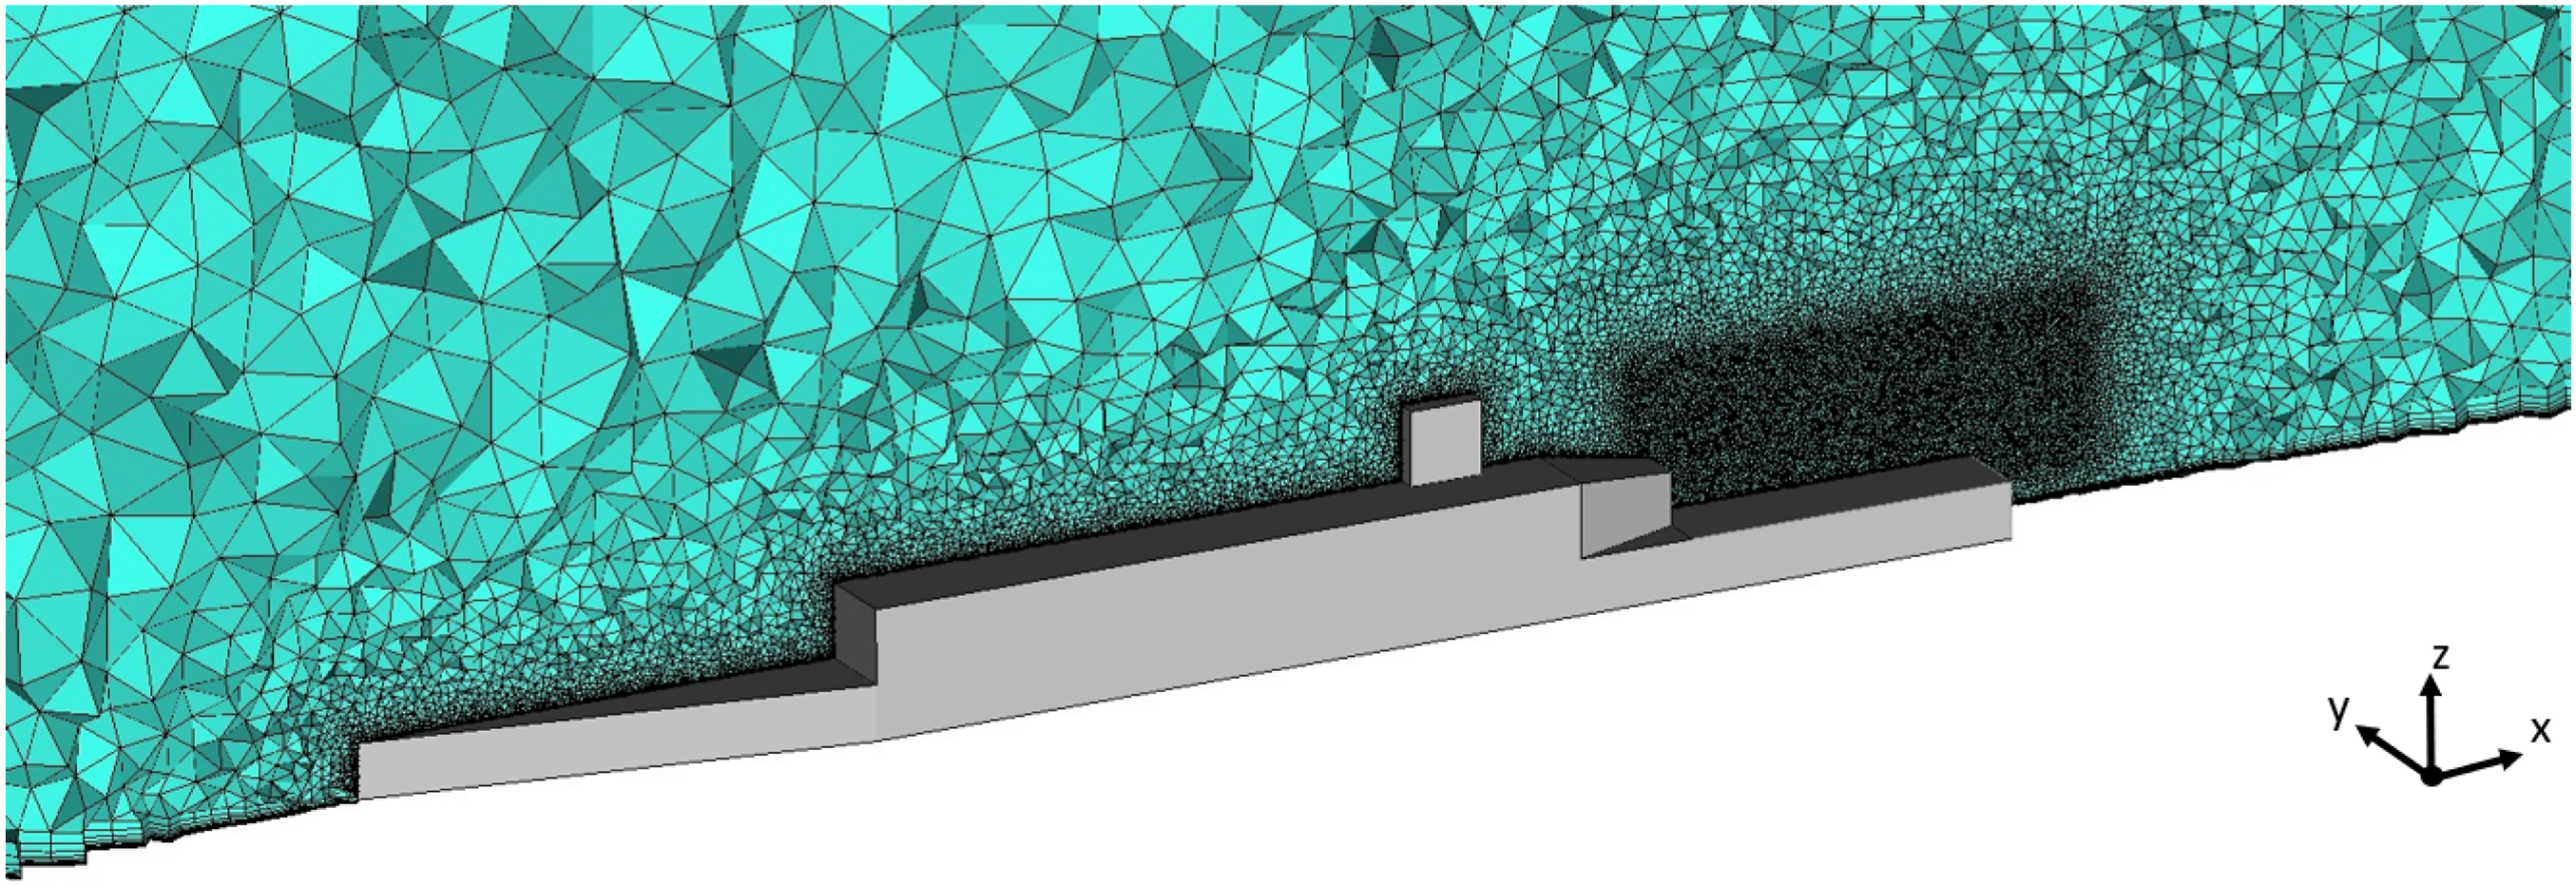
The CFD method described above has been used in numerous studies of ship airwakes and the results have compared favourably with experimental data, for example.34,36,40 The opportunity was also taken in this study to compare the CFD data with the experimental data published by Bardera et al.
19
Figures 8 and 9 show a selection of the PIV results from Bardera et al.
19
alongside the equivalent CFD. The selected data is for the angled hangar only and for the wind from Ahead and 30°; however, comparisons were also made for the original SFS2 geometry and for the 15° wind. The comparisons are made using contour plots of total velocity, Comparison of PIV and CFD velocities for modified hangar in headwind. (a) Headwind airwake PIV (left) and CFD (right) for modified hangar. (b) Profiles of total velocity (left) and turbulence intensity (right). Comparison of PIV and CFD velocities for modified hangar in 30° wind. (a) 30° airwake for modified hangar PIV (left) and CFD (right). (b) Profiles of total velocity (left) and turbulence intensity (right).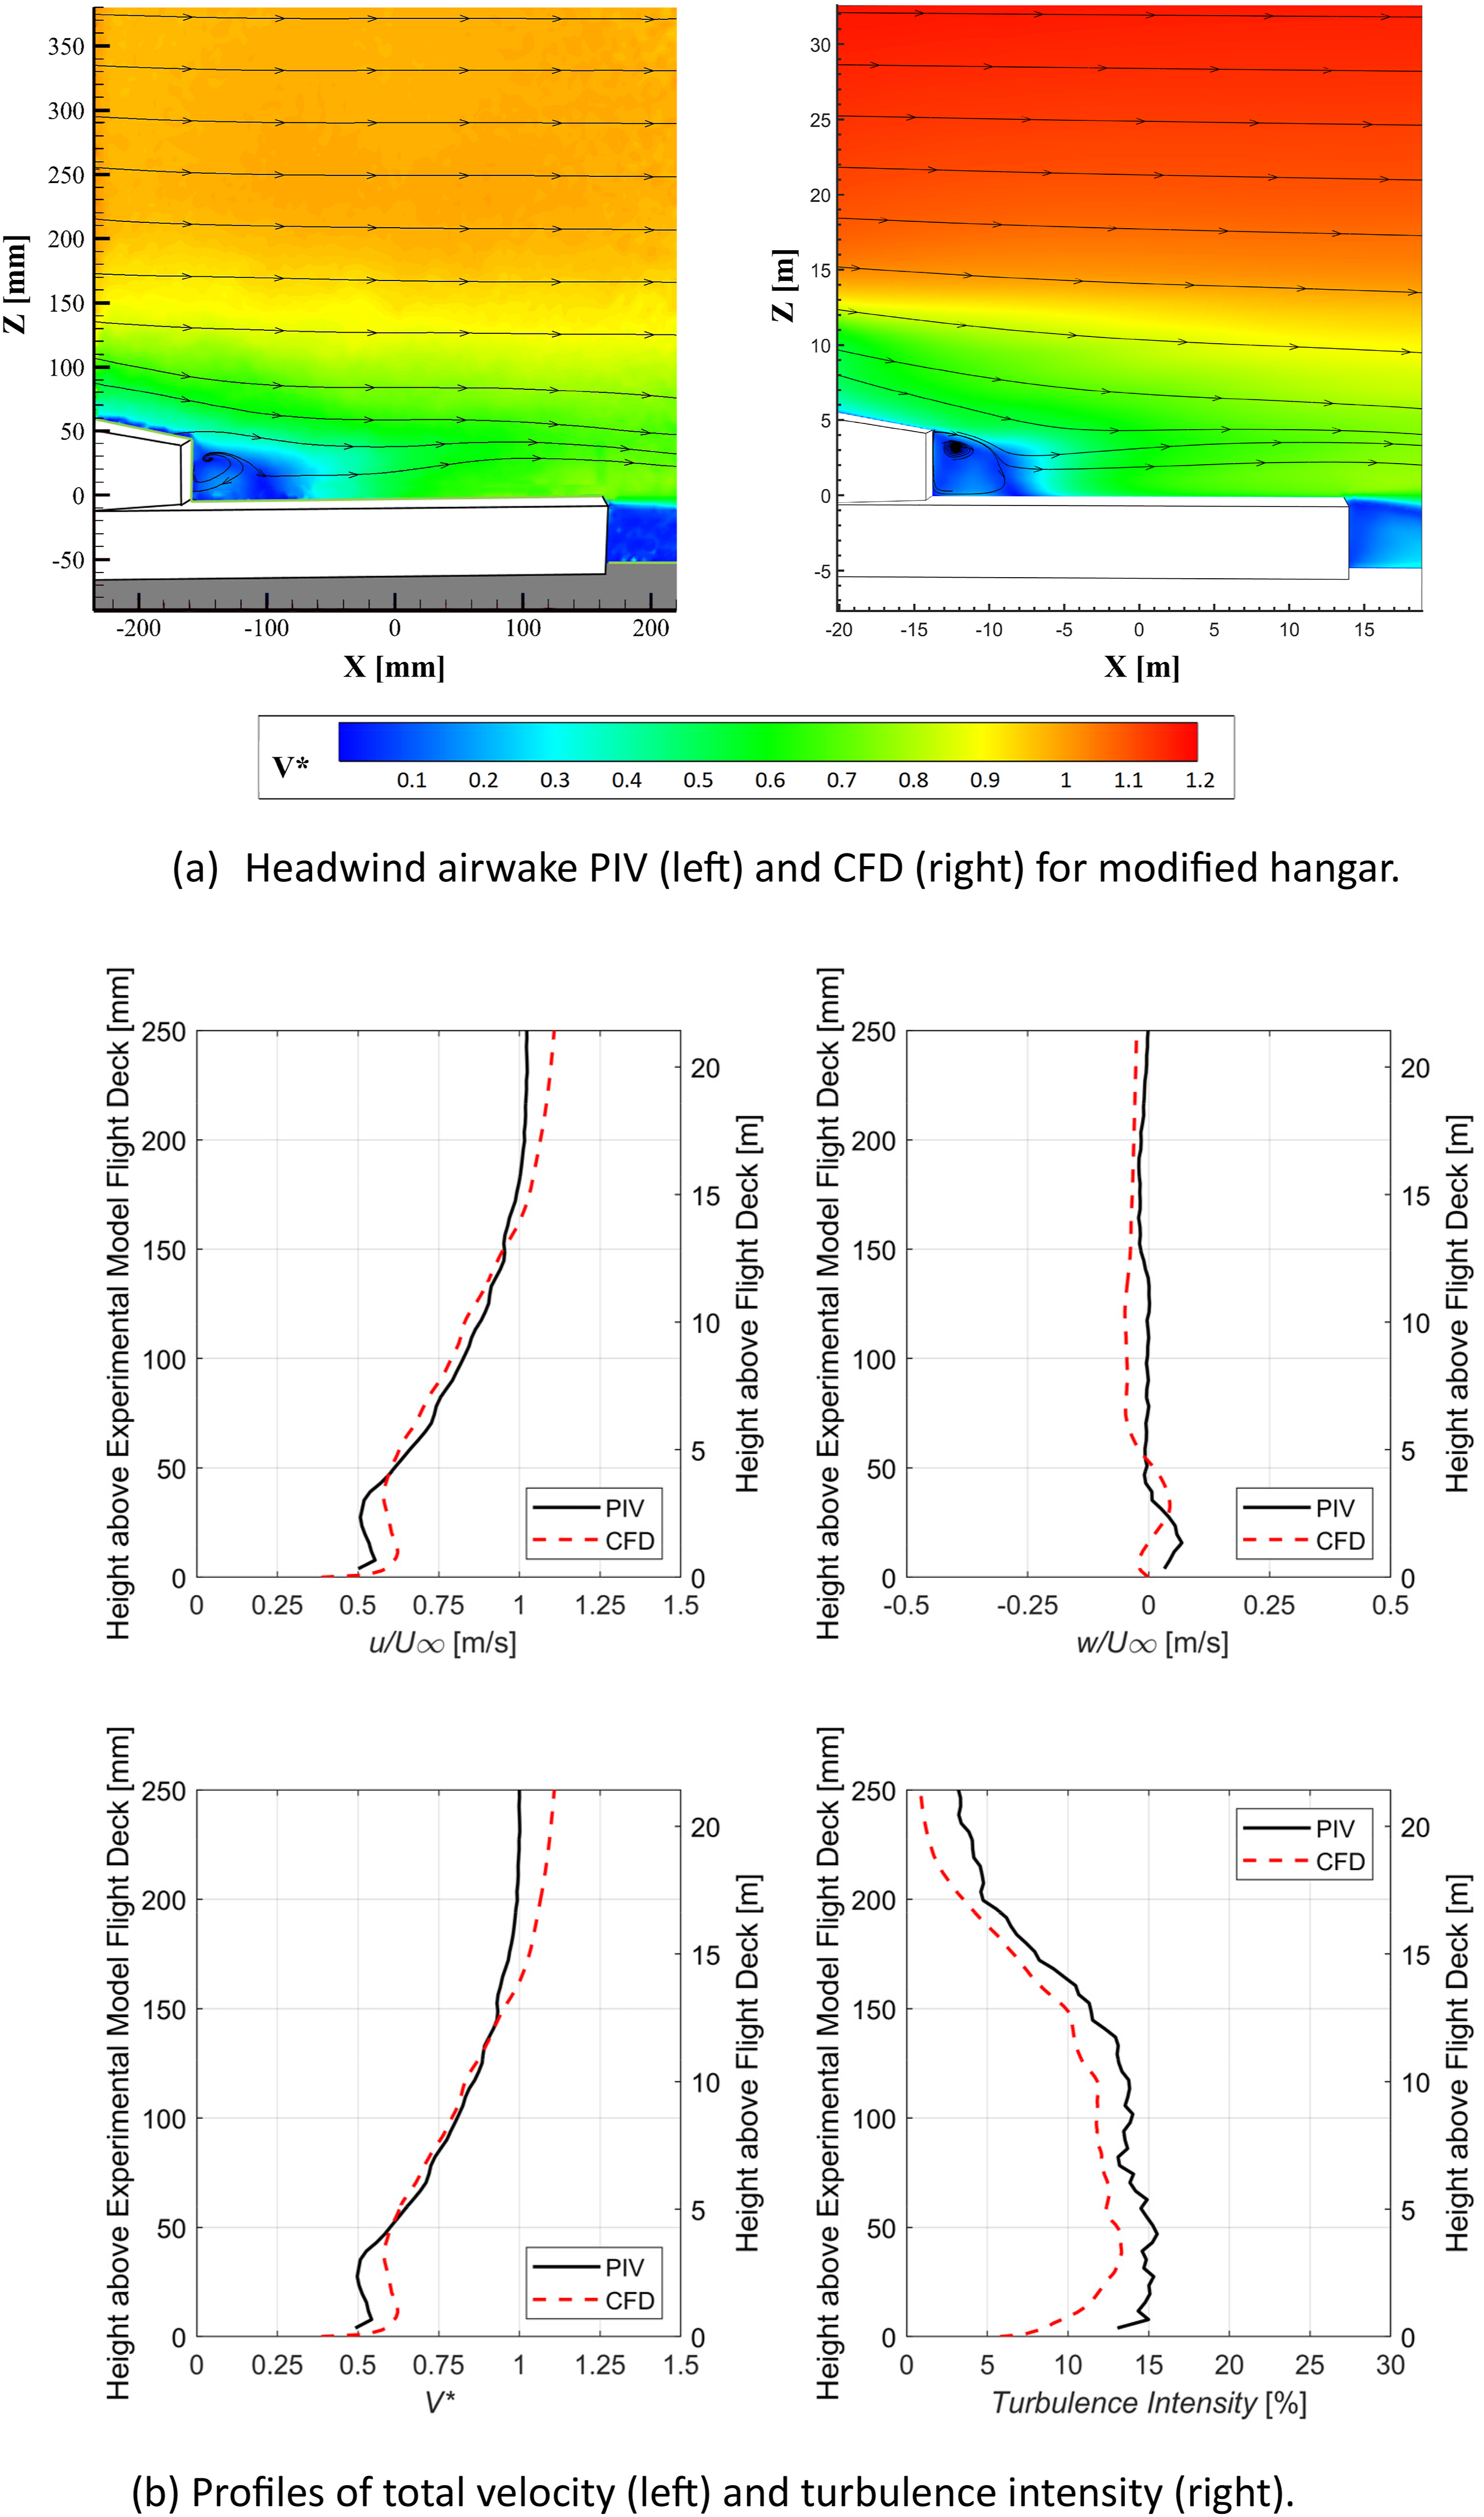
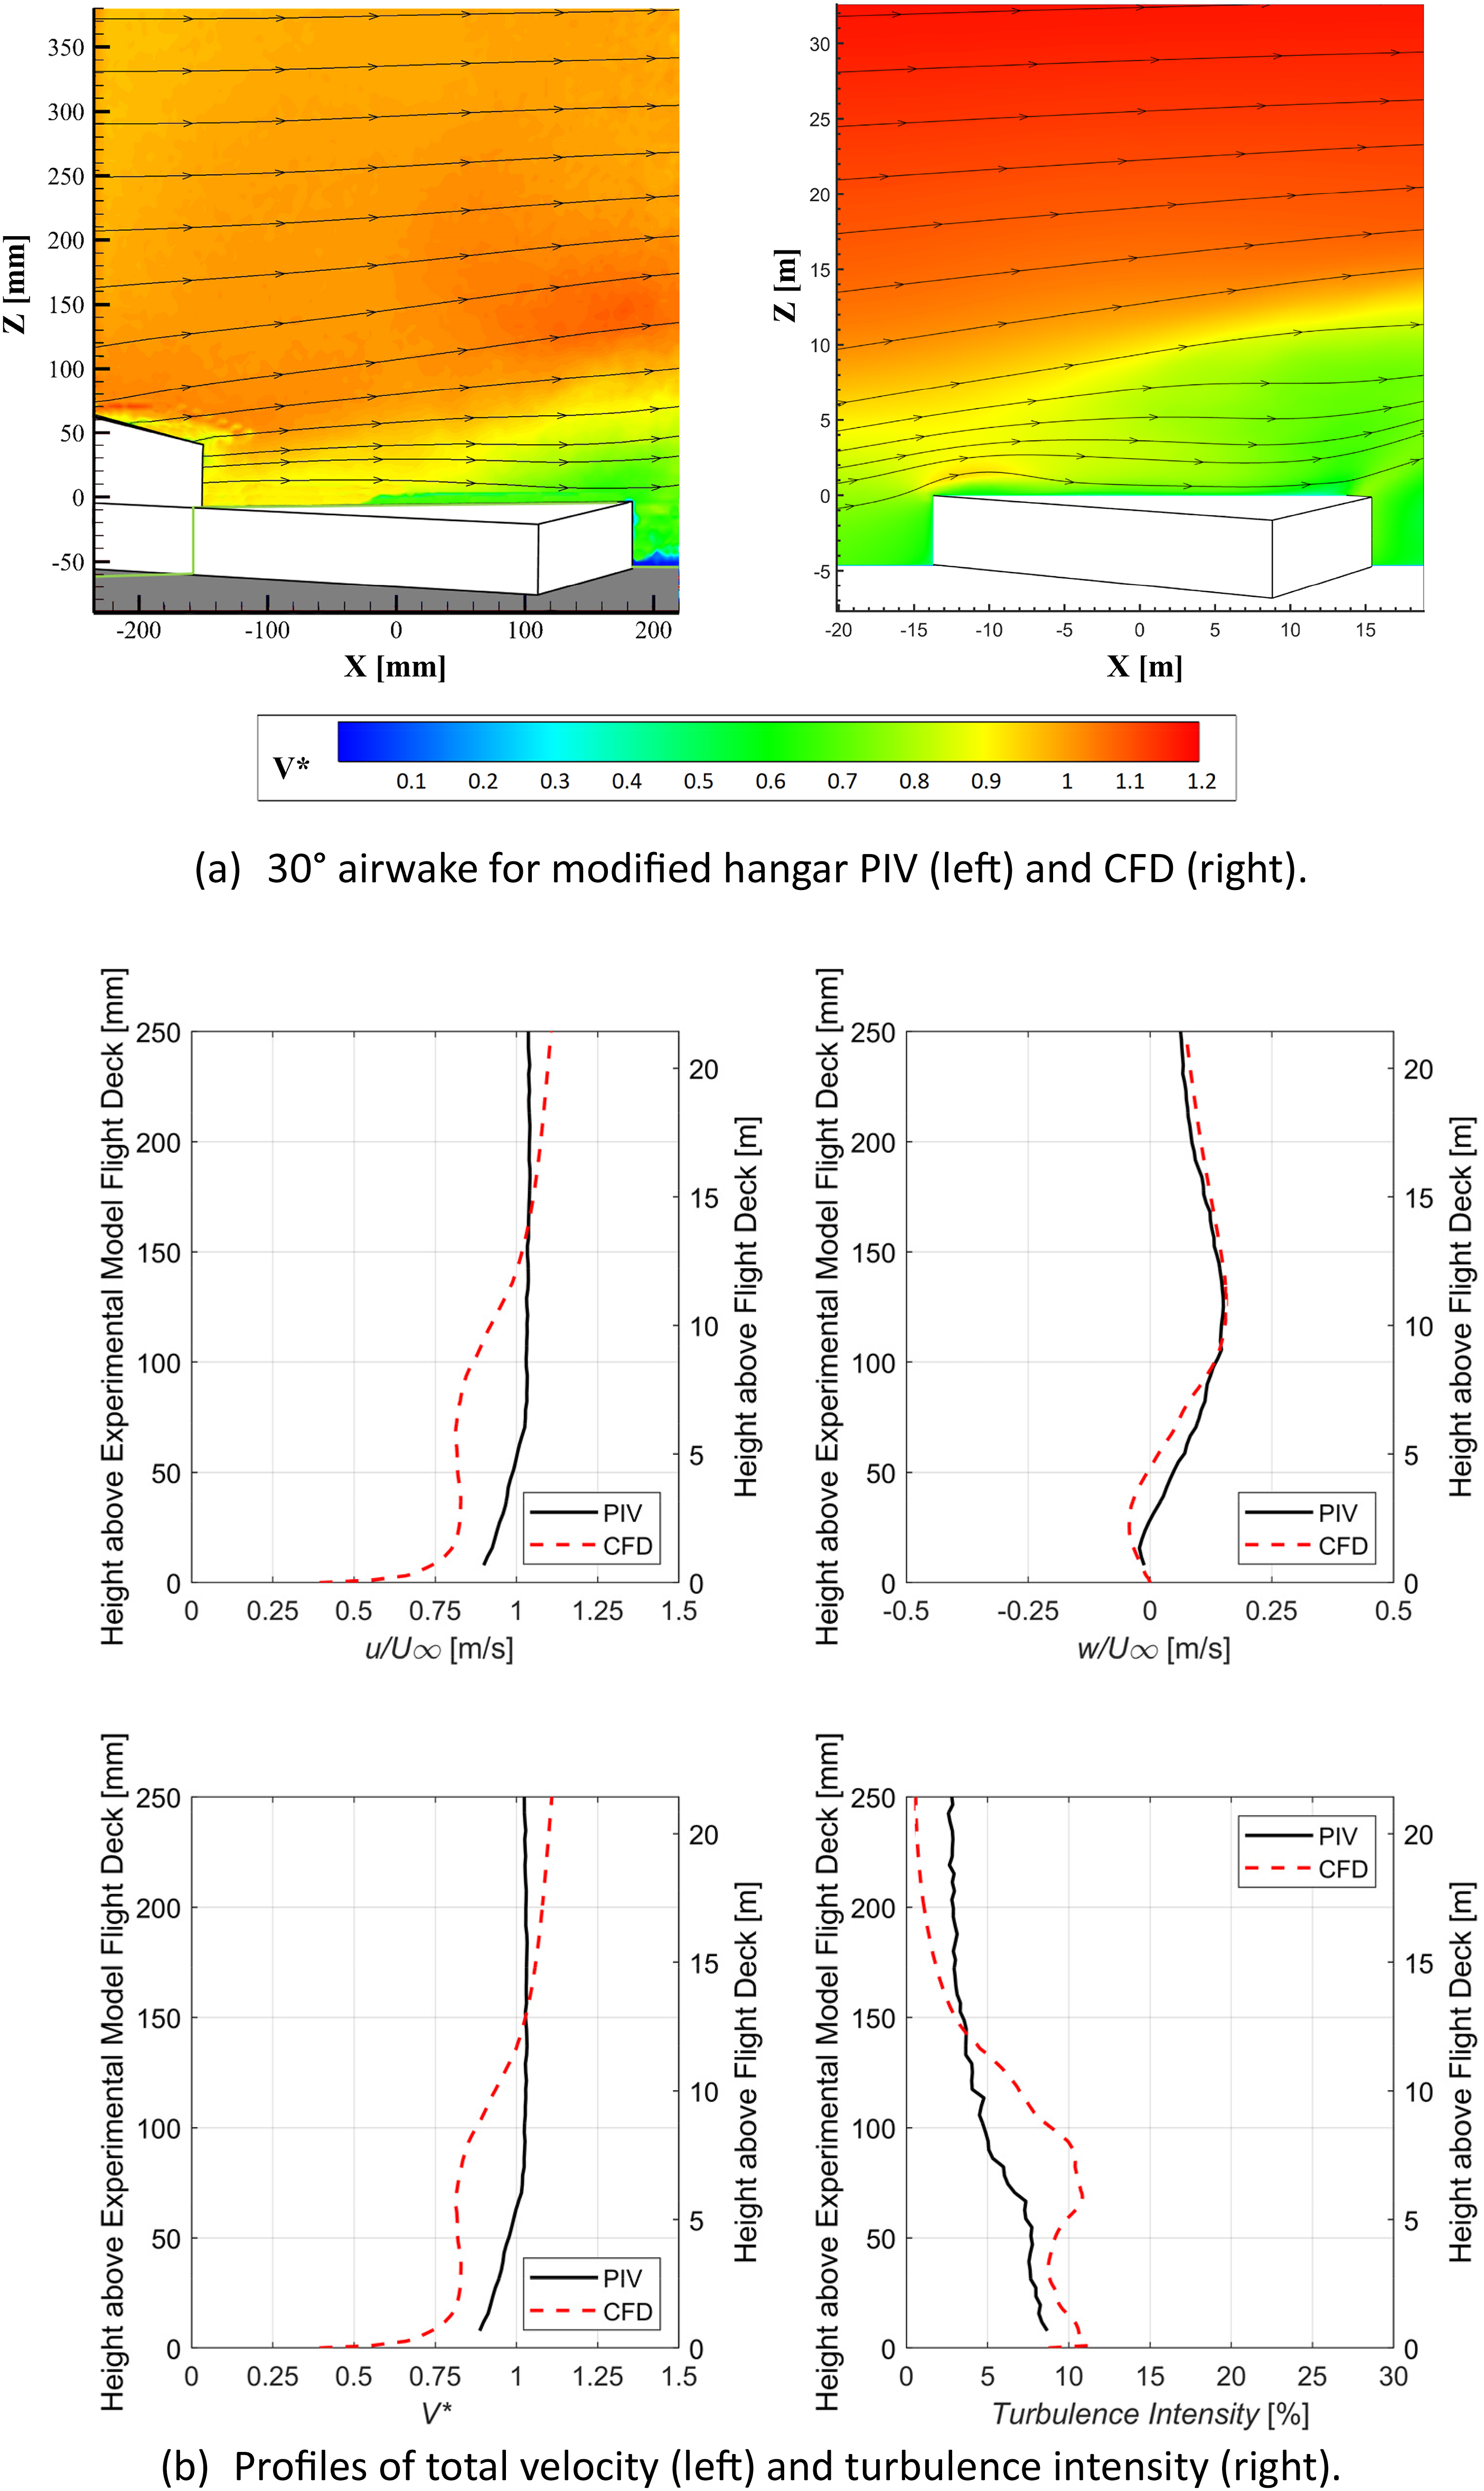
Considering first the headwind in Figure 8, it can be seen that the contour plots in Figure 8(a) show reasonable agreement, as do the vertical profiles in Figure 8(b). The recirculation zone behind the hangar in Figure 8(a) is one of the parameters that was taken into account by Bardera et al. when selecting the most effective hangar geometry. In Figure 9, where the ship is angled at 30° to the flow, the CFD shows slightly lower velocities in the contour plots of
Figure 10 shows contours of turbulence intensity on a lateral vertical plane through the centre of the landing deck computed using CFD for a headwind and for a wind from 30° off the starboard side, commonly known as a ‘Green 30’ wind (winds from the port side are known as Red winds). The overall shape of each turbulent area is similar for each ship hangar geometry in a headwind as shown in Figure 10(a) and (b); however, there is a decrease in turbulence intensity below hangar height for the angled SFS2. Similarly, Figure 10(c) and (d) show that, while the overall area of turbulent flow is comparable for both ships in a Green 30 wind, the standard SFS2 shows higher levels of turbulence intensity in the plane over the centre of flight deck. CFD contours of total turbulence intensity on a lateral vertical plane through the centre of the landing deck. (a) Standard SFS2 headwind. (b) Angled SFS2 headwind. (c) Standard SFS2 green 30 WOD. (d) Angled SFS2 green 30 WOD.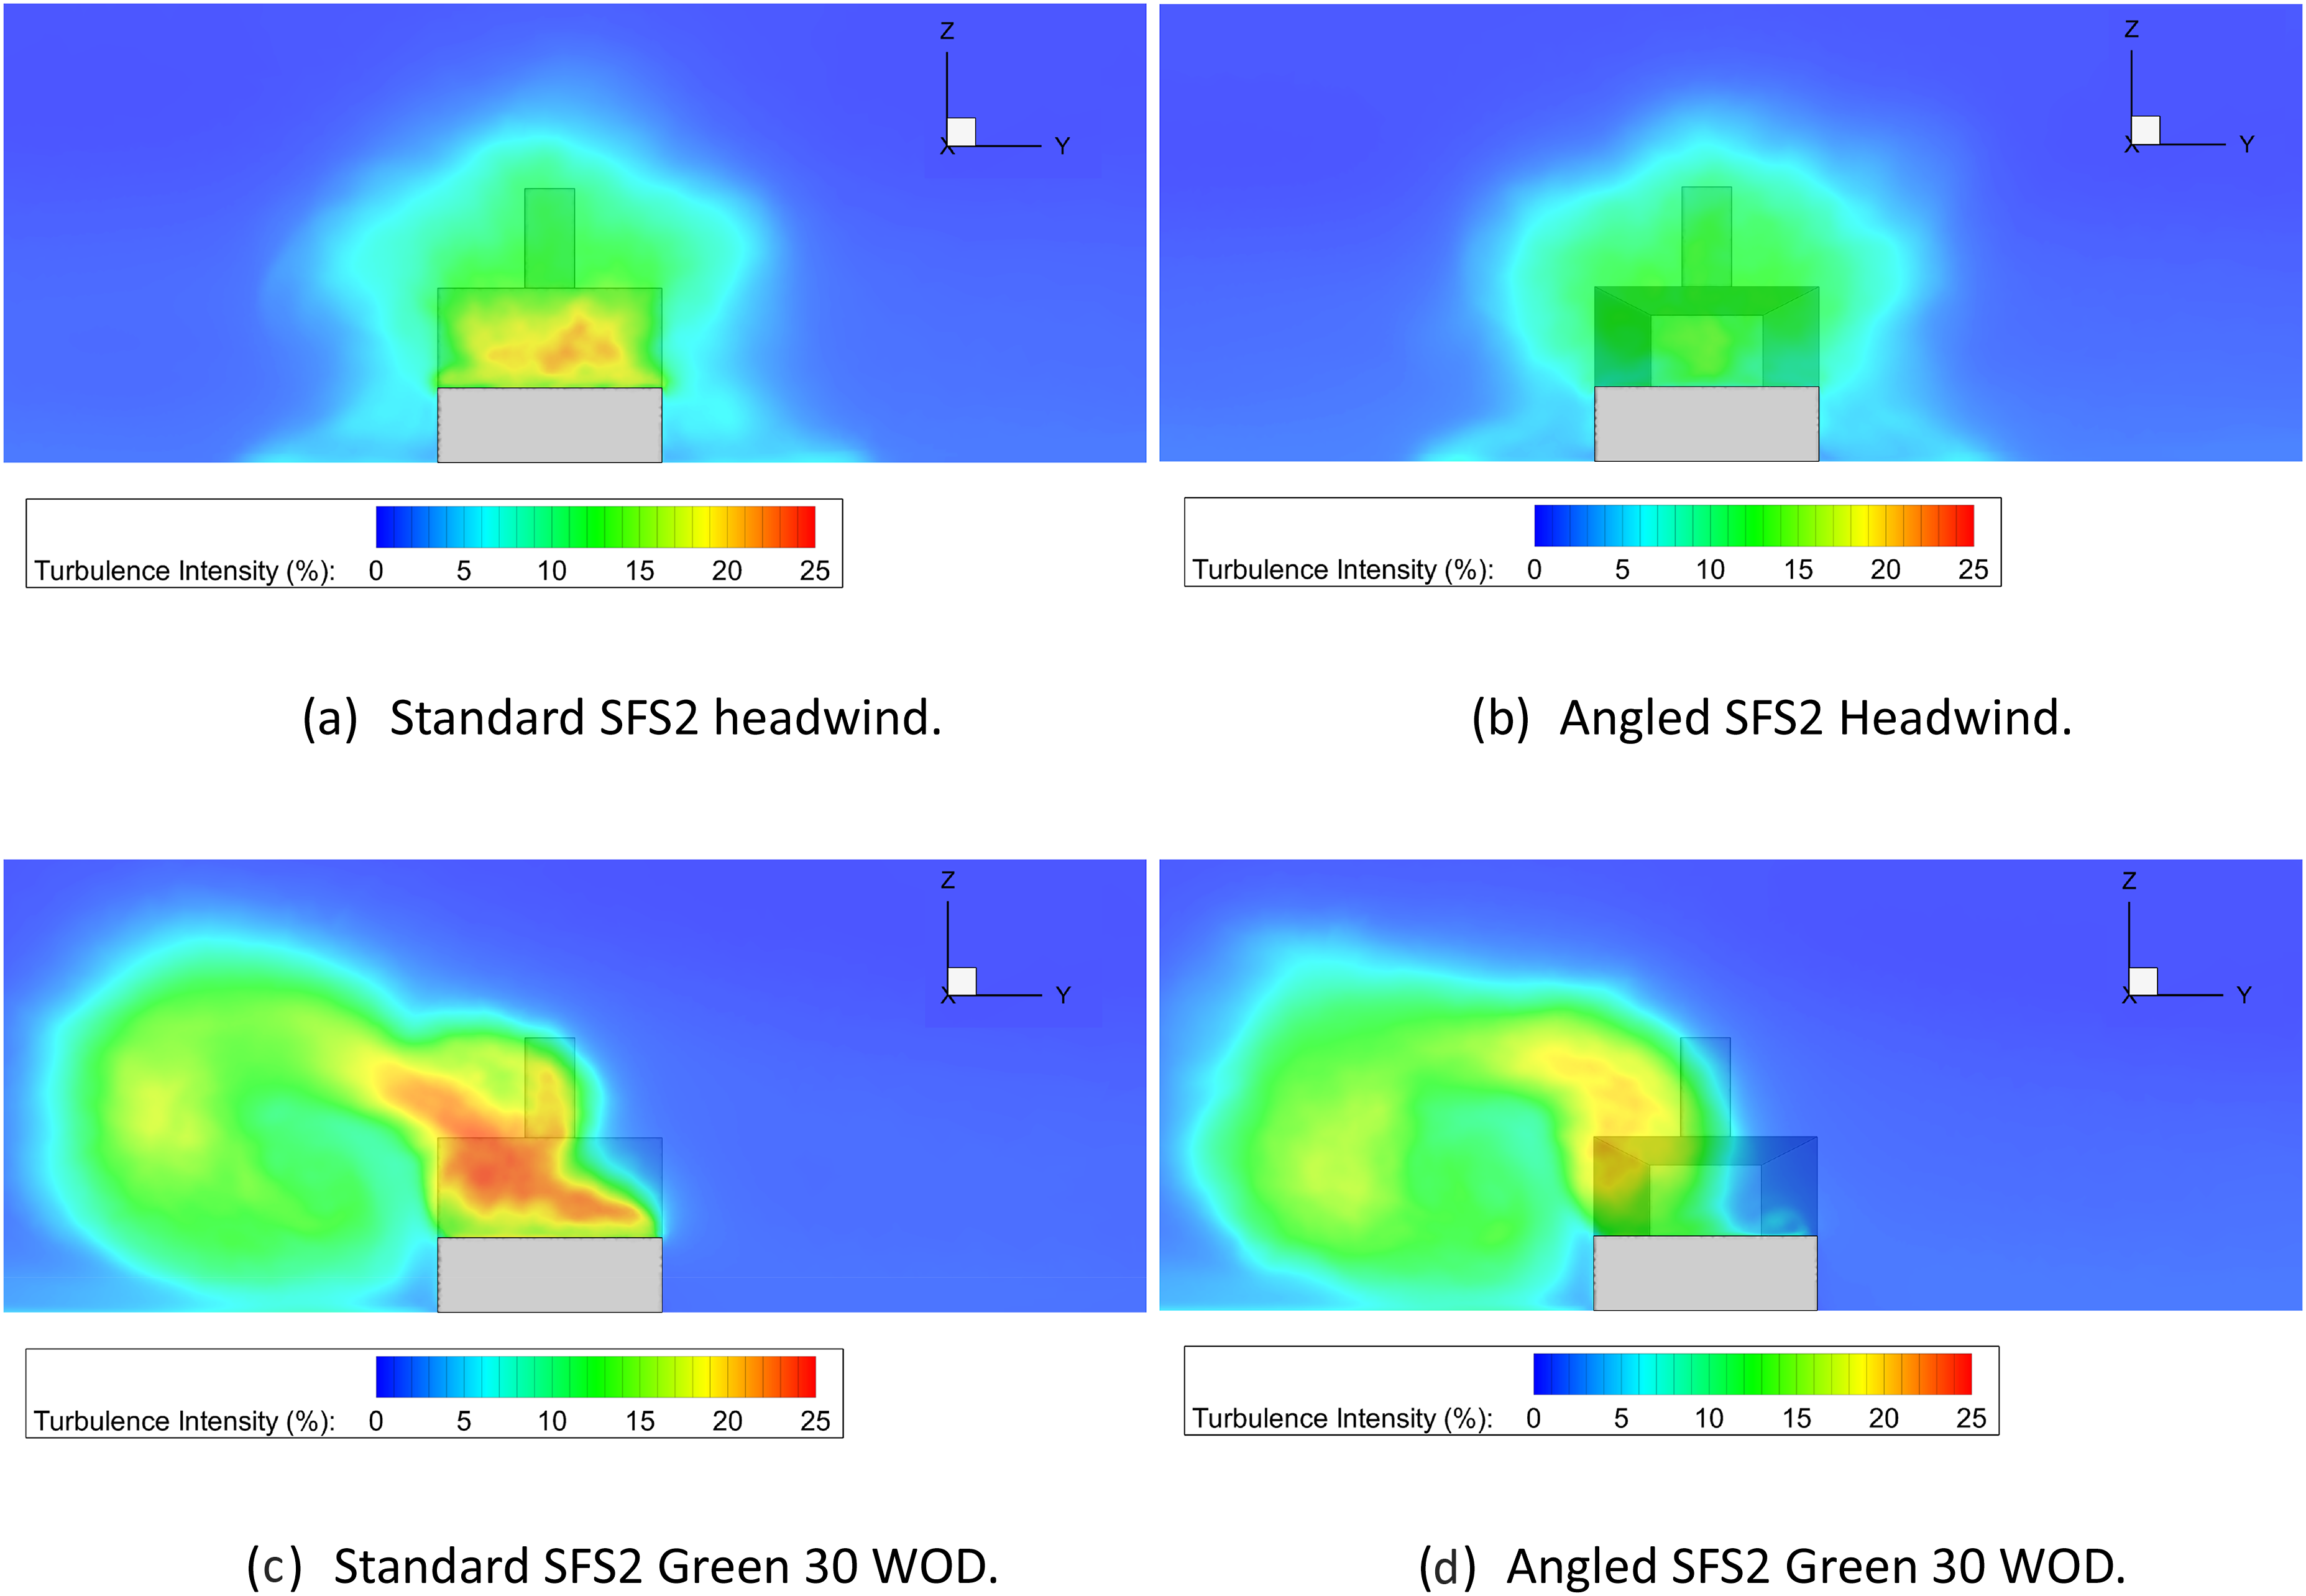
Piloted flight simulation
As mentioned previously, performing helicopter recovery and take-off to and from a ship at sea in adverse weather is considered to be amongst the most demanding tasks a pilot can face. Due to the highly dynamic flying environment, the HSDI, pilots often rely on both motion and visual cues for guidance which, for high-fidelity piloted flight simulation, is provided by a six-degree-of-freedom motion flight simulator. Effective simulation also requires effective modelling of the unsteady ship airwakes, the helicopter’s flight dynamics and ship motion, along with realistic visual models of the ship geometry, deck markings, visual landing aids and sea surface. 41
HELIFLIGHT-R, Figure 11, is a fully reconfigurable research simulator
42
which has been used in numerous studies investigating the effect of CFD-generated ship airwakes on helicopter pilot workload.6,29,43 The simulator has a generic rotorcraft cockpit housed inside a 12 ft diameter visual display dome, mounted on a standard hexapod motion platform with six 24-inch stroke electric actuators. A twin-seat cockpit is housed in the simulator cabin, with a third seat available at the rear for an instructor or simulator operator. The primary cockpit instruments are displayed on two flat-screen monitors, allowing straightforward instrument panel reconfiguration for each simulated aircraft. Similarly, a four-axis electronic control loading system provides the capability to configure the force-feel characteristics of both the pilot and co-pilot’s cyclic, collective and pedal controls to represent a wide range of aircraft types. The outside world image is displayed onto the inside surface of the dome, as can be seen on the right of Figure 11, using three Digital Light Processing (DLP) projectors, each with a resolution of 2560 × 1600 pixels. Each projector is equipped with a wide-angle lens, which together provide a single blended image with a vertical field-of-view of 70° (+30°/−40°) and a horizontal field-of-view of 230° (±115°). Loudspeakers are distributed throughout the cabin to provide audio cues to the pilot. Visual environment in the HELIFLIGHT-R flight simulator.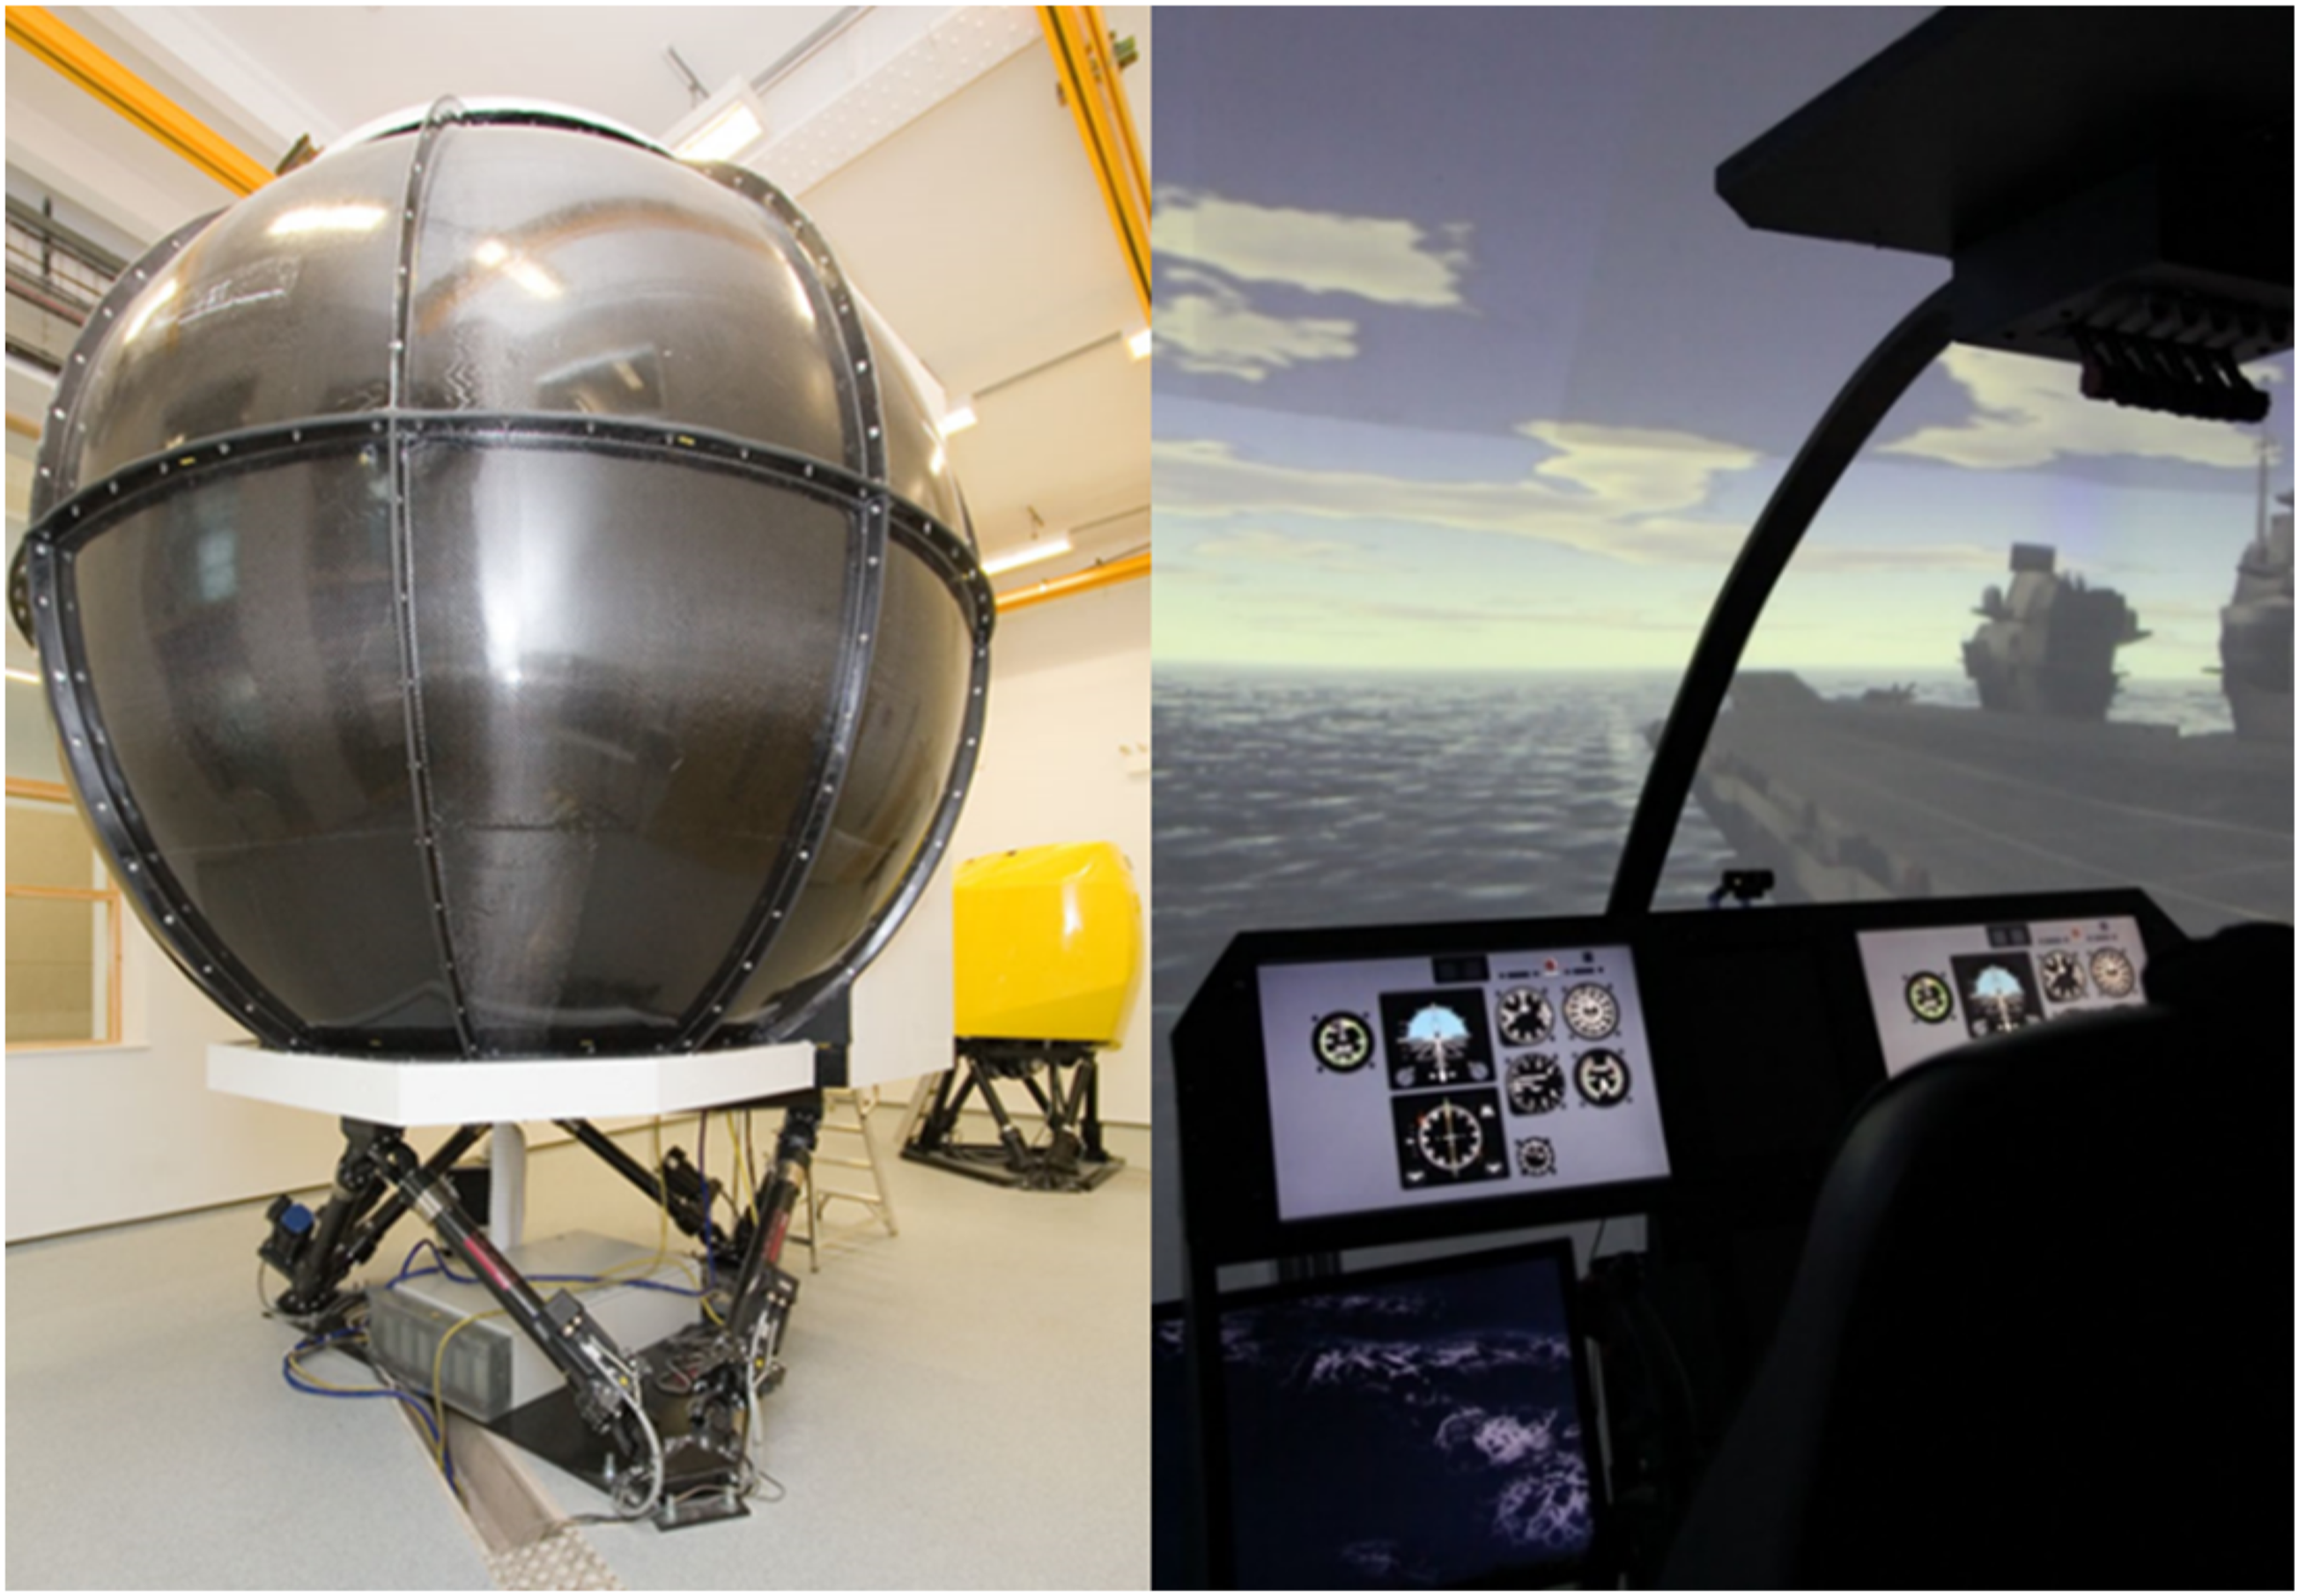
Using Advanced Rotorcraft Technology’s FLIGHTLAB software, 44 a generic rotorcraft flight dynamics model, configured to be representative of the SH-60B Seahawk, was integrated with the HELIFLIGHT-R simulator. The Seahawk model was used because of its strong validation 45 and extensive use during previous research at the University of Liverpool. 46 Within FLIGHTLAB, the local velocity components are applied to the helicopter flight dynamics model at various locations on the main rotor blades and airframe, thereby allowing the CFD-generated airwakes to be integrated with the aircraft’s aerodynamic model. Real-time flight data is monitored and recorded through FLIGHTLAB during testing which, together with in-cockpit video and audio recordings, are used for post-trial analysis.
To provide the pilot with appropriate visual cues during the flight trial, a visual model of a conceptual frigate, shown in Figure 12, was used to represent the SFS2. The visual model was scaled so that the ship length, the length and breadth of the flight deck, and the hangar height all corresponded to the dimensions of the SFS2. Ship motion of a typical 130 m long frigate in a headwind was applied for each wind condition. Frigate visual model scaled to represent the SFS2.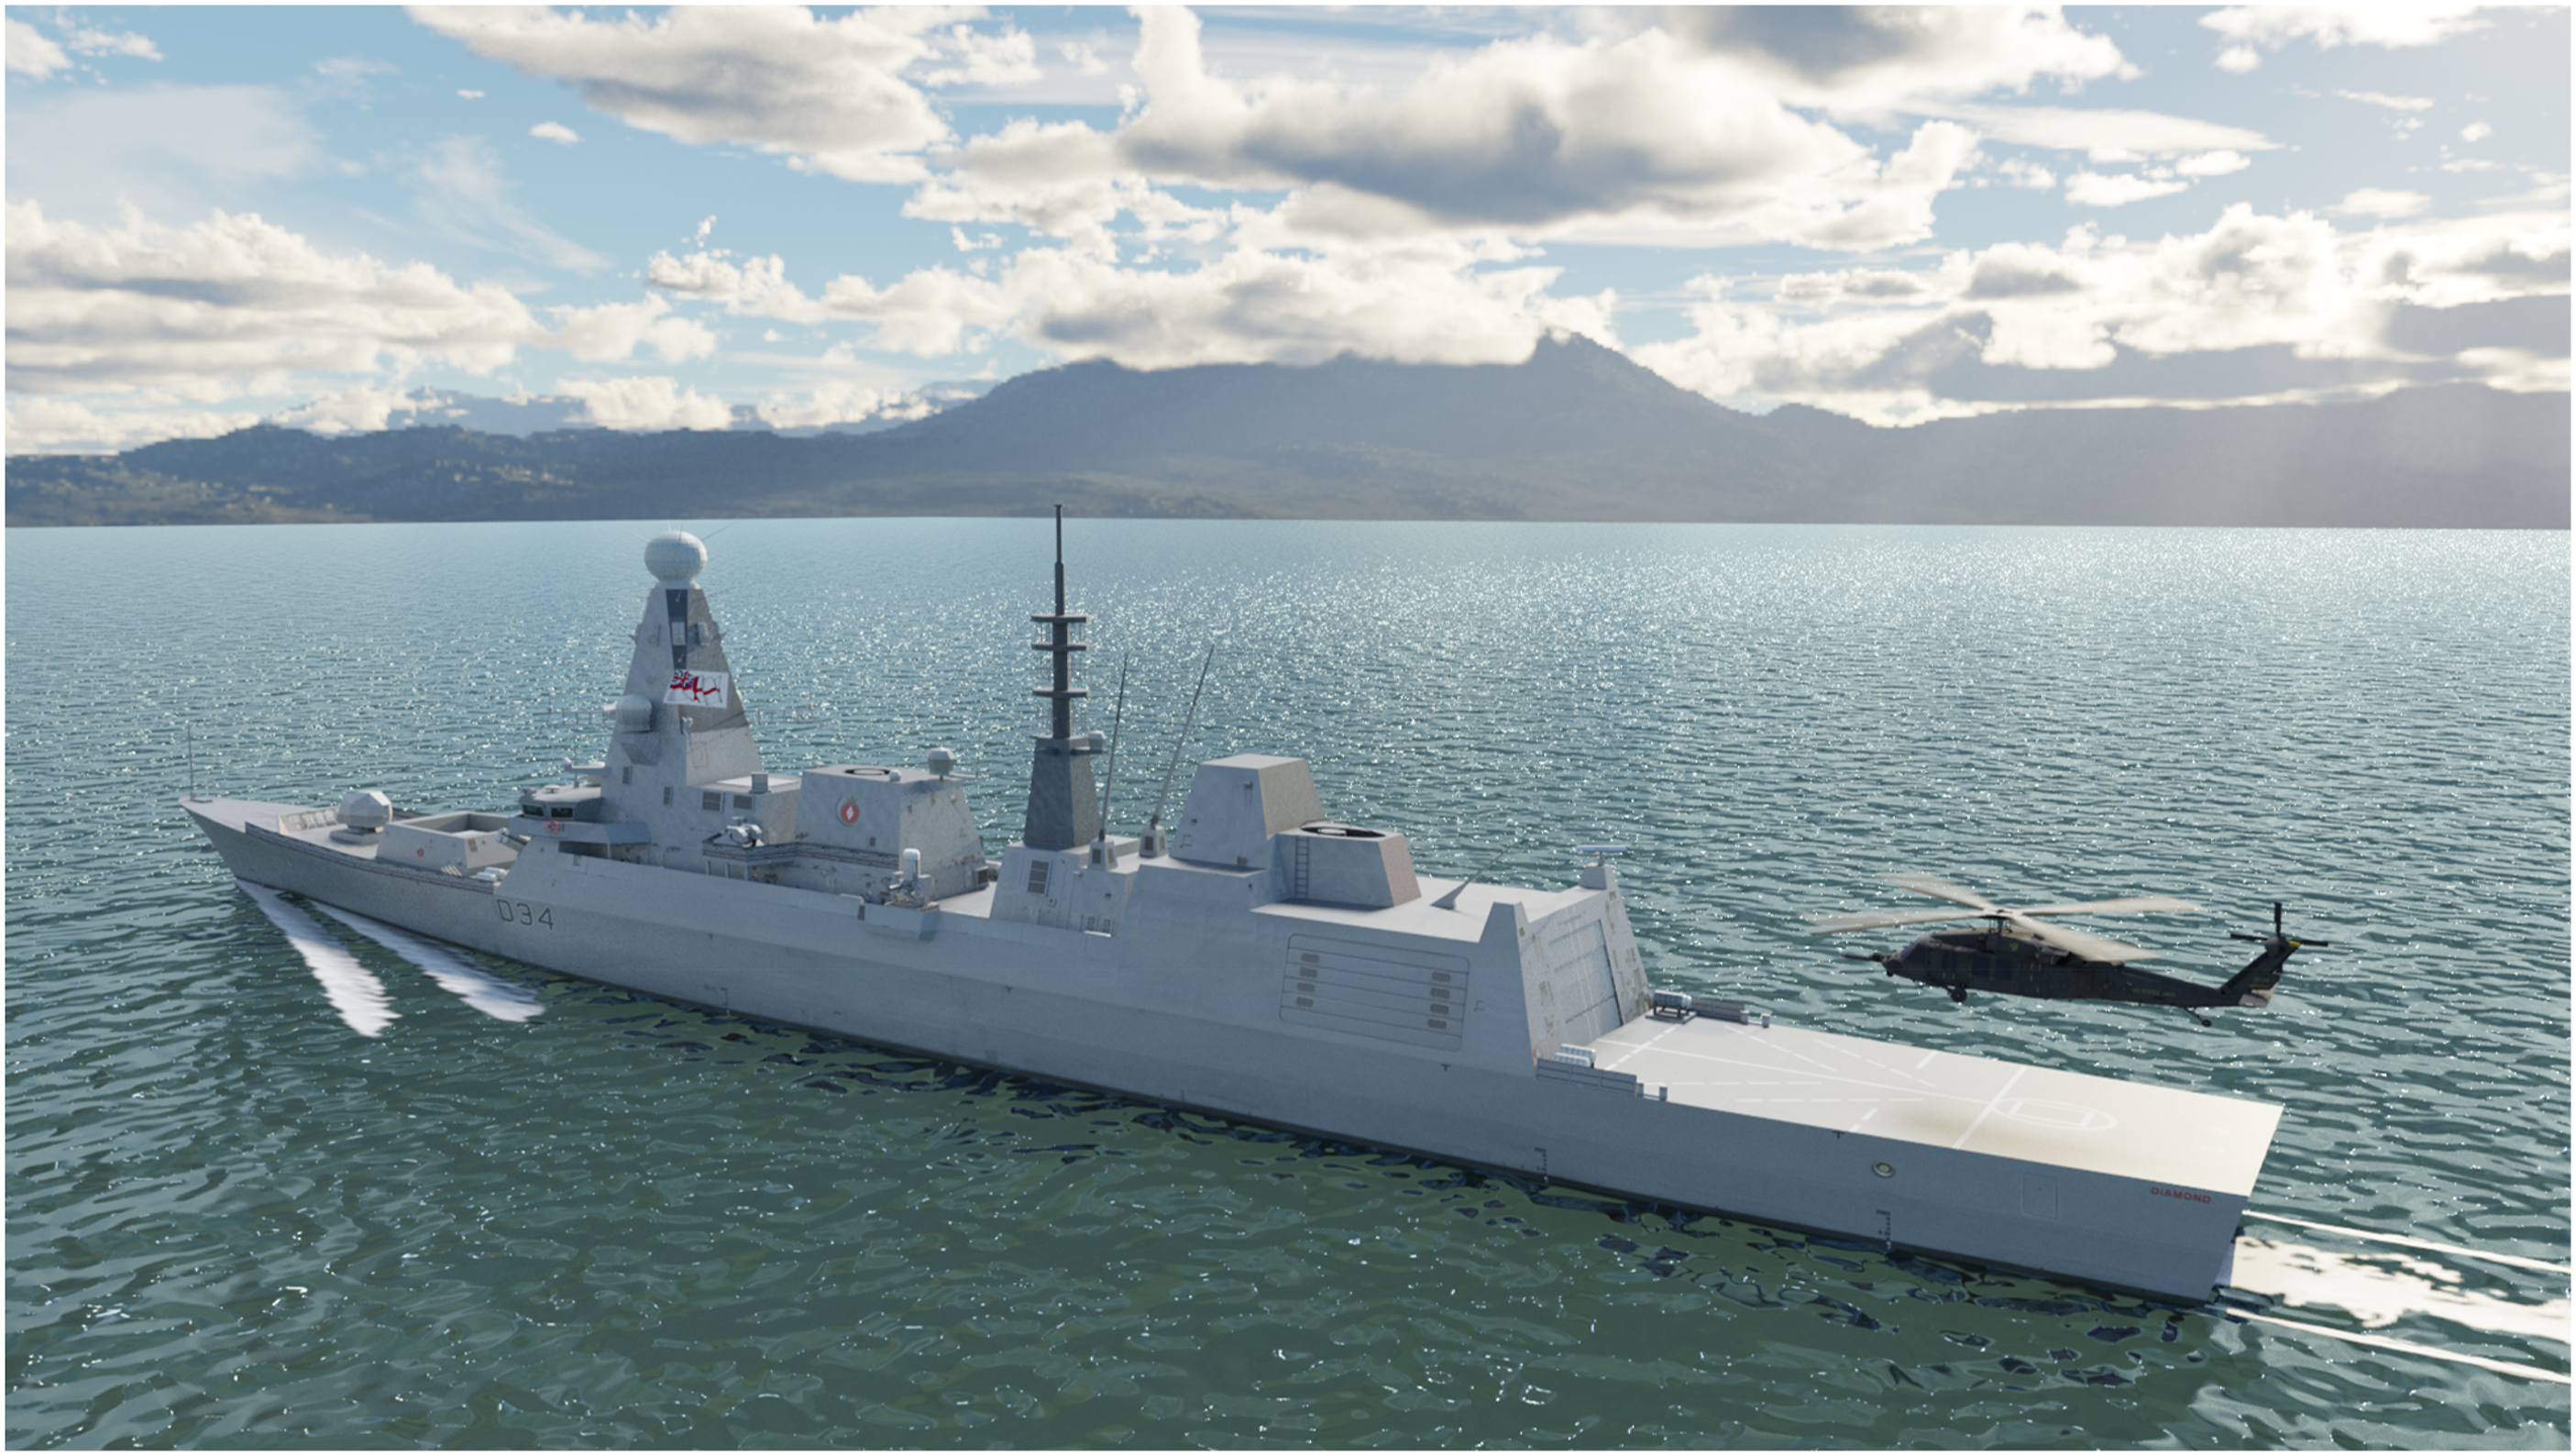
Airwake interpolation and integration with FLIGHTLAB
To assess the effect of the SFS2 airwakes on the helicopter, for the two hangar geometries, the CFD-generated airwakes that had been created and compared with the experimental data from Bardera et al. for the headwind and Green 30 were used in the flight simulation trials. The process by which the raw unsteady CFD airwake data is applied to the FLIGHTLAB helicopter flight dynamics model is shown in Figure 13. A 30 s airwake is computed at 100 Hz on an unstructured mesh for each wind direction; the time-dependent velocity components in the unstructured mesh are then interpolated onto a smaller structured grid and down-sampled to 25 Hz (i.e. the unsteady velocity components are applied to the flight dynamics model every 0.04 s). The airwake is looped continuously within MATLAB Simulink for the duration of the landing task. The rectangular structured grid is shown in the bottom left of Figure 13 and is the region in which the helicopter will be flown by the pilot; the grid was 120 m by 90 m by 30 m, with a spacing of 1 m. For each ship geometry, the airwakes were computed at 40 kt for the two wind directions. To obtain wind speeds of 30 kt and 50 kt the airwakes were then scaled linearly in both magnitude and frequency, that is each velocity component is multiplied by 3/4 or 5/4 and the airwake time history is replayed in the simulation with the same scaling applied. The rationale of the scaling process is that at such high Reynolds numbers the airwakes have dynamic similarity at different wind speeds, and the frequency content follows Strouhal scaling. The validity of the scaling method has been previously demonstrated.
47
The interpolated velocity data of each airwake is converted into a series of lookup tables in Simulink and scaled accordingly. The instantaneous velocities are then applied to the helicopter flight dynamics model at Aerodynamic Computation Points (ACPs) in real time within FLIGHTLAB as the helicopter moves around within the airwake; as the aircraft has no effect on the airwake, this integration is known as one-way coupling. The distribution of ACPs on the helicopter model can be seen in the upper right of Figure 13. Each of the four main rotor blades has 10 ACPs, with one at the centre of gravity, one on each of the port and starboard stabilators and two on the vertical tail, giving a total of 46 ACPs. Integration of CFD airwake with helicopter flight dynamics model.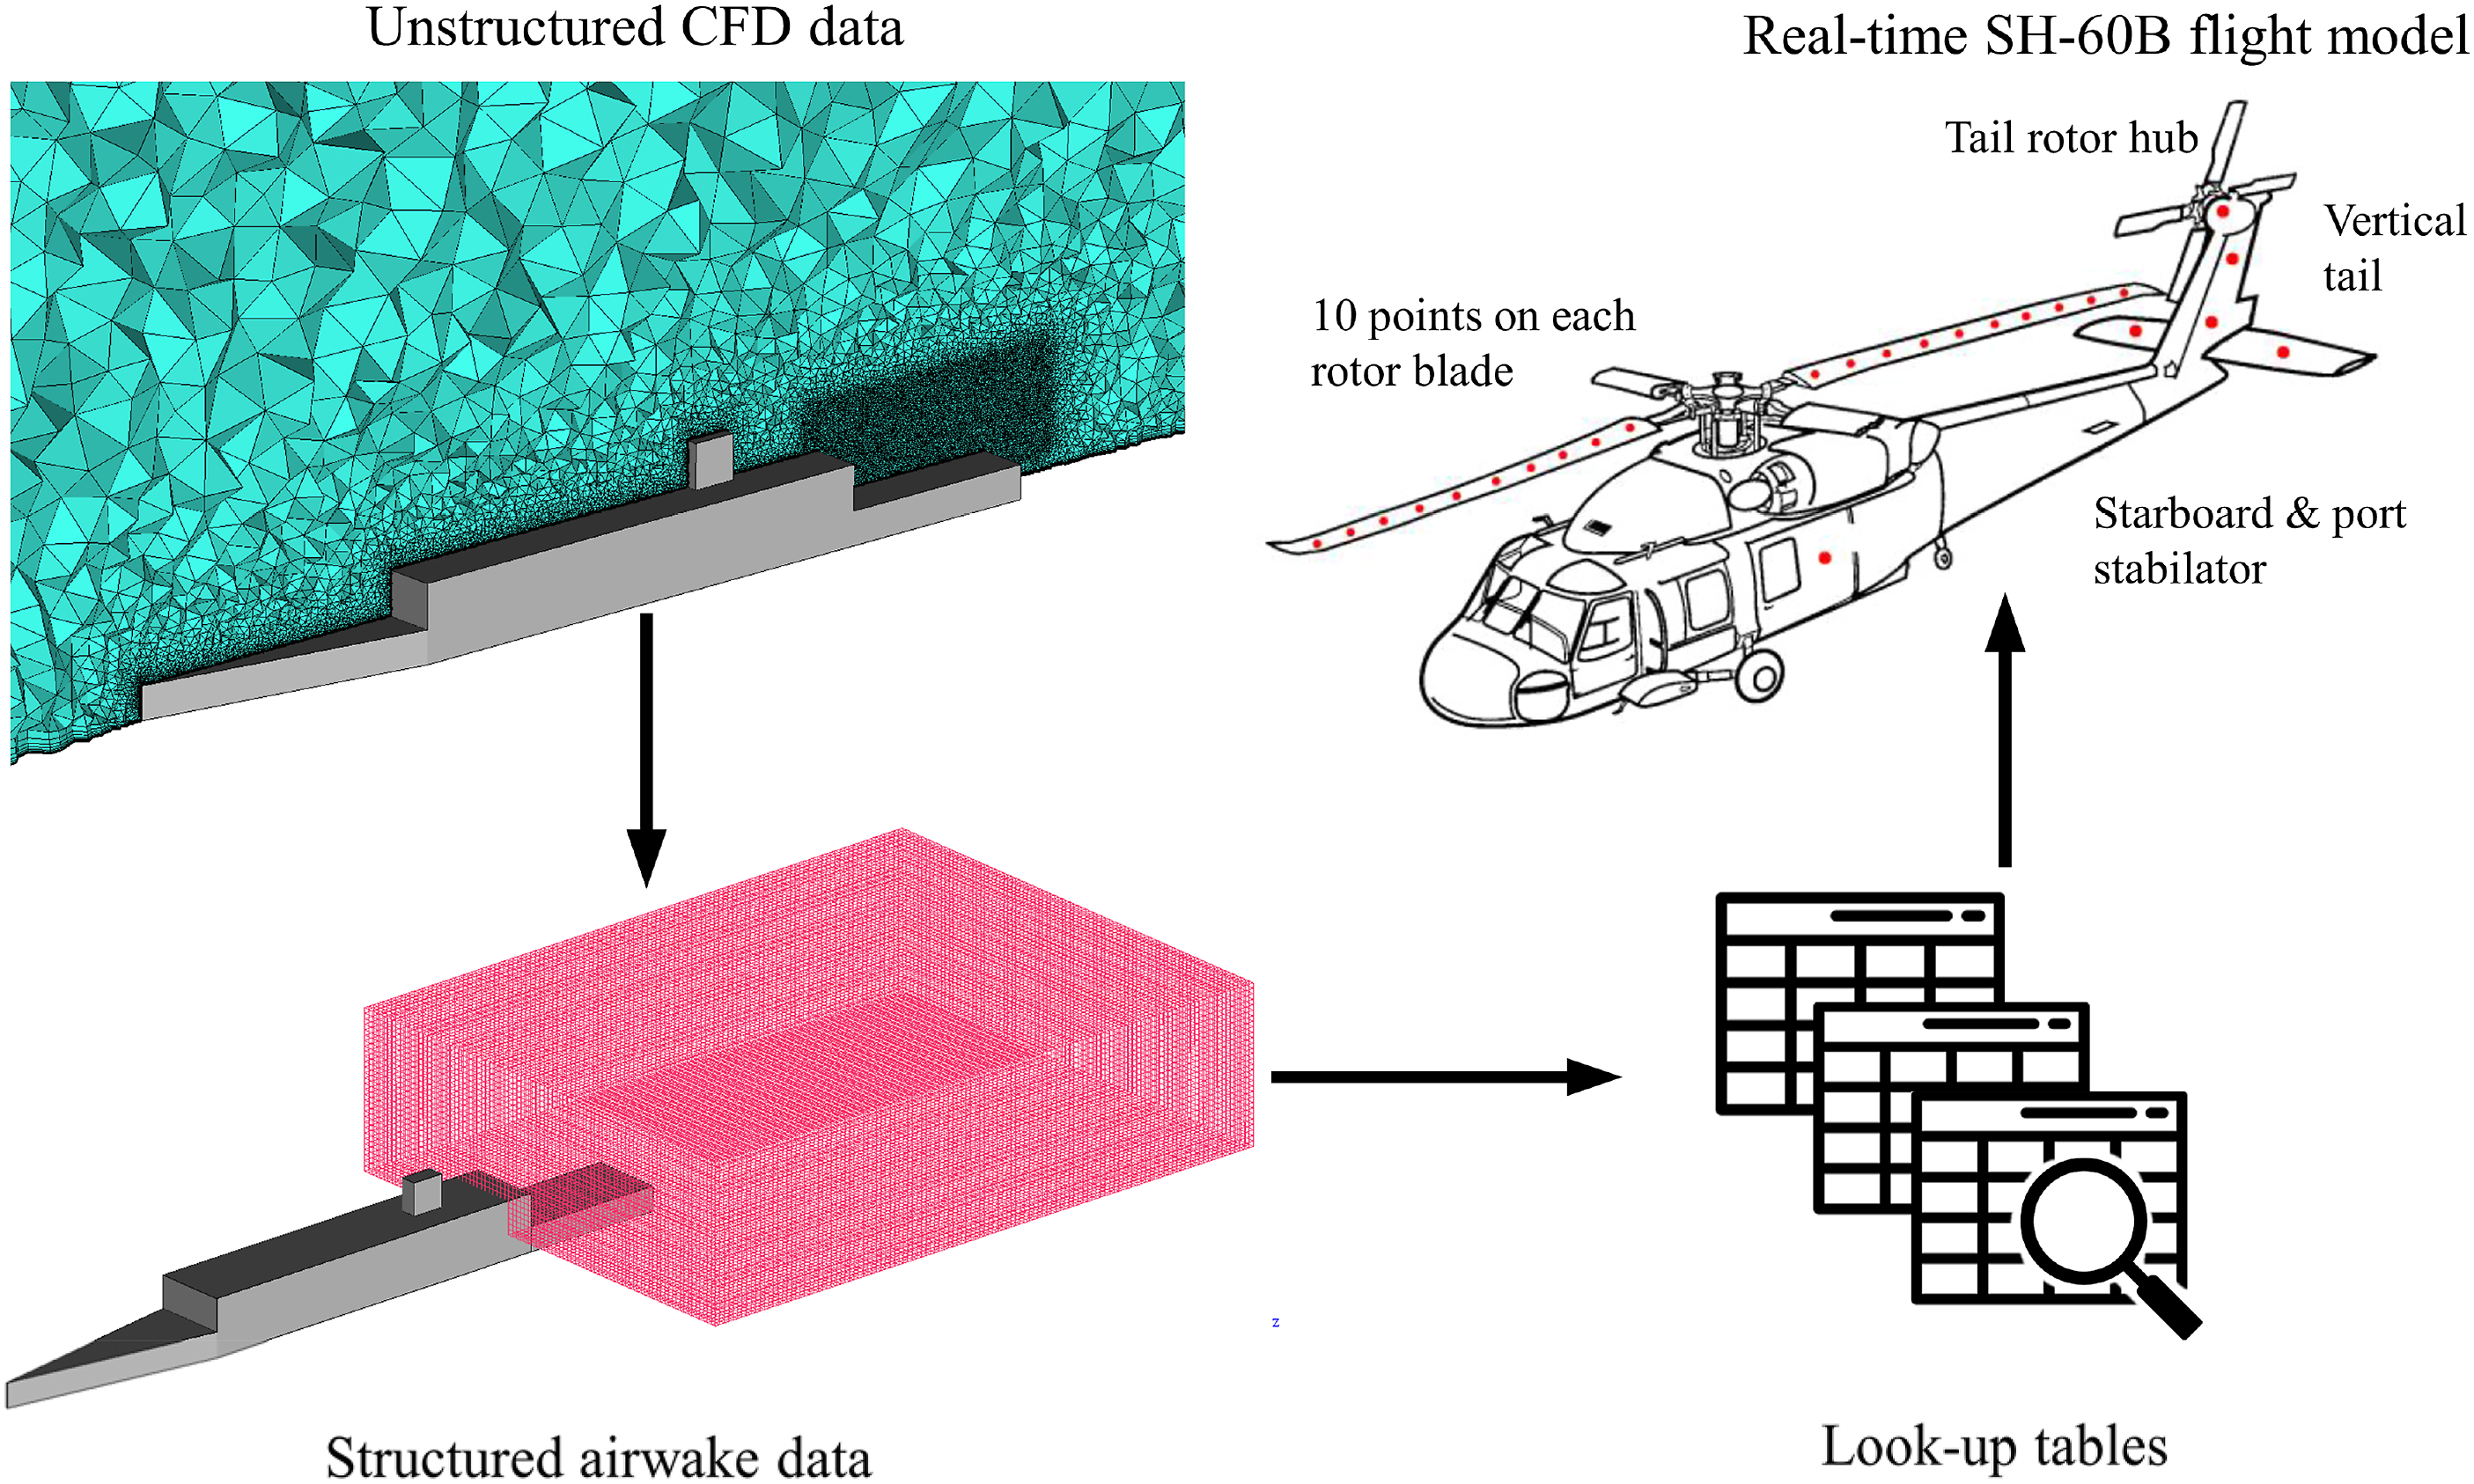
Flight test procedure
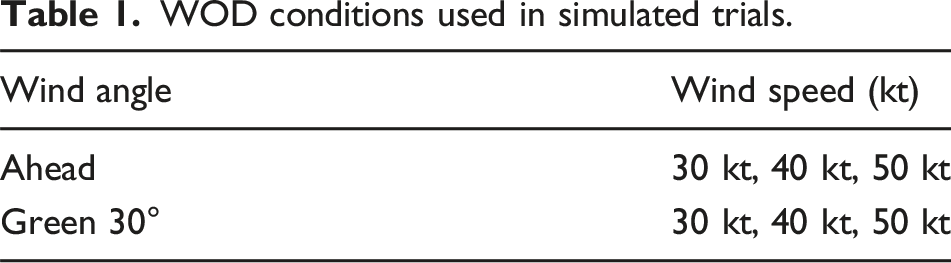
The flight tests were conducted for a headwind and a Green 30 wind. The wind speed and direction, that is the wind-over-deck (WOD) is specified relative to the ship and a Green wind was chosen because it presents particular challenges for helicopters performing the UK Royal Navy standard approach adopted in the trial. This deck landing approach, shown in Figure 14, requires the pilot to adopt a stabilised hover position parallel to and alongside the port side of the deck, matching the speed of the ship; this is followed by a lateral translation to a hover position above the landing spot, before a final vertical descent to touchdown on the deck. Table 1 provides a list of the six WOD conditions in which the deck landings were conducted for each of the ship geometries. UK Royal Navy standard recovery approach to a single spot frigate. WOD conditions used in simulated trials.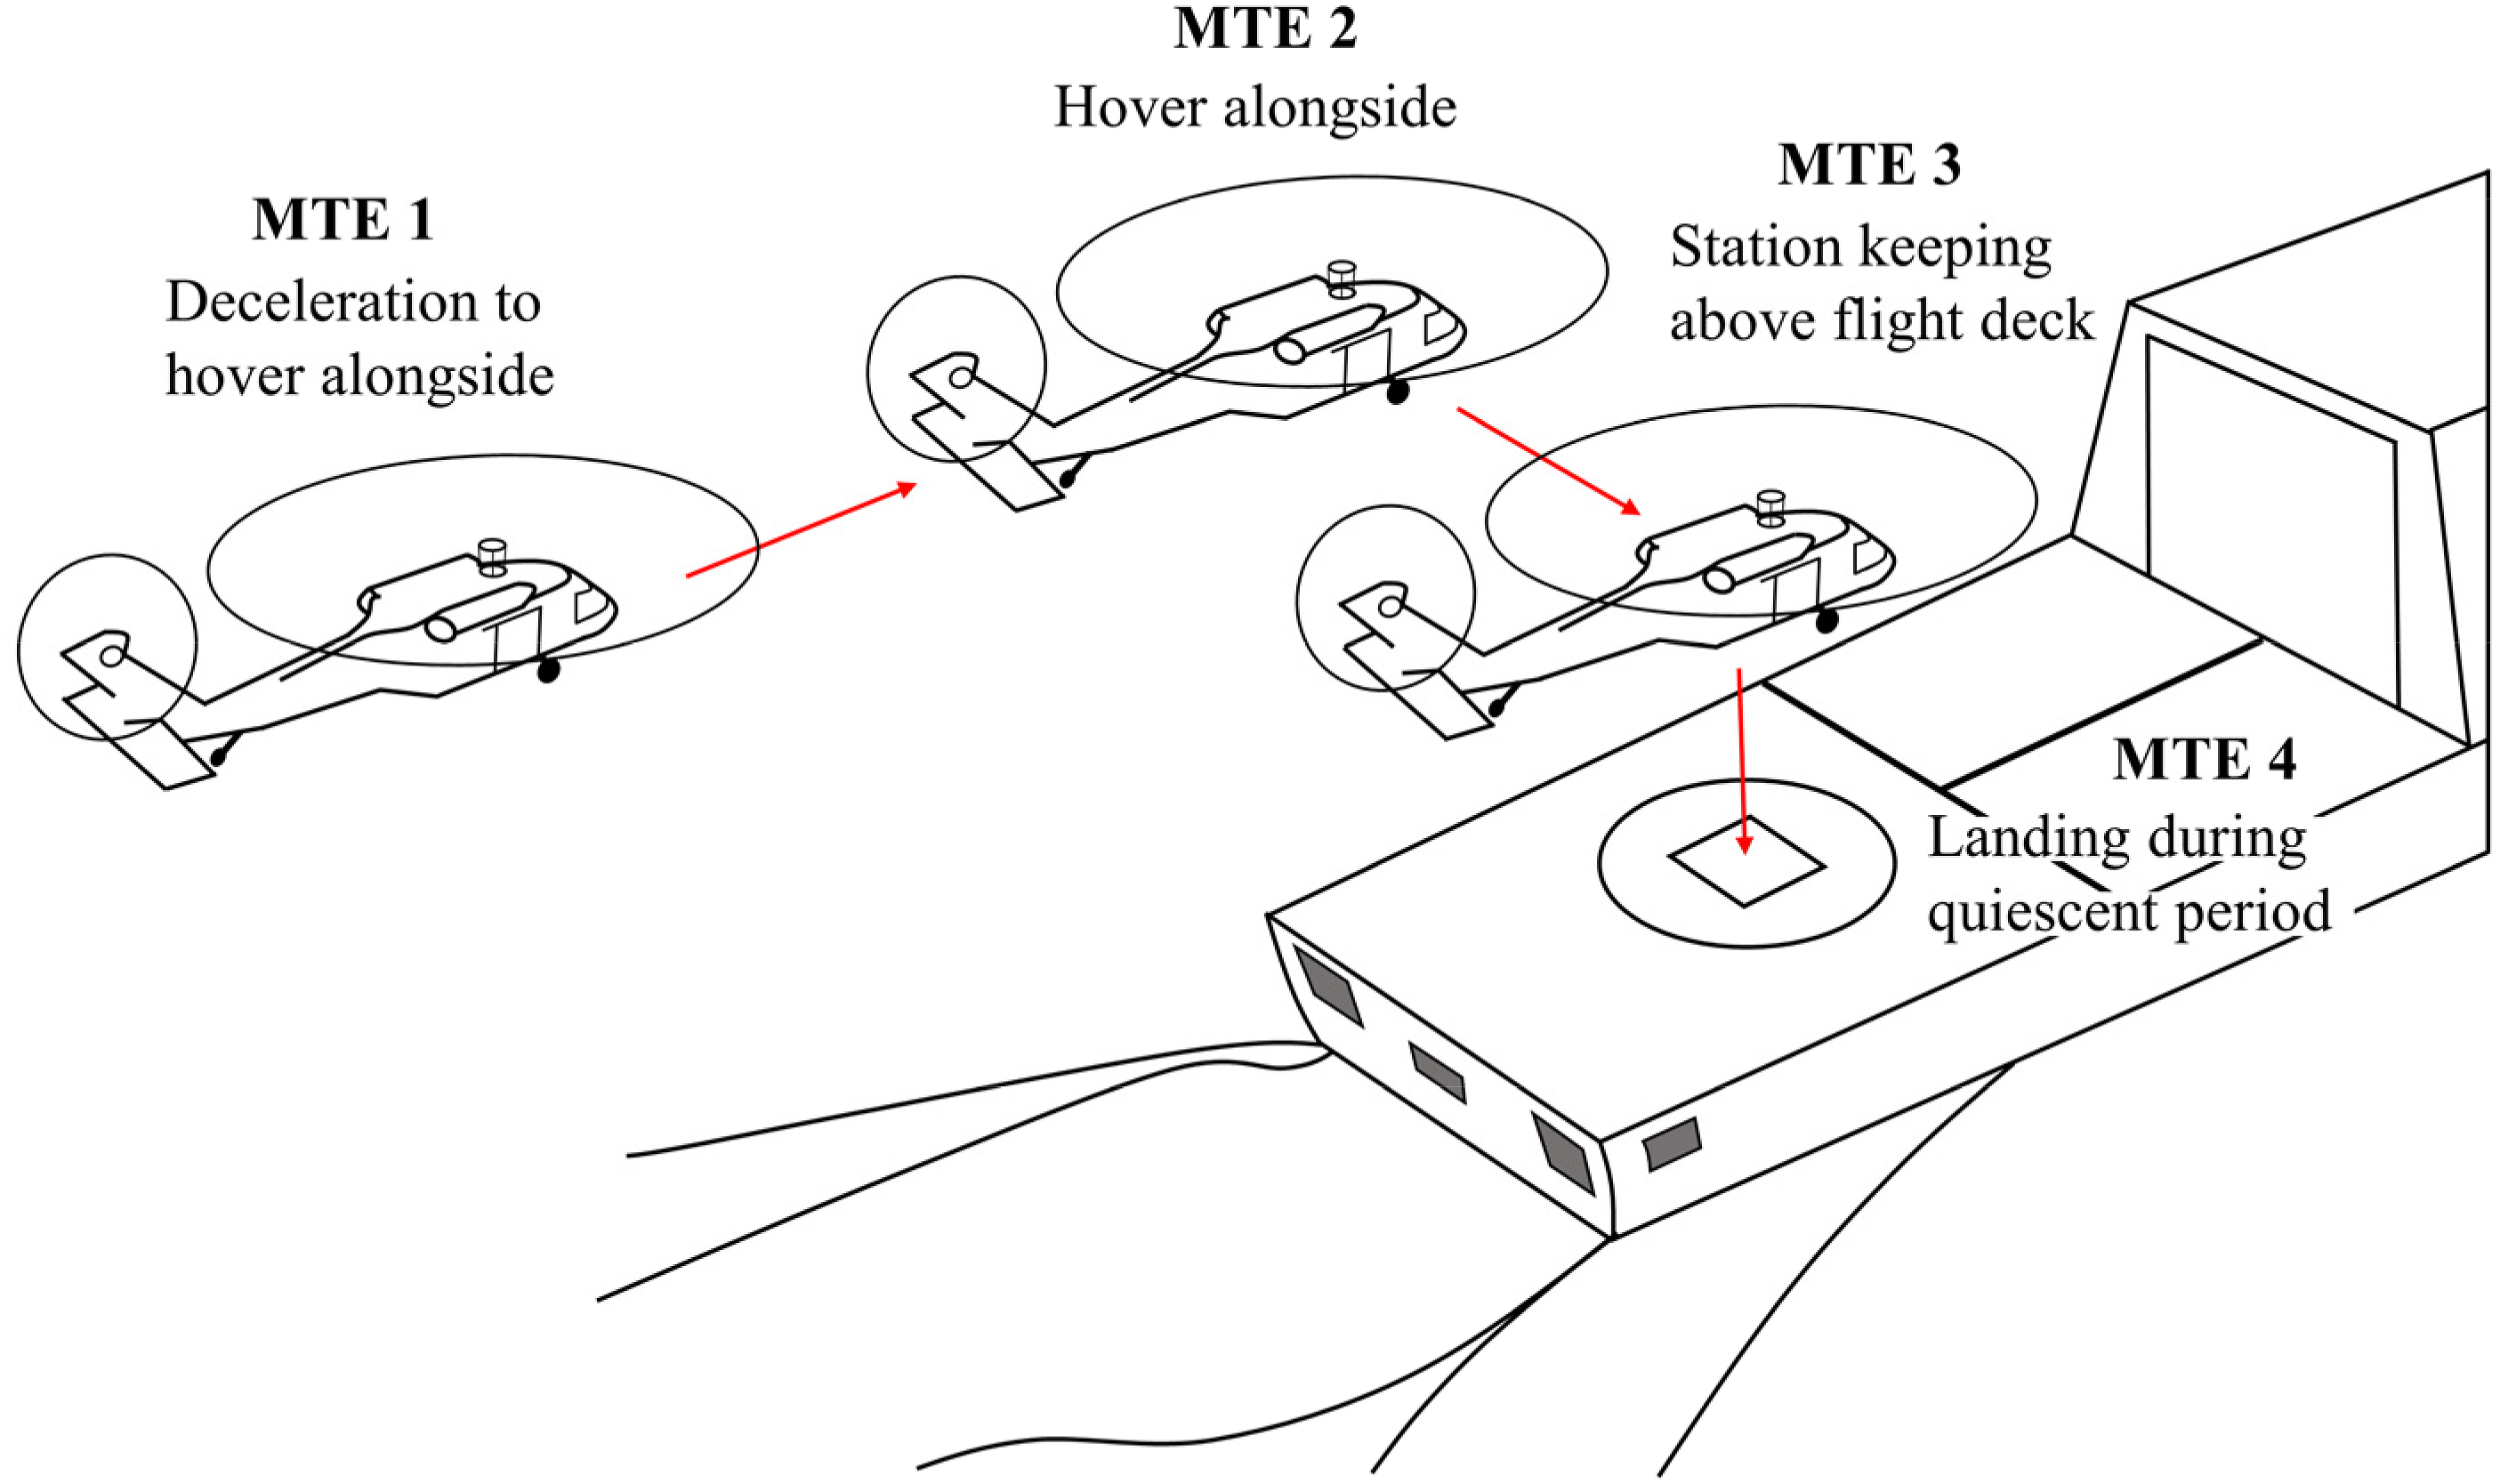
The flight trials were conducted by an ex-Royal Navy helicopter test pilot who was instructed to perform the UK Royal Navy standard approach as depicted in Figure 14. To provide further information about the different phases of the landing, and thereby provide a more detailed assessment of the effect of the hangar modifications, each landing was split into four Mission Task Elements (MTEs). The first MTE is the approach to a position alongside and parallel to the port-side edge of the flight deck. The second MTE requires the pilot to perform a lateral traverse across the deck to a hover position above the landing spot. The third MTE requires the pilot to maintain a hover position over the landing spot for 30 s and, finally, the fourth MTE is the vertical descent from the hover position to touchdown on the flight deck. The difficulty of the landing task was assessed by the test pilot using two scales: the Bedford workload rating scale for each MTE,
48
and the Deck Interface Pilot Effort Scale (DIPES) for the overall landing task.
49
The two scales are shown in Figures 15 and 16, respectively. Bedford workload rating scale.
48
DIPES rating scale.
49
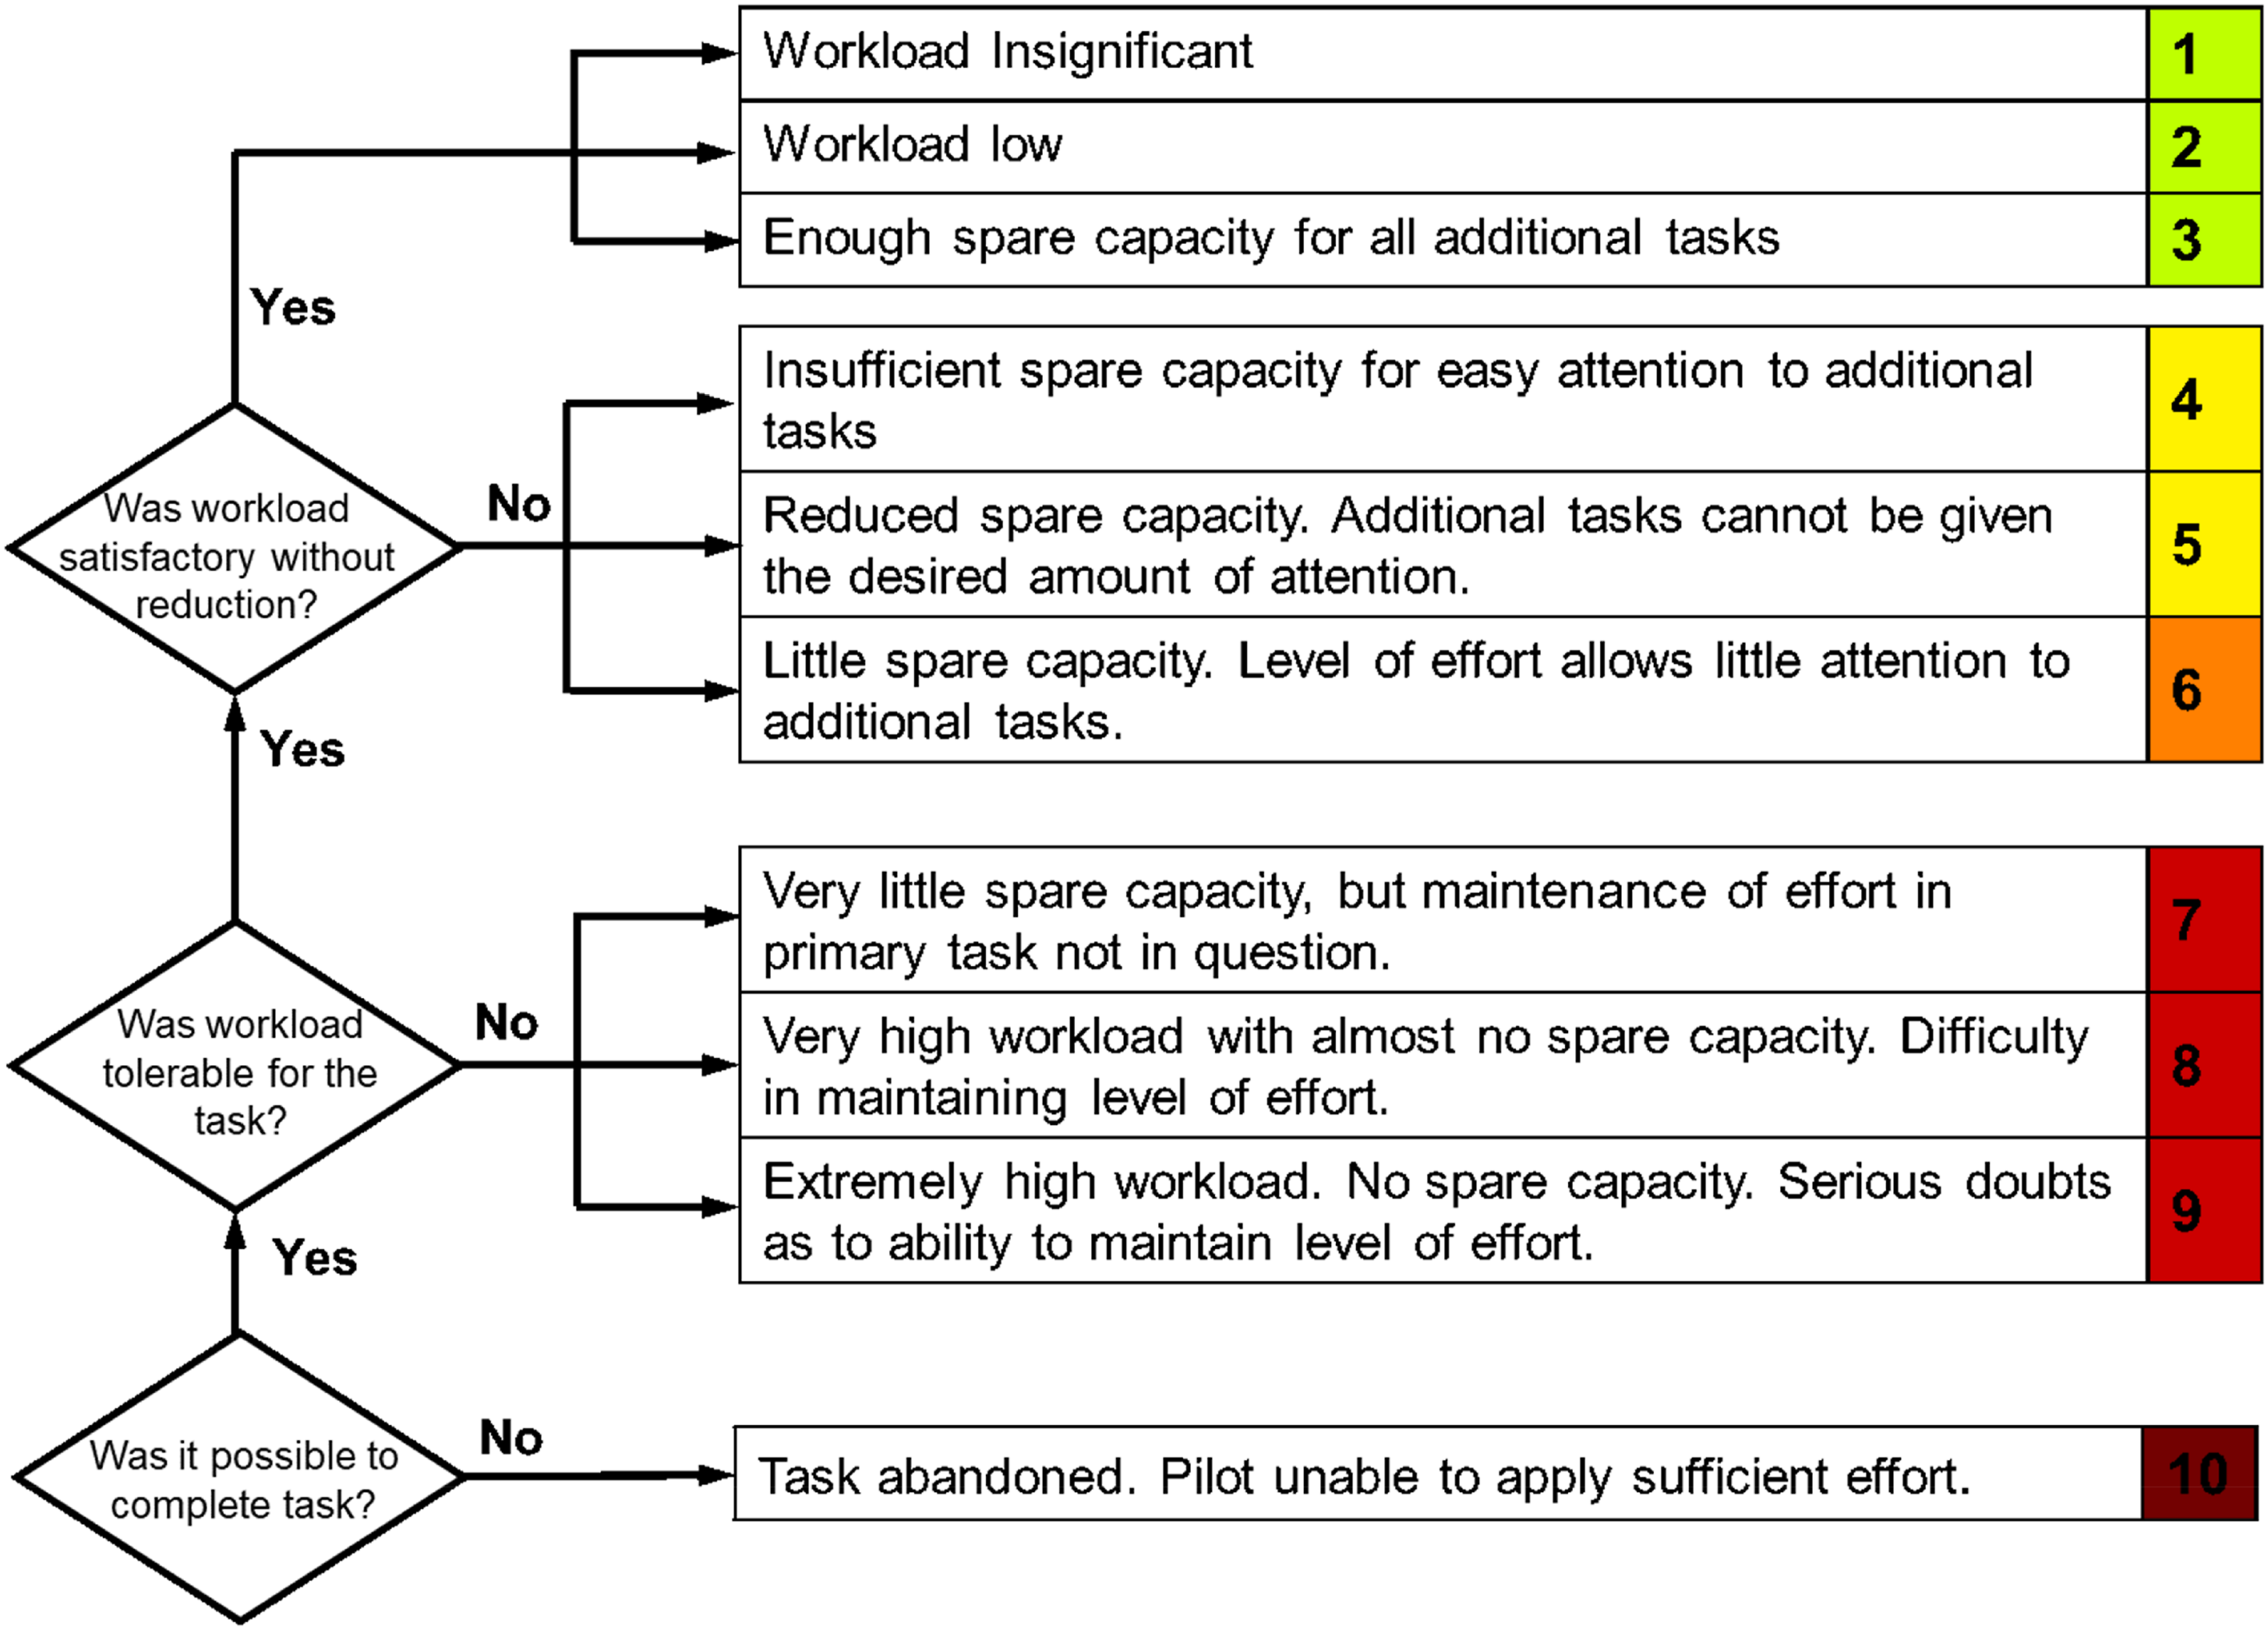
The Bedford workload rating scale is used to determine the pilot’s perceived workload and is based on the level of spare capacity which the pilot has to perform additional tasks. Workload can be defined as the integrated physical and mental effort generated by the perceived demands of a specified piloting task. 48 Figure 15 shows the 10 Bedford workload ratings that can be awarded by the pilot after their assessment of available spare capacity during the set task. If the workload was satisfactory during the task a rating of 1–3 will be given. A rating of 4–6 is awarded where the workload for the task was unsatisfactory and reduced the pilot’s capacity to perform additional tasks. Ratings of 7–9 indicate that while the task could be performed successfully, the workload was regarded as intolerable. A rating of 10 is reserved for situations in which the pilot is unable to complete the task due to high pilot workload and must abandon the task.
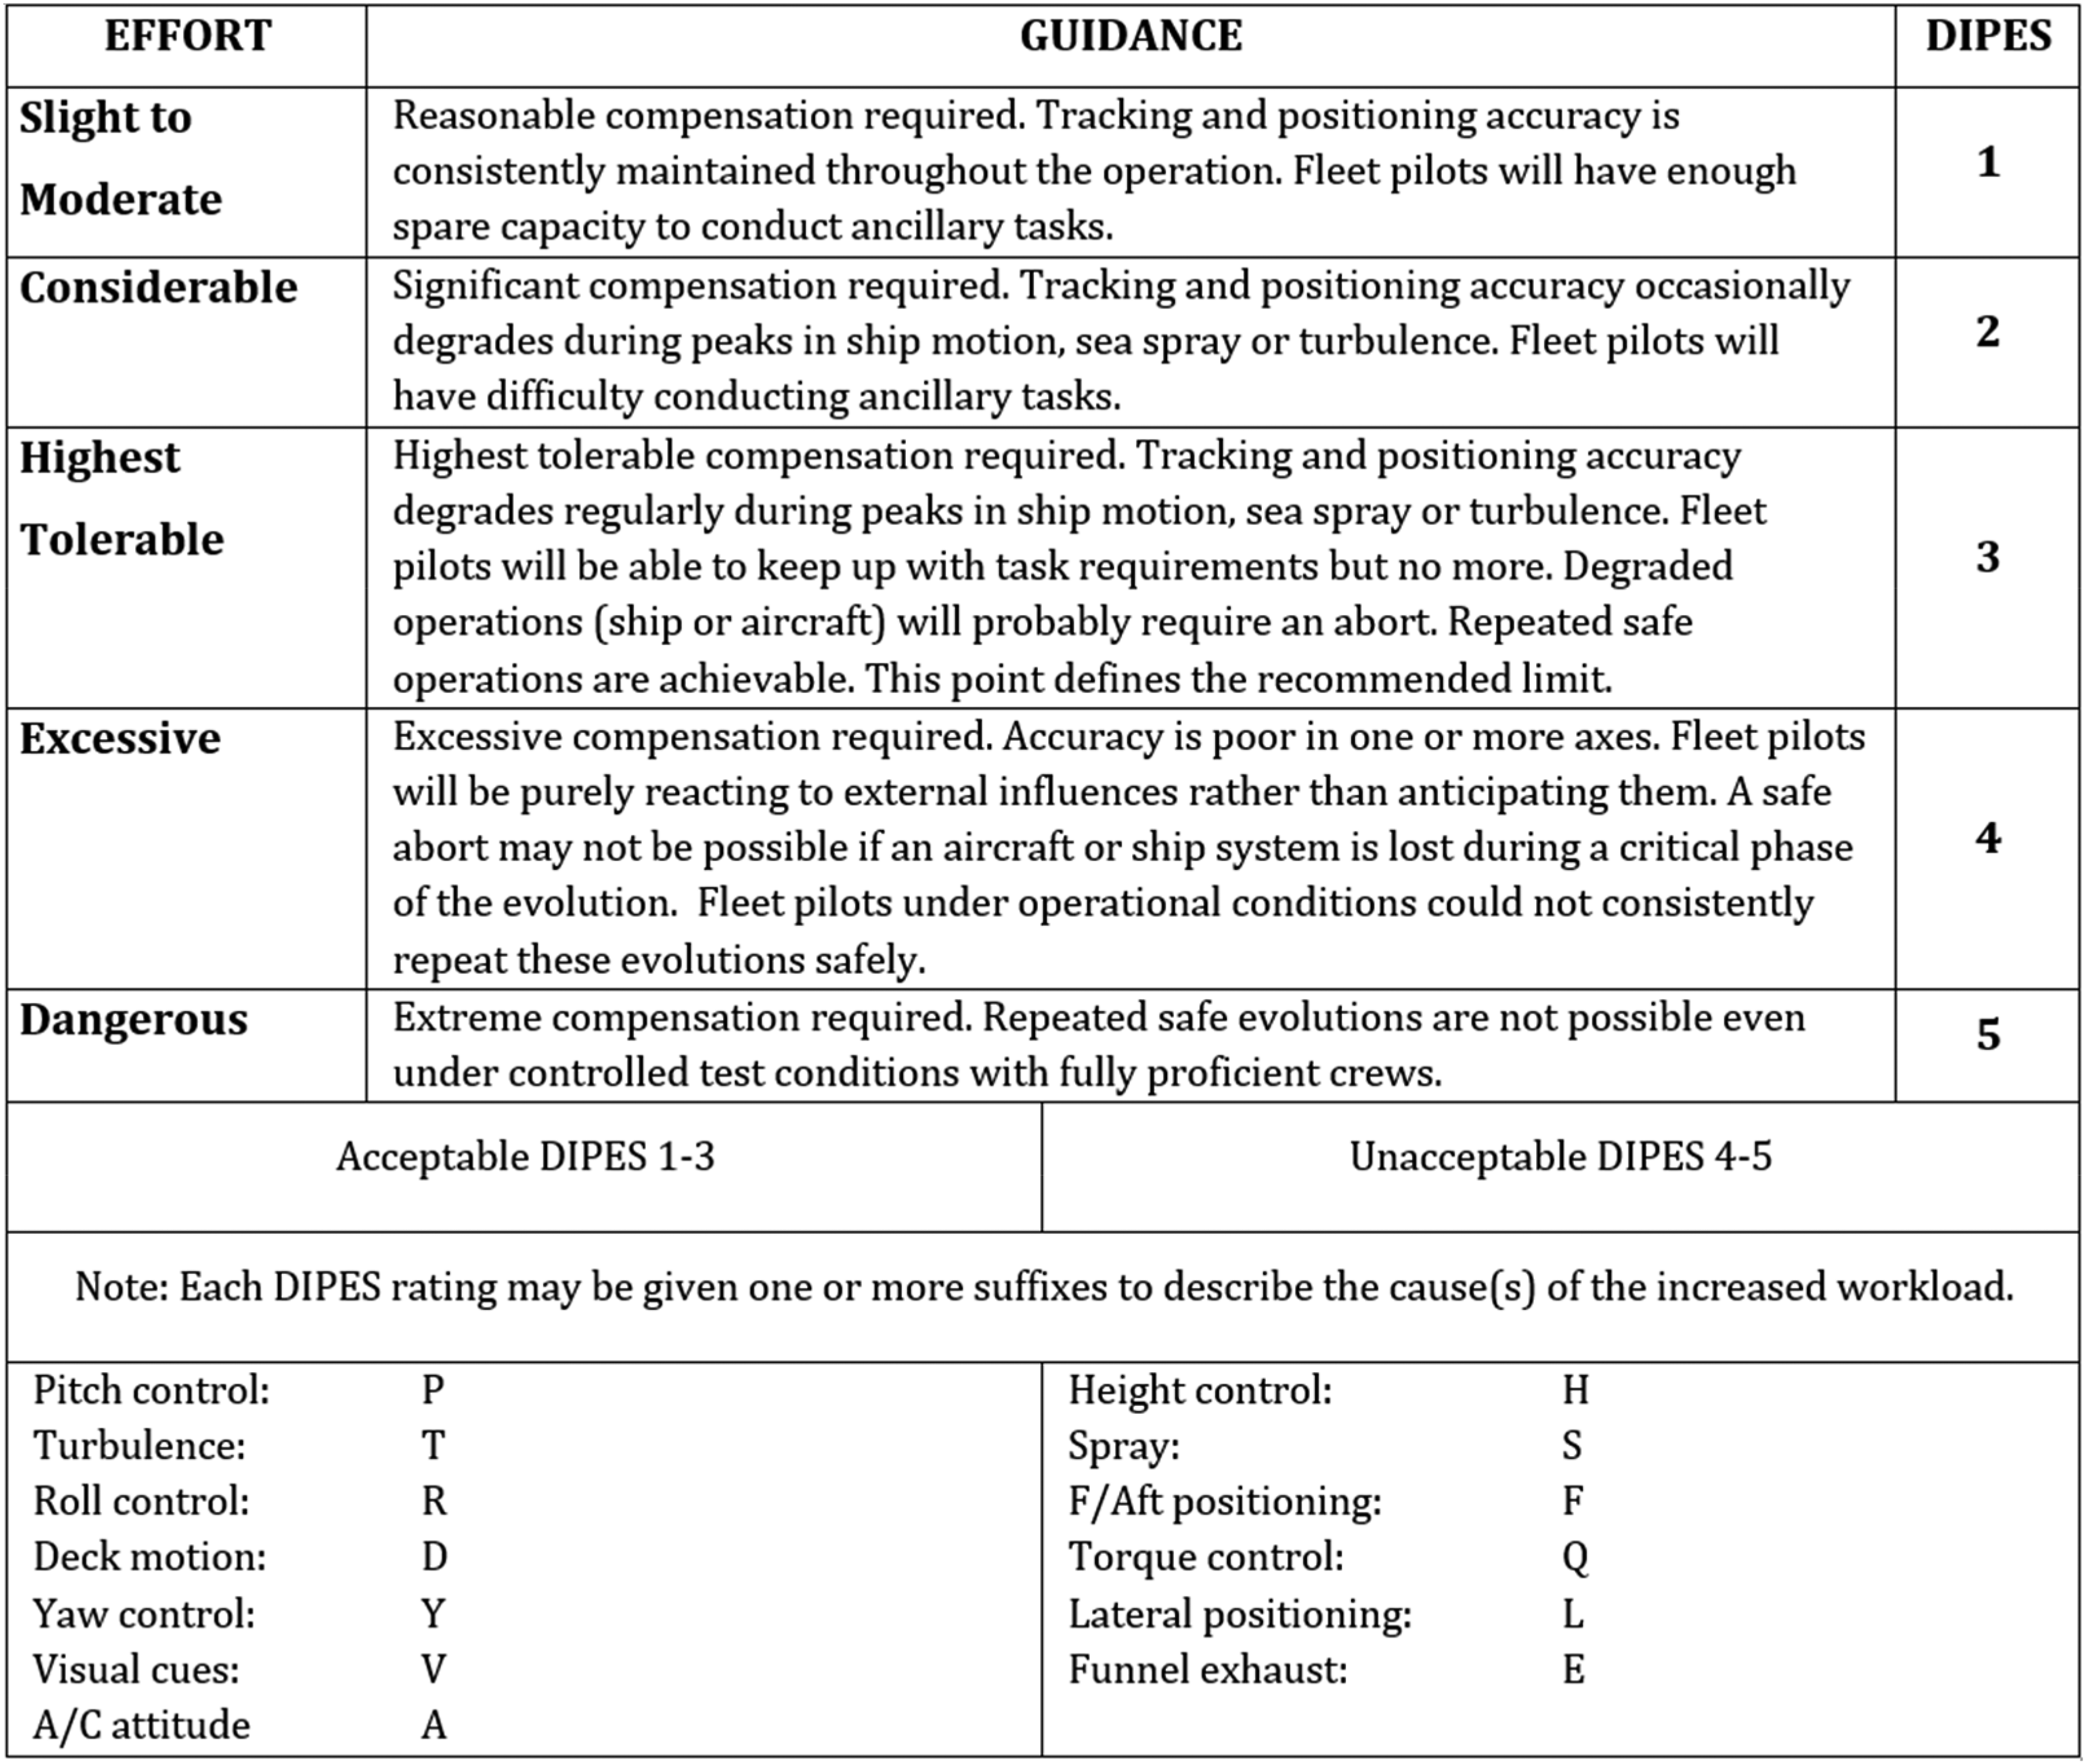
The DIPES rating scale, Figure 16, is widely used by NATO member countries to determine operational limits for ship-aircraft combinations, and it assesses the difficulty of the overall landing task.49,50 The DIPES not only accounts for pilot workload, in a similar manner as the Bedford scale, but also considers the aircraft physical control margins and identifies influencing factors in the rating for example deck motion and turbulence. DIPES is therefore suitable for qualification testing where, although pilot workload may be low, control limits can be encountered. On completion of a launch or recovery task a DIPES rating of 1–5 is awarded to assess the safety of completing the task. As shown in Figure 16, a rating of 1–3 ranks the spare capacity from slight to the highest tolerable while still being considered within acceptable bounds and the capabilities of an average fleet pilot. If the assessing pilot deems the task to be unacceptable on the basis that an average fleet pilot would not be able to complete the task in a consistently safe manner, a rating of 4 is awarded. A rating of 5 indicates that the task cannot be safely completed by fully proficient crews even under controlled test conditions. A list of suffixes is provided beneath the DIPES scale which the pilot uses to identify the causes of the increased workload.
During the simulated flight trials, the pilot was asked to provide Bedford workload ratings for each MTE and, after the recovery task was completed, a DIPES rating; pilot comments were also documented. Flight test data were recorded in FLIGHTLAB, providing the pilot cyclic, collective and pedals control inputs during each task, as well as aircraft position, attitude and accelerations in six degrees of freedom. The airwake velocity components at each of the 46 ACPs were also recorded.
Flight trial analysis
A selection of the results from the simulated flight trial are presented and discussed in the following sections. The results have been collated as tables of pilot workload and figures of control inputs and aircraft response, for the complete landing task and for the 30 s hover task, that is MTE 3. As will be seen, the perceived benefit of the angled hangar on pilot workload was mainly for the 50 kt wind speed; therefore, the data that will be presented for control inputs and aircraft response are only for the 50 kt wind speed.
Pilot ratings for helicopter recovery
Headwind
Bedford workload and DIPES ratings in a H00 WOD.
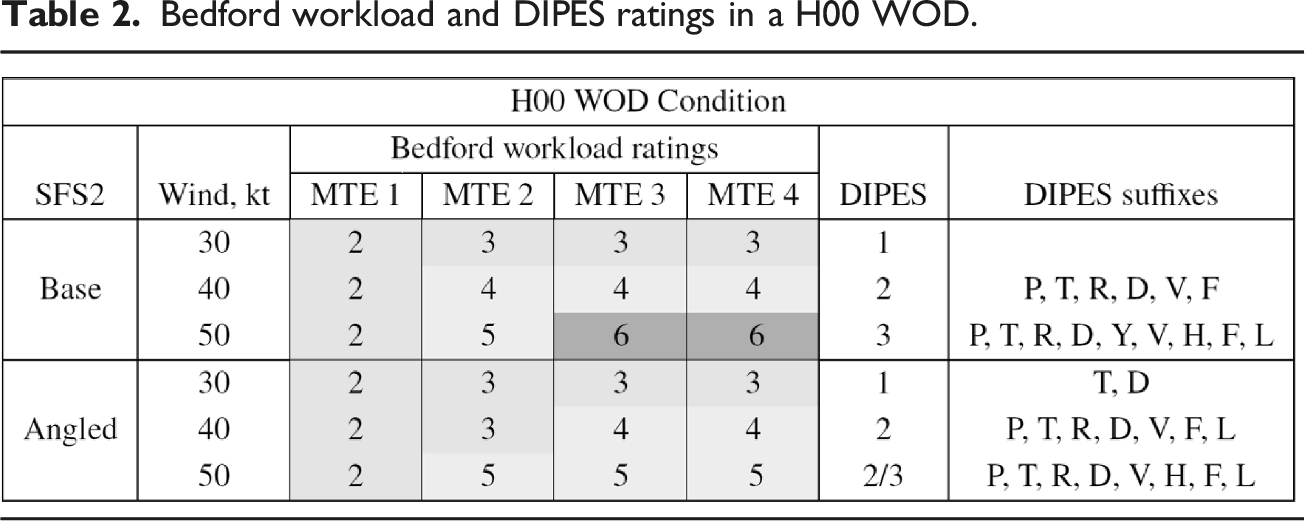
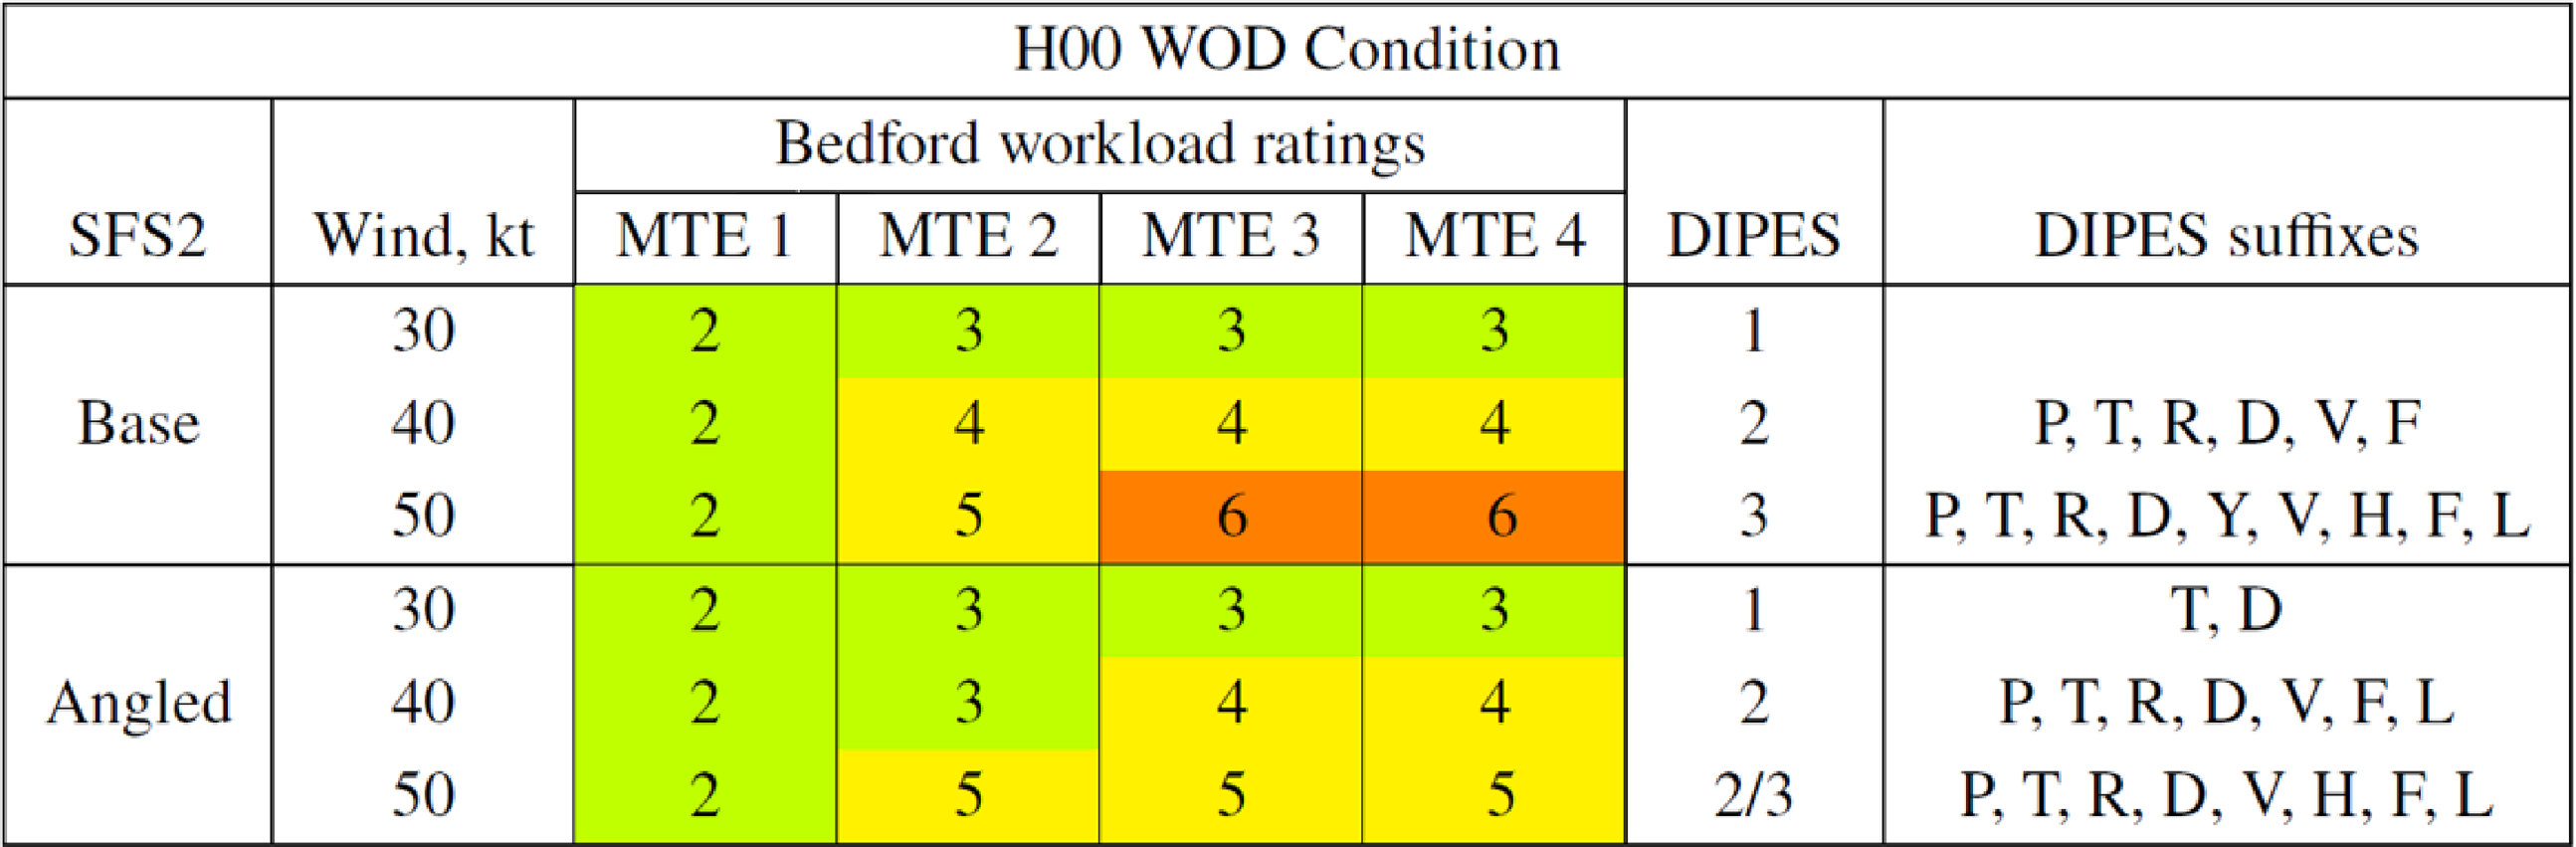
In the 40 kt headwind, it can be seen from Table 2 that MTEs 2 to 4 created more workload for the pilot due to the higher wind speed, with a Bedford workload rating of 4 denoting insufficient spare capacity available for easy attention to additional tasks. The pilot commented that during the initial translation task over the standard SFS2 the workload rating was 3 but increased to 4 near the end of the translation. During recovery to the angled SFS2, however, a workload rating of 3 was given for the complete translation manoeuvre. It was seen earlier in Figure 10(a) and (b) that the turbulence is reduced over the flight deck of the angled SFS2. Comparing the Bedford workload ratings for the two ships in the 40 kt headwind, there is a suggestion that the airwake of the standard SFS2 caused greater pilot workload during MTE 2, but overall, there is little difference, which is consistent with a DIPES rating of 2 being awarded for both ships. DIPES 2 indicates that significant compensation was required in the recovery manoeuvre, and it is noticeable that, unlike in the 30 kt wind, the pilot was being sufficiently challenged that a number of suffixes were identified. The increase in workload was therefore due to a combination of several factors: turbulence (T), pitch control (P), roll control (R), deck motion (D), visual cues (V), forward/aft positioning (F) and lateral positioning (L). However, while the landing task was more difficult in the stronger wind, the hangar modifications appeared to offer little improvement.
Considering the ratings in Table 2 for the 50 kt headwind, it is first noticeable that the workload is now approaching the limit that is considered tolerable, and that the modified hangar is showing some improvement in the severity of its airwake. Recovering the aircraft to the flight deck of the two ship geometries in the 50 kt wind resulted in the same pilot workload ratings being awarded for MTEs 1 and 2. However, the unmodified SFS2 led the pilot to award Bedford workload ratings of 6 for MTEs 3 and 4, and an overall DIPES of 3, compared with Bedford ratings of 5 and a DIPES between 2 and 3 for the modified SFS2 (for the DIPES rating of between 2 and 3 the pilot reported that the required compensation only encroached into the highest tolerable for a brief period during the recovery). A DIPES rating of 3 indicates that, with respect to the average fleet pilot, the compensation required to complete the landing task was the highest tolerable and was at the recommended limit. A number of additional suffixes, compared with the 40 kt wind, were provided by the pilot and included yaw control (Y), height control (H) and lateral positioning (L). Overall, therefore, the simulated flight trial has provided evidence that in the 50 kt headwind the modified hangar has led to a noticeable reduction in the pilot workload and the difficulty of the landing task.
Green 30
Bedford workload and DIPES ratings in a Green 30 WOD.

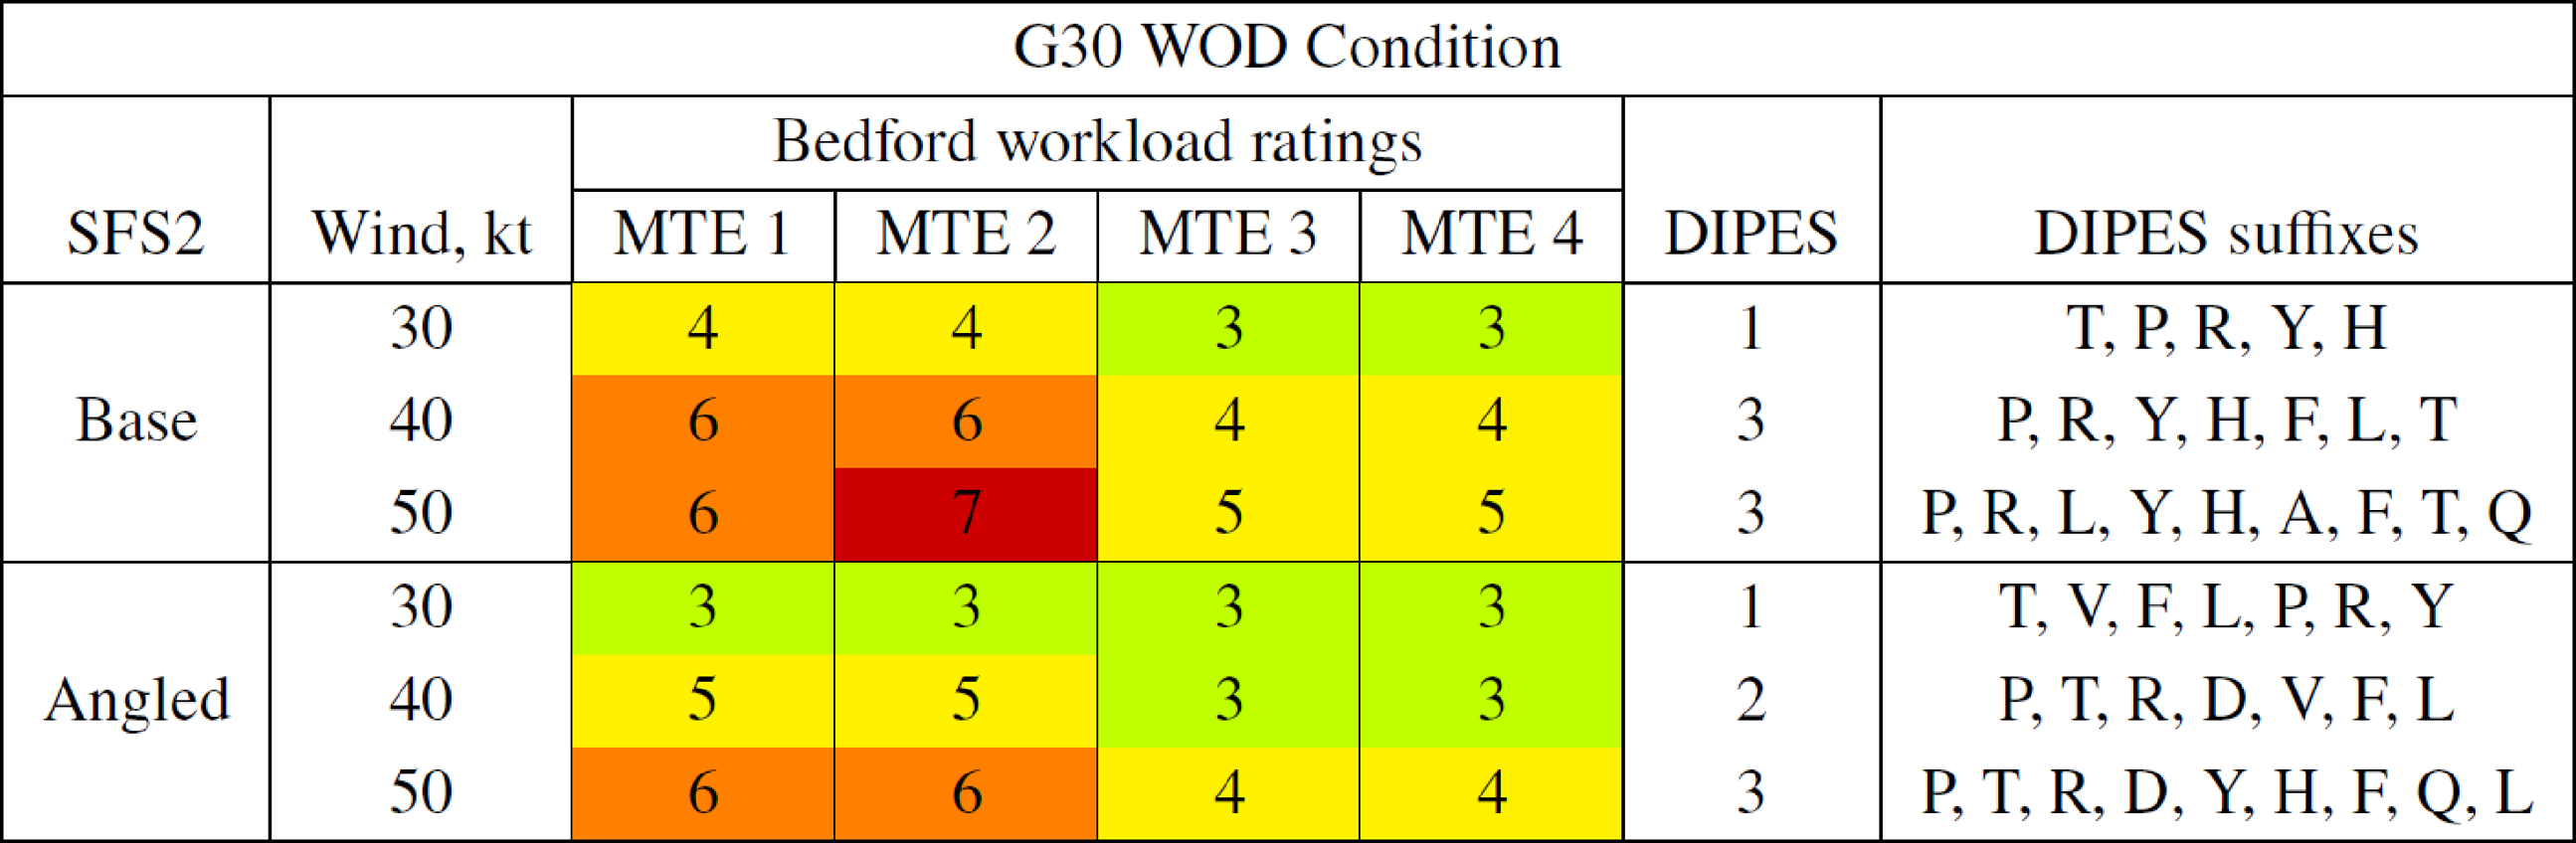
In the 30 kt Green 30 WOD, the workload ratings for MTEs 1 and 2 decreased from 4 for the standard SFS2 to 3 for the angled SFS2. The workload ratings of 3 given for the hover and touchdown task, MTEs 3 and 4, were the same for both the standard and angled SFS2. A DIPES rating of 1 was attributed to the recovery to both ships in the 30 kt Green 30 wind, although the pilot commented that for the standard SFS2 the workload was at the ‘very limit’ of moderate effort.
A DIPES rating of 2 was awarded for the overall recovery to the angled hangar SFS2 in the 40 kt Green 30 WOD, while a DIPES rating of 3 was awarded for the standard SFS2, indicating that the highest tolerable compensation was required, with the additional attribution of yaw control to the increased effort. Again, the higher workload was during MTEs 1 and 2.
As the Green 30 wind speed was increased to 50 kt a similar trend of increasing workload for each MTE was observed for the two ship geometries. The translation across the flight deck of the standard SFS2 incurred the largest workload rating of the trial, 7, which, as defined, shows the workload was intolerable for the task. The pilot commented that there ‘was a risk of bumping into the superstructure during translation of the aircraft across the flight deck’ and that the DIPES rating was at the very limit of tolerable. The majority of the MTE workload ratings provided in the 50 kt Green 30 WOD during the recovery task to the angled SFS2 were lower than the standard SFS2, MTE 1 being the exception. The DIPES rating given was the same for the two ships; however, the pilot commented that it was ‘relatively comfortable to hold the aircraft in a desired hover position’ over the flight deck of the angled SFS2. Figure 10(c) and (d) show that the turbulence intensity is similar off the port side of each ship in a Green 30 wind; however, there is an increase in turbulence over the flight deck of the standard SFS2 which is consistent with the pilot’s ratings and comments.
It can also be seen in Table 3 that the pilot identified a wide range of causes for the DIPES ratings and the rating generally increased with wind speed. It appears, therefore, that the causes of the workload are in many axes and this reflects the nature of the unsteady three-dimensional airwake. Bearing in mind that a Bedford rating of 6 and a DIPES rating of 3 are the maximum of what is considered tolerable in terms of workload and compensation, it is apparent that the modified hangar geometry is proving beneficial in the 50 kt winds.
As well as the pilot workload ratings, further evidence of the potential benefits of the angled hangar modification was sought by considering the trajectory of the helicopter and a selection of control inputs from the pilot when recovering the helicopter to the two different ships. As explained above, this comparison will be presented for the 50 kt cases where the greatest benefit was achieved.
Aircraft position during helicopter recovery task
Figure 17 shows the helicopter’s lateral and vertical position during the recovery task in the 50 kt winds, beginning at the held hover position off the port side of the ship through to touchdown on the flight deck. The position is recorded at the aircraft’s centre of gravity. In the Ahead WOD condition, shown in Figure 17(a), the pilot was able to maintain a relatively smooth translation across to the landing spot for both ships. It can also be seen that the pilot was able to hold the aircraft in the hover without too much aerial scatter. However, as shown in Table 2, in the 50 kt wind the pilot was working at the limit of what would be considered tolerable when landing to the standard SFS2. Referring to the CFD turbulence data in Figure 10(a) and (b), it can be seen that the standard SFS2 creates a more turbulent flow over the flight deck. Helicopter position in (a) Ahead and (b) Green 30 wind at 50 kt.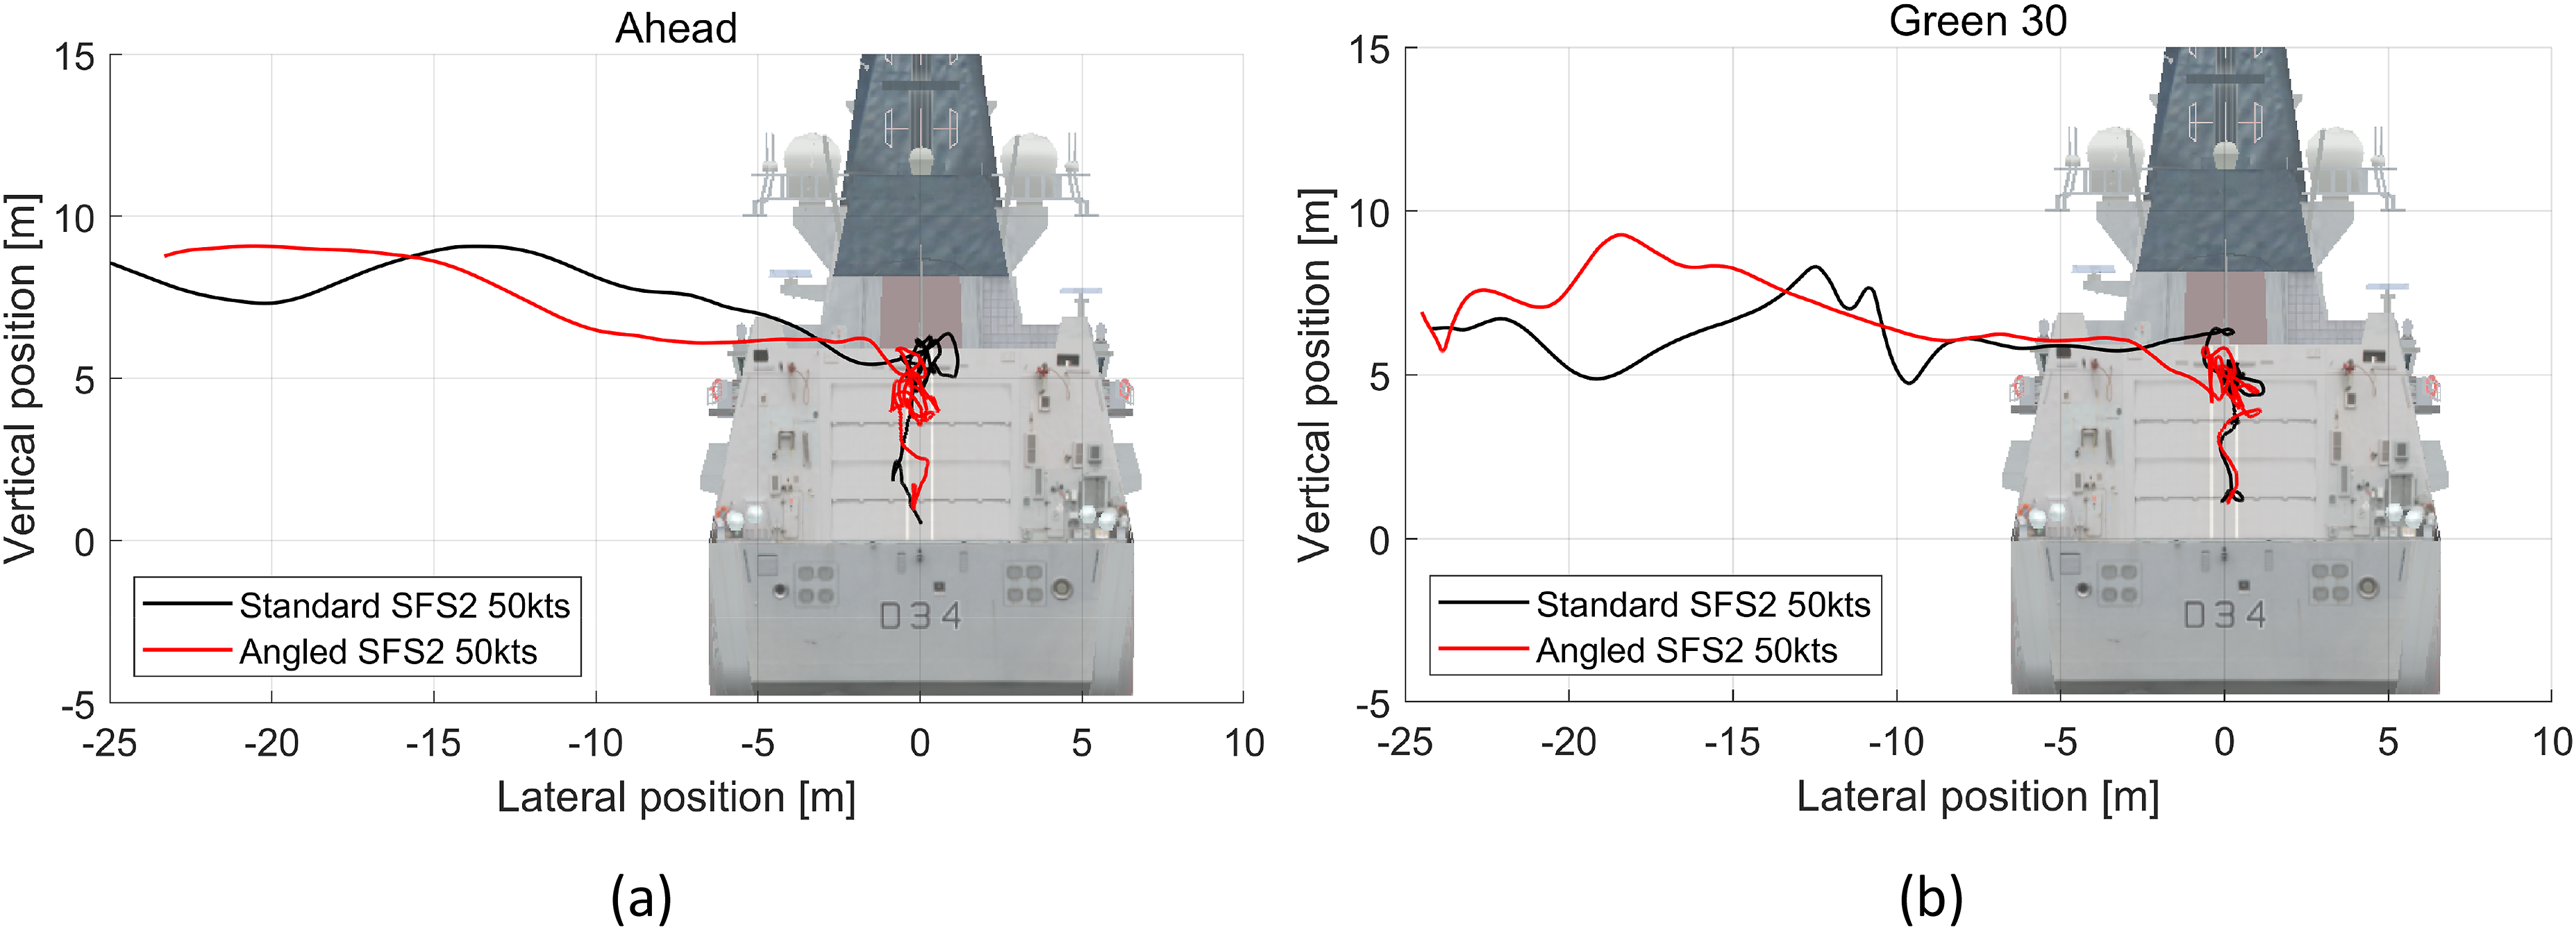
In the Green 30 WOD condition, it can be seen from Figure 17(b) that the translation to both ship geometries was more erratic with vertical excursions as the pilot manoeuvred the aircraft in the disturbed air off the port side of the ship, consistent with the workload ratings shown in Table 3. Over the landing spot, the pilot was able to hold a fairly tight hover position and execute the landing smoothly, again consistent with the ratings in Table 3. Referring to Figure 10(c) and (d), the turbulent air flow off the port side of the ship is evident, as is the higher levels for the standard SFS2, particularly the port side of the landing deck, which may explain the vertical displacements just off the port side deck-edge of the standard SFS2 in Figure 17(b).
Aircraft attitudes during helicopter recovery task
Figures 18 and 19 show the roll, pitch and yaw of the aircraft during the recovery task for the two ship geometries in the 50 kt Ahead and Green 30 WOD conditions. In the figures, the time histories are split by two vertical dashed lines that represent the start and end of the 30 s hover task (MTE 3). The traverse task, MTE 2, was initialized by the pilot following completion of the approach manoeuvre, approximately 15–20 s before the start of the hover task. Aircraft attitudes during recovery in a headwind wind at 50 kt. Aircraft attitudes during recovery in a Green 30 wind at 50 kt.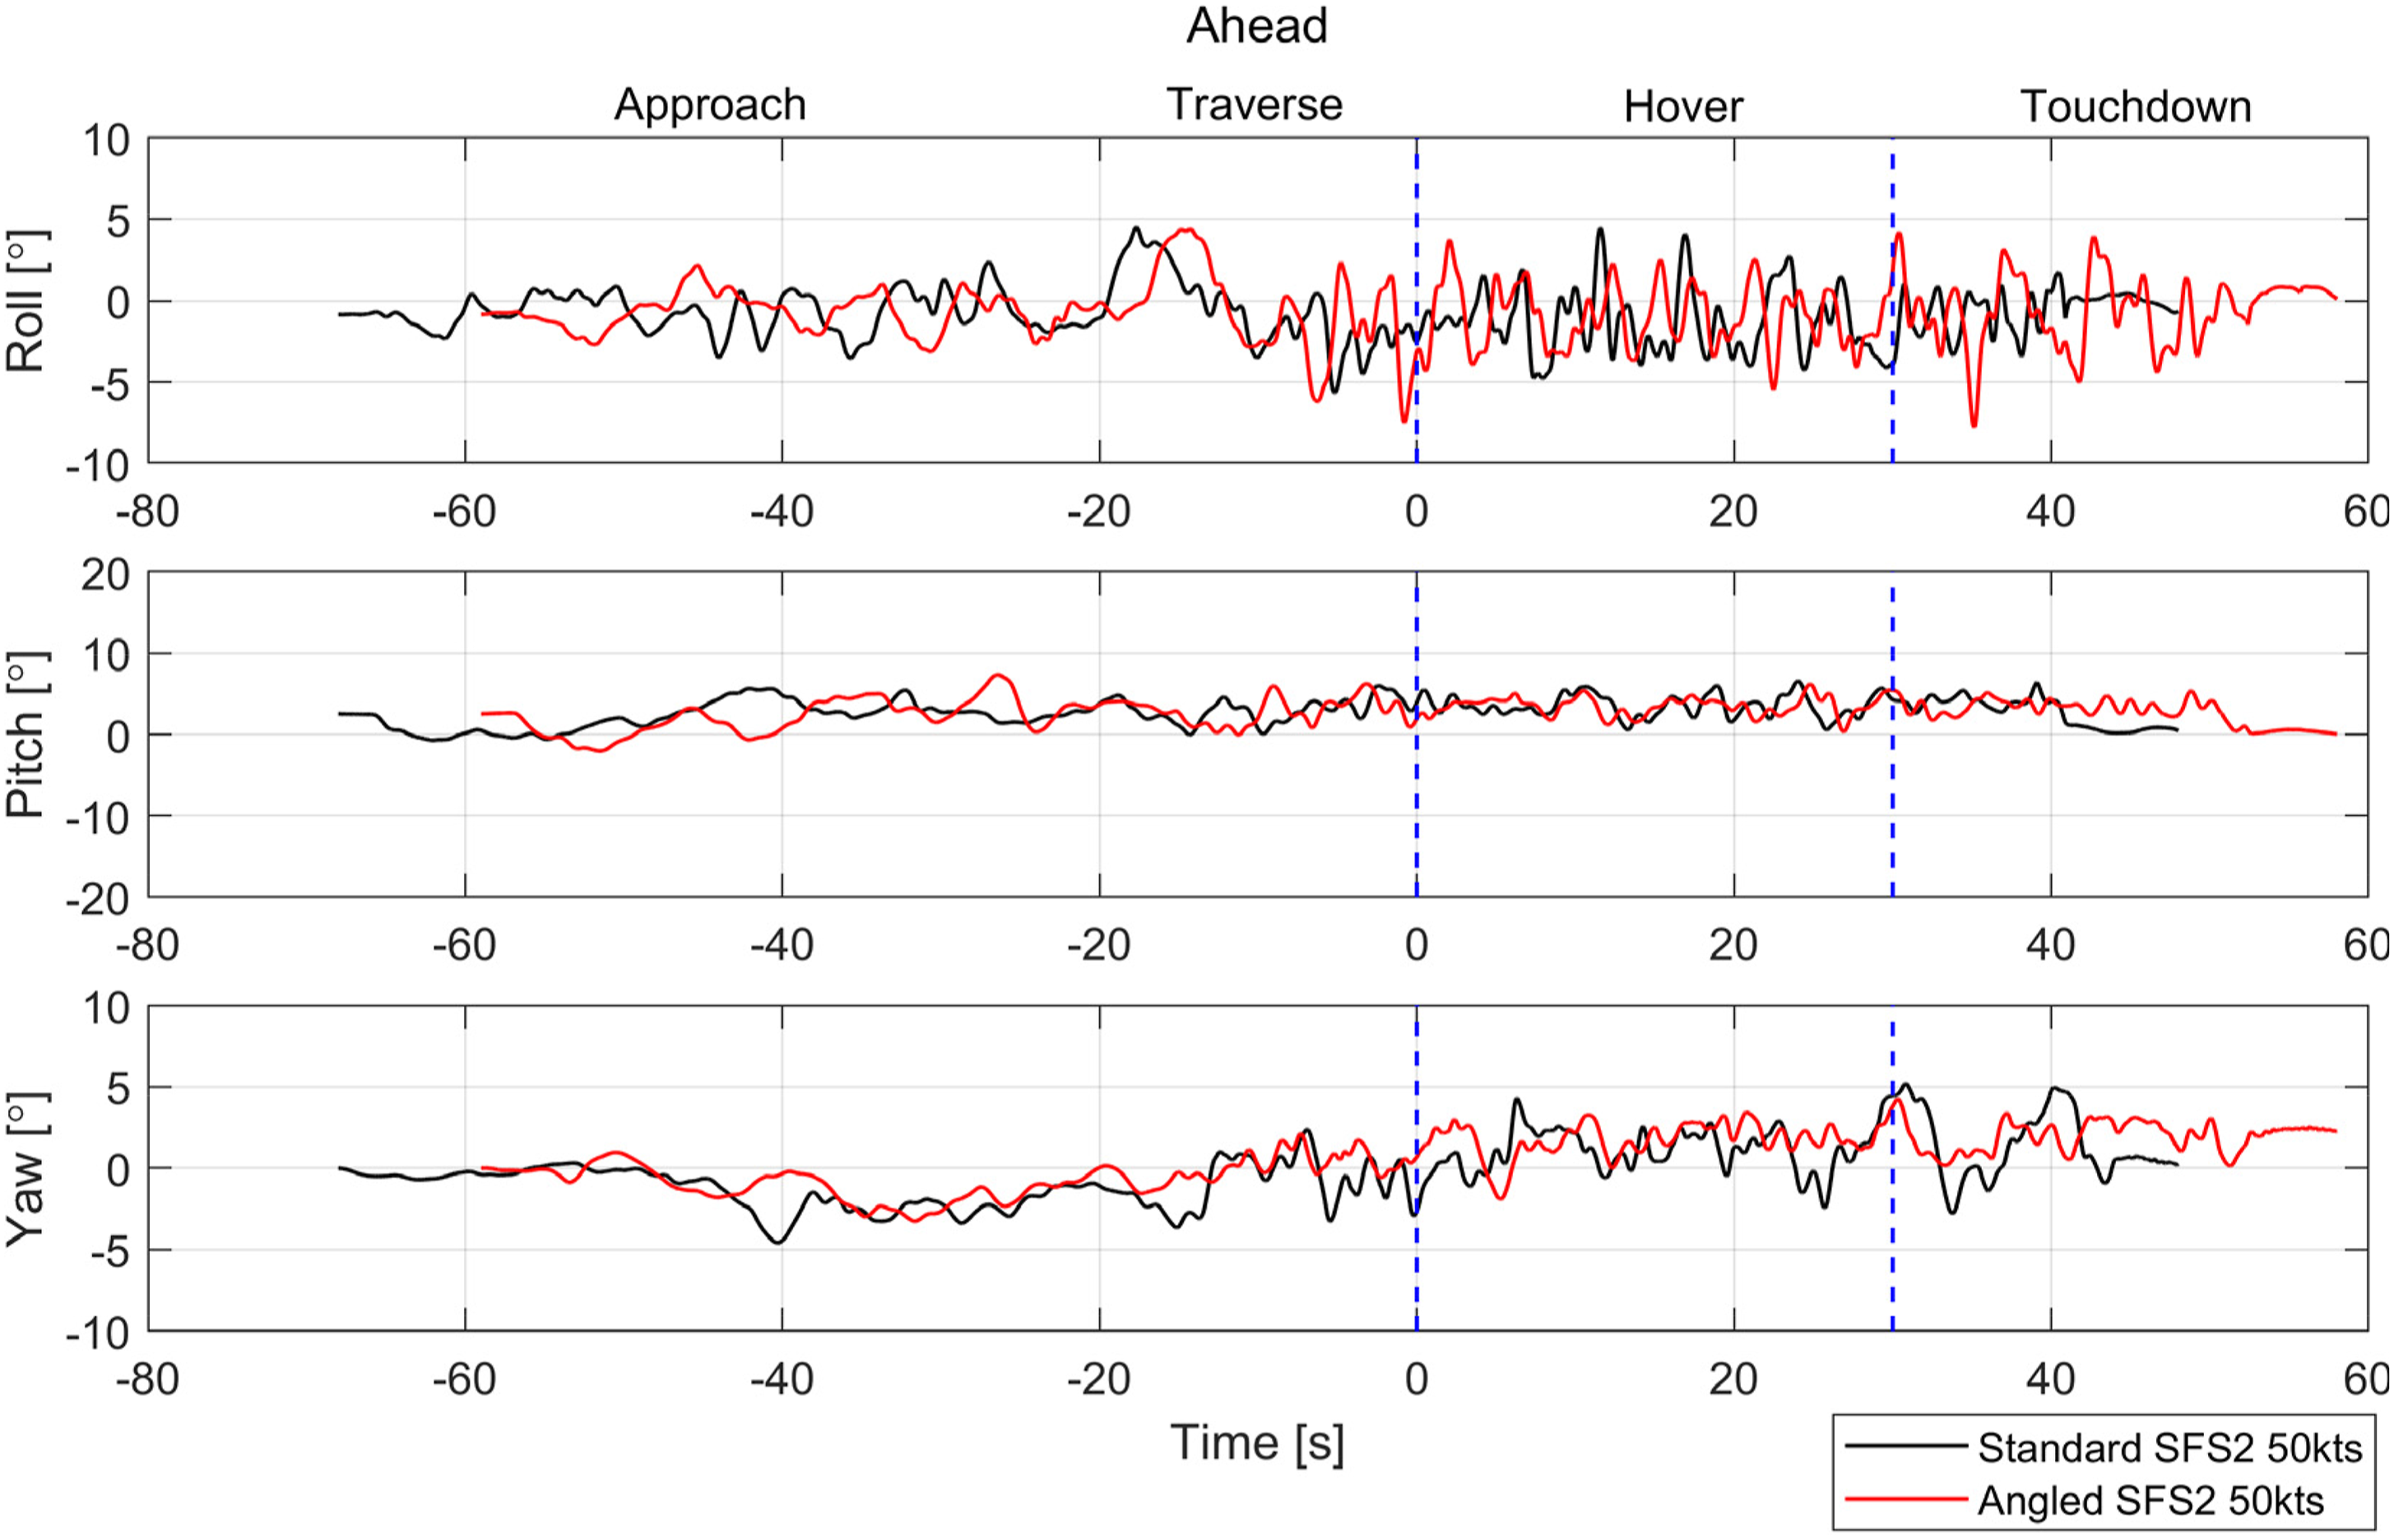
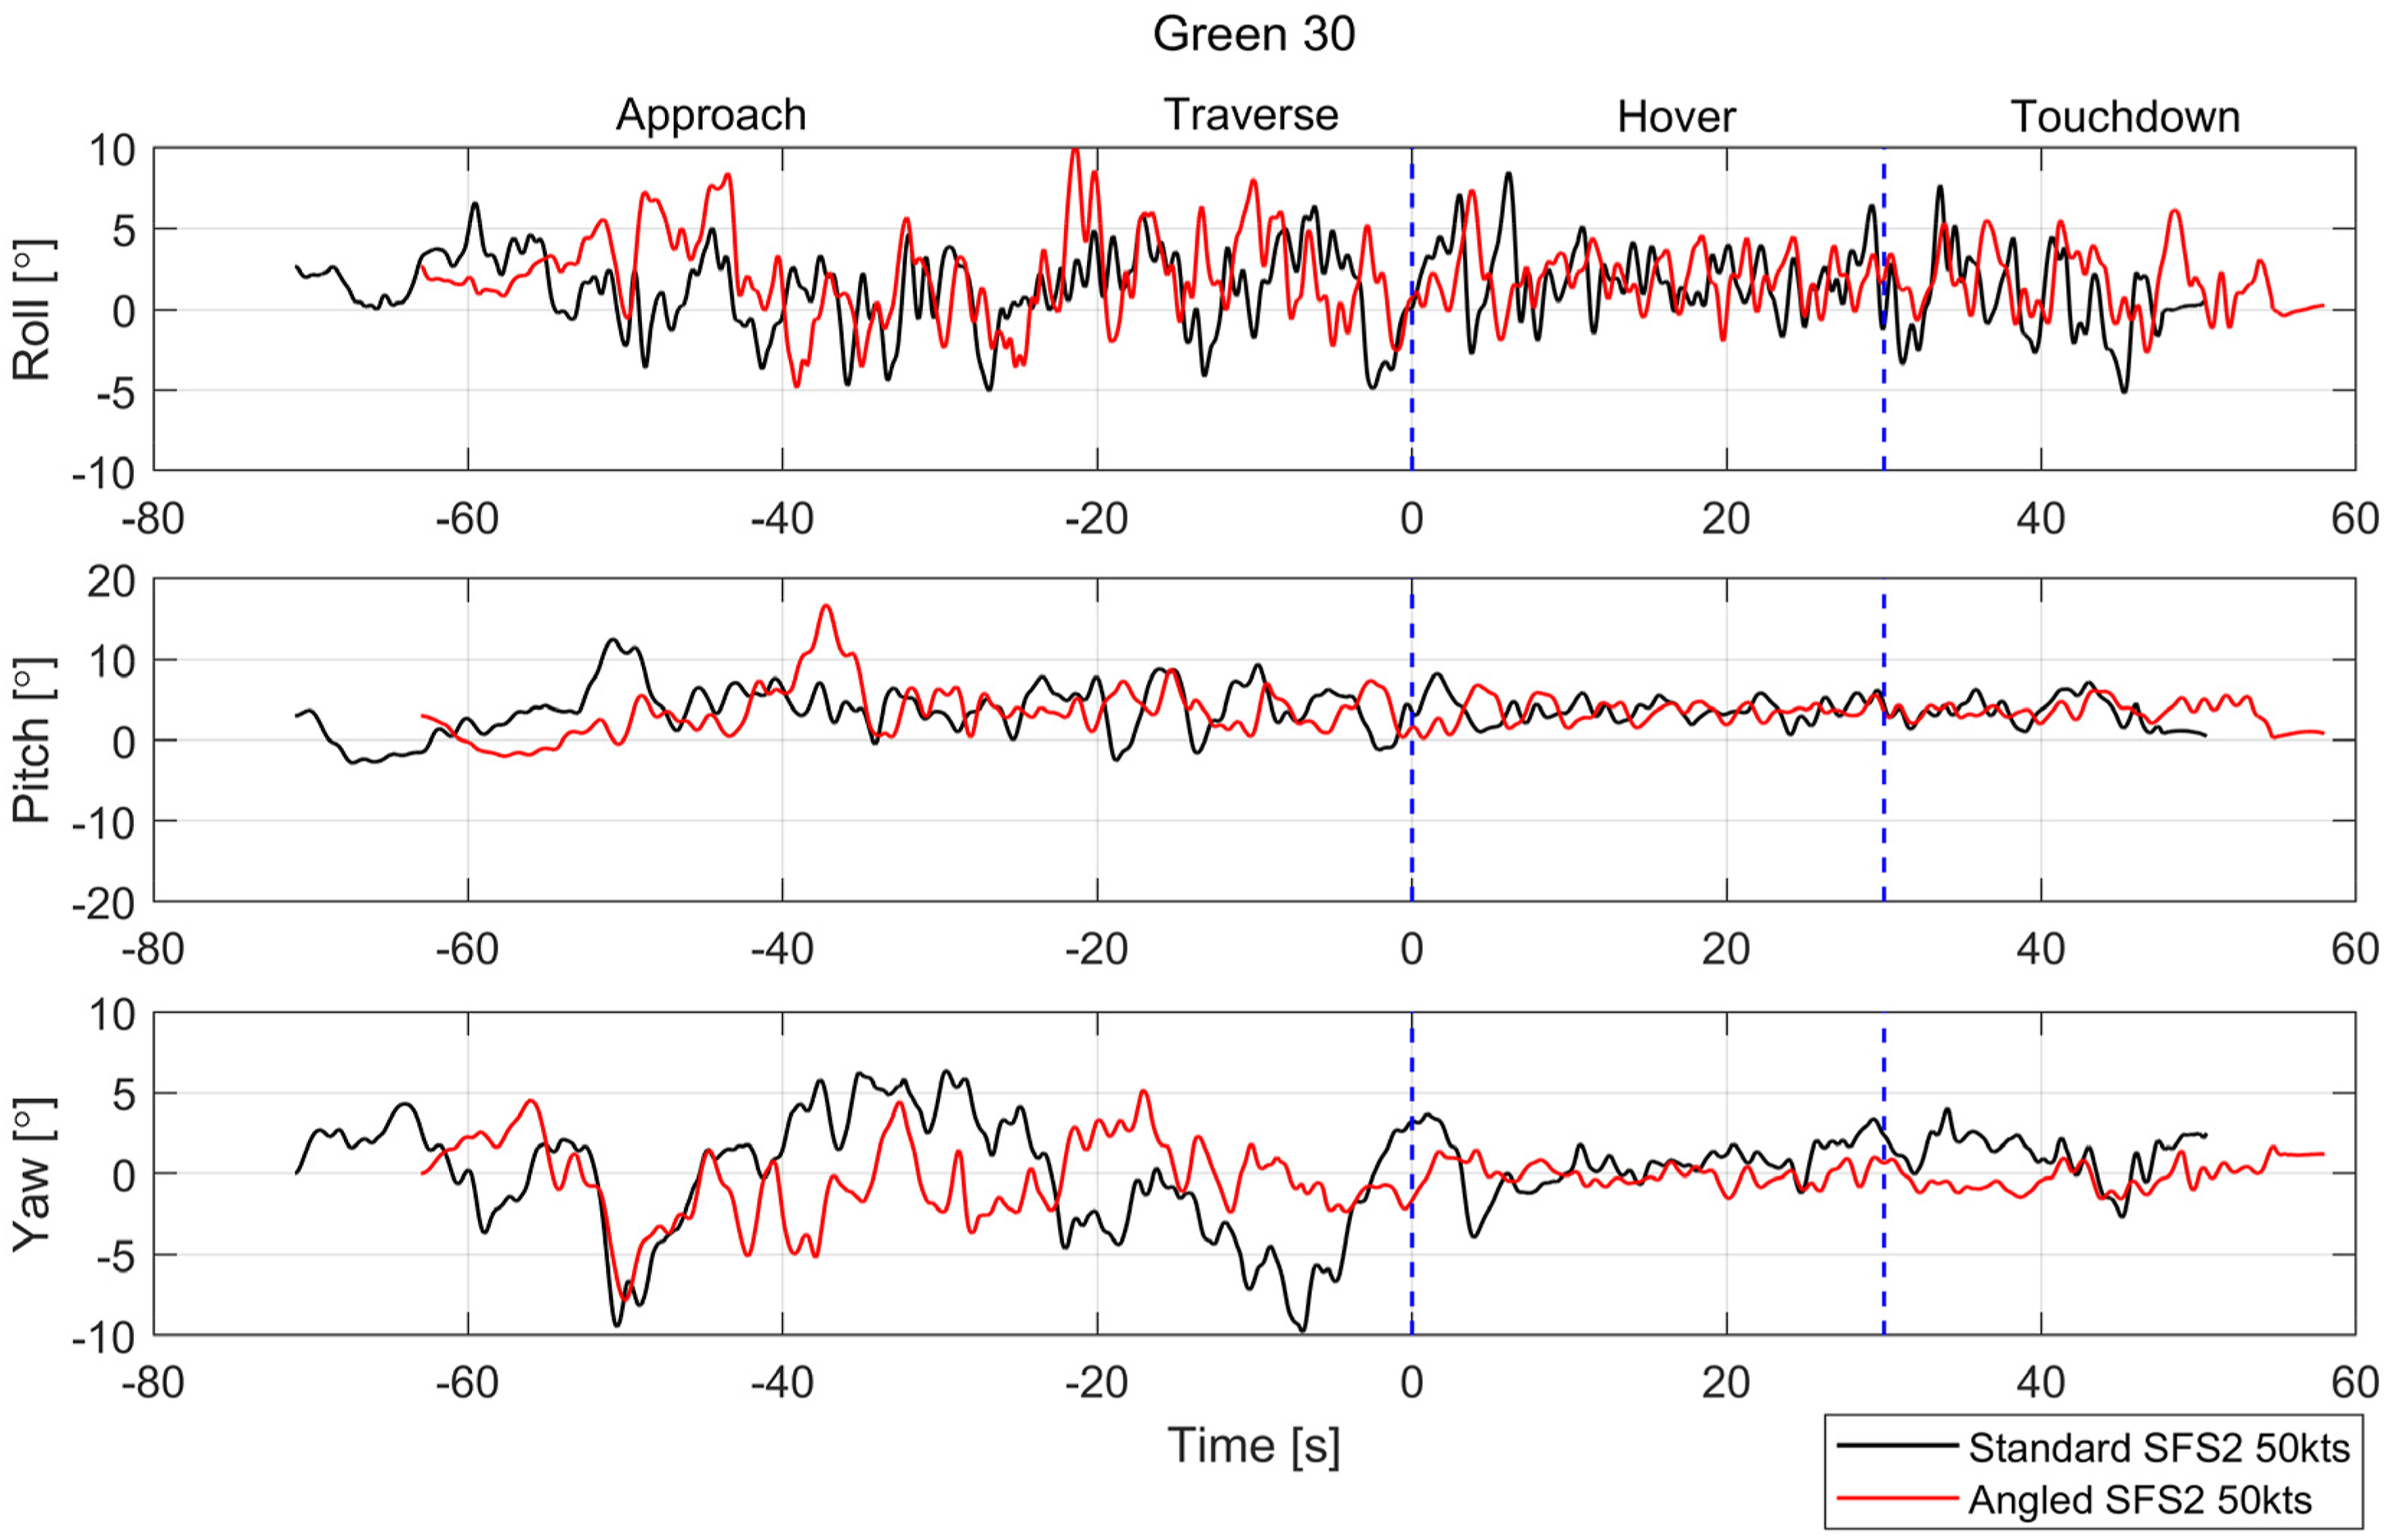
During aircraft recovery in the Ahead WOD condition, Figure 18 shows the higher angular changes, particularly in roll and yaw, are during the later stage of the translation and the hover and descent, that is when the aircraft was in the turbulent ship airwake over the deck. In contrast, in the Green 30 WOD, Figure 19 shows the aircraft had significant attitude changes when off the port side of the ship, due to the disturbed air in the oblique wind. Over the deck, the angular changes in pitch and yaw subside, but not in roll. Overall, the data is consistent with that in Figure 17 and Table 3 and while there are differences in the data for the two ship configurations, there is little to distinguish between them.
Cyclic inputs during hover task
Figure 20 shows the pilot’s control activity during the hover task, MTE 3, for which the pilot was asked to maintain position for 30 s in the 50 kt Ahead and Green 30 WOD conditions. The central graph shows the lateral/longitudinal cyclic displacement from the trim position, while the outer time-based graphs show how the lateral and longitudinal inputs changed with time; the full cyclic range is ±50% in each axis. To highlight the maximum displacements from the trim position, a broken line box has been used to bound the edge of each dataset. Longitudinal and lateral cyclic inputs in (a) Ahead and (b) Green 30 wind at 50 kt.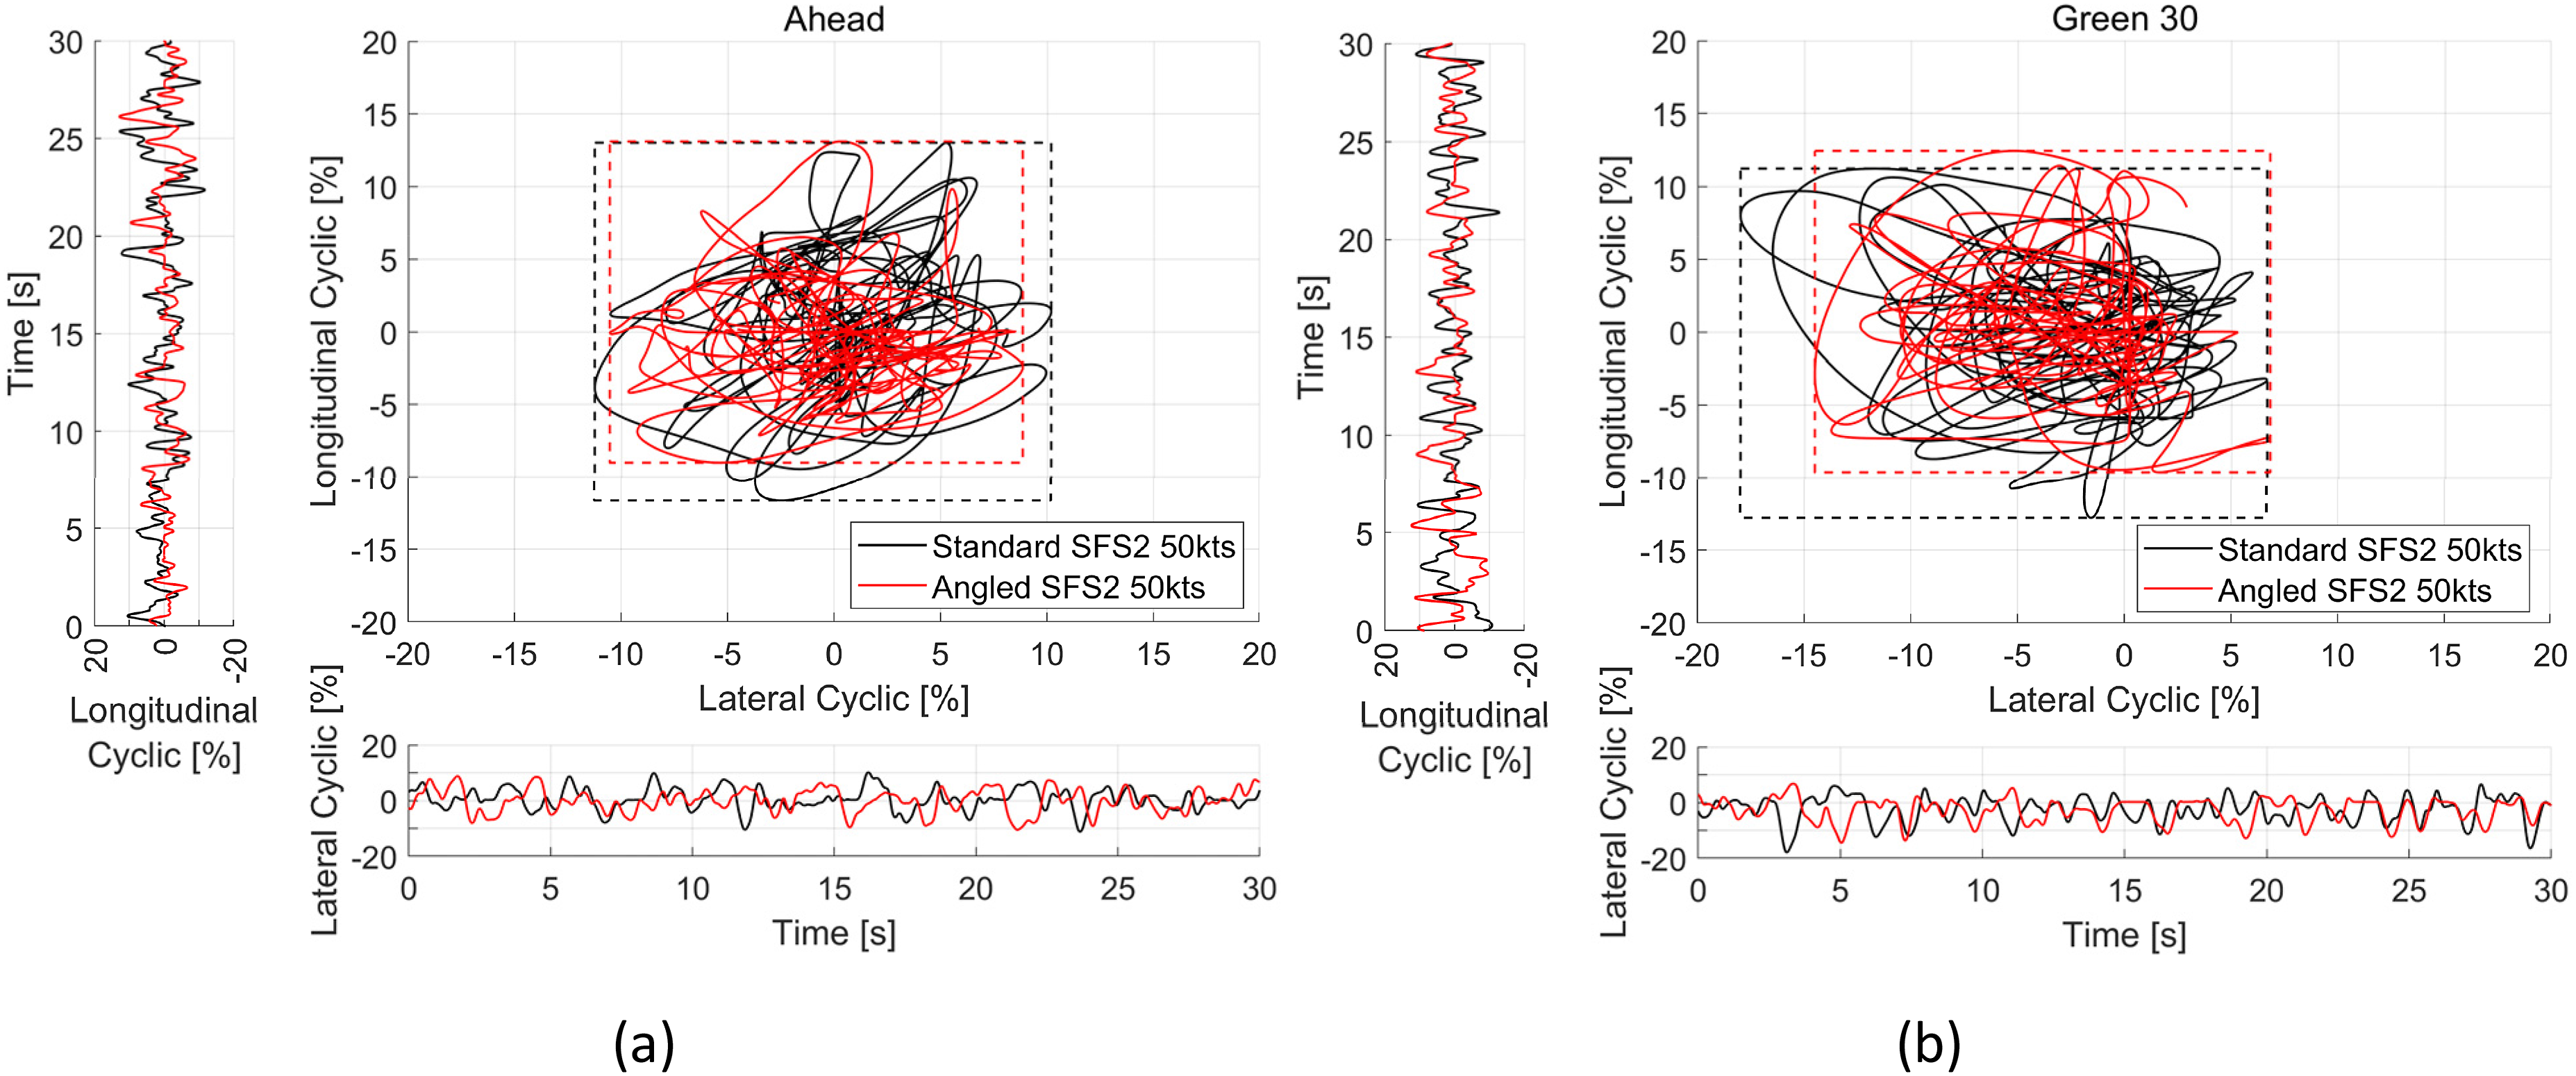
The pilot’s cyclic input during the hover task in the 50 kt Ahead WOD is shown in Figure 20(a). A small increase in maximum displacement, about 2%, is seen during hover over the flight deck of the standard SFS2 compared with the displacement in cyclic during hover over the angled SFS2. The cyclic controls the tilt of the main rotor disc and Figure 10(a) and (b) shows that the turbulence intensity in the area where the rotor will be positioned during hover, above the hangar, is similar for each hangar shape, consistent with the cyclic inputs.
The maximum displacements in cyclic input in the Green 30 wind, Figure 20(b), show a 3–4% increase during the hover task over the flight deck of the standard SFS2 compared with the angled SFS2, which is consistent with the increase in the pilot workload reported in Table 3 and the increase in turbulence intensity above hangar height shown for the standard SFS2 in Figure 10. A greater maximum lateral cyclic displacement is shown during hover over the standard SFS2 in the Green 30 WOD than in the Ahead, which is also consistent with the different levels of turbulence intensity shown in Figure 10. Overall, in both winds, there is some evidence that the pilot was applying greater control inputs when flying to the standard SFS2.
Pedal inputs during helicopter recovery task
Figure 21 shows the pedal control inputs in the 50 kt Ahead and Green 30 WOD conditions; full right and left pedal are defined as +50% and −50% respectively. The pedals control the tail rotor thrust, which provides a counter-torque to the main rotor, as well as overcoming yawing moments from lateral disturbances. As in Figure 18, the time histories in Figure 21 are split by two vertical dashed lines that represent the start and end of the 30 s hover task (MTE 3). Pedal position in (a) Ahead and (b) Green 30 wind at 50 kt.
In the Ahead WOD condition, shown in Figure 21(a), a similar magnitude of pedal input was required during MTE 1 and MTE 2 for both ships, which is consistent with similar levels of workload rating in Table 2, as well as the aircraft’s angles of rotation shown in Figure 18 and the low turbulence intensity observed off the port side of each ship. As the aircraft passes over the port side deck-edge and into the airwake, the pedal inputs are seen to increase as the aircraft is buffeted by the turbulent air. Larger pedal inputs are observed during the hover and touchdown phases, MTEs 2 and 3, for the standard SFS2 compared with the angled hangar SFS2, which is consistent with the increase in workload ratings in Table 2 and the aircraft’s angle of yaw, shown in Figure 18. The increase in pedal input is also consistent with the pilot’s additional attribution of yaw to the overall increased effort of landing to the standard SFS2. It is suggested that during the hover and touchdown tasks, the reduction in recirculation zone close to the rear of the angled hangar, compared with the standard SFS2 as shown by Bardera et al., 19 reduces the yawing moment on the aircraft, thereby reducing the pedal inputs and their contribution to pilot workload. Figure 21(b) shows the pilot’s pedal inputs during recovery to both ship geometries in the Green 30 wind. The trim position is seen to be at 22.5% left pedal, which was required to hold the aircraft’s heading in the oblique wind. Consistent with the workload ratings, pilot comments and helicopter vertical position, much larger pedal inputs were required by the pilot during the approach and traverse MTEs to both ships compared with the hover task. The pilot applied larger pedal inputs during most of the recovery to the standard SFS2 compared with the angled SFS2, particularly when over the landing deck. The maximum deviation of the pedal input for the recovery to the standard SFS2 was 17% and close to twice that required during recovery to the angled SFS2. According to the pilot, yaw control in the oblique wind provided a strong contribution to the DIPES rating awarded for the full recovery to the standard SFS2, which is consistent with the high level of pedal control input and resultant increase in aircraft yaw angle shown in Figure 19. The contours of turbulence intensity in Figure 10(c) and (d) are also consistent with the increase in pilot workload, control inputs and aircraft position.
Torque response during helicopter recovery task
Figure 22 shows the rotor torque response to the pilot’s collective input during the helicopter recovery task in the 50 kt Ahead and Green 30 WOD conditions. The collective is used to control the thrust from the main rotor by varying the pitch of the rotor blades and adjusting the power input accordingly; it therefore also affects the rotor torque. The two vertical dashed lines again highlight the start and end of the 30 s hover task, MTE 3, while the horizontal dashed line indicates the 100% torque limit. Torque response in (a) Ahead and (b) Green 30 wind at 50 kt.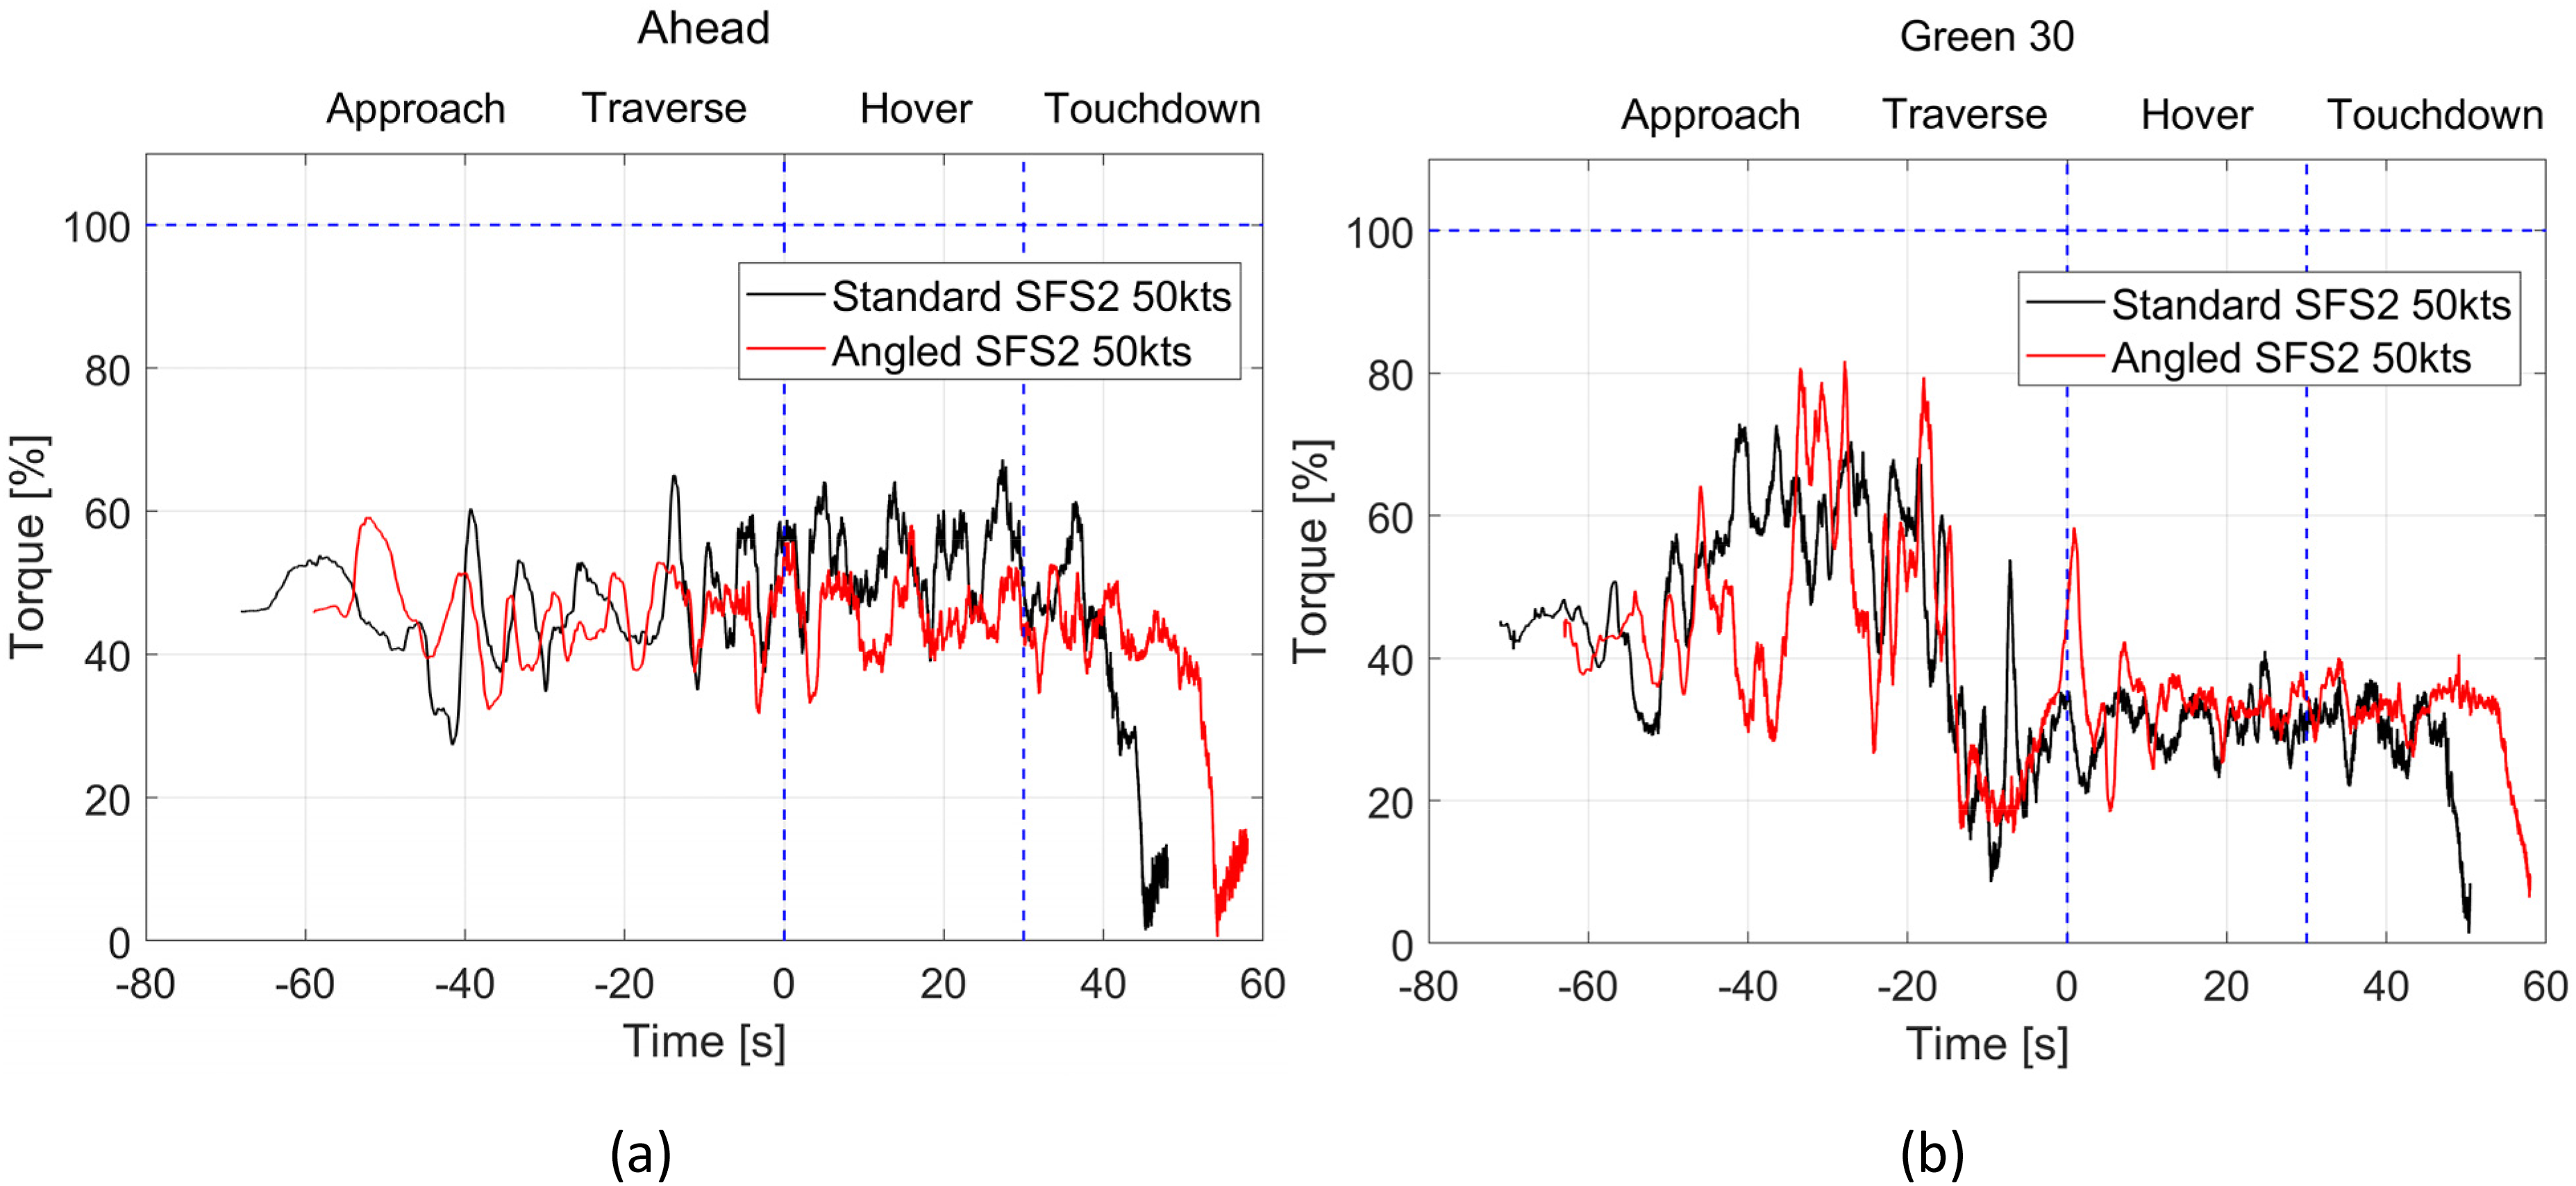
It was seen in Table 2 that the workload during MTEs 1 and 2 in the headwind were the same for the two ships; however, from Figure 22(a) it can be seen that the torque response to the collective inputs are different for these phases. Referring back to the helicopter trajectories shown in Figure 17(a), it can be seen that the vertical heights and trajectories of the helicopter when translating from off the port side were different for the two ships, which reflects the different collective inputs. From the pilot’s ratings, it appears that although the inputs and trajectories were different, the workload was the same. Once over the deck, however, in the hover and touchdown phases the inputs are larger for the standard SFS2, consistent with the workload ratings in Table 2, and the increased turbulence intensity over the deck of the standard SFS2.
In the Green 30 WOD condition, Figure 22(b) shows that during MTEs 1 and 2 torque values were about 20% higher than in the headwind with greater fluctuations for both ships. Table 3 showed that the pilot found the workload to be higher in MTE 2 for the standard SFS2 but it is not obvious from Figure 22(b) that the increased workload was due to the collective input. Similar comments hold for MTEs 3 and 4 and overall there is little to differentiate the collective inputs when the pilot was landing to the two ships.
Concluding comments
There have been several studies conducted into the use of hangar modifications, superstructure appendages and flow control devices in an attempt to reduce the severity of a ship’s airwake over the flight deck.3,7–14,16–19,24,25 However, while superstructure modifications can alter the airwake, the effect on the helicopter and pilot is uncertain. Furthermore, because an improvement is made for one wind direction, it does not necessarily follow that the improvement is maintained for different wind directions. Therefore, instead of attempting to assess the airwake by looking at the air flow, whether by experiment or CFD, a more reliable assessment is obtained by integrating the airwakes with a full-motion flight simulator and conducting piloted deck landings. Such a study has been conducted in this paper.
The modification to the hangar of the SFS2 was not recommended by Bardera et al. solely on airwake characteristics, but neither could they take into account how the modified air flow would interact with the helicopter and how that would affect the pilot workload. Looking at the geometry of the hangar modification in Figure 5 and the CFD images in Figure 10, it can be seen that the angled surfaces deflect the air flowing over the top and sides of the hangar towards the centre of the flight deck, thereby creating a smaller recirculation zone with lower levels of turbulence; it is effectively a streamlining of the blunt hangar. The effect of the modification on pilot workload was assessed and has been discussed above, but from a practical perspective the modified hangar has enabled the helicopter to operate in a headwind greater than 50 kt (although the limit has not been determined), and in the Green 30 WOD the maximum safe wind speed has been increased from 40 kt to 50 kt. The fact that the hangar modification only led to improvements in the severity of the airwake at the higher wind speed should not be seen as a negative because it is at the higher wind speeds and at the boundary of what is deemed safe that the improvements are needed. The improvement appears to be due to reduced disturbances in the yaw axes, leading to lower pilot workload mainly in the pedal controls but also through the cyclic. Whether the improvements would be maintained at other wind angles still needs to be determined, but it can be said that the modification is, at the least in part, an improvement.
As a final observation, the SFS2 is not a particularly realistic ship geometry, with just a simple funnel on the superstructure. Over a real ship the turbulent airwake comes not just from the hangar edges but from other large features such as masts and radar arrays, as illustrated in the conceptualised ship in Figure 12. The SFS2 hangar height is about 6 m, which is actually the same as the UK Type 23 frigate, but this gives little height for the angled modification to be applied. It may be that the modification would be more effective on a bigger hangar, and would be more representative if the superstructure was realistic.
Footnotes
Acknowledgements
The authors acknowledge the ongoing support form ANSYS U.K., Ltd. The authors would like to thank a former Royal Navy Test Pilot for professionalism, skill, and input during the simulation flight trials. The authors would also like to thank Dr Rafael Bardera Mora and the team at Instituto Nacional de Técnica Aeroespacial for providing the PIV data.
Declaration of conflicting interests
The author(s) declared no potential conflicts of interest with respect to the research, authorship, and/or publication of this article.
Funding
The author(s) received no financial support for the research, authorship, and/or publication of this article.