
Abstract
Insight into the interference effects of the nacelle position can be used to provide some guidance for achieving better aircraft performance in the preliminary design of modern civil aircraft. This paper investigates the through-flow nacelle position effects on aircraft aerodynamic characteristics and nacelle intake performances through numerical simulation. The Common Research Model with different nacelle-pylon installation positions is analyzed and all the five nacelle installation parameters, including spanwise position, penetration, gully depth, pitch angle, and toe angle, are systematically studied. Qualitative and quantitative comparisons between different configurations are conducted and the sensitivity of drag, lift distribution, total pressure recovery, and airflow distortion to nacelle position is obtained. The mechanism of interference effects is also explored. These derived insights can provide some guidance for determining the nacelle position and reduce the cost of subsequent wind tunnel test.
Keywords
Introduction
Modern large civil transport aircraft generally adopt the under-wing mounted engine configuration. 1 With this configuration, the aircraft has better weight distribution and the nacelle inlet does not suffer interference from fuselage or wing.
However, the presence of nacelle will impact greatly on aircraft aerodynamics, weight, vibration, noise, engine efficiency, maintenance, and handling characteristics, among others. 2 The second drag prediction workshop (DPW), which was organized in an effort to assess the state of the art of computational fluid dynamics (CFD) drag prediction in the aircraft industry, began to study nacelle installation effects, 3 and the nacelle-pylon drag increment is also one of test cases in DPW6. 4 The influence area of nacelle is not limited to the wing surface near the installation position, but almost the whole wing flow. The aerodynamic interference between the nacelle, pylon, and wing will change the pressure distribution on the upper and lower wing surfaces, causing greater drag and lower available lift. 5 And due to the flow acceleration on wings and pylons, shock is generated ahead of time and the flow even separates. 6 Especially for engines with large bypass ratio, the installation drag of nacelle can reach 20–30 counts. 7 The nacelle and pylon can also lead to a distinct change in the location of the lift breakdown. 8 Stall performance is primarily governed by the separation at nacelle-pylon location.9,10
Therefore, the interference effect between the engine and aircraft when performing the aerodynamic design with engine-airframe integration is an increasingly important concern, and the nacelle position optimization is a critical topic. 11 Oliveira et al. 12 and Chen et al. 13 made detailed statistics on the installation position of aircraft engine and gave the nacelle installation boundary. It was considered that as long as the nacelle was installed outside this boundary, the nacelle drag can be lower than 1% of the whole aircraft drag. Rossow et al.14,15 reported an inviscid study of nacelle position variations in the vertical and horizontal direction. They found that the horizontal position had more pronounced influence on the interference effects. Sibilli et al. 16 and Oliveira et al. 12 performed similar studies and confirmed this finding. Stankowski17,18 investigated the effect of powered nacelle position on the aerodynamic interference. They indicated that the best position was located closest to the wing horizontally and lowest from the wing vertically. Goulos et al. 19 also performed similar works and studied the impact of the vertical and horizontal position of the nacelle. Based on numerous CFD solutions, Hooker et al. 20 analyzed many engine positions and found the drag variation with position was different for different engine size. Applying the multi-disciplinary optimized method, Koc and Saitoh et al.21–23 conducted aerodynamic design optimization for wing-body-nacelle-pylon (WBNP) configuration, which considered the variation of gully depth and pitch angle. Gisin et al. 24 focused on the effects of gully depth and penetration of the above-wing mounted nacelle on wing performances by using the superficial grid migration method. Li et al. 25 used the arbitrary space-shape free form deformation method to optimize the gully depth and penetration. Smith et al. 26 also carried out a similar optimization study which considered the pitch and toe angle variation. Blaesser et al. 27 quantified the interference drag for different nacelle locations varying in chordwise, spanwise, and vertical directions. Lei et al. 28 employed adjoint method to optimize the penetration, gully depth, and toe angle. Wegener and Lange 29 also analyzed the influences of the nacelle position and geometry shape of pylon and wing on the aerodynamic performance of the aircraft with nacelle arranged above the wing.
The above research studies have emphasized the necessity of nacelle position effect study in engine-airframe integration. In most of these research studies, only the effects of the vertical and horizontal installation positions of nacelle are explored and these research studies are mostly carried out on the non-pylon situation. And all the studies consider aerodynamic forces experienced by the whole aircraft as the objective function, without considering the influence of nacelle position on inlet flow distortion. The nacelle installation position is important for nacelle intake performance and should ensure that the intake delivers the air at the highest total pressure and as uniform as possible.
In this paper, the effects of the under-wing nacelle position on the aerodynamic characteristics and nacelle intake performance are studied through numerical simulation. The work is conducted with the use of Common Research Model with through-flow nacelle. All the five nacelle installation parameters, including spanwise position, penetration, gully depth, pitch angle, and toe angle, are systematically studied. The sensitivity of drag, lift distribution, total pressure recovery, and airflow distortion to nacelle position is assessed, and the mechanism of interference effects is explored. These knowledge can be applied in the preliminary design stage to give some guidance for the determination of nacelle position, derive a preliminary installation boundary, and thus assist the subsequent wind tunnel test.
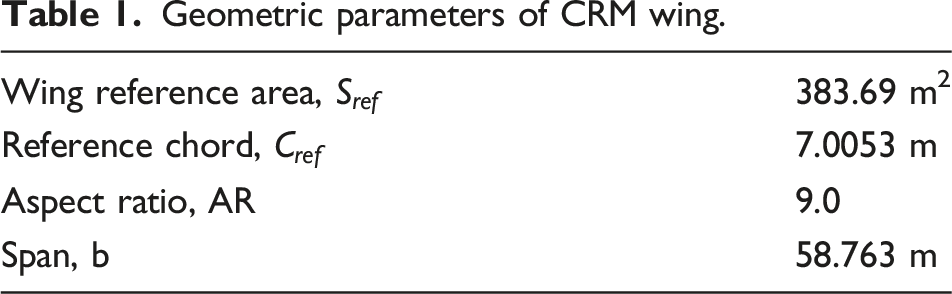
Geometry and conditions
Geometric parameters of CRM wing.
Nacelle installation parameter definition
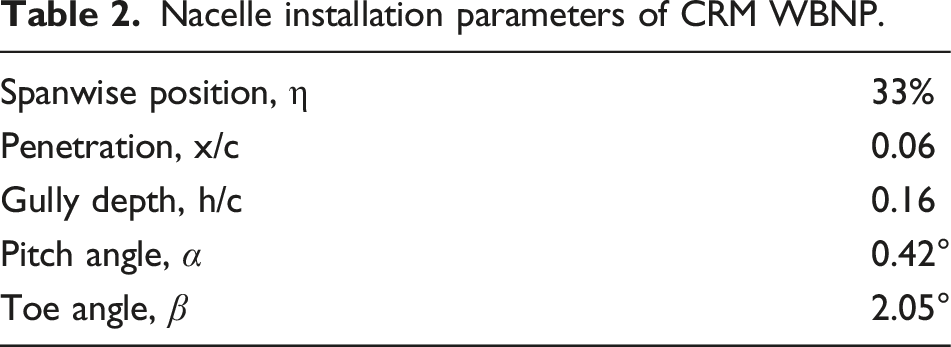
The definitions of nacelle installation parameters are illustrated in Figure 1. These parameters are defined under the coordinate system shown in the figure. The larger spanwise position means that the nacelle is farther away from the fuselage. The penetration and gully depth are the horizontal and vertical distance between the leading-edge point of the local airfoil at the spanwise installation position of the nacelle and the highest point of the nacelle rear-end face, respectively. The larger gully depth brings the nacelle farther away from the lower wing surface. The downstream movement of nacelle causes larger penetration, meaning more overlap between the nacelle and wing. The penetration and gully depth are dimensionless with chord length (c) of the local airfoil, denoting as x/c and h/c, respectively. Pitch angle of the nacelle (α) is defined as the angle between the nacelle axis and horizontal plane of the fuselage. The pitch angle is positive when the nacelle axis is deflected upward. The nacelle toe angle (β) is the angle between the nacelle axis and the symmetry plane of the fuselage. When the nacelle axis deflects towards the fuselage, the toe angle is positive. The nacelle installation parameters of CRM WBNP are shown in Table 2. Parameter definitions of nacelle installation position. Nacelle installation parameters of CRM WBNP.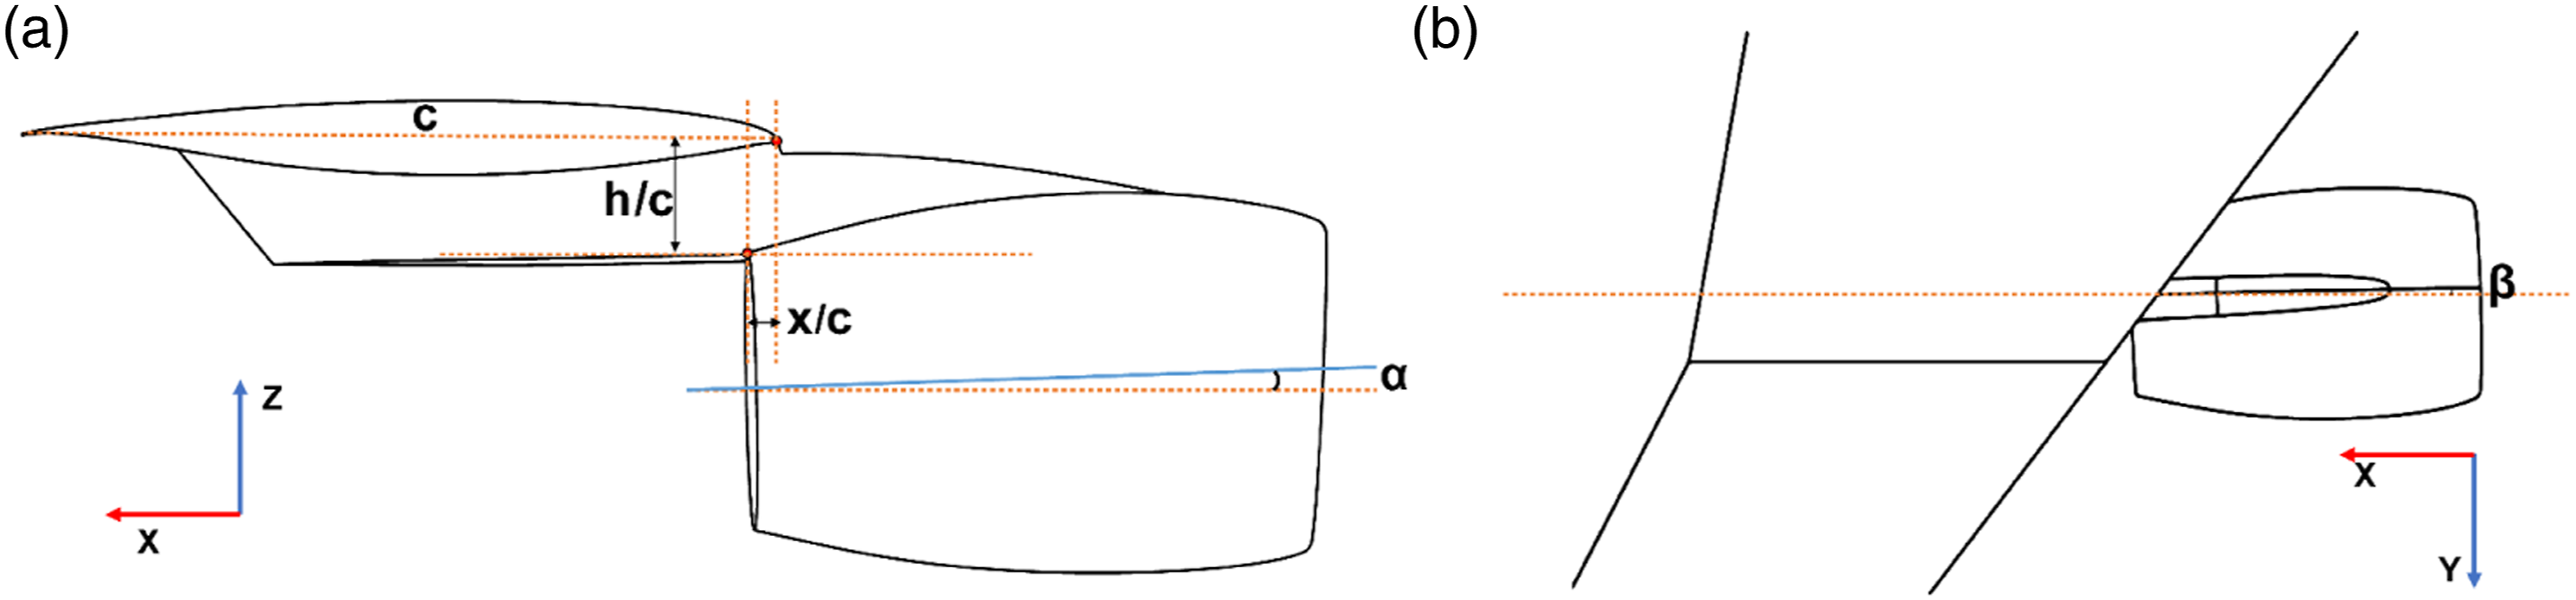
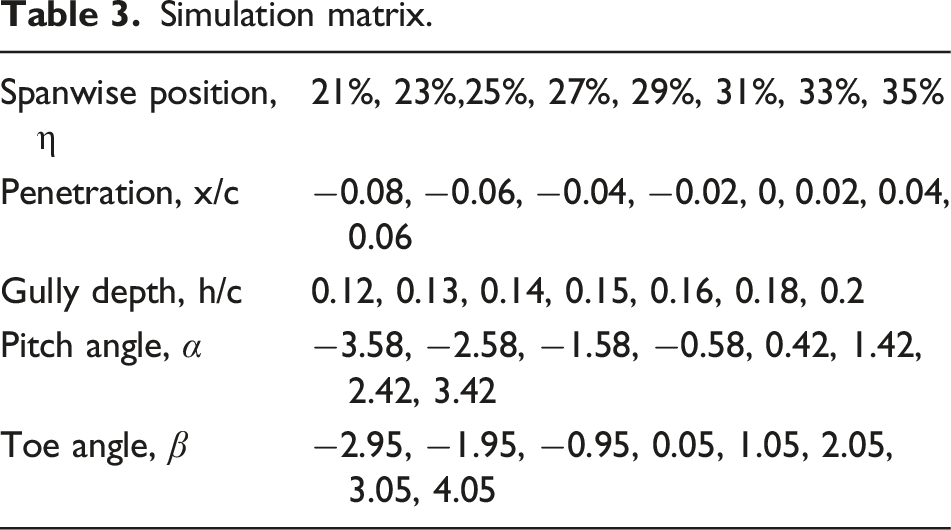
Simulation matrix.
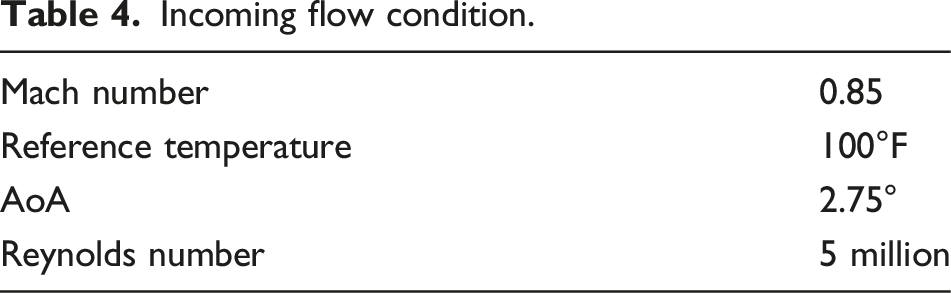
Incoming flow condition.
Nacelle intake performance
Current practice for the evaluation of flow distortion typically depends mainly on steady-state and occasionally unsteady experimental measurements. The quantification of distorted flow fields is based on total pressure measured at specific points on the aerodynamic interface plane (AIP). A standard way to do this in the circular AIP is to use a radial rake on which measuring probes at the center of equal-area rings are placed.
30
A standard measurement arrangement for engine intakes comprises an array of eight spokes with five probes each, as depicted in Figure 2. 8 × 5 rake and pressure probe array in AIP.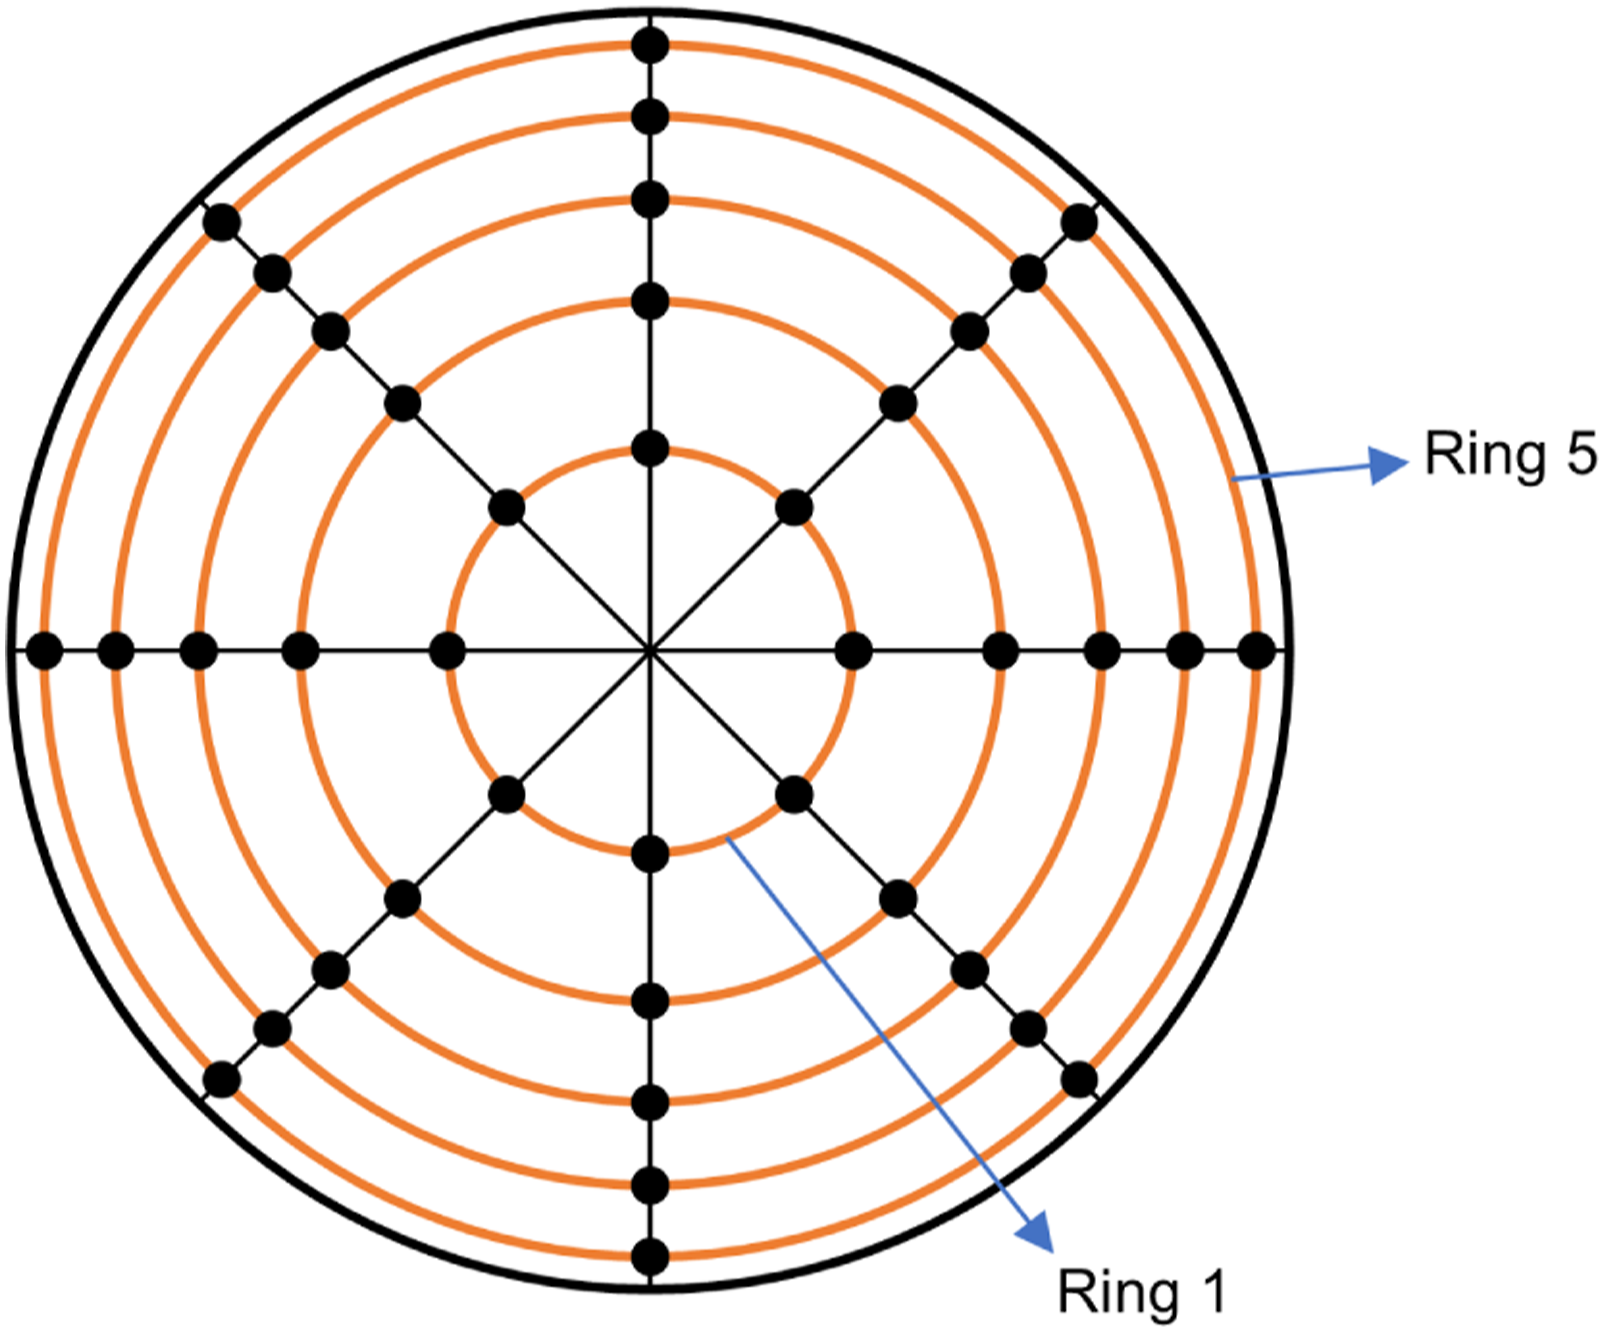
Following the guidelines in Ref. [30], two parameters are used to describe the nacelle intake performance. The first one is the total pressure recovery (PR) which is a measure for the efficiency of the ram compression of an intake and is defined as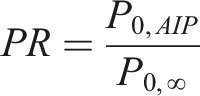
The other one is the distortion which describes the non-uniformity of the flow. In this study, the total pressure distortion is used to evaluate distortion and only steady state one-per-revolution distortion is considered.
The circumferential distortion index (IDC) assesses the uniformity of the circumferential total pressure distribution and is defined as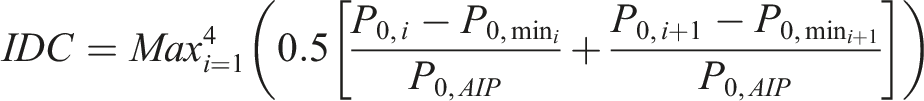
The radial distortion can be evaluated by the radial distortion index (IDR). The IDR is calculated by considering the inner ring (hub radial) and the outer ring (tip radial) and is defined as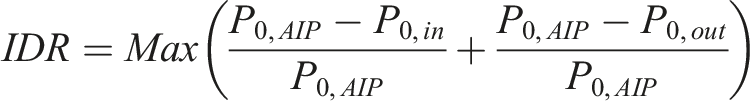
In addition, an overall distortion metric, DC (60), is also used, which is defined as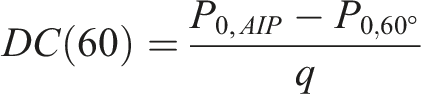
Numerical modeling
This section contains details of the numerical modeling used in the present study.
Governing equation
The steady compressible Reynolds-Averaged Navier–Stokes (RANS) equations are employed as the governing equations, which can be written as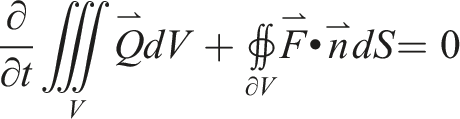
The RANS equations are closed by the SST k-ω model, which is a two-equation turbulence model combining the k-ε and k-ω model. 31 This model utilizes the k-ω formulation in the inner parts of the boundary layer and switches to a k-ε behavior in the free-stream. The tendency of SST model to produce a bit too large turbulence levels in regions with large normal strain is much less pronounced than with a normal k-ε model. And SST model avoids the common k-ω problem, which is that the model is too sensitive to the free-stream turbulence properties.
The governing equations are discretized using the finite volume method. The coupled flow model is employed to solve the conservation equations for mass and momentum simultaneously using s pseudo-time-marching approach. The convection and diffusion terms are discretized with a second-order upwind scheme. The ideal gas is used to consider compressibility effects.
Mesh generation
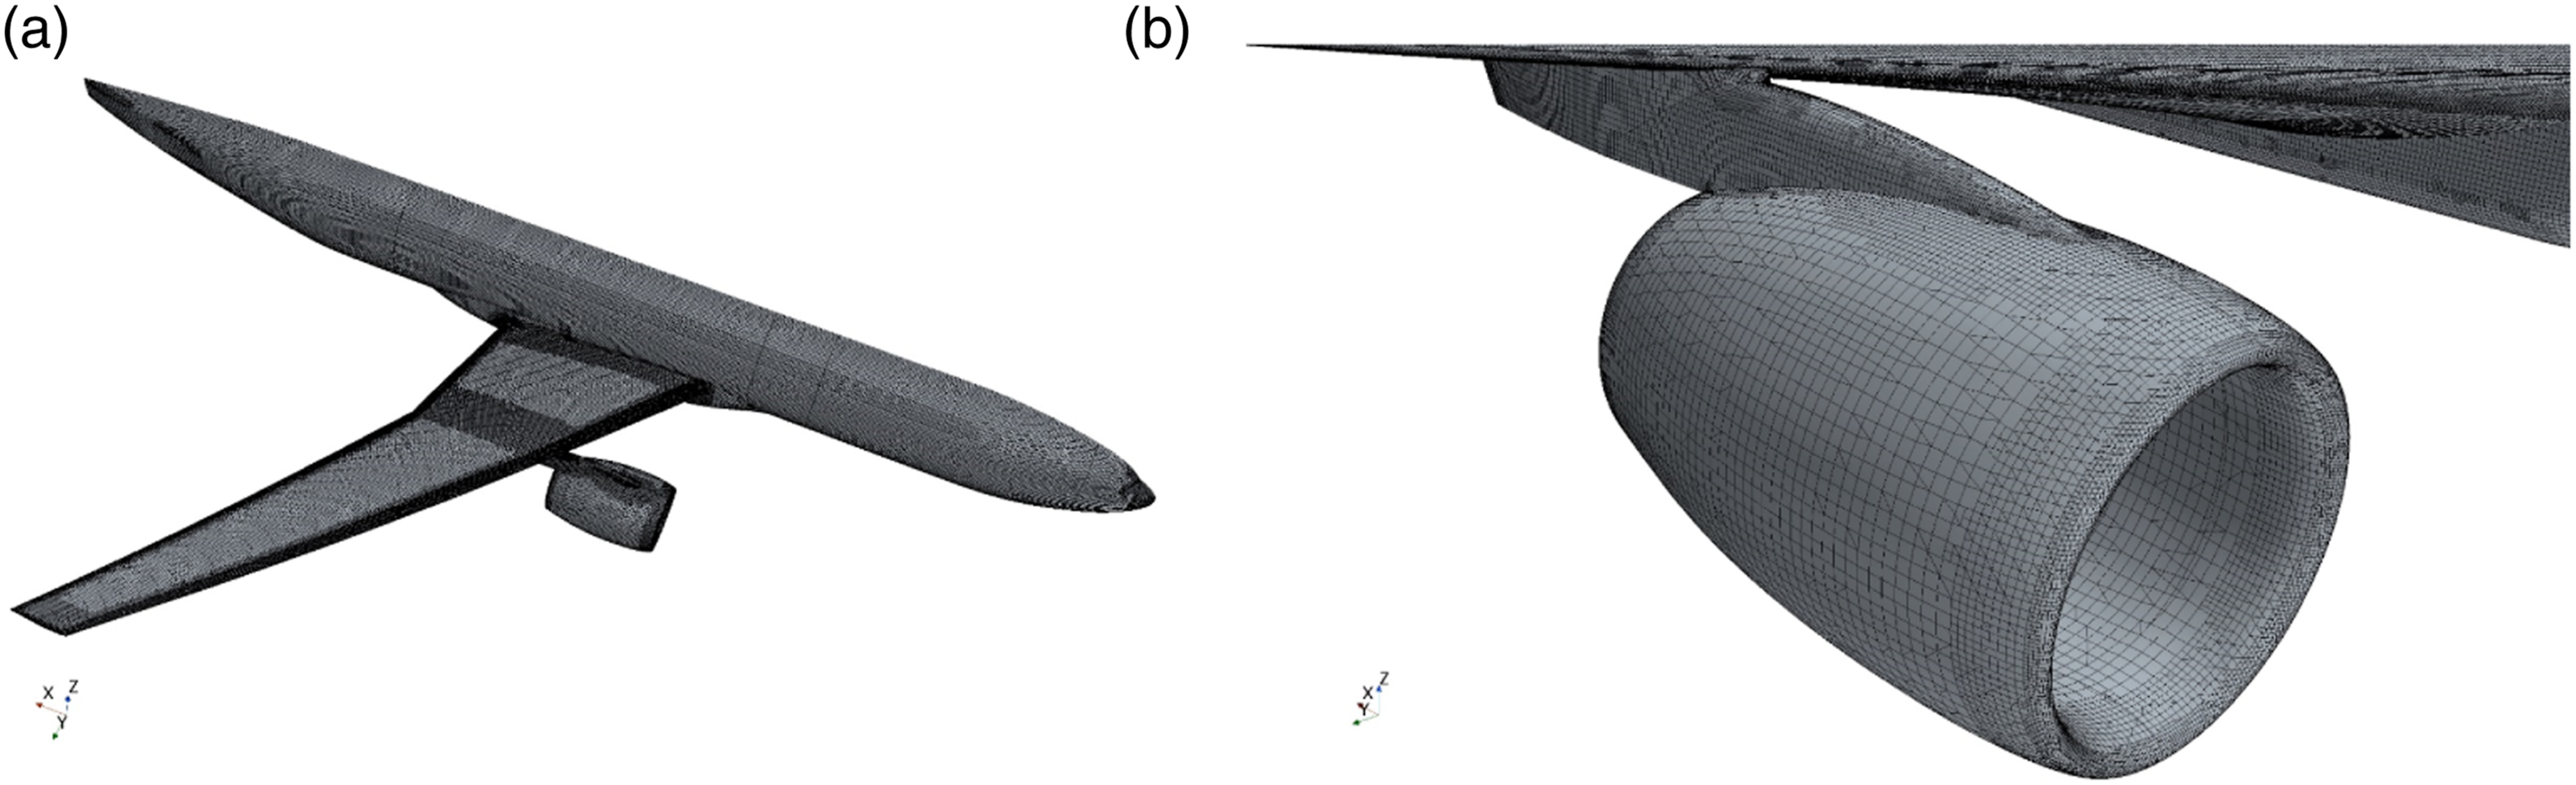
The trimmed cell mesh technique is used to provide a predominantly hexahedral unstructured mesh. The computational domain for CRM WBNP configuration is a half sphere. The far field boundary is about 100C
ref
length from geometry. The height of first mesh layer is set to 0.0000284 m to yield Obtained Mesh on surfaces of WBNP. ((a) Whole view, ((b) Close-up of nacelle-pylon surface.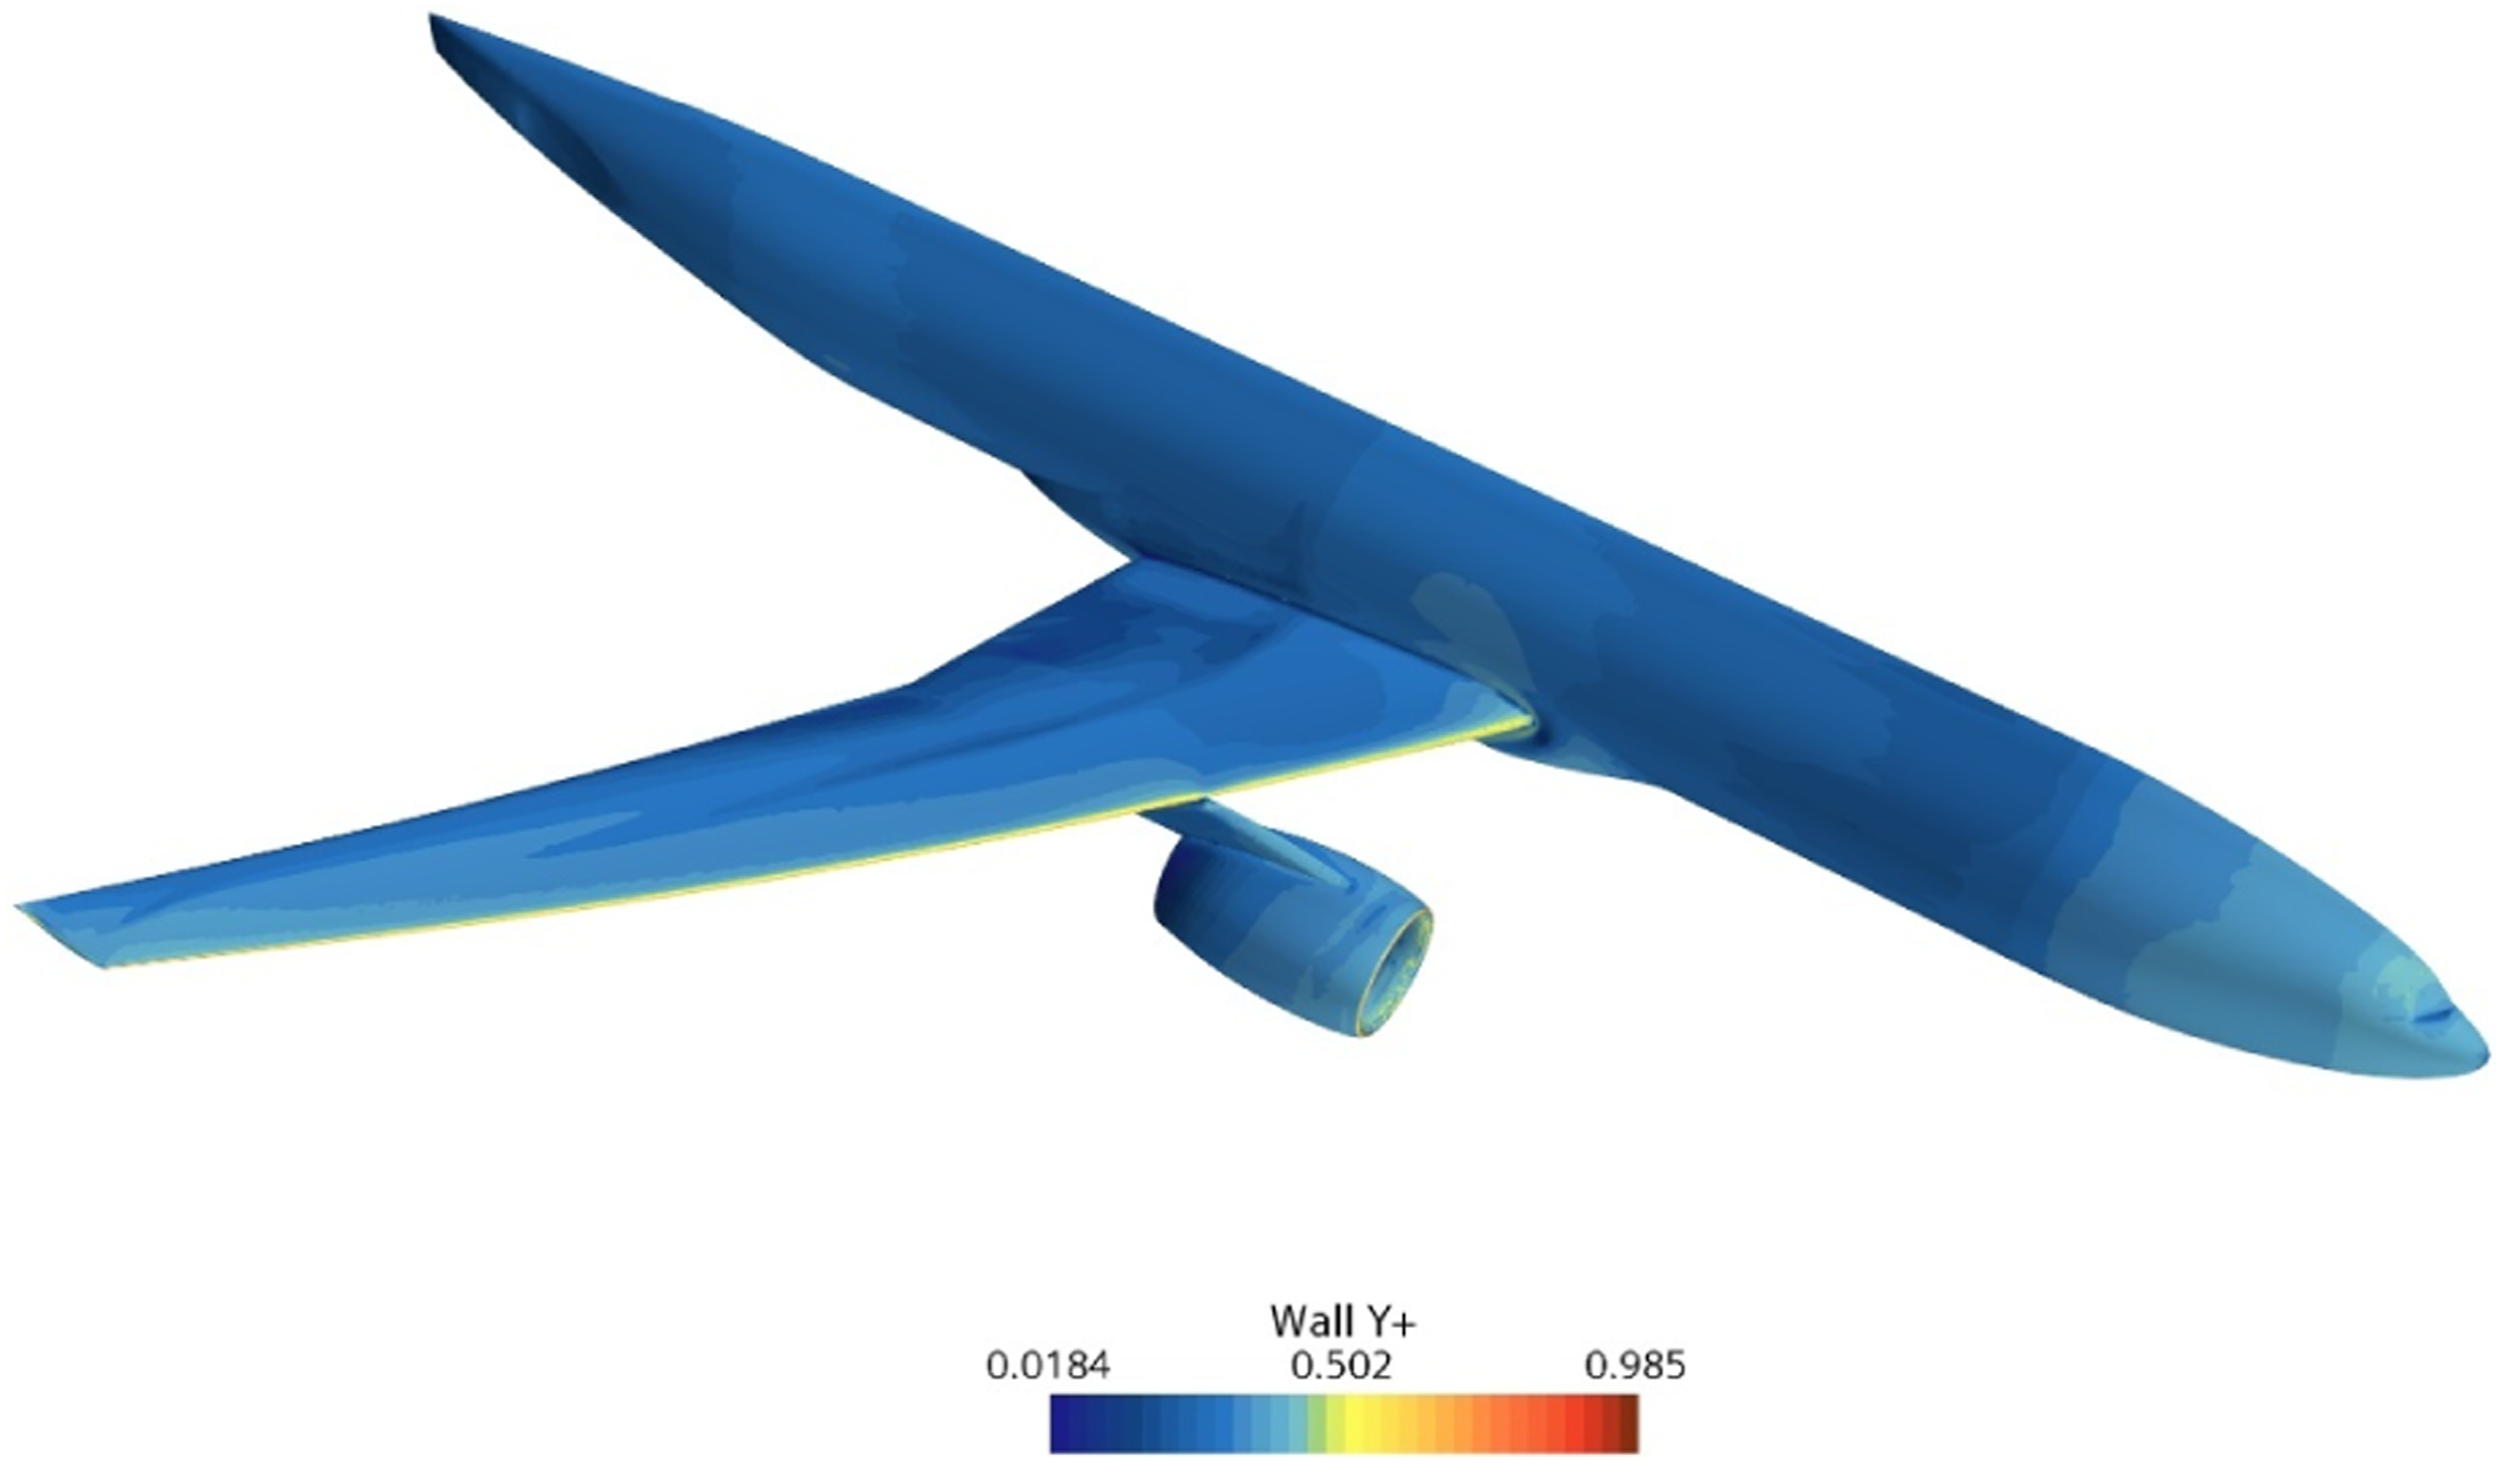
Mesh independence study
WBNP mesh refinement family statistics.
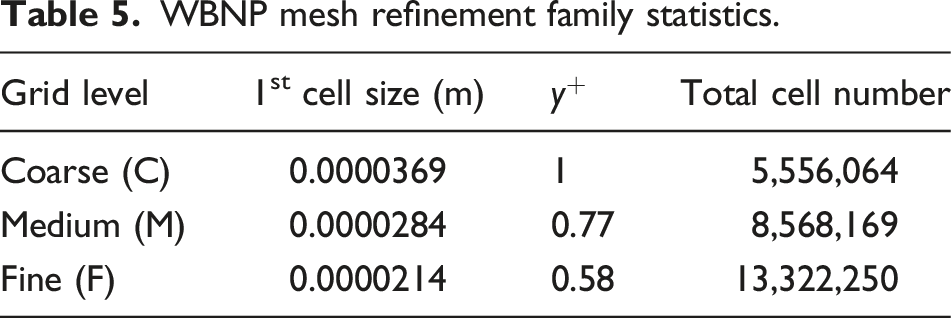
The mesh independence study is performed through the uncertainty analysis. The observed order of convergence of the solutions is obtained using

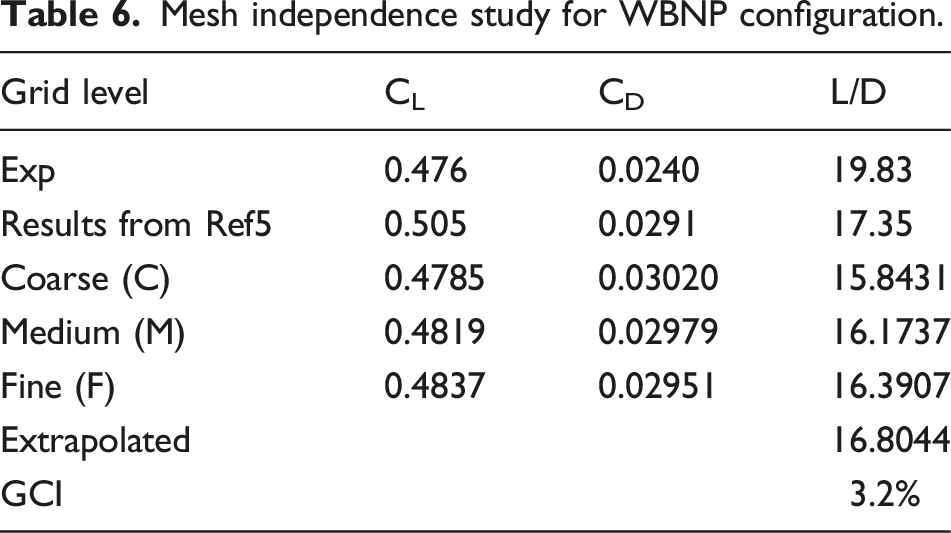
The Grid Convergence Index (GCI) is a measure of the percentage of the computed value deviating from the value of the asymptotic numerical value.
24
The GCI is calculated using a safety factor of 1.25, and the mesh-induced uncertainty is predicted as
Mesh independence study for WBNP configuration.
Results and discussion
The influence of nacelle-pylon
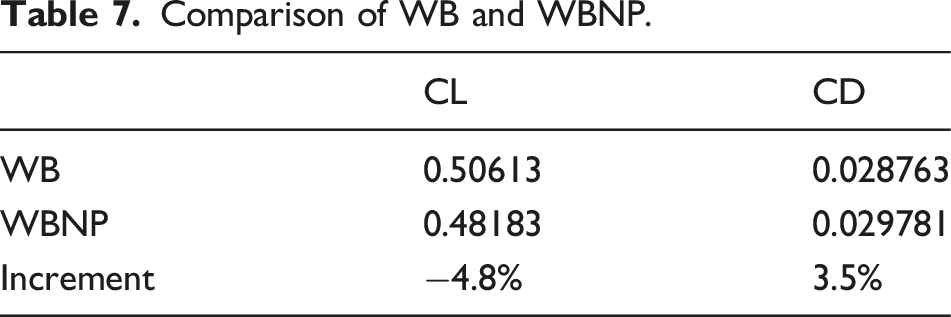
Before studying the influences of different nacelle-pylon installation positions, the aerodynamic characteristics of CRM wing-body (WB) and WBNP configuration are compared to investigate the influence of nacelle-pylon. The grid generation strategy of WB configuration is the same as that of WBNP. The total cell number is 6.9 million. The comparison is conducted under the same conditions and the AoA is also set to 2.75°.
Comparison of WB and WBNP.
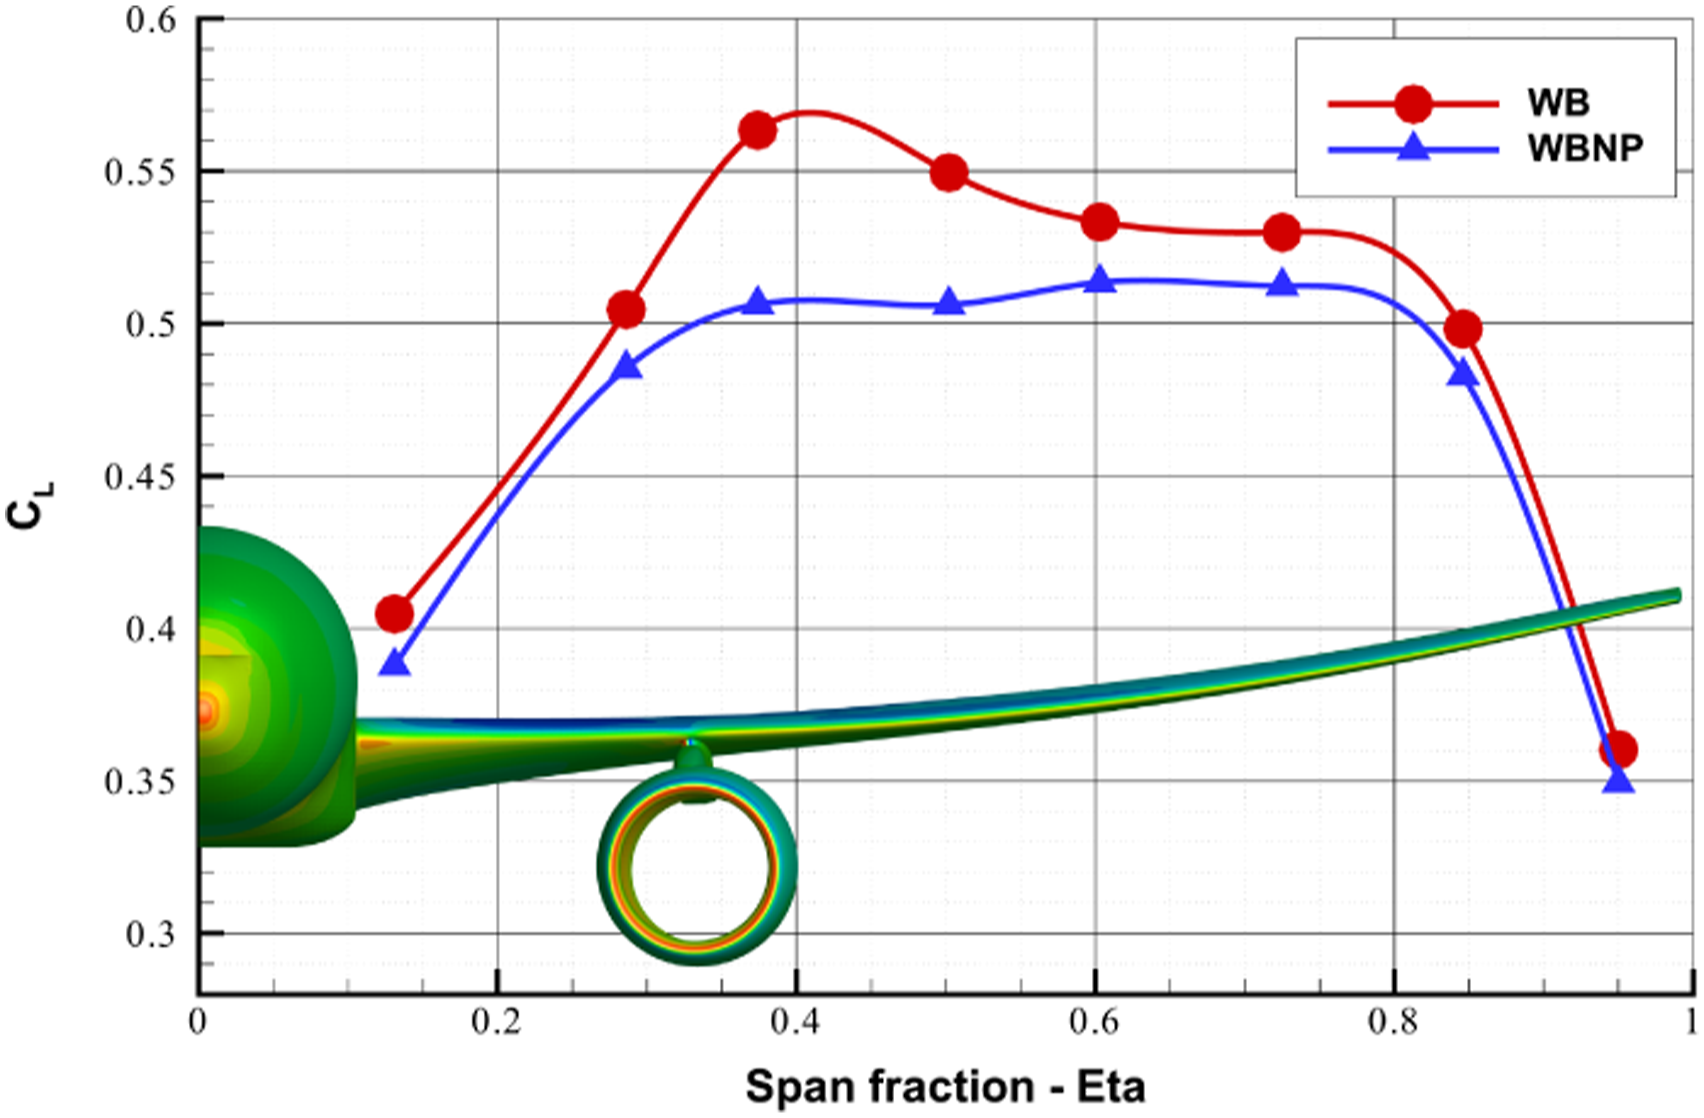
CRM WB and WBNP wing section lift coefficient.
Figure 6 qualitatively shows the pressure contours on wing surfaces of WB and WBNP configurations. The general pressure distributions of the two configurations are similar. The presence of nacelle-pylon, however, significantly alters the pressure distributions on both the lower and upper wing surfaces near its installation position. On the upper wing surface of WB, a significant low-pressure region can be observed at the leading edge. However, in the WBNP, this low-pressure region only exists on the wing inboard of the pylon. Compared with the upper wing surface, the differences of pressure distribution between WB and WBNP are less obvious on the lower wing surface. Pressure contours on wing surfaces of WB and WBNP configurations.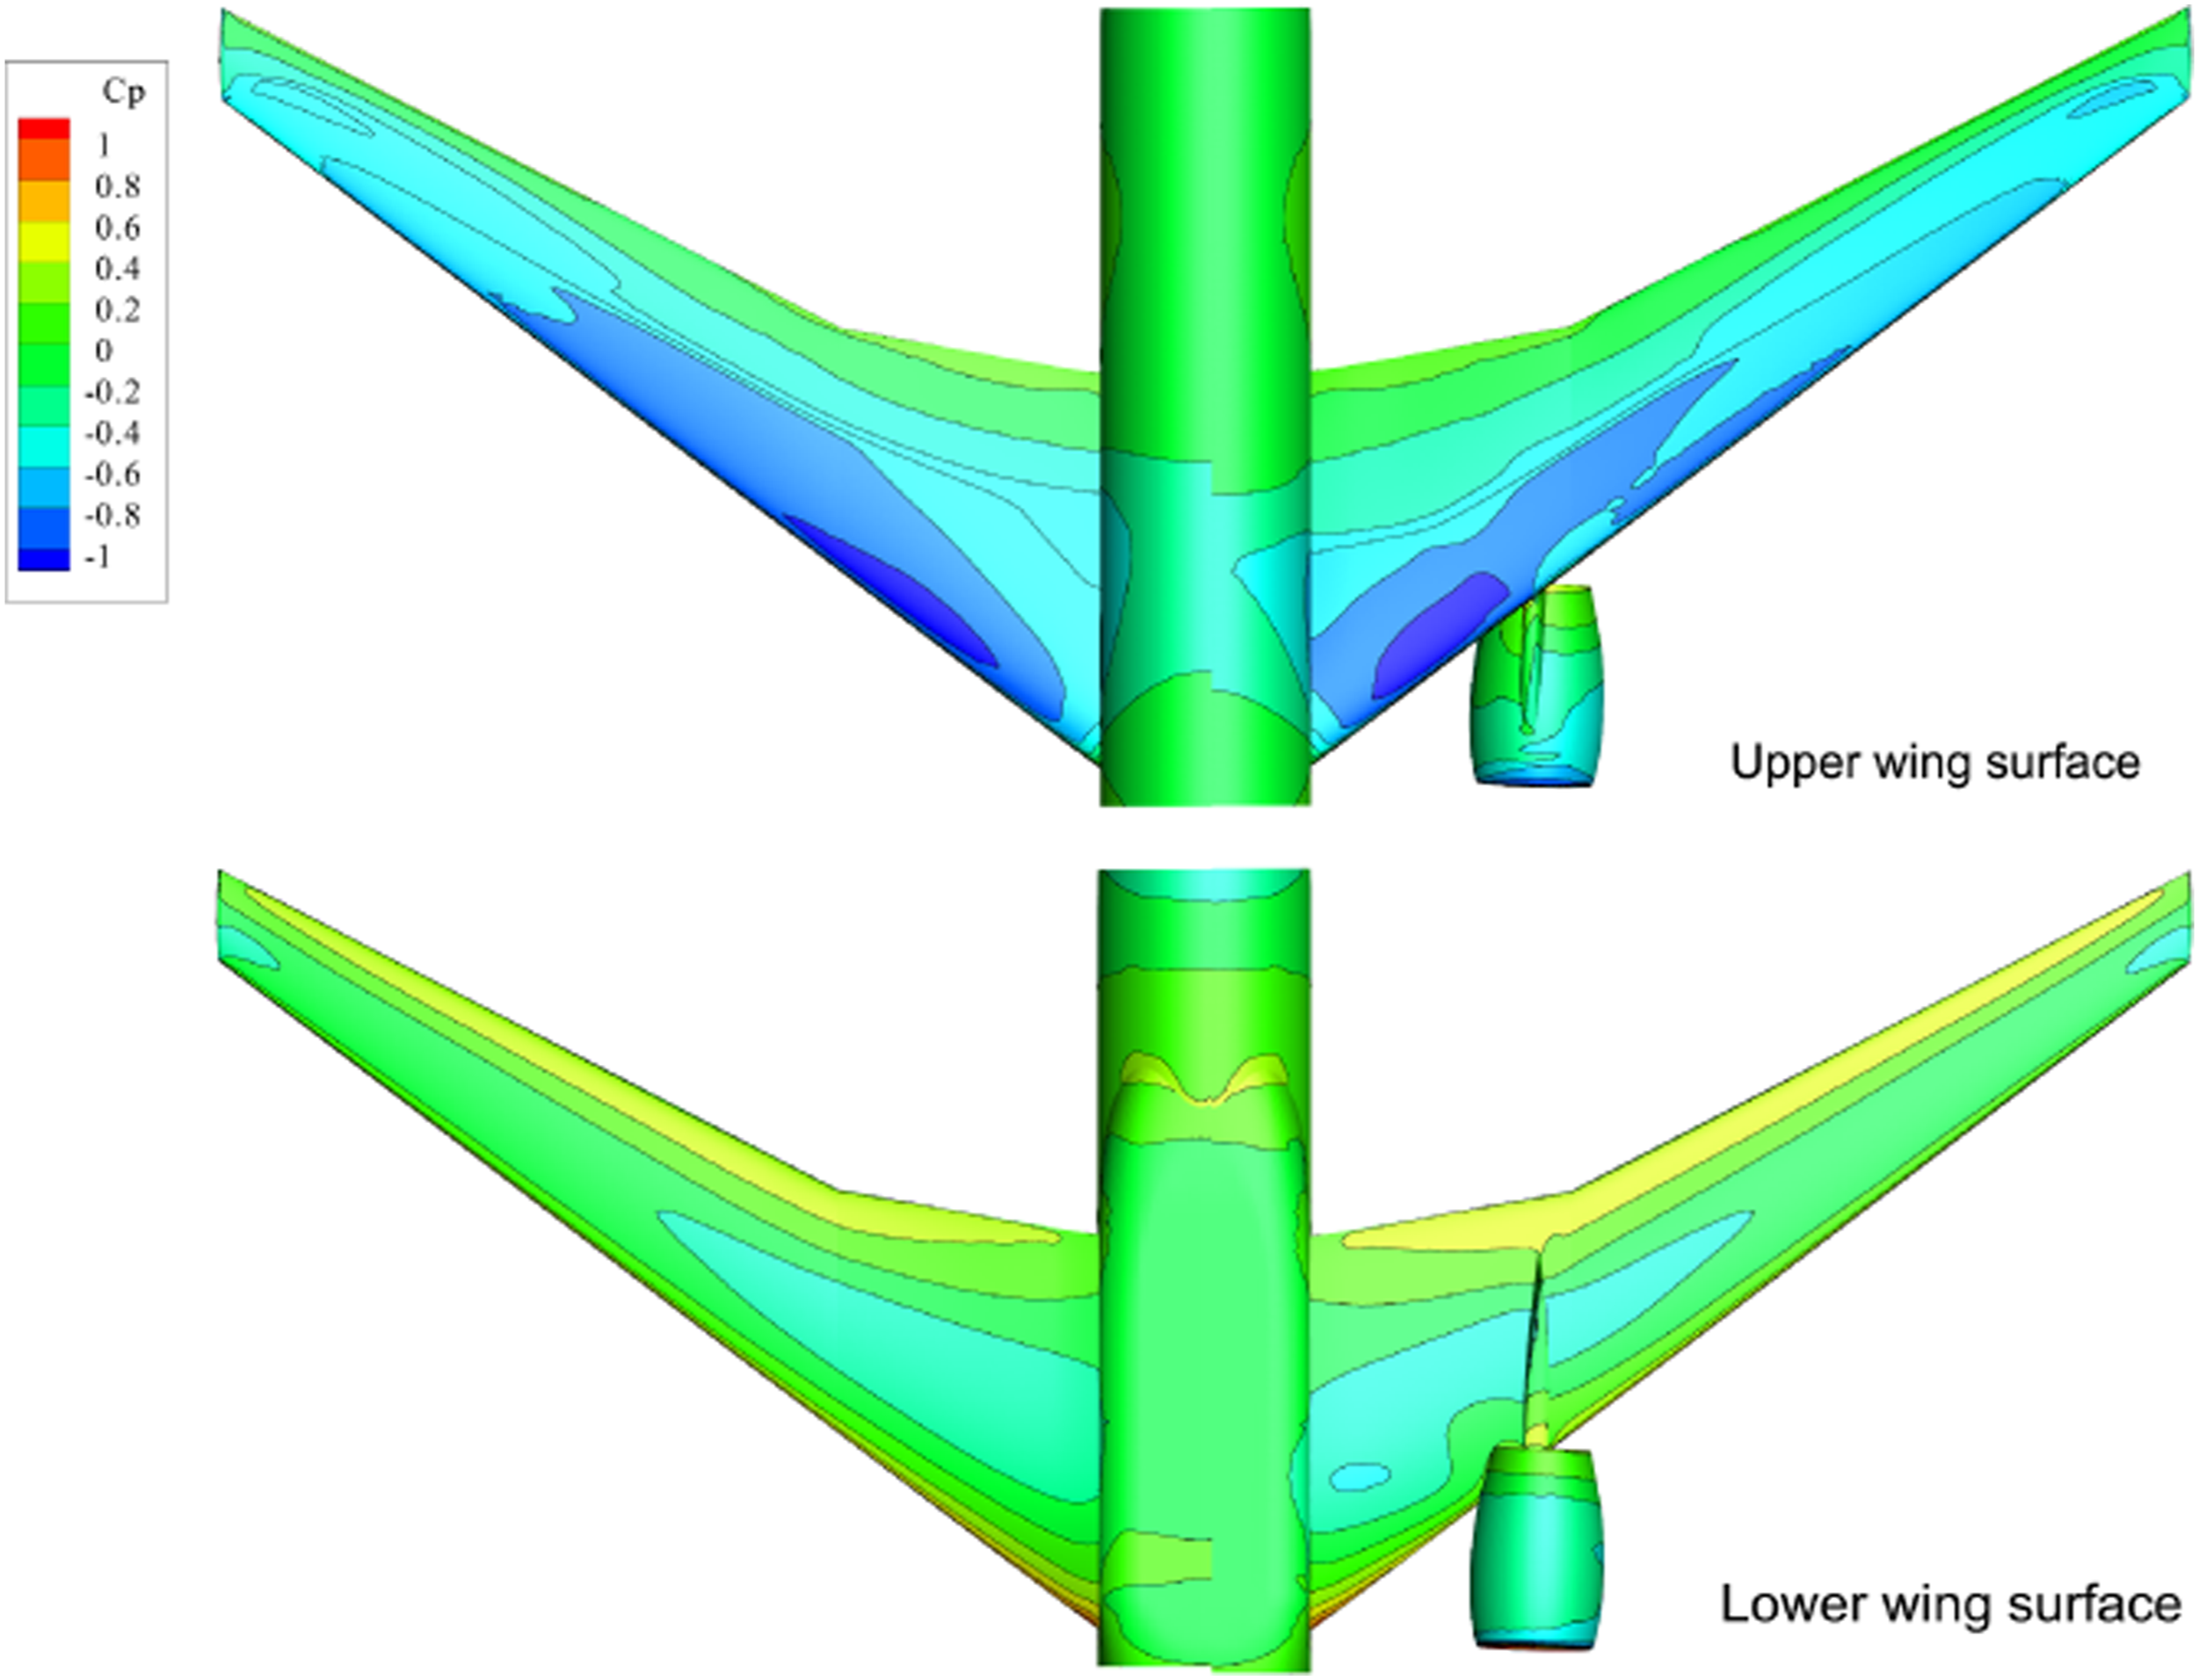
In order to quantitatively describe the influence of nacelle-pylon, the pressure distributions at several wing cross-sections of WB and WBNP are shown in Figure 7. The differences of pressure distribution between the two configurations are mainly concentrated on the upper wing surface. And there is a stronger shock in WBNP, and the shock location moves upstream. At the wing section close to the fuselage (Eta = 0.131), the pressure on the upper and lower wing surfaces of WBNP is obviously smaller. However, as shown in Figure 5, there is little difference in lift between the two configurations at this wing section. At wing sections on both sides of the pylon (Eta = 0.286 and 0.374), WBNP configuration has higher pressure on both the upper and lower wing surfaces. This phenomenon is more prominent just outboard of the pylon (Eta = 0. 374), which will significantly reduce the wing section lift. In addition, the strongest shock appears at this wing section. At the wing section moving further away from the nacelle-pylon (Eta = 0.502), the main differences are the higher pressure on the upper wing in WBNP. As the wing sections approach the wing tip, the pressure distributions in the two configurations are almost identical. Pressure distributions on various wing sections for WB and WBNP configurations.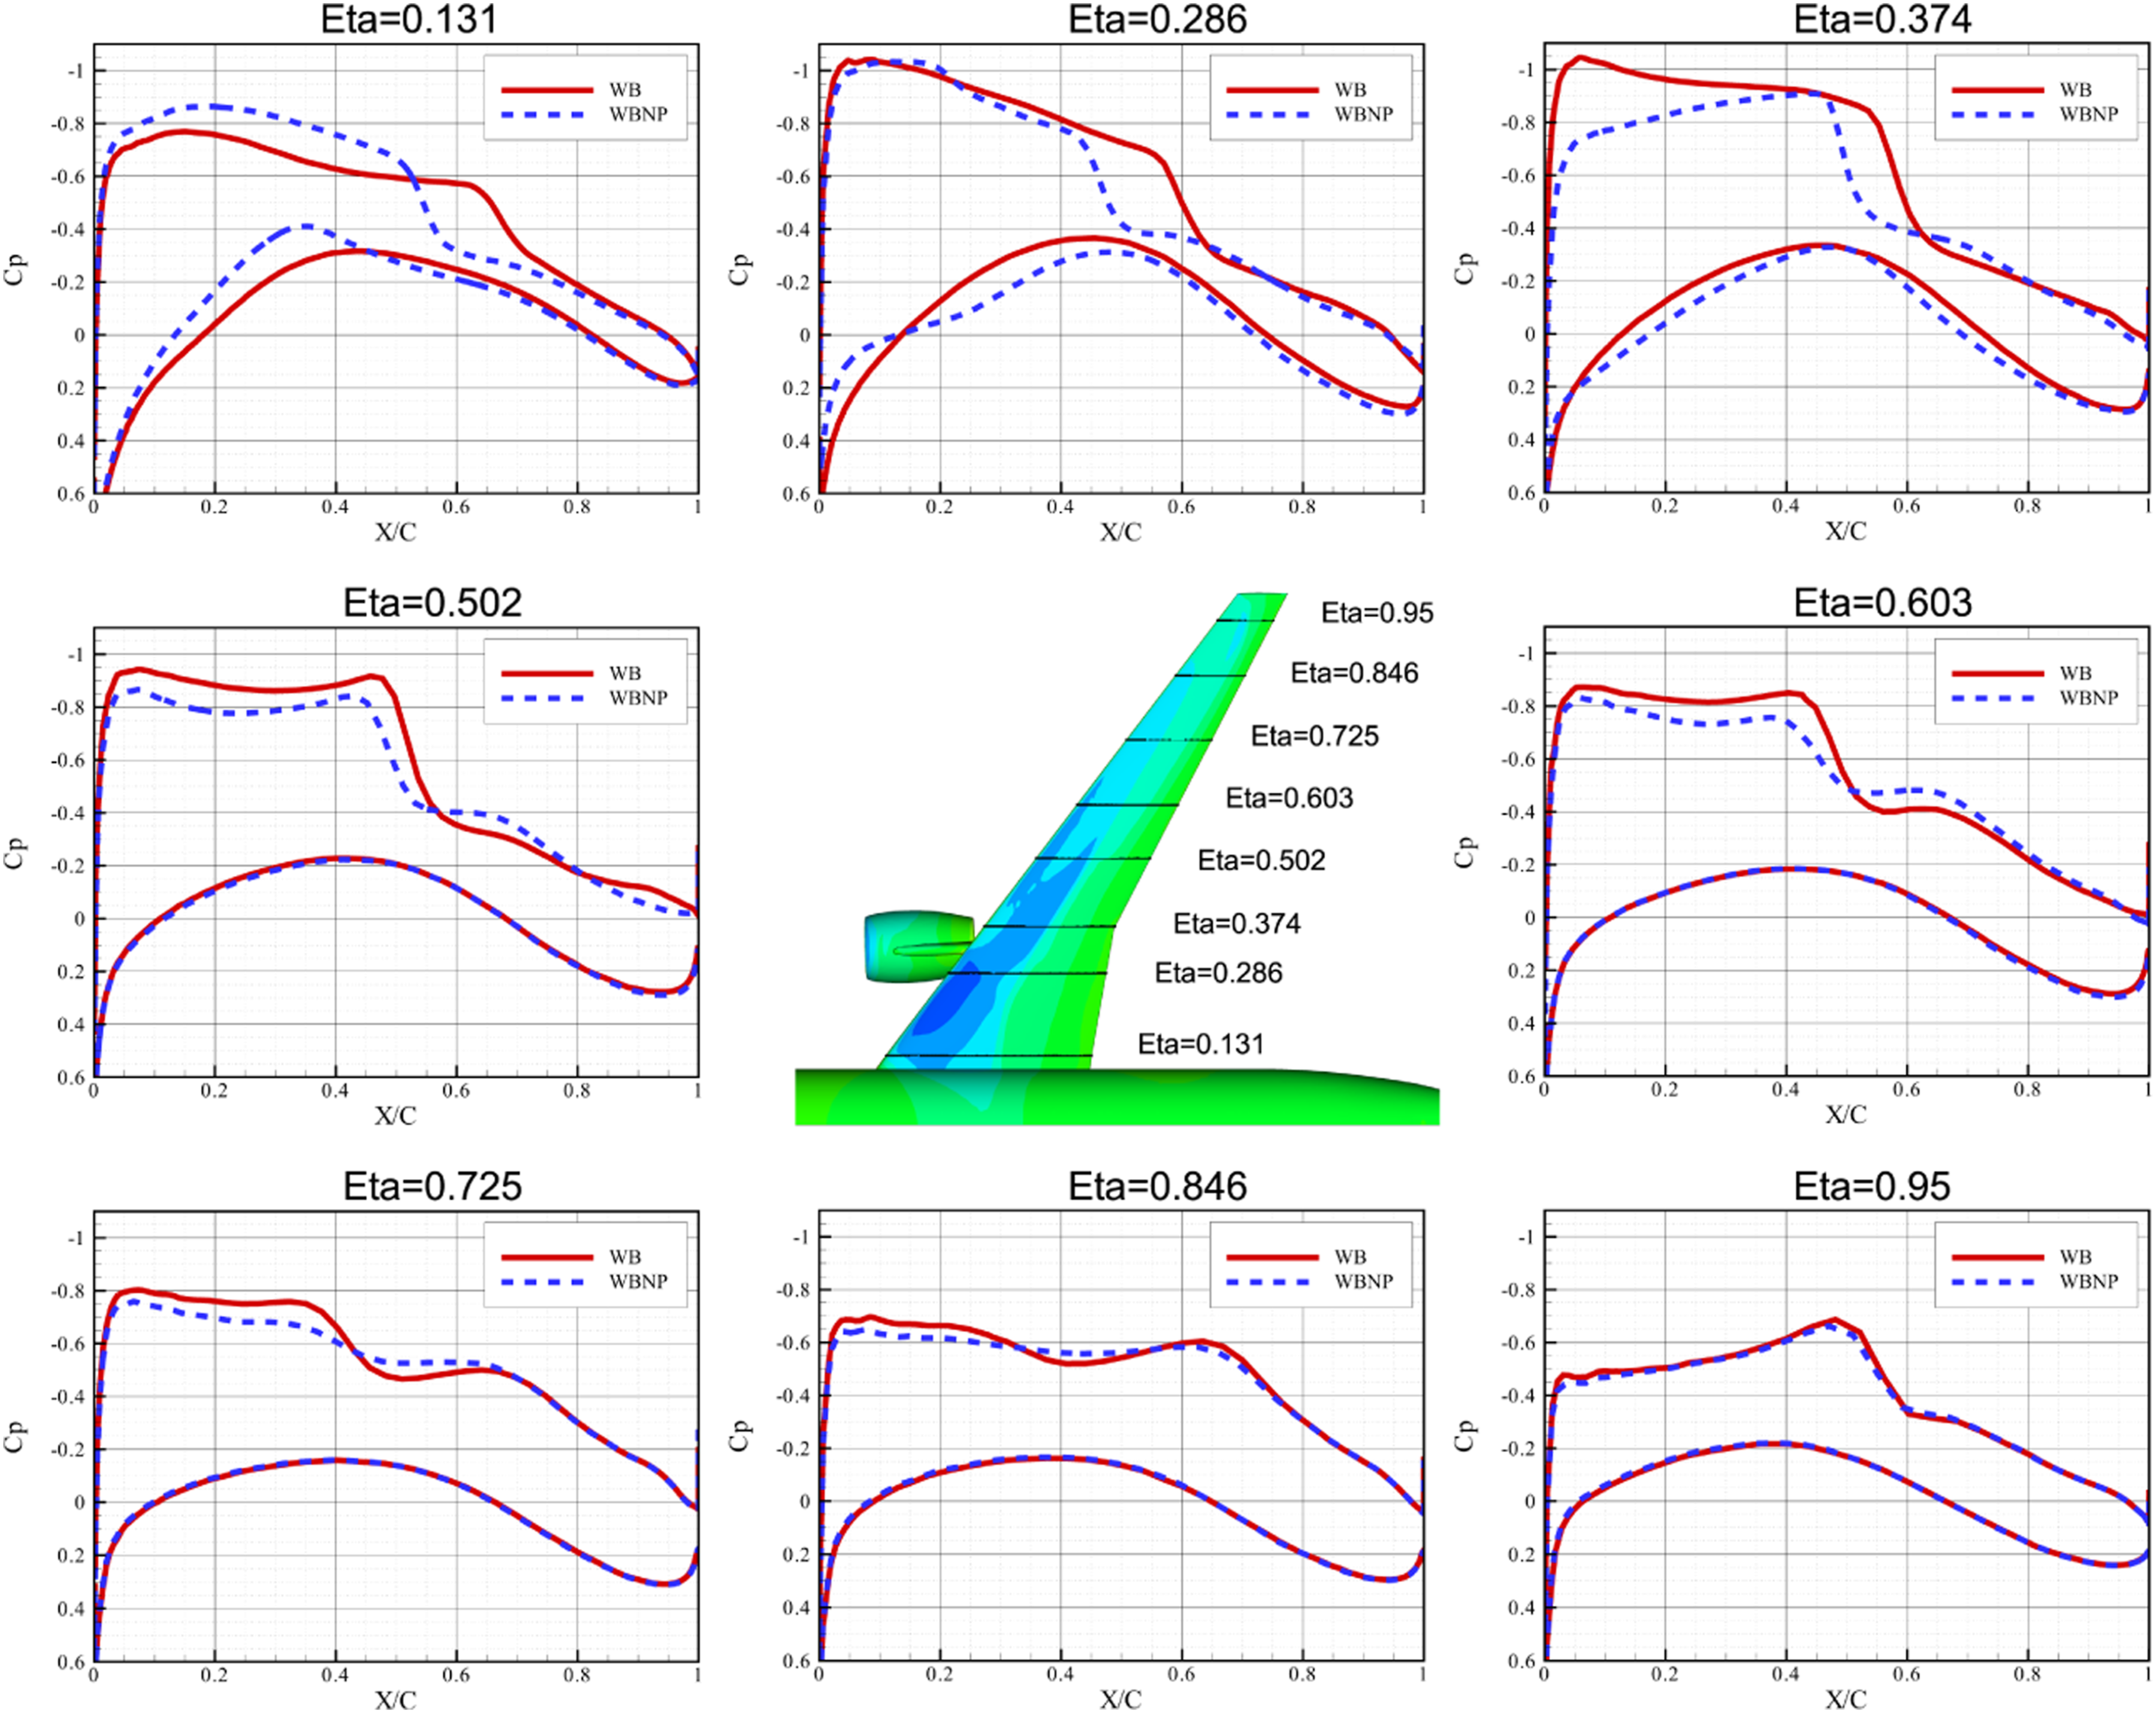
WBNP nacelle pressure distributions are shown in Figure 8. The lowest-pressure area is located at the leading round edge of the nacelle. The pressure on the inner wall of the nacelle is higher than that on its outside surface, resulting from the compression of airflow as it travels through the nacelle. There is a small area with significantly higher pressure on the right side of the junction between pylon and wing, while the area on the left side has negative pressure. Such pressure distribution is due to the asymmetry shape of the wing and pylon. The incoming flow is rushed to the right side of the pylon-wing juncture corner, resulting in high pressure in this area and negative pressure on the other side of the pylon. WBNP nacelle pressure distributions.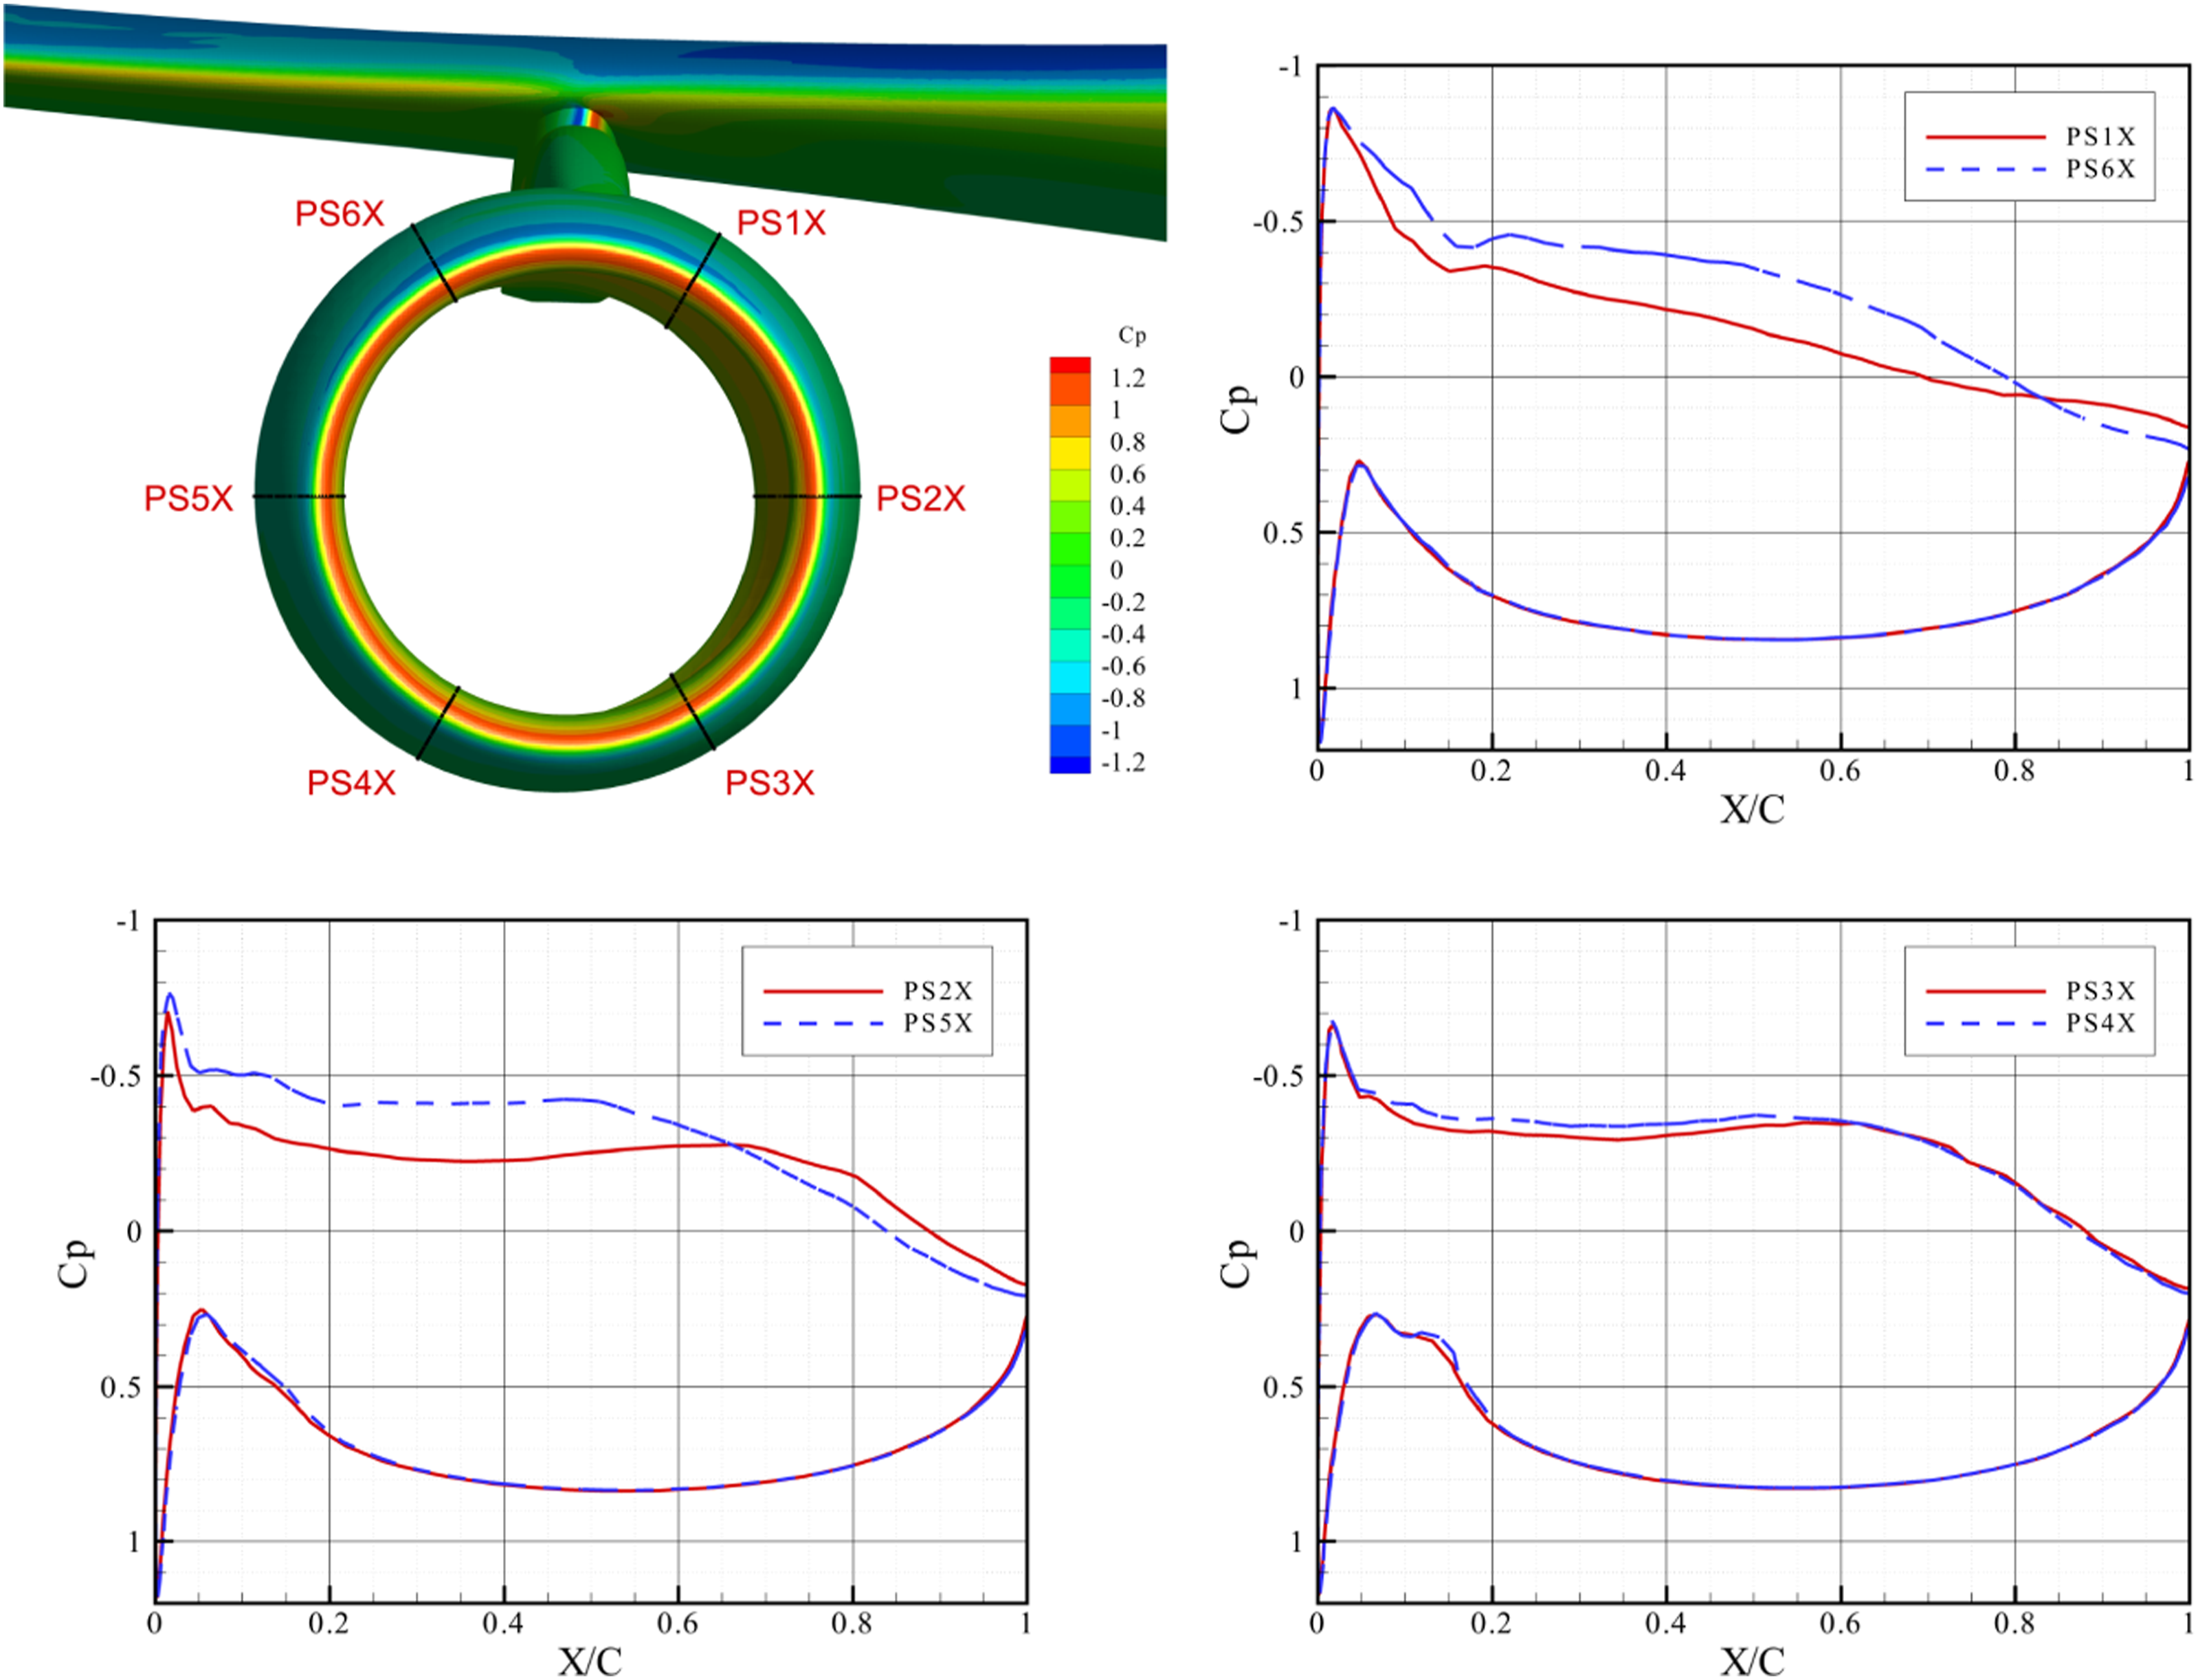
Figure 8 also shows the pressure distributions of six cross-sections on the nacelle. Cross-sections in symmetrical positions relative to the nacelle are plotted in pairs in the same figure to clearly show the differences in pressure distribution between them. A larger negative pressure peak can be observed at the section closest to the pylon (PS1X and PS6X), which means that there is more suction in the upper area of nacelle near the leading edge. And PS6X section has a larger negative pressure than PS1X, which is consistent with the pressure distribution at the pylon-wing juncture. At two horizontal cross-sections, the greater negative pressure appears at the section close to the fuselage (PS2X). At PS3X and PS4X farther away from the pylon-wing, the pressure distribution becomes almost identical.
Spanwise position
In order to analyze the influences of spanwise positions of nacelle on aerodynamic characteristics and nacelle inlet flow distortion, eight different spanwise installation positions, as shown in Table 3, are simulated. Figure 9 shows the lift-drag ratio and drag coefficient with the nacelle installed at these spanwise positions. As the nacelle-pylon gradually moves away from the fuselage, the drag first decreases and then increases; the change of lift-drag ratio is opposite. In general, the configurations with the nacelle installed in the range of spanwise 25%–29% have the minimum drag and the maximum lift-drag ratio. Lift-drag ratio and drag coefficient with nacelle installed at different spanwise positions.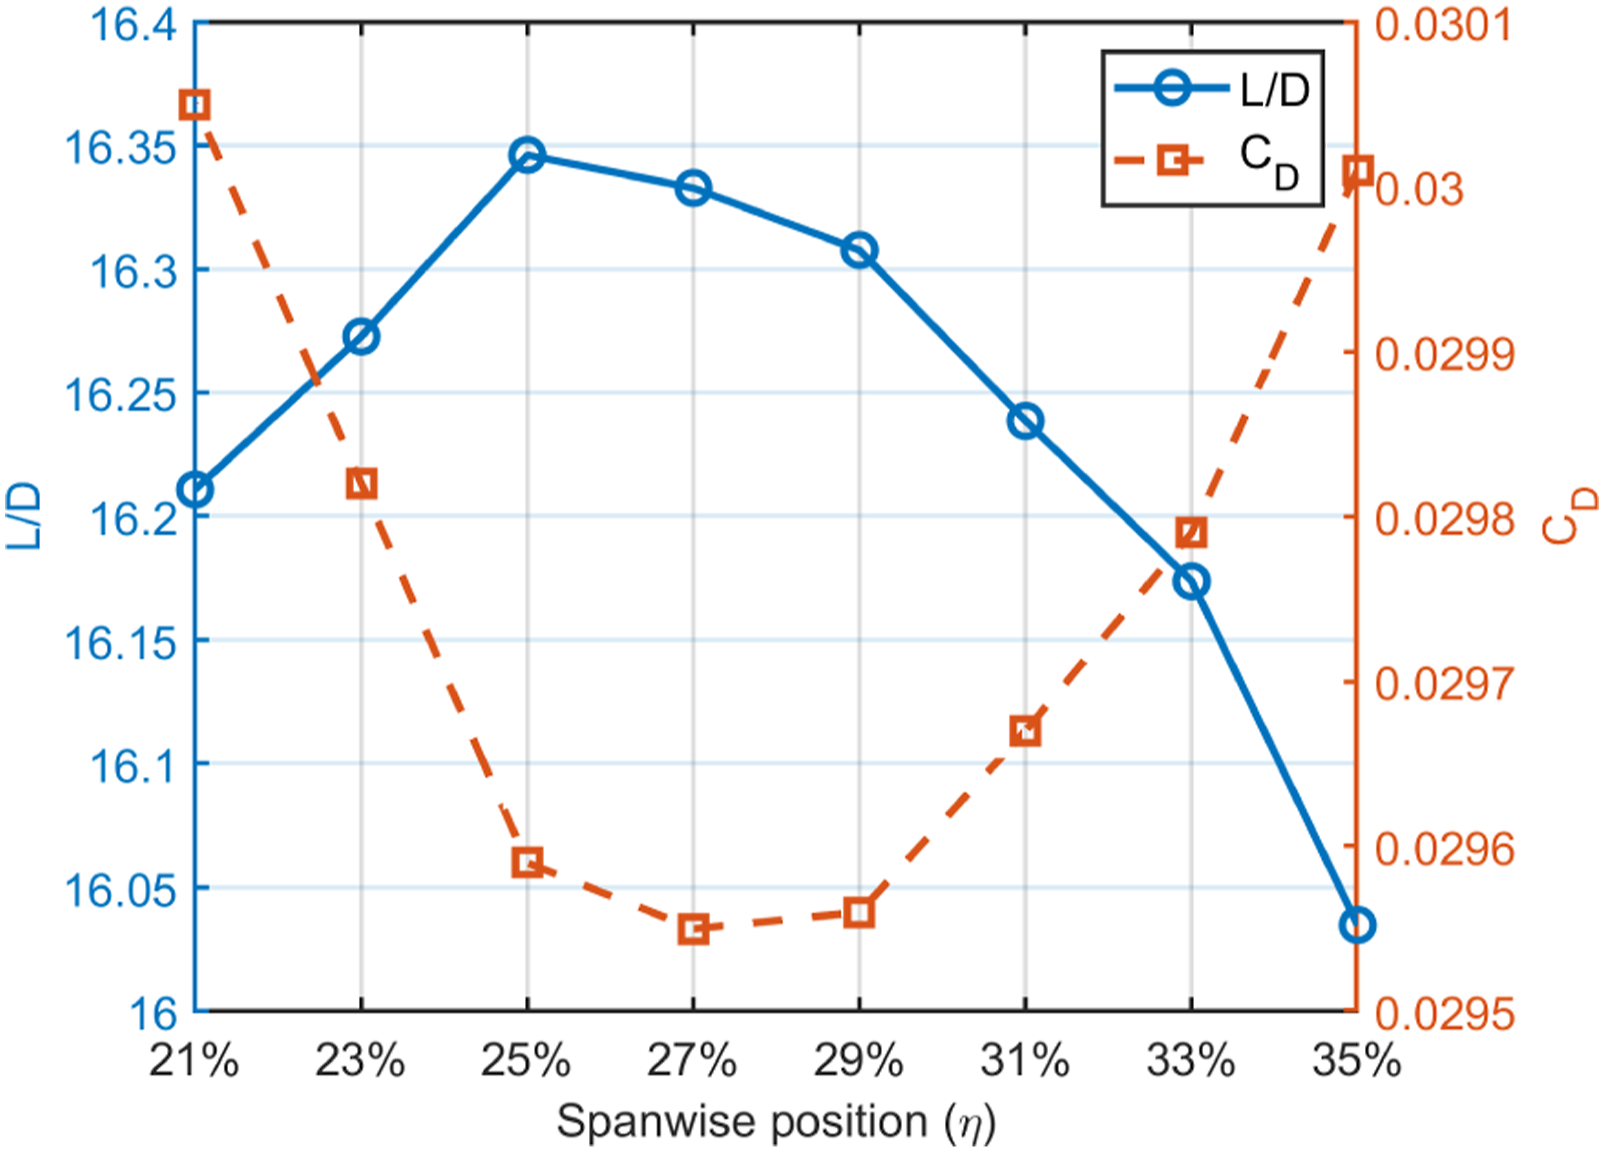
Figure 10 gives the wing section lift coefficient when the nacelle is installed at different spanwise positions. The change of spanwise installation position of nacelle can significantly alter the lift spanwise distribution, especially in the outboard wing area. Increasing the nacelle spanwise position causes smaller lift at most wing sections. The difference in lift between different configurations reaches the maximum value at 39% wing section, about 0.0368, and then decreases as the section approaches the wingtip. Wing section lift coefficient with nacelle installed at different spanwise positions.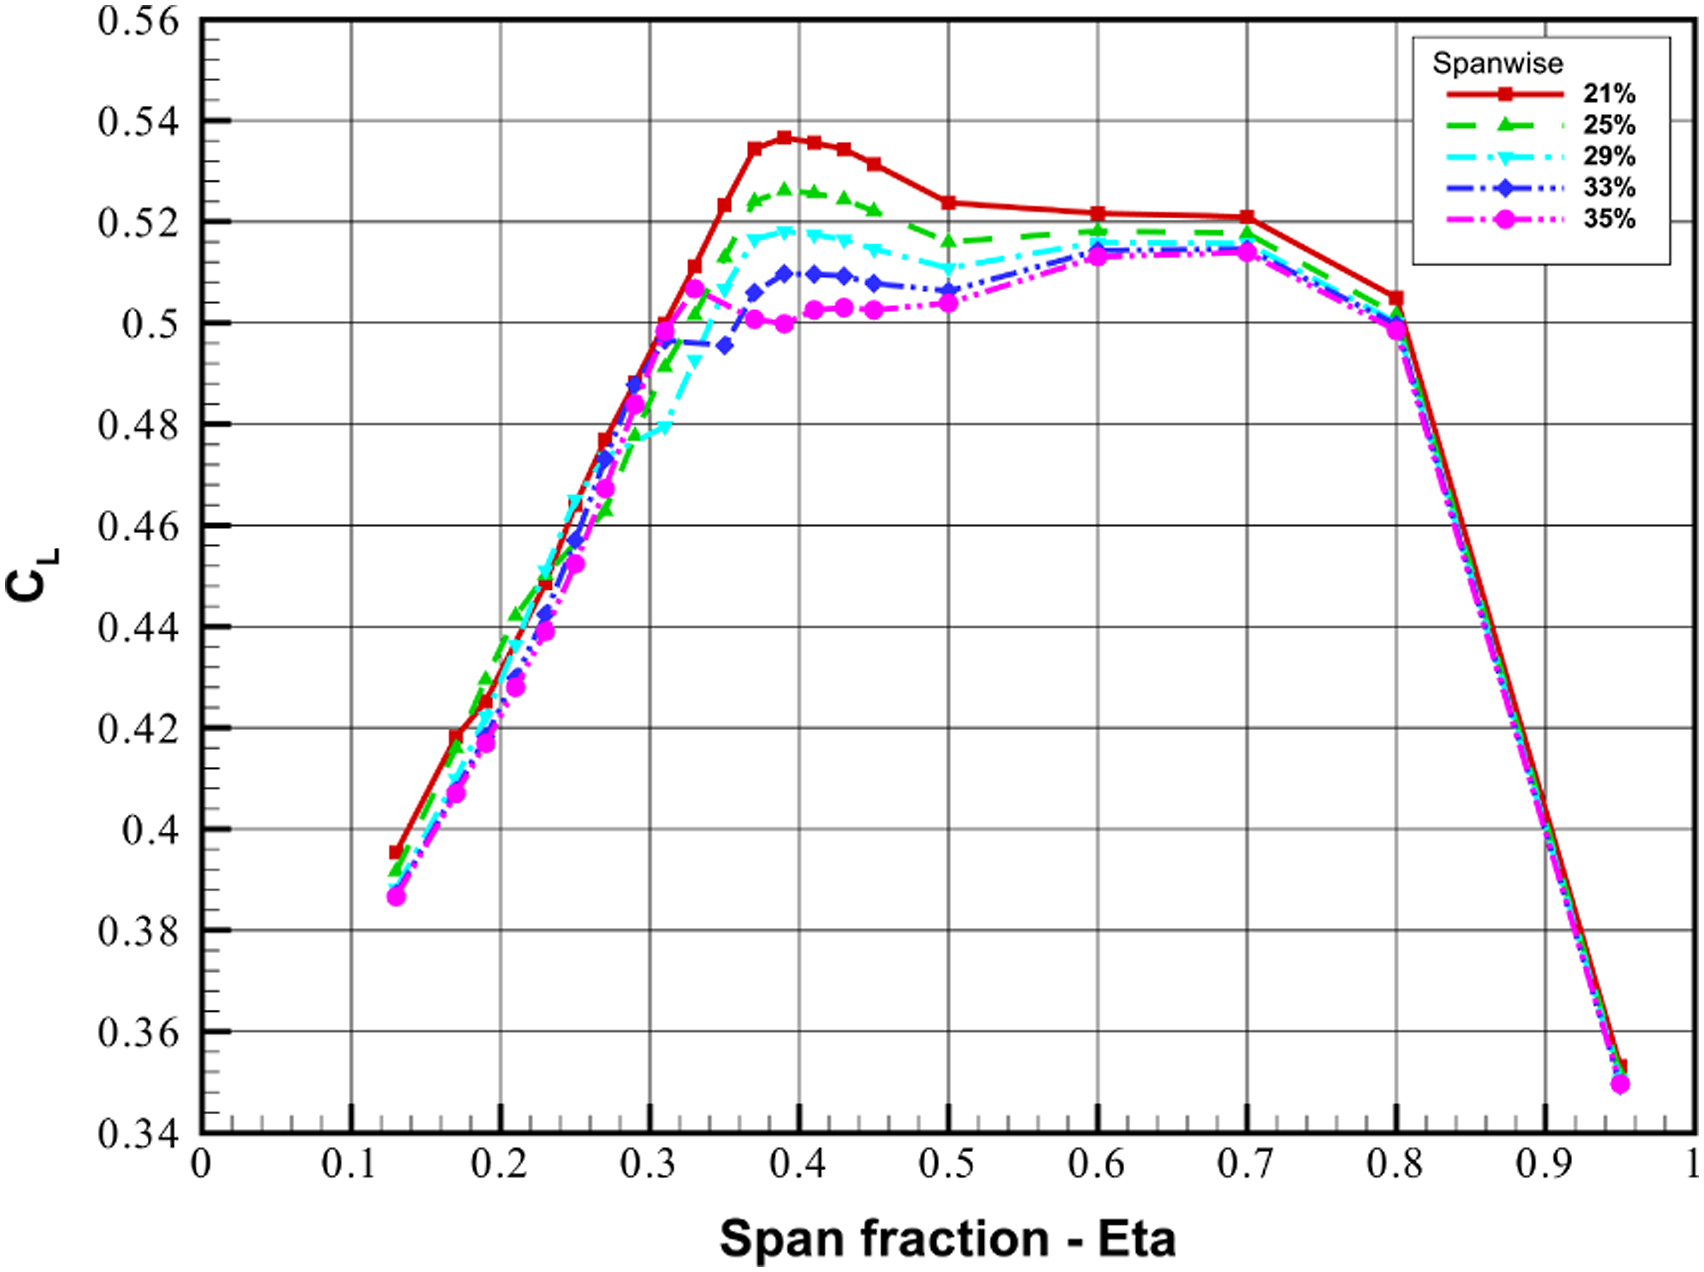
Figure 11 shows the nacelle intake performances with nacelle installed at different spanwise positions. As the nacelle moves from the wing-root to the wingtip, the changes of nacelle intake performances are extremely complex. The PR changes slightly while the variations of total pressure distortion are more obvious, especially the IDC and the DC (60). The configuration with nacelle installed at 27% spanwise position has the largest circumferential total pressure distortion and smallest pressure recovery, indicating that better aerodynamic performance does not necessarily correspond to the best nacelle intake performance. Nacelle intake performances with nacelle installed at different spanwise positions.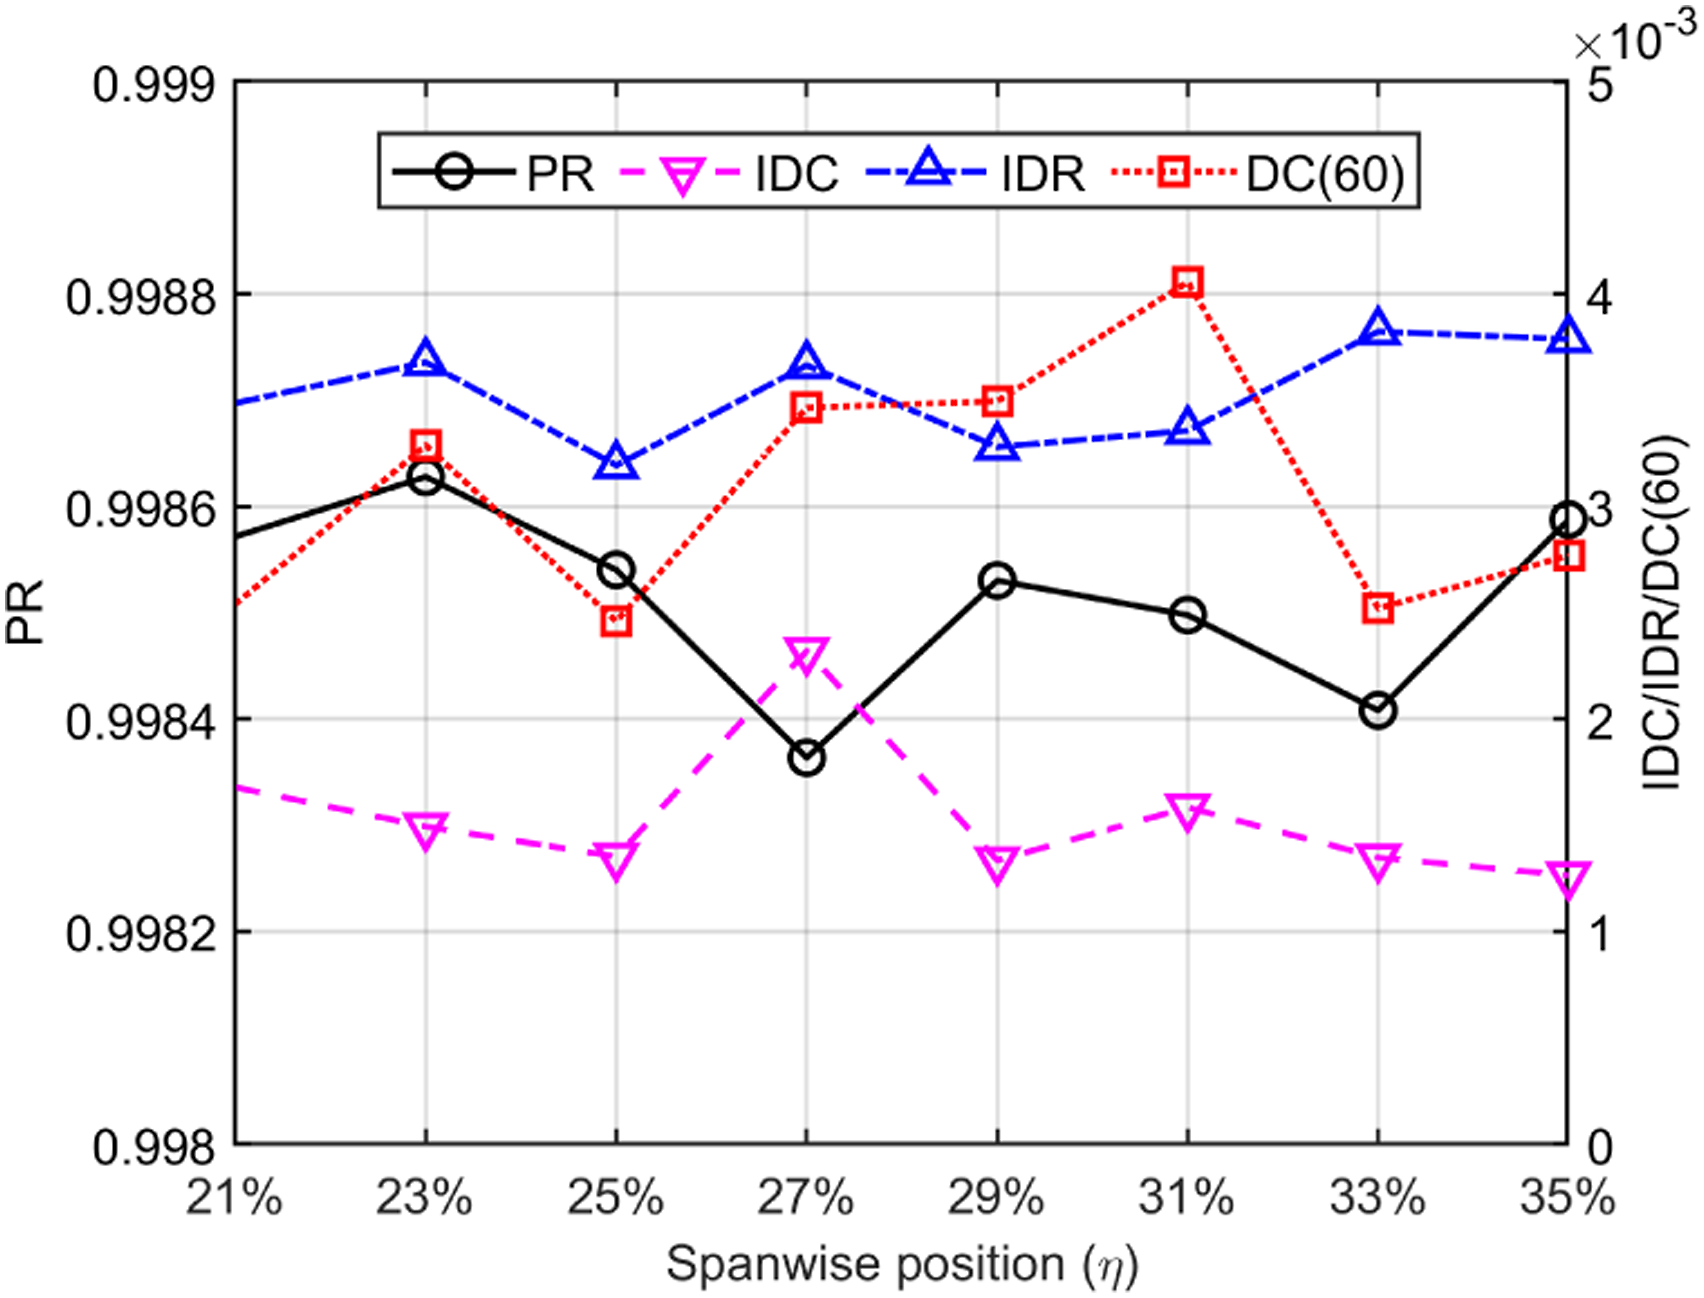
Based on the above analysis, it is considered that the nacelle can be properly placed close to the wing-root. However, in addition to aerodynamics and air intake performance, the determination of nacelle spanwise position is limited by many other factors. The wing-root bending moment in flight is smaller when the engine is located outboard, which is beneficial to weight reduction, but the requirement of ground taxiing state is just the opposite. Due to the wing sweep angle and reverse angle, the nacelle spanwise position also has great influence on the gravity center of the whole aircraft and the layout of flap and aileron. And spanwise position must also consider passenger door escape slide, loading ramps, suction and blowing zones, and nose gear water spray cone.
Penetration
As shown in Table 3, eight nacelle penetrations are studied. The configurations with different penetrations are obtained by changing the pylon geometry and the nacelle is just translated horizontally. As illustrated in Figure 12, with the increase of penetration, that is, the nacelle is moved downstream, the drag of the whole aircraft significantly decreases and the lift-drag ratio increases. Lift-drag ratio and drag coefficient under different penetrations.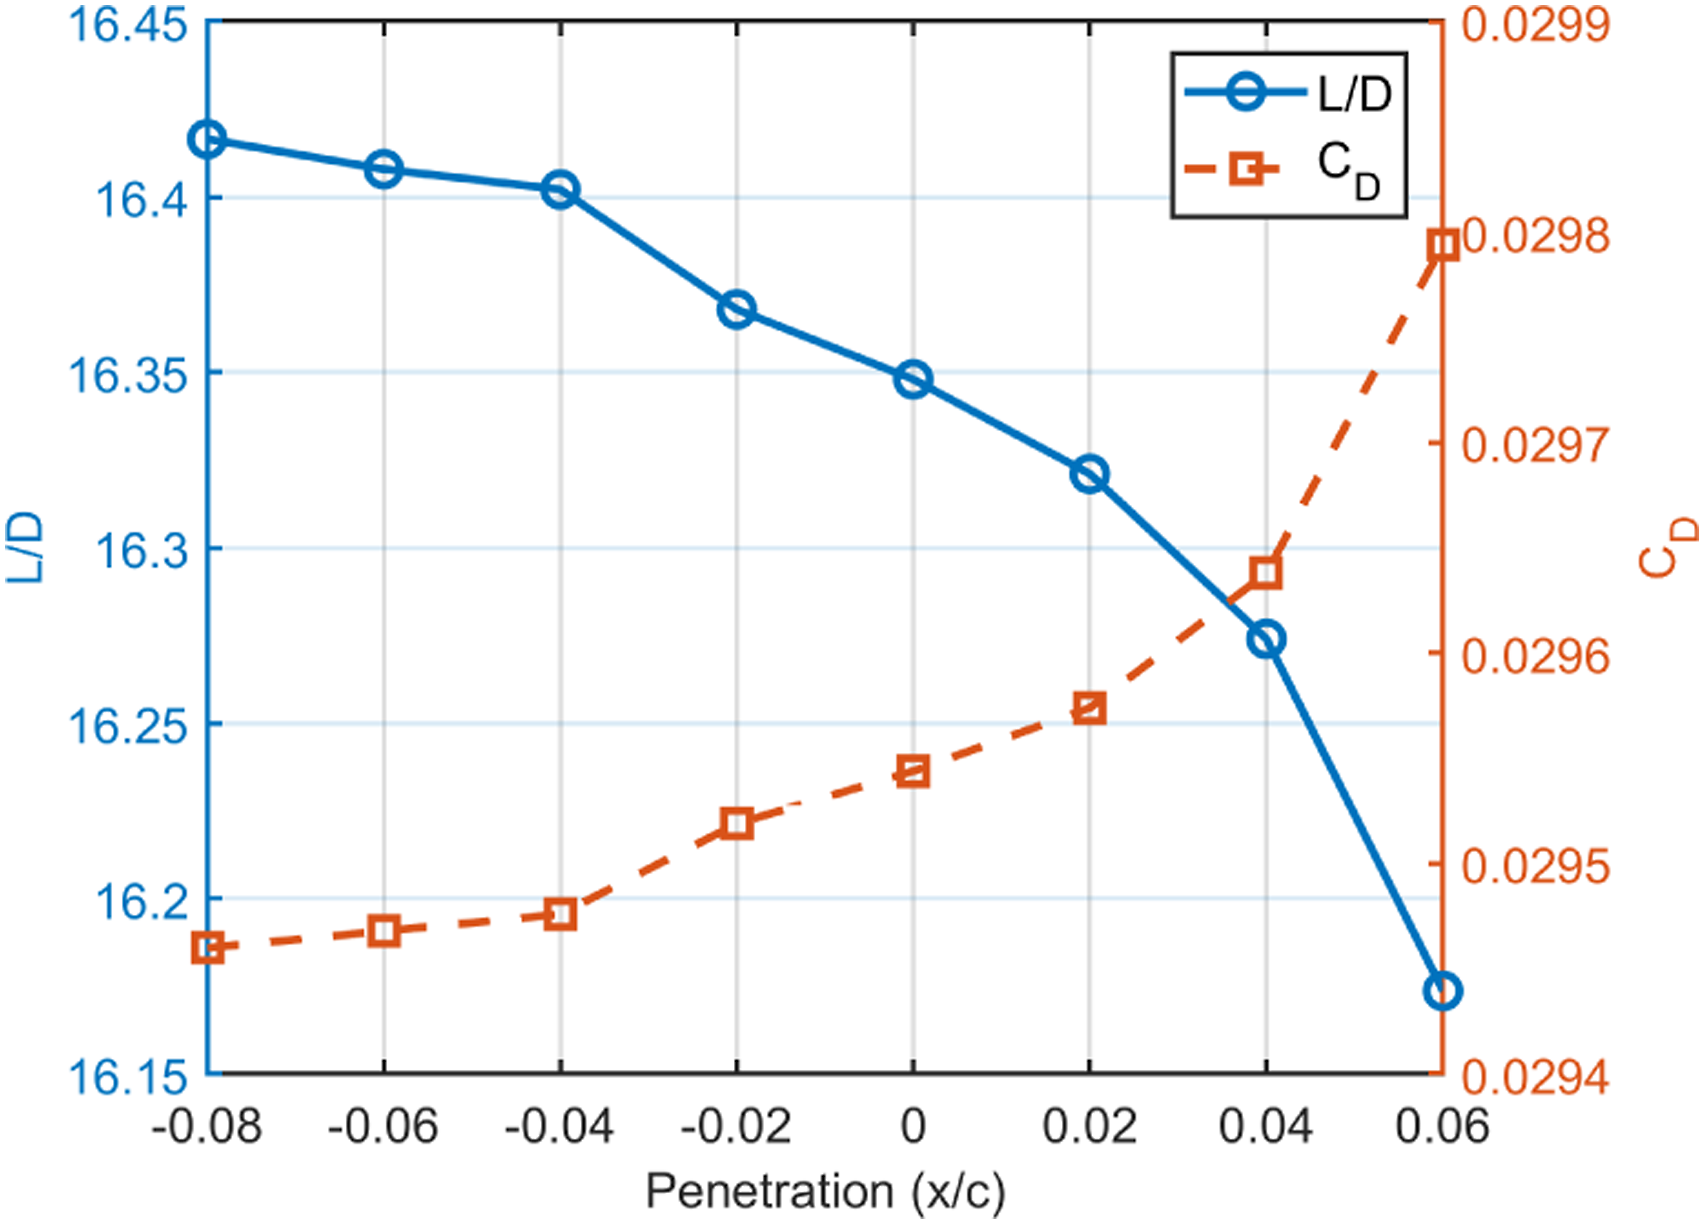
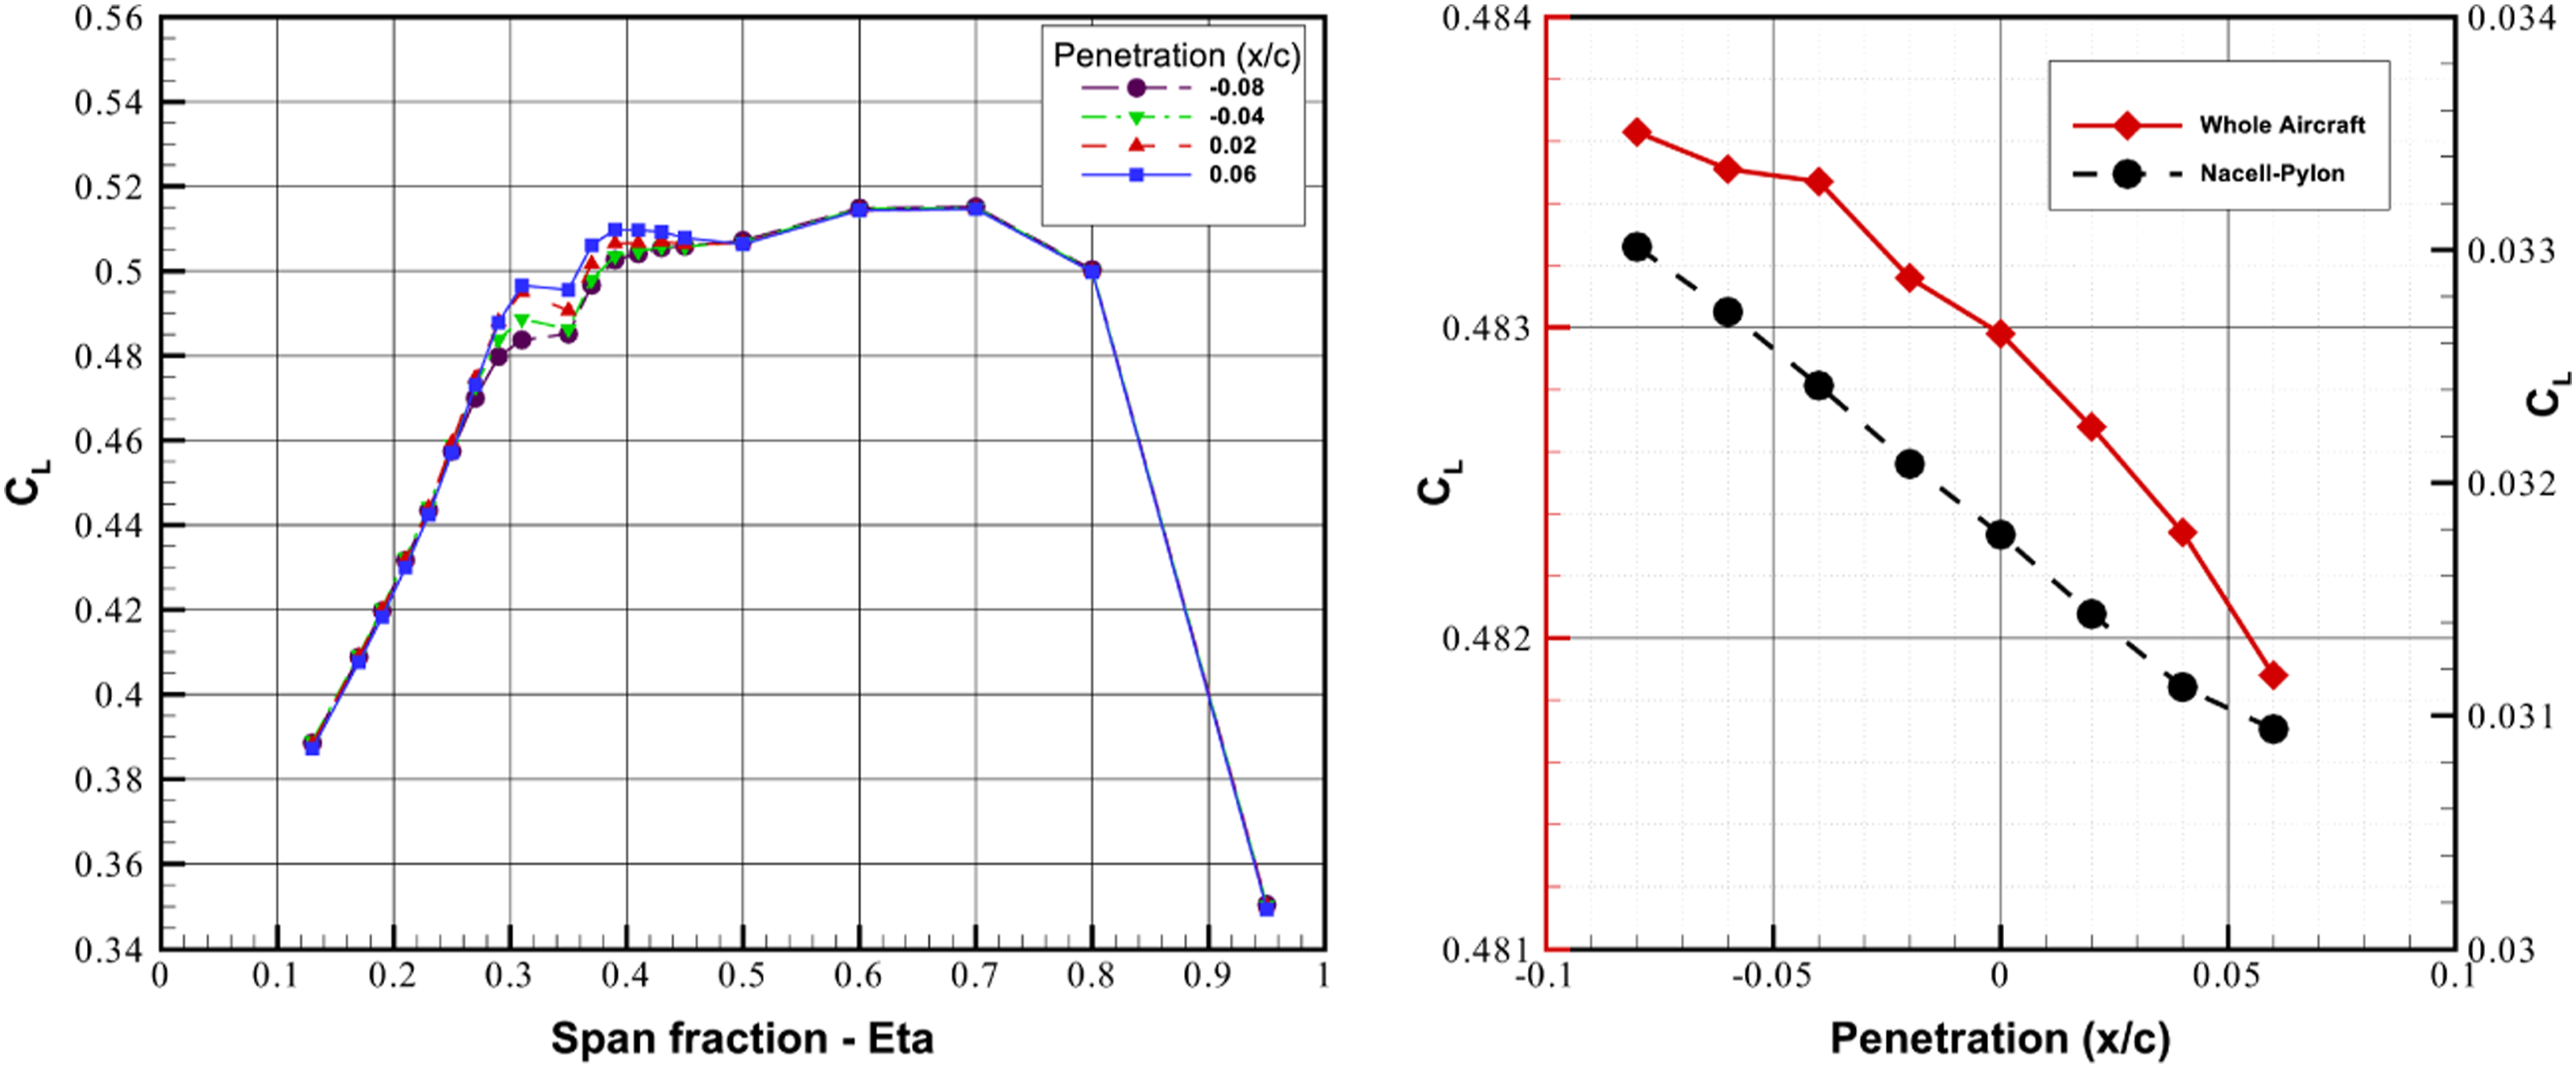
Figure 13 shows the pressure distributions of wing sections inboard and outboard of the nacelle under different penetrations. The inboard lower wing surface is dominated by adverse interference effects, whereas other wing areas are little affected. With the increase of penetration, the pressure is decreased, resulting in lift loss, especially up to 20% chord on the lower surface. This is because the downstream movement of nacelle (overlapping the nacelle and wing) reduces the airflow channel formed by wing-pylon-nacelle, considerably accelerating the flow at the inboard wing section. And reduced airflow channel leads to aggravation of interference effects, causing drag penalty. In contrast, at larger chord position (20%–60%), larger penetration results in reduction of flow acceleration on wing lower surface, followed by greater pressure corresponding to increased lift. Such chordwise pressure distribution characteristics under different penetrations eventually cause decreased wing section lift with the upstream movement of nacelle, as shown in Figure 14. And penetration only affects the wing section lift in the range of spanwise 25%–50%. The wing section lifts under different penetrations are almost identical in other wing areas. In fact, at the wing section of spanwise 36%, the differences in wing pressure distribution between different penetrations are relatively small as shown in Figure 13. However, it can be clearly seen in Figure 14 that the lift of whole aircraft is reduced as the penetration increases. This is attributed to the decrease of nacelle lift. In addition, the influences of penetration on pressure distribution are obviously weakened as it decreases. The reduction of this influence is reflected in the almost the same drag and lift-drag ratio under small penetrations in Figure 12, implying that moving the nacelle upstream further has little effect on the aerodynamic performance. Pressure distributions of wing sections under different penetrations. Lift of whole aircraft and spanwise lift distribution under different penetrations.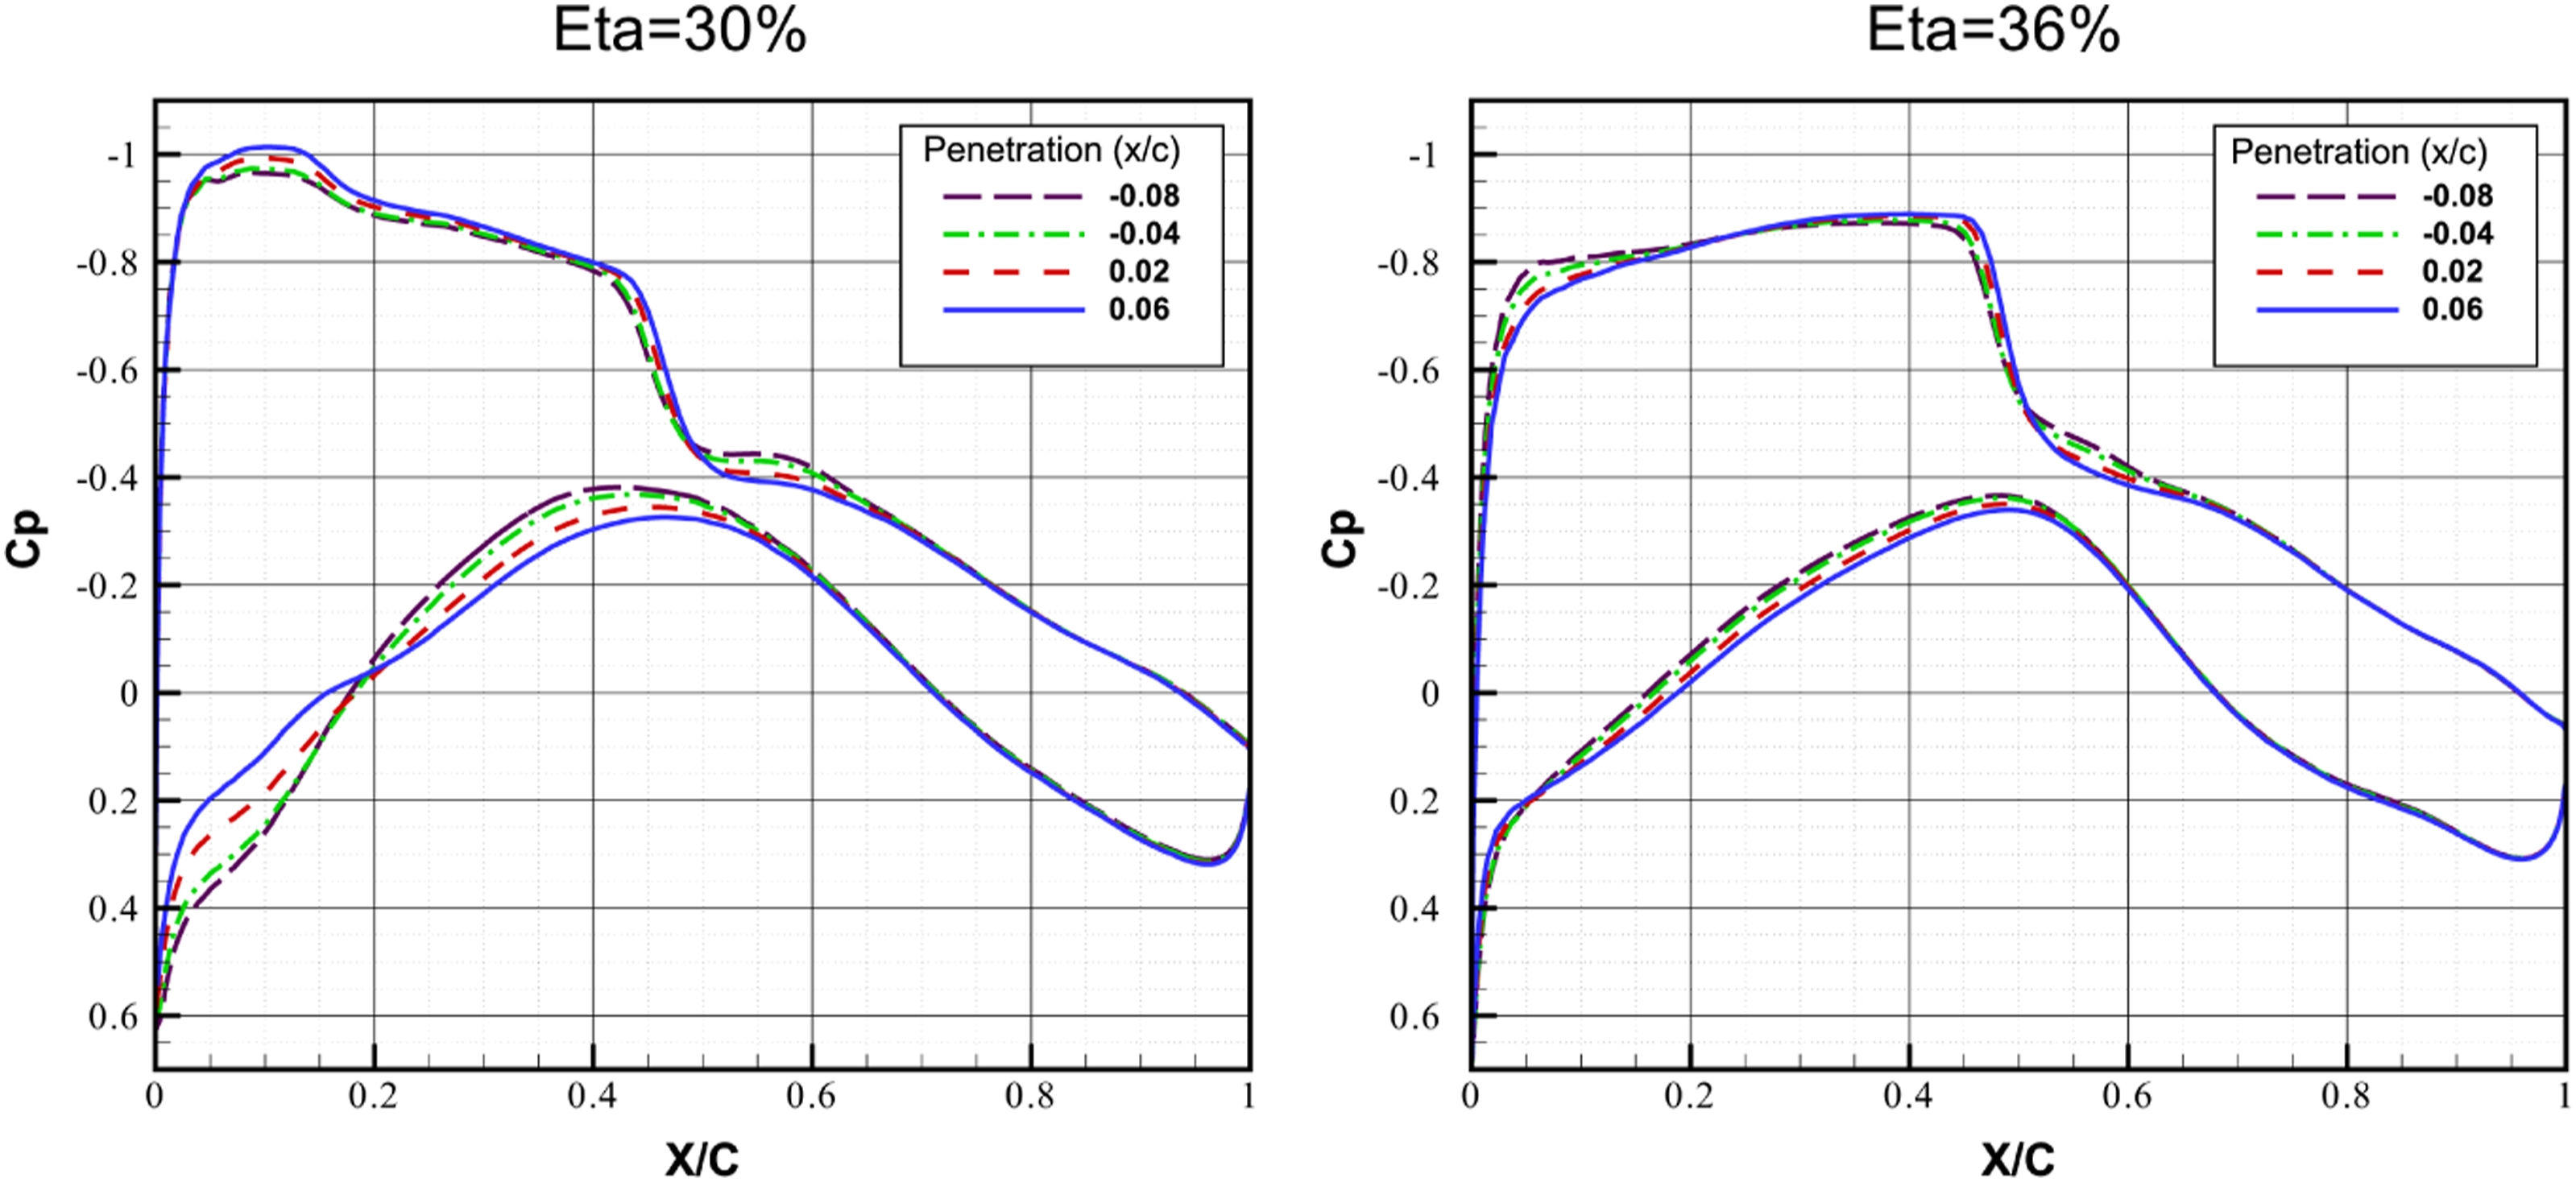
The nacelle intake performances under different penetrations are shown in Figure 15. It can be seen that the influence of penetration on the nacelle intake performance is relatively insignificant. When the penetration is greater than 0.02, the PR is smaller and airflow distortion is larger. Therefore, overlapping of the nacelle and wing is unfavorable to the intake performance. Nacelle intake performance under different penetrations.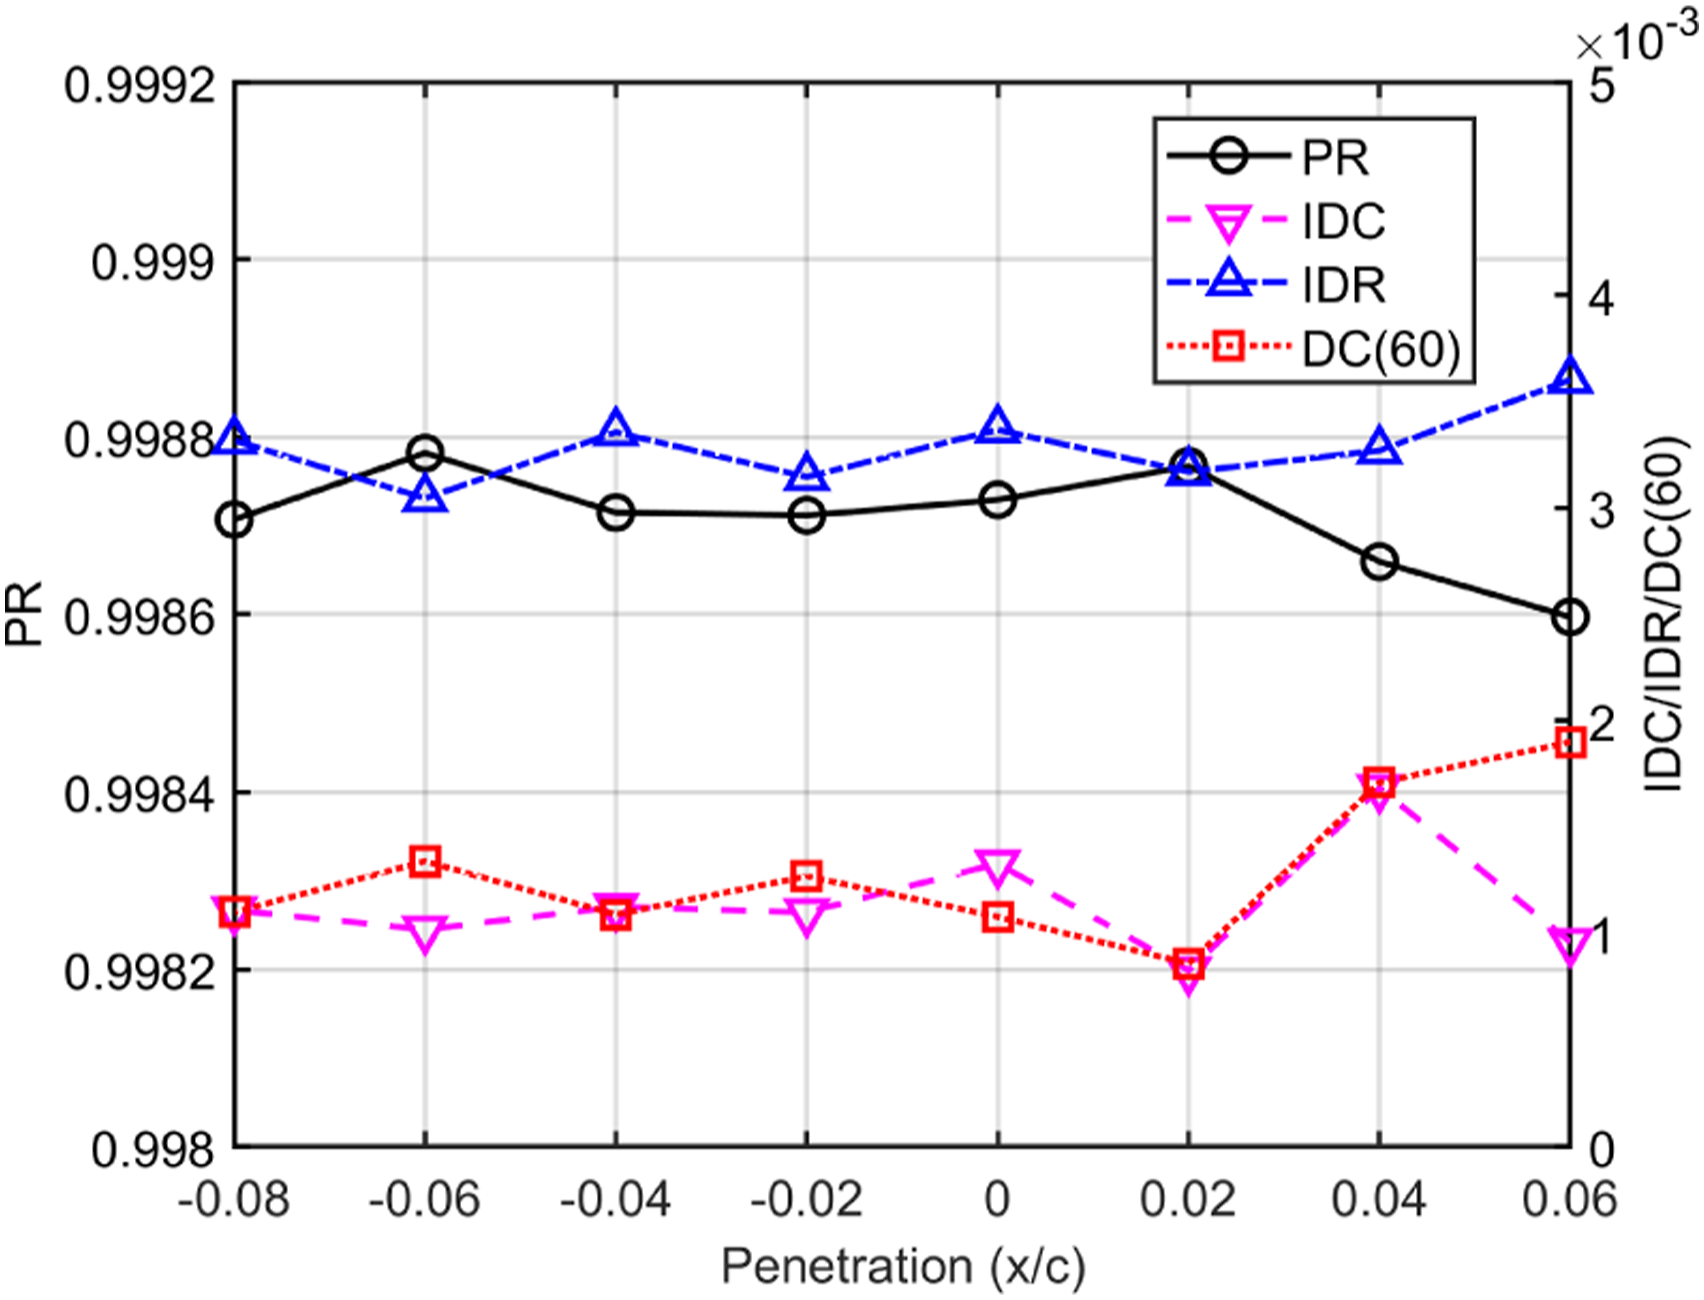
In conclusion, the penetration has more pronounced influences on the inboard wing area and the interference effects are flow acceleration on the lower wing surface. The outboard wing area and nacelle intake performance are little affected. With respect to design considerations, keeping the engine pod away from the wing properly is an effective means to reduce the adverse engine-airframe interference. Excessive horizontal distance can hardly improve aerodynamic and intake performance, but it will have a great impact on wing aeroelastic response and structural elements sizing.
Gully depth
Simulations of seven configurations with different nacelle gully depths, as shown in Table 3, are carried out. The configuration with different gully depths is obtained by changing the pylon geometry and nacelle is just translated vertically. As one can see from the Figure 16, the increase of gully depth reduces the drag. However, the lift-drag ratio reaches peak when the gully depth is 0.14, implying that the larger gully depth causes reduction in the lift. Figure 17 shows wing section lift under different gully depths. Compared with penetration, the influence of gully depth on lift is greater, and the affected wing area is larger. In general, the configuration with larger gully depth has smaller lift at most wing sections, especially at the inboard wing section near the nacelle. Lift-drag ratio and drag coefficient with the nacelle installed at different gully depths. Wing section lift coefficient under different gully depths.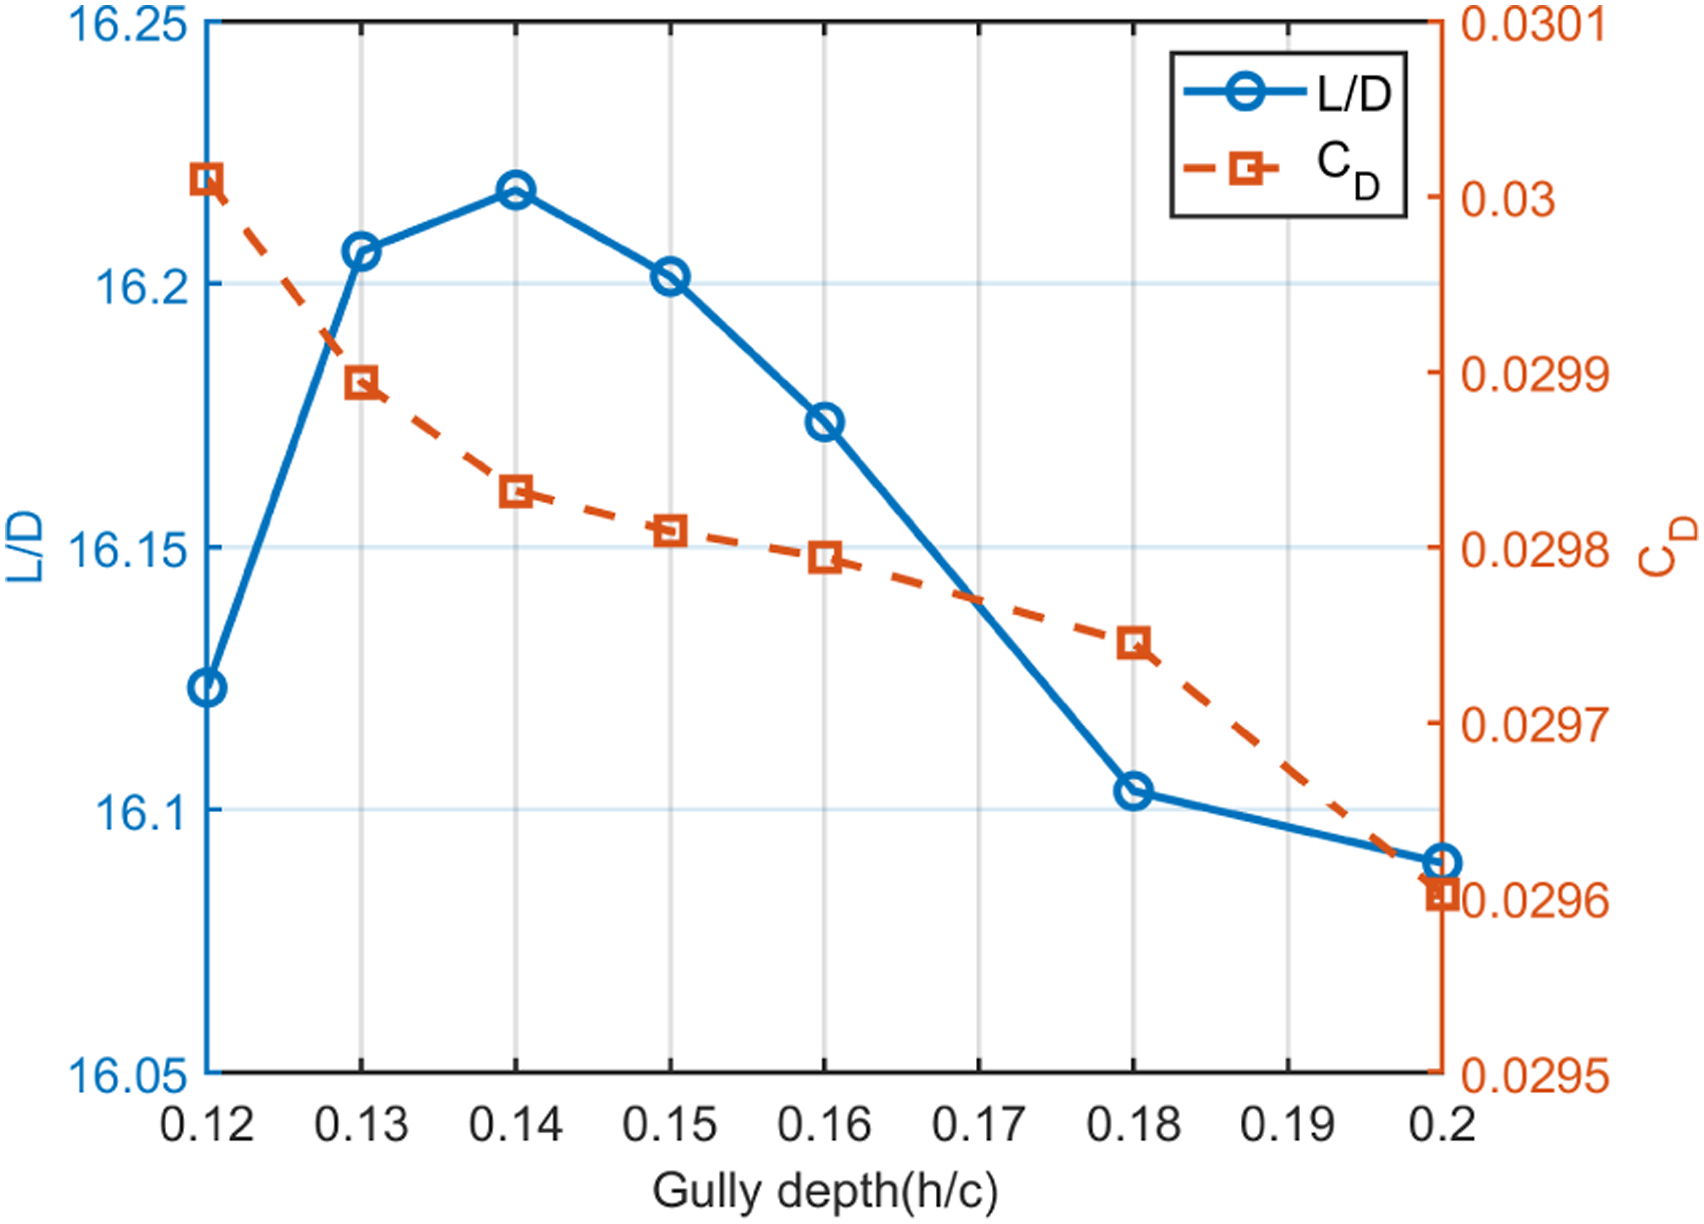
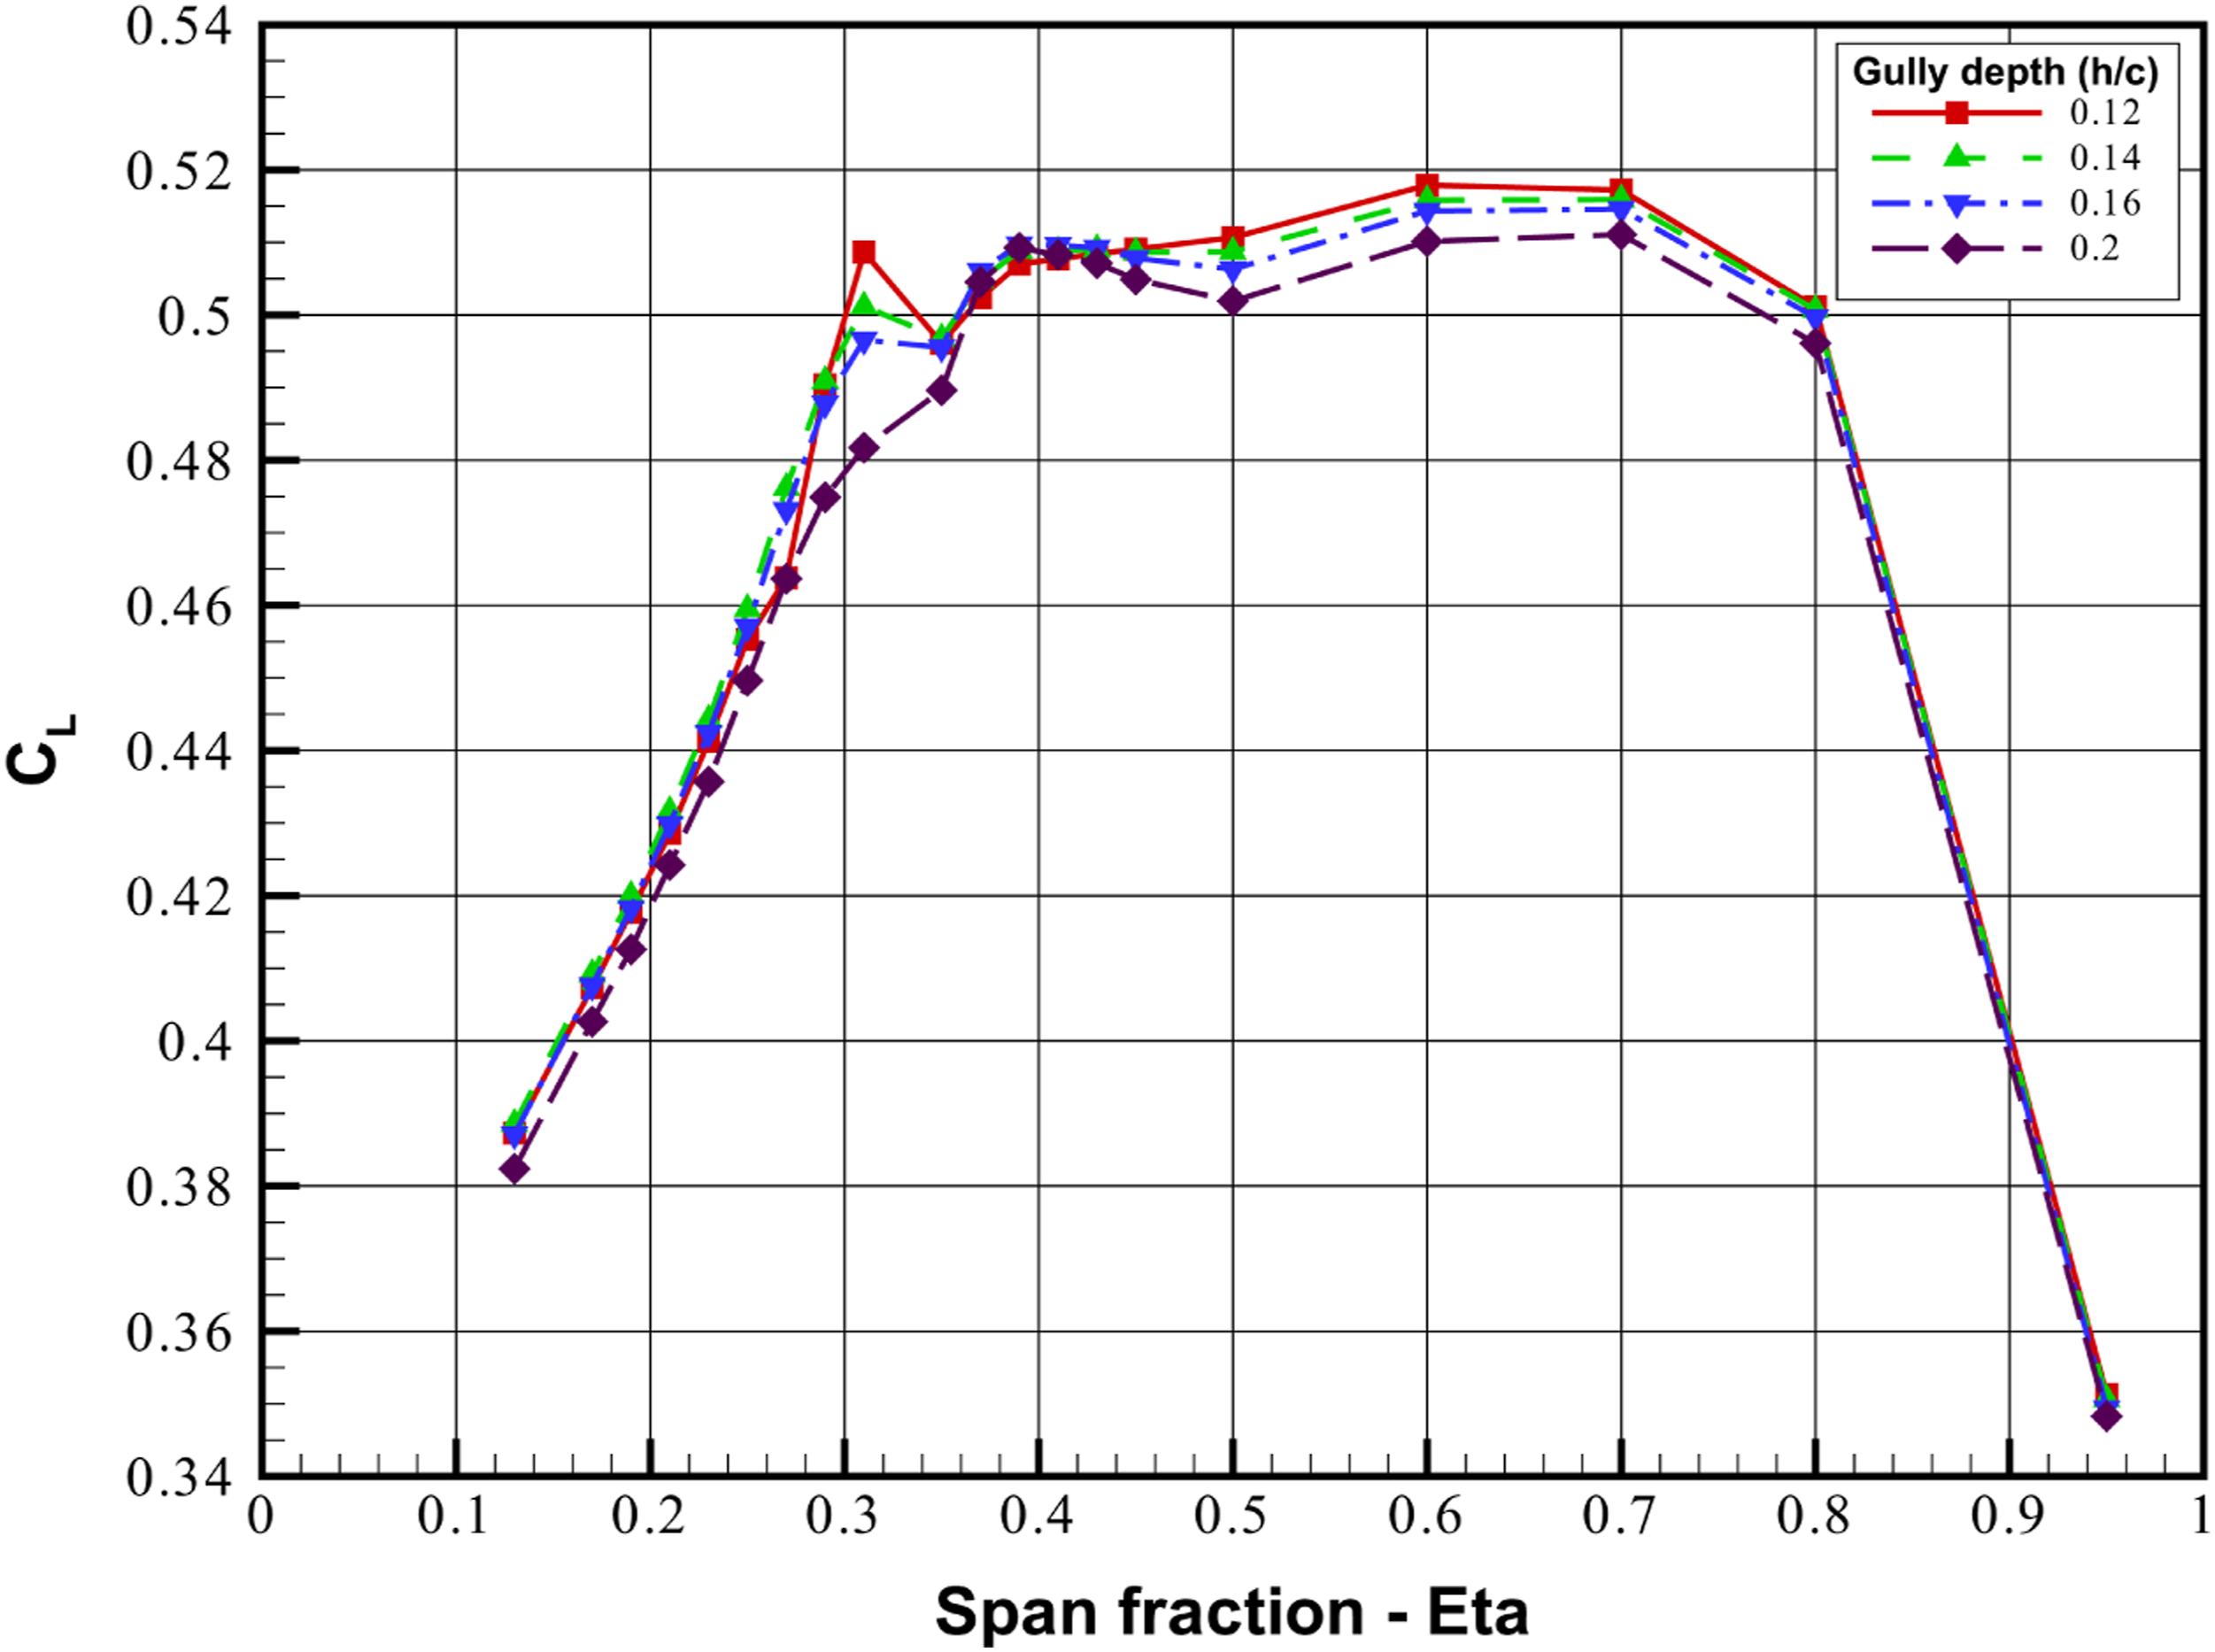
In order to explore the cause of such lift distribution, the pressure distributions of wing sections under different gully depth configurations are derived and shown in Figure 18. Gully depth significantly affects the wing pressure distribution and the effects on the upper and lower wing side are contrary. At inboard of the nacelle, the reduction of gully depth causes smaller pressure near the leading edge. This is mainly because when the nacelle is closer to the wing, the interference between the wing-pylon-nacelle is significantly enhanced, causing an increase in airflow velocity as shown in Figure 19. This flow acceleration phenomenon is obvious at inboard wing sections near the nacelle. In this region, when the vertical distance is too small, the airflow velocity is so high that another strong shock is generated near the leading edge on the upper surface. The appearance of two shock patterns can significantly increase the drag, as shown in Figure 16. In addition, reducing gully depth also causes a progressive upstream movement of shock located in the middle of upper surface, indicating that the nacelle has more interference with the wing. The combination of these two factors leads to a lift loss on wing suction side. In contrast, small gully depth causes reduction of flow acceleration and hence increased pressure level on the lower wing side, corresponding to an increase in lift. Similarly, at outboard wing section, the effects on upper and lower wing side are also contrary. The effects at the upper and lower surfaces are not compensated, and the more significant effects on lower wing surface makes the configuration with small gully depth have greater lift, as shown in Figure 17. Pressure distributions of wing sections under different gully depths. Ma number contour of slice at spanwise 30% under different gully depths.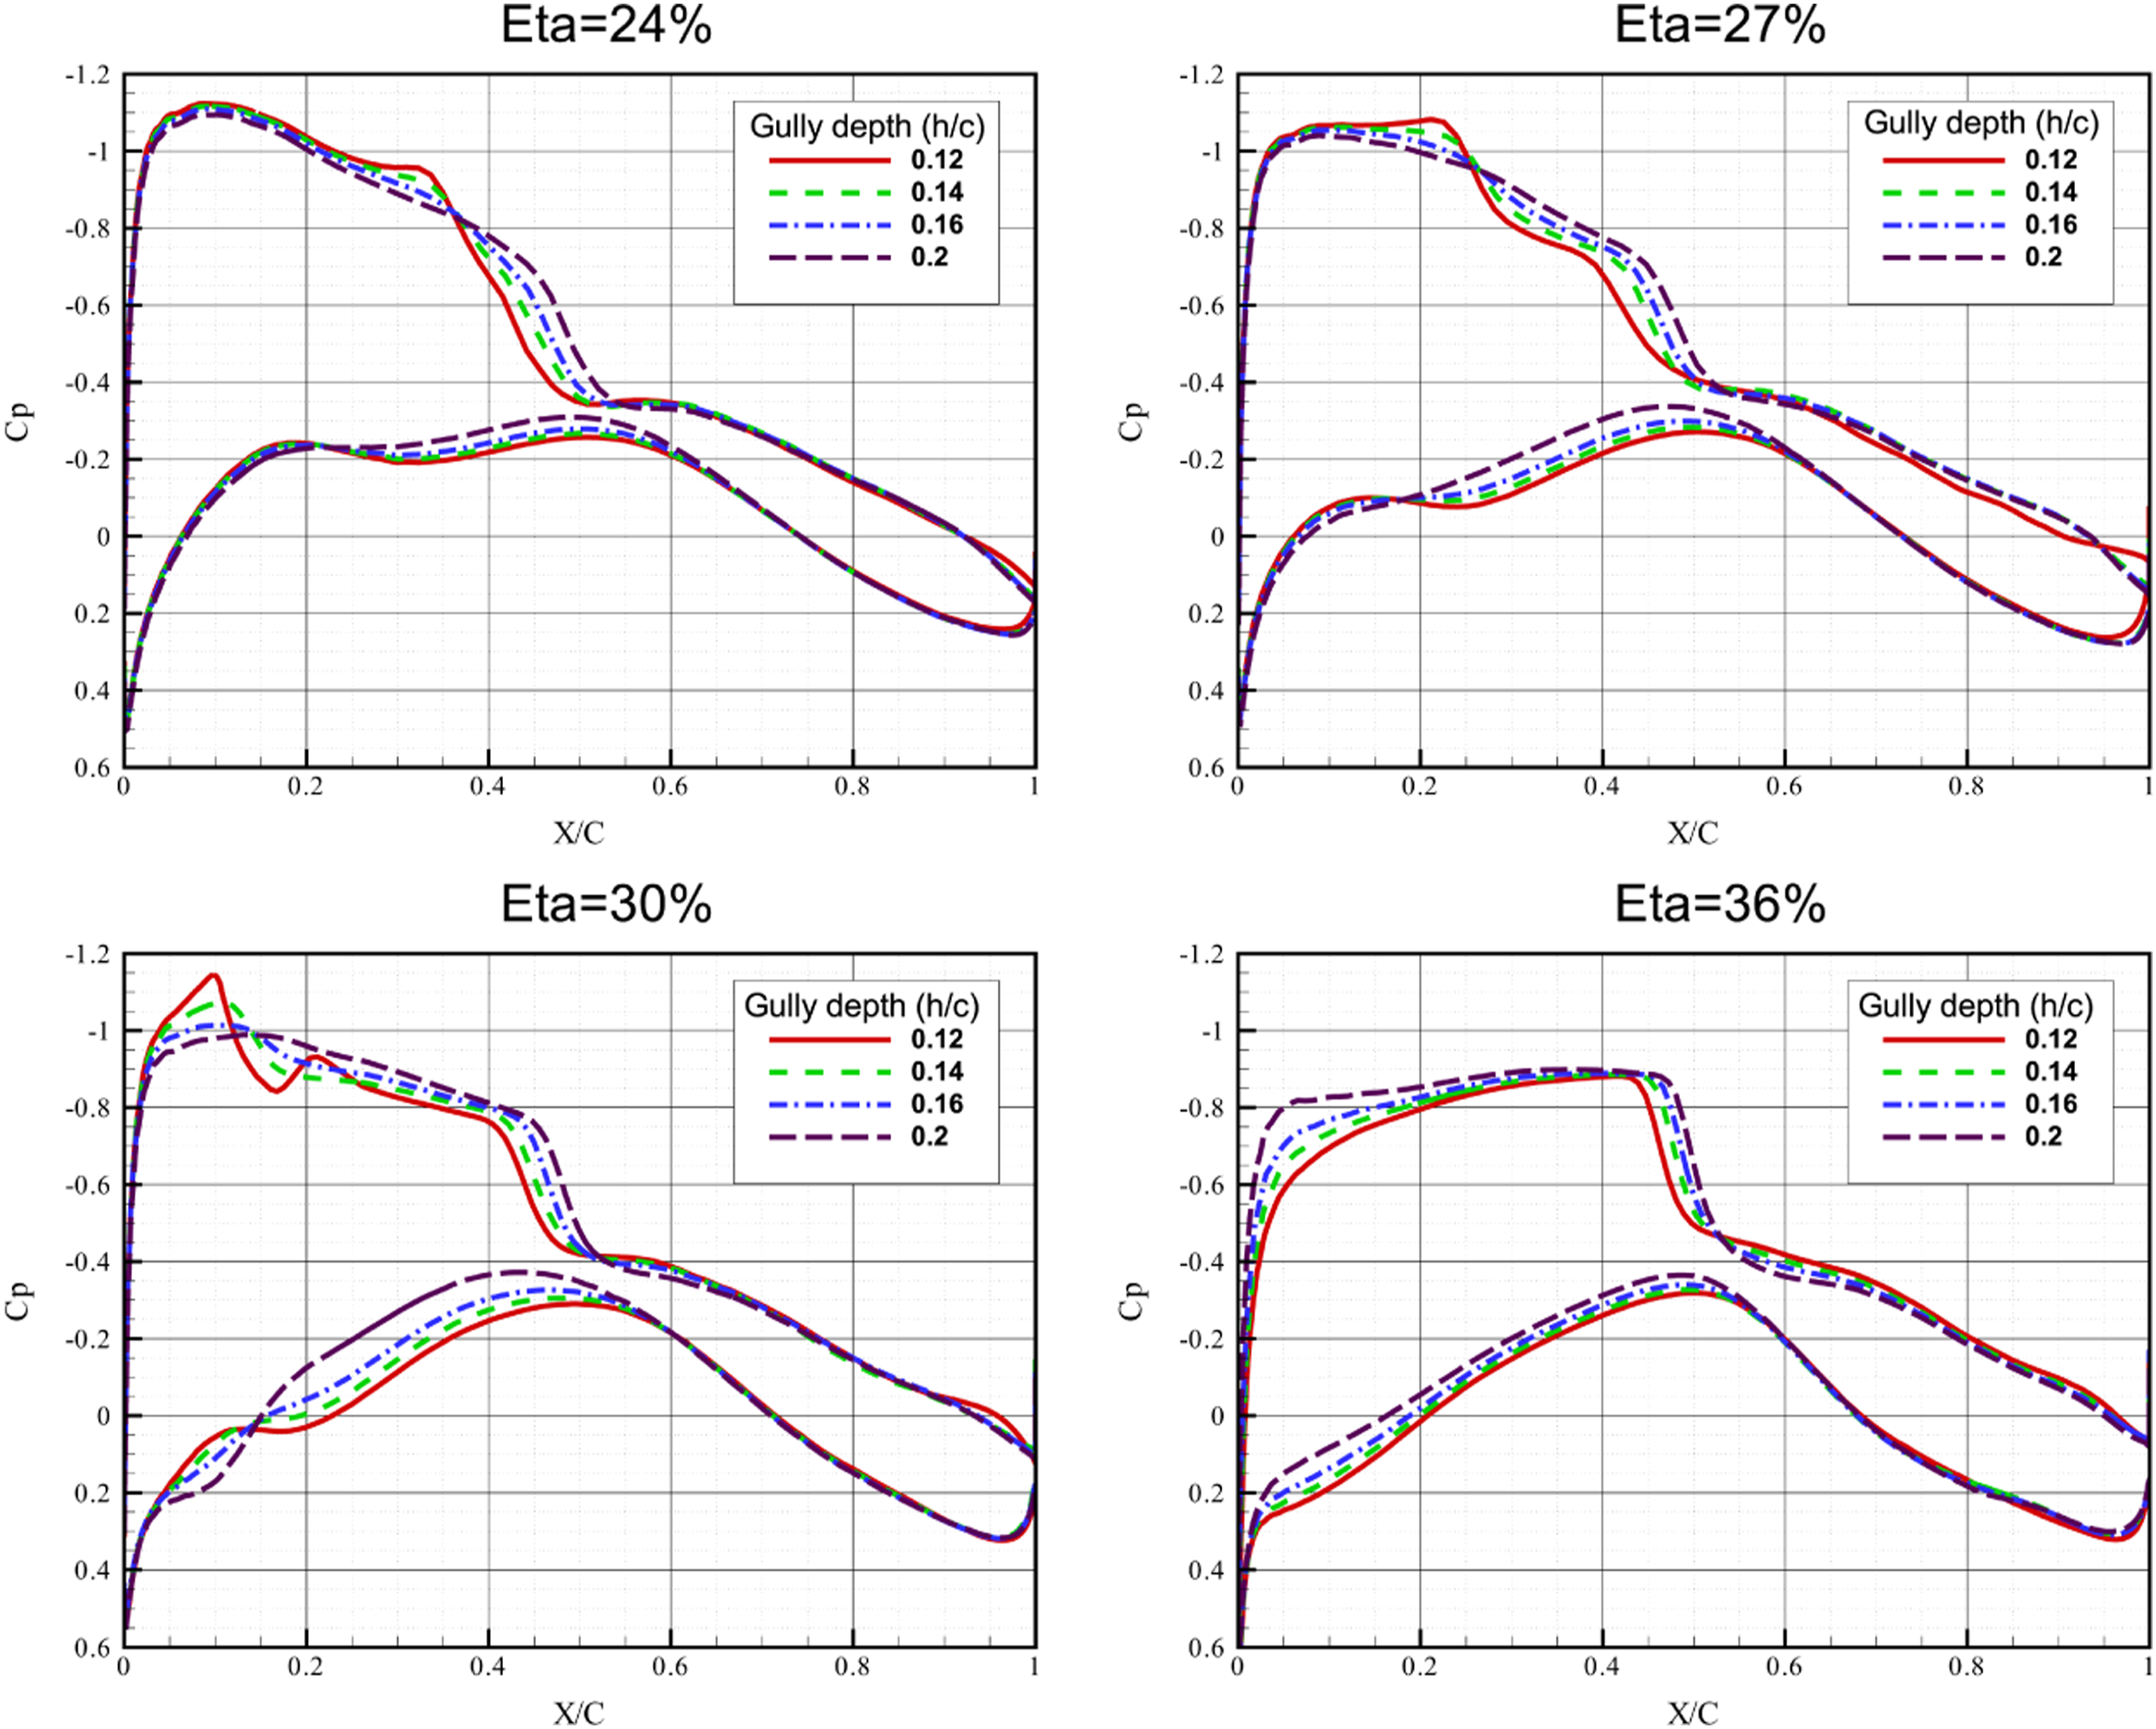
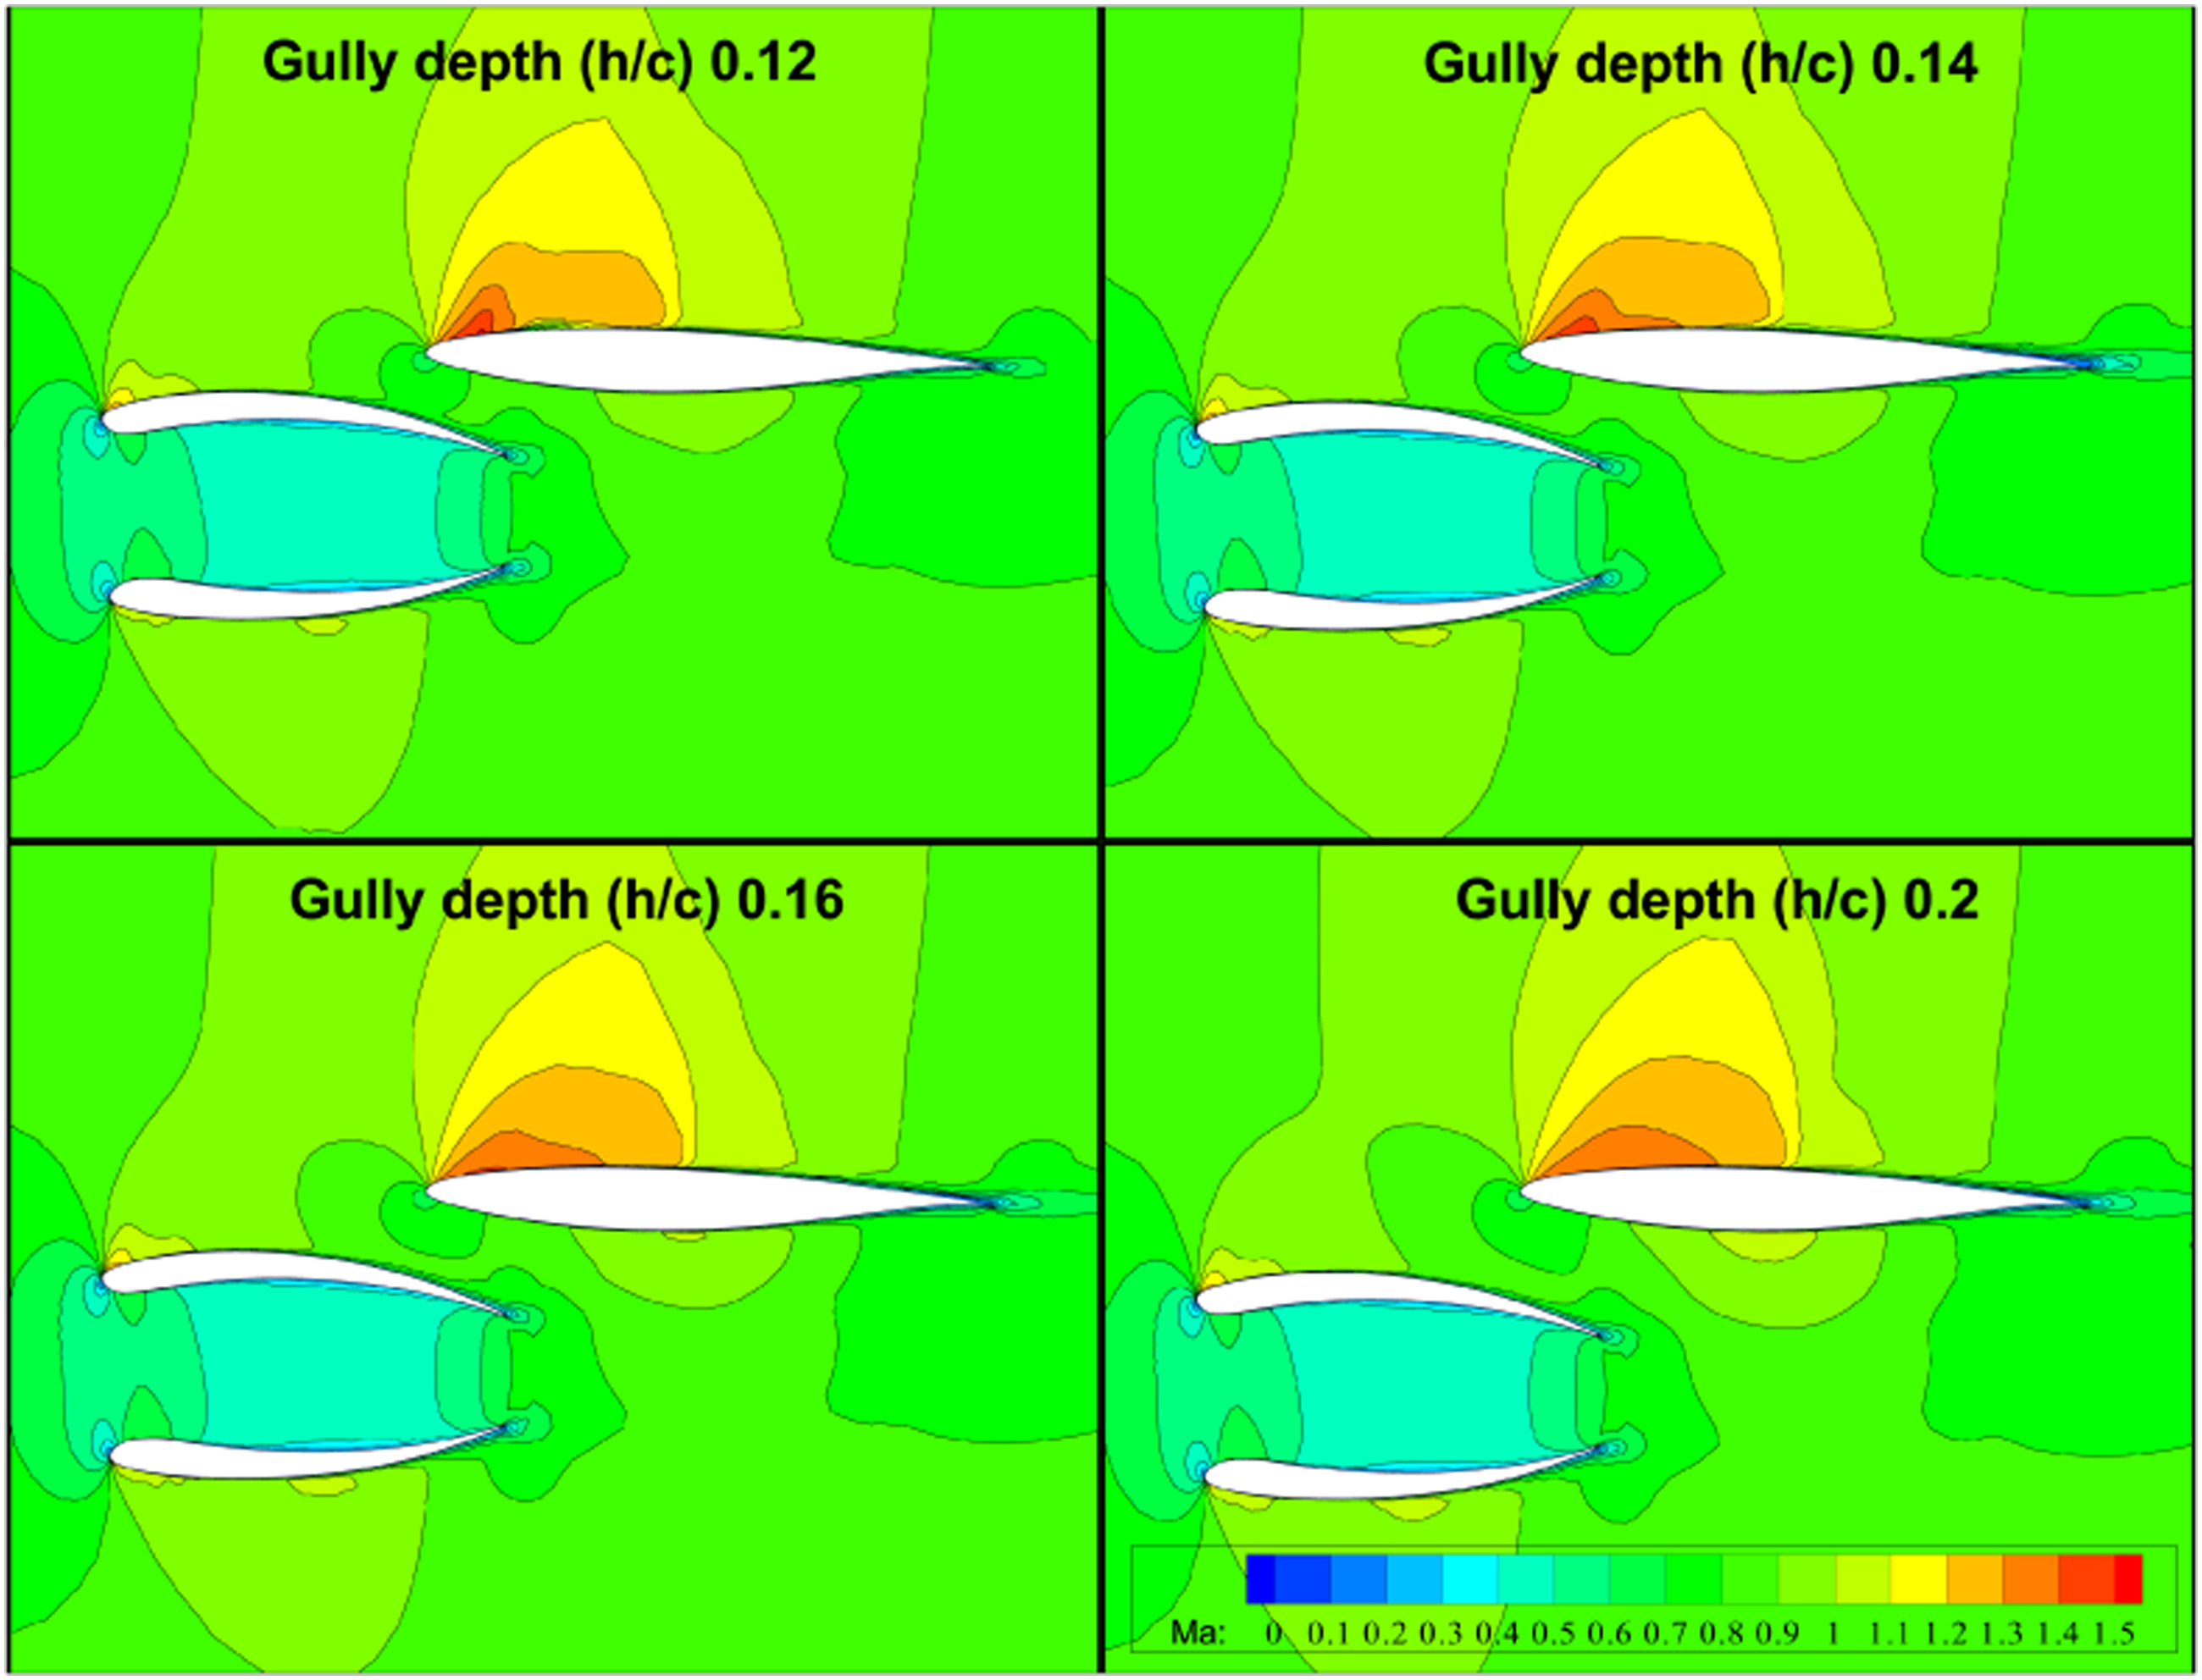
Figure 20 shows the nacelle intake performances with the nacelle installed at different gully depths. The nacelle intake performance is relatively less affected by the current gully depth. Therefore, when determining the gully depth of nacelle during the design process, the emphasis can be placed on its influence on other design parameters. Nacelle intake performances under different gully depths.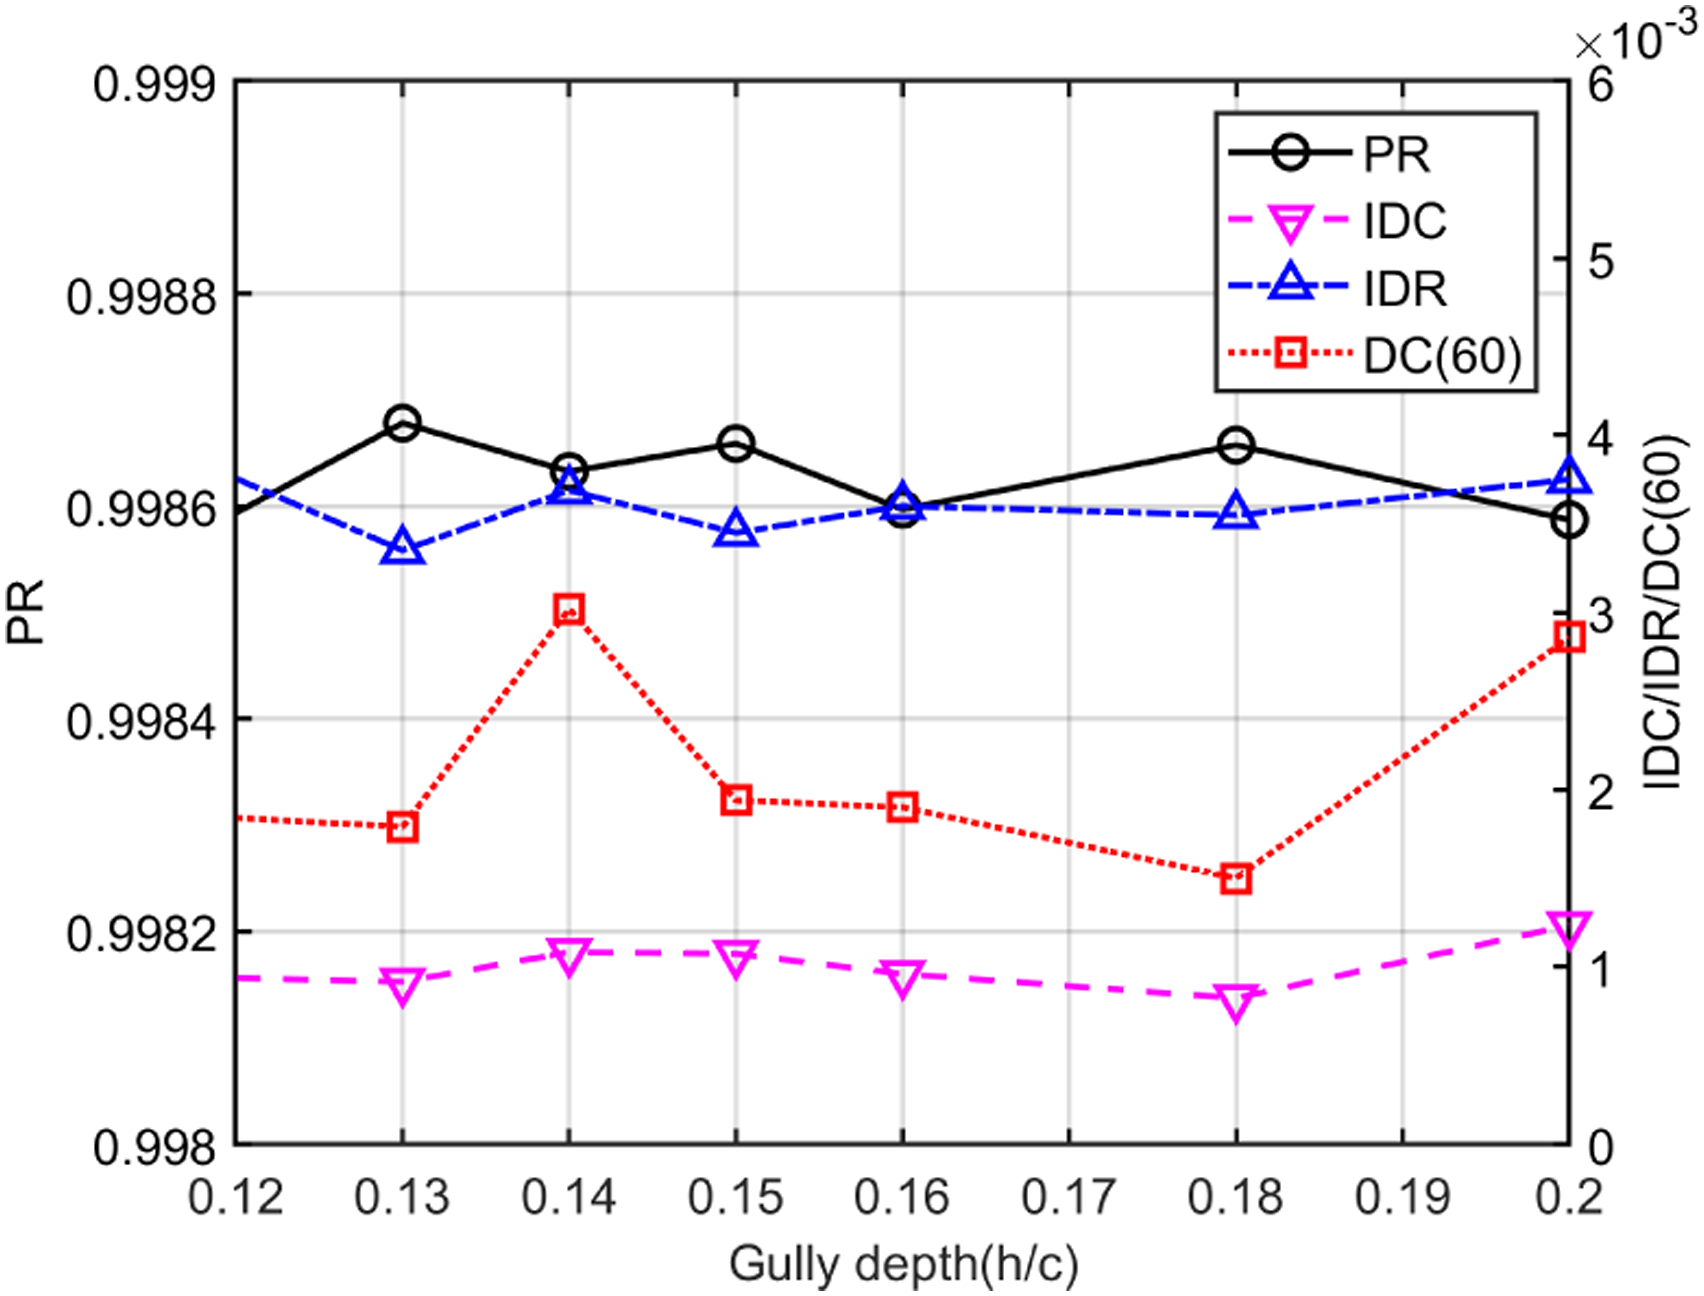
Based on the above analysis, an indication has been found that the configuration with gully depth in the range of 0.13-–0.15 has better lift-drag characteristics.
Pitch angle
Eight configurations for different pitch angles of nacelle installation are studied, as shown in Table 3. As indicated in Figure 21, the drag first decreases and then increases with the increase of pitch angle. The variation of lift-drag ratio is opposite. When the pitch angle is 0.42°, the drag is minimum and the lift-drag ratio is maximum. The drag is asymmetrical with respect to the pitch angle, and positive pitch angle causes smaller drag. However, the lift-drag ratio is generally symmetrical. Overall, a small magnitude of pitch angle is more beneficial to aerodynamic performance. Lift-drag ratio and drag coefficient under different pitch angles.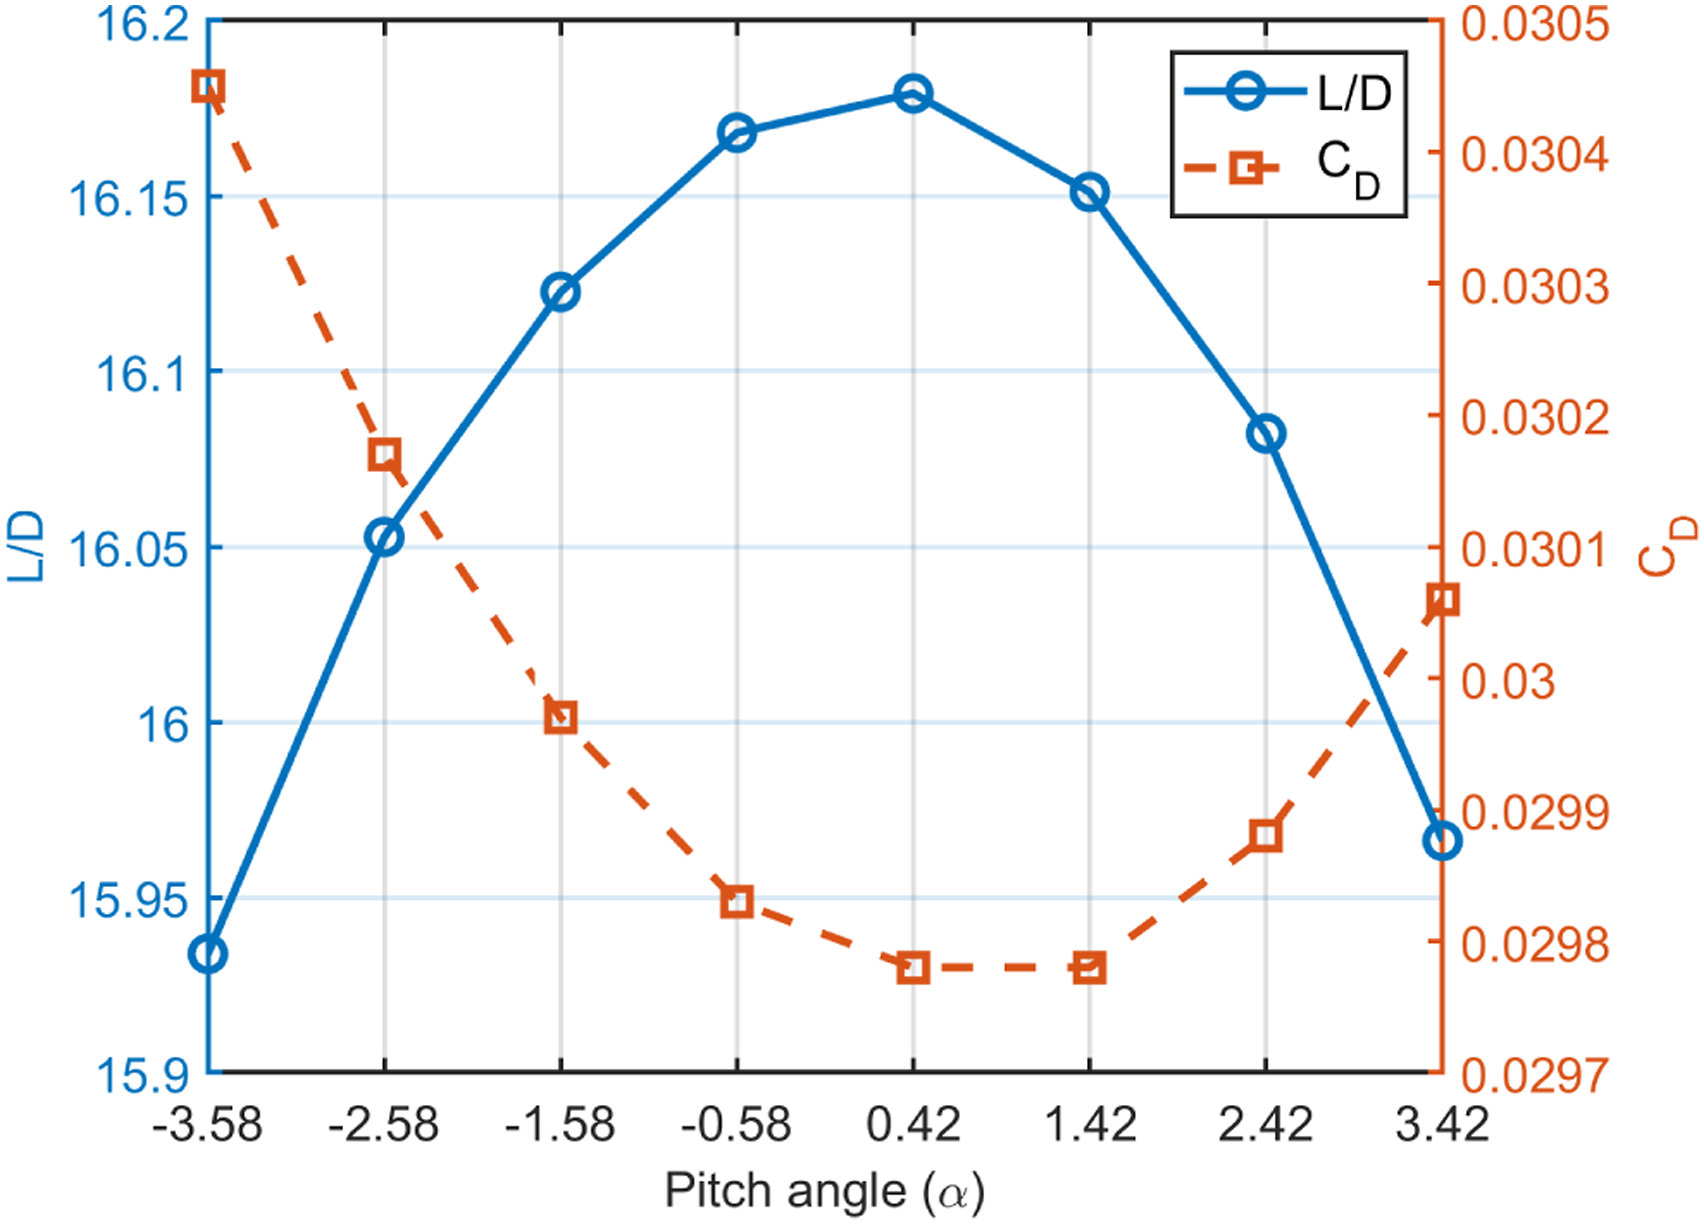
Figure 22 shows the wing section lift and pressure distribution under different pitch angles. It can be clearly seen that nacelle pitch angle significantly influences the spanwise lift distribution. With the increase of pitch angle, the wing section lift decreases obviously. Especially in the range of spanwise 25%–45%, the differences in lift between different pitch angles are significant, and the maximum can reach 0.075. Analyzing the corresponding pressure distributions in Figure 22 reveals that increasing pitch angle goes along larger pressure on the upper wing side and results in an upstream shift of upper surface shock, causing a sharp decrease in suction. And larger pitch angle brings smaller pressure in the whole outboard lower wing area. In the inboard lower wing area, although small pitch angle slightly causes flow acceleration near the leading edge, the pressure is higher in other chord positions. Such pressure distribution characteristics on the upper and lower wing surface make the lift always be penalized when the pitch angle increases, followed by a decrease of lift-induced drag. In addition, at the outboard, small pitch angle strengthens the shock, causing increased drag. Wing section lift and pressure distribution under different pitch angles.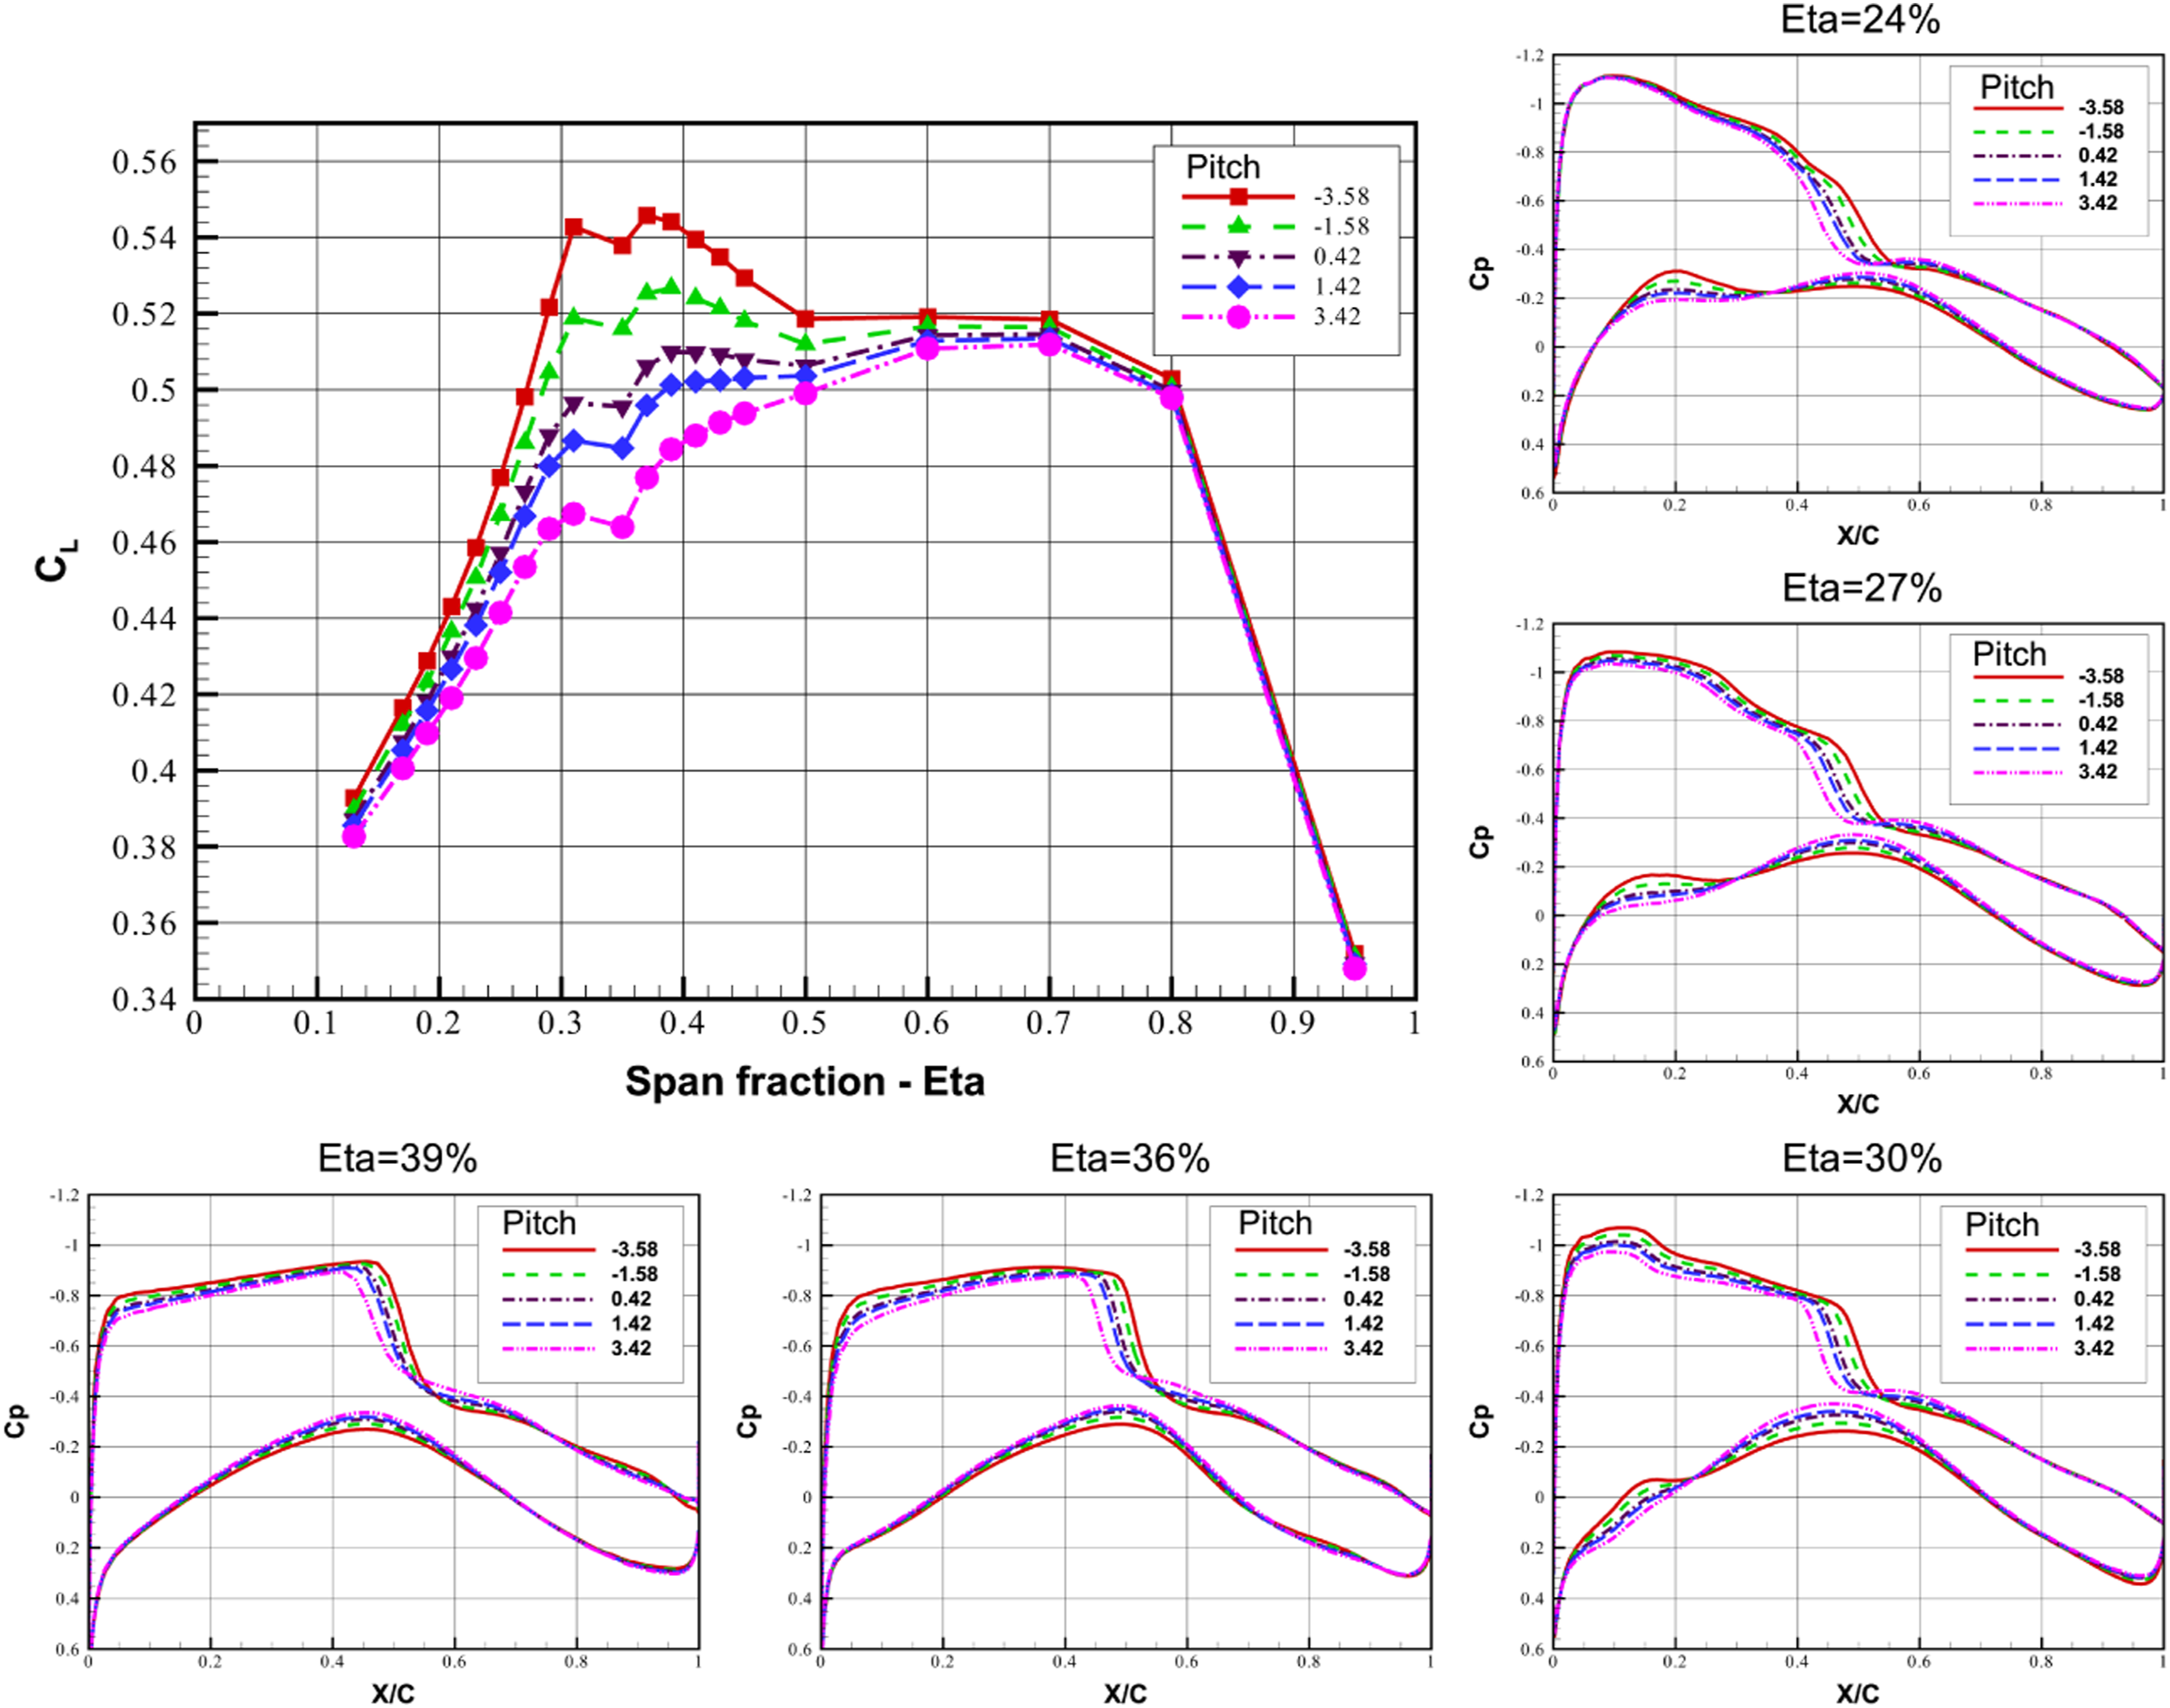
The nacelle intake performance of configurations with nacelle installed at different pitch angles is presented in Figure 23. Compared with the penetration and gully depth, the pitch angle has a more significant influence on the nacelle intake performance. In general, PR becomes larger with the increase of pitch angle until it reaches the maximum at the pitch angle of 1.42°, and then decreases. The variation of IDC and RDC with pitch angle is opposite and both reach the minimum at pitch angle of 1.42°. And the total distortion, DC (60), is also relatively small in the pitch angle range of −0.58°–1.42°. Nacelle intake performances under different pitch angles.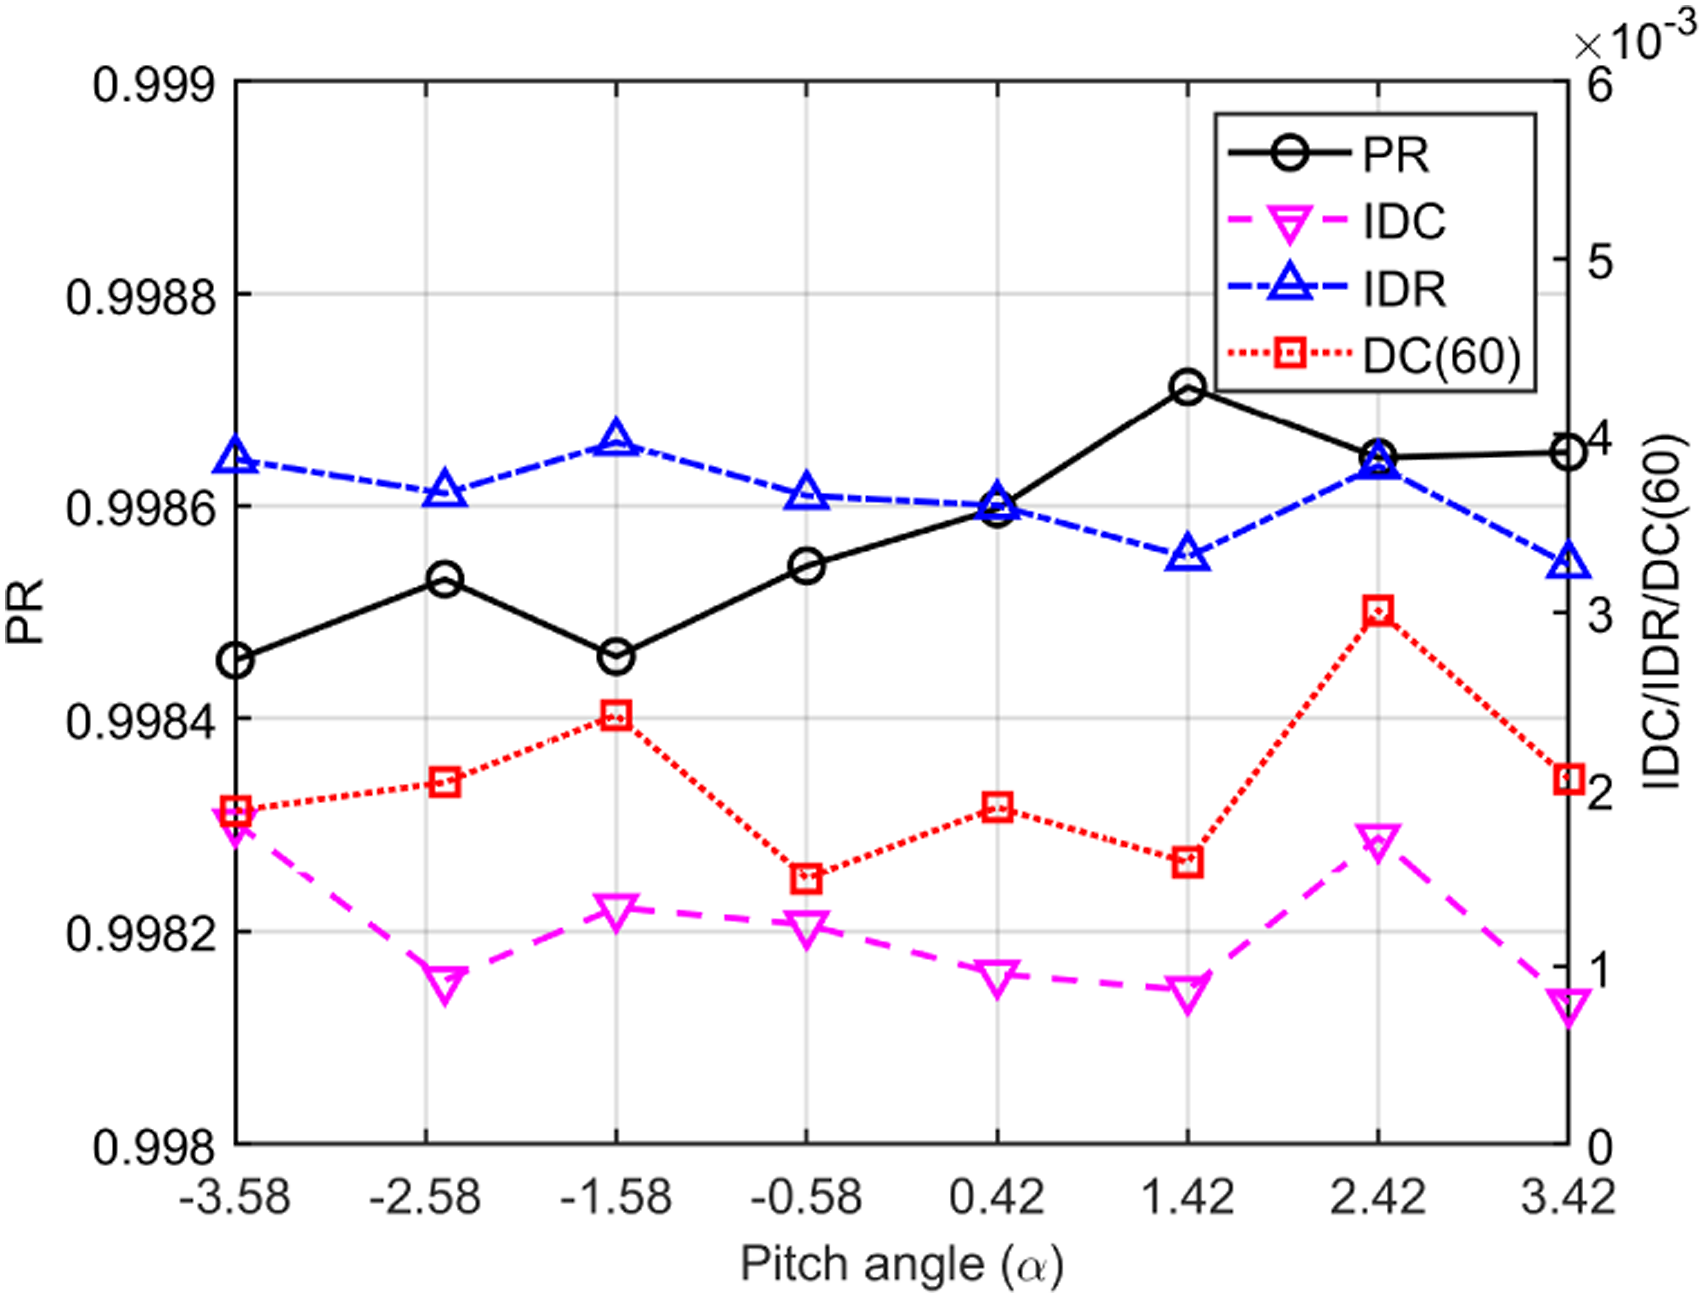
Based on the above analysis, the configuration with the pitch angle in the range of −0.58°–1.42° can have better aerodynamic performance and intake performance at the same time.
Toe angle
The influences of toe angle on aerodynamic and nacelle intake performance are investigated, as shown in Table 3. As shown in Figure 24, with the increase of toe angle, the drag decreases, but the rate of decrease gradually slows down. The lift-drag ratio increases first and then decreases, and reaches the maximum when the toe angle is 2.05°. Obviously, the aerodynamic performance is not symmetrical about the toe angle. The positive toe angle, that is, the nacelle air intake is deflected towards the symmetry plane of aircraft, has significantly better aerodynamic performance. Lift-drag ratio and drag coefficient under different toe angles.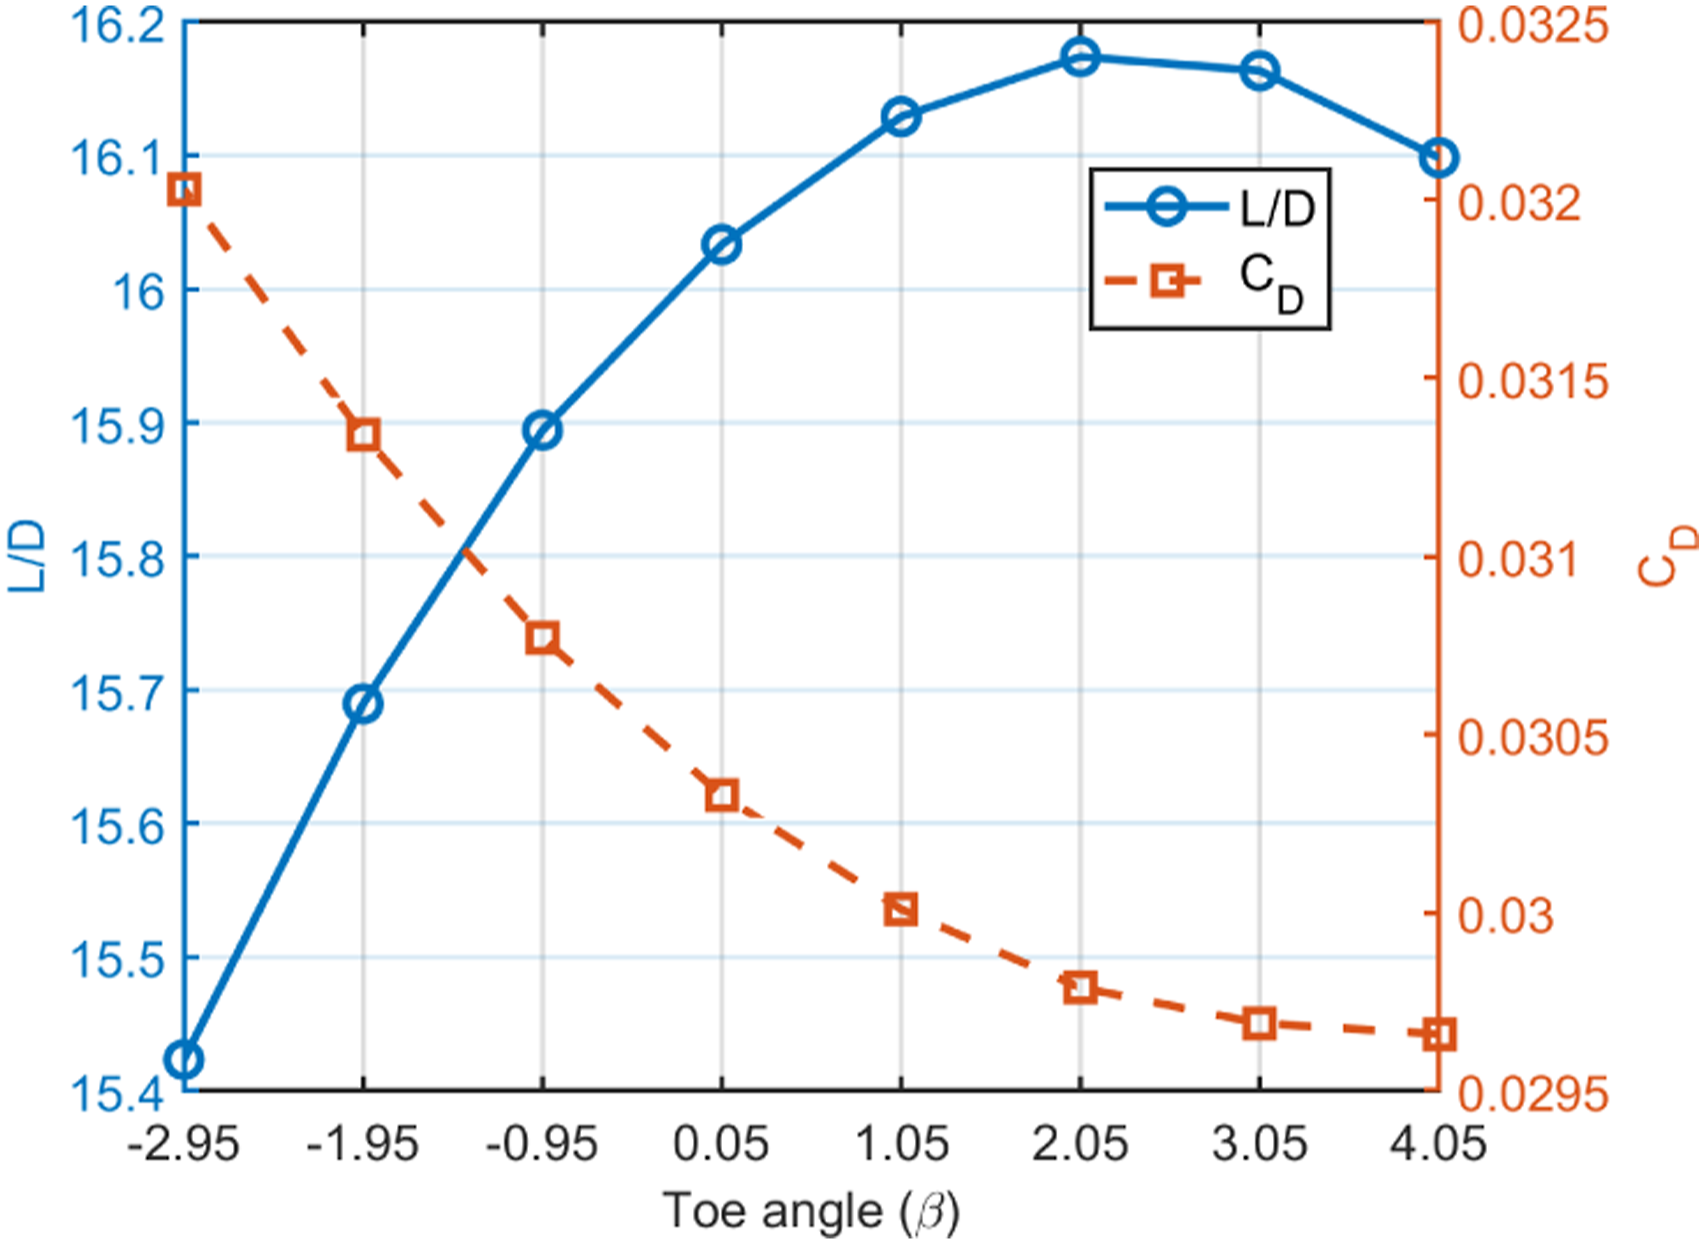
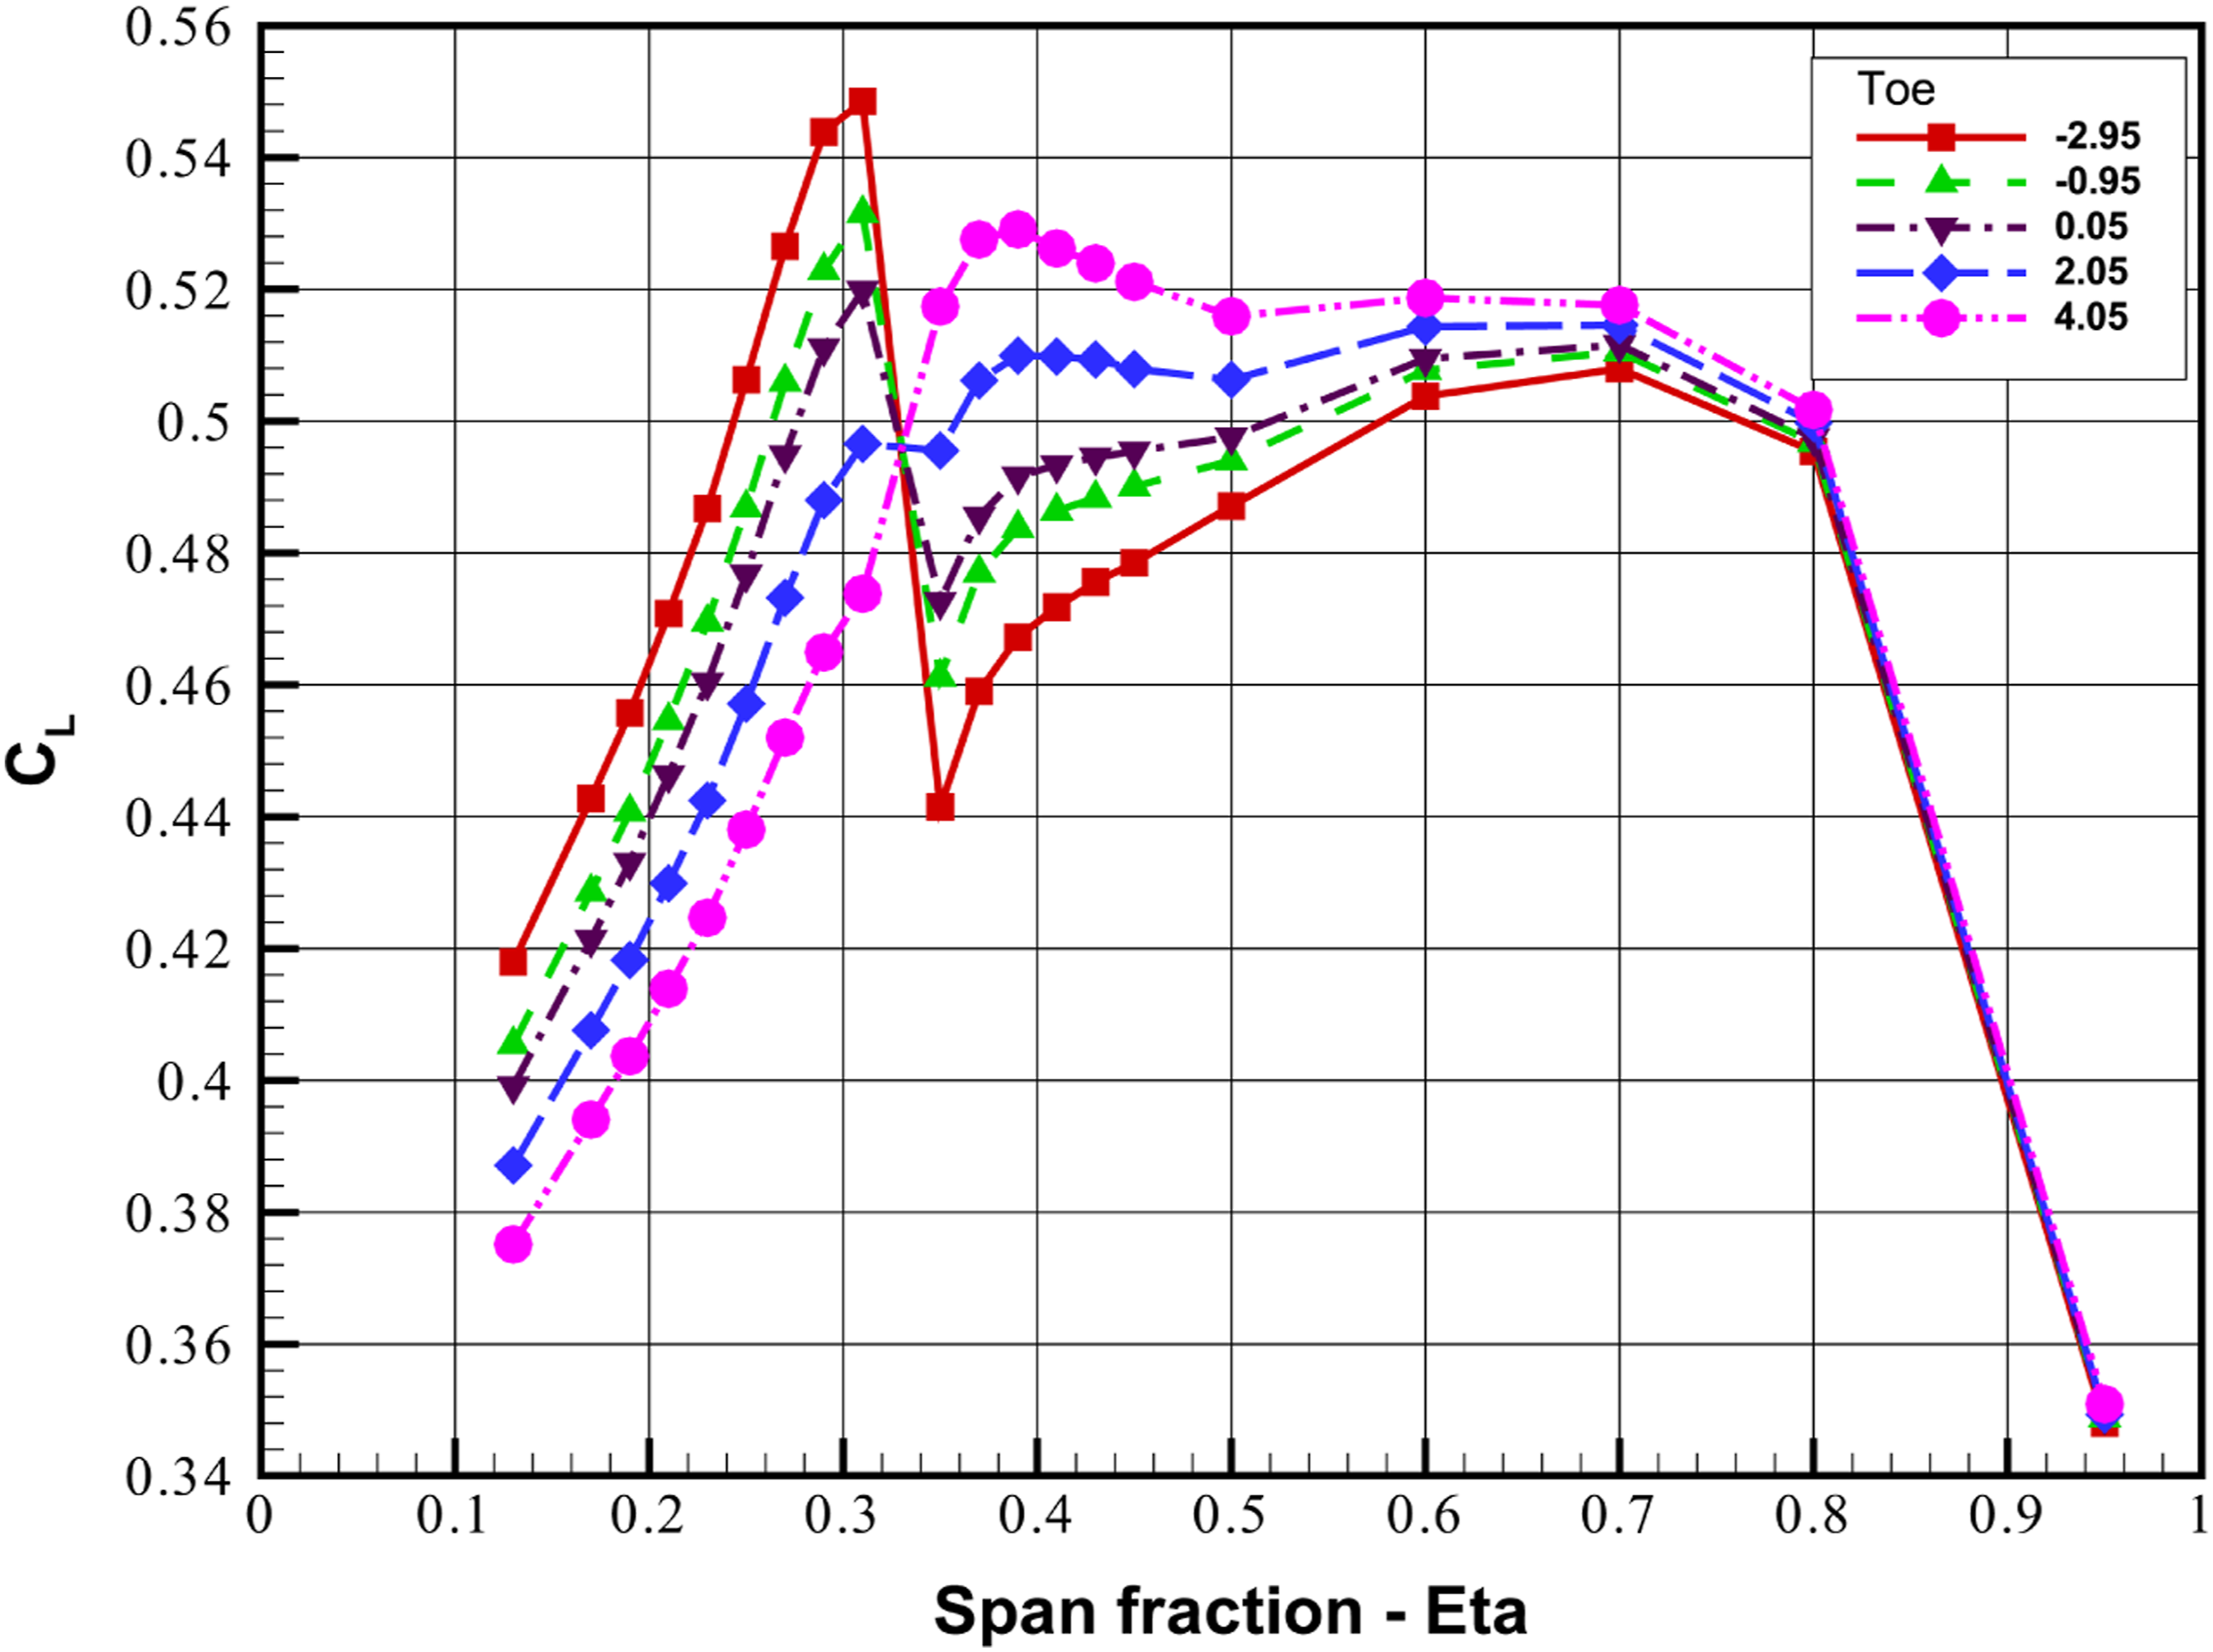
Figure 25 shows the pressure distribution of wing sections under different toe angles. It can be seen that the influences of toe angle on the pressure distribution are mainly concentrated in the leading-edge region. In the inboard upper wing area, the pressure becomes larger with the increase of toe angle. For small toe angle, the pronounced pressure gradient near the leading edge and the generated two shock pattern together cause greater drag. However, for large toe-in angle, the mitigation of the suction peak brings a lift loss. In addition, increasing toe angle also causes slightly decreased strength of the shock located at the mid-chord, but does not substantially change the shock position. On the lower wing surface, as the toe angle increases, the airflow is accelerated due to the effect of nacelle-pylon, causing smaller pressure level near the leading edge. Such pressure distribution characteristics of upper and lower wing surface cause the wing section lift to decrease significantly with the increase of toe angle, as shown in Figure 26. Pressure distributions of wing sections under different toe angles. Wing section lift coefficient under different toe angles.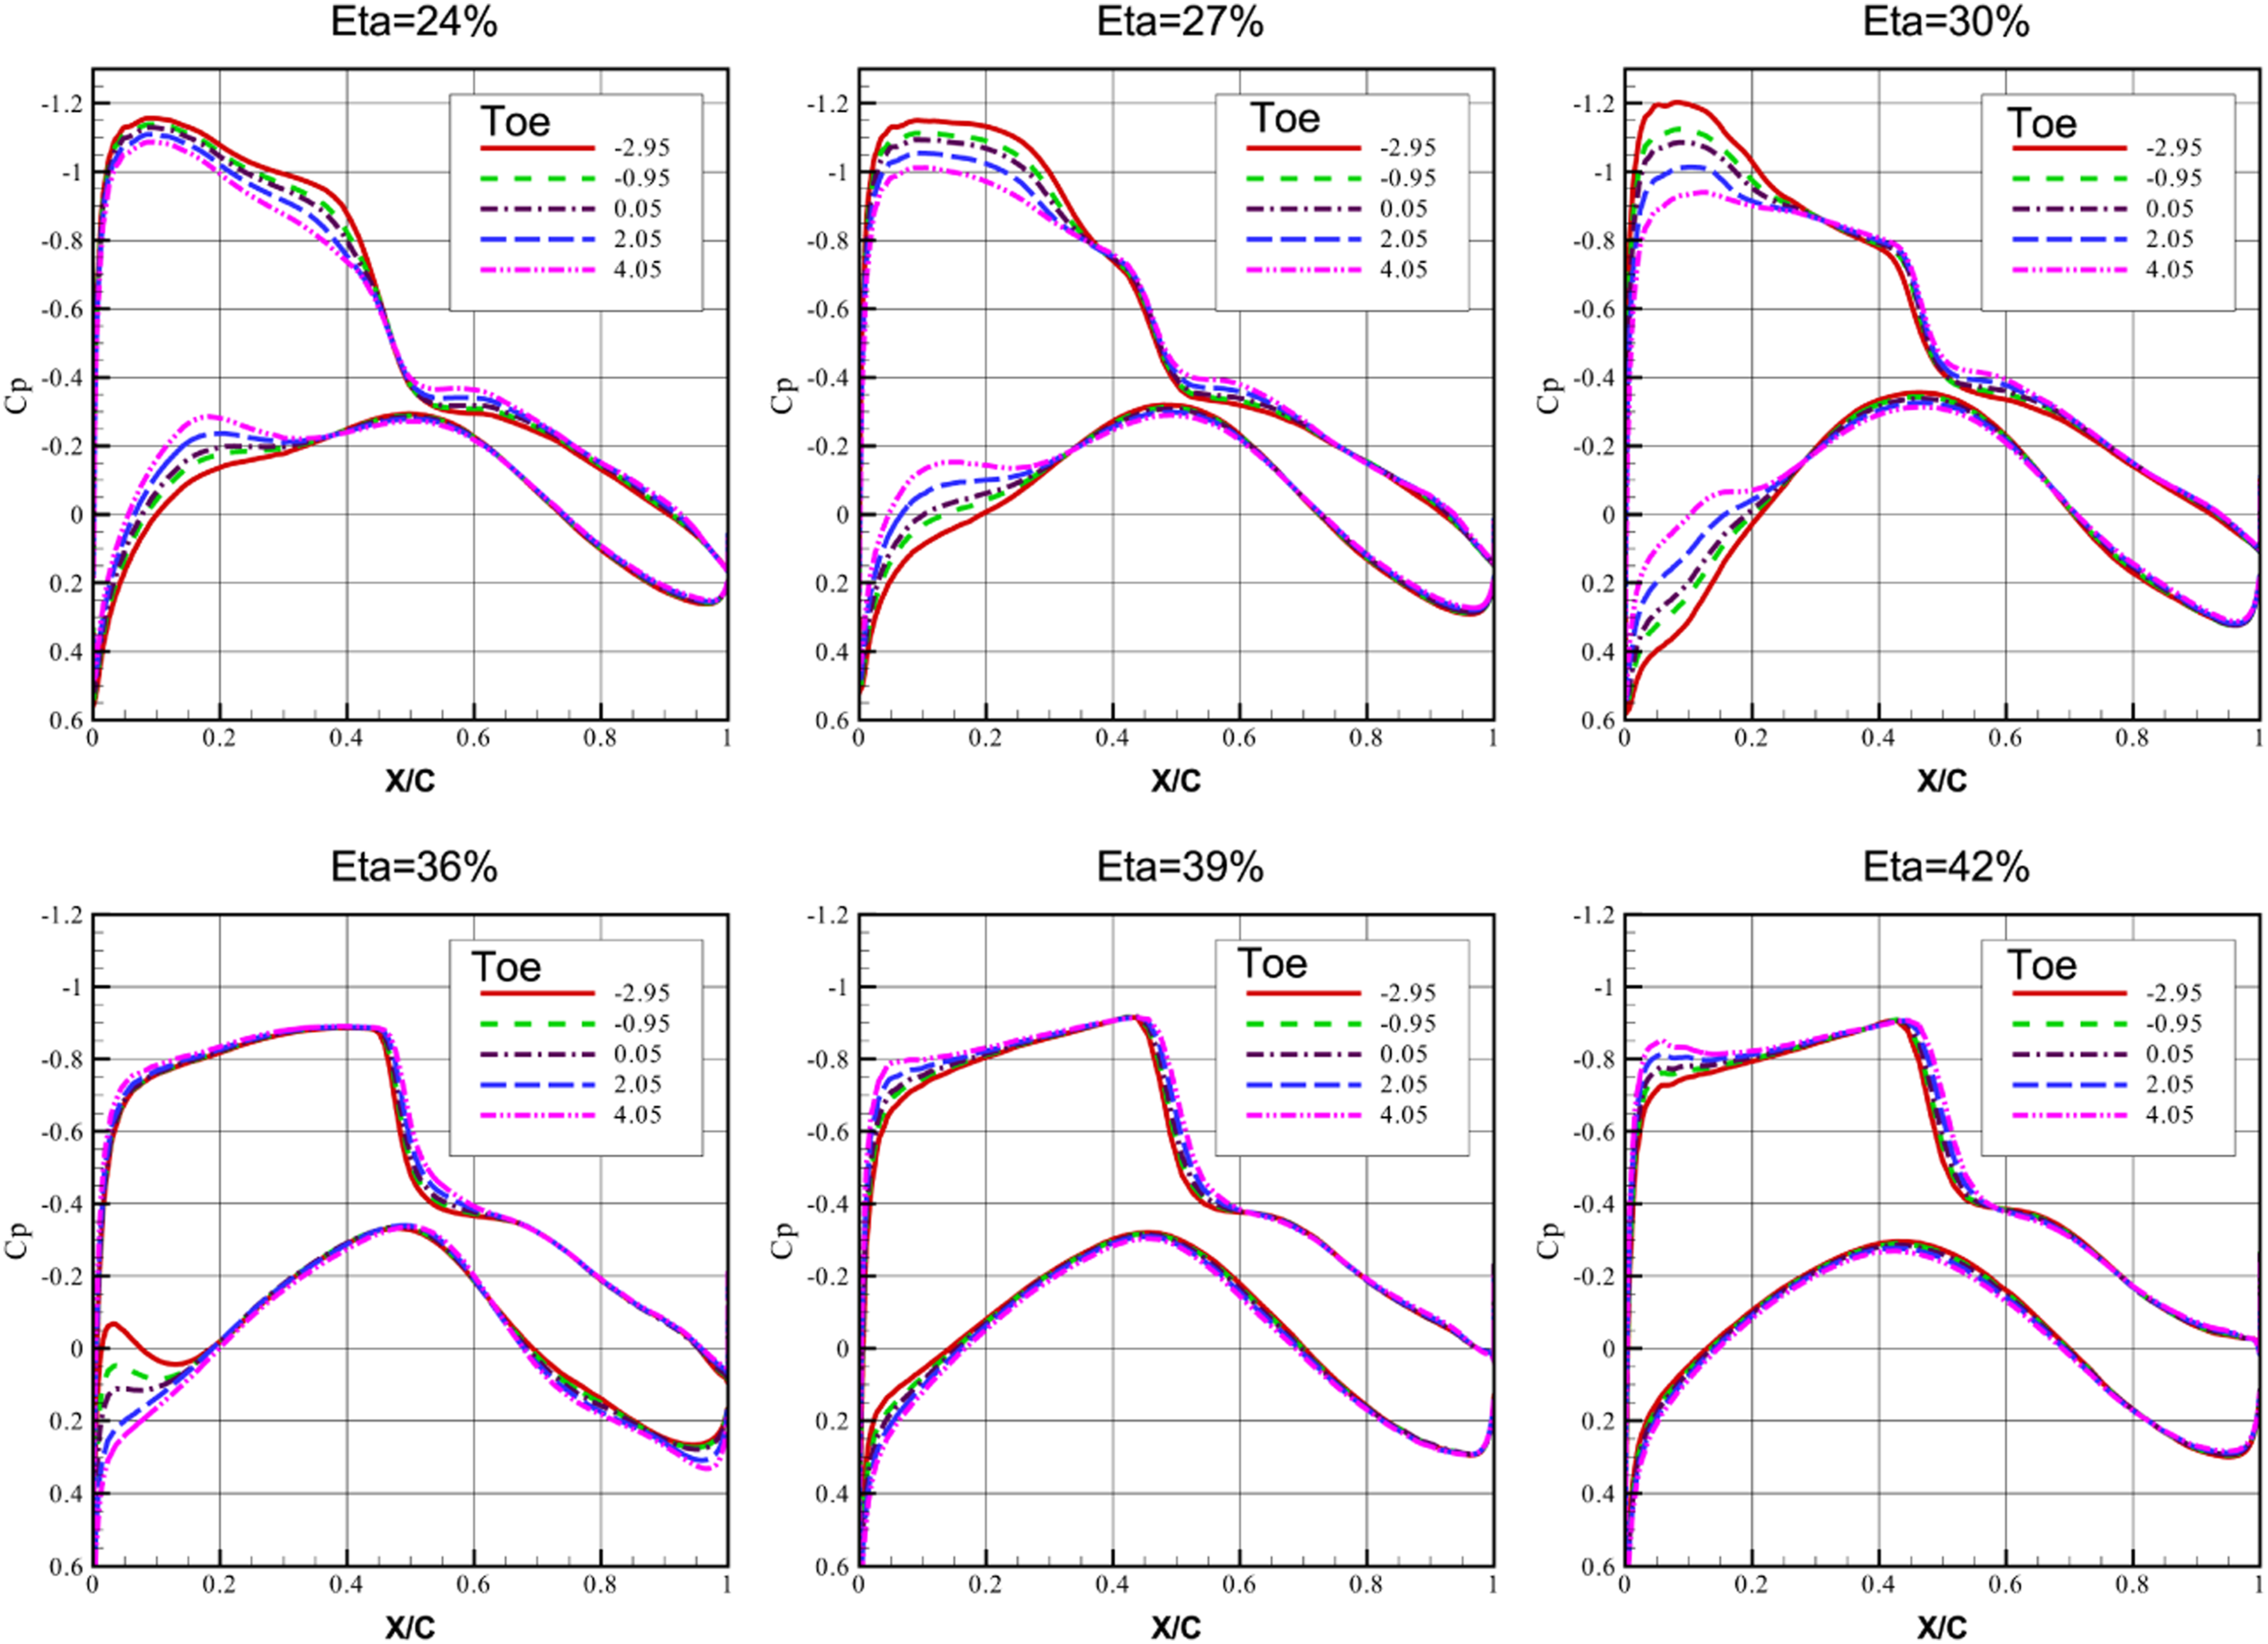
Contrary to the change of pressure distribution in the inboard wing area, at outboard of the nacelle, larger toe angle brings smaller pressure on the upper surface and greater pressure on the lower surface. Consequently, the change of wing section lift with toe angle is also opposite: increasing toe angle causes greater lift. This results in very drastic change in lift at the two wing sides of nacelle, particularly in the case of small toe angles. It should be noted that at the spanwise 36%, an obvious low-pressure peak is generated on the lower surface, followed by a strong reverse pressure gradient, after which the airflow will separate. In general, the pressure distributions do not change significantly at outboard of the nacelle.
Figure 27 illustrates the pressure distribution on the lower wing surface and Mach distribution on both wing sides of nacelle under different toe angles. When the airflow approaches the nacelle-pylon-wing, due to the influence of local side wash, the stagnation point is located at the inboard leading edge of pylon. The airflow then accelerates around the leading edge and flows to the outboard of pylon, forming a low-pressure area. With the increase of toe angle, the stagnation point location is closer to the leading edge and the high-pressure inboard of the pylon decreases significantly, leading to smaller pressure difference between the inboard and outboard of pylon caused by the flow acceleration. The distribution of Mach number also shows that the airflow velocity is significantly different near the wing surface inboard of the nacelle. As the toe angle increases, the airflow velocity on the upper wing side decreases and the peak value of negative pressure increases; whereas the airflow velocity near the lower wing increases and the pressure decreases, as shown in Figure 25. At the outboard wing section, the velocity distribution near the upper side is almost identical; the airflow velocity between pylon and wing decreases with the increase of toe angle. Particularly in the case of toe angle of −2.95°, a small high-speed region appears, resulting in the reverse pressure gradient on the lower wing surface as shown in Figure 25. Pressure distribution on the lower wing surface and Mach number on both sides of the pylon.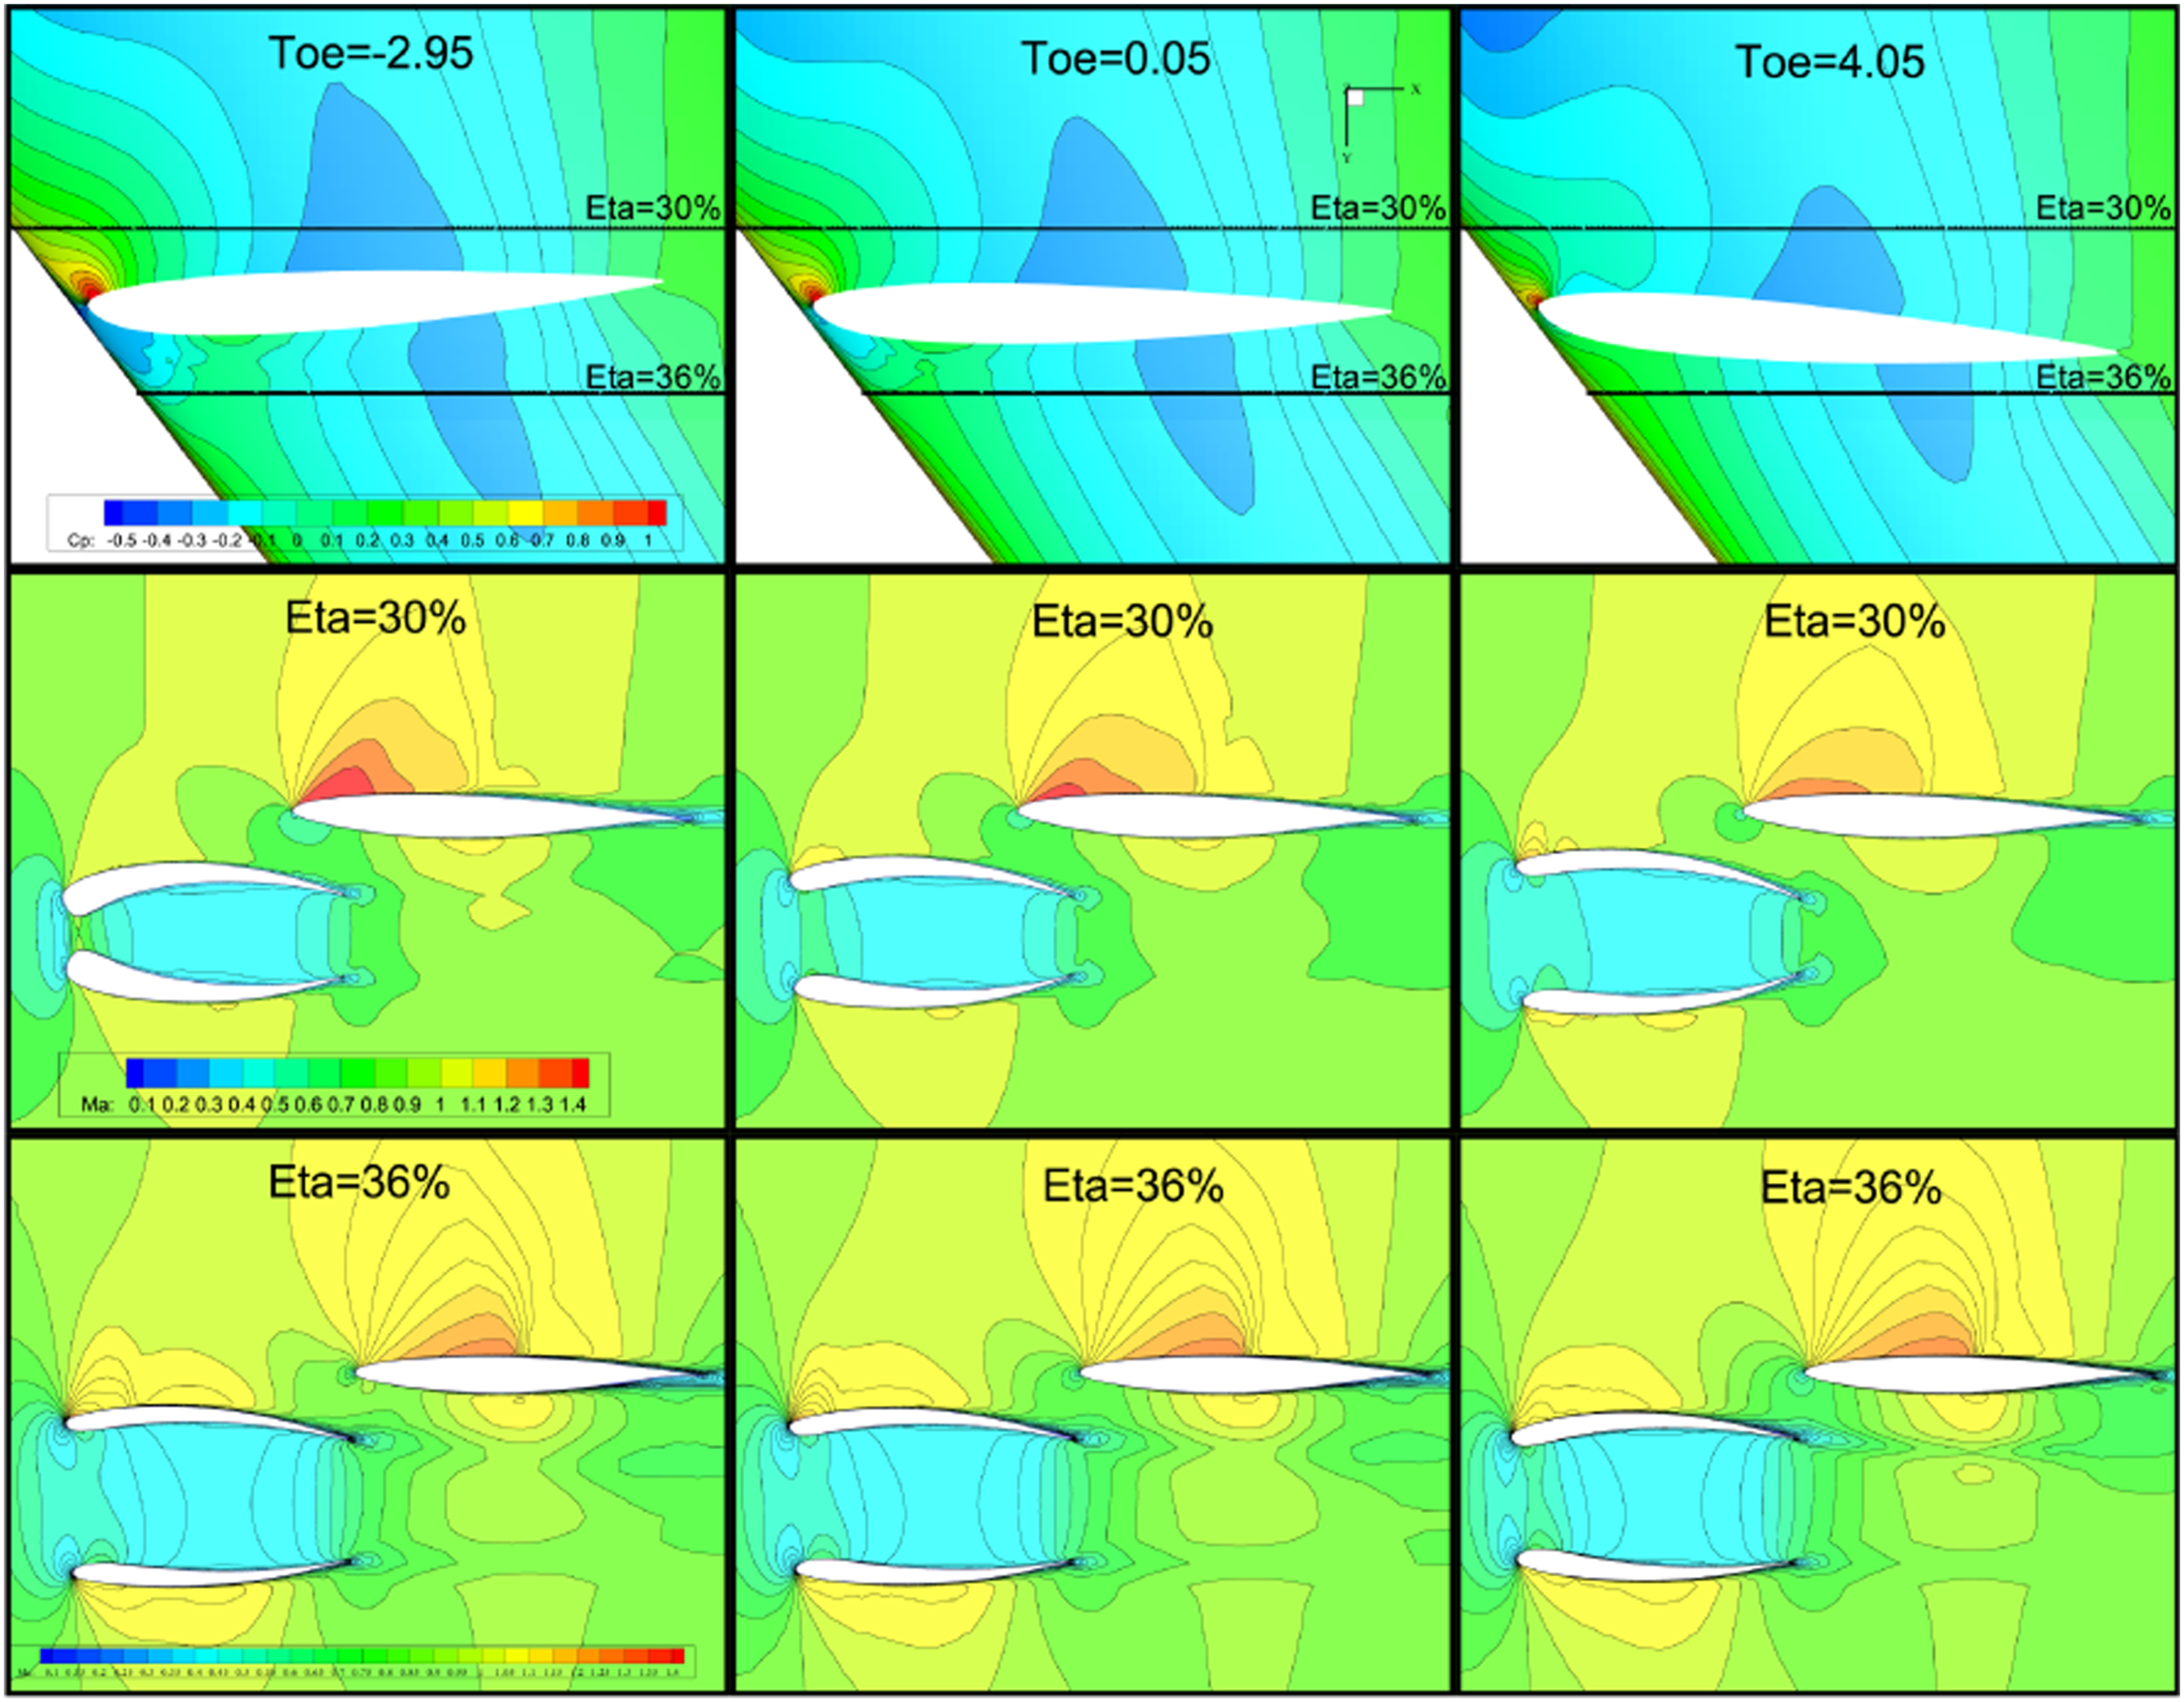
Figure 28 shows the nacelle intake performance under different toe angles. It can be found that the influence of toe angle on PR is not as obvious as that of pitch angle. In general, the configurations with positive toe angle have slightly higher PR and smaller airflow distortion. Nacelle intake performances under different toe angles.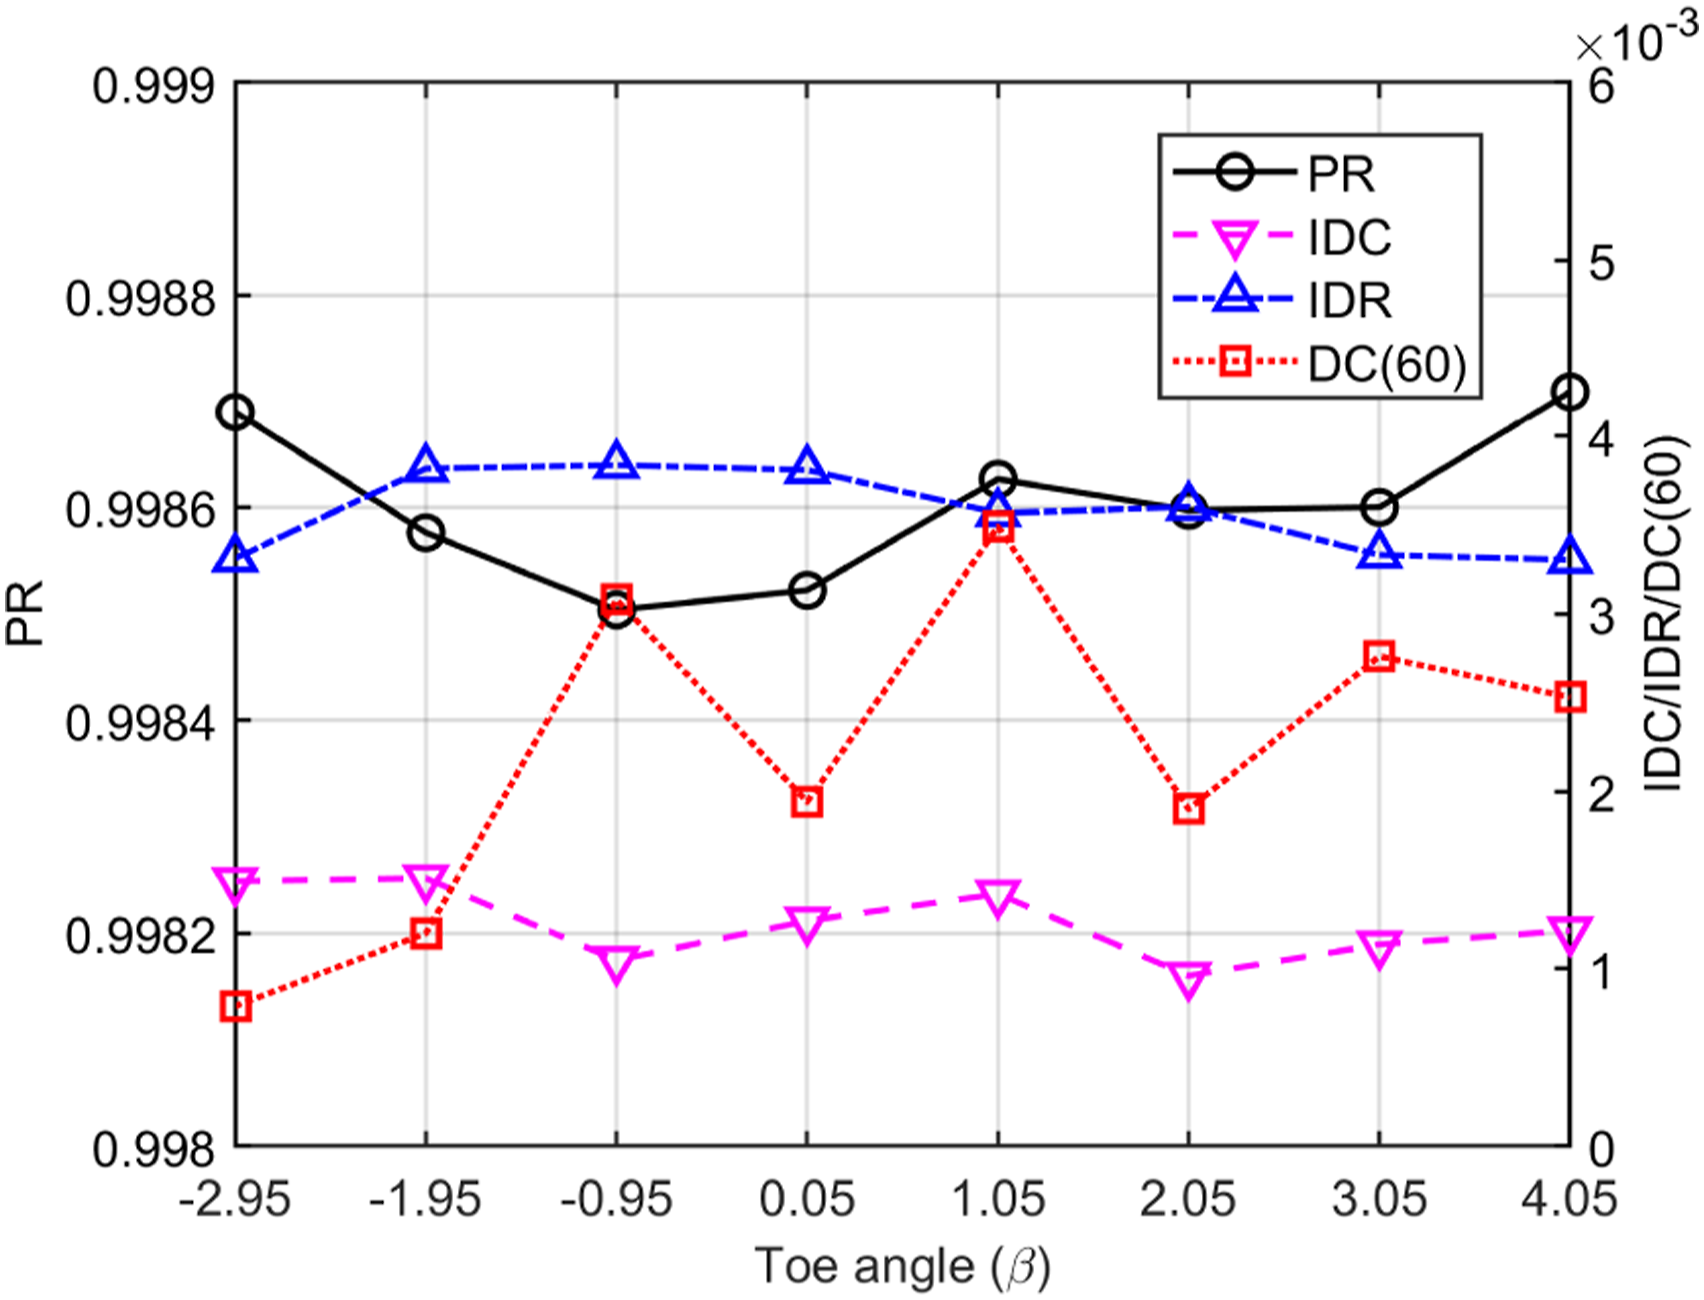
With respect to design considerations, making the nacelle intake incline towards the fuselage can reduce the drag and improve the lift-drag ratio.
Conclusion
This paper investigates the effects of the under-wing nacelle position and orientation on the aerodynamic characteristics and nacelle intake performances through numerical simulations. The work is conducted with the use of the CRM with through-flow nacelle. All the five nacelle installation parameters, including spanwise position, penetration, gully depth, pitch angle, and toe angle, are systematically studied. Qualitative and quantitative comparisons between these configurations have been carried out to analyze the effects of these parameters on the flow field, lift spanwise distribution, aerodynamic forces, and nacelle airflow distortion. And the mechanism of interference effects is explored. Based on these analyses, the specific conclusions are drawn as follows: (1) The presence of nacelle-pylon causes increased drag and decreased lift. The differences between the WB and WBNP are mainly on outboard wing surface of the nacelle; (2) Nacelle spanwise position significantly influences the lift spanwise distribution. Reducing nacelle spanwise position alleviates the lift loss. However, installing the nacelle too close to the fuselage causes drag penalty; (3) An upstream movement of nacelle reduces the lift, drag and airflow distortion, and increases total pressure recovery. The most adverse interference effect for increasing penetration is strong flow acceleration on the inboard lower wing area; (4) The reduction of gully depth causes upstream movement of the shock, appearance of two shock pattern, and increased drag. The interference effects on the pressure distribution on the upper and lower wing surfaces are opposite; (5) The variation of pitch angle causes pronounced influence on the nacelle intake performance and small positive pitch angle brings minimal drag. Increasing pitch angle goes along larger pressure on the upper wing side and results in an upstream shift of shock; (6) Increasing toe angle significantly affects the spanwise lift distribution and reduces the lift and drag. The most problematic interference effects for the increase in toe angle are flow acceleration on lower side and mitigation of the suction peak on upper side in the outboard wing area.
While every effort was made to obtain reliable and valuable effects of nacelle position on aerodynamic characteristics and nacelle intake performances, this work can be extended in a variety of ways. In the future, research will be conducted on the overall effects of different nacelle installation parameter combinations on the aircraft. And some advance optimization techniques can be used to conduct further aerodynamic design of WBNP configuration.
Footnotes
Declaration of conflicting interests
The author(s) declared no potential conflicts of interest with respect to the research, authorship, and/or publication of this article.
Funding
The author(s) received no financial support for the research, authorship, and/or publication of this article.