
Abstract
This study aims for endurance improvement and energy saving by addressing, on the one hand, the design optimization (DO) of a hybrid electric source (HES) consisting of a fuel cell (FC) and a battery, intended for a fixed-wing electric UAV (EUAV) and, on the other hand, the power management (PM) of the sources. The DO employed the particle swarm optimization (PSO) algorithm, which determines the FC power and the battery capacity that offer the sources the least weight; the findings resulted in a weight reduction of 8%; this gain saves a total energy of 90.28 kJ that can extend the “endurance stage” by more than 26 min. Three power management strategies (PMS) are examined: frequency separation (FS), which gives good performance in PM and protects the FC from dehydration by smoothing its response; power limitation (PL) which protects the FC from exceeding its maximum power, and fuzzy logic (FL), which allows for more flexible power distribution between the sources and has the main advantage of controlling the battery state of charge (SOC). A fourth strategy was developed by combining the benefits of these three strategies. This hybrid PMS (HPMS) saves 2% of FC energy compared to the FL strategy. FS and PL save, respectively, 41% and 44% of FC energy, but the SOC can drop significantly, especially for longer missions. The experimental findings, achieved using a laboratory test bench, validate the simulated results obtained from MATLAB/Simulink software, confirming the validity and performance of the proposed HPMS.
Keywords
Introduction
Electric propulsion in small fixed-wing UAVs has a variety of advantages over internal combustion engines, including low cost, high efficiency, reliability, reduced noise, and low thermal signature.1–3 However, a well-known disadvantage of electric UAVs is their short endurance (less than 1 hour) for specialized applications, as the majority of these electric UAVs rely entirely on a battery as a power source.2,3 Many researchers are interested in hydrogen fuel cells because of their high specific energy, which allows for extending UAV endurance while maintaining the benefits of electric propulsion. From the Hornet to the Ion Tiger, manufactured in 2003 and 2013, respectively, the endurance of fixed-wing UAVs increased from 0.25 h to 48 h with the use of fuel cells. 4 Nevertheless, FCs suffer from a slow dynamic and a low power density, which can be resolved by their hybridization with a fast-acting power source, such as a battery or a super-capacitor, which are able to generate the peaks of power during the take-off phase, climbing phase, and rapid maneuvers. 5
The scientific community has made a limited effort to build a systematic approach for sizing fixed-wing UAVs powertrains, particularly FC UAVs, which encouraged this study to fill this gap. One of the few studies is that presented by Hu J and Booker J 6 ; the authors in this study proposed a sizing procedure to predict the masses of five case study UAVs and validated the results with their actual masses; however, they didn’t optimize the masses of the UAVs. Another study 7 proposed an optimized sizing of battery capacity for endurance and range optimization in a fixed-wing UAV without considering a FC. The authors in Ref. 8 sized the fuel cell based on the cruising and endurance power, and the battery size is determined on the grounds of the maximum discharging current during cruising phase, without considering the other flight phases.
After the DO process, a convenient PMS is necessary to decide the appropriate power distribution between the sources, consequently, enhancing the global electric system efficiency. Several studies have been conducted in this context for fixed-wing electric UAVs, and are classified into two types: passive PMS and active PMS. The passive ones are widely adopted for electric UAVs,1,2,5,9–12 where power converters are not necessary and the power sources are directly connected to the DC bus to supply the propulsion. Although the SOC and power flow cannot be controlled, this allows for significant reductions in complexity, weight, and power losses. In active PMS, the power management unit controls the power delivered by each source using power converters connected to these sources. This architecture is more adaptable and efficient, but it adds weight, complexity, and power losses to the whole system. 13 Online active PMS can be rule-based, optimization-based, or intelligent-based. 14 Most PMS for fixed-wing electric UAVs mentioned in the literature are rule-based, 14 owing to their simplicity. Rule-based strategies can be fuzzy logic or deterministic. 15 Fuzzy logic is widely used and showed its performance in several applications, however, one can notice from the results that two crucial drawbacks of FL-PMS were not taken into account in the previous studies: the fuel cell is not protected against abrupt power changes, that can damage its membrane, in addition, the FC exceeds its maximum power when high demand of power occurs. Consequently, FL is unable to prevent these two drawbacks because it uses fuzzy sets and the power frequency or the power level cannot be limited to an exact value, exposing the FC to major risks.
In this context, and in order to improve the sizing and PMS for fixed-wing UAVs, adequate sizing of the HES, derived from DO is critical for improving the performance of such a hybrid power system. The DO algorithm investigated in this paper uses the power profile of the whole mission and the parameters of the fixed-wing UAV presented in a previous study 8 to perform an optimized sizing methodology for the HES. Moreover, this work introduces a Hybrid PMS able to overcome the drawbacks of fuzzy logic-based PMS (FL-PMS) and protect the FC which is very costly, by its hybridization with two other deterministic rule-based strategies: frequency separation-based PMS (FS-PMS) that filters the FC response, and power limitation-based PMS (PL-PMS) that limits the FC power to its maximum value. The remaining transient power and extra power are ensured by the battery which is faster than the FC.
This paper is divided into six sections. The first one provides an overview of the system under consideration, as well as the modeling of its different components. The following section exposes the problem formulation for the HES sizing optimization, followed by the PMS section which presents the investigated PMSs. The main simulation and experimental results are given and discussed in the next section, and the last one is meant to bring this work to a close with a summary of the findings.
System overview and modeling
System overview
The architecture of the studied system shown in Figure 1 below, is composed of four parts: power sources, a DC bus, a power profile, and a power management system. The power sources used are a fuel cell as the primary source and a battery as a secondary one. The fuel cell is connected to the DC bus through a DC/DC boost converter while the battery is connected to the DC bus via a DC/DC bidirectional converter. The two sources supply the load by providing the required power according to the given power profile, which is obtained from the energetic model of the UAV using the velocity and flight parameters. In order to accomplish this task, the power management system has to ensure an optimized distribution of the required power between the two sources. The studied architecture.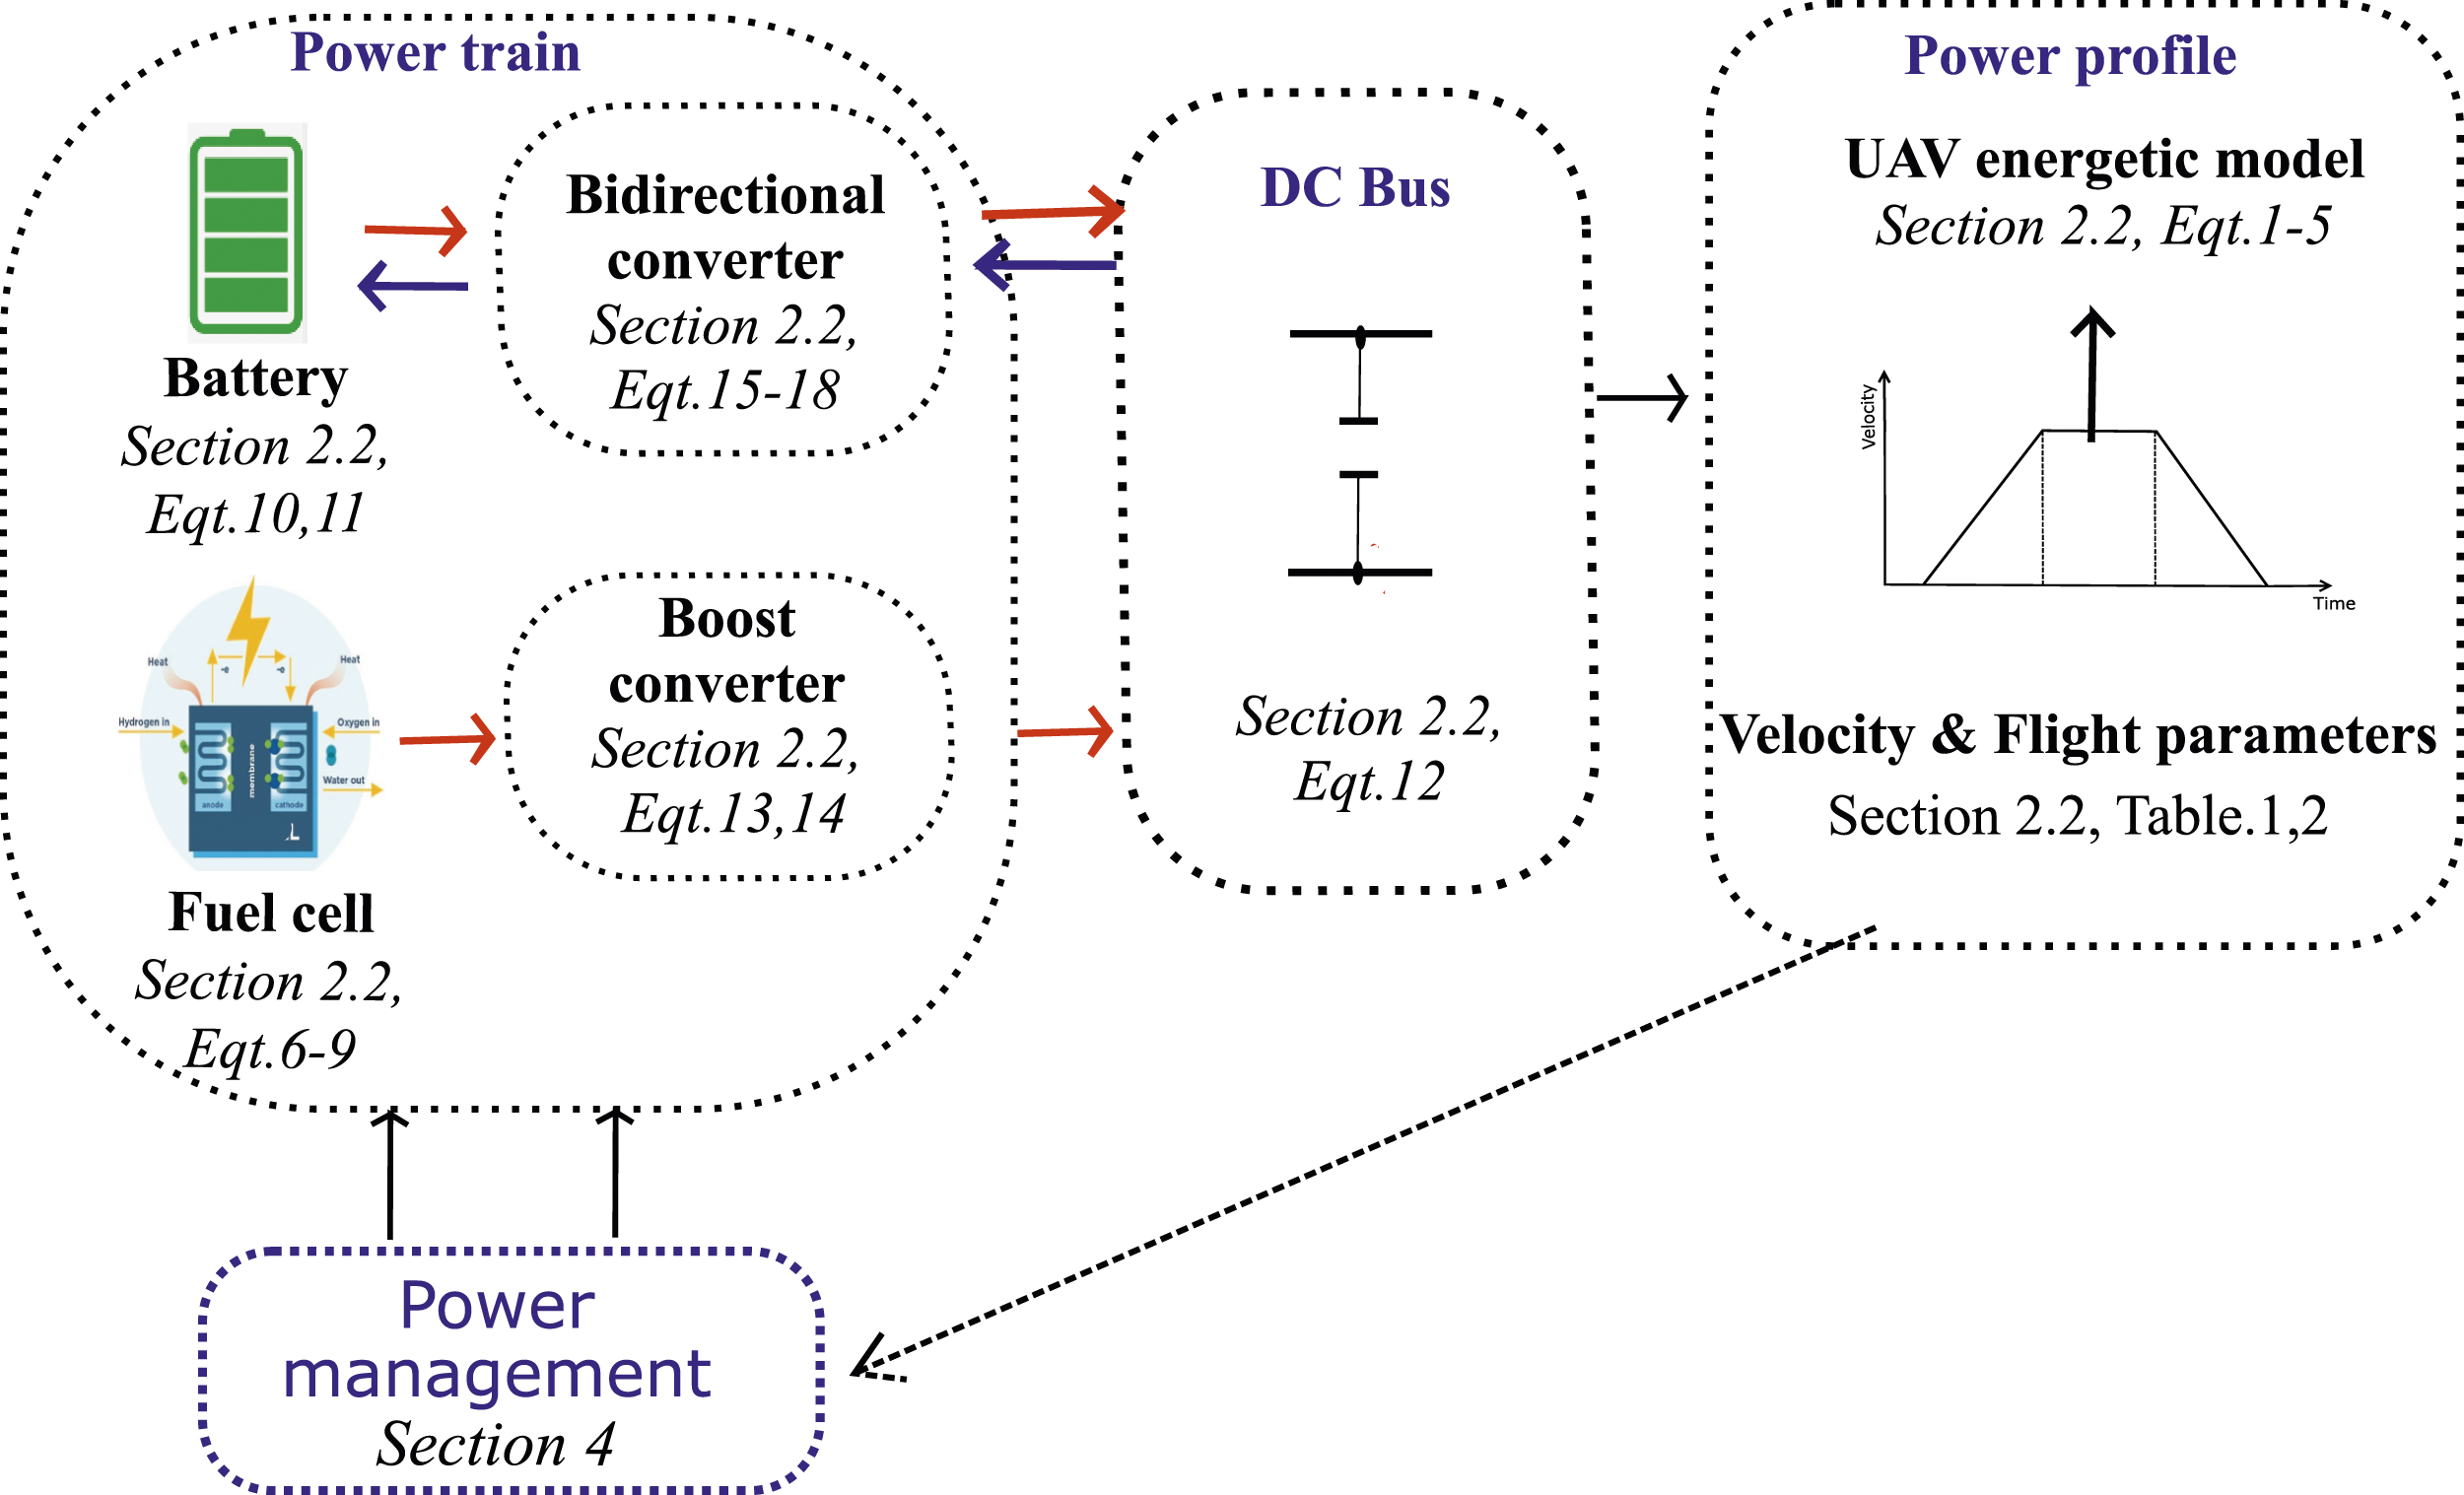
System modeling
This section deals with the modeling of each part of the whole power system.
UAV model
Many research works related to fixed-wing UAVs, which are based on various assumptions, are proposed.
16
In this paper, the model described in Ref. 17 and illustrated by Figure 2 is used, where the authors presented the UAV’s propulsive power by examining two cases: constant and non-constant Lift-to-Drag (L/D) ratio. This work adopted the first assumption. UAV model.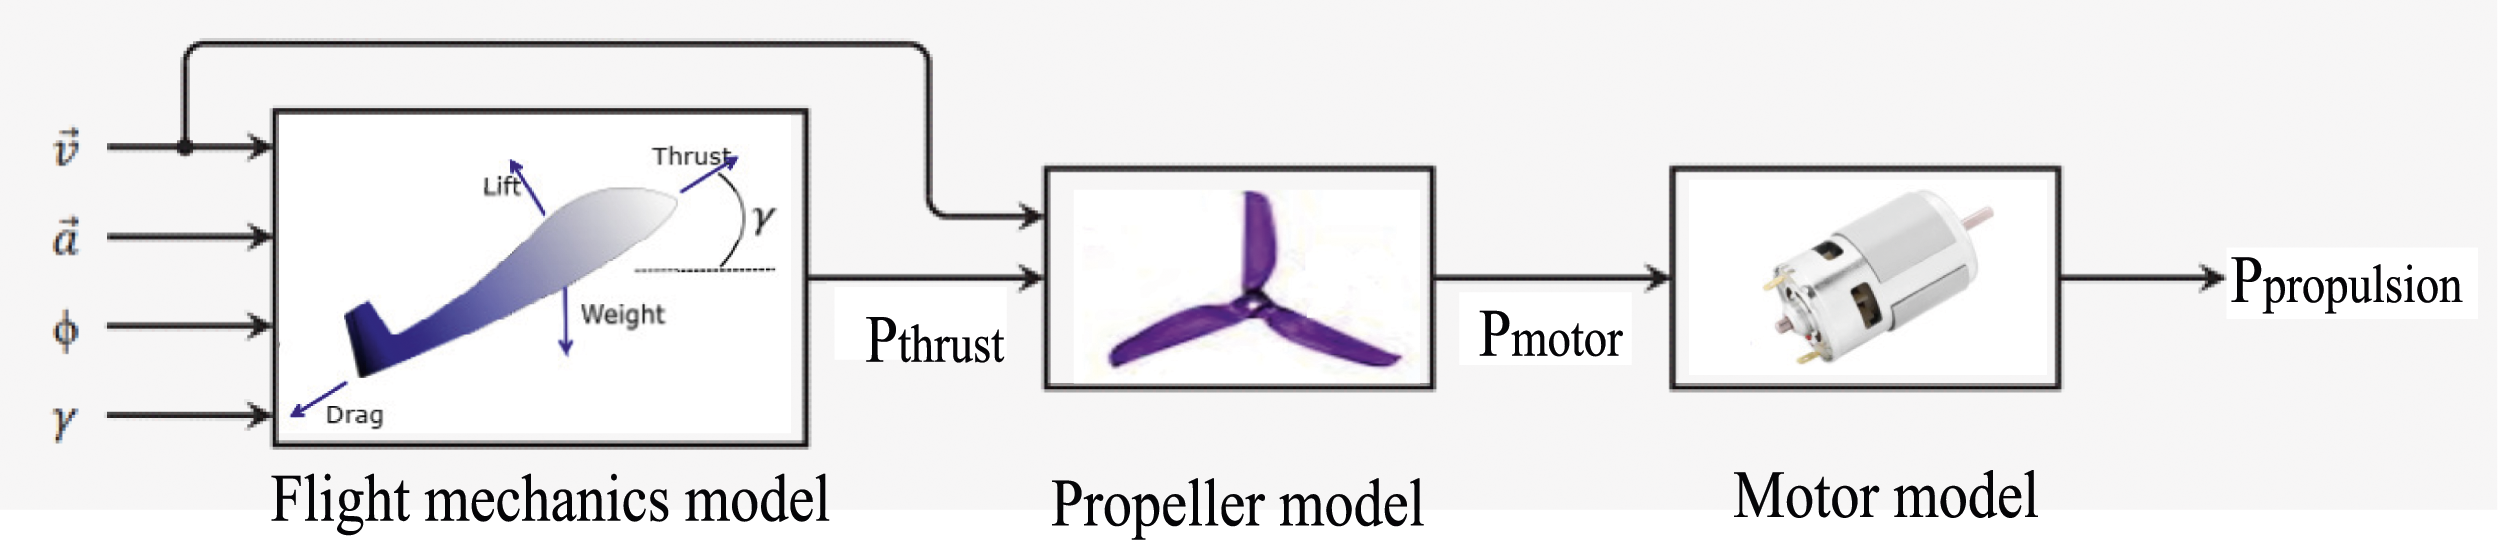
The thrust power P
thrust
, generated by the flight mechanics model, is composed of two parts (equation (1)), a steady state part P
ss
calculated from the fundamental laws of flight mechanics principles, and a dynamic part calculated from Newton’s second law:

The dynamic part is expressed by the equation (2) as follows:

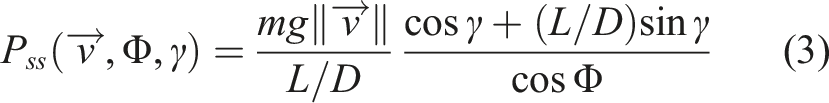
The expression of the steady state power is given by the equation (3):
The output power P
propulsion
in equation (4) can be calculated by incorporating the propeller and the motor efficiencies, η
m
and η
P
, respectively:

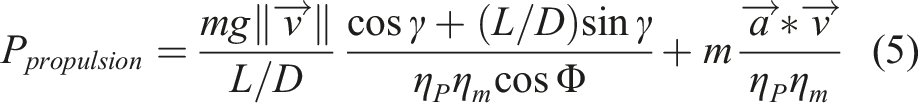
The final expression of the propulsion power is obtained by combining the previous expression (equations (1)–(4)), and is given by the equation (5) below: Forces, roll and climbing angles.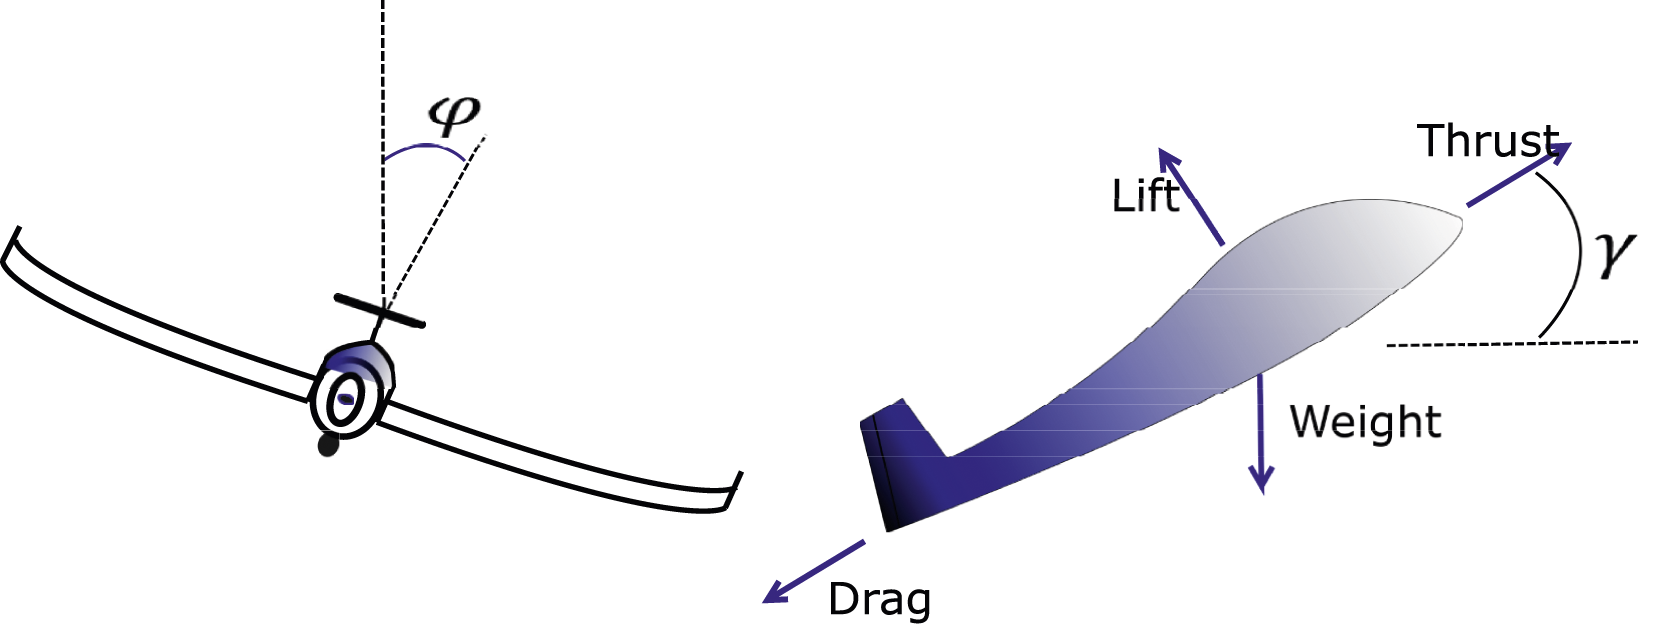
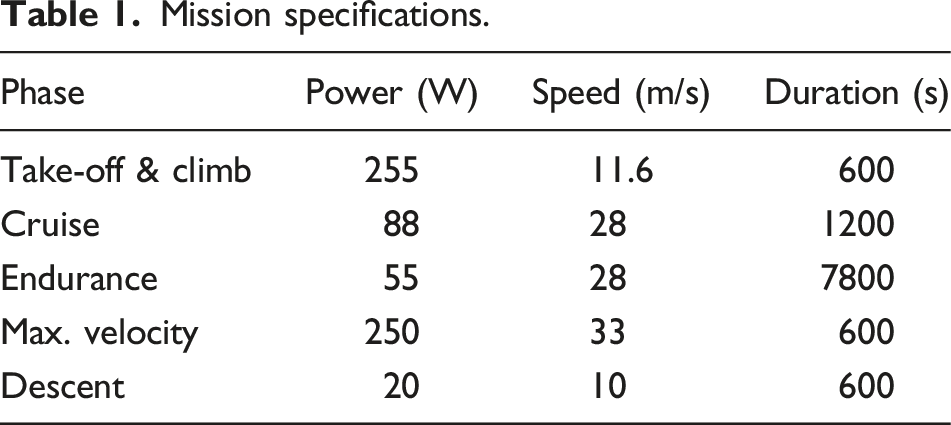
Mission specifications.
Sources models
Fuel cell


Model parameters.
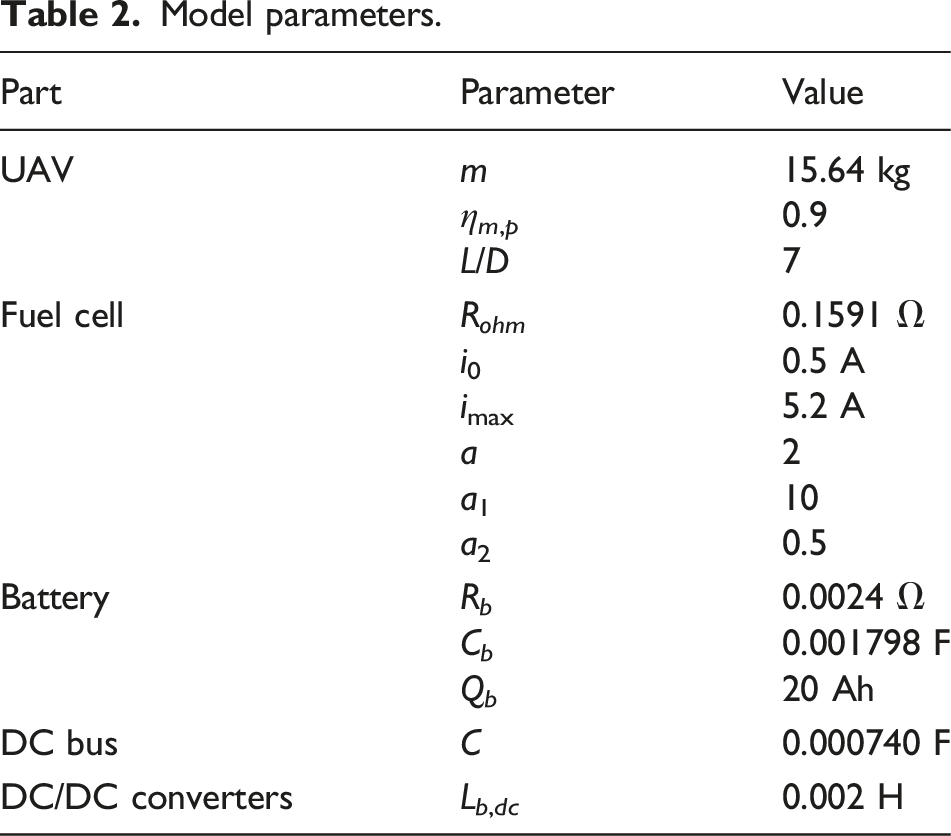
Battery
According to the predefined mission, the energy storage system must be carefully chosen. There are numerous means for energy storage, and lithium batteries, like Li-polymer, Li-sulfur, and Li-ion are widely used in this field. Li-polymer and Li-sulfur have, respectively, higher power density and energy density compared to Li-ion, but our choice of the lithium-ion battery was prompted by the need for a long-range aircraft to be lightweight and efficient in the same time, in addition other parameters influenced this choice: our laboratory is only equipped with Li-ion batteries, this type of batteries were used in the architecture that we adopted from the literature, Li-polymer batteries performance is highly affected by low temperatures, which is the operating condition for our UAV, and Li-S have lower power density compared to Li-ion batteries.
Most of the studies use the internal resistance model for its simplicity. 18 The battery model given in the equation (10) comprises an electromotive force E0b that models the battery’s open-circuit voltage, a capacitor that models the battery’s internal capacity C b , and its internal resistance R b . 9
The battery voltage is given by: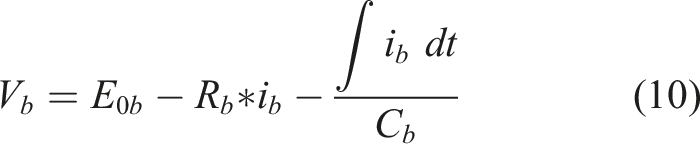
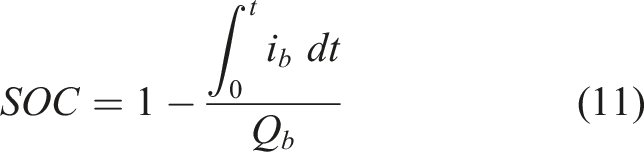
The battery state of charge is expressed by
19
:
DC bus model
The DC bus is the component that connects the power train to the load which is highly required for the parallel connection of power sources.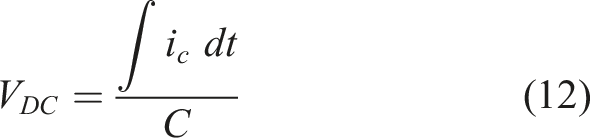
DC/DC converters models
DC/DC power Converters are required to be used as an electronic interface between the power sources (FC and battery) and the load in order to guarantee specific performance features, such as an appropriate (DC) voltage level, FC protection, and energy management between the sources. In fact, The DC/DC boost converter is used to boost up the FC output voltage since its output voltage is low with high current, while the DC/DC reversible converter is employed to use the battery in both charge and discharge phases.
DC/DC boost converter
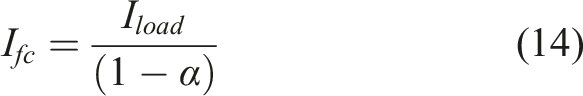
The output voltage V
DC
of the DC/DC Boost converter is set by the duty cycle α. With α is the ratio between the switch conduction period αT and the whole sampling period T. Where: I
load
is the equivalent load current requested from the DC bus, and L
DC
is the boost inductance. The static model is represented by the following equations: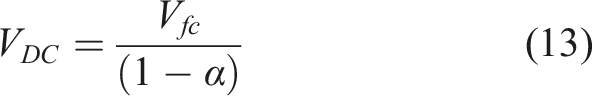
DC/DC bidirectional converter
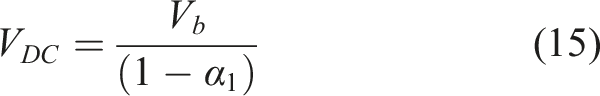
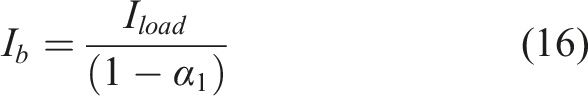
The output voltage V DC of the DC/DC bidirectional converter is set by the duty cycles α1 and α2, generated through a pulse width modulation (PWM) unit. In fact, in the battery discharging phase (boost mode) α1 is the ratio between the T1-switch conduction period α1T and the whole sampling period T, and in the charging phase, α2 is the ratio between the T2-switch conduction period α2T and the whole sampling period T.
Where: Ib_DC: the battery current injected or taken from the DC bus, and L b is the chopper inductance.
The bidirectional converter has two distinct operating modes: a buck mode when the battery is in charging and a boost mode when it is discharging. The average model is given by the following equations where α1 and α2 are the control commands: (1) In the boost operating mode (2) In the buck operating mode


FC-battery hybrid electric source sizing
In the literature, several optimal sizing techniques of HES components have been proposed and can be classified into three main categories, 15 namely: experience-based sizing technique, equivalent calculation-based sizing technique, and optimization-based sizing technique.
In this work, the optimization-based sizing technique of the HES is chosen and the optimization process can be presented in three ways: it can only focus on component characteristics (sources rated power, motor rated power, and speed), or it can focus on the energy management strategy or it can combine the two aspects, as presented in some works.
This paper focuses on fuel cell and battery system sizing. The power management is not optimized, but it is included and called during the sizing process to check the constraints. Hence, the PSO algorithm, invented by James Kennedy and Russell Eberhart in 1995, 20 is the optimization approach used in this study. This algorithm is a simple and smart optimization method based on the notion of food search in swarms of birds known as populations, with each bird referred to as a particle. 21 To determine the next position, the method employs the particle position, the best personal position (P best ) of each particle in the population, and the population’s global best position (G best ). The PSO advantages, like those of other meta-heuristic algorithms, are that it is a robust method and it can solve optimal objectives in global optimization and nonlinear problems.22,23
Problem formulation
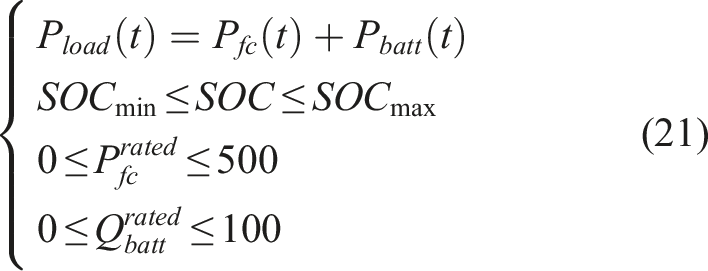
Because the weight is one of the most essential factors to optimize in embedded systems, especially for UAVs, the total weight of the sources is used as the objective function in this study:
The optimization problem is expressed as follows:
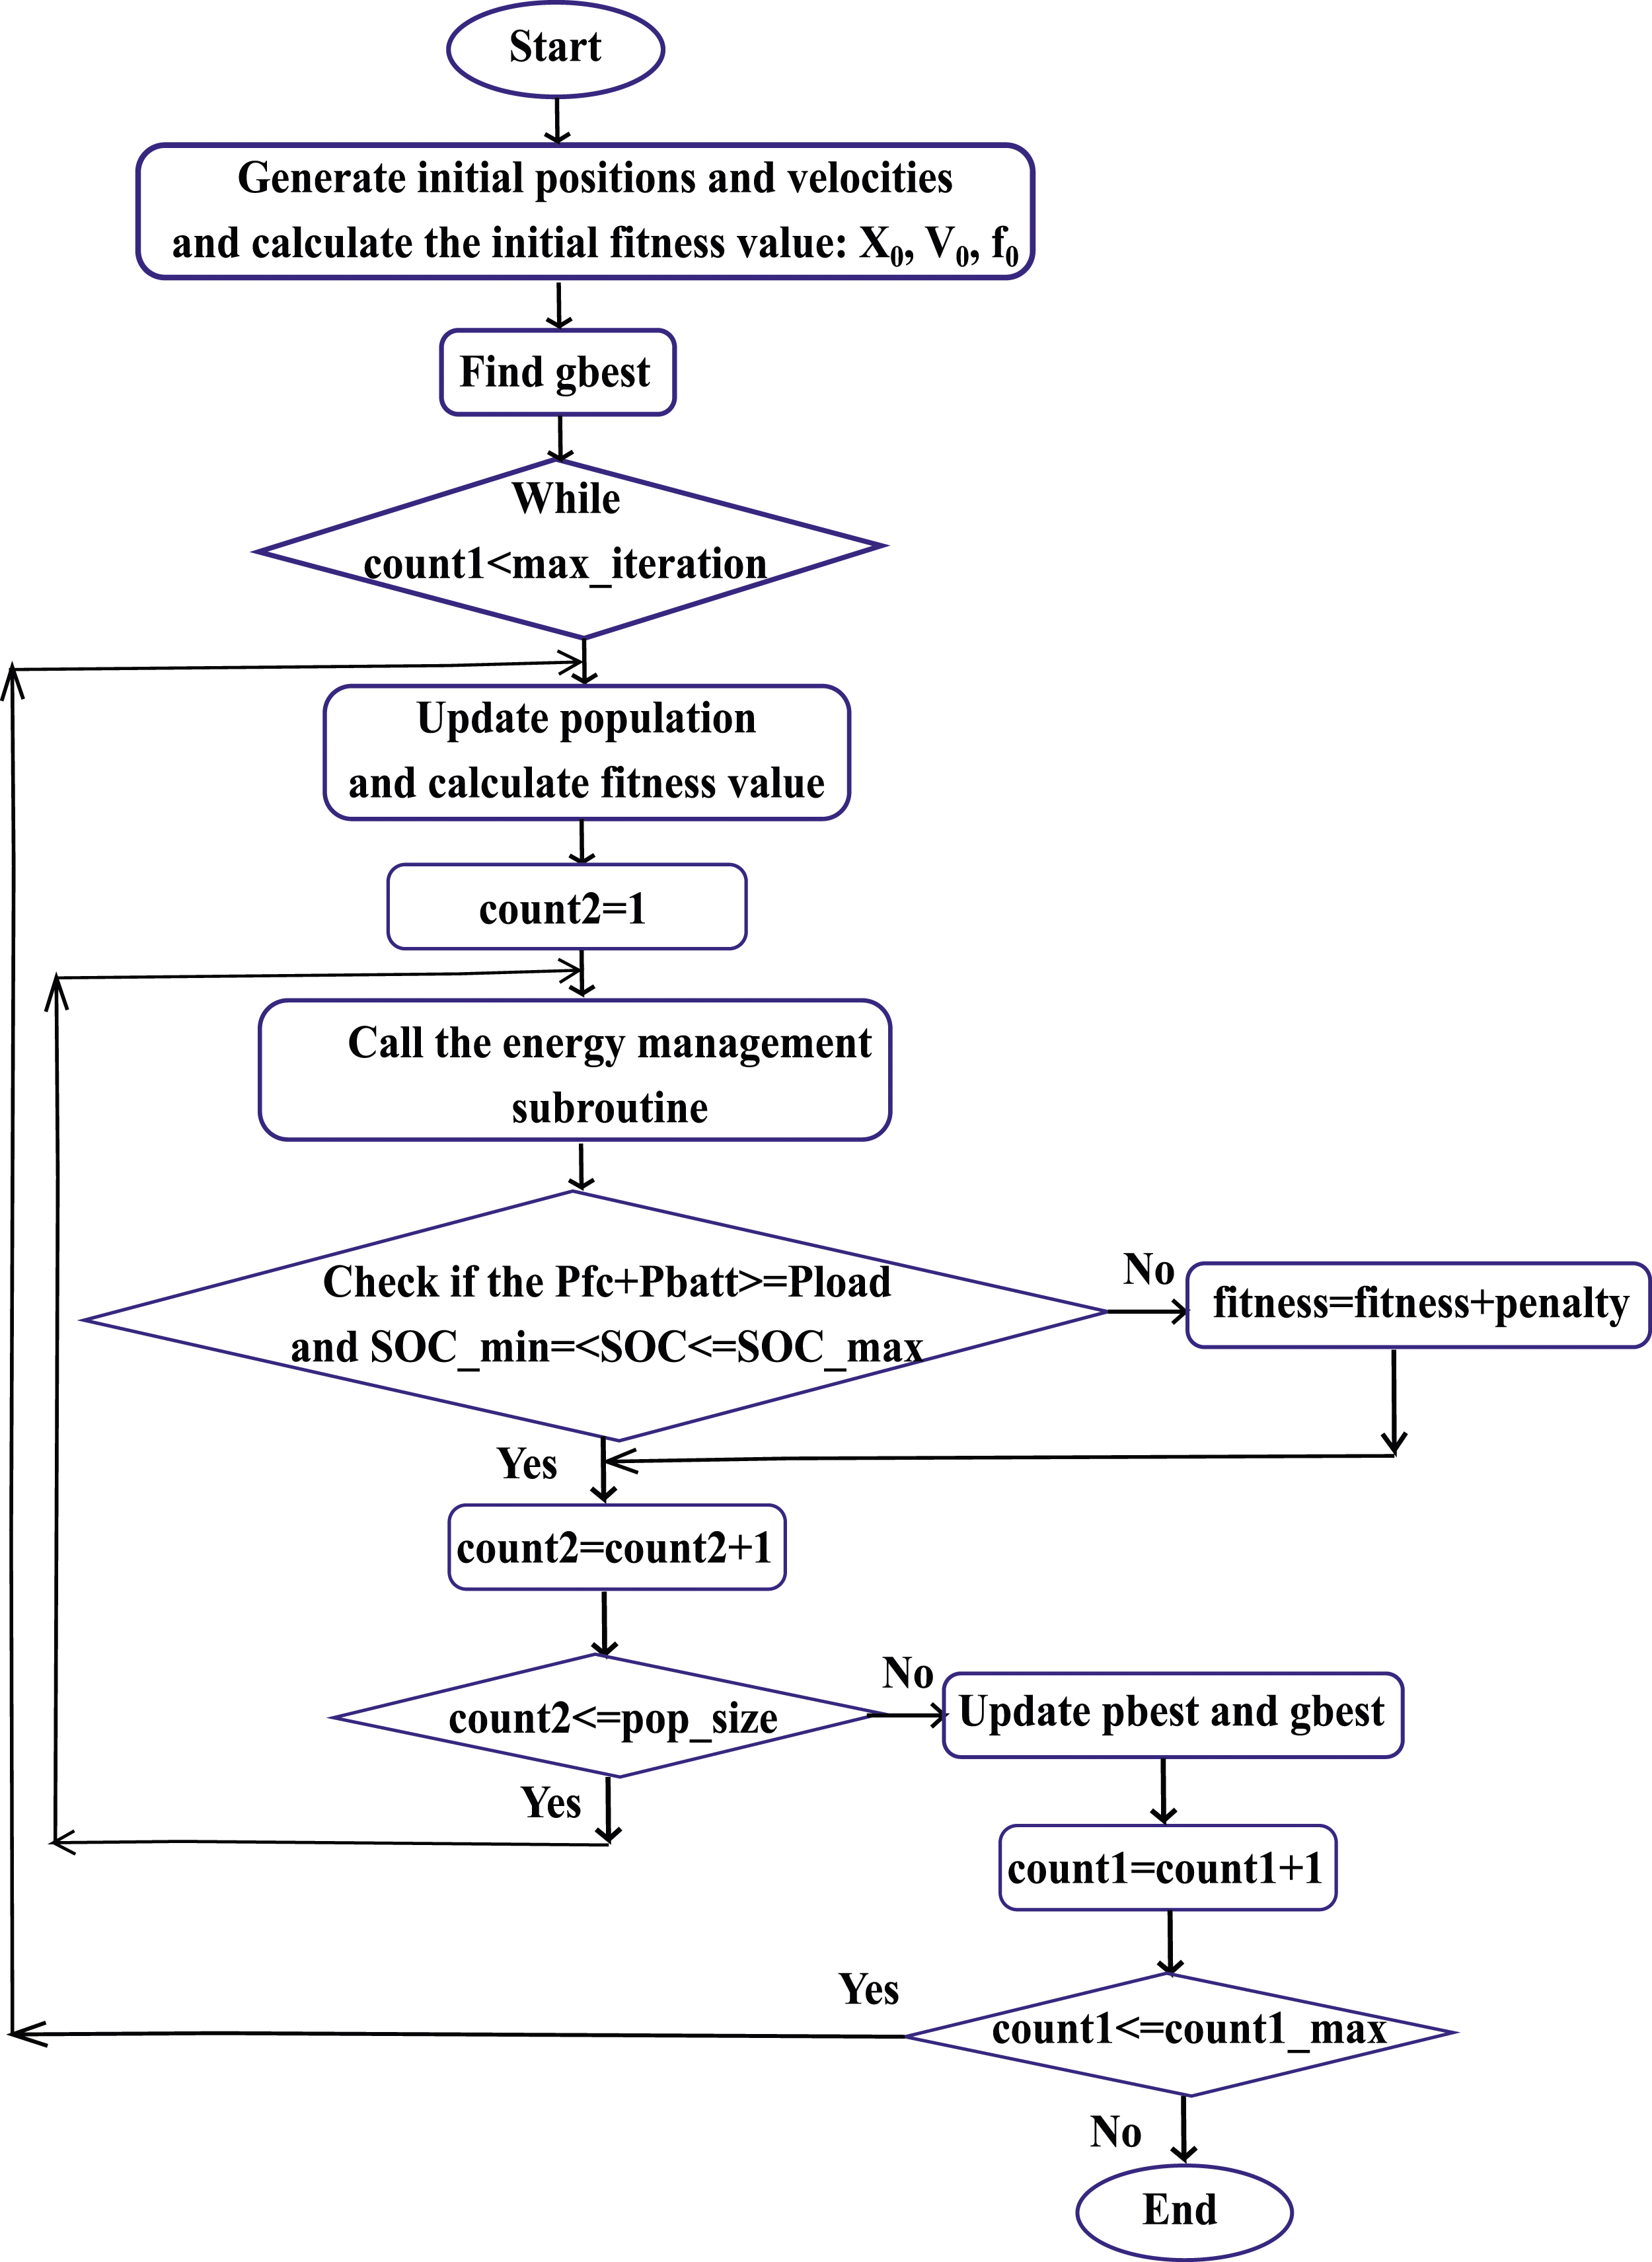
The algorithm generates the initial population, velocity, and fitness x0, v0, and f0 and calculates the global best position G
best
as shown in the optimization process flowchart of Figure 4. After that, it uses the equations to update the population after updating the velocities and positions
24
: Flowchart of the sizing process.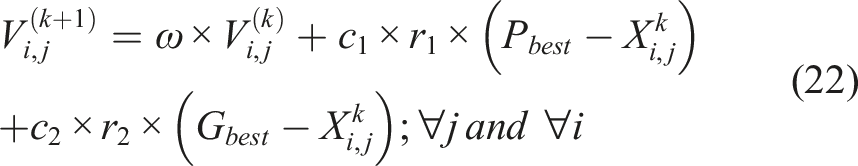

The weighting function is given by the equation (24):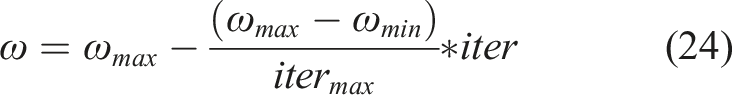
The equation (19) of the total weight is used to calculate fitness. If the constraints are met, the algorithm updates the population’s P best and G best ; otherwise, it adds a penalty to the fitness to eliminate the corresponding agent. The algorithm repeats until the maximum number of iterations is reached.
Optimal sizing results
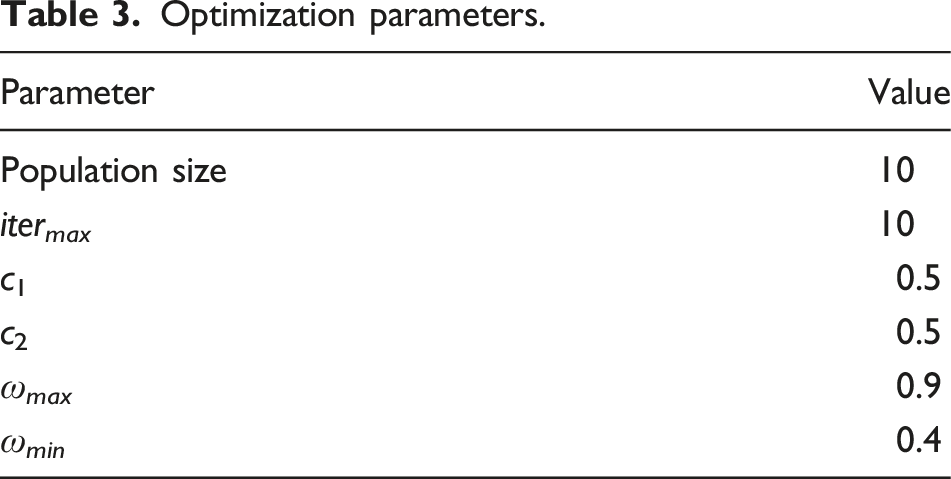
Optimization parameters.
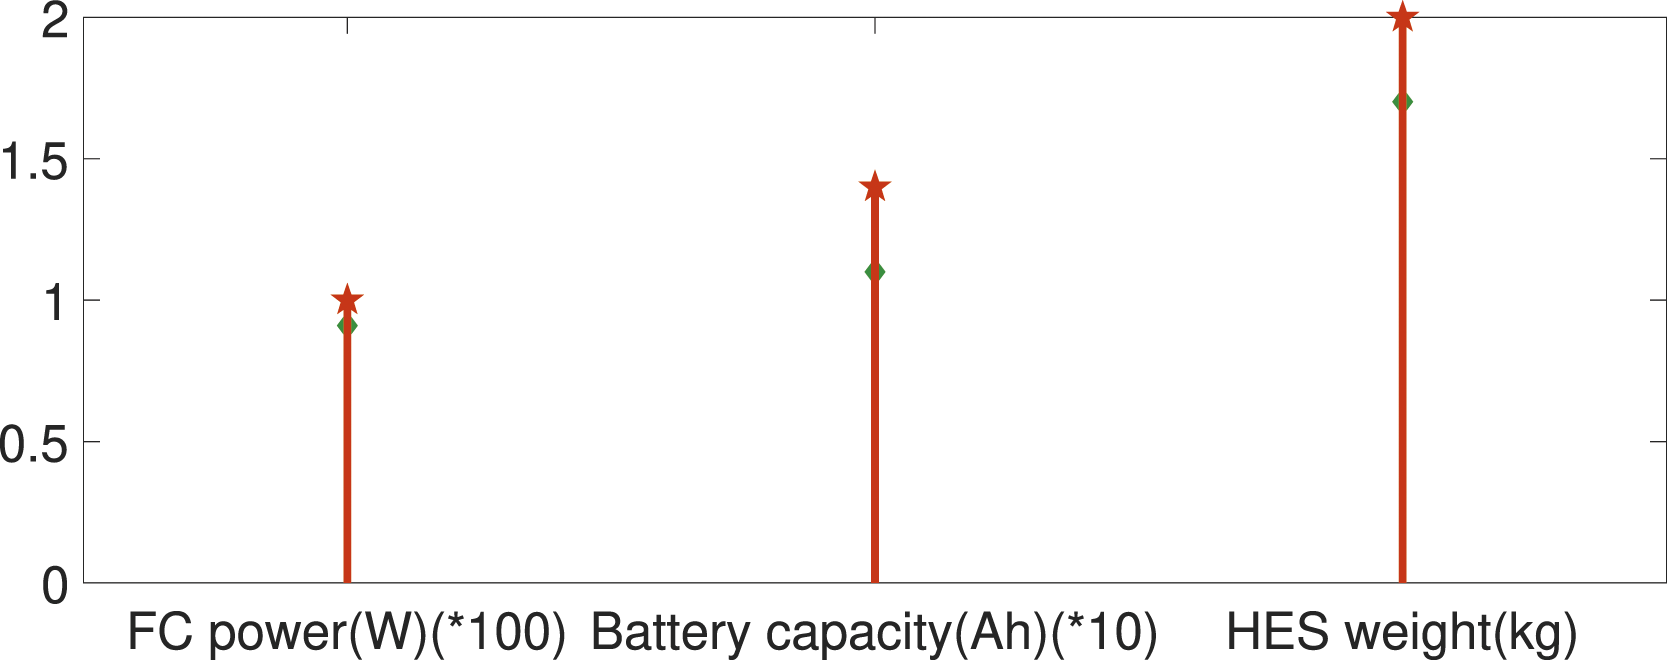
Optimization results.
For the purpose of comparison, the data found in the Ref. 8 are adopted as the base of comparison in order to evaluate the optimal sizing technique presented in this paper. The optimal sizing results performed a weight reduction of 8% of the overall weight of the sources, permitting 10% weight reduction for the FC and 6.14% for the battery; this gain saves a total energy of 90.28 kJ that can extend the “endurance stage” by more than 26 min (FC and battery specific energy 200 wh/kg, and 110 wh/kg).
Power management strategies
The hierarchical power management and control of the whole power system are composed of three layers (Figure 6): the power management layer, the control layer, and the HES. Truthfully, the power management layer has to define the optimized amount of power for each power source while the control layer controls the DC/DC converters to generate the power references issued from the power management layer by using current references. This section focuses mainly on the power management layer which uses an appropriate power management strategy to distribute the required power references between the FC and the battery. In this field, several studies were interested in power management for fixed-wing EUAVs. In Ref. 25, the author developed a rule-based technique to estimate load sharing across the sources and employed simulation and hardware-in-the-loop simulation to examine the benefits of hybridization in a fuel cell-battery system with solar cells. Despite the little weight gain, this hybridization saves approximately 59% of hydrogen. Based on altitude and battery power, a new rule-based Energy Management Strategy (EMS) was investigated in Ref. 26. The method is divided into three stages: the battery is recharged and gravitational potential is stored in the first stage, which takes place during the day. The gravitational potential is released in the second, and the battery provides power in the third. The simulation and hardware-in-the-loop test results of a hybrid fuel cell/battery power system for a long-endurance small UAV and various battery states of charge were presented in Ref. 27. The simulation includes a rule-based control method, and the hybrid power system may power the UAV during different stages of flight. Because it operates at constant output power, the stack efficiency is likewise optimized. Hierarchical power management and control of HES.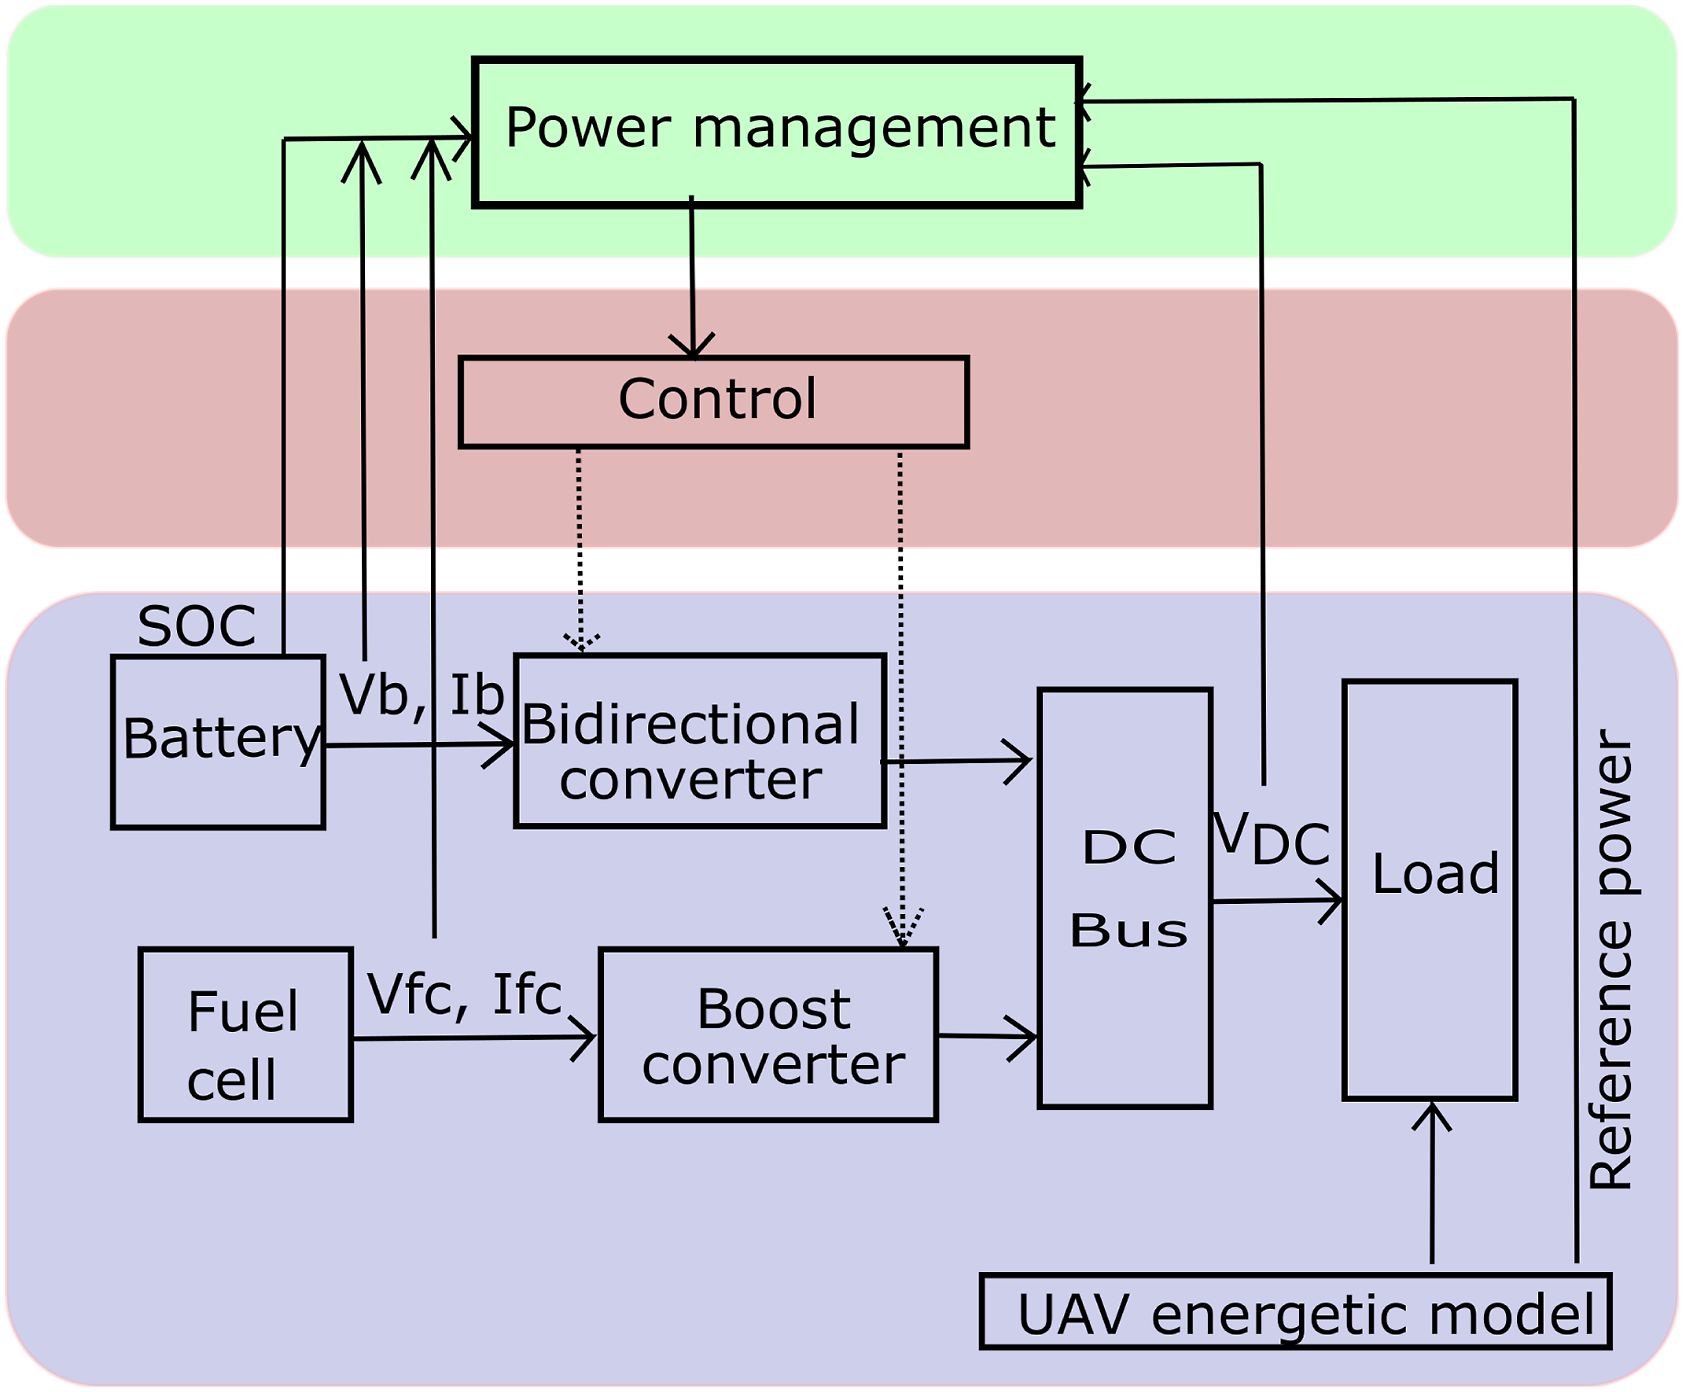
According to the demand power and battery state of charge, the authors in Ref. 28 presented an online fuzzy energy management method to control the output current of an FC through the control of a DC-DC current converter. When this method is compared to the passive control strategy and the state machine strategy for three different profiles, it is clear that the online fuzzy technique has the best fuel consumption performance. Adaptive neuro-fuzzy energy management is utilized in Ref. 29 to maximize the FC output power in a UAV with a FC-battery power system. The power flow of the battery is decided using an event-based decision technique based on the battery state of charge and load power. According to the obtained results, this hybrid electric propulsion system has a long endurance capability (more than 2 hours compared to the combustion engine-powered UAV). In a study presented in Ref. 19, the authors compared Fuzzy State Machine (FSM) energy management in a PV/Fuel Cell/Battery UAV to the thermostat method in a gasoline Aerosonde UAV in terms of power, energy contribution from sources, battery SOC, and H2 consumption. They discovered that the FSM outperforms the thermostat in terms of power distribution and fuel usage, saving 26.7% of hydrogen fuel. For a low-speed and long-endurance UAV, the research published in Ref. 11 looked into passive, and active constrained thermostat power management techniques (EAV-2). Active power management is more efficient and safer than passive power management, according to simulation results. The power system illustrated in Ref. 30 is a PV-FC-Battery hybrid system. The power control of the sources is performed using the finite state machine (FSM) concept.
In this optic, three standard online power management strategies have been presented and then a hybrid power management strategy has been proposed for the purpose of power optimization. The relevant PMS’s schemes are presented in Figure 7. Studied PM strategies schemes. (a) FL-PMS, (b) FS-PMS, (c) PL-PMS, and (d) HPMS.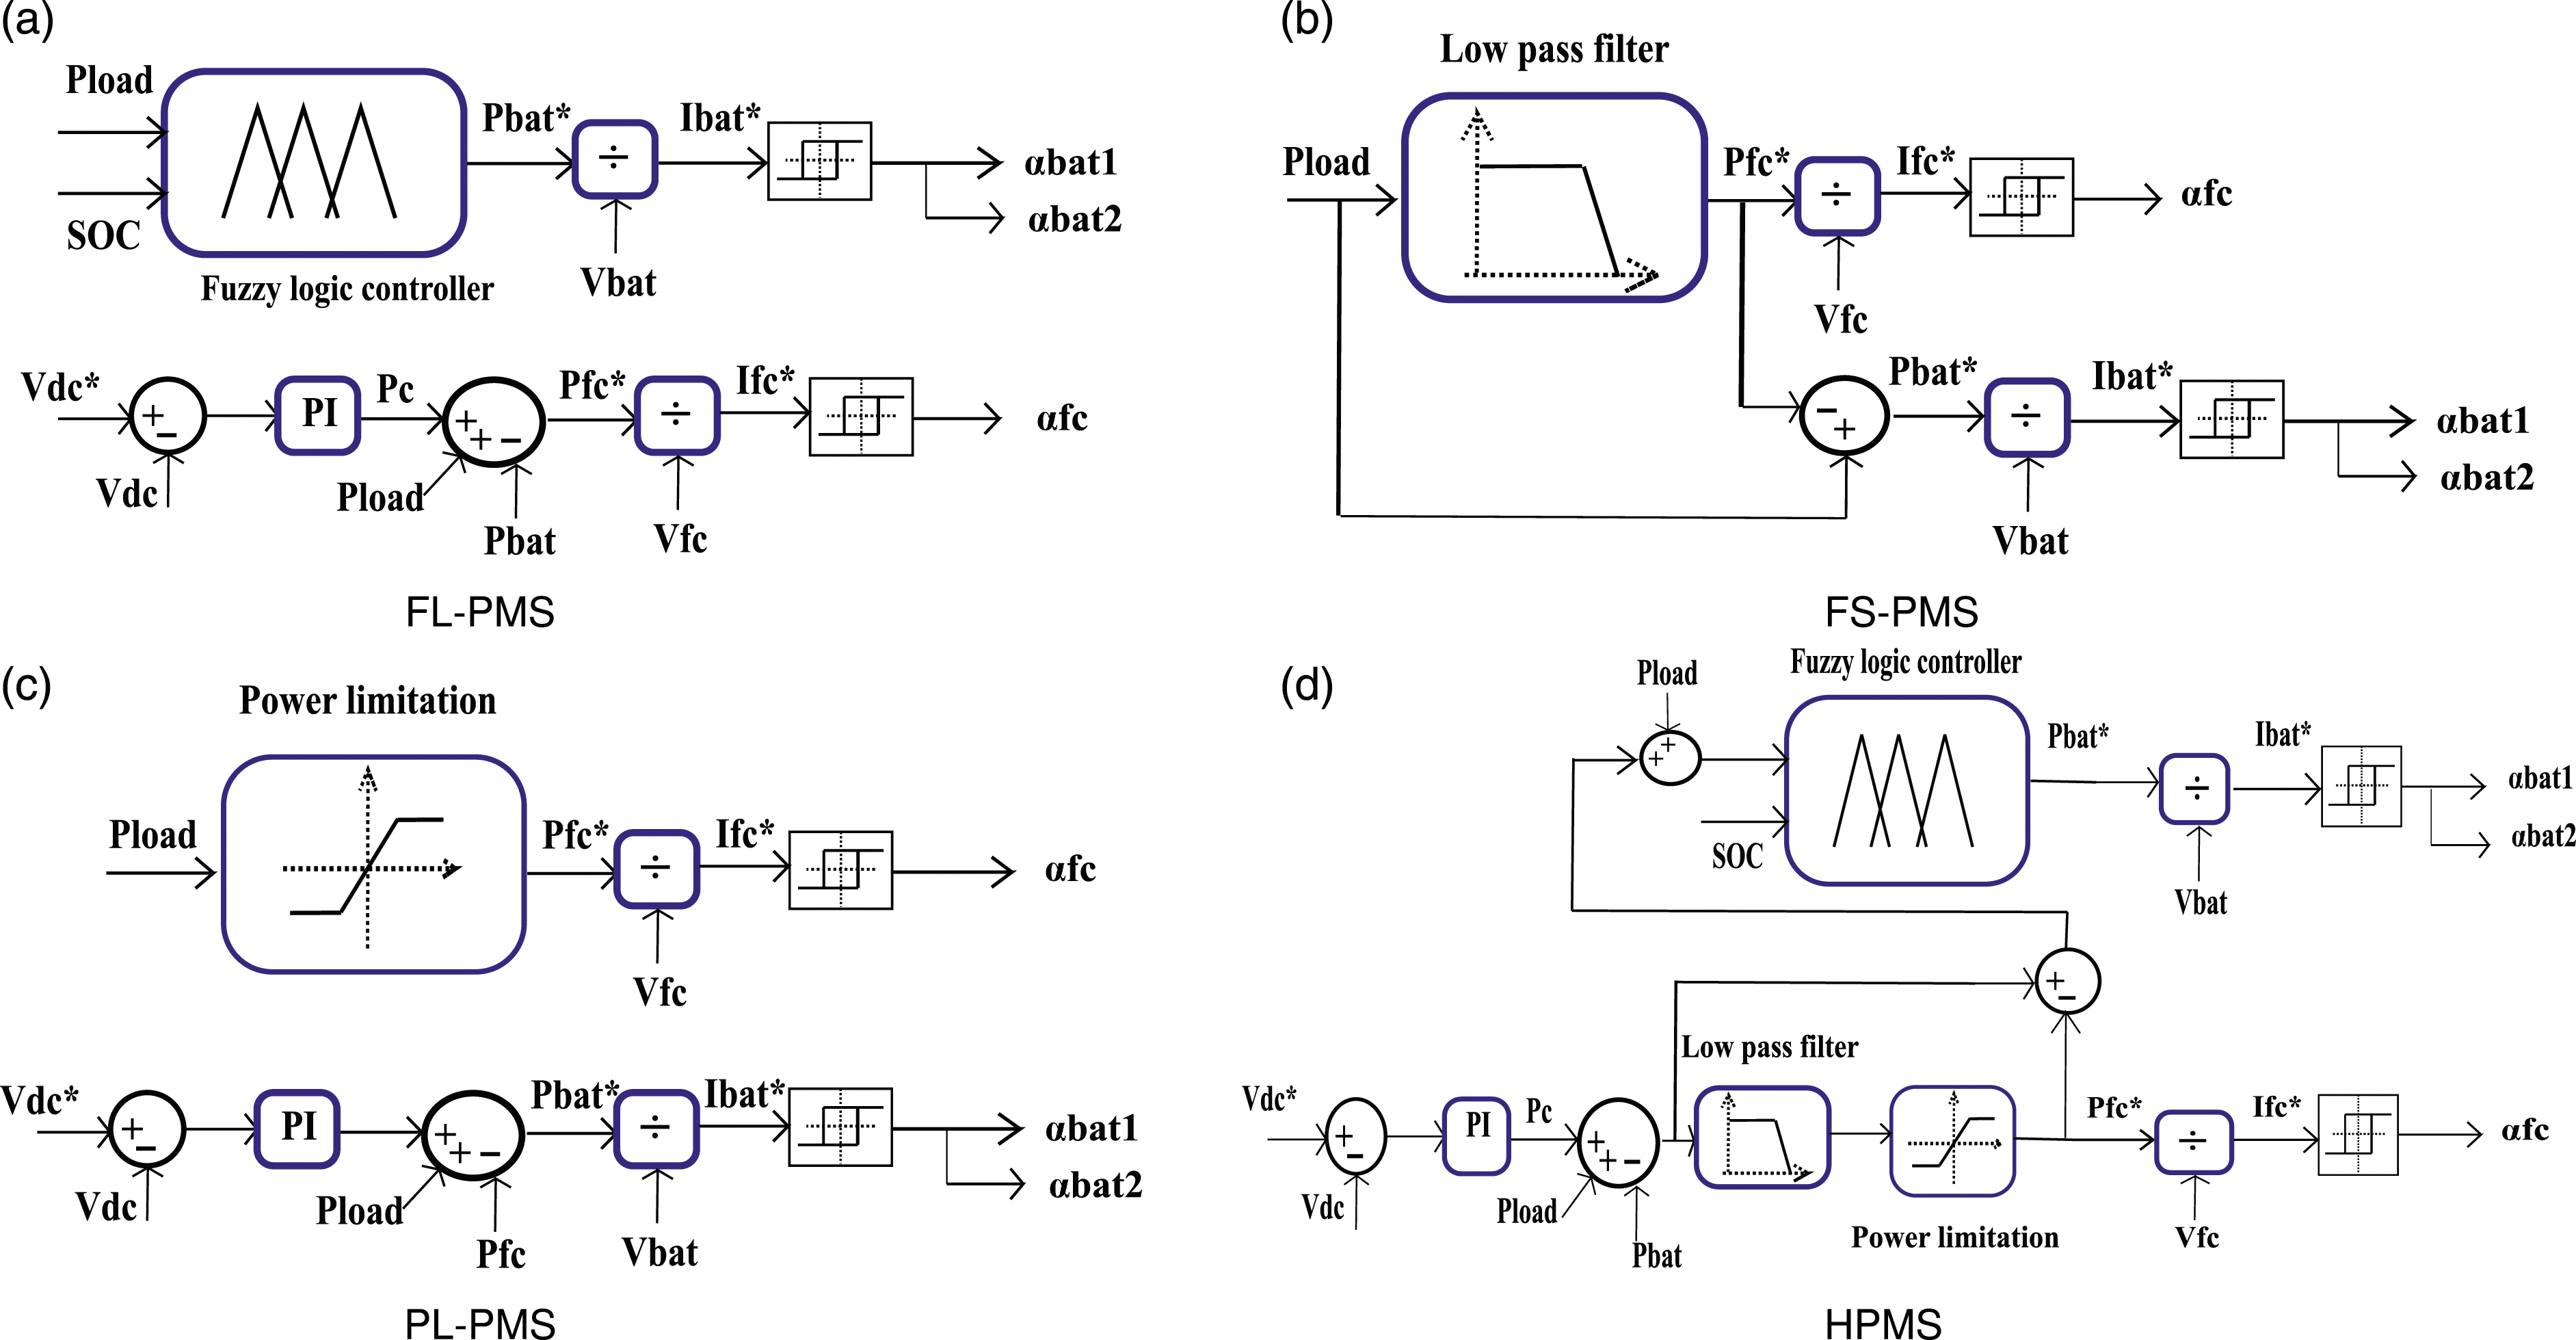
Fuzzy logic-based power management strategy (FL-PMS)
This strategy is based on fuzzy logic, which is considered as an intelligent meta-heuristic technique that enables the formulation of uncertainties owing to a general comprehension of a very complicated system and the description of its behavior in words.8,25
Inference rules.
The use of FL control in the power management of the HES has the main advantage of controlling the battery SOC, but it doesn’t allow the smoothing of the fuel cell response.
Frequency separation-based power management strategy (FS-PMS)
The frequency separation-based power management strategy is the second power management strategy studied in this research (Figure 7(b)). The essential idea behind this strategy is to use a low-pass filter to split the needed reference power into high- and low-frequency components.31,32 Thus, the FC provides the low-frequency component, while the battery, which has a faster dynamic, provides the high-frequency component. This approach provides a smooth FC response but does not permit battery SOC control.
Power limitation-based power management strategy (PL-PMS)
The power limitation-based power management approach, presented in Figure 7(c), is the third strategy given in this study. This strategy employs a traditional method based on the saturation of power given by one of the sources. The fuel cell’s output is limited to a maximum of 200 W in our study, and the battery covers up the difference. This limit selection is based on the mission’s mean power and the internal characteristics of the components. 33 This approach allows the regulation of the DC bus voltage, however, it does not control the SOC or smooth the FC current.
Hybrid power management strategy (HPMS)
The concept of this hybrid controller design is based on an analysis of simulation and experimental findings obtained with the linear and nonlinear controllers described above individually. Fuzzy logic-based PMS alone proved its performance in power management applications for electric vehicle and UAVs, however, some of its drawbacks were not investigated: the fuel cell is not protected against abrupt power changes, that can damage its membrane, in addition the FC exceeds its maximum power when high demand of power occurs; this motivated this work that proposes a Hybrid PMS able to overcome the drawbacks of FL-PMS and protect the FC which is very costly, by its hybridization with two other strategies: FS-PMS that filters the FC response and PL that limits the FC power to its maximum value.
As shown in the scheme of the proposed technique, presented in Figure 7(d), to obtain the power of the FC, the battery reference power is first generated from the fuzzy logic without changing the rules from the first technique, and then the FC power is deduced from the DC bus, the load, and the battery power. The high-frequency power component and the extra power over the FC maximum power are then extracted from the FC power, and these components are added to the load power that is introduced as an input of the fuzzy logic controller.
This combination gathers the advantages of the three strategies through the regulation of the DC bus voltage by the PI controller, the control of the SOC through the FL, the smoothing of the FC response by the FS, and the limitation of the FC delivered power by the PL.
Results and discussions
This section presents the simulation findings of the PMSs as well as their related experimental validations. MATLAB/Simulink software is used to implement and analyze the simulation results. For better observation of the strategies’ behavior, an initial state of charge of 50% is chosen, and the four methods are implemented for 3 min rather than 3 h.
Experimental test bench
The experimental test bench comprises: a 28 V DC source controlled by a DC/DC buck converter to emulate the FC characteristic, and the battery which is constituted of two batteries of 12 V rated voltage and 5 Ah rated capacity, connected in series in order to have the 24 V rated voltage in the input. The test bench also contains a power converter in the same module combining: the boost converter connected to the FC, and the bidirectional converter connected to the batteries with their respective coils. Another module of converters composed of a boost and a buck converter connected to a resistor is used in the output to represent the electronic load employed to reproduce the desired power profile. The whole test bench is controlled by uploading the Simulink model to a control board; this last generates the control signals of the converters. A sensor board is also used to get the necessary signals from the test bench and delivers them to the control board.
FL-PMS results
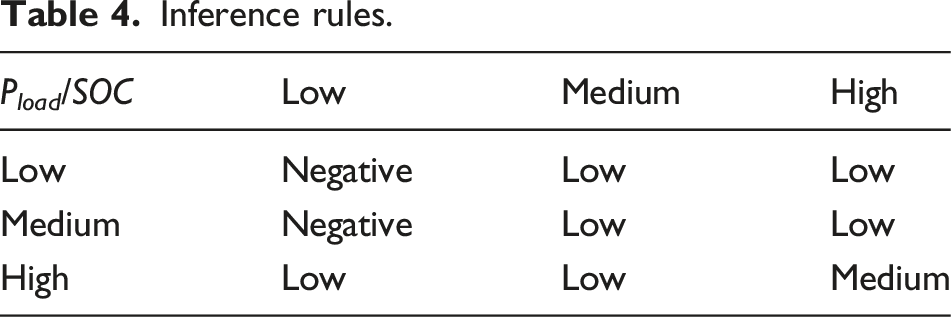
The simulation and experimental findings are given jointly in Figure 8 to examine the FL-PMS. Figure 8(a) depicts the load power and the power provided by the sources, while Figure 8(b) illustrates the battery SOC. It can be noticed that the simulation and experimental results are nearly the same. Simulation and experimental results of FL-PMS. (a) FC power, battery power, and load power and (b) battery SOC.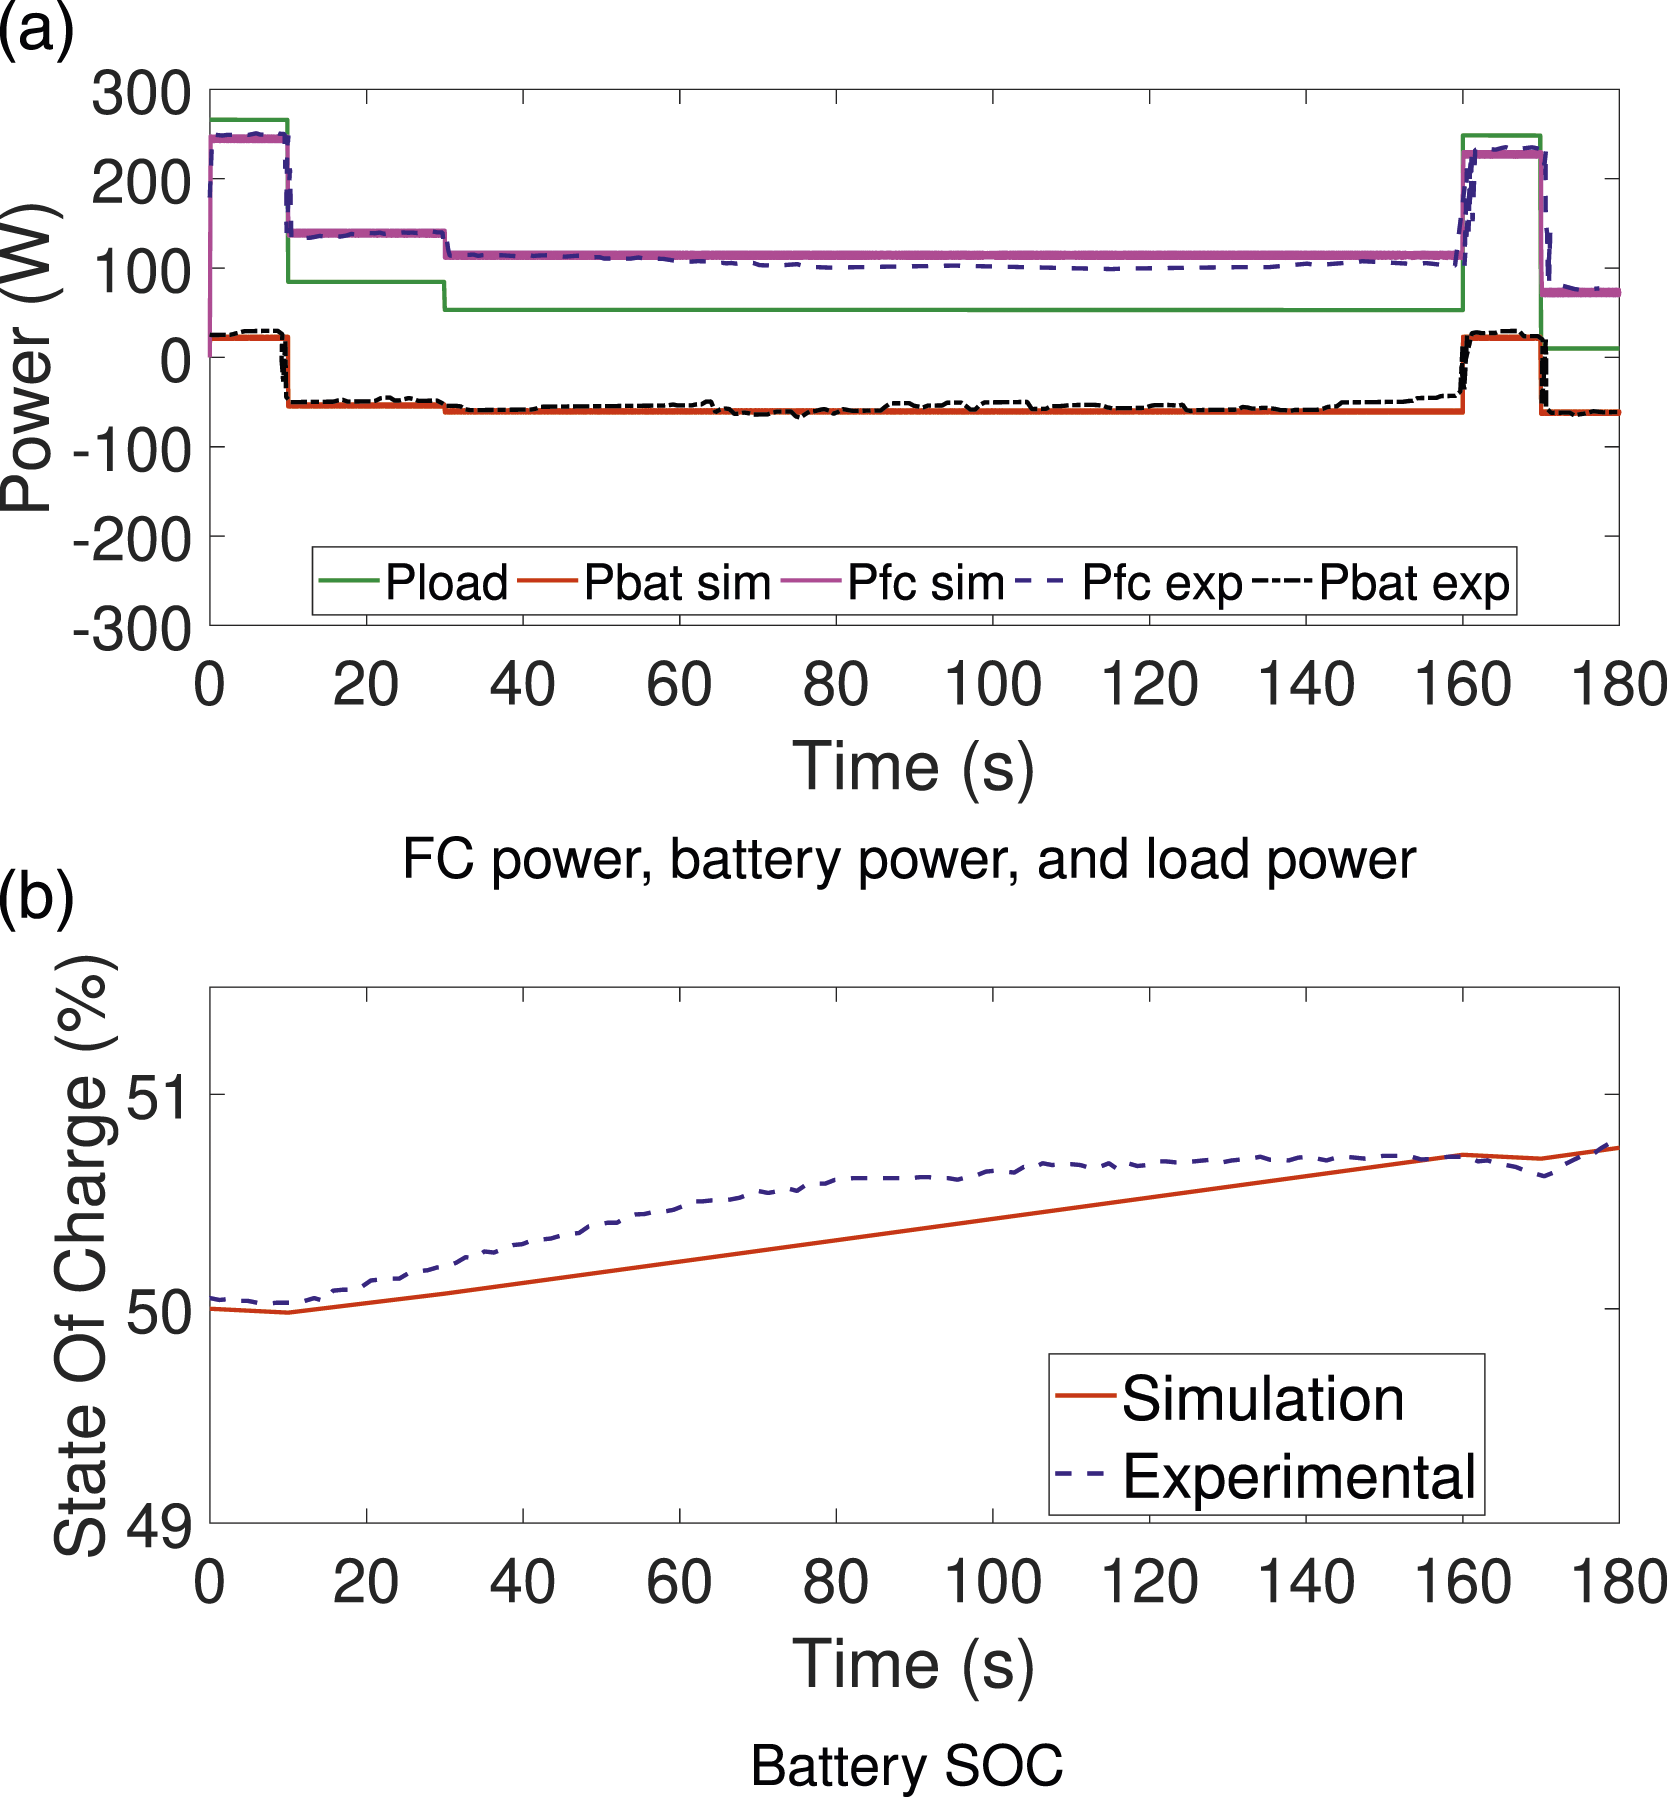
In the take-off phase, which demands the highest power, both the FC and the battery supply the load, the SOC decreases, and the battery enters the “discharging mode.”
During the cruising phase, the load power is lower, so the FC powers both the battery and the load. The battery switches to the “charging mode” and its SOC increases. In the endurance phase, the FC continues to charge the battery, and it is observed that the battery consumes the most power during this phase because it is the phase that requires the least power.
When the maximum velocity phase is reached, the FC power increases while the SOC lowers since the battery is now enabled to sustain the FC. Because the power consumption is minimal after this phase, the battery is charged and its SOC rises. The quantity of power delivered by the battery is low in these results, which is due to its low SOC.
The results obtained with the FL-PMS show its effectiveness. This strategy incorporates the SOC into the power split decision and guarantees the battery charging; however, the FC current is not smooth, which is the strategy’s main drawback.
This strategy can be implemented on its own and has several benefits, but because of the abrupt changes in power, the FC is exposed to the risk of dehydration, which can damage its membrane. This main drawback motivated the hybridization of this strategy with others.
FS-PMS results
The FS-PMS test results are shown in Figure 9. The power flow (Figure 9(a)) demonstrates that the FC slow dynamic is respected, that is, the battery provides positive power peaks while absorbing negative ones during transient periods, while the FC supplies the load alone during steady state; however, the SOC in Figure 9(b) is not controlled and decreases slightly, exposing the battery to the risk of deep discharge, which reduces its lifetime. Simulation and experimental results of FS-PMS. (a) FC power, battery power, and load power and (b) battery SOC.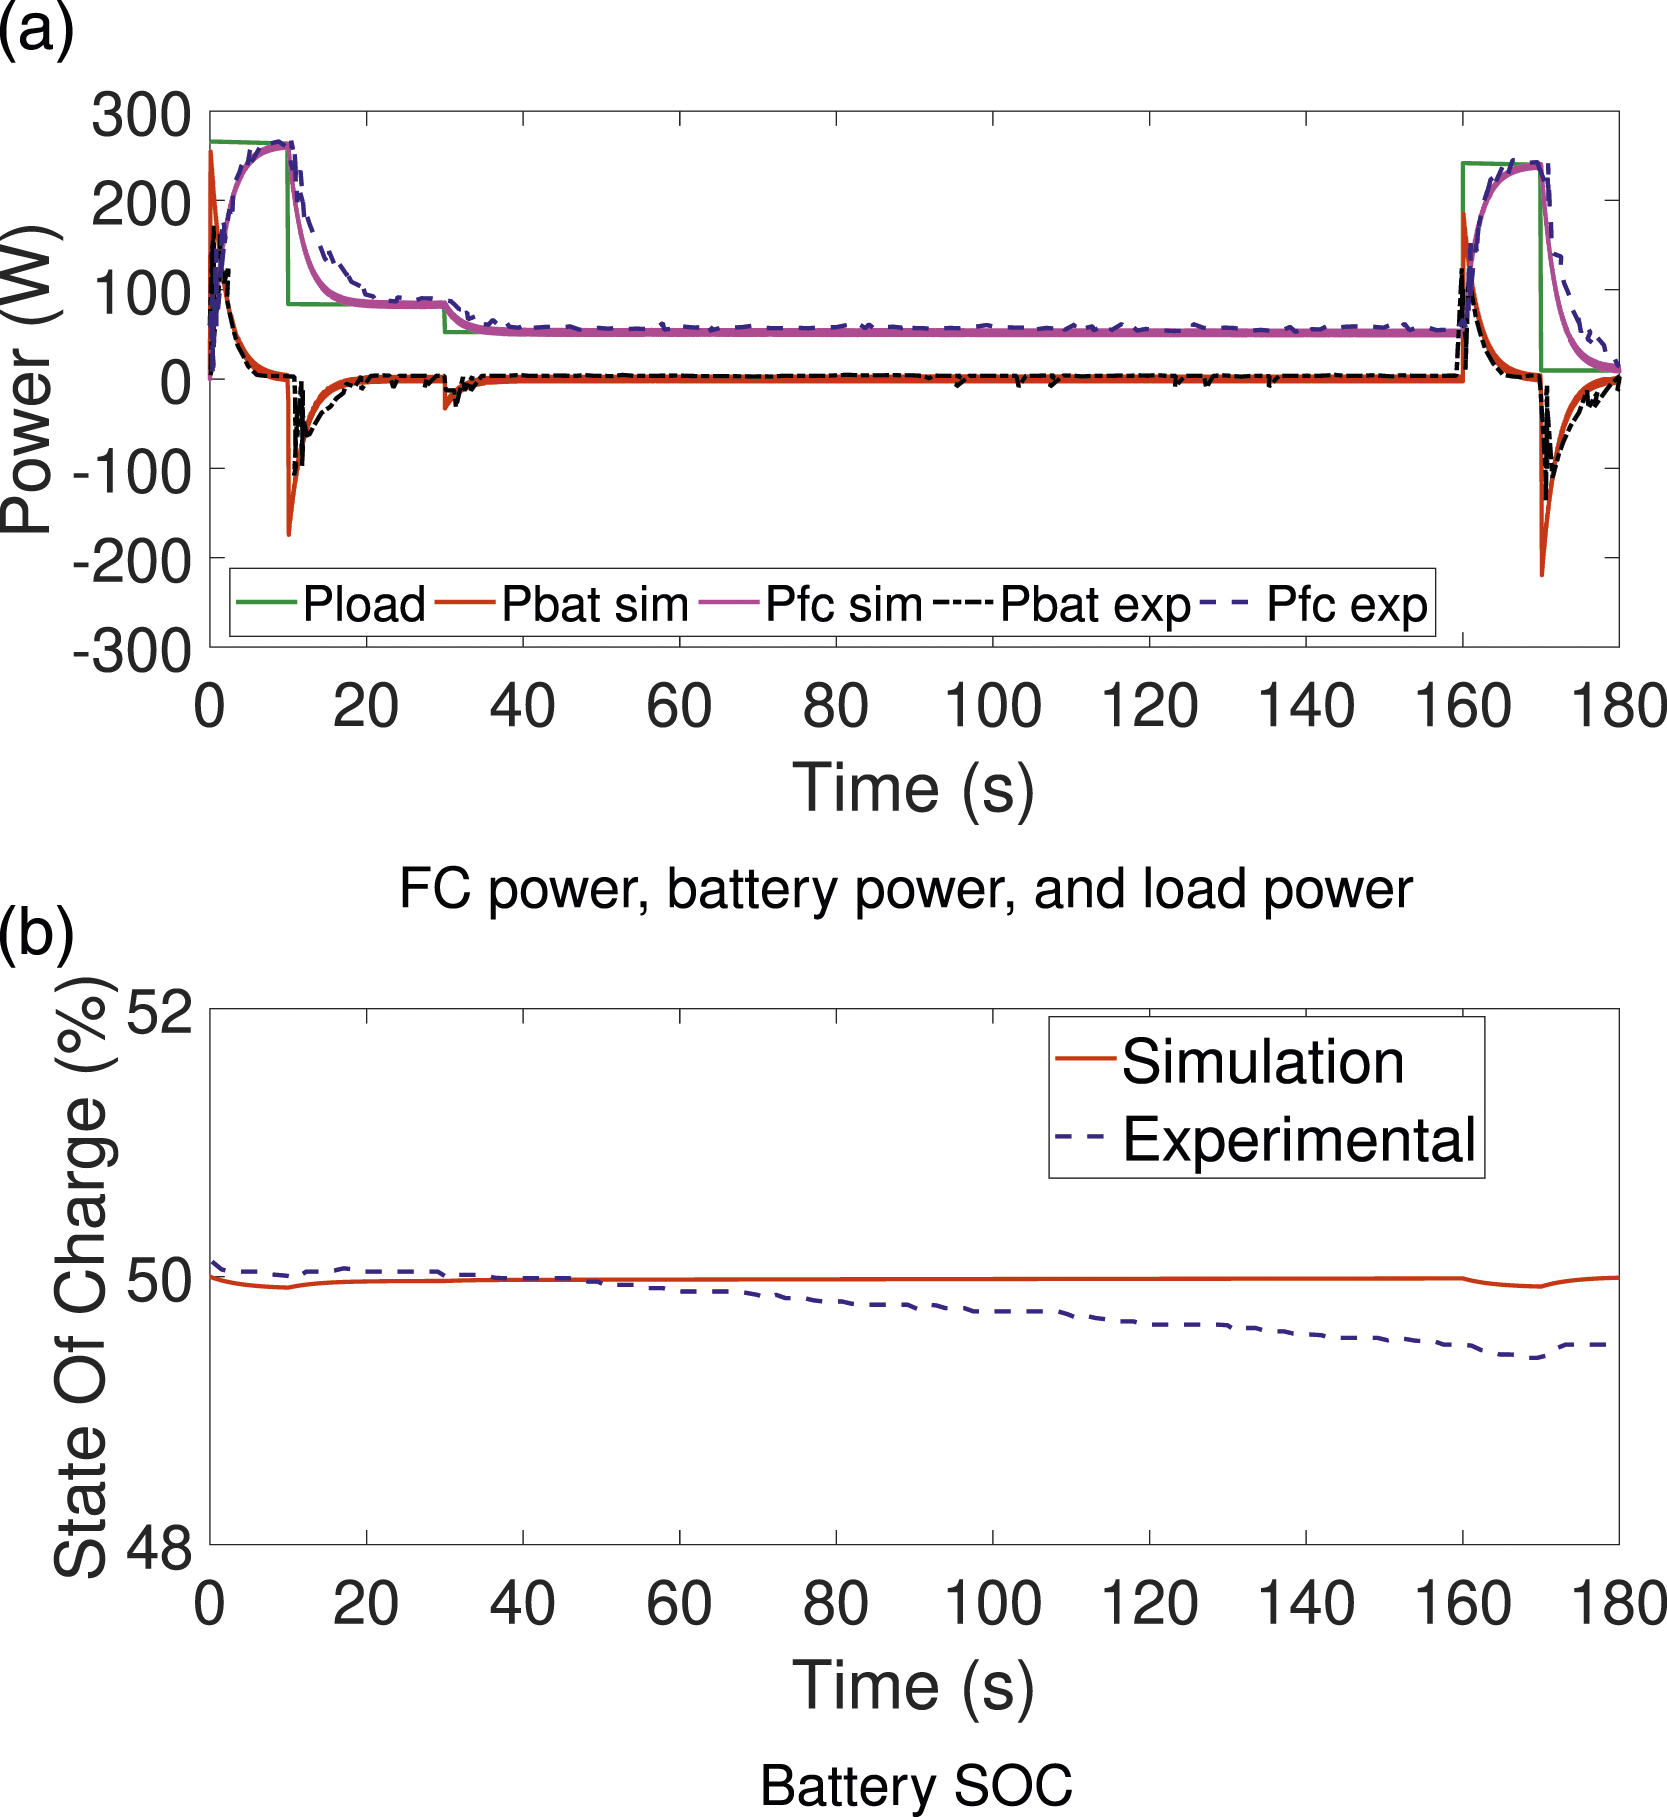
Based on these findings, it can be concluded that while this technique successfully distributes load power between the sources and protects the FC from rapid responses, it cannot be employed alone because it has no control on the battery’s SOC.
PL-PMS results
According to the PL-PMS test results (Figure 10), both power sources supply the load during high power demand (take-off and maximum velocity phases), as illustrated by Figure 10(a), ensuring that the FC power does not exceed its maximum value of 200 W. In the other phases, the FC supplies the required power to the load while the battery is in “standby mode.” It is observed in Figure 10(b) that the battery is not recharged, and its SOC continues to decrease as long as the battery delivers power; also, the fuel cell response is abrupt. Simulation and experimental results of PL-PMS. (a) FC power, battery power, and load power and (b) battery SOC.
These findings demonstrate that the PL-PMS is unable to regulate the SOC. Additionally, the FC responds abruptly when there is a strong demand for power, which reduces its lifespan. Therefore, PL-PMS is not recommended for UAV applications.
HPMS results
The test results of the proposed HPMS which is the hybridization of FL-PMS, FS-PMS, and PL-PMS are shown in Figure 11. Simulation and experimental results of HPMS. (a) FC power, battery power, and load power and (b) battery SOC.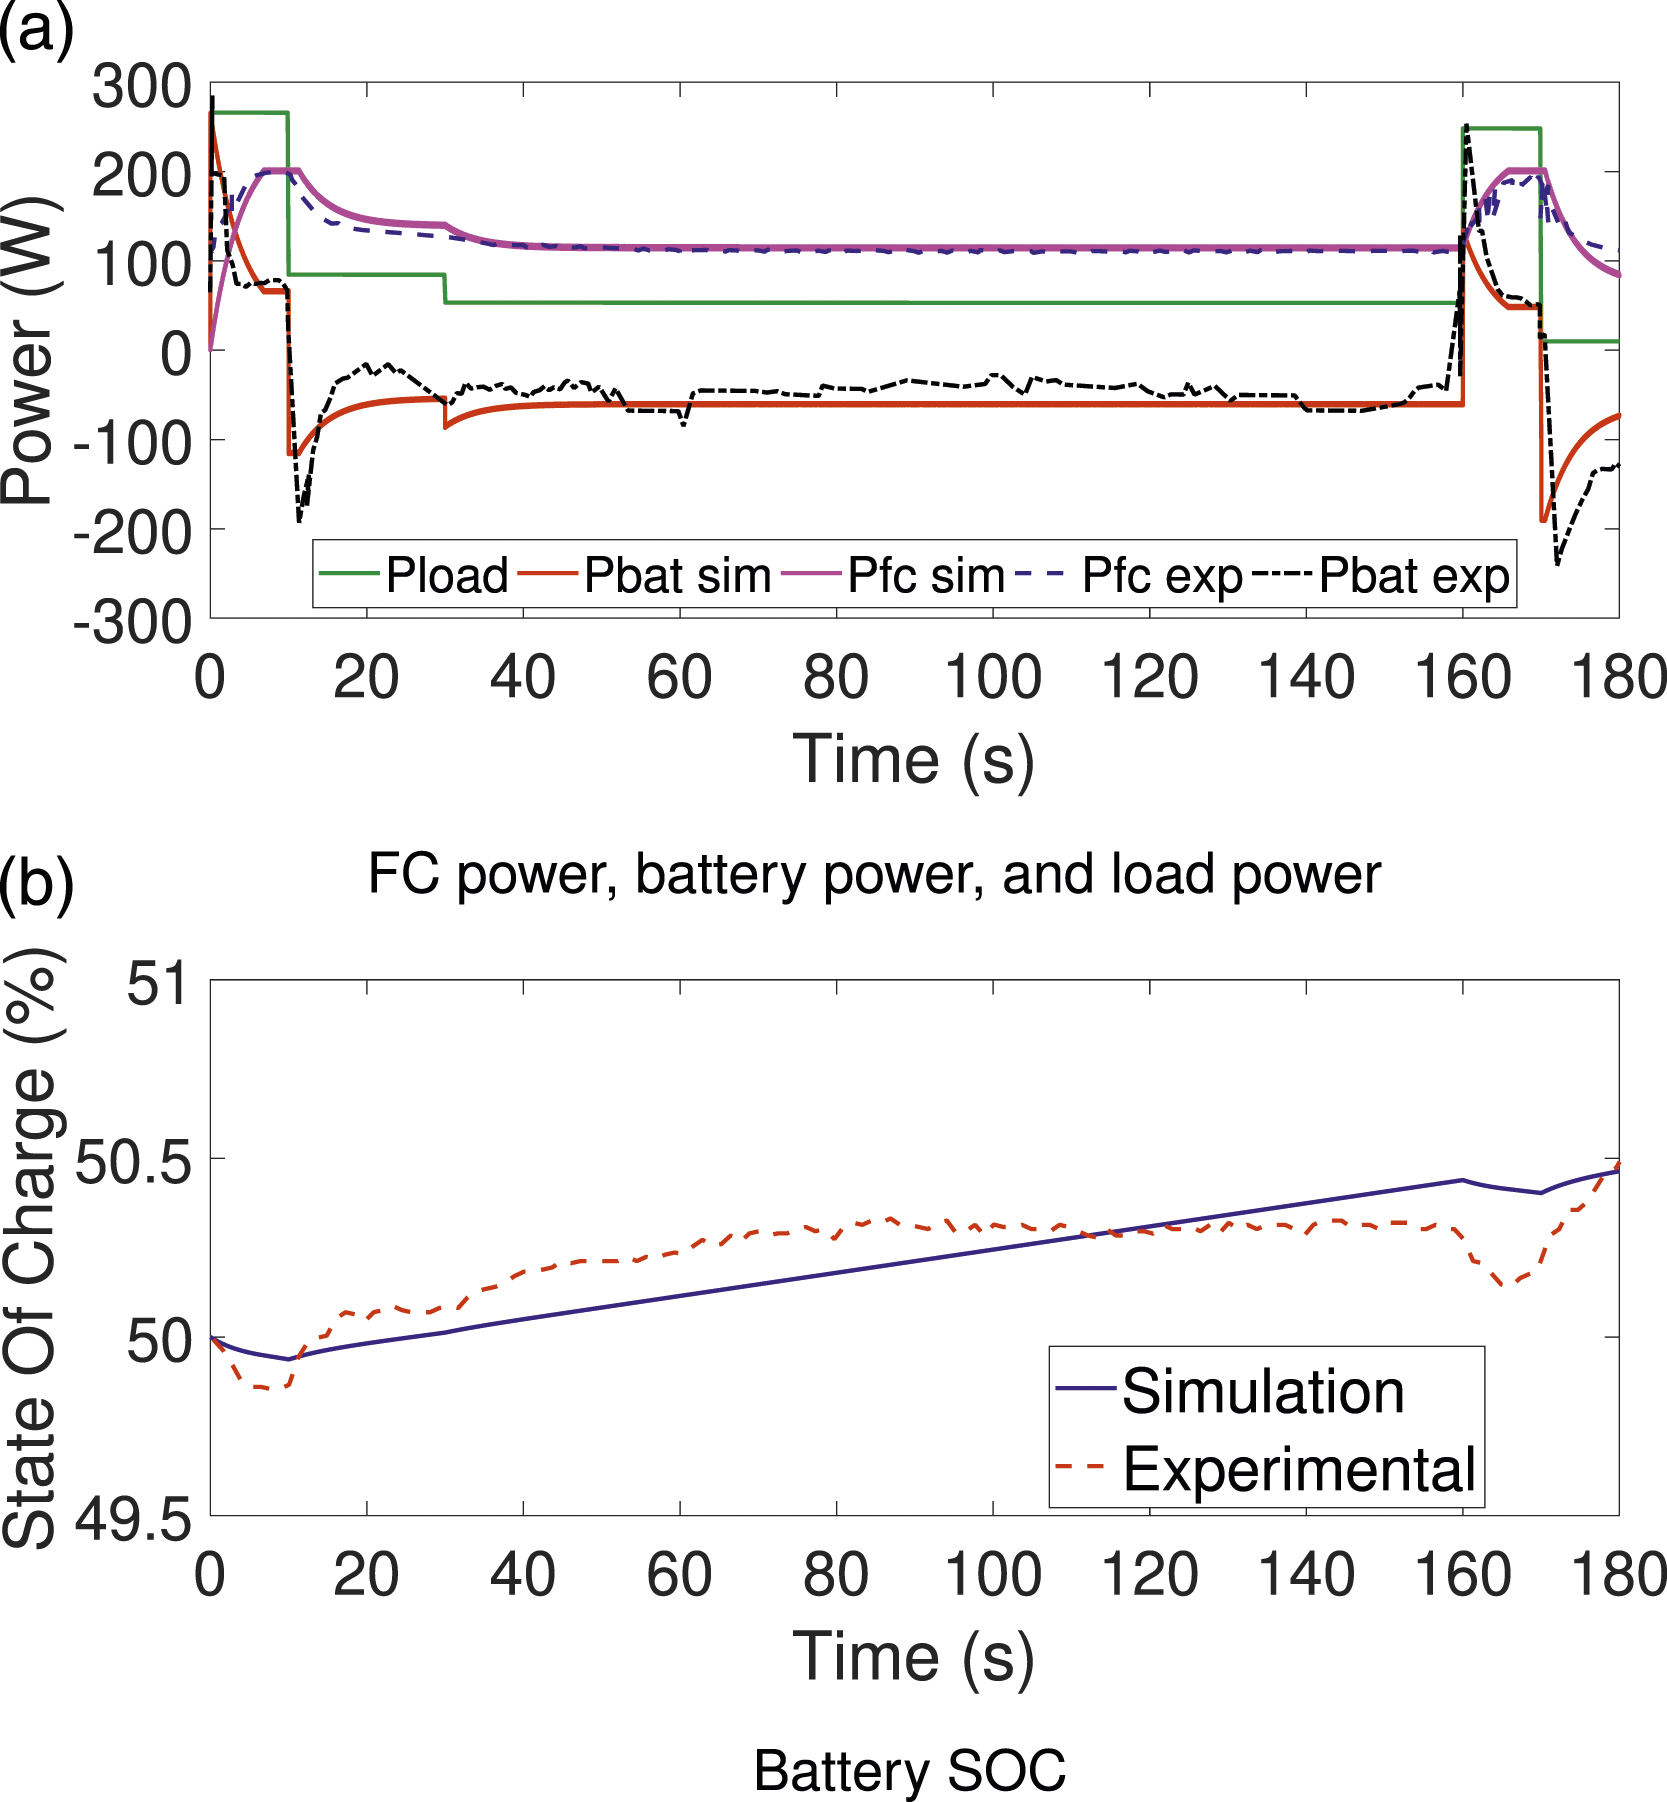
During the take-off and maximum velocity phases, where high demand for power occurs, it is noticed that the load demand is met by the two sources that work in parallel (Figure 11(a)). The PL-PMS limits the FC power to 200 W, while the FS-PMS smooths the FC response. Furthermore, the FL-PMS regulates the SOC so that the battery supplies the remaining power, causing the SOC to fall (Figure 11(b)); and then increases it during cruising, endurance, and descending phases, where the load power is low.
The experimental and simulation findings confirm that HPMS efficiently splits the propulsion power between the fuel cell and the battery, and achieves SOC control with the added advantage of FC protection from abrupt power changes and exceeding its maximum power, by filtering and limiting its response, which is critical for the FC lifespan preservation.
During the experiments, FL-PMS and HPMS, which require more calculations due to the use of fuzzy inference system, overloaded the digital control unit until the sample time was increased to 1e−3 s.
DC bus regulation
The DC bus regulation curve is one of the results that reflect the PMS performance, the more is the DC bus regulated, the better is the power flow. Figure 12 below, presents the results of the DC bus voltage for the four studied strategies. From this figure, it is noted that the HPMS has better performance in terms of the DC bus voltage regulation, and maintains the DC bus voltage to the desired value of 48 V, FL-PMS, and PL-PMS also regulate well the DC bus, but with a little fluctuation. The FS-PMS has the poorest performance in terms of the DC bus voltage regulation, but the results remain acceptable. DC bus voltage.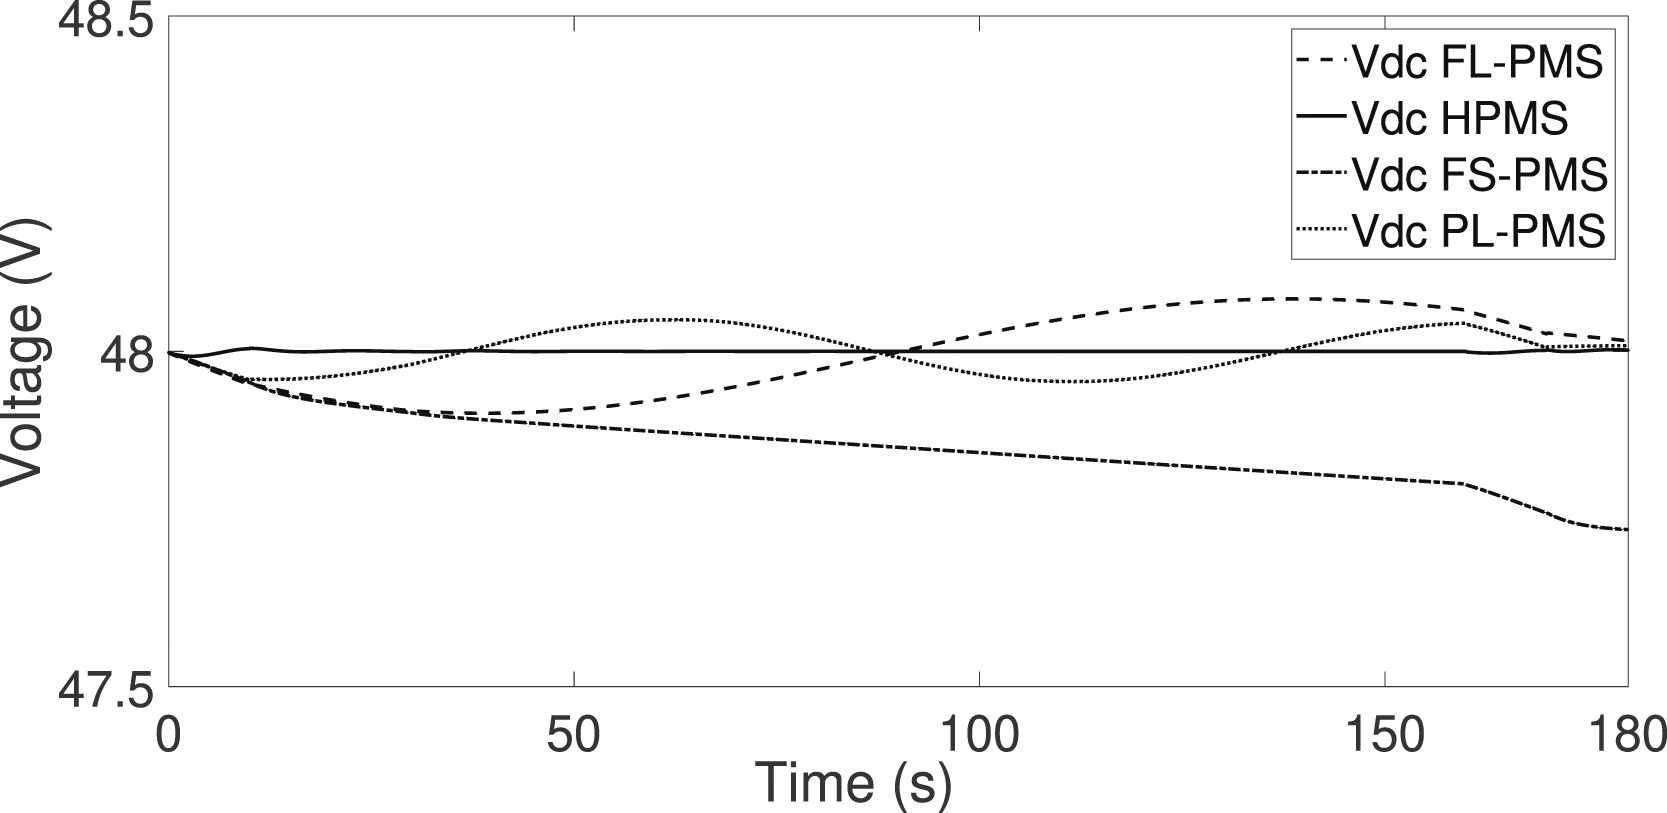
Energy consumption
From the results represented in the following Figure 13, it can be seen that for the strategies that have the ability to control the SOC (HPMS and FL-PMS), the energy delivered by the FC during the whole mission and the energy consumed by the battery for the HPMS strategy are less when compared to the results obtained for FL-PMS; saving 2% of FC’s energy; the difference is due to the power limitation and FC response smoothing. Moreover, the battery energy is negative, which means that the battery is charged during the mission, leading to a greater SOC at the end of the mission. Energy consumption during the mission.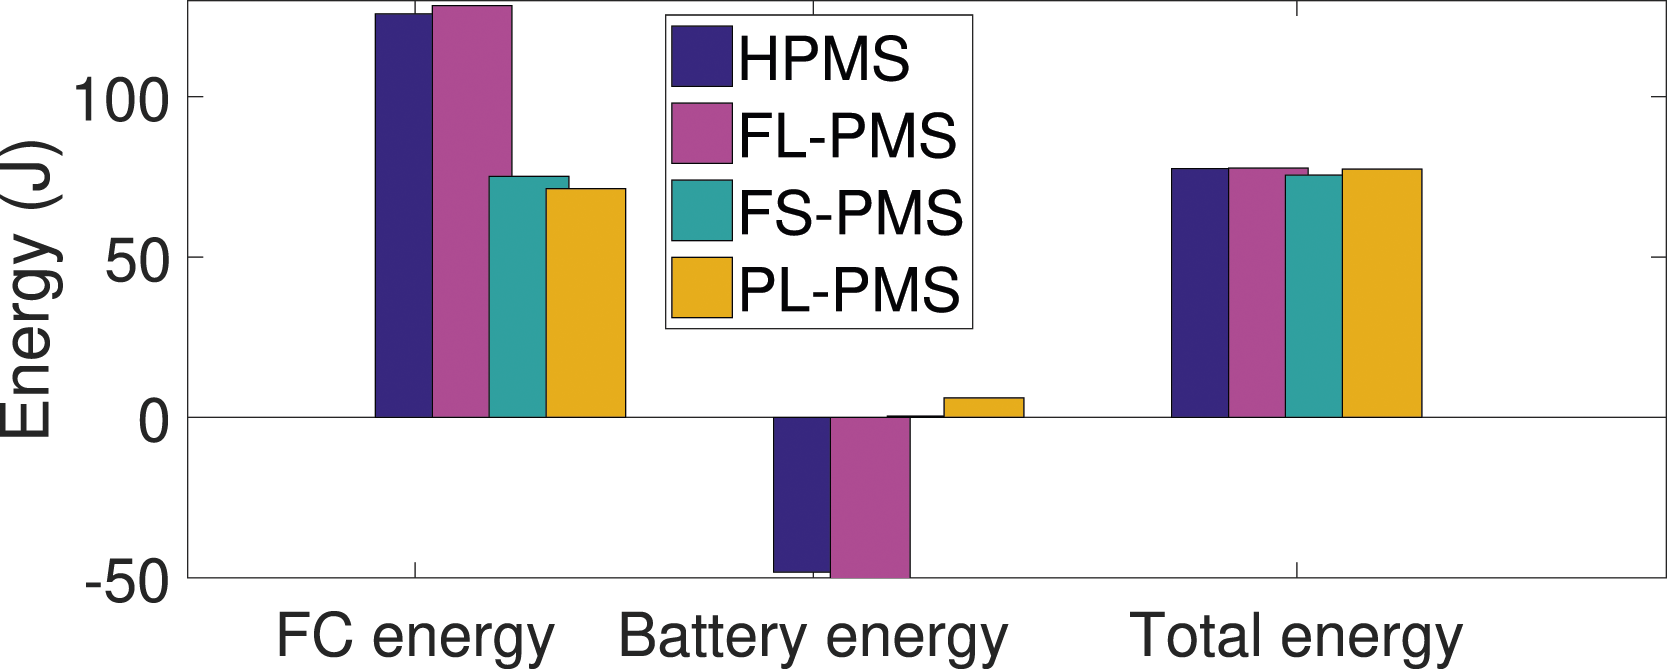
It is observed that for FS-PMS and PL-PMS strategies, the FC is charged to deliver the required energy and the battery contribution is insignificant, particularly for FS-PMS; this is due to the SOC’s lack of control.
The energy delivered by these two approaches is clearly less than that of the other two, saving, respectively, 41% and 44% of FC energy compared to FL-PMS; however, this benefit is to the detriment of SOC control.
Conclusion
Small fixed-wing UAVs are recently employed in several applications such as pipeline surveillance, forest surveillance, and military missions. The use of fuel cells together with batteries to supply these UAVs seems to be a suitable solution to increase their autonomy and to offer more advantages during the different UAV flying phases. In this topic, this paper has presented firstly an optimized power source sizing by using the PSO algorithm, and it is found that this algorithm has permitted a gain of 8% in the total power sources weight. Furthermore, an efficient PMS, based on fuzzy logic, frequency separation, and power limitation, has been secondly proposed in this paper to distribute the required UAV power between the FC and the battery. In order to accomplish these tasks, the overall system model, which comprises the UAV power profile during the flying phases, converters, and power sources, has been established. Then, the proposed hybrid PMS together with the complete power system has been simulated and compared with the three mentioned PMSs (FL-PMS, FS-PMS, and PL-PMS). The obtained results confirm that the FL-PMS offers the battery SOC and power flow control while the FS-PMS preserves the FC from harsh changes in the current response, whereas the PL-PMS protects the FC from extra power demand. The proposed hybrid PMS gathers the advantages of the three PMS (FL-PMS, FS-PMS, and PL-PMS) and so it controls, on one hand, the power flow between the power sources while reducing the stress on the FC for better lifespan preservation. On the other hand, it controls the battery SOC as well as reduces hydrogen consumption, allowing a reduction of 2% in FC energy consumption compared to FL-PMS. FS-PMS and PL-PMS save much more energy (41% and 44%, respectively) compared to HPMS but on the detriment of SOC control. The validity of the proposed hybrid PMS is confirmed by the experimental findings obtained from the experimental test bench built in the laboratory.
In the future, more work will be done in the optimization process, including the optimization of both PM and source sizes, the propulsion train, and the fuel tank, along with sensitivity analysis of the parameters influencing the sizing.
Footnotes
Declaration of conflicting interests
The author(s) declared no potential conflicts of interest with respect to the research, authorship, and/or publication of this article.
Funding
The author(s) received no financial support for the research, authorship, and/or publication of this article.