
Abstract
A 2-D airfoil shape optimization in transonic low-Reynolds number regime is conducted. A Navier–Stokes flow solver with a transition model (k-ω SST γ-Reθ) is used to evaluate the fitness function. Single-point and multi-point formulations of the optimization results are compared. In addition, the effects of Mach number and angles of attack on aerodynamic characteristics of the optimized airfoils are investigated under low Reynolds number (Re = 17,000) and high-subsonic-flow (
Keywords
Introduction
Since 1997, seven rovers have successfully landed on the surface of Mars. However, only 0.3% of the planet's circumferential paths have been explored, which is mainly due to the hilly terrain and limited ground visibility. Rovers can significantly increase their range and maneuverability by providing an aerial view of upcoming paths by planning their route more effectively and avoiding obstacles on the route accurately. Such advantages and functionalities guide scientists to continue to improve and optimize the design of Mars aerial vehicles.
The design of airfoil’s high-Mach low-Reynolds numbers has gained scientific attention due to their application to Mars aerial vehicles. The low density of the Martian atmosphere and the relatively small Mars rotor result in very low chord-based Reynolds numbers (103 <Rec< 104) 1 which often introduce problems of laminar boundary layer separation on the suction side due to the adverse pressure gradient. Additionally, the low temperature and largely CO2-based atmosphere of Mars compound the overall aerodynamic problem by resulting in a lower speed of sound, indicating a limitation on the rotor’s maximum tip Mach number. As a result, a typical flying vehicle design needs to pay attention to: (1) the flow separation without reattachment occurred at the low Reynolds number condition, (2) relatively high blade rotational speed to ensure effective performance of Mars rotor, and (3) low Reynolds number compressible aerodynamics of which very little knowledge is available.
Subsonic low-Reynolds number airfoil design is now fairly well understood,
2
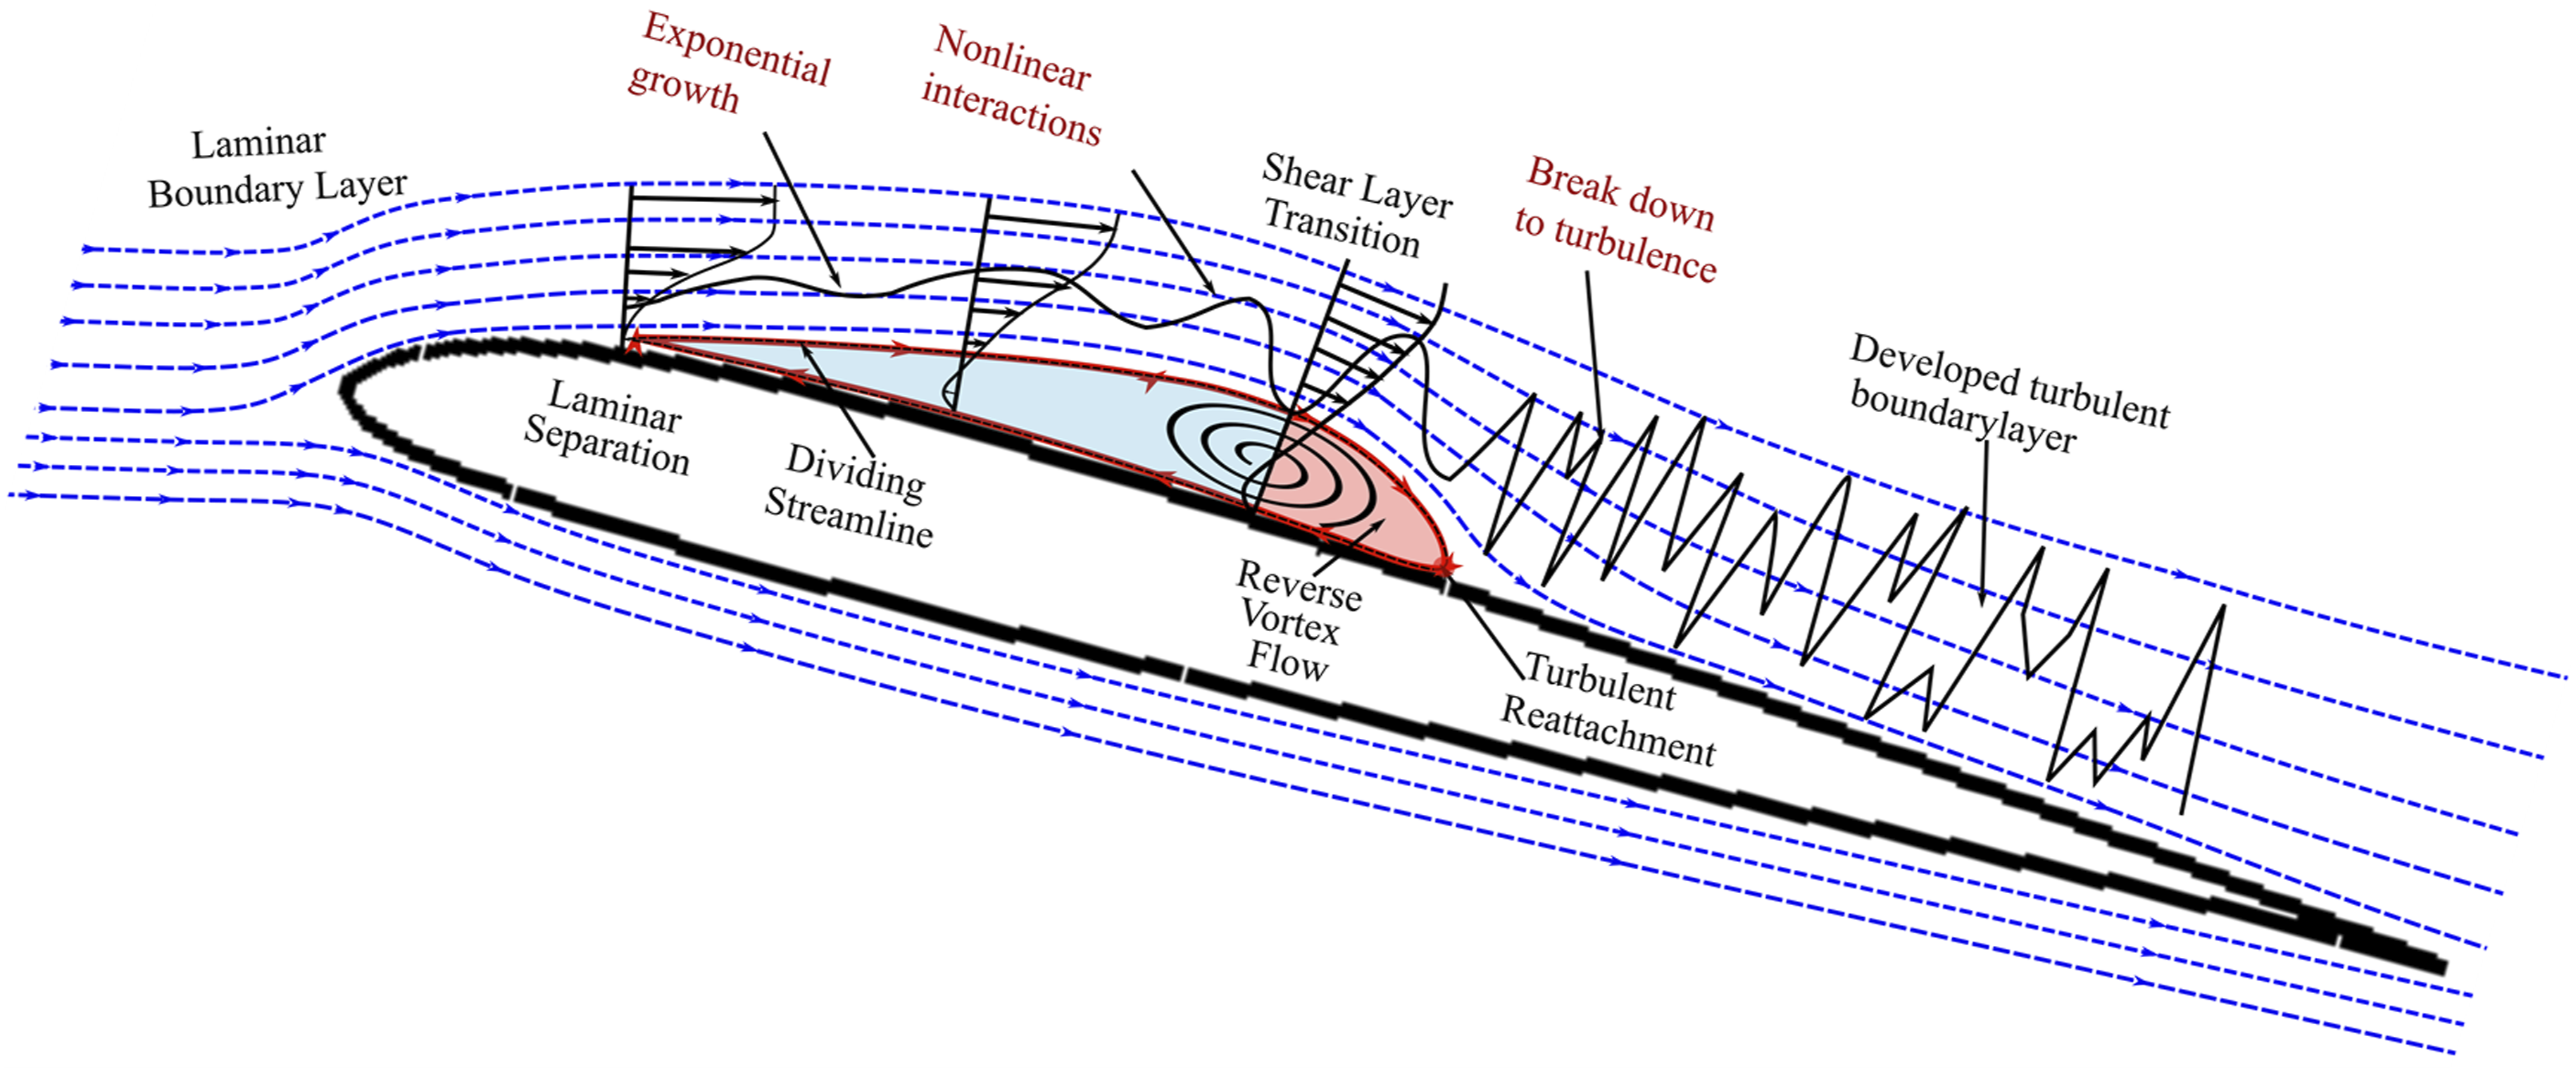
the key issue is that the flow field has both strong unsteady and viscous effects, leading to a formation of complex vortical flow, among which a special phenomenon is the formation of laminar separation bubbles.
3
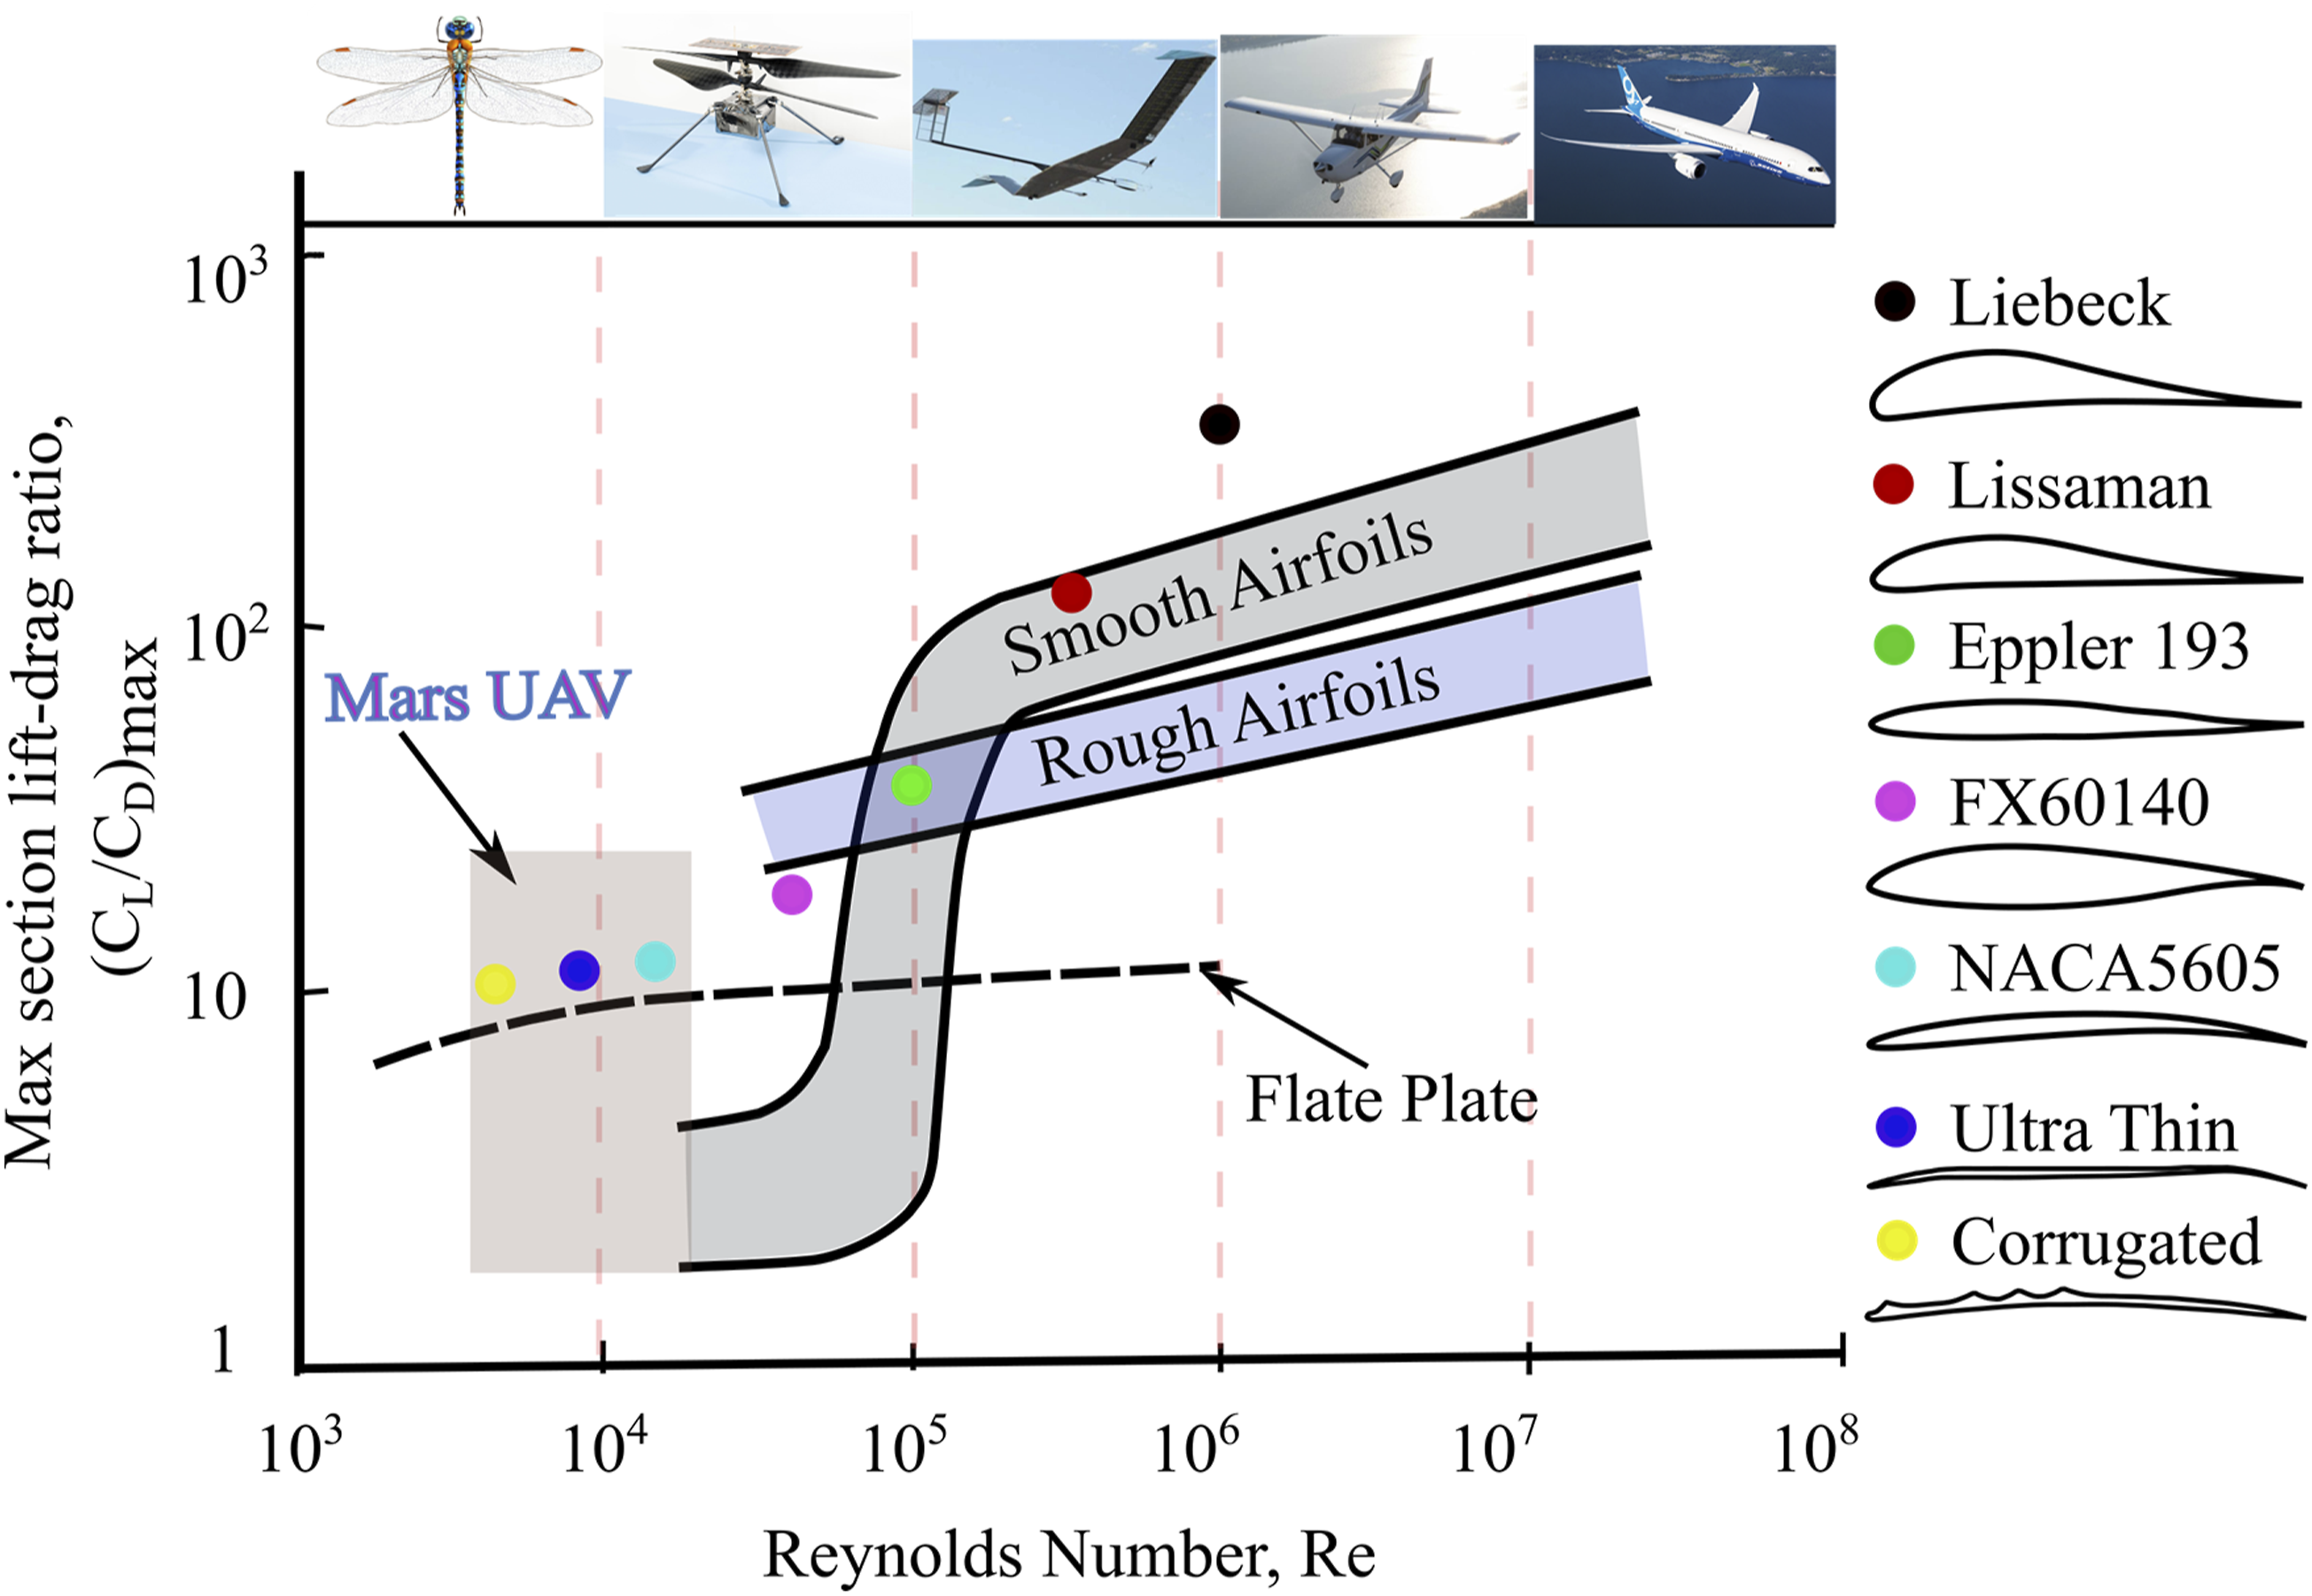
According to Carmichael’s survey,
4
the Reynolds number based on the mean chord length is around The mean flow structure of a laminar separation bubble. Maximum sectional lift-to-drag ratio versus Reynolds number.
35
The fundamental research on transonic flow in the field of wing/airfoil aerodynamics was carried out in the early second half of the 20th century. Nieuwland and Spee
7
reviewed early work on transonic wing/airfoil designs. The supercritical airfoil design is based on the concept of local supersonic flow with isentropic recompression, and the relevant shape was characterized by a large leading-edge radius, reduced curvature over the middle region of the upper surface, and substantial aft camber.
8
The concept of aft shift of maximum camber is also utilized for ultra-low Reynolds number airfoil design, resulting higher attainable lift coefficients and lift-to-drag ratios by a less severe reduction of lift past the linear range. The aft shift of camber experiences reduces adverse pressure gradients and hence delays the separation.
9
For a given airfoil shape, the thickness ratio (t/c) and lift coefficient are often the most critical parameters influencing the drag divergence Mach number, as shown in Figure 3(a). In general, Reynolds number, relative thickness and location, leading-edge shape, and airfoil camber influence on transition location, and hence the aerodynamic characteristics, that is, Figure 3(b) shows the effect of a blunt trailing edge on the drag coefficient development at various Mach numbers. Recent work by Sudhi
10
and Badrya
11
showed that the optimum hybrid laminar flow control airfoil has achieved a 25% lower drag than the NLF (natural laminar flow) airfoil.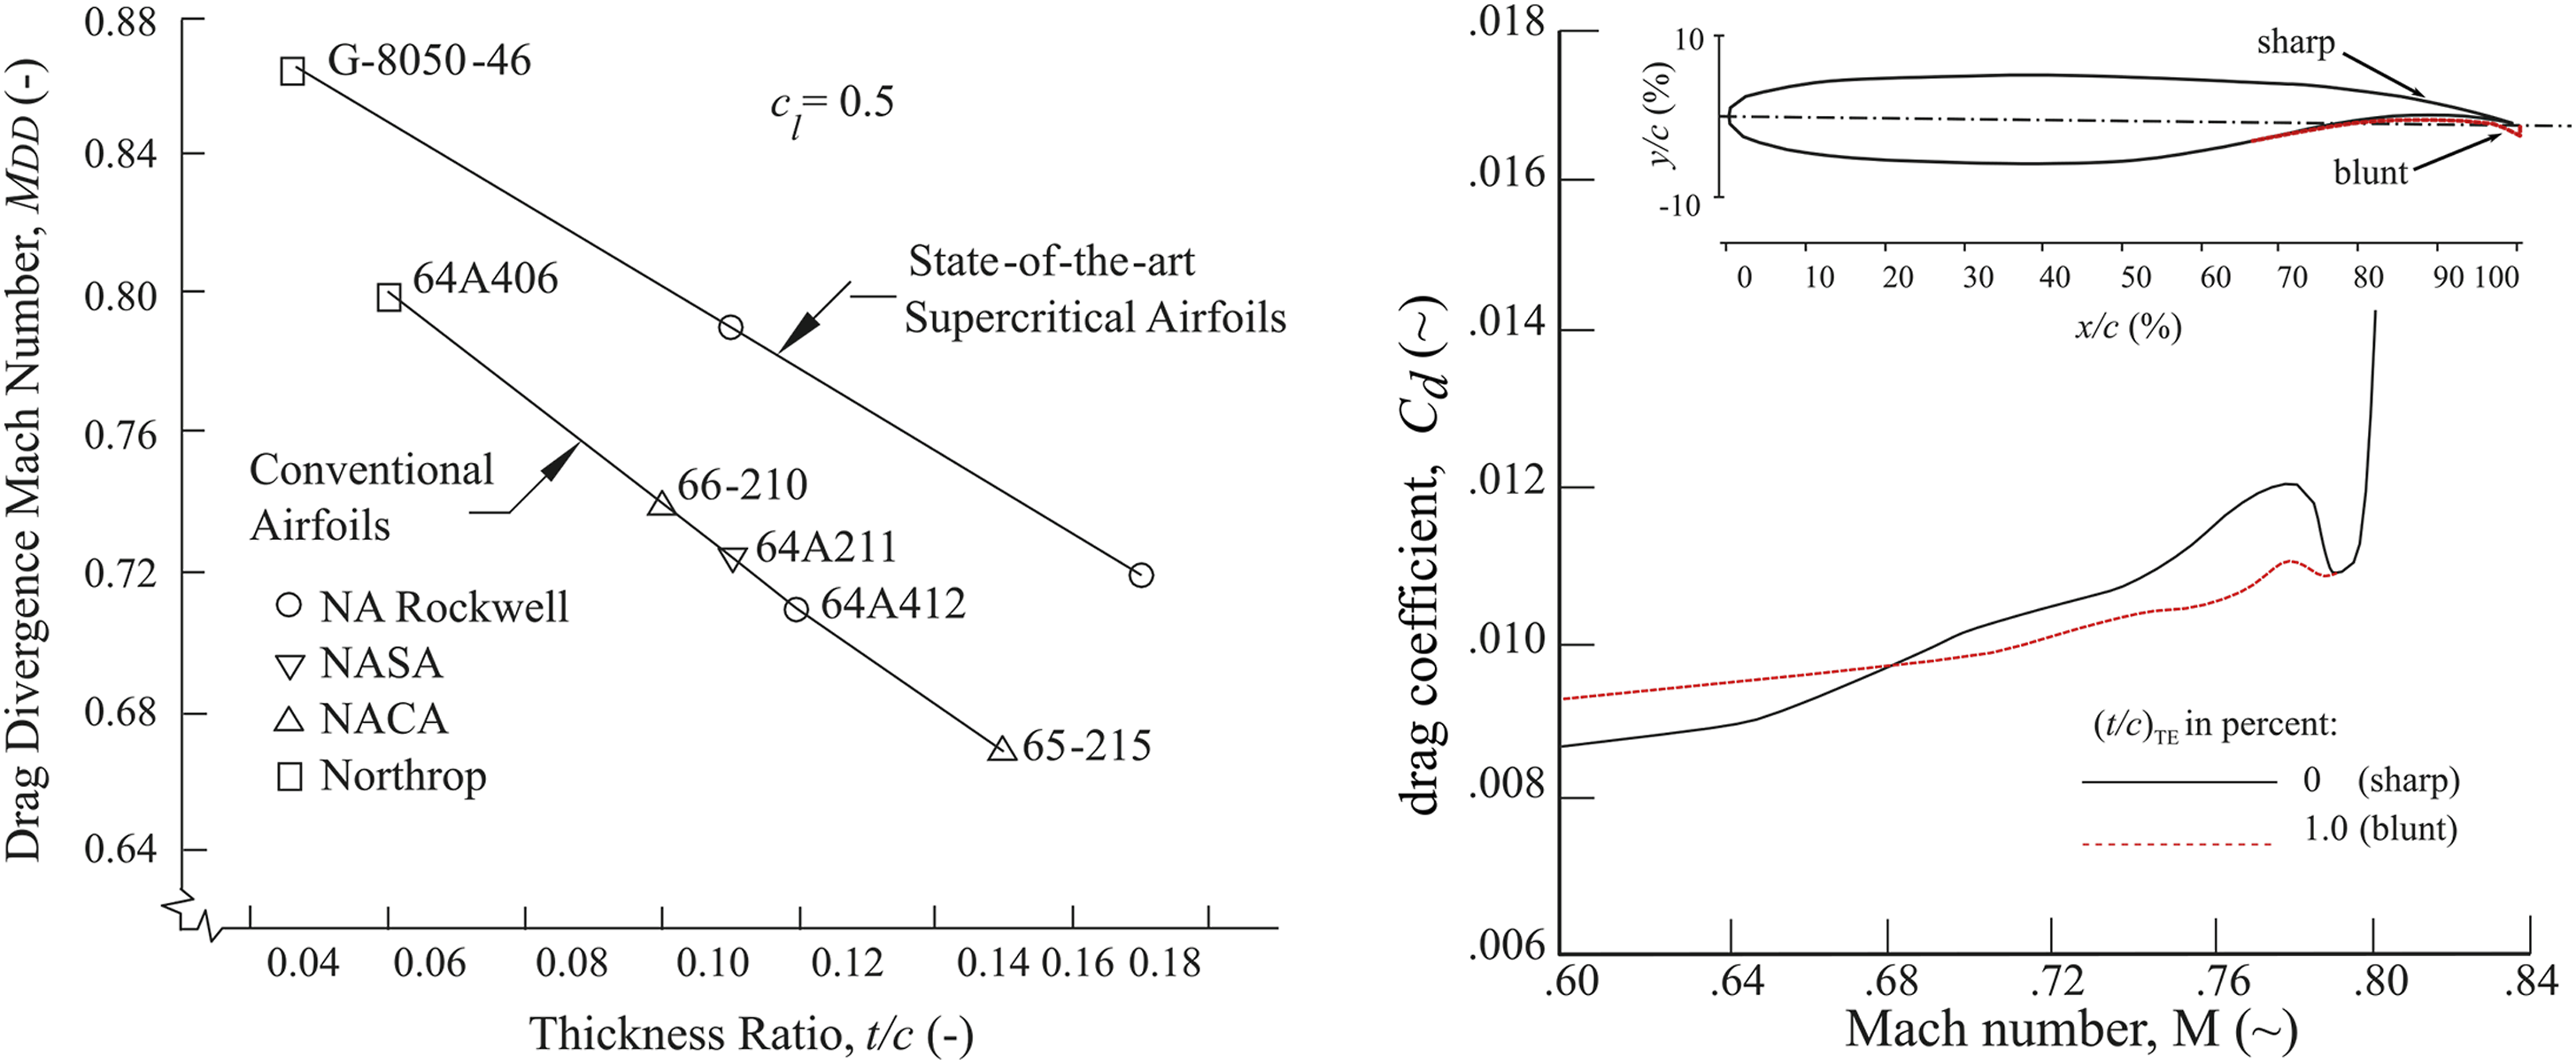
The high-Mach low-Reynolds number combination is unique in aeronautical applications and is unfortunately distinguished by a complete lack of suitable airfoil data, as shown in Figure 4. Early work on this topic was conducted by Drela.
12
The computational study highlighted the relevant characteristics of laminar separation at a low Reynolds number, where “A”-shocks/boundary layer separation interaction was observed. As the Mach number increases, transition in the separation bubble will be delayed due to a reduction in growth rates of disturbance, resulting in an increased loss. Anyoji et al.
13
studied the effects of low Reynolds numbers (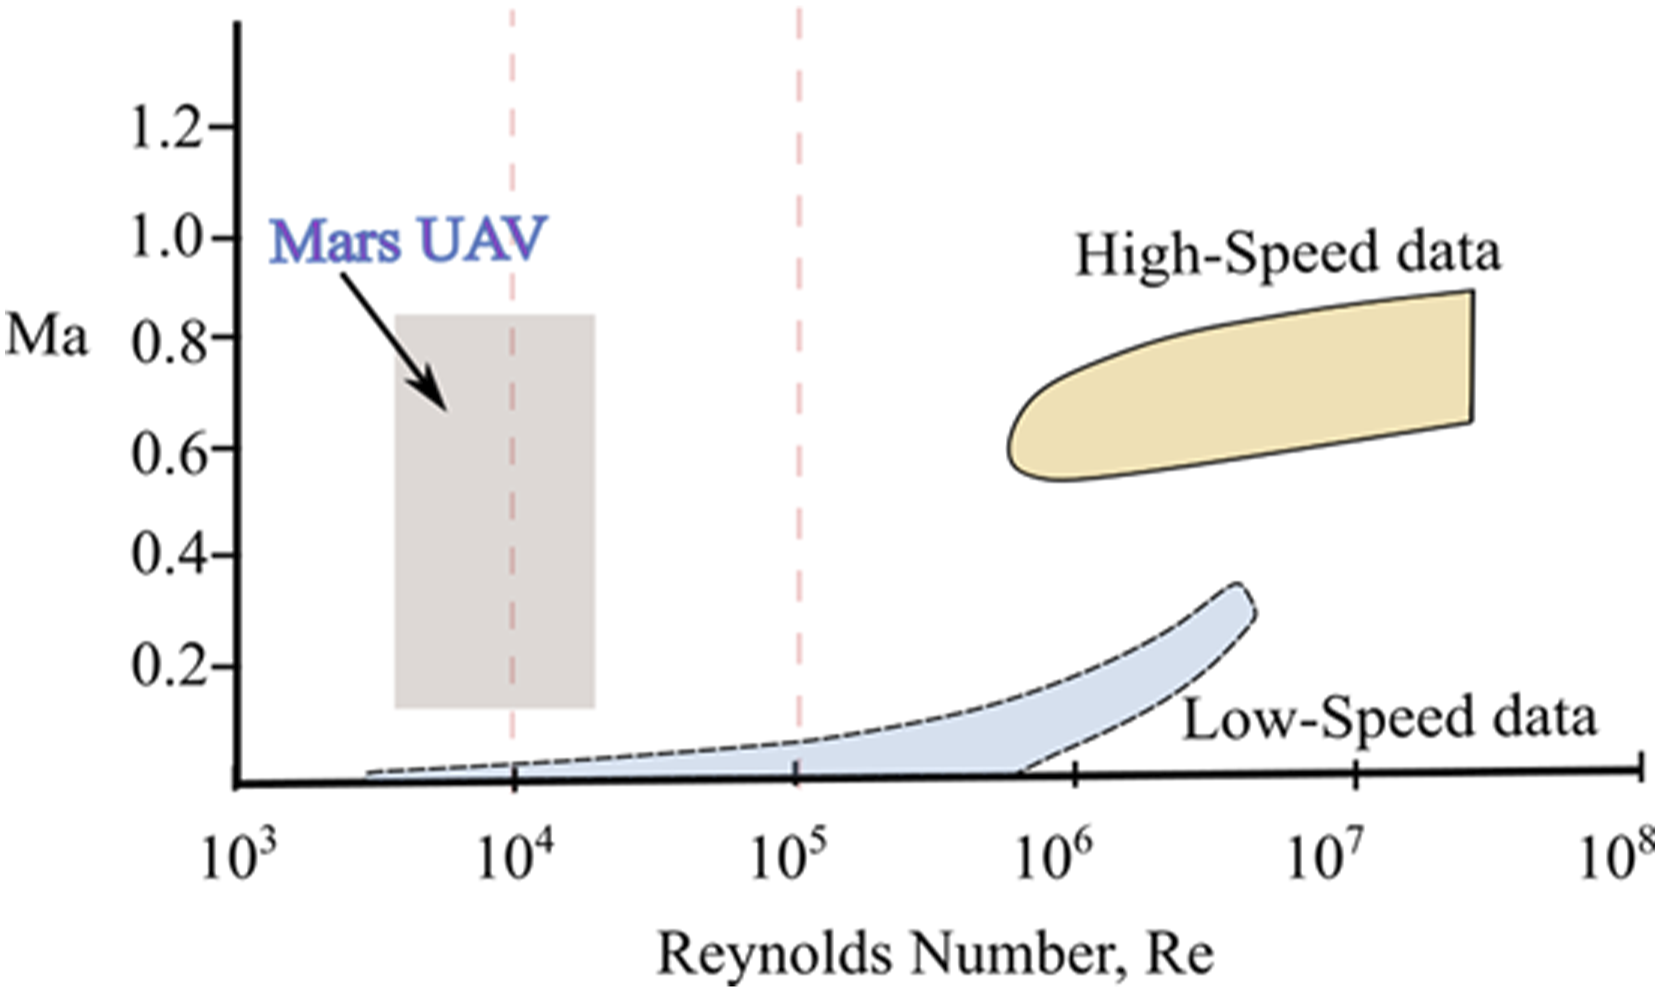
Propellers for Mars UAVs operate under various operating conditions, ranging from vertical take-off to hovering conditions 15 and cruising. In addition, the angle of attack, Reynolds number, and Mach number for a rotor blade design varies from the root to the tip. Relatively poor performance would occur at the blade root when the Reynolds number is below 105. On the other hand, the presence of transonic flow will, of course, influence the quantitative performance of the airfoils and their off-design behavior, such as a delayed drag divergence Mach number. These objectives result in design conflicts for new airfoils, as improvements in divergence Mach number require thin airfoils with limited camber, while improved maximum lift requires thicker airfoils with greater camber.
Increased payload, vertical take-off and landing capabilities lowered stall speeds, and extended endurance can all be derived from the beneficial effects of improved high-lift airfoil aerodynamics. However, working under the Martian atmosphere condition, the presence of a separated flow, together with a shock wave forming, introduces an interaction between the separation region and the shock wave, leading to pressure fluctuations, structural vibrations, and noise. It is, therefore, an essential task to gain a proper understanding of the phenomenon and seek possible ways to reduce the above-stated adverse impacts.
This paper aims to present an airfoil with good performance over a specified Mach range for the increasingly important transonic low-Reynolds number regime in which Mars rotor aerial vehicles operate. The work contributes to the verification and validation of state-of-the-art RANS-based aerodynamic shape optimization of a transonic low-Reynolds number airfoil. First, a validation case, NACA0012-34 airfoil, was carried out by comparing previous experimental results to current computational results. Second, the Genetic Algorithm14,16 was adopted for airfoil optimization because of its global nature. The Reynolds number is 17,000, and the Mach numbers are 0.75 and 0.8 for optimization cases. The turbulence intensity (Ti) sets to 0.01% for all simulation cases. The pitching axis is 0.25c downstream of the leading edge on the chord line, as depicted in Figure 7. Finally, the aerodynamic performance of optimized airfoils under off-design conditions is studied with the Mach number varying from 0.6 to 0.9. In addition, unique features of transonic low-Reynolds number flows are revealed, including the evolution of different types of the shock wave, wake elongation, shock foot on the separation region, and strong shock wave on separation suppression.
Aerodynamics in Mars environment
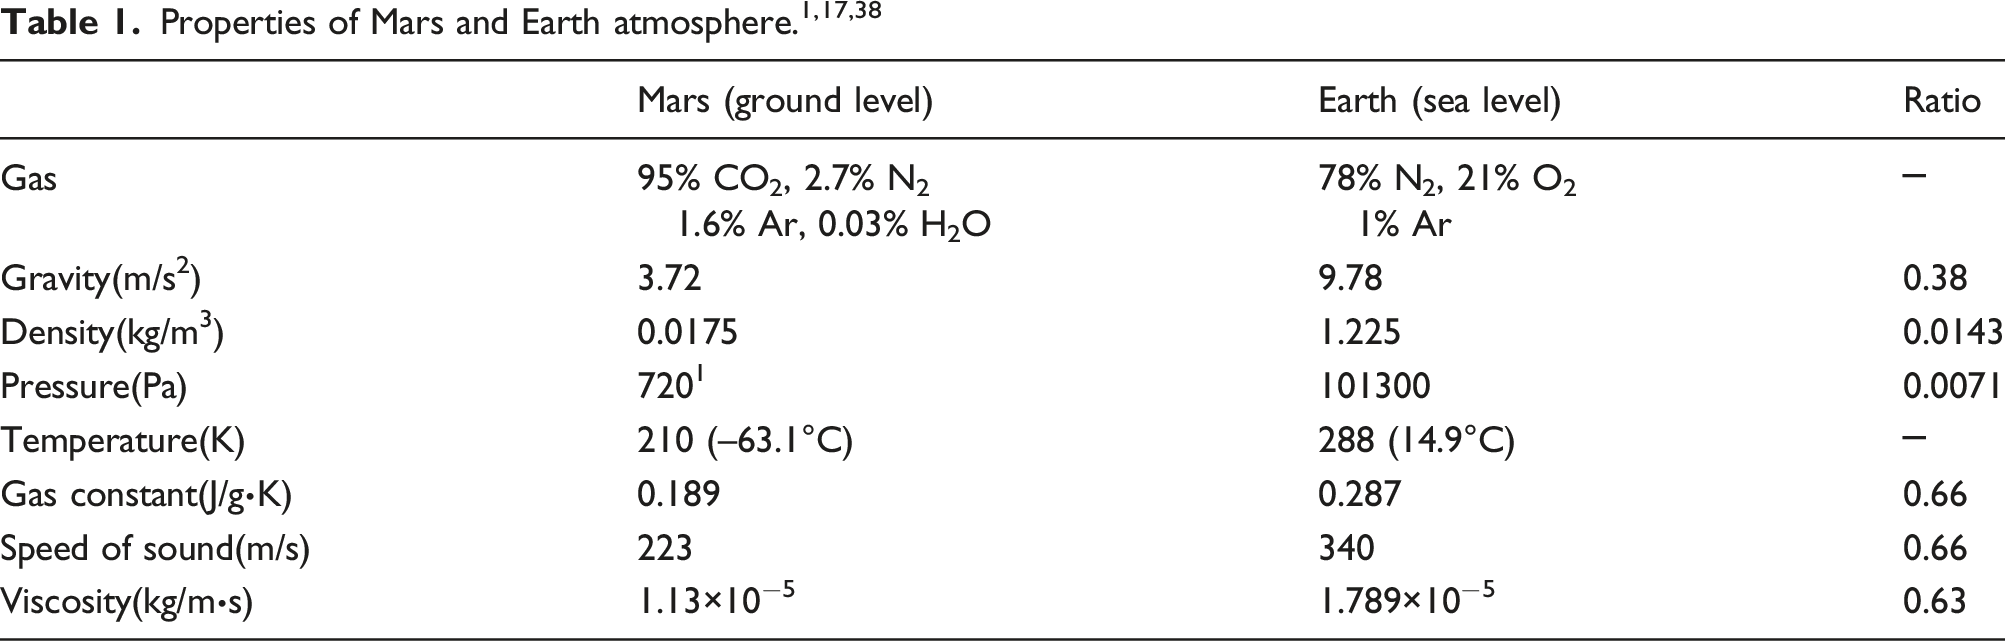
The low Reynolds number affects the lift and the drag characteristics, while the compressibility effects shear layer stability, that is, delaying the transition to turbulence. 18 The low temperature and low speed of sound limit the Mars rotor tip speed, indicating airfoils require satisfactory performance over the given set of Mach numbers.
Optimization framework
Airfoil shape parameterization
The selection of design variables and the parameterization of these variables is one of the most important factors in aerodynamic shape optimization. On the premise of ensuring the geometric characteristics, such as smoothness or continuity of an airfoil. Aerodynamic shapes typically are represented using Splines (e.g., B-spline and Bézier curves),
19
FFD,
20
class-shape transformations (CSTs),
21
parametric sections (PARSEC),
22
Bézier-PARSEC,23,24 and Bézier-GAN (generates smooth shapes that conform to Bézier curves).
25
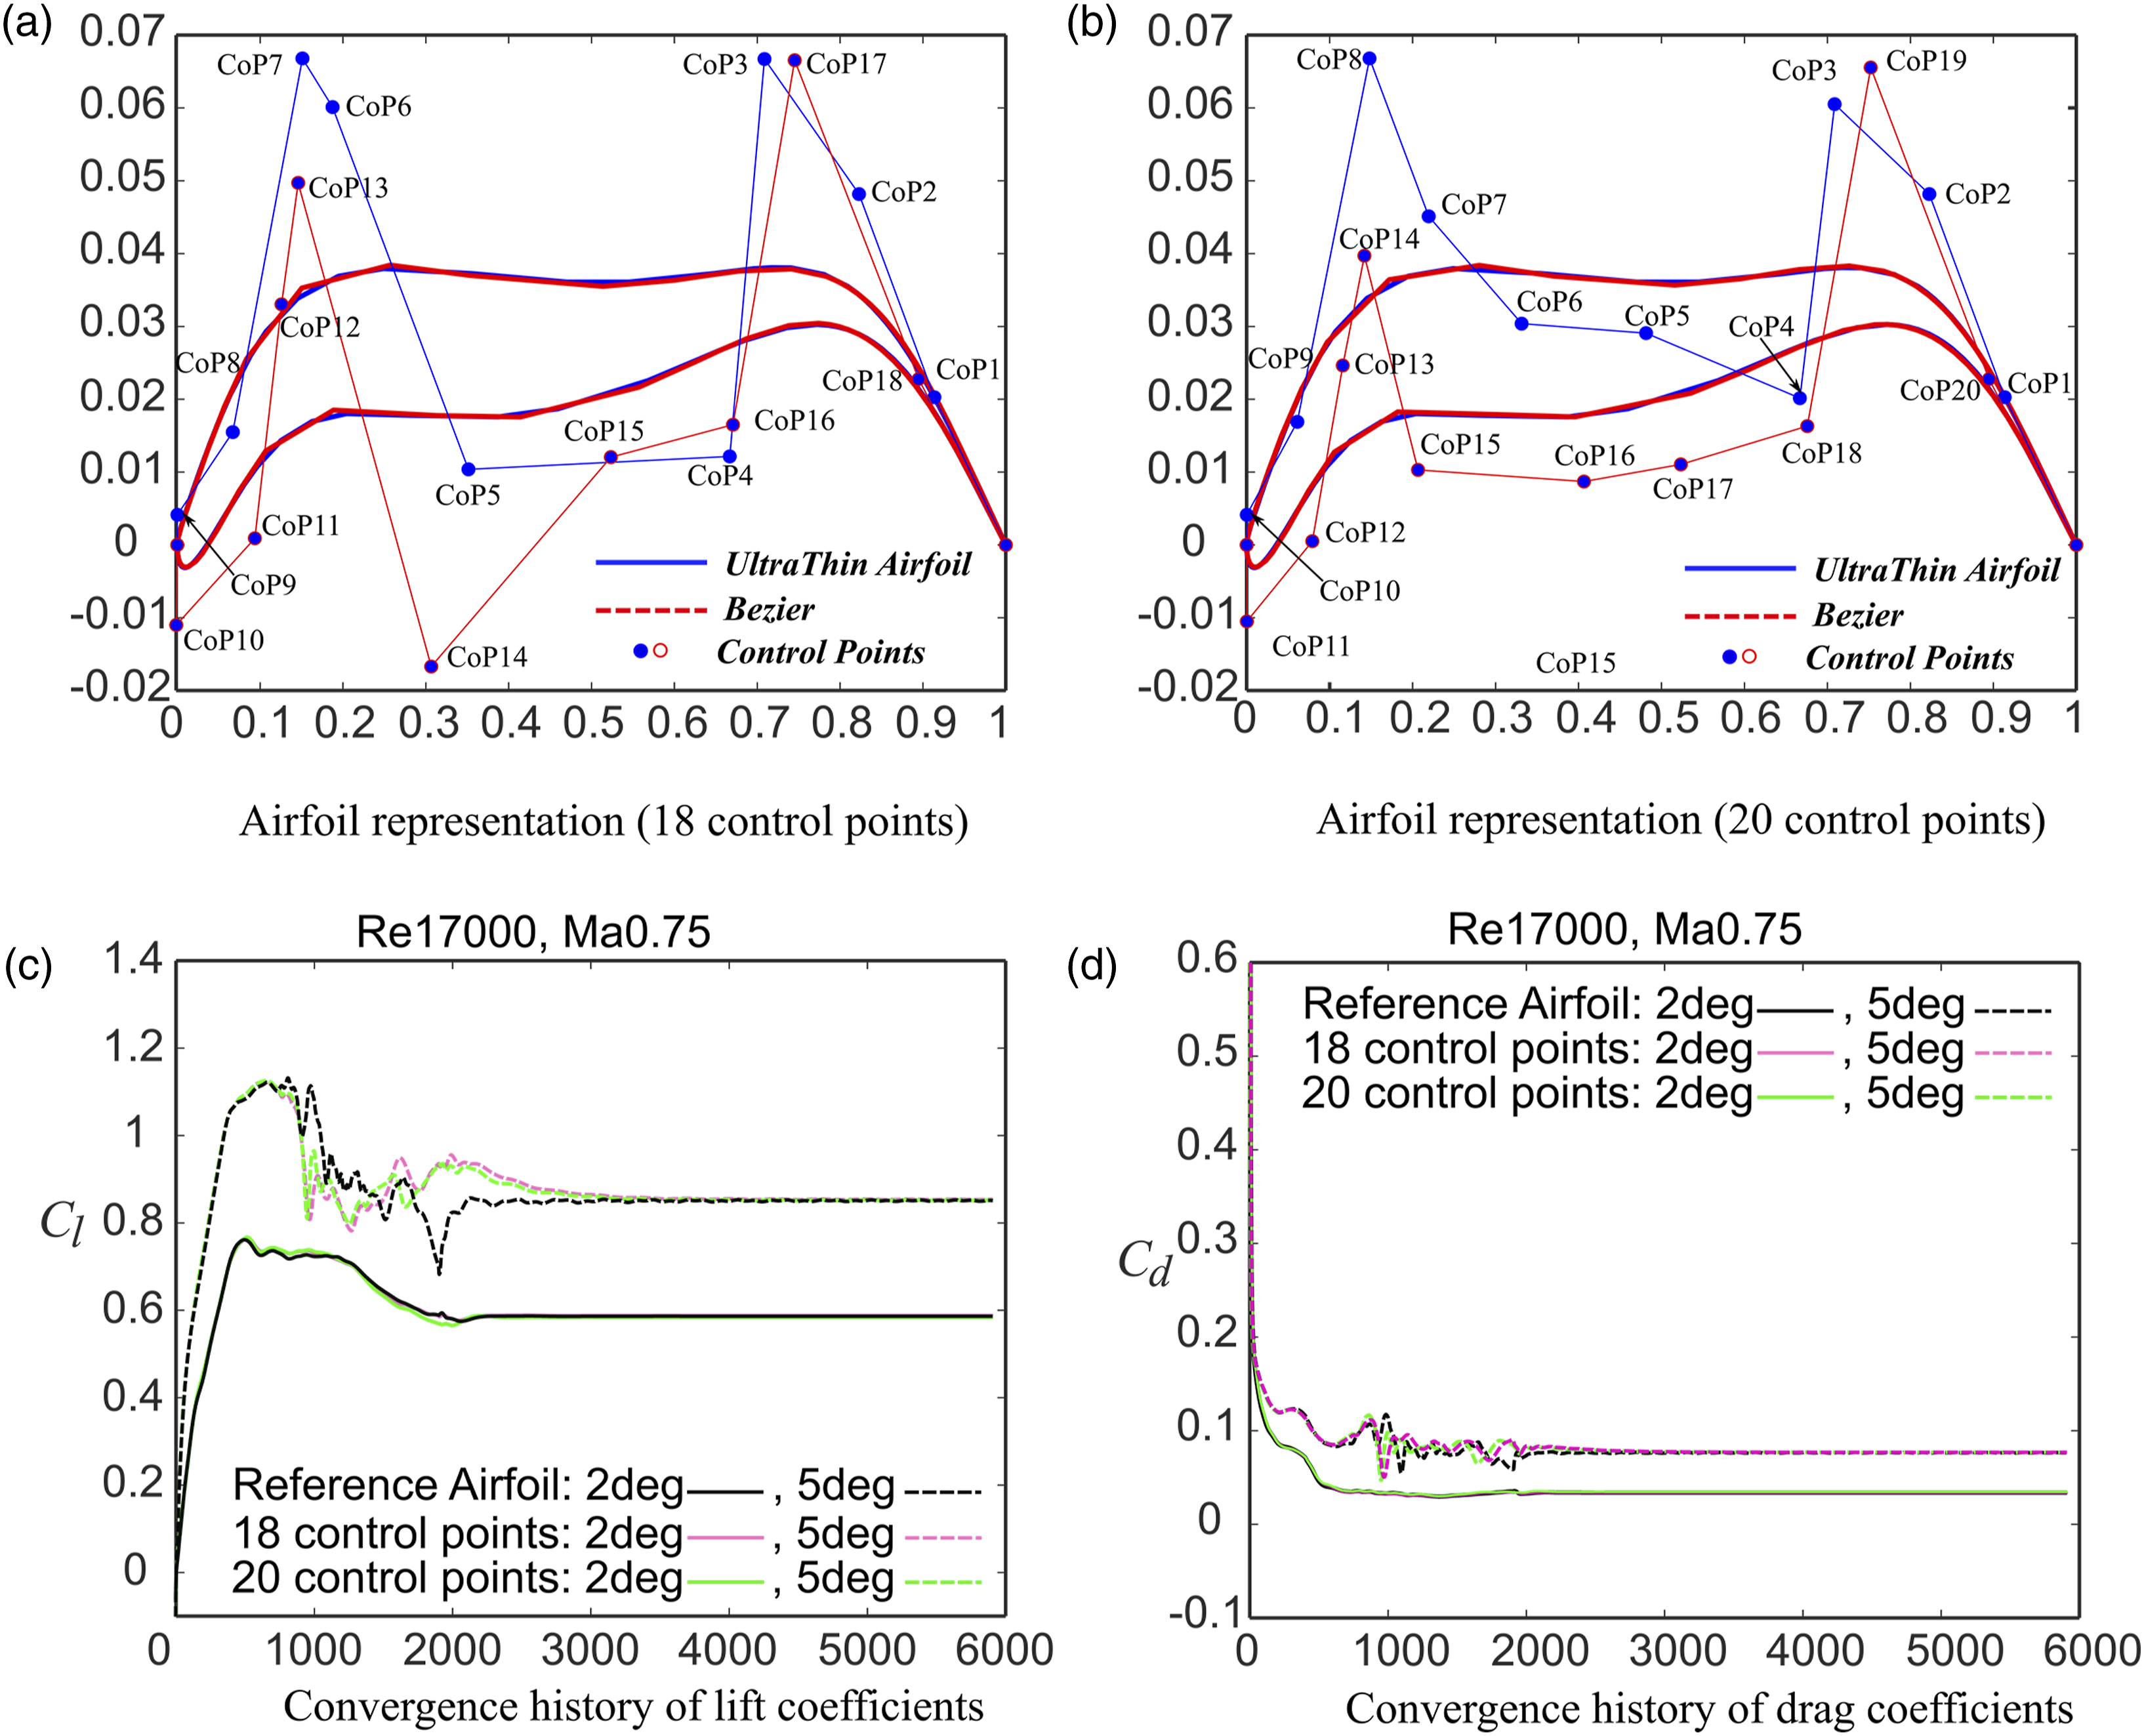
In the present work, the Bézier curve is used to describe the airfoil geometry (as shown in Figures 5 and 6). Clearly, the parameterization methods, Bezier curve fitting, could successfully approximate the shape of the airfoil profile. The advantage of this choice is the possibility of conjugating the properties of Bézier functions in terms of the regularity of the curve and easy usage with a piecewise structure that also allows to make a local modification to the geometry. Sensitivity analysis of parameterized control points for NACA airfoil. Sensitivity analysis of parameterized control points for UltraThin airfoil.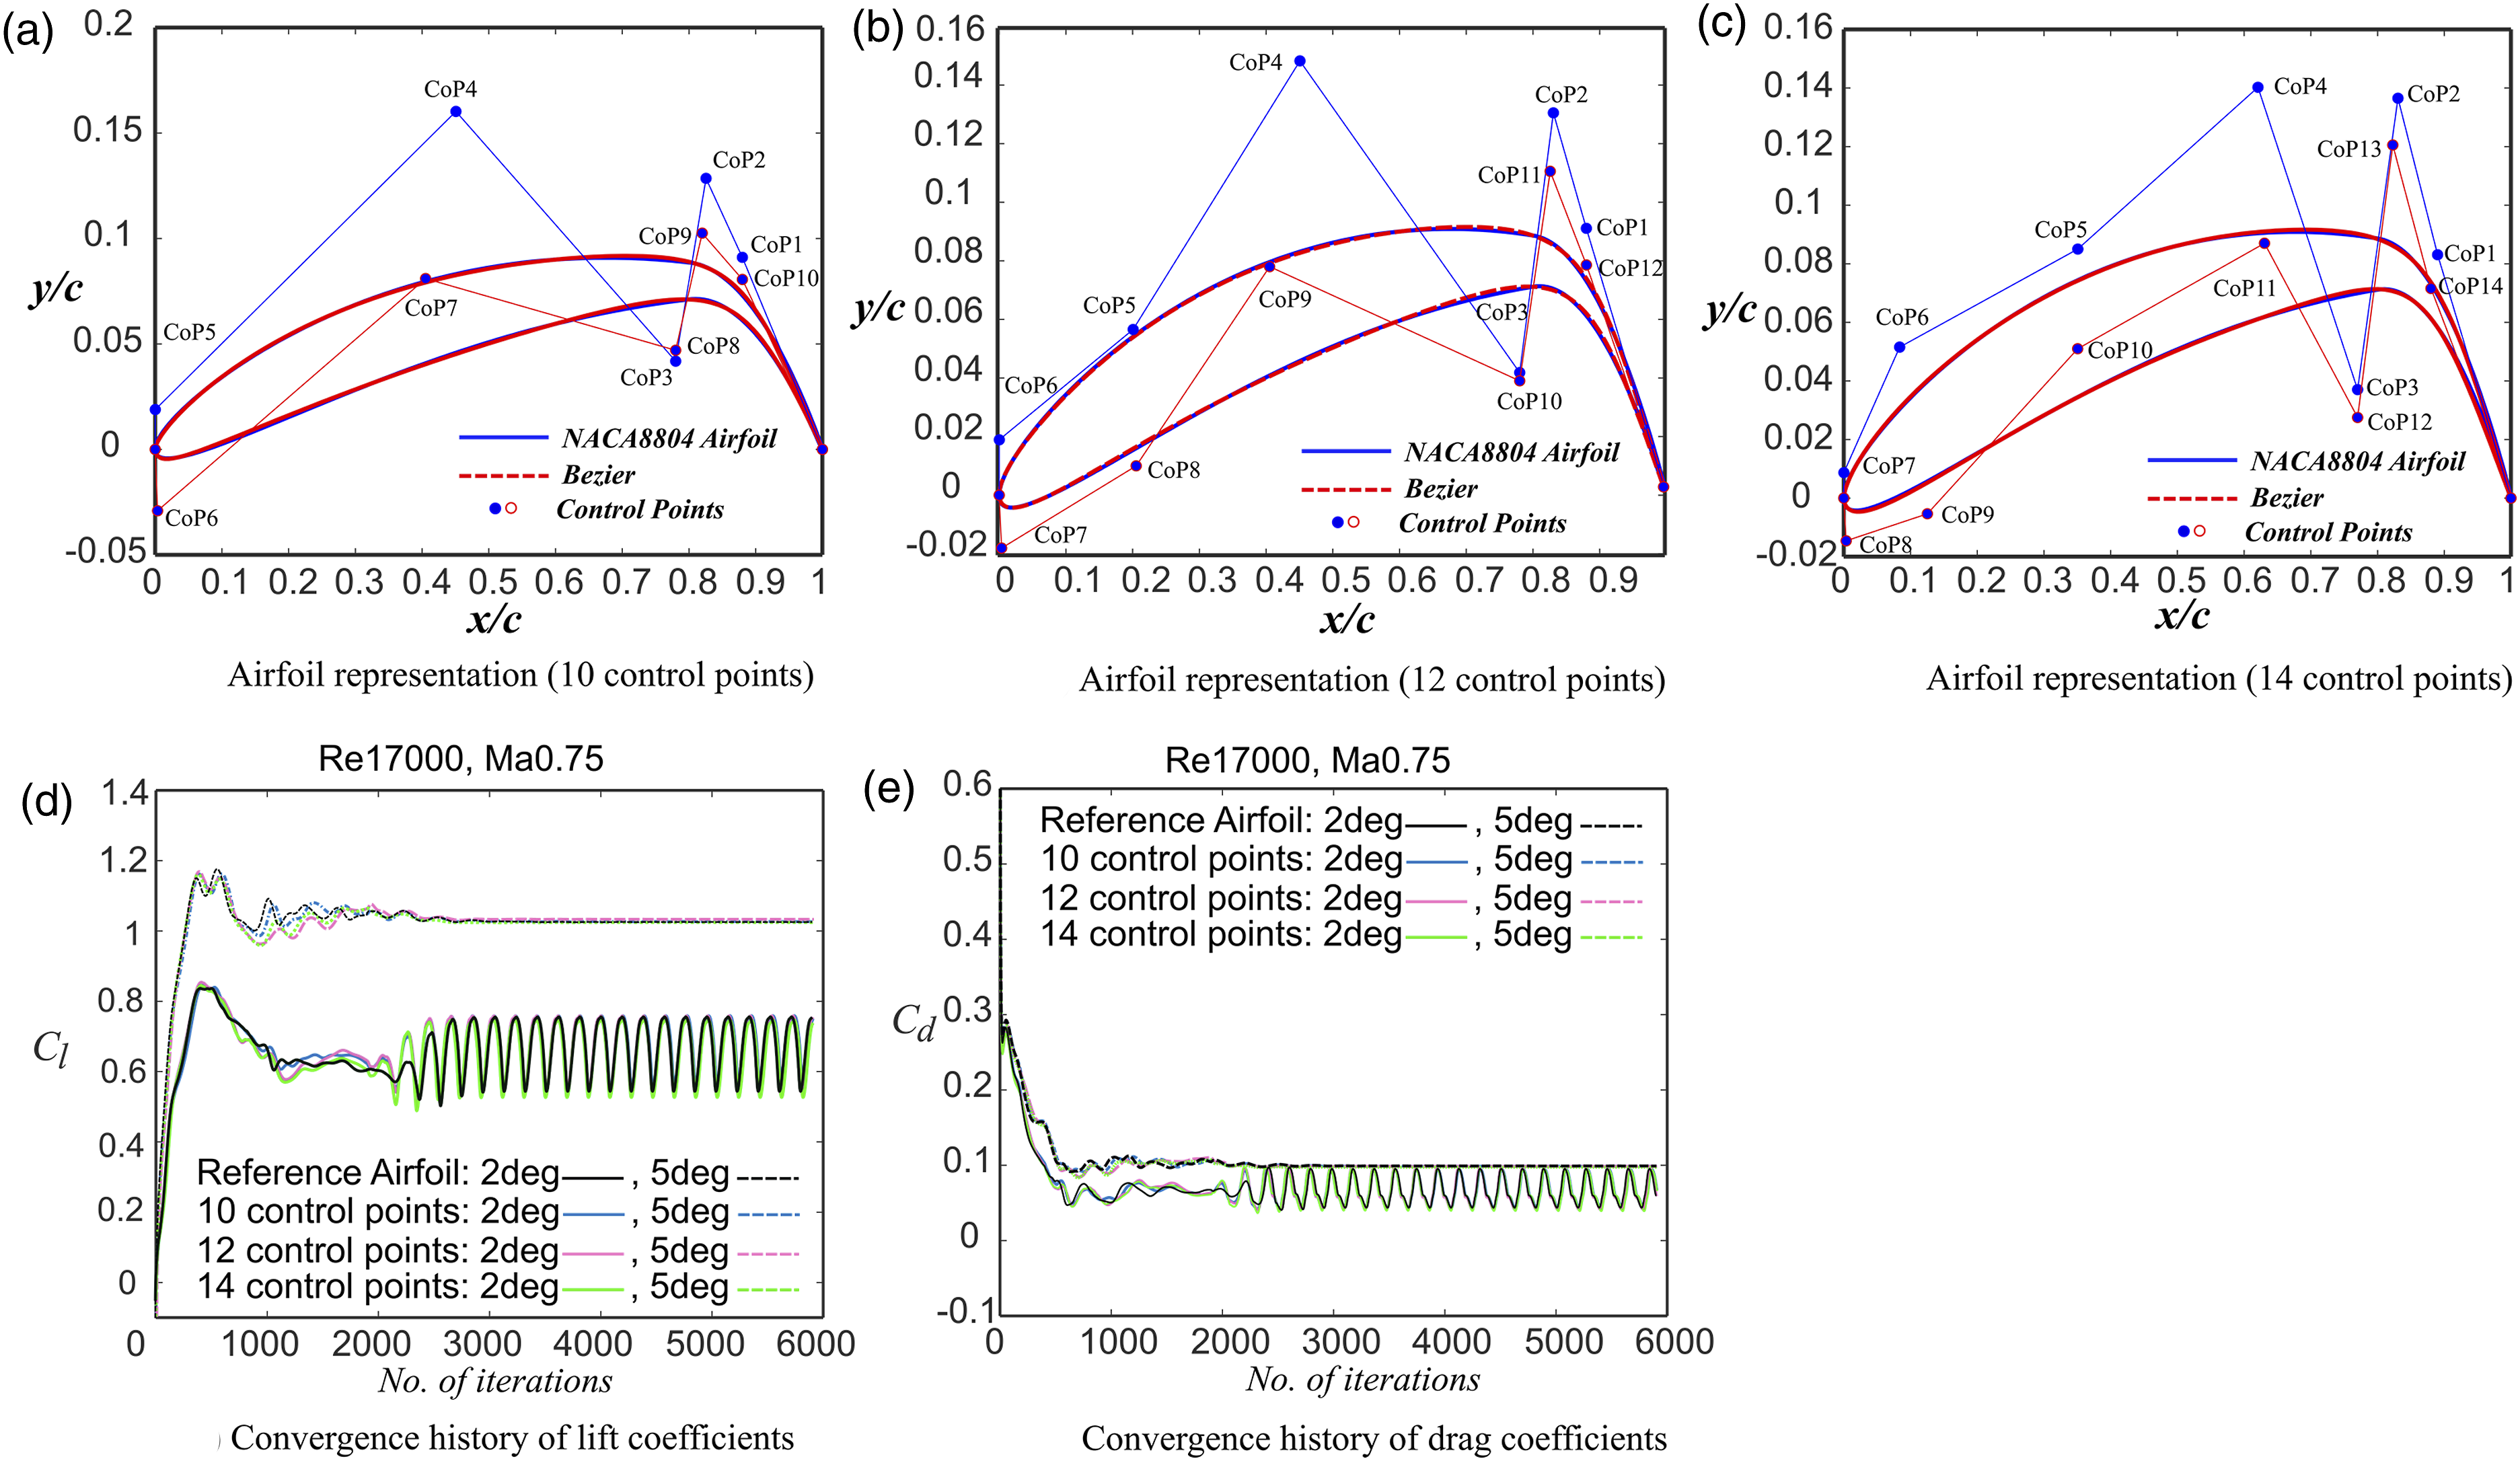
A Bézier parameterization is determined by its control points which are physical points in the plane, and is defined in parametric form by the following: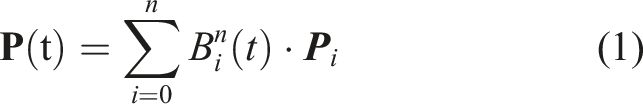
is the ith Bernstein basis function in degree n.
The points
Flow solver and mesh
The flow solver used is a structured multiblock, finite-volume, cell centered scheme solving the compressible Reynolds-averaged Navier–Stokes equations, and it is expressed in Cartesian coordinates as follows: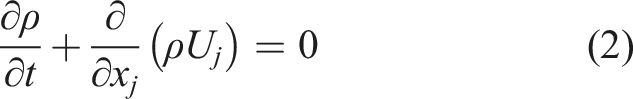
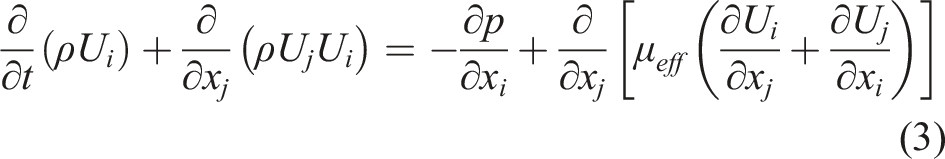
The viscous flux terms are evaluated using second-order central differences in space, and inviscid fluxes are evaluated with a third-order-accurate MUSCL scheme, and turbulent viscosity is modeled by the SST 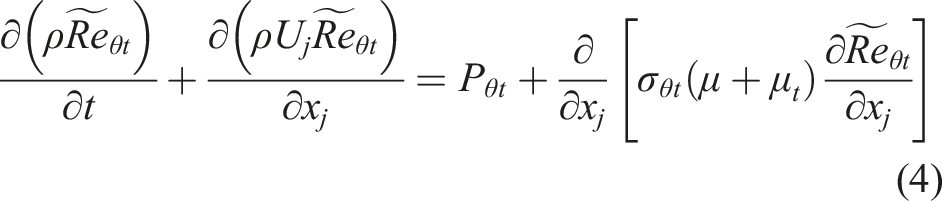
The transport equation for intermittency is used to trigger the transition process (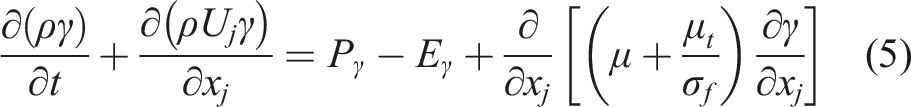
Furthermore, incoming freestream velocity, freestream turbulent intensity (
Mesh sensitivity study
Global optimization based on a genetic algorithm requires large numbers of solver calls. Therefore, a mesh sensitivity study is essential to balance minimizing numerical drag and minimizing the run time. A NACA0012-34 airfoil at a very low Reynolds number of Mesh topology for NACA0012-34 airfoil. (a) C-type computational domain and (b) mesh in near wall region. Grid-sensitivity study for NACA0012-34 at 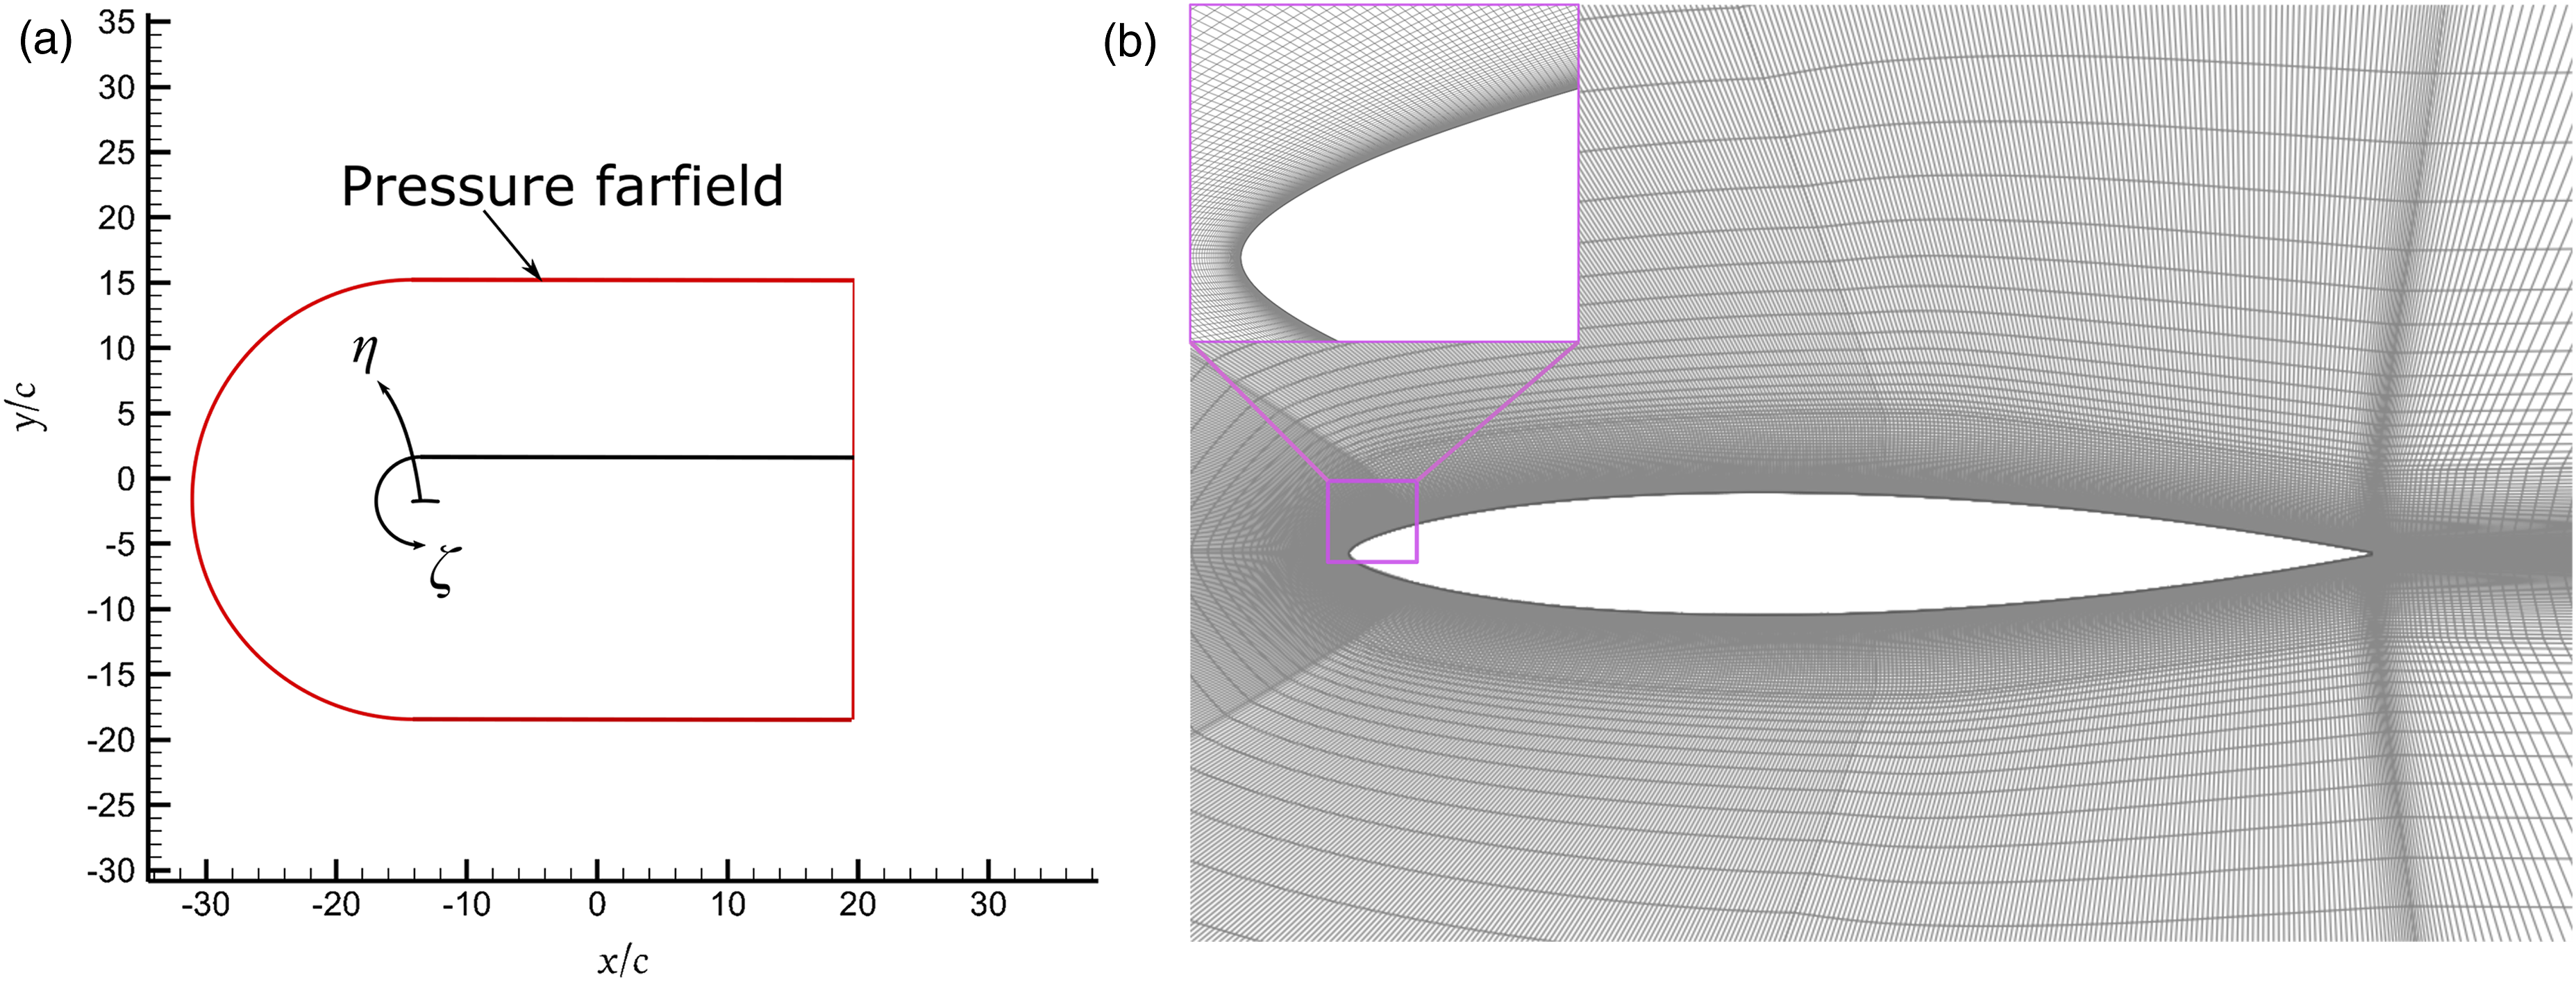
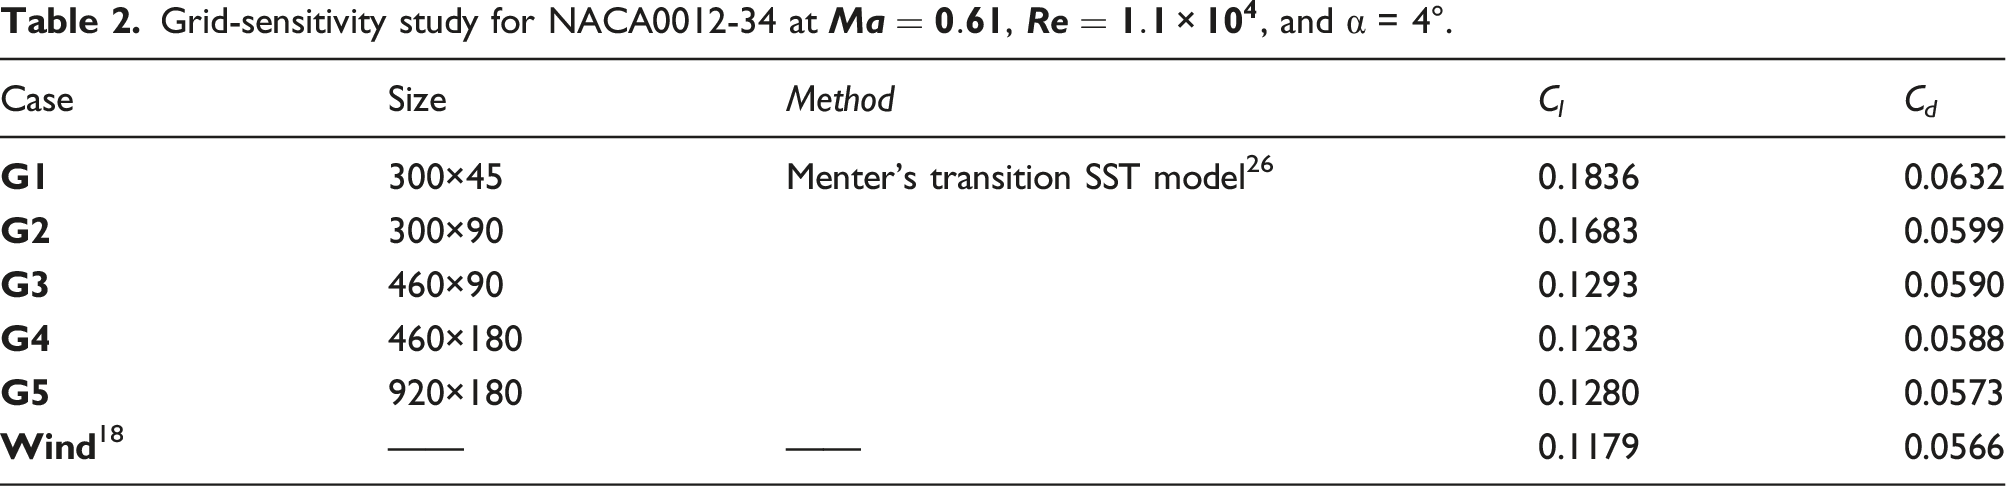
Mesh sensitivity analysis and verification of the numerical methods are carried out for NACA0012-34 high-Mach low-Reynolds airfoil in order to ascertain whether the selected grid density was of sufficient resolution and that the spatial discretization errors were minimal. The first grid, G1, listed in Table 2, was generated by estimating resolution requirements based on previous studies at lower Reynolds numbers. The second grid, G2, was subsequently produced to improve the simulation’s resolution. The maximum grid size of case G5 has 920 nodes streamwise, and 180 nodes are in the normal direction. The gird independence study shows little difference in aerodynamic coefficients, for example, lift coefficient, between G3, G4, and G5. All the RANS results in Figure 8 show a comparable solution in terms of aerodynamic coefficients. Case G5, with doubled grid points in streamwise and normal direction compared to G3, shows a much better agreement with the wind tunnel data, especially in drag coefficient as shown in Figure 8(d). Therefore, for the subsequent analysis, a grid size of 920×180 was considered a sufficient resolution for the present investigations. Mesh sensitivity study for NACA0012-34 airfoil at 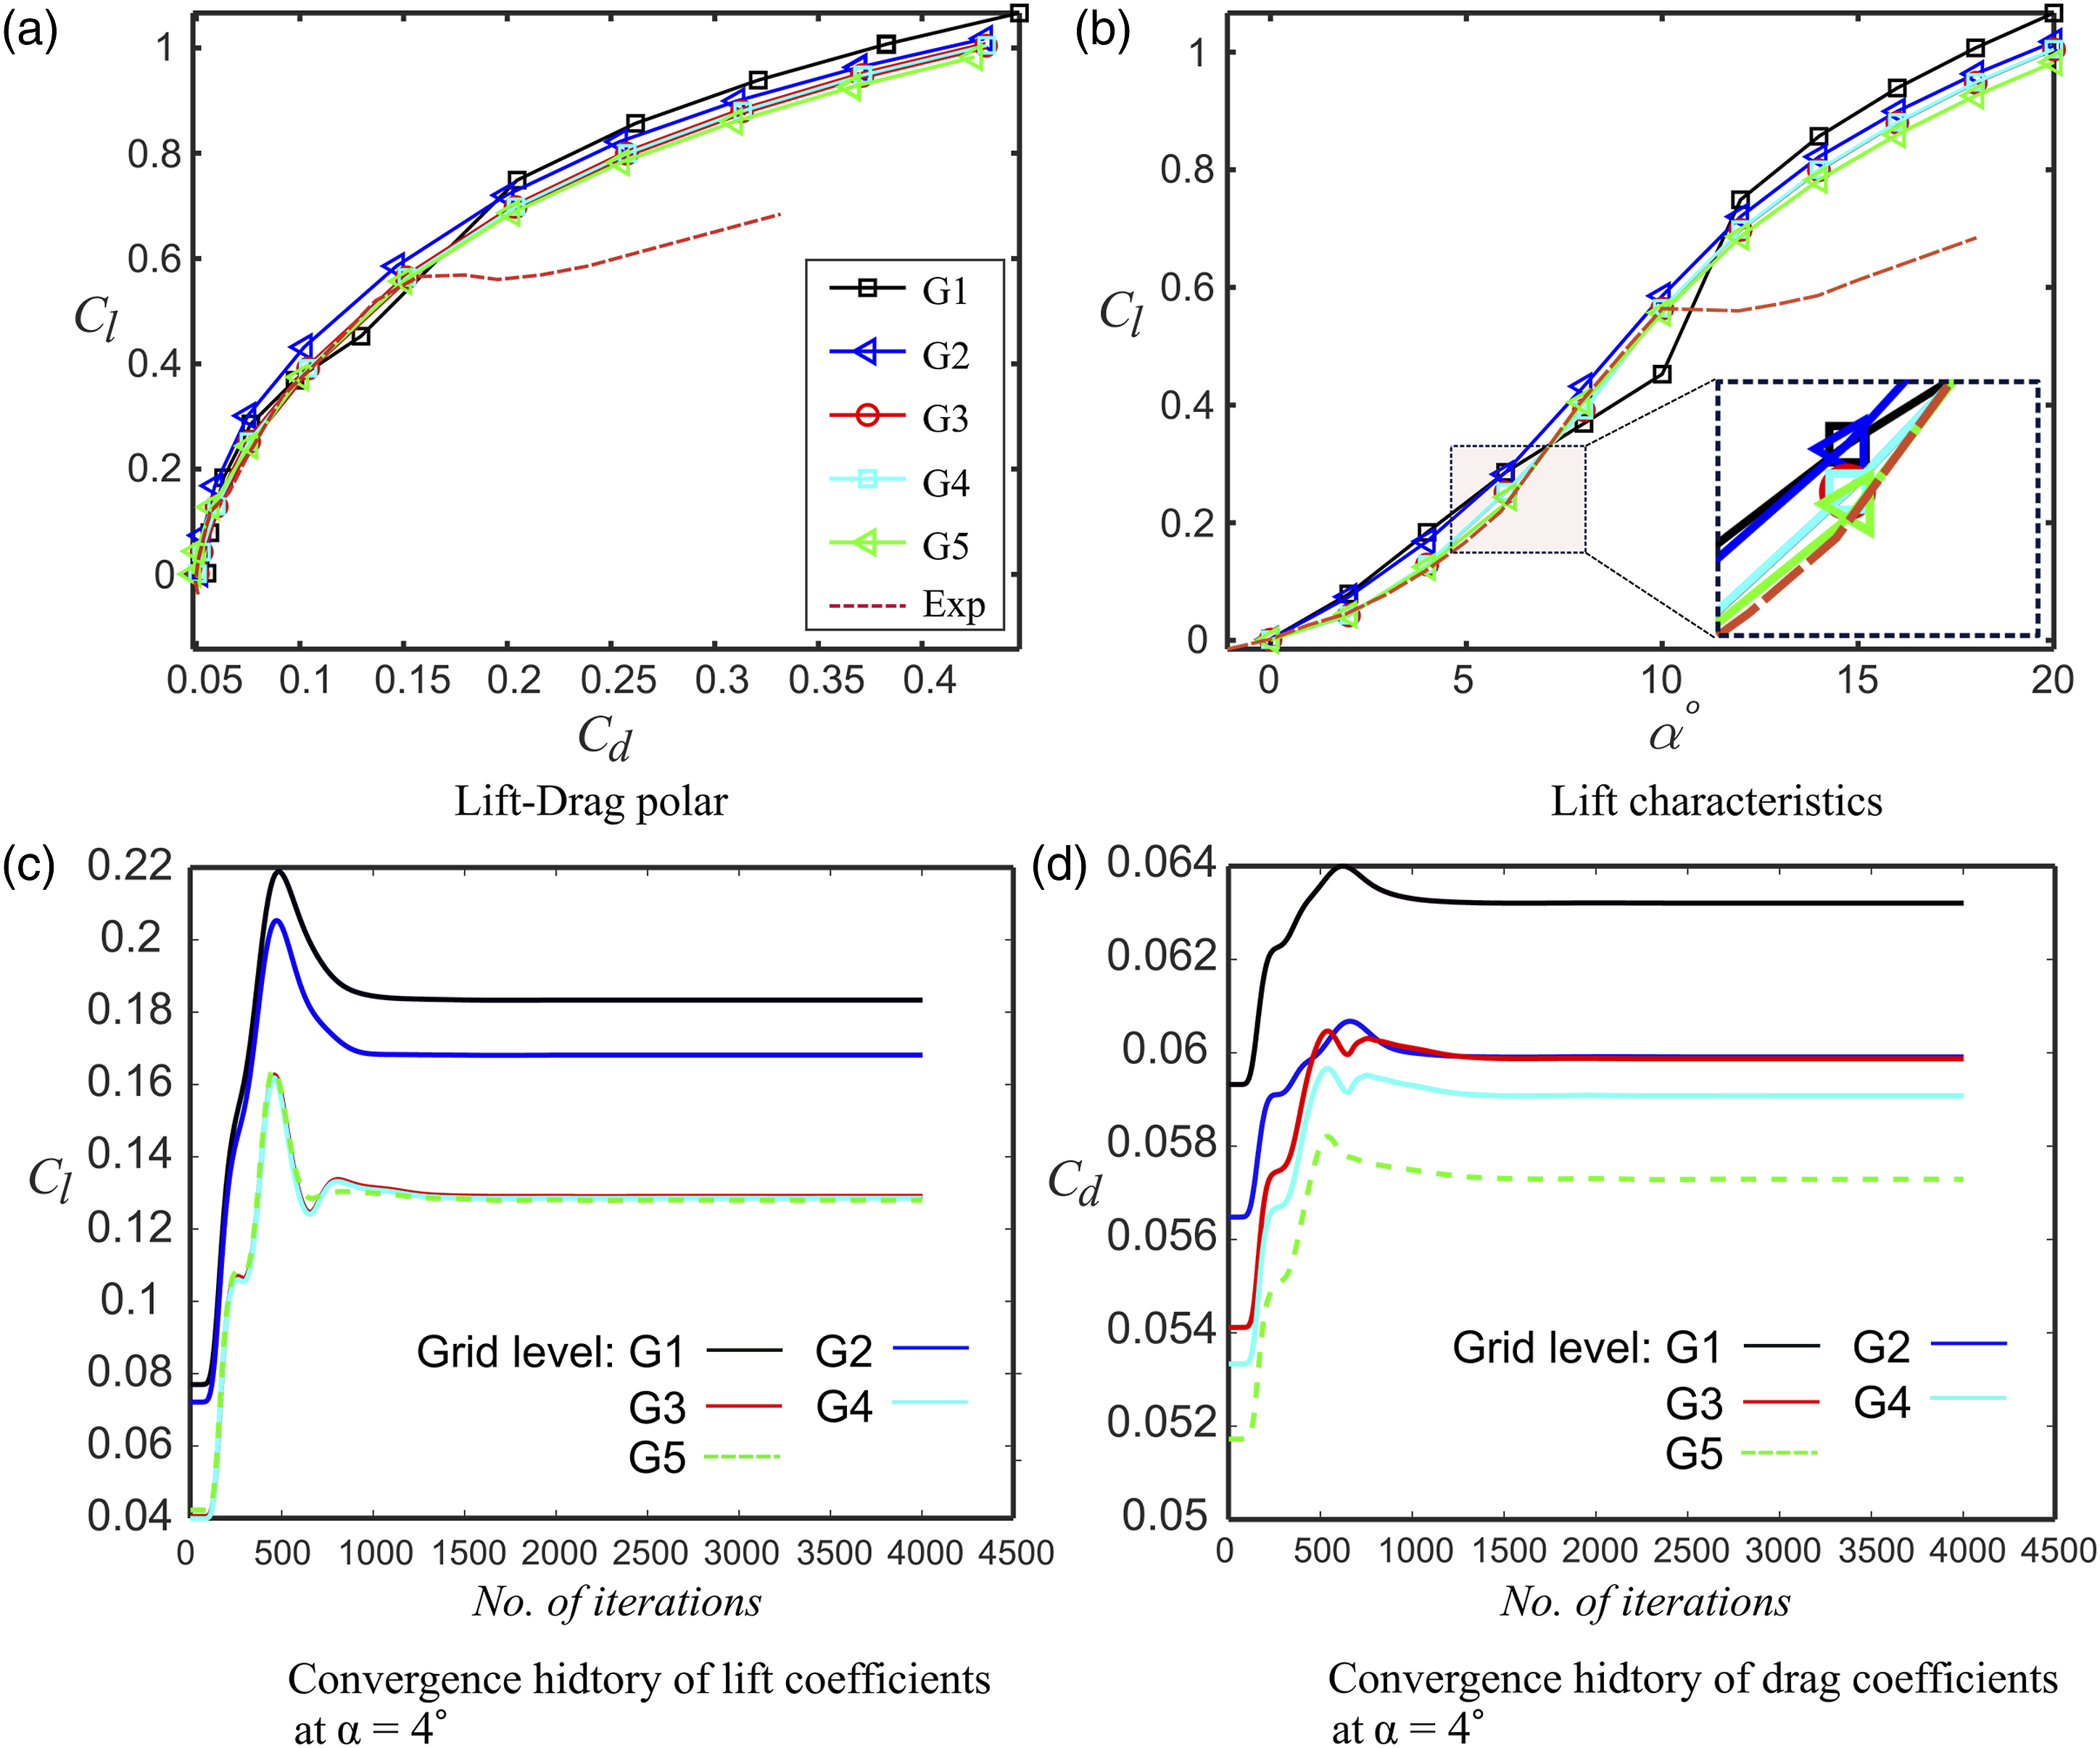
Airfoil shape optimization for Mars rotor blade
In our previous studies, 29 the laminar separation bubble significantly influences the lift-curve slope and drag characteristics at a low Reynolds number. However, contrary to the Earth’s atmosphere, Mars atmosphere shows a strong interaction between viscous and compressibility effects, indicating a highly complicated flowfield would be expected around the wing or propeller. This paper further investigates the limits to airfoil performance in the unexplored high-Mach low-Reynolds number in Mars environment.
As already stated, a single-point design generally leads to unacceptable off-design performances; therefore, it is necessary to specify multi-point designs. The optimization problem presented here is the improvement of the drag-rise characteristics of high-Mach low-Reynolds number airfoils.
Geometry and design variables
Bézier parameterization with upper and lower bounds of their control points.
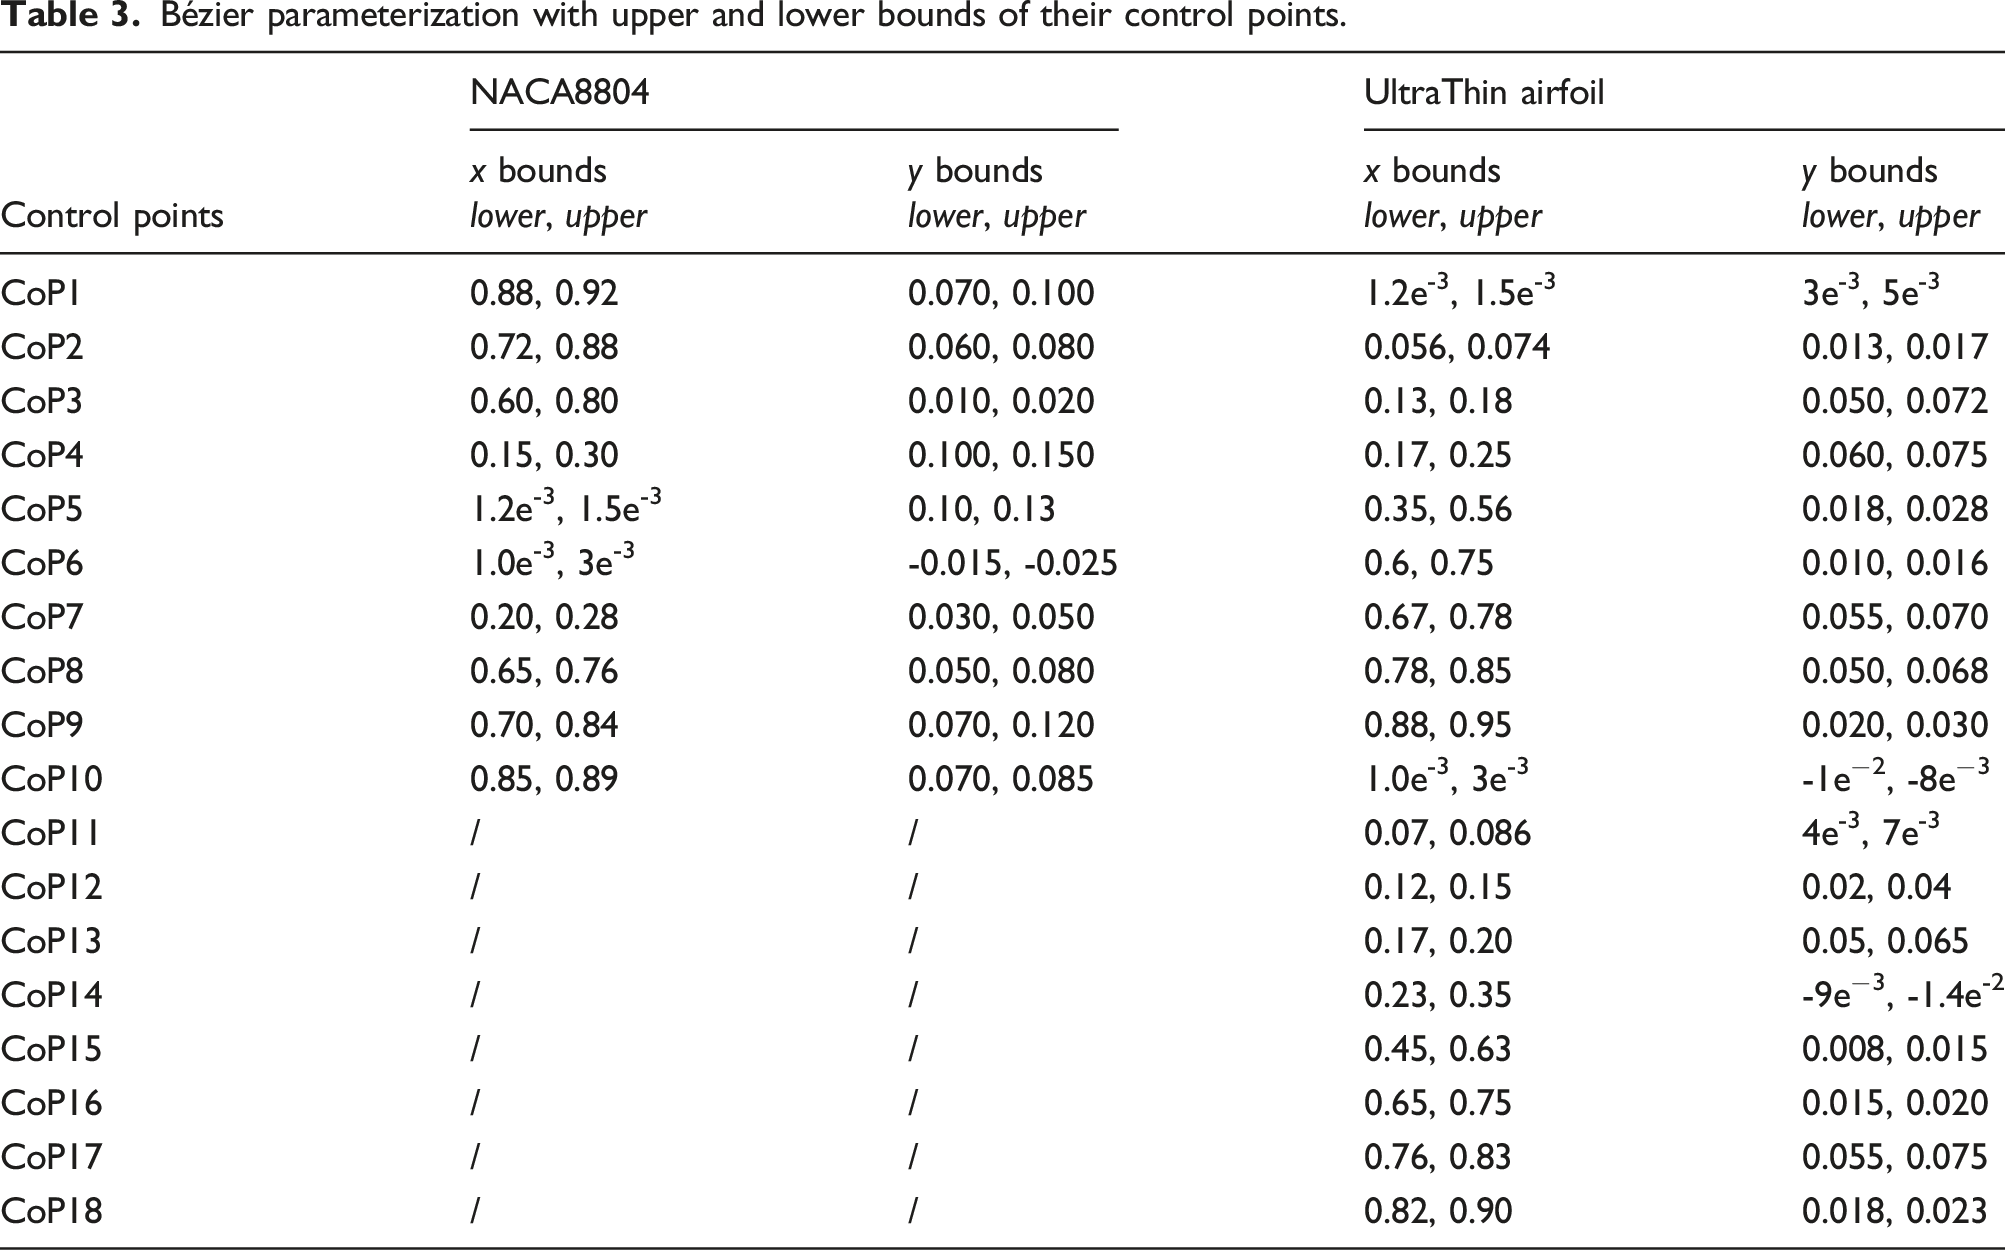
Although up to 10 (18 for UltraThin airfoil) control points have been adopted for airfoil’s parameterization, as shown Figure 5 (d and e) and Figure 6 (c and d) and each control point can be varied in the x and y direction. The designed bounds for the x and y direction are listed in Table 3. These four points primarily control the geometric shape at and near the leading edge of the airfoil, thus significantly influencing the aerodynamic performance.
Genetic algorithm
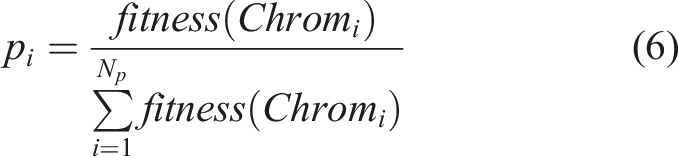
Objectives for single-point and multi-point optimization problem.
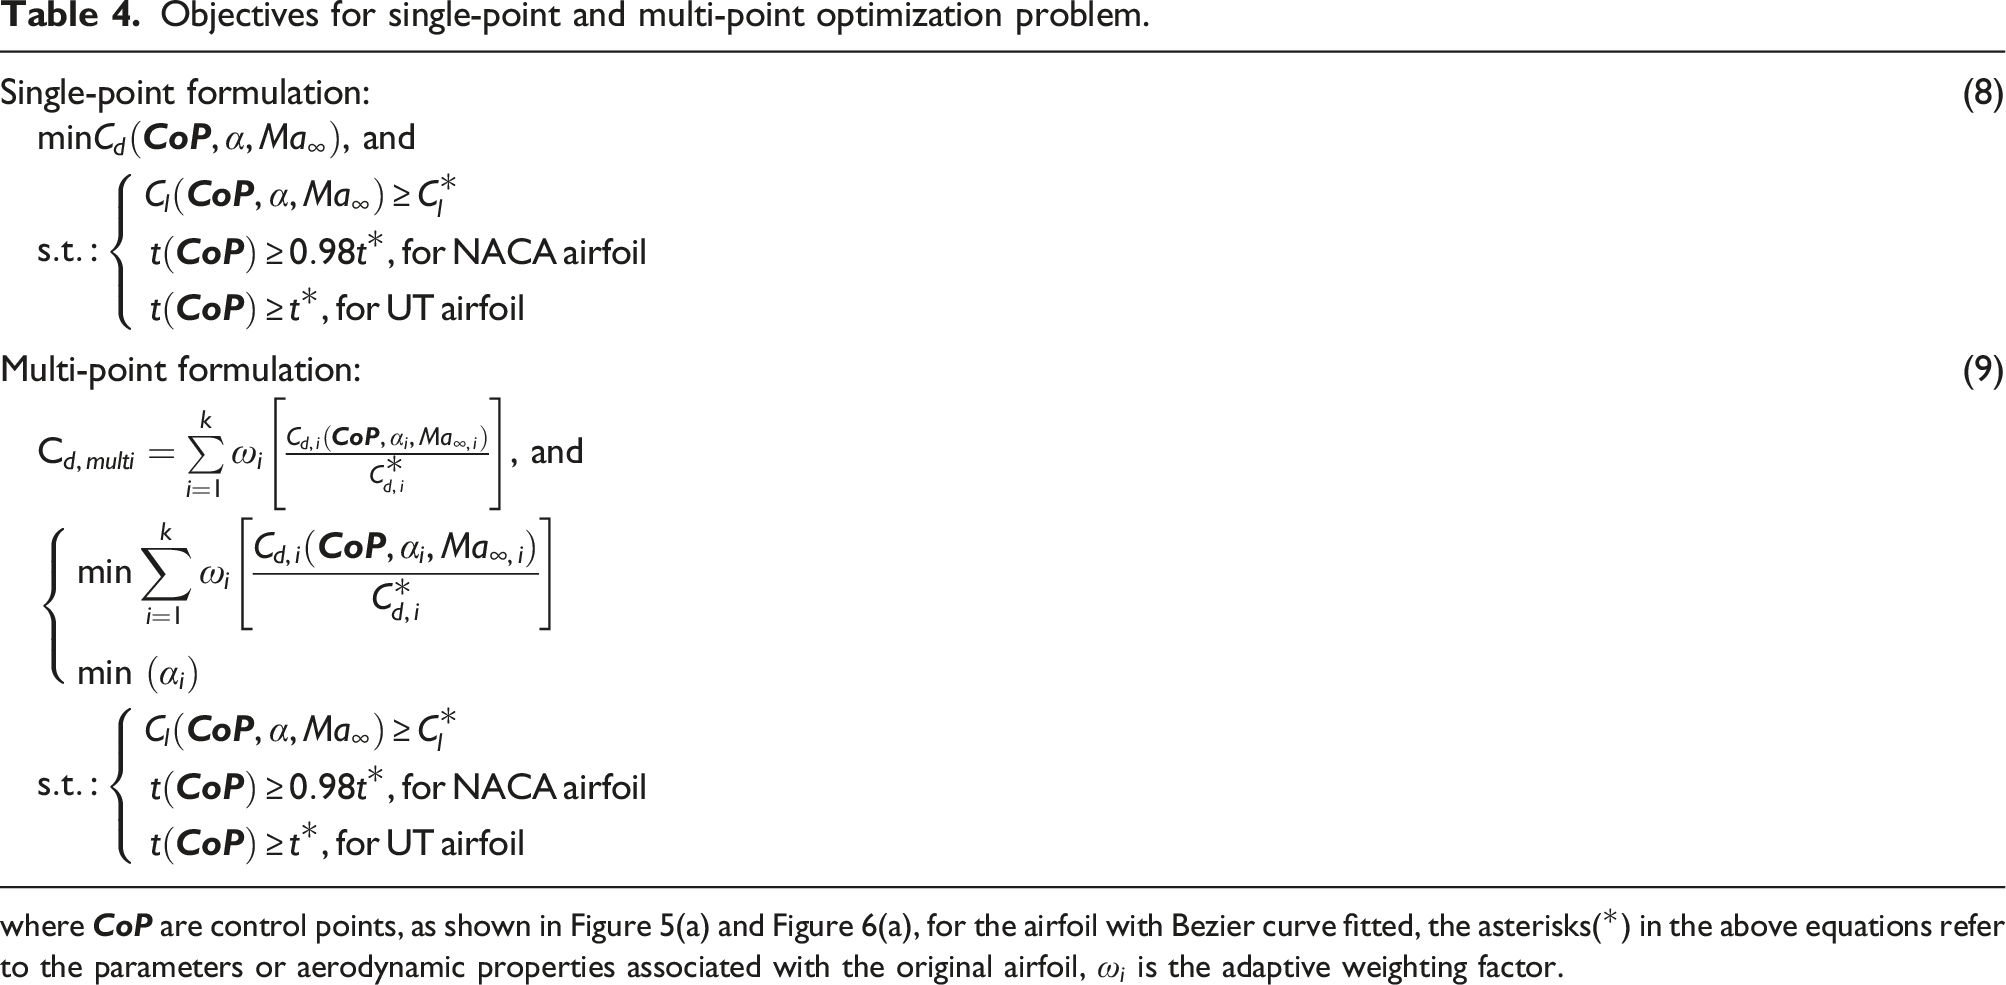
where
The pure-mutation operator takes one chromosome from the total number of populations with a random value, as shown following: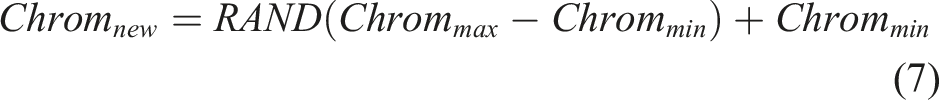
After the mutations take place, the costs associated with the offspring and mutated chromosomes are calculated. The process described is iterated. The maximum number of generations depends on when an acceptable solution is obtained.
A weakness of GAs is their poor computational efficiency, which prevents their practical use when the cost function evaluation is computationally heavy. Oyama et al. 32 used an EA to redesign the NASA rotor67. The blade shape has 56 design parameters, with a population size of 64 and a generation size of 100 are utilized. However, Timnak, N. et al. 33 applied the GA method for the optimum design of a transonic airfoil, the PARSEC method with nine design variables was applied for airfoil parameterization. The total population of each generation is set to be 20. In addition, the tournament operator is used with an elitist strategy where the first- and second-best chromosomes in each generation are directly transferred to the next generation. Flows over multi-element airfoils have been analyzed using GA methods by Benini, E. et al. 34 The population size was chosen by multiplying the number of free variables (equal to 22) by a factor of 3 or 4. The value of 70 individuals per generation felt within the cited interval. The total number of generations performed was set to 30 artificially, corresponding to 2100 evaluations of the fitness function. Therefore, in the present case, the total number population, Np, is 100, and the probability values are 0.8 and 0.05 for crossover and mutation, respectively.
Results and discussion
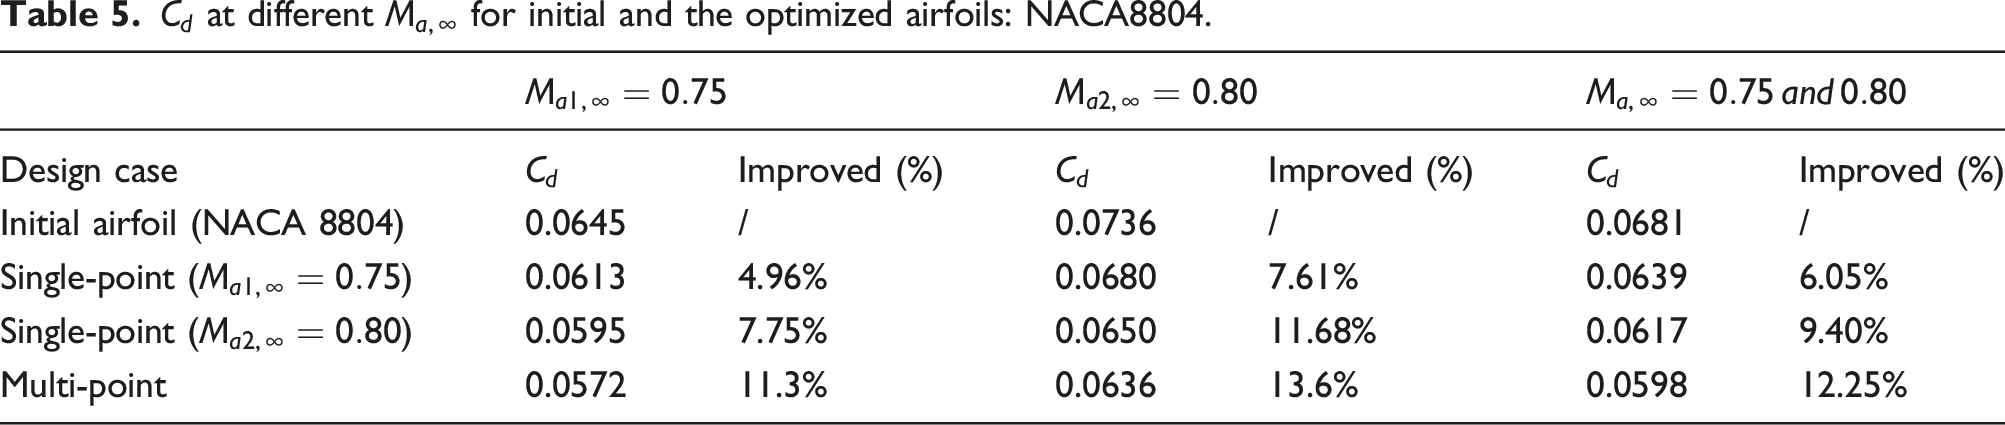
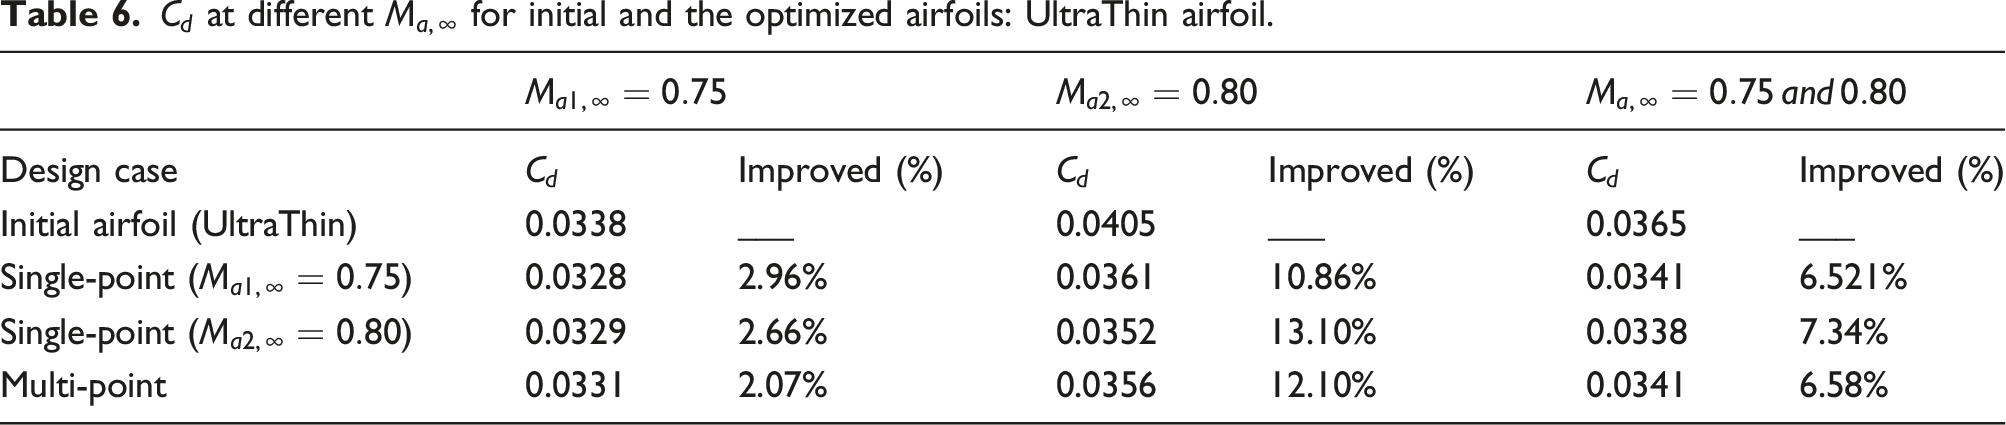
This section shows the optimization results of the NACA8804 and UltraThin airfoils. In particular, starting from the original airfoil coordinates, the aerodynamic shape optimization results will be presented in the following arrangement, including results comparison of single-point and multi-point optimization; then, the airfoil performance is discussed, including effects of Mach numbers and Reynolds numbers.
Single-point Vs multi-point optimization
Two single-point optimizations, applying single-point formulation (8), for two different flight conditions,
Figure 9(a) shows the geometries of the optimized airfoils. In all cases, the three NACA optimized airfoils are very smooth, and the percentage of aft camber is reduced compared to the original airfoil at design conditions. The optimized airfoils have a maximum thickness of Initial airfoil and single-/multi-point optimized airfoils at 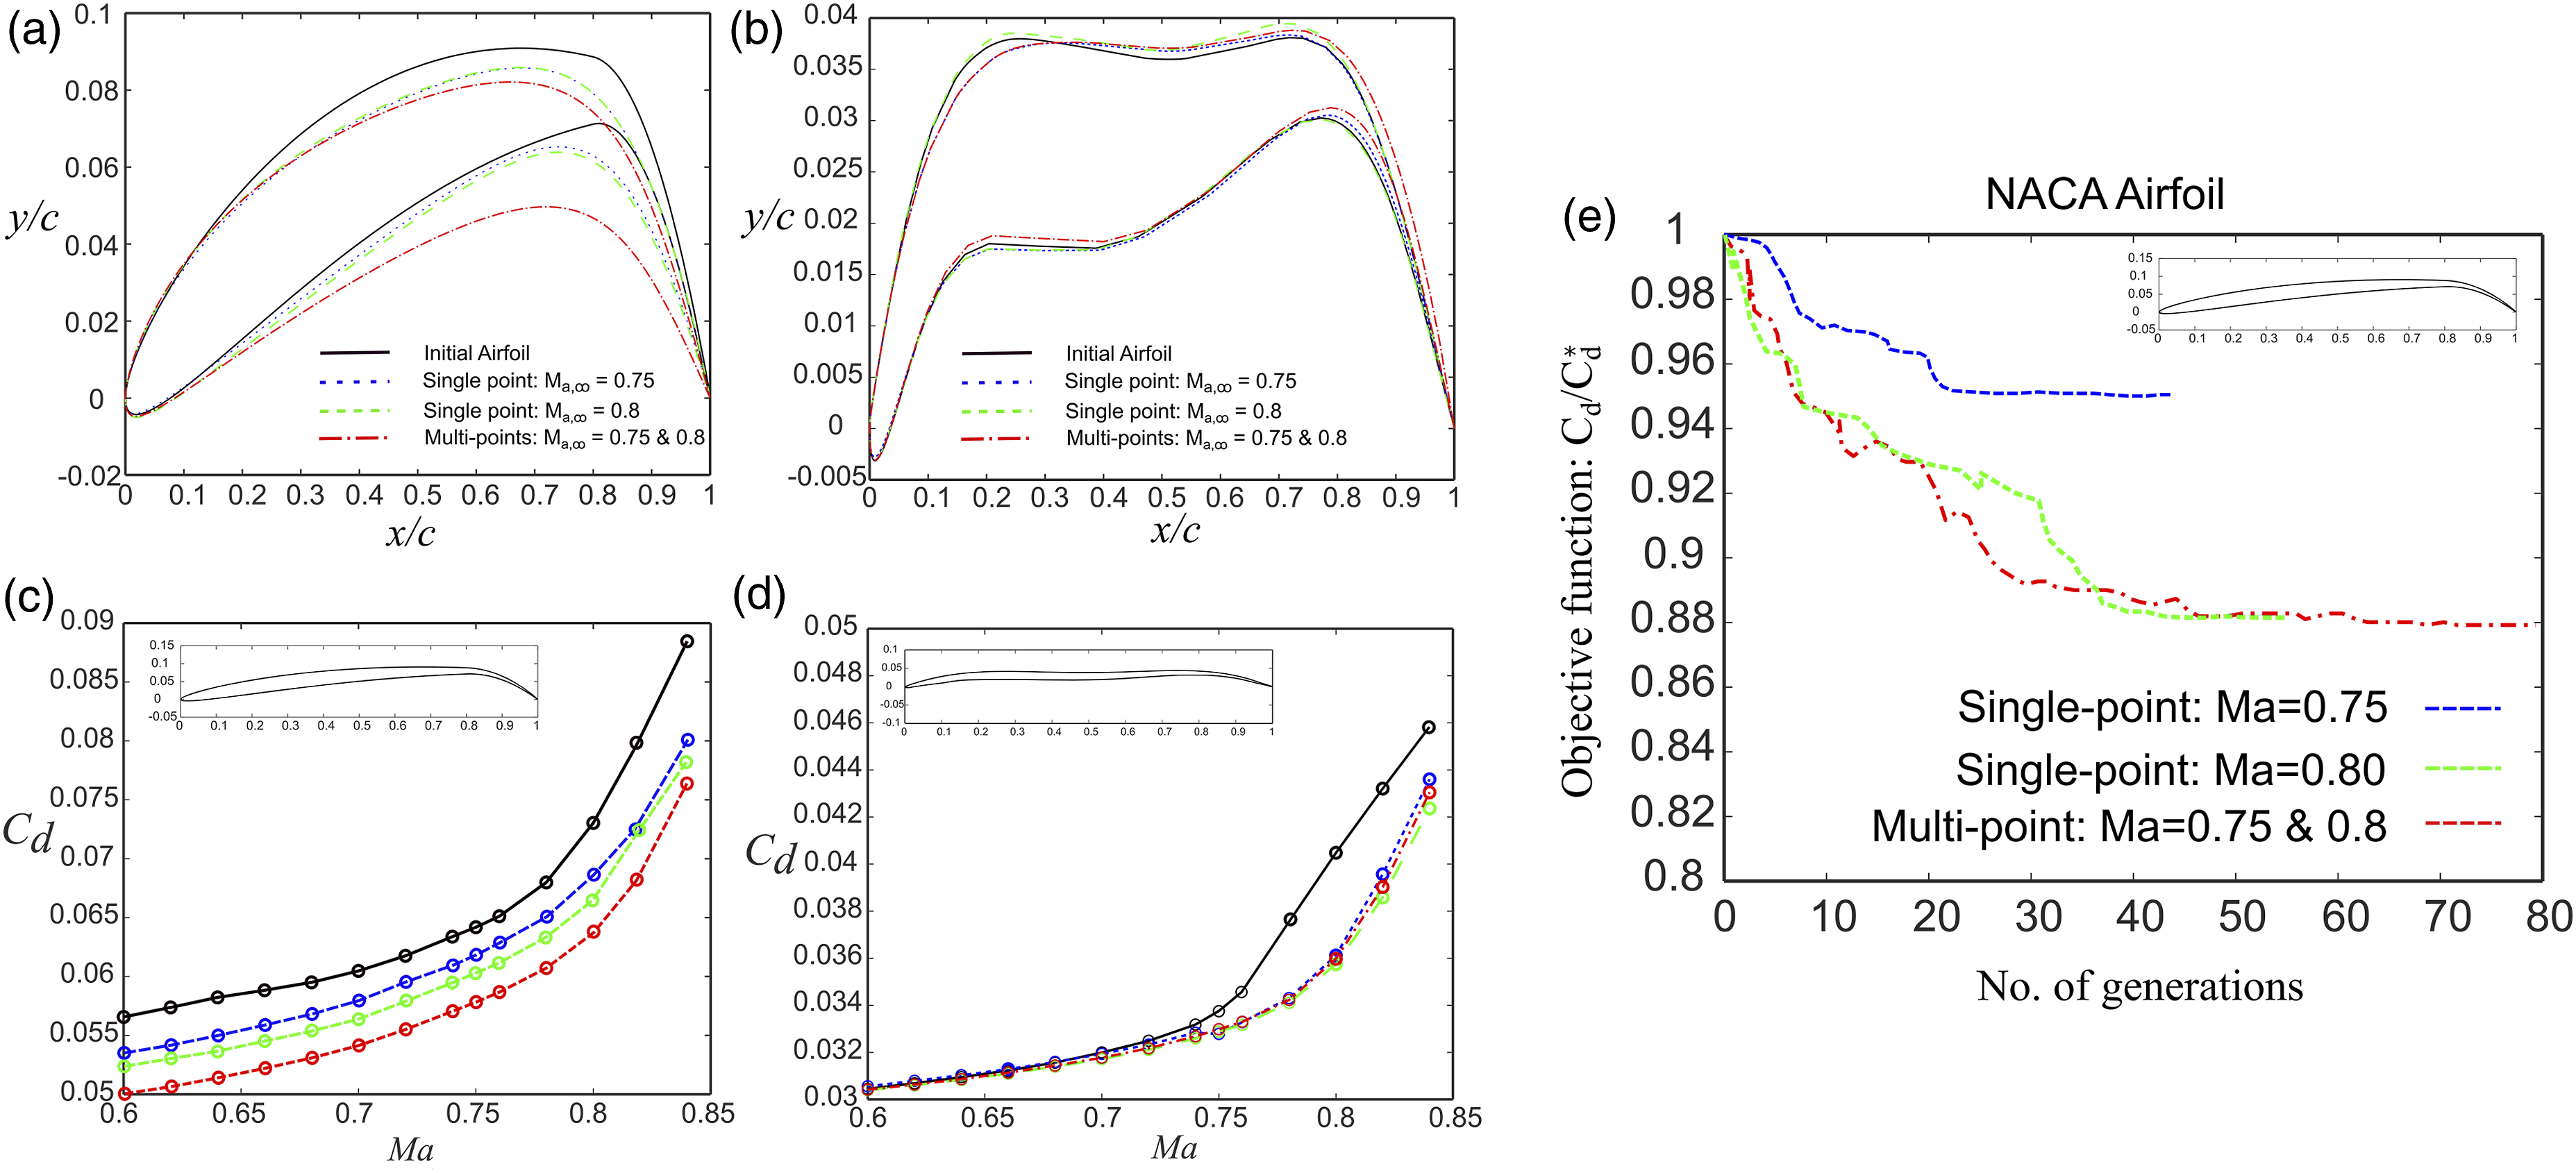
Figures 10 and 11 show the time-averaged plots of the multi-point optimized airfoil at the design conditions (i.e., C
l
= 0.581). For clarity, Figure 10 a–e shows the Mach contour with a trailing-edge separation, a thickening in the wake separation is observed as the Mach number increases. Periodic lift fluctuations, such as the NACA airfoil in Figure 10(h), indicate the enhanced unsteadiness regarding a strengthened shock wave/separation interaction as the Mach number increases. When the Mach number reaches 0.84, the amplitude of lift fluctuation almost doubles compared with that at Ma = 0.8, which shows an earlier separation in Figure 10(f) marked as an arrow on the pink curve. In addition, the time-averaged pressure coefficient distribution in Figure 10(f) pink curve further highlights an increase in shock wave strength (i.e., a larger pressure rises). The corresponding two fundamental drag components, pressure drag C
dp,
and friction drag C
df
, have been expressed in Figure 10(g). A sharp increase in pressure drag coefficient is observed at Ma > 0.75. However, the friction drag coefficient is almost constant. This increase in drag is virtually due to the formation of the shock wave on the upper surface. Time-averaged plots of the multi-point optimized NACA airfoil at the design conditions of C
l
= 0.581 and Re = 17,000. Time-averaged plots of the multi-point optimized UltraThin airfoil at the design conditions of C
l
= 0.581 and Re = 17,000.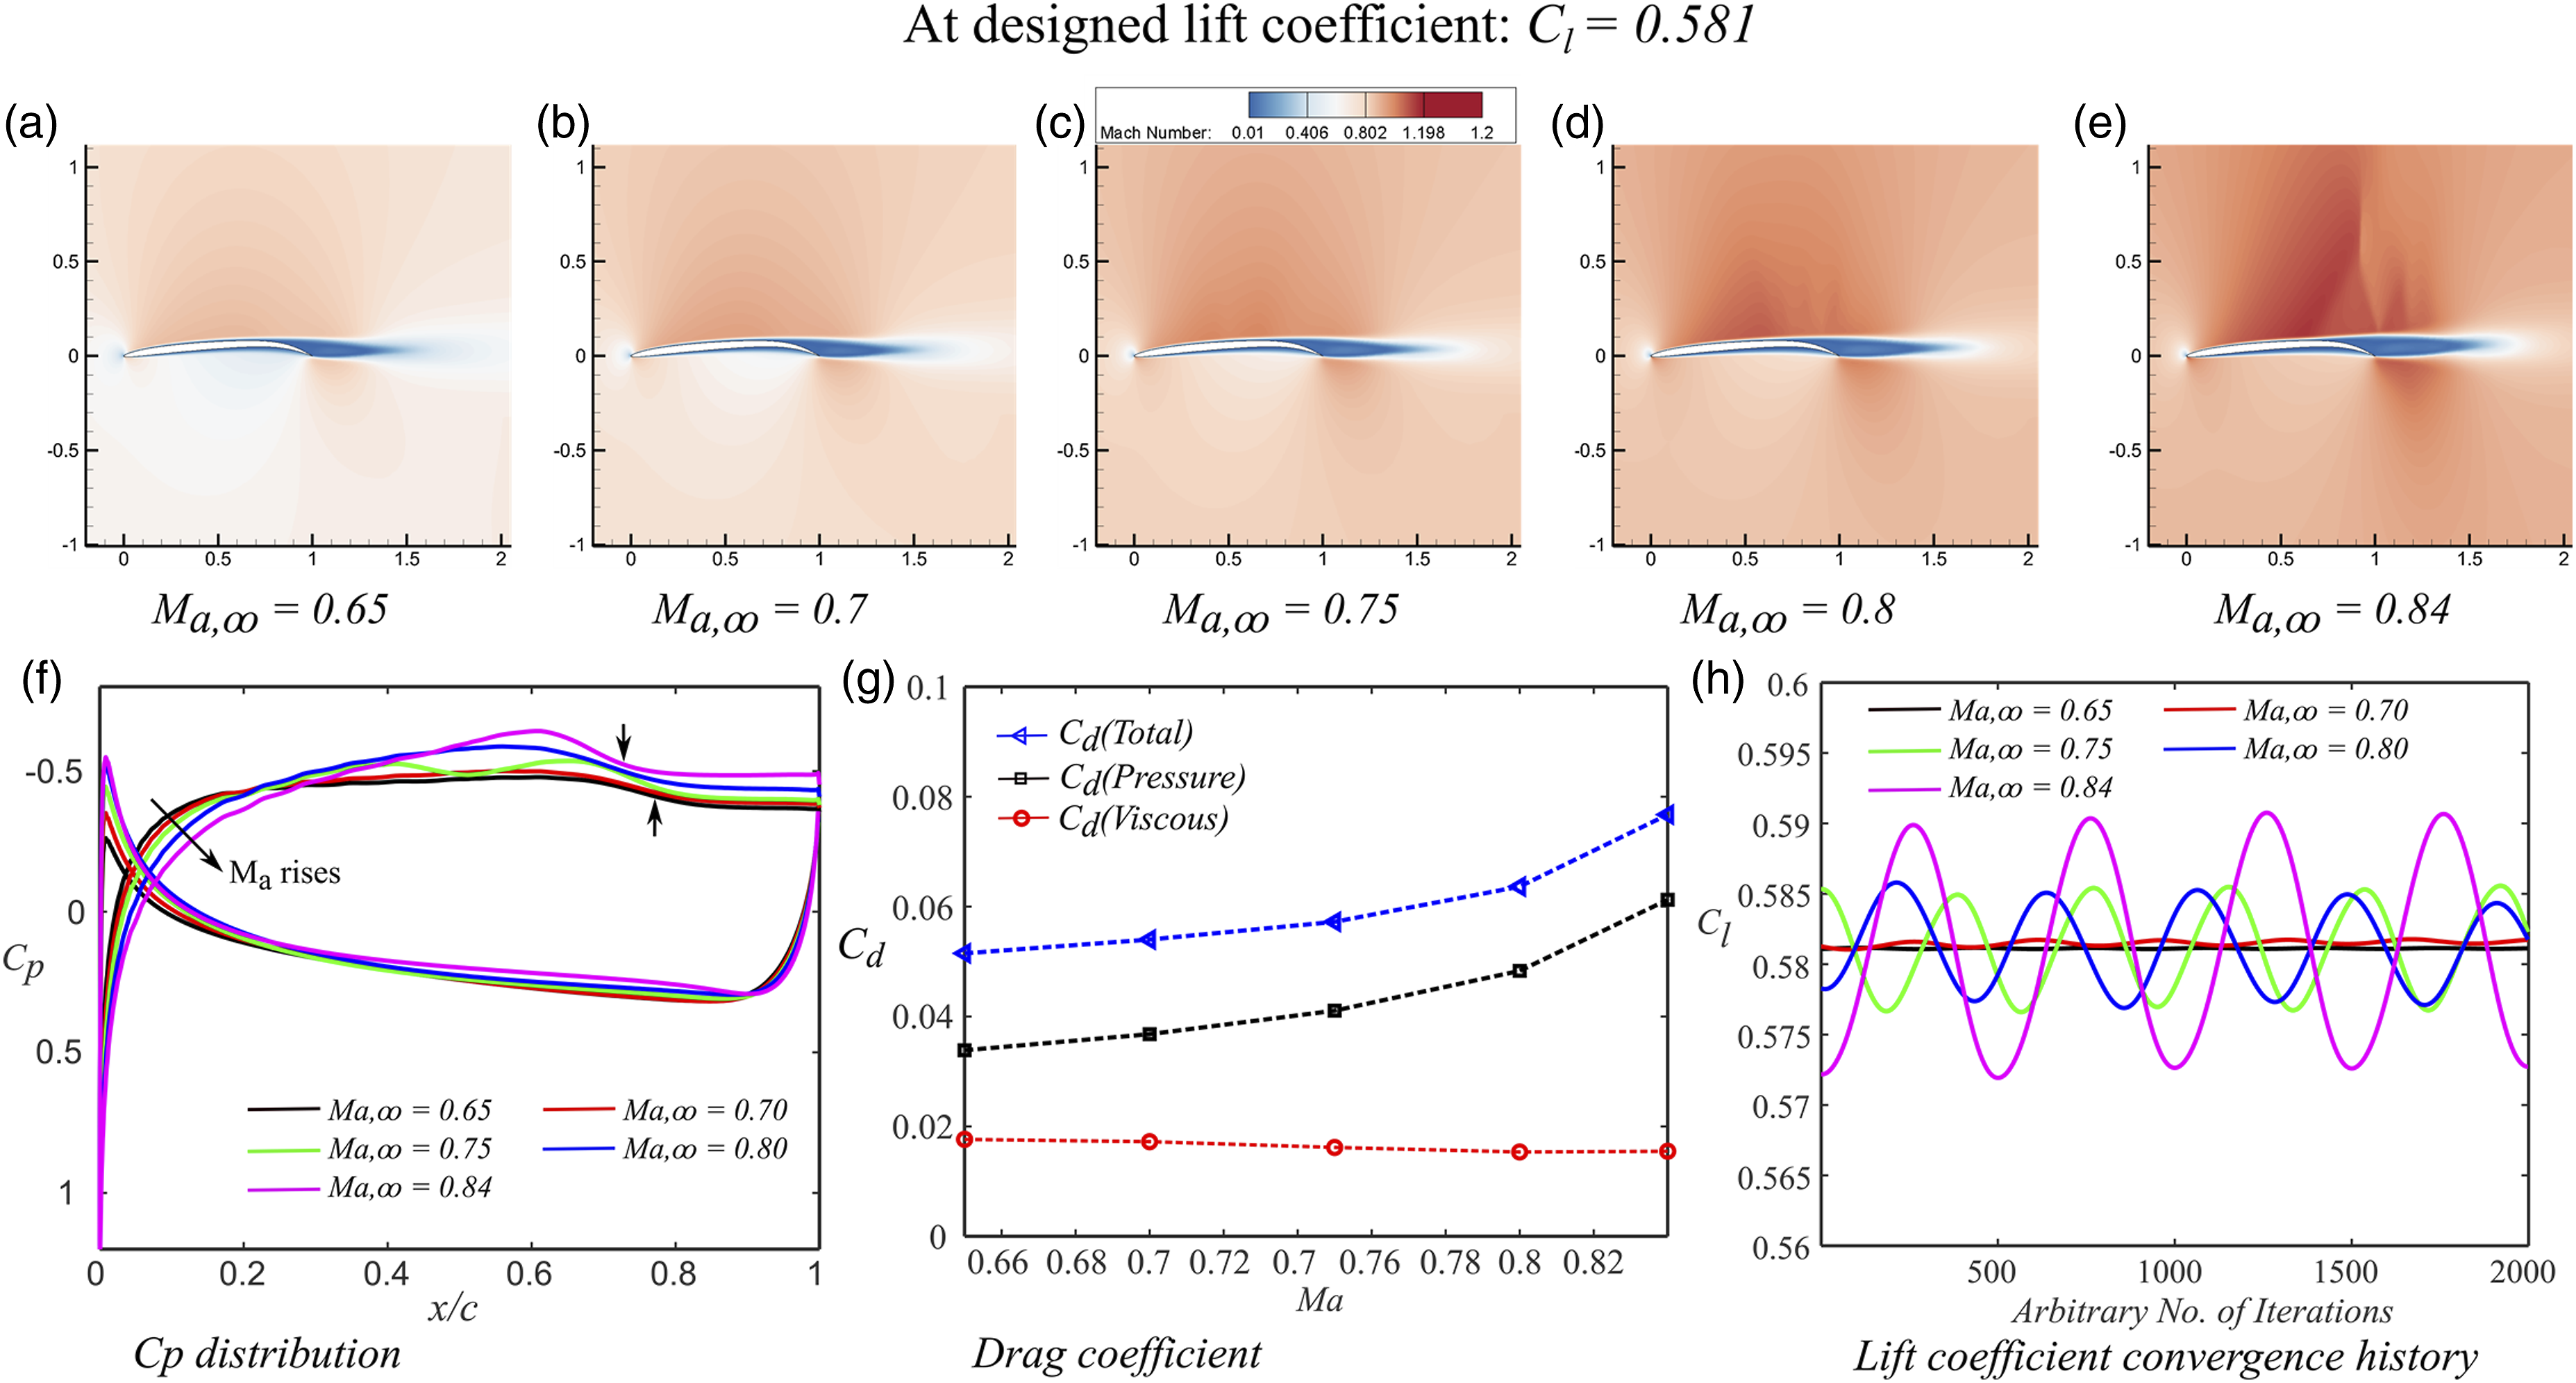
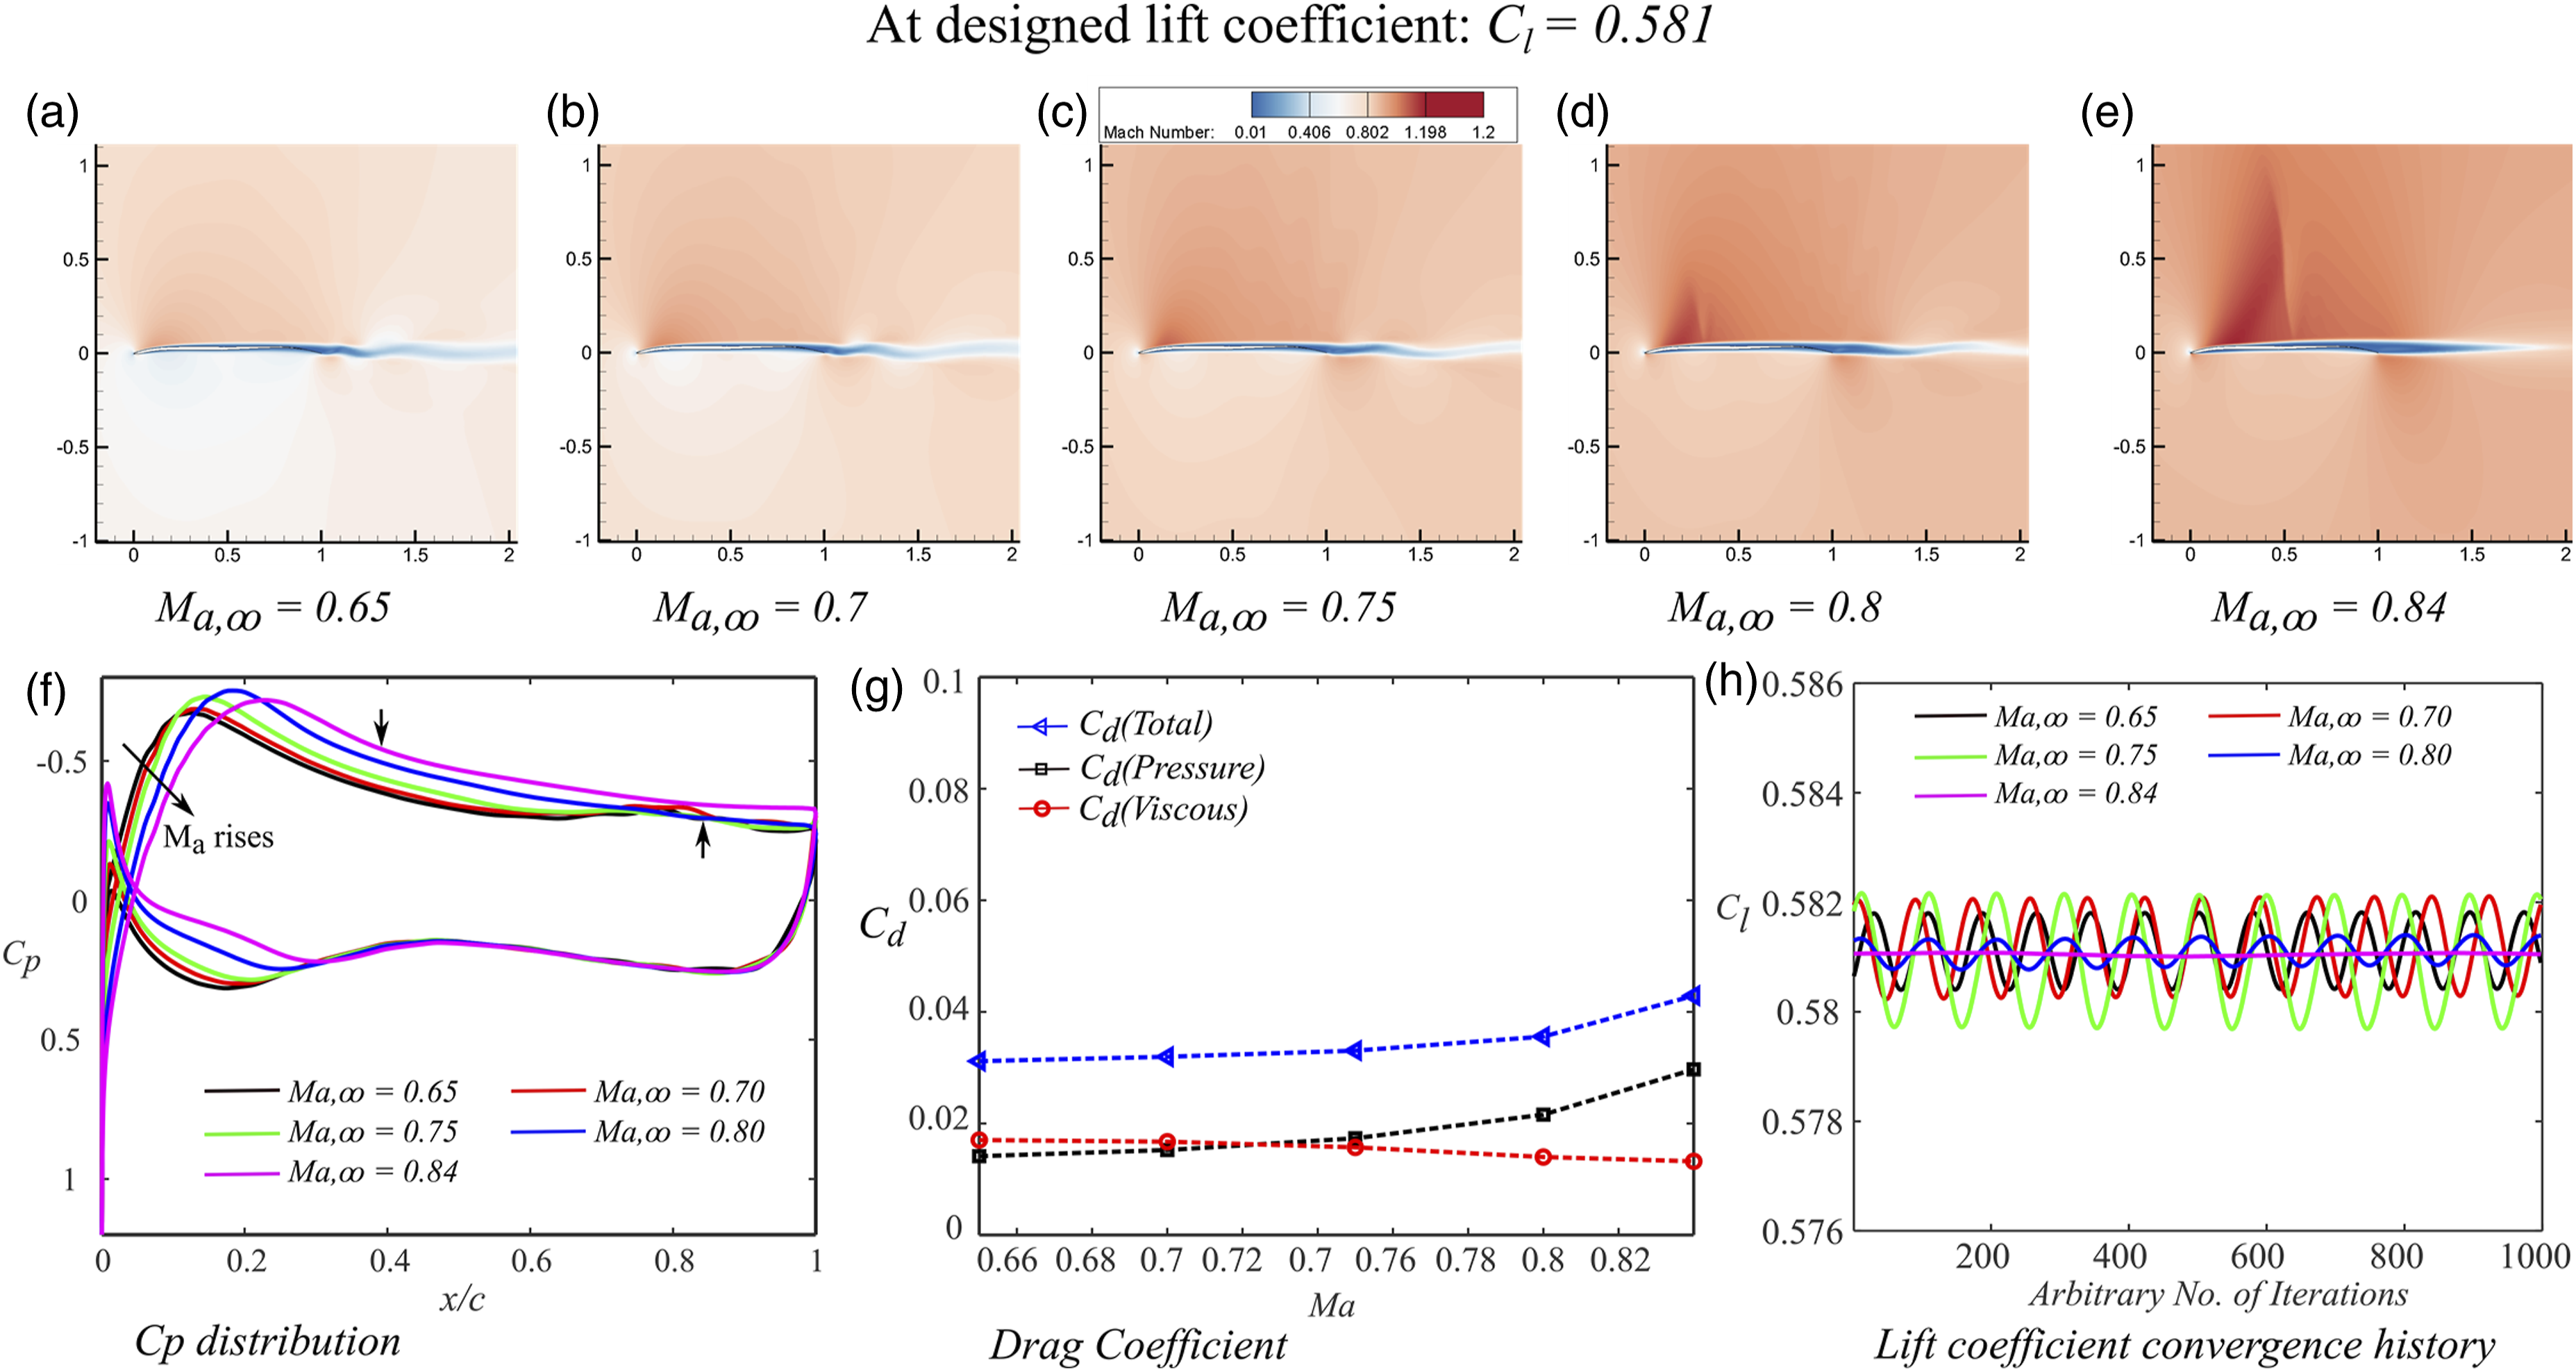
In contrast, Figure 11 a–e shows the airfoil wake variation under the influence of the Mach number, forming a pattern similar to that of a vortex-shedding in the far downstream region. As the Mach number reaches 0.84, a stretched and thickened wake pattern is formed. If we compare the periodic lift fluctuations between two airfoils as shown in Figure 10(h) and Figure 11(h), we immediately see that the UT airfoil shows a decreasing of amplitude in lift coefficient fluctuation as the Mach number increases, while the NACA airfoil shows the opposite trend. A possible reason is that the shock wave thickens the wake separation and hence tend to move the shock foot away from the airfoil surface (i.e., enhanced shock/separation interaction, which is a unique feature of low-Reynolds high-Mach number flow). On the other hand, the UT airfoil shows that as the Mach number increases a shock wave starts to form at the leading edge, and a shock-induced boundary layer separation is observed when Ma = 0.84. The corresponding separation location on the pink curve (i.e., Ma = 0.84) is indicated by a black arrow in Figure 11(f). Finally, the UT airfoil shows the pressure drag does not rise as fast as for the NACA airfoil for the entire Mach number range, as shown in Figure 11(g), indicating an attached flow was retained on upper surface of the UT airfoil.
Aerodynamic performance
To help understanding on the performance of the optimized airfoil under off-design conditions, the influences of the Mach number, from 0.6 to 0.9, on the aerodynamic characteristics of the optimized airfoils for a given Reynolds number are investigated, as shown in Figures 12 and 13. First, NACA and UT airfoils have shown improvements in aerodynamic efficiency at given constraints. A maximum lift-to-drag ratio of 13.9 and 20.5 are obtained for NACA and UT optimized airfoils, respectively. Second, the NACA (4% thickness) and UT airfoils (with 2% thickness) both shown a less variation on the Effect of Mach number on aerodynamic characteristics of NACA-based airfoils at off-design conditions: optimized airfoil (1) at Effect of Mach number on aerodynamic characteristics of UT airfoils at off-design conditions: optimized airfoil (1) at 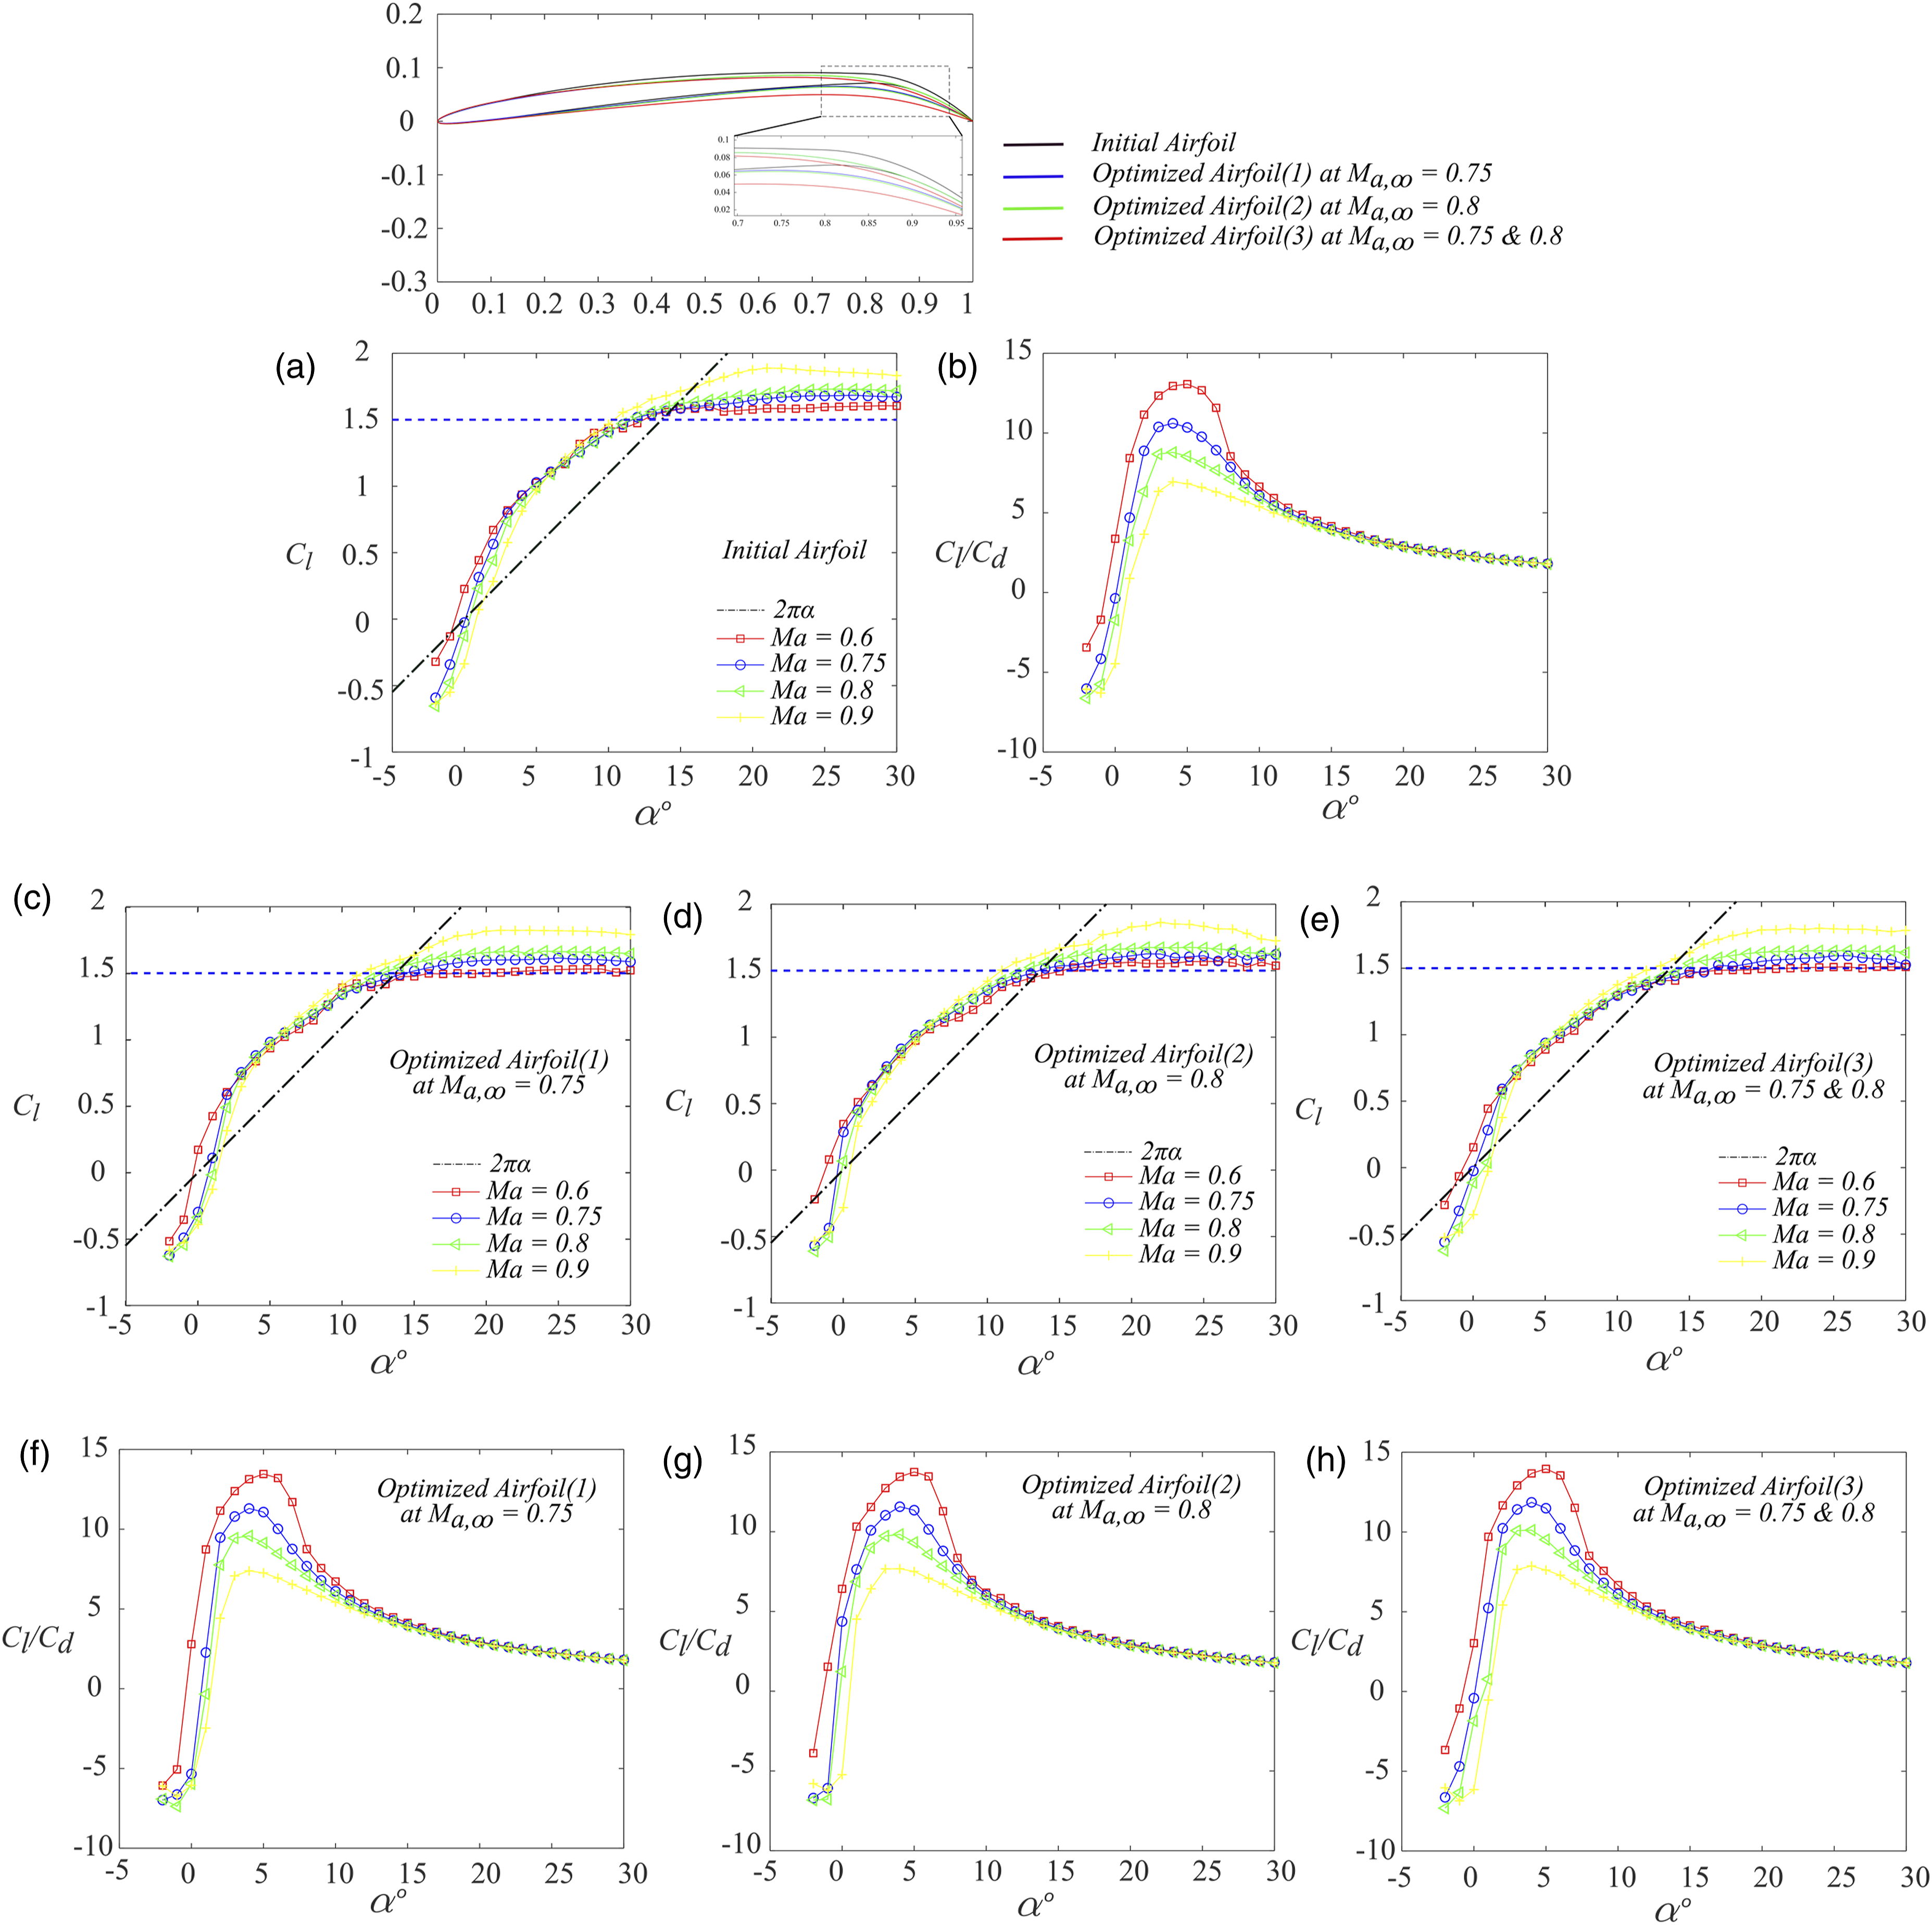
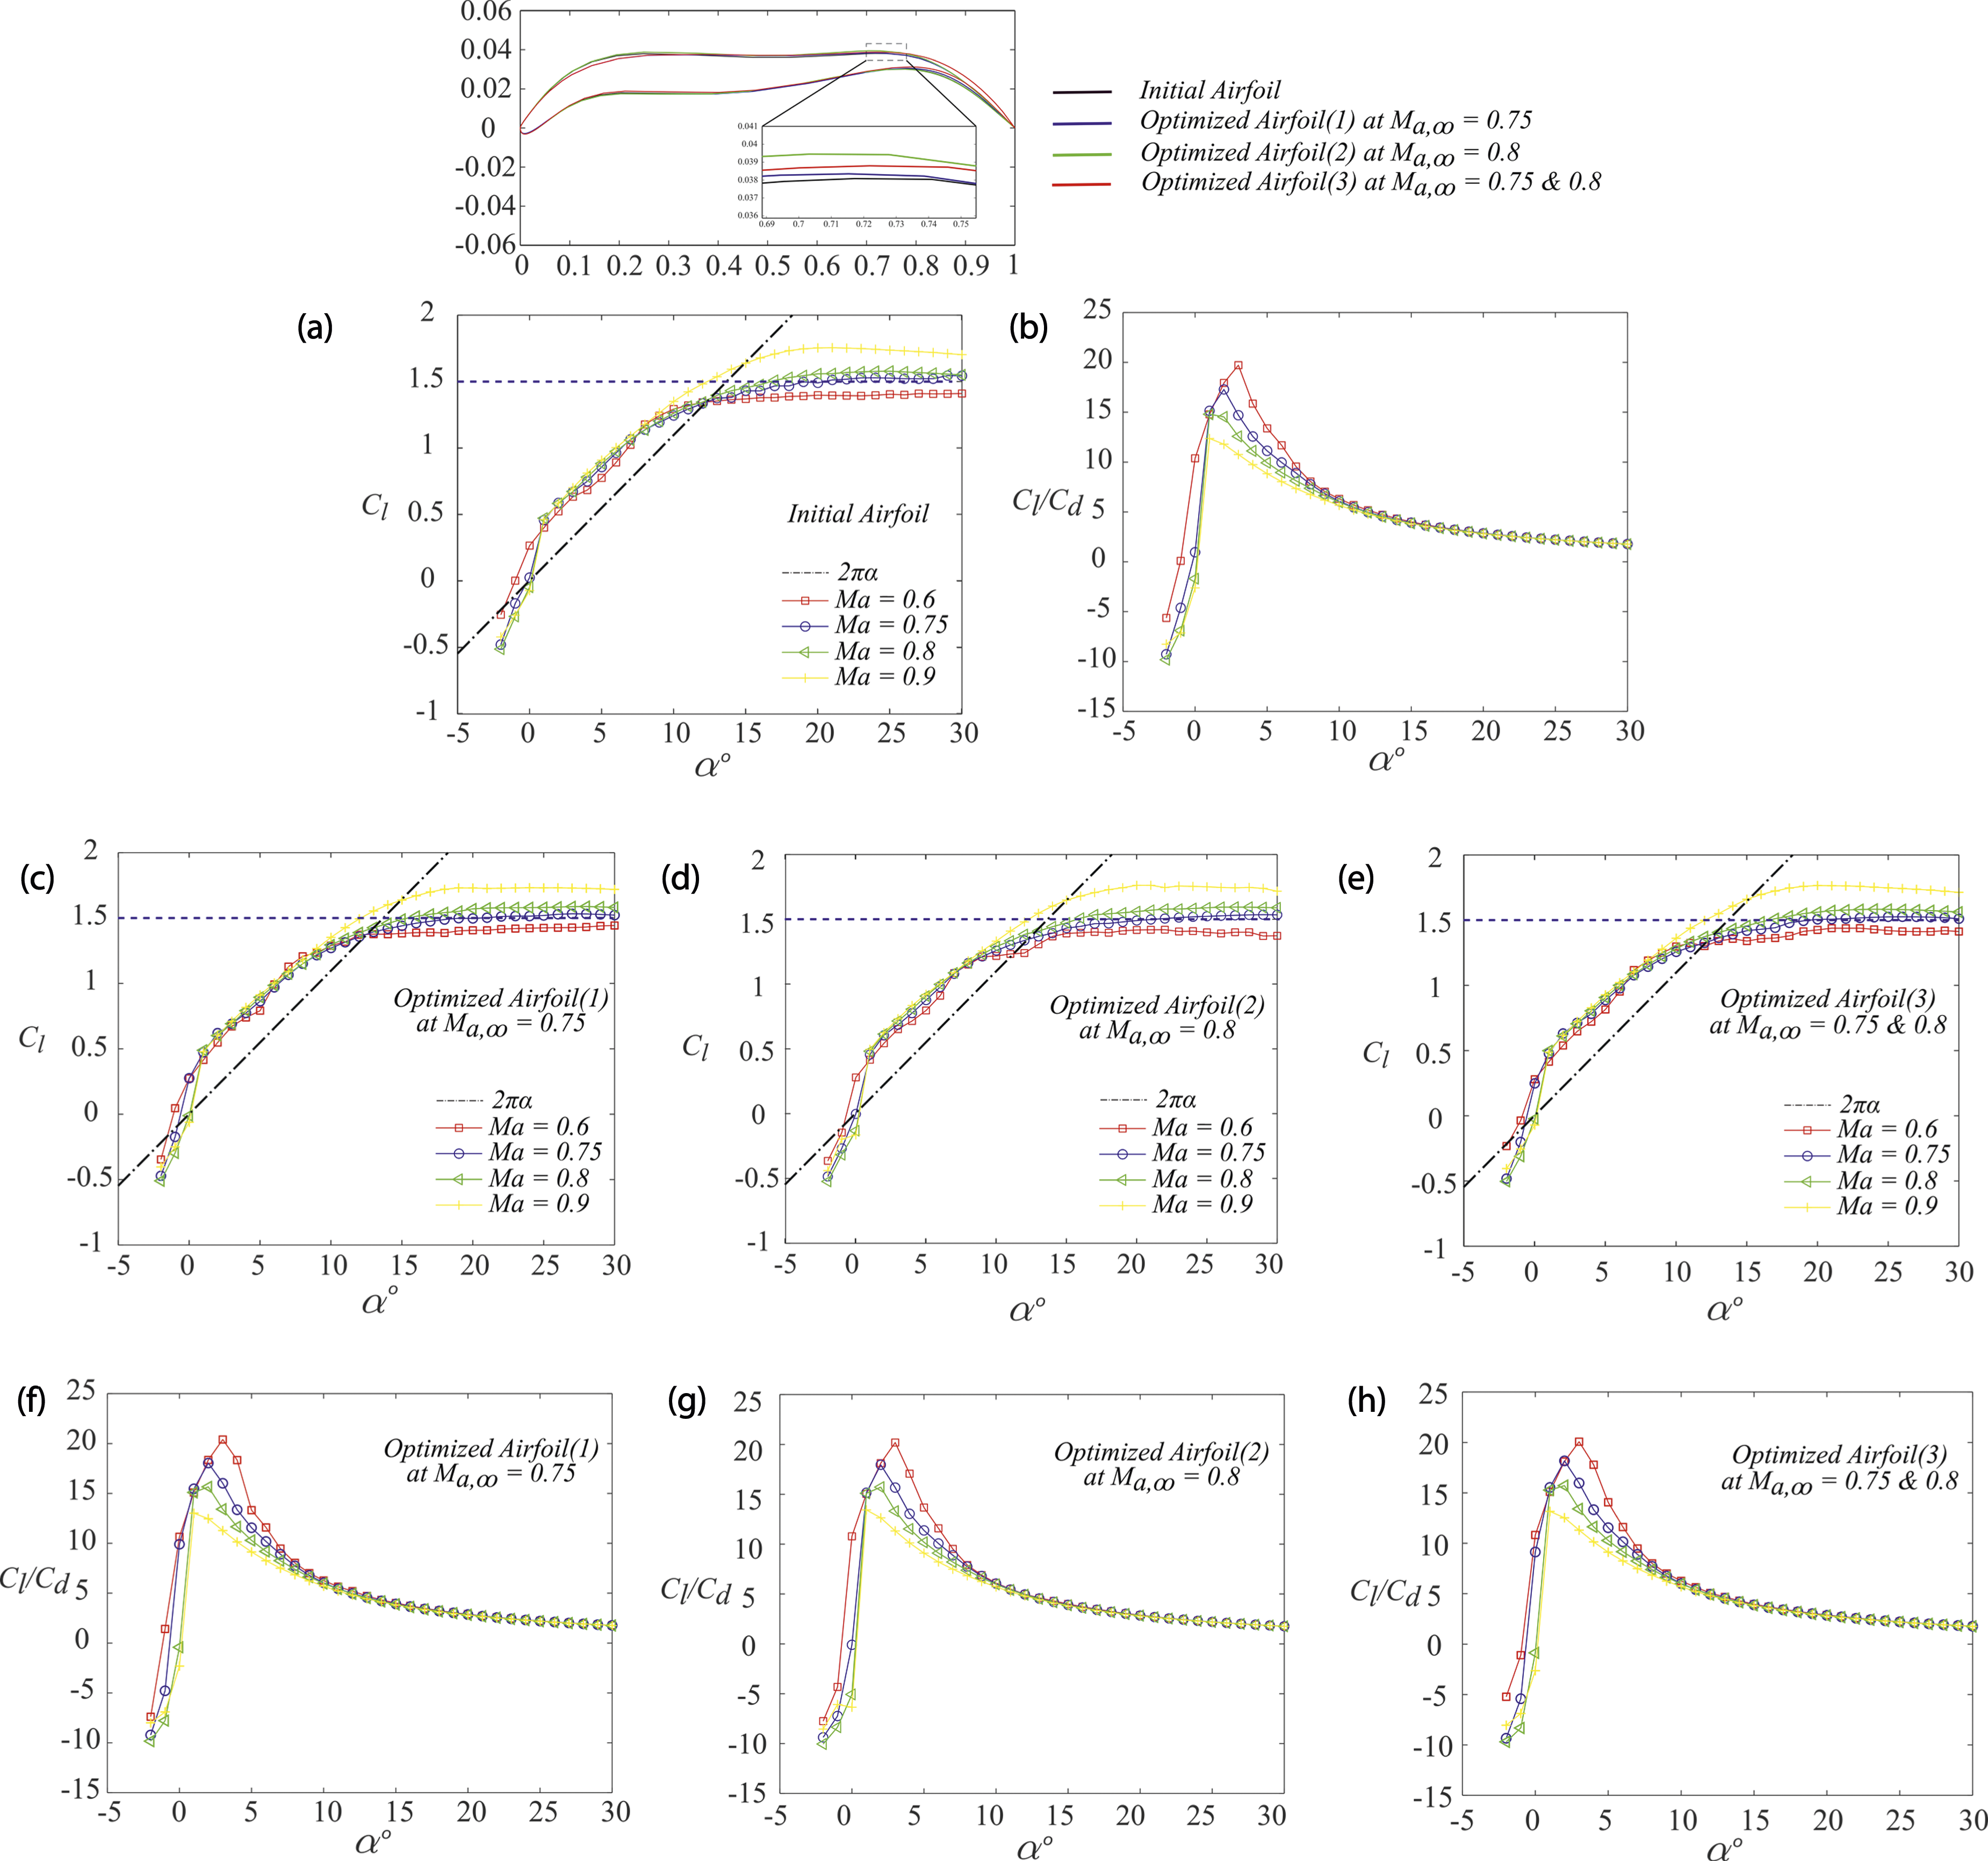
Figure 12 through (a) to (h) shows the effect of the Mach number on the lift and lift-to-drag ratio characteristics of NACA and UT airfoils for a fixed Reynolds number. In regards to lift, it can be pointed out that the Mach number has a significant influence at
Figures 12 and 13 (b, and f to h) show the effect of the Mach number on each airfoil (2% t/c UltraThin, and 4% NACA airfoils) separately in terms of the lift-to-drag ratio (
To provide insight into the mechanisms responsible for the trends in the lift and the lift-to-drag ratio, as shown previous, Figure 14 displays shock wave evolution associated with changes in angles of attack, which were obtained for Mach numbers 0.6, 0.75, 0.8, 0.85, and 0.9 at Reynolds number 17,000. At low incidence Mach contours for optimized airfoil at Time-averaged pressure distribution for optimized airfoil at 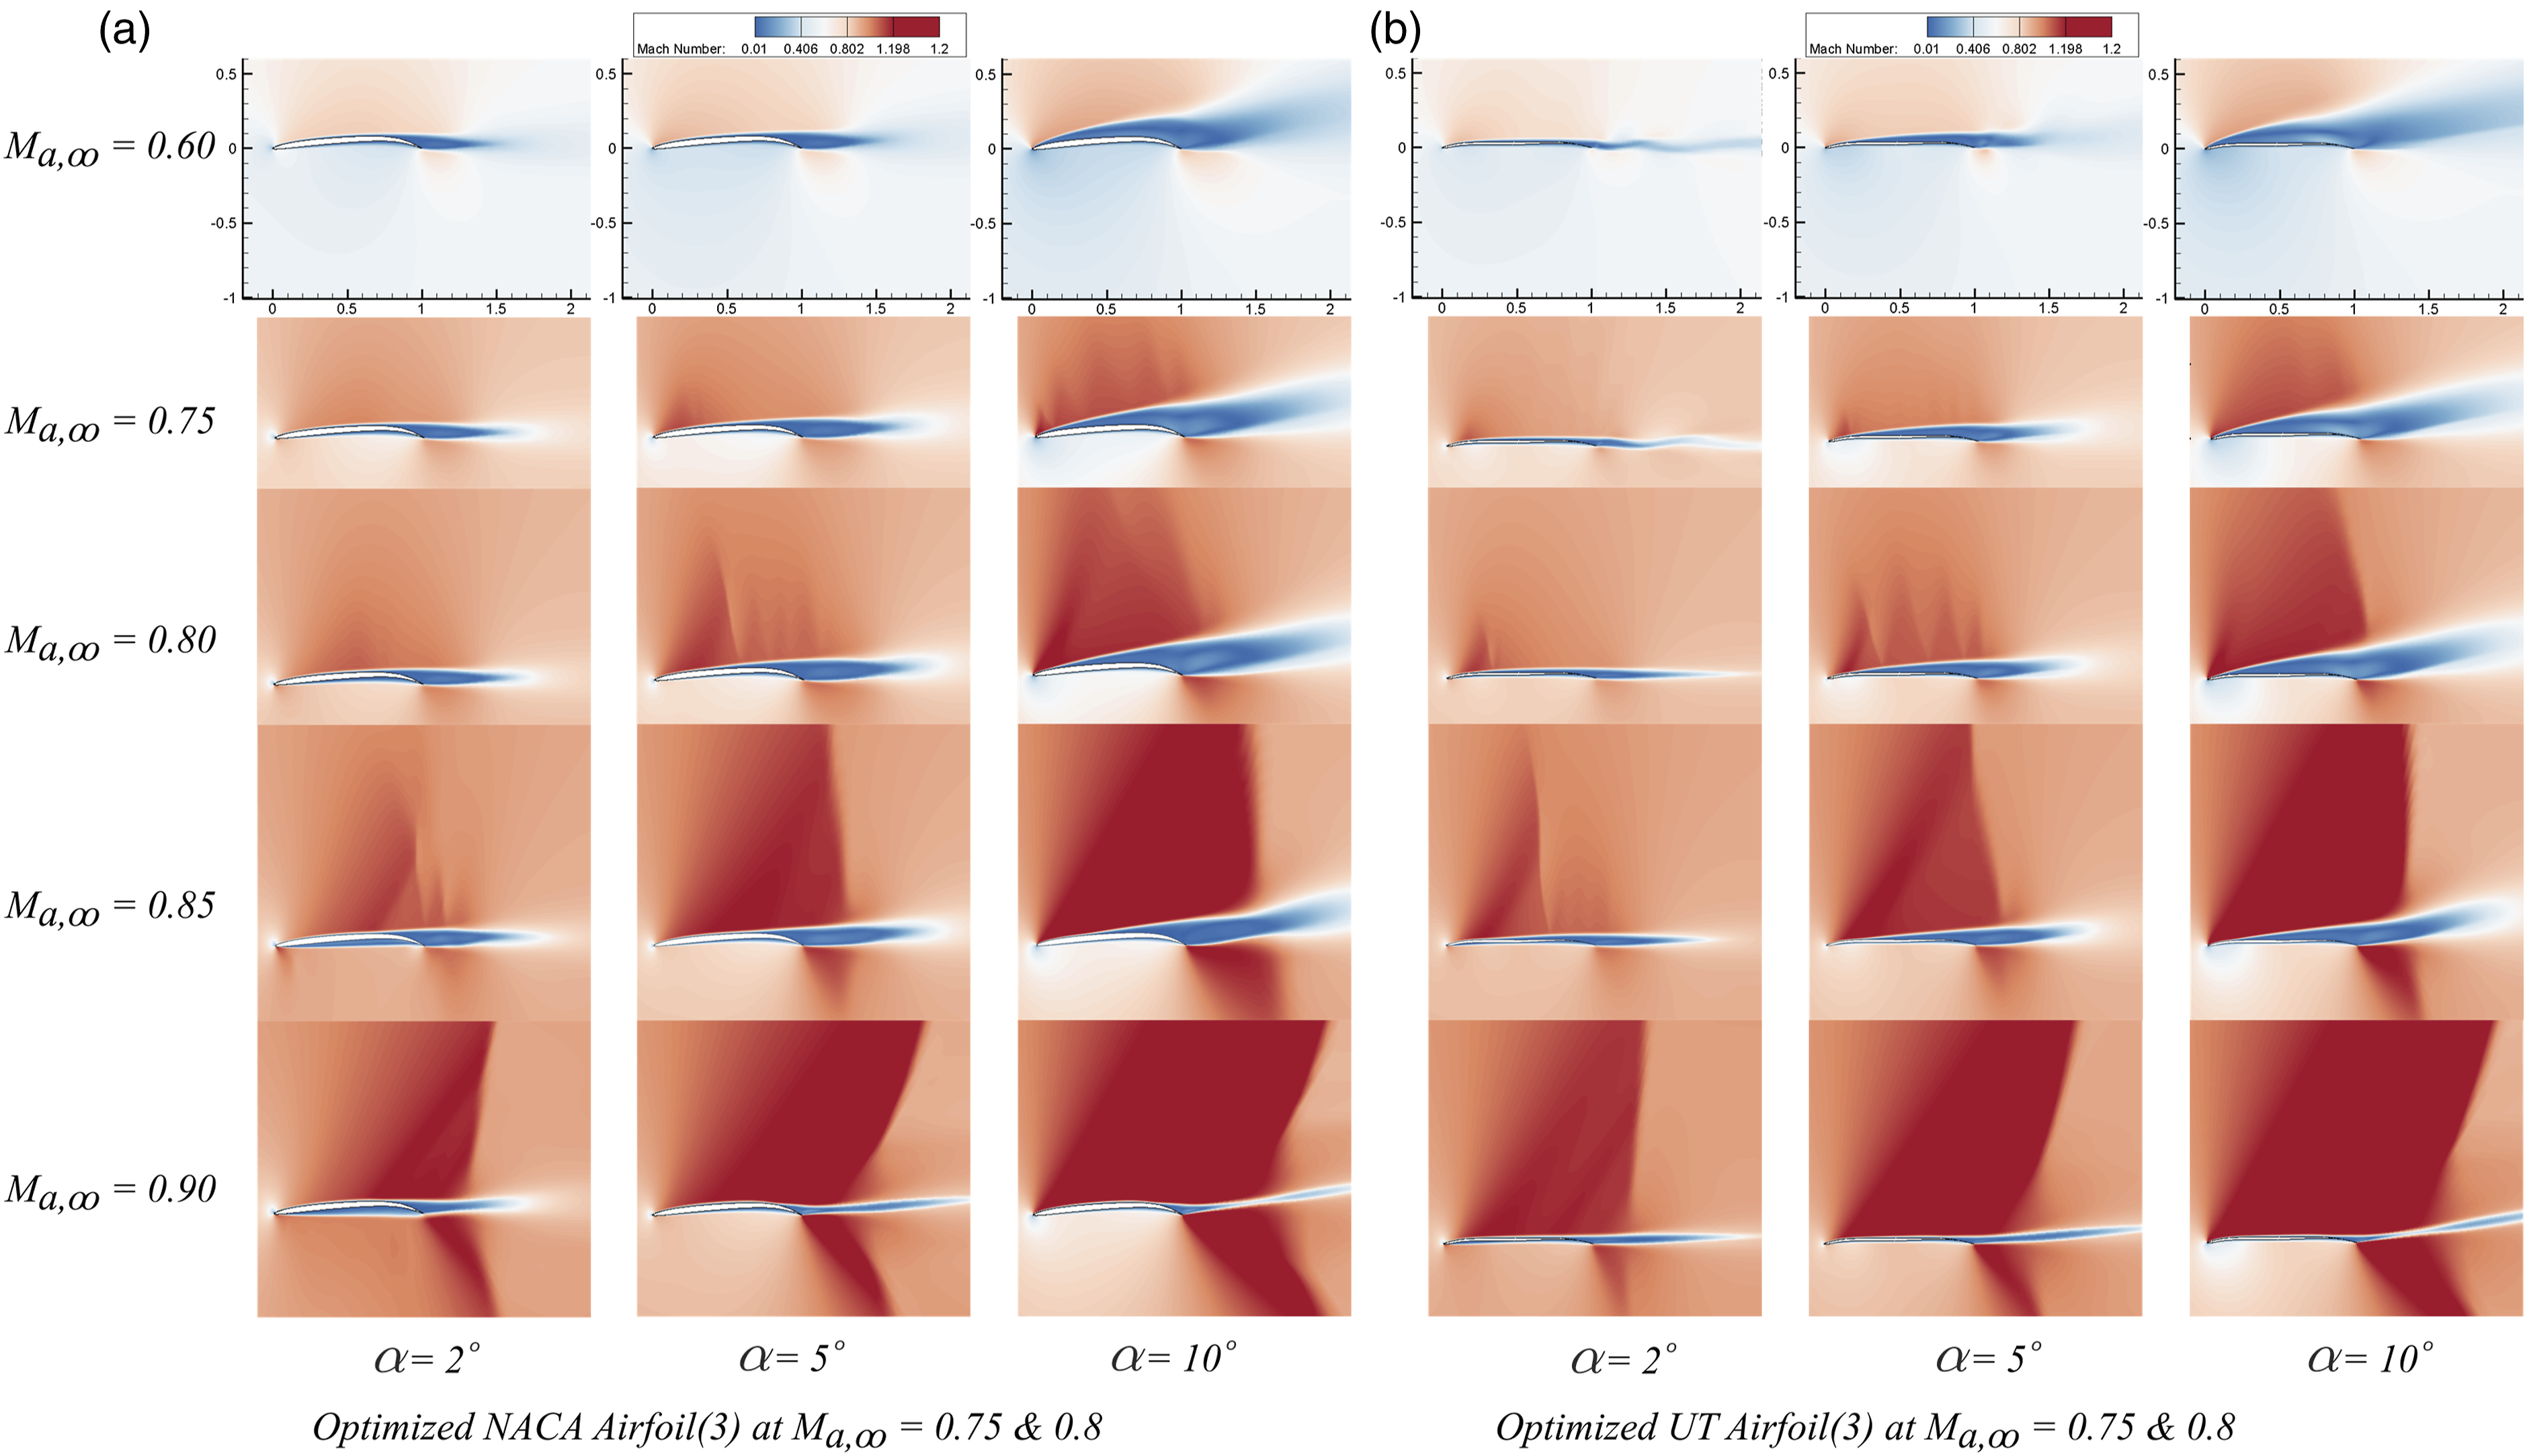
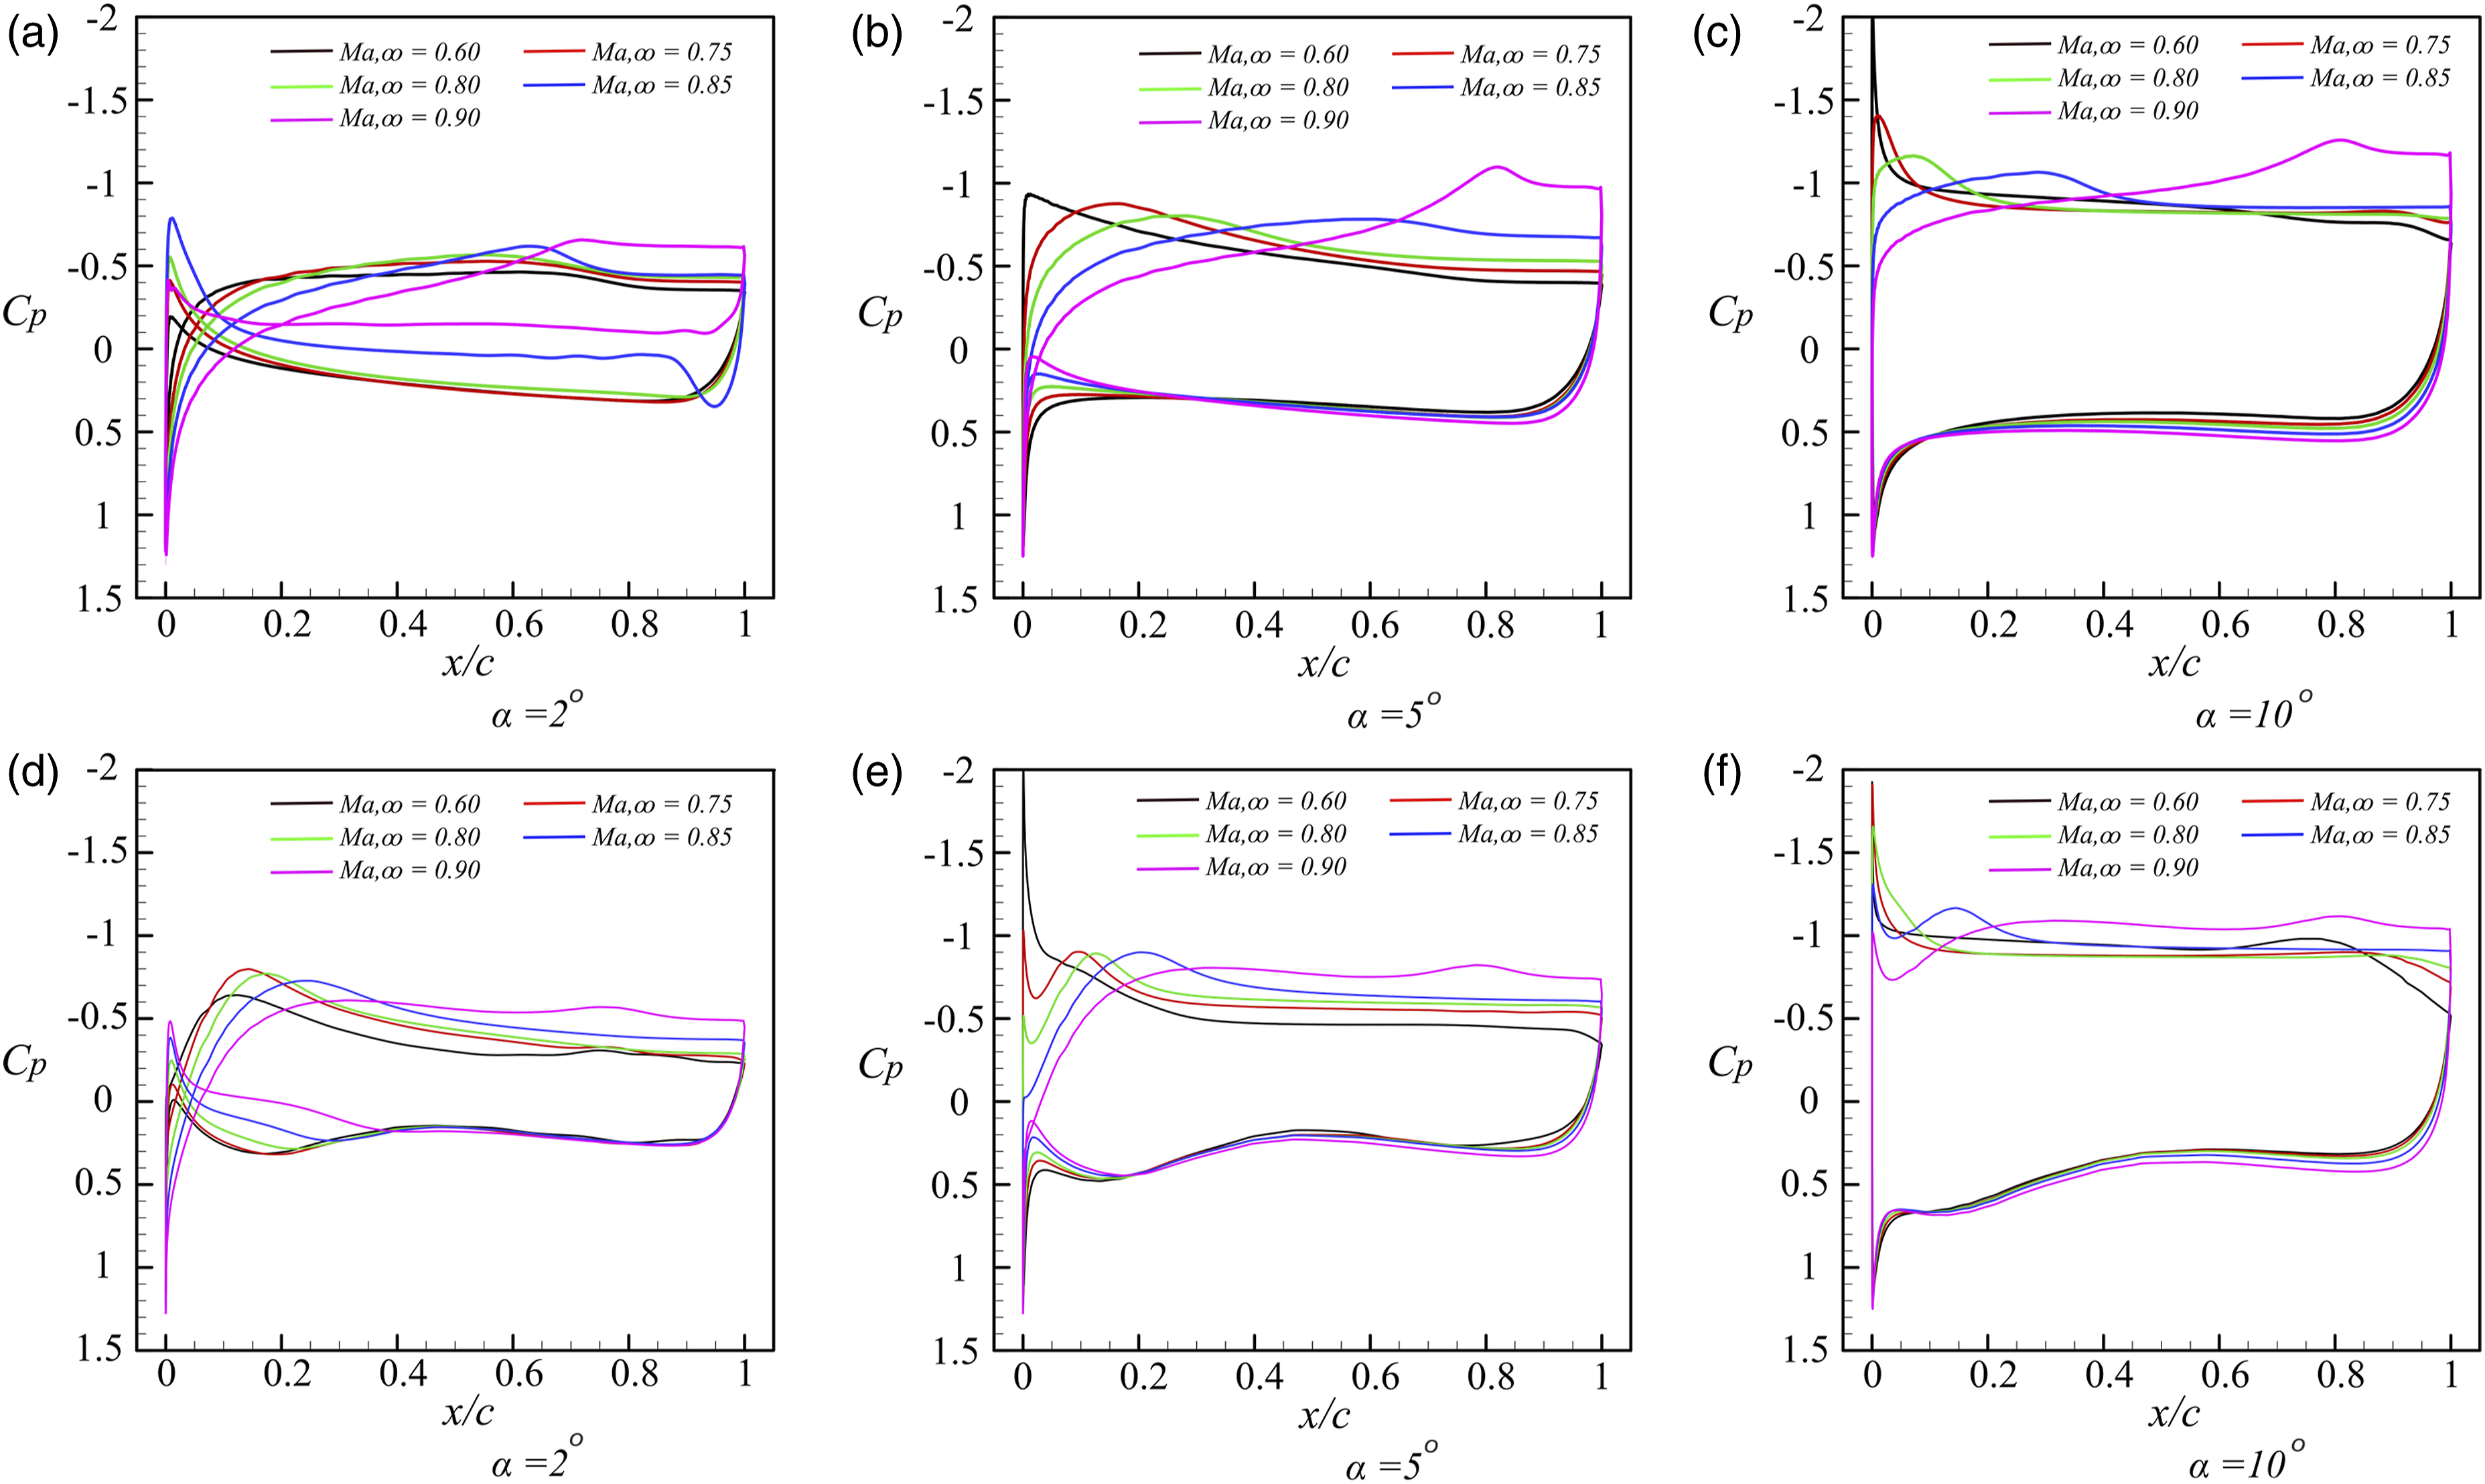
By contrast, in Figure 15(d), the UT airfoil shows a pressure suction peak followed by an adverse pressure gradient, and the associated suction peak location moves rearwards as the Mack number increases. In addition, trailing-edge separation, x/c = 0.872, is observed on the upper surface of the UT airfoil at
At moderate angles of attack
When the airfoil rises at
Conclusion and outlook
A Reynolds-averaged Navier–Stokes solution implemented with the κ-ω SST γ-Reθ turbulence-transition model approach was applied to the study of transitional flows on transonic low-Reynolds number airfoils in the Martina atmosphere. First, a genetic algorithm based on Bezier curve parameterization combined with single-/multi-point objective function formulations was conducted to investigate the drag reduction characteristics. In addition, the current work also revealed a distinct flow characteristic: shock wave patterns vary above the flow separation region on the upper surface of airfoils as the Mach number and angles of attack increase. Finally, compared to the NACA airfoil, the UltraThin airfoil forms a shock wave near the leading edge. The shock movements will bring local but very severe changes in loading, hence bring important significance in the contra-rotating propeller design. The following specific conclusions were drawn from this study: 1) Based on the drag divergence Mach number results of NACA (4% thickness) and UltraThin airfoil (2% thickness), the single-/multi-point optimized airfoil shows some Mach number dependency. The corresponding 2) For the performance at off-design, the Mach number shows a negligible effect on the lift coefficient at moderate incidences. On the other hand, the lift-to-drag ratio significantly reduces as Mach number increases, indicating an increase in the drag coefficient. Besides this, the lift-curve slope is nearly linear at moderate angles of attack for NACA and UltraThin airfoils, that is, 3) The Mach number shows a significant impact on the flow past airfoils, including of flow separation, trailing-edge wake patterns, and shock wave types. A stretched trailing-edge separation pattern is clearly observed from both NACA and UltraThin airfoils, which indicates the suppression of compressible flow on early separated shear layer roll-up motion, hence resulted in a smoother 4) The noticeable differences between NACA (conventional design) and UltraThin airfoil (unconventional design) are shown as following: a) At
Footnotes
Declaration of Conflicting Interests
The author(s) declared no potential conflicts of interest with respect to the research, authorship, and/or publication of this article.
Funding
The author(s) disclosed receipt of the following financial support for the research, authorship, and/or publication of this article: The present work is supported by the National Natural Science Foundation of China under Grant No. 12002161, 12032011, and the Key Laboratory of Aircraft Environment Control and Life Support (Grant. No. KLAECLS-E-202205).