
Abstract
This paper presents the finite element modelling (FEM) strategy to identify the structural response of aircraft tyres under quasi-static and taxiing load conditions. The tyre FEM was developed to simulate the aircraft tyre/ground interaction for a range of inflation pressures under vertical, lateral, longitudinal, torsional, yawed and un-yawed rolling. A thorough comparison for validation purposes is made between the test and simulation data extracted from the FEM. The reinforcement plies of the tyres are modelled in a computationally efficient manner whilst also considering the variable fibre volume fractions and ply discontinuities within the tyre. The accurate material characterisation at coupon level combined with the overall modelling approach allowed most simulated responses to match the experimental stiffness within 12% against best fit curves of similar tyre types and within 5% for the majority of test comparisons.
Keywords
Introduction
Airplane ground mobility is facilitated by the aircraft tyres that also contribute to reduce the deceleration pulse during landing and improve comfort by absorbing the roughness undulations of the runway. Tyres crucially contribute to the safety and reliability of an aircraft and are one of the common causes of fatal accidents. 1 Owing to the key role tyres play in aircraft, several numerical and analytical approaches have been proposed both for their structural optimisation and performance improvement.
The internal structure of an aircraft tyre is very complex compared to that of cars or other road vehicles. It is composed by several layers with different materials (commonly nylon and polyester) and filament orientations. The orientation of material layers used in the crown (beneath the tread) or the sidewall varies through the thickness to provide the stiffness and strength required for the different type of interactions with the ground. The tuning of the tyre performance is also achieved using varying proportions of natural/butadiene rubbers and carbon black in the tread and sidewall. 2 The design requirements result in a complex internal structure optimised through several iterations using finite element analysis (FEA) to reduce costly development and testing.
Predicting the quasi-static and dynamic response of tyres with FEA is a complex task involving non-linear, anisotropic and incompressible materials, large displacement and large strain and variable contact conditions between the tyre and ground. 3 The behaviour of tyres in contact with various ground interfaces (dry, wet, sand, dirt, snow) has been studied for automotive vehicle tyres,4–8 truck tyres9–15 and off-road tyres.16,17 NASA, specifically, has also carried out extensive testing and parameterisation of aircraft tyres. 18
One of the first attempts to model tyre responses with FEA was conducted by Kilner to study the vertical ground interaction and the drag load. 19 The numerical strategy adopted in the 90s by Michelin to model the response of radial tyres was described by Anson et al. 20 including the rim contact distribution. More recent studies include a detailed FE model implemented by Yao et al. 21 to study the dynamic response of aircraft tyres and the SPH-FEM coupled model proposed by Zhang et al. 22 and implemented in LS-DYNA to study the tyre spray produced by aircraft running on wet runways. Several other studies have been published on the simulation of rolling resistance, 23 cornering, 24 burst 25 and off-road tyres 26 for automotive applications.
The FEA approaches mostly reported in literature include composite layup16,17,21,27 and rebar element7,28–30 methods. Composite layup is usually used to model the plies as layers of a composite laminate defining material, direction and thickness through integration points for each layer. Each layer corresponds to one reinforcement ply that is wrapped on the mould during the manufacturing process. Rebar elements are used to define 1D elements embedded in the solid or shell elements representing the rubber. There are also other more recent approaches where each ply is modelled with shell elements and the reinforcement is defined as rebar embedded in the shell element and accounted for in the definition of the stiffness matrix of the element. This second method is less common and does not allow visualisation of the rebar elements and rebar results. The tyre rubber has complex mechanical behaviour with large deformations, viscoelasticity and stress softening which is very difficult to capture with numerical modelling. In most applications, the Mooney–Rivlin constitutive equation is the most common formulation together with Yeoh and Prony series to capture viscoelasticity.
Although numerical models of various types of tyres have been implemented, limited information is available regarding FE models that can capture the structural response under a variety of loading conditions including static and dynamic in a computationally efficient manner. This paper presents the modelling strategy implemented in LS-DYNA to simulate the response of three different sizes of aircraft tyres under quasi-static and dynamic loading using the same FE model. The results for the three tyres, namely, Dunlop 24x7.7R10 (rated pressure [PR] 165 psi), Dunlop H38x13R18 (PR: 172 psi) and Michelin 1400x530R23 (PR: 263 psi) are validated with experimental tests or the expected behaviour according to the NACA-TR-64 trends. 18 The work is presenting for the first time a numerical approach that can be used to simulate a variety of loading conditions using the same tyre modelling strategy obtaining results very close to the experimental measurements.
Modelling strategy
This section describes the key steps in the implementation of the modelling strategy for tyres. The description of the modelling approach covers material characterisation, mesh generation and contact definitions. The boundary conditions, airbag functions adopted to model inflation and the kinematic joints to apply static and dynamic loading are also explained. The work carried out on the numerical modelling of the aircraft tyres includes commercially sensitive information that is not fully disclosed. However, this paper focuses on the methodology adopted and related validation which is not affected by the actual numerical values of the material constants or the static and dynamic response of the tyre. All FE simulations were performed on LS-DYNA using a single node with twin Intel E5-2620 (Broadwell) CPUs providing 16 parallel processing cores for static analysis and two nodes providing 32 parallel processing cores for dynamic cases on a high-performance cluster with 128 GB of shared available group memory per node.
Fabric reinforcement material
The reinforcement fabrics tested in accordance with ASTM D885-06 used within the tyres investigated are coded as F5, F7, F11, F22 and F36 (Figure 1) owing to their commercial sensitivity. The differences in low (strain between 0 and 0.08) to high strain modulus (strain between 0.16 and 0.24) are important as the median stress–strain range (strain between 0.08 and 0.16) is used to work out the orthotropic equivalent properties of the tyre plies. Uniaxial tensile test data for tyre reinforcement fabrics.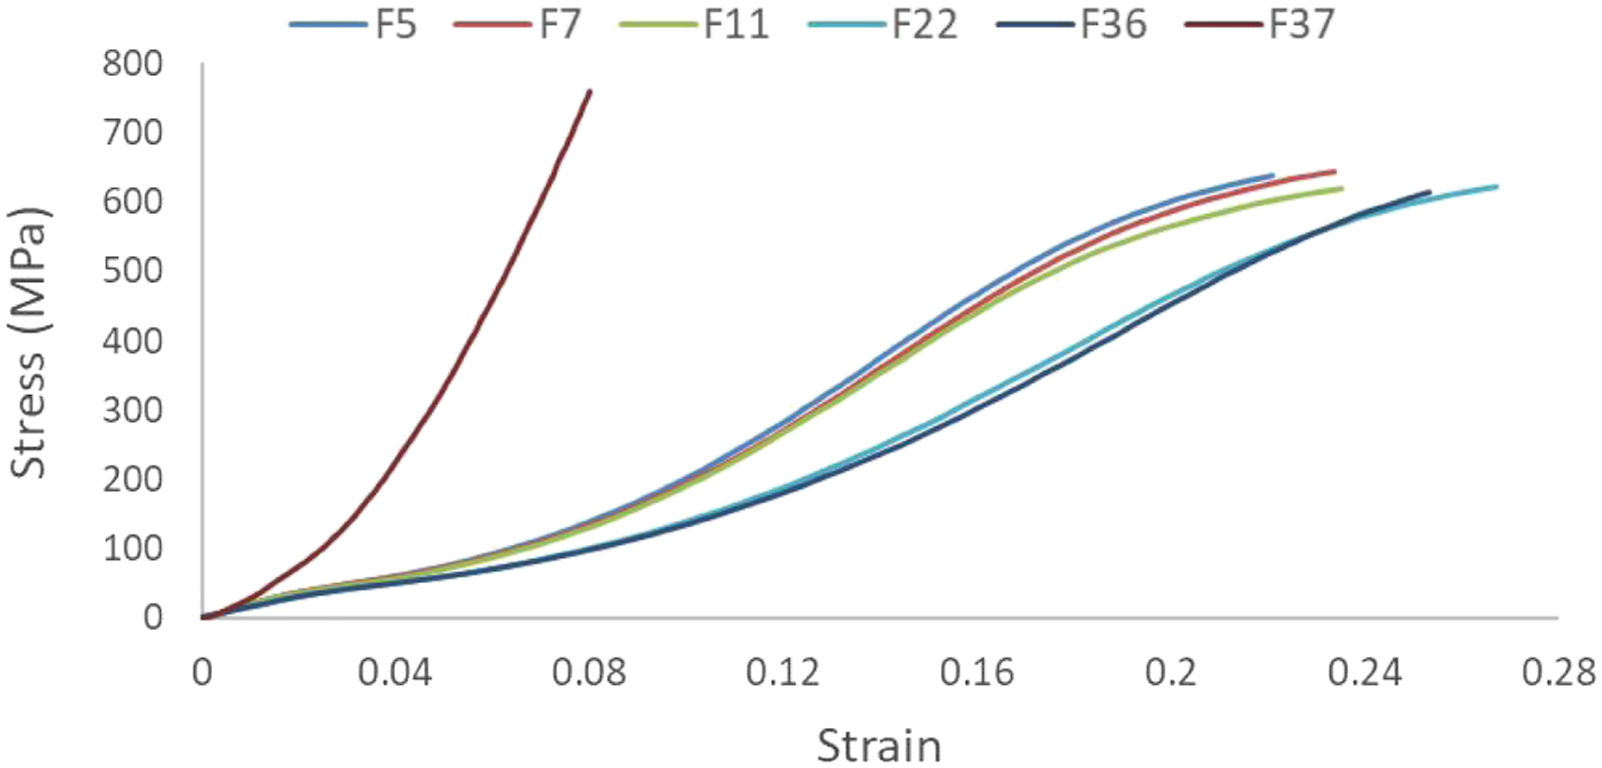
Rubber material model
The characterisation of the tyre rubbers named R1, R5, R12, R18 and R29 has been investigated using uniaxial tensile and compression tests (Figure 2) on coupons extracted from the production tyres after vulcanisation in accordance with BS-ISO 37 2017. In this way, the effect of the manufacturing process was accurately accounted for. It is important to capture the stress–strain behaviours during compressive and tensile loading as the tyre endures a combination of these conditions throughout various regions under both quasi-static and dynamic loading. Uniaxial tensile and compression test data for tyre rubber compounds.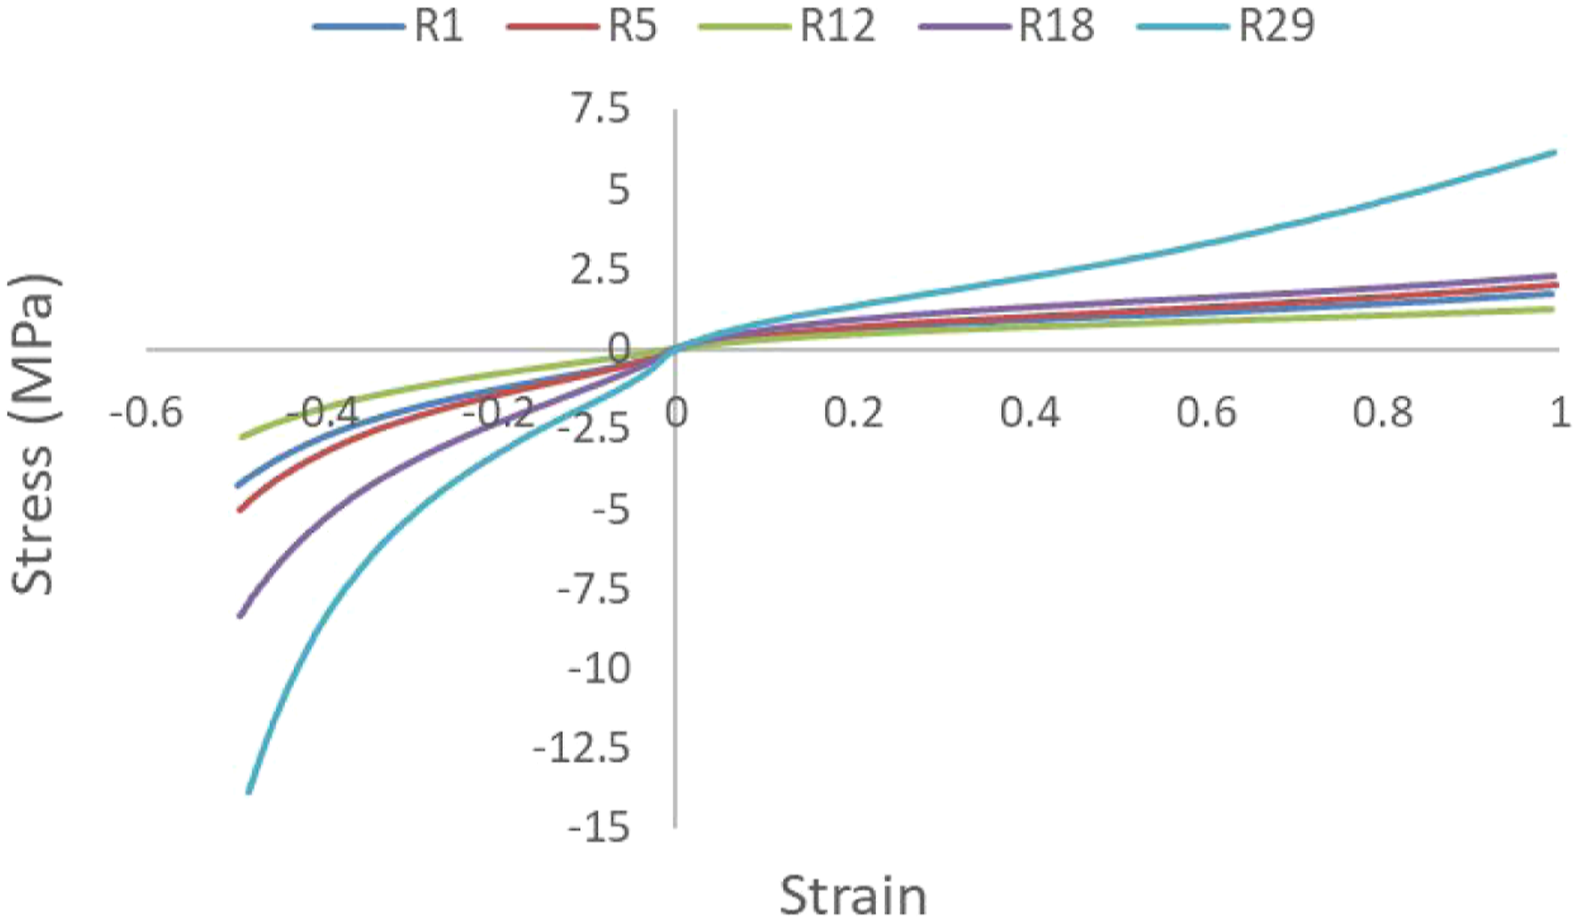
A large strain modelling approach is required for rubber which has a high extensibility rating allowing it to stretch or distort without breaking or tearing.31,32 The incompressible polynomial constitutive Mooney–Rivlin model is commonly used in tyre modelling studies.1,4 It is well established that in pure stress states such as uniaxial, biaxial and planar tension, the stress can be correlated by stretch ratios. A hyperelastic model is often used to model tyre rubber, 33 and the behaviour of vulcanised rubbers should consider viscoelastic effects in the time domain to account for the internal damping and heat generation when these effects are to be considered.34,35 This work focuses on tyres used under runway taxi conditions with large deformations considered in the high vertical load and low inflation pressure cases, respectively. Transient responses, high-speed landing and heat generation are not considered in this work owing to the overall parameterisation scope being restricted to taxi conditions.
For defining the material model and its constants in the current FE models, it is assumed that the rubber compounds are hyperelastic whilst the equivalent orthotropic material properties of the plies are identified with the rubber assumed as linear elastic having the moduli derived in the median stress–strain range shown in Figure 1. The scope of the model described in this work allows the assumption of hyperelastic behaviour with curve fitting of stress–strain test data (Figure 2) at different strain rates having been performed.
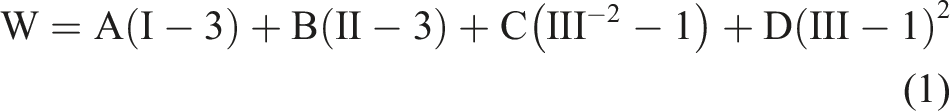
The Mooney Rivlin (MR) constitutive equation is characterised by the strain energy density function shown in equation (1):
v = Poisson’s ratio 2(A+B) = shear modulus of linear elasticity I, II, III = invariants of the right Cauchy–Green tensor C.
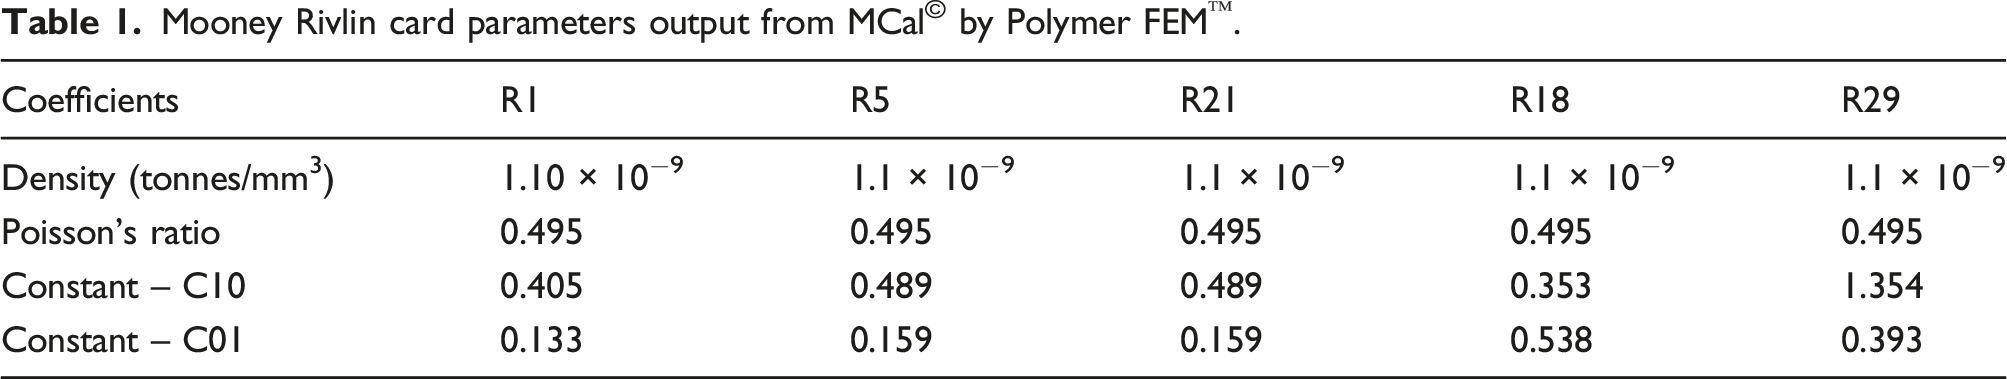
Mooney Rivlin card parameters output from MCal© by Polymer FEM™.
Orthotropic equivalent composites
To model the tyre’s ply reinforcements, the fabric and rubber properties are used in conjunction with classical laminate theory (CLT) and the rule of mixtures for calculating the orthotropic equivalent properties based on the orientation of the reinforcements. The internal structure of the tyre and the equivalent properties are commercially sensitive; however, the modelling approach is not dependent on this data.
The fibre volume fractions (
Using CLT,
37
the extensional [A], coupling [B] and bending stiffness [D] of the reinforced rubber are calculated for the individual regions of the tyre, being specific to the tyre construction. The plies in the crown and sidewall are modelled as shell layers and grouped together where applicable according to their through-thickness location. For the sidewall, the reinforcement carcass shells are segregated into regions (5a–5g in Figure 3) to capture the variation in FEM segmentation into tyre components with variable Vf sidewall.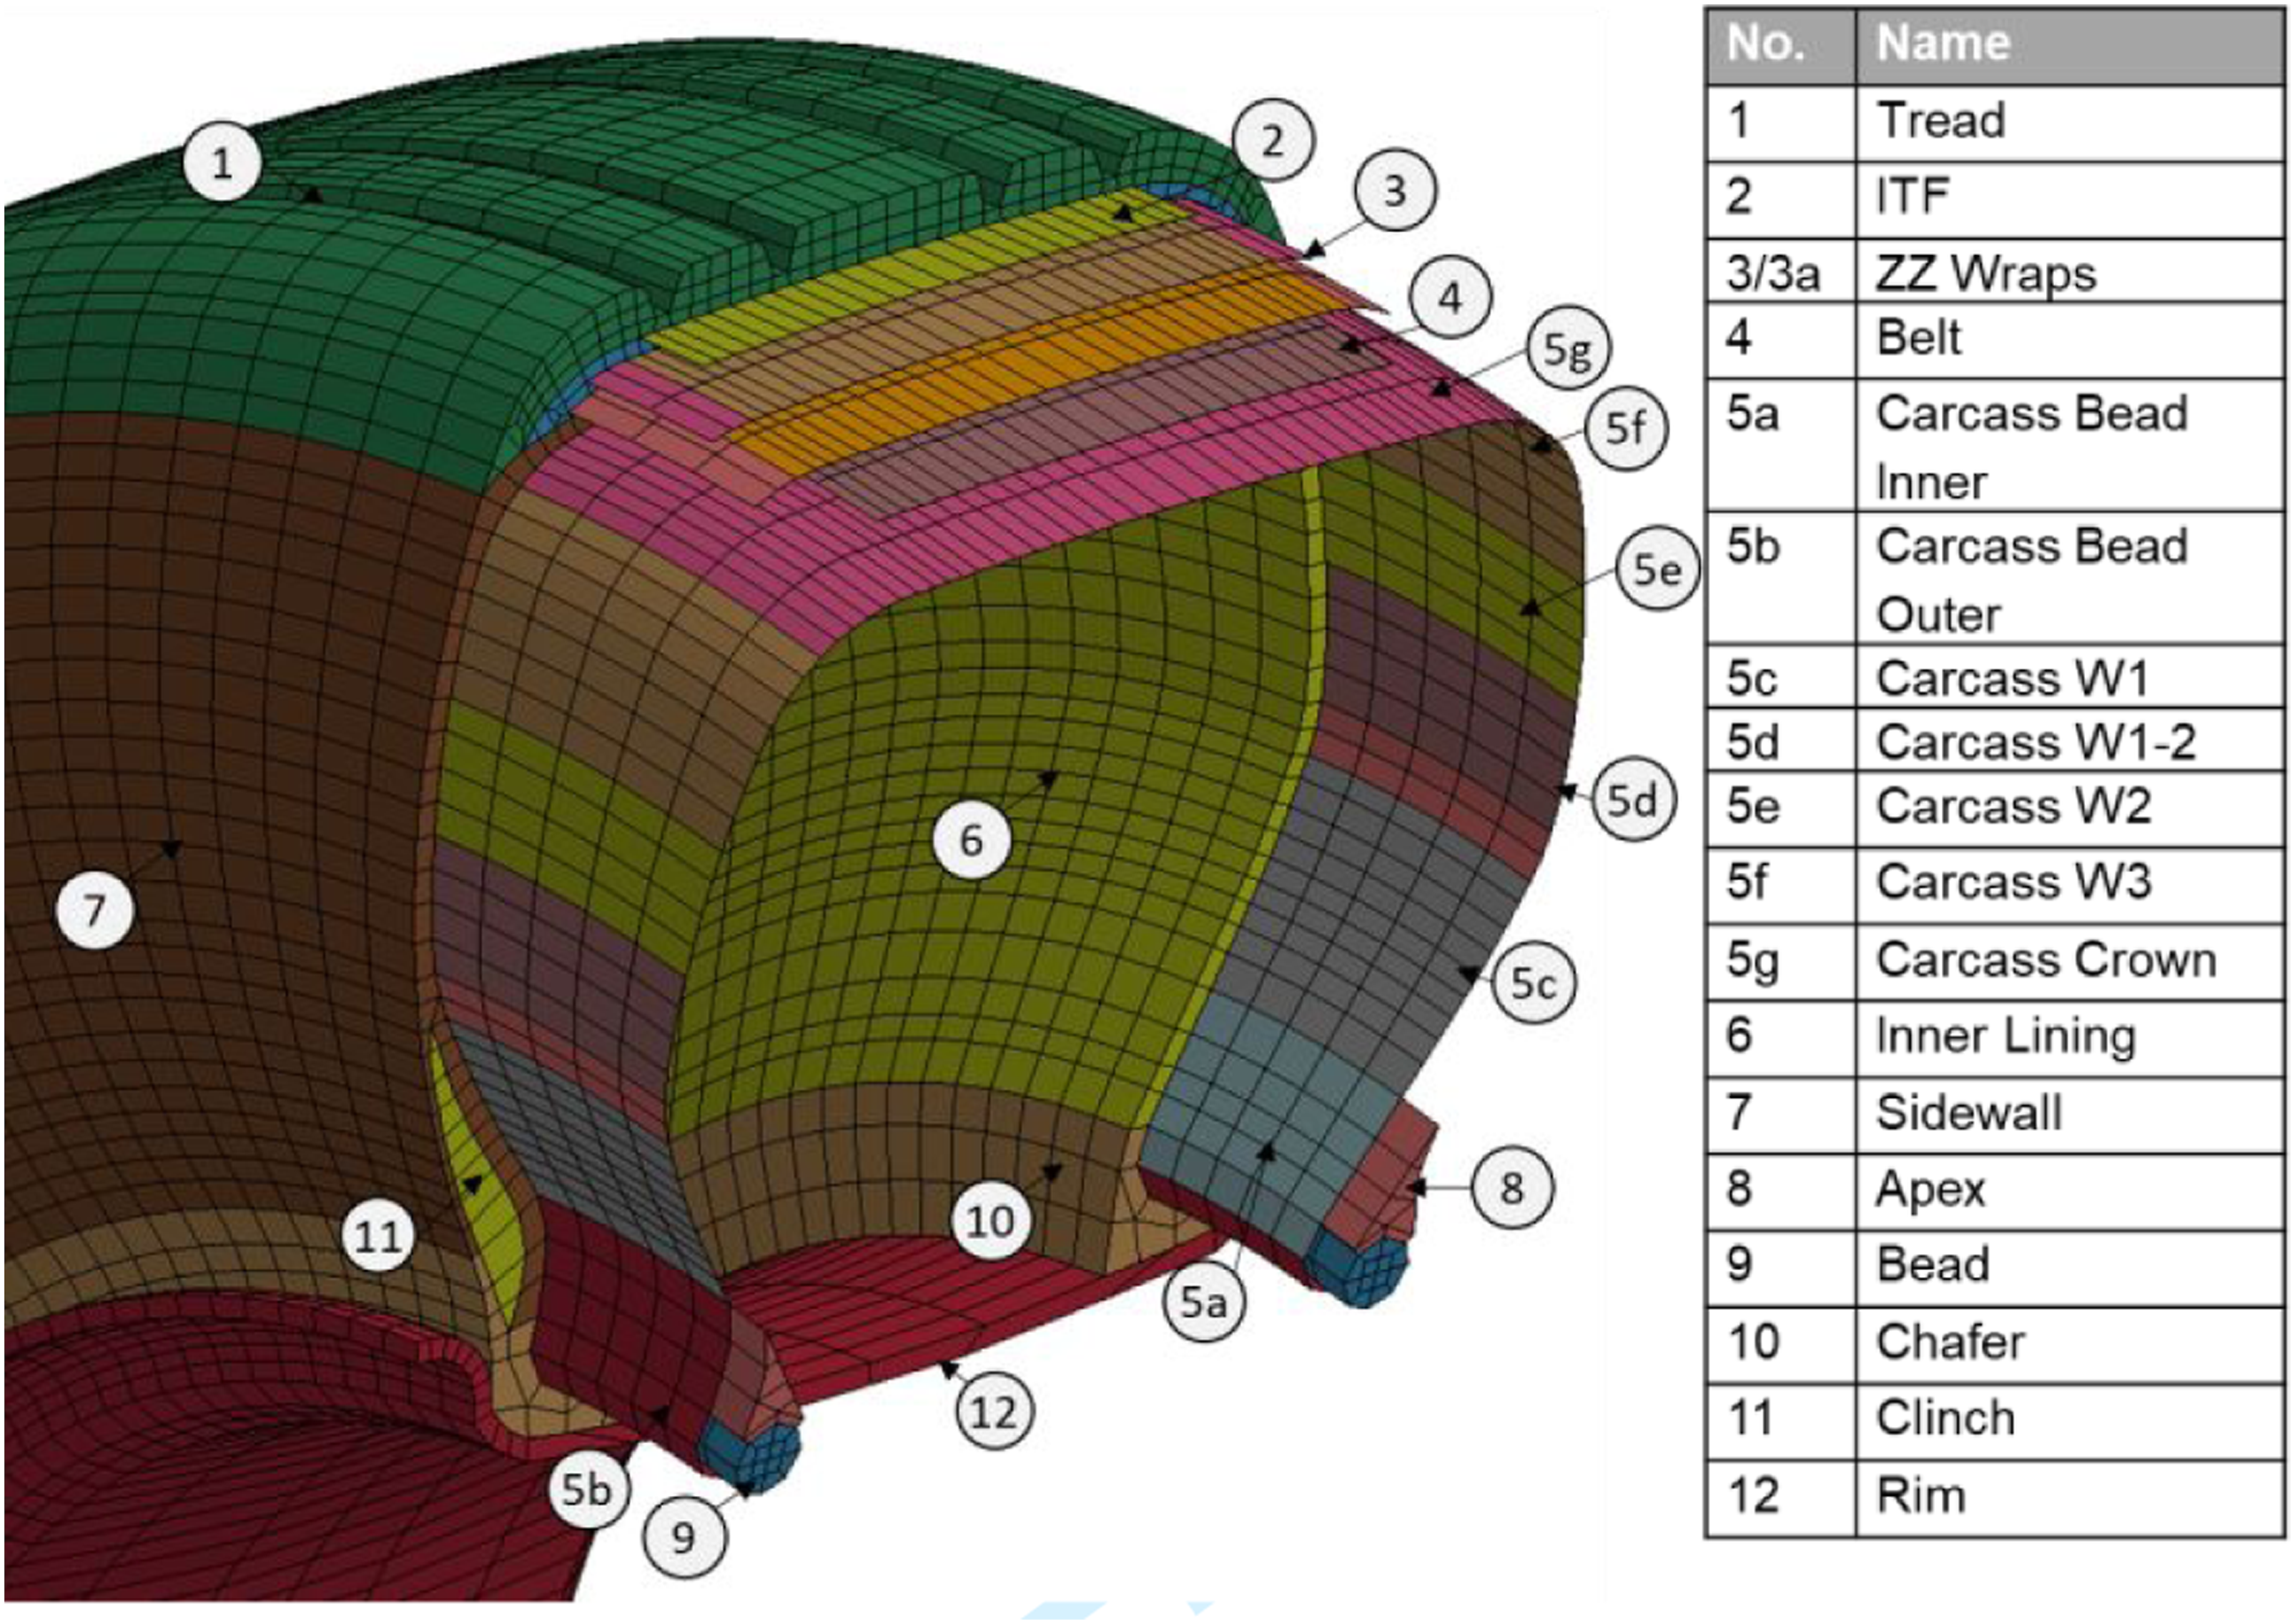
Tyre model discretisation
The tyre discretisation was generated in LS-PREPOST as a combination of shell and solid elements by revolving an axisymmetric cross-section of the tyre concentric to the rolling axis. The common nodes between the shell elements representing the embedded plies and the solid elements representing the rubber compounds are merged to ensure structural continuity. The model includes crown and sidewall plies, the solid rubber surrounding the plies, the metallic bead modelled as a homogeneous linear elastic steel ring and the rim as rigid. The metallic rim only includes the portion in contact with the tyre and the internal surface required to define the enclosed volume used for initialisation of the inflation pressure. A smooth surface-to-surface contact is defined between the rim and the tyre with a static friction coefficient of 0.8 to avoid over-constraining of the sidewall.
The models generated for the three types of tyres contain a total of circa 48,000 elements for Dunlop 24x7.7R10, circa 132,000 elements for Dunlop H38x13R18 and circa 340,000 elements for the Michelin 1400x530R23 (Figure 3).
The contact definition is challenging due to the variability of the contact surfaces during the load application. The chafer and rim (Parts 10 and 12 in Figure 3) define the boundaries of the internal volume used for the inflation initialisation, and the tyre–rim interaction is dictating the constrain level of the tyre under all the loading conditions. A surface-to-surface contact is used with the automatic search algorithm which makes it better-suited to handle disjointed meshes. Owing to the difference in the material behaviour with the rigid rim and the highly deformable tyre, the soft = 1 option has been adopted to reduce penetration without drastically changing the penalty contact formulation. The ground is also assumed as rigid, and the contact friction coefficients have been derived with the loaded tyre test data on tarmac with a resolution of static forces. Following the experience gathered during the full-scale testing of the tyres under investigation, the rim is constrained using a revolute joint that allows the transfer forces while releasing the rotation about the axis of the tyre.
Numerical simulation approach
The solver adopted for the quasi-static and dynamic analysis was explicit, and to remove the unwanted dynamic effects from the rapid inflation and quasi-static loading steps, an overdamped simulation was setup using an artificial global damping.
The simulation was structured in several steps, all starting with initialisation of the inflation pressure. Once the pressure was initialised, the next step was the application of vertical load with which the vertical tyre–ground interaction was characterised and the initial condition for interactions in the other directions was established. The third step changes depending on the direction of the test to be carried out (Figure 4) with the specific setting for each configuration being described as follows. Tyre with loading directions.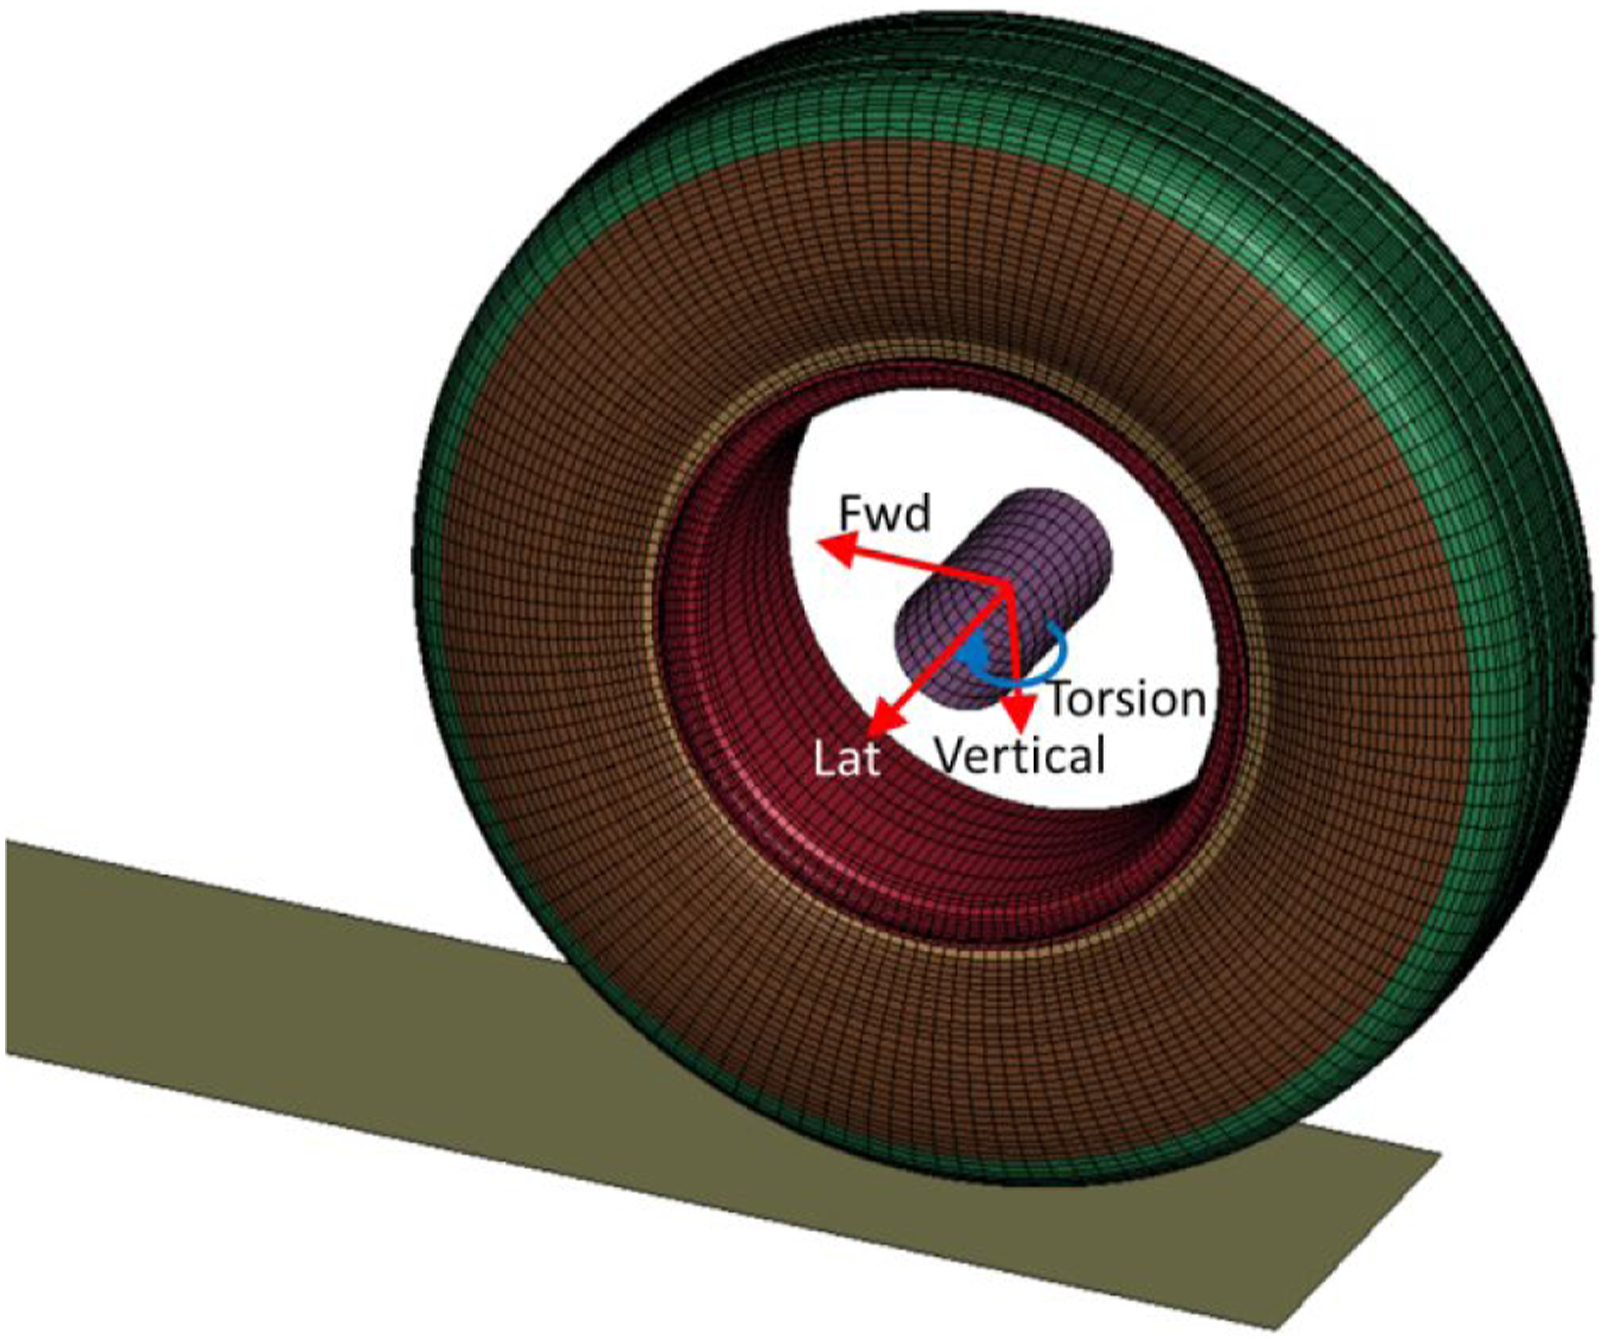
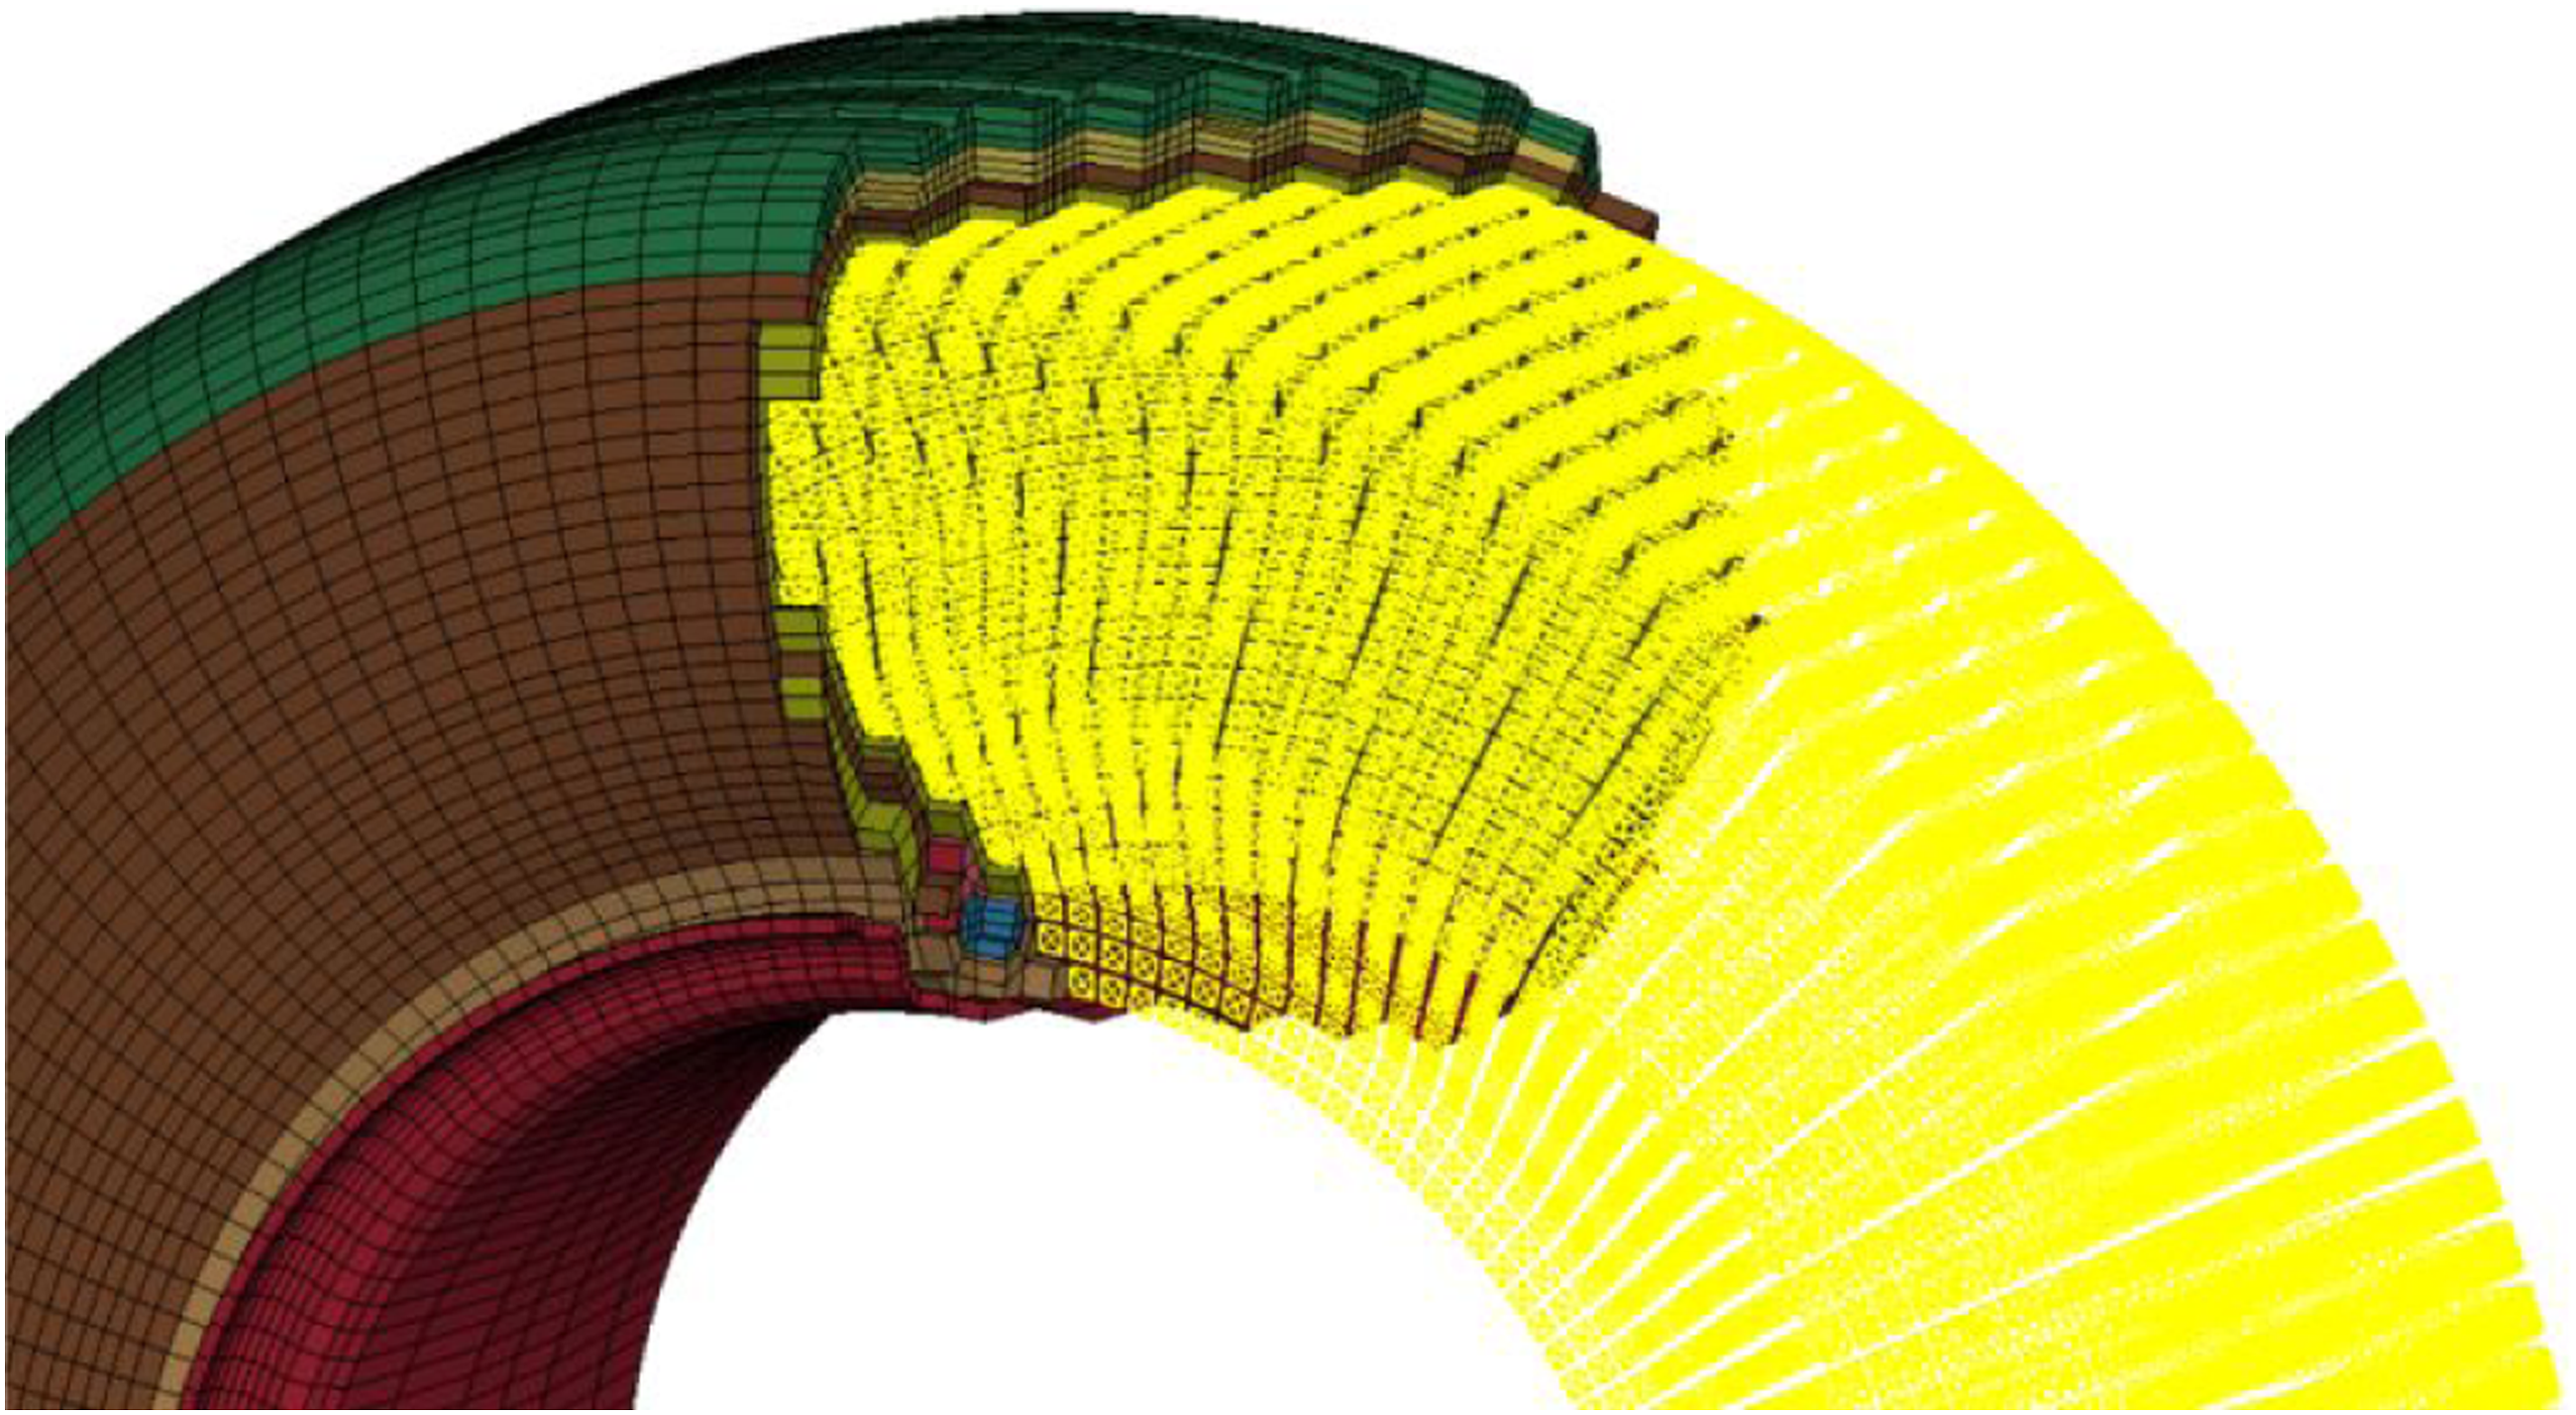
For inflating the tyre, a *SIMPLE_AIRBAG_MODEL has been defined using Set_Segment including the internal tyre surfaces to establish a control volume (Figure 5) to be initialised for the inflation. The equation of state used to determine the pressure in the airbag is Internal segment set defining closed airbag control volume.
A 3-D inflation pressure calibration analysis to correlate the trial mass flow rates to the achieved inflation pressure was implemented using a bespoke Matlab code coupled with LS-DYNA using parallel pool functions for all tyre models to account for the actual stiffness of the tyre. The airbag mass flow rate approach was used instead of setting a constant airbag pressure to capture the effects of pressure rise during loading. The air mass flow rate required to achieve the desired inflation pressure over a fixed time duration of 0.003 s is determined for the Dunlop 24x7.7R10, Dunlop H38x13R18 and Michelin 1400x530R23 tyres in Figure 6. Mass air flow-rate variable for desired inflation pressure ratio (P/PR).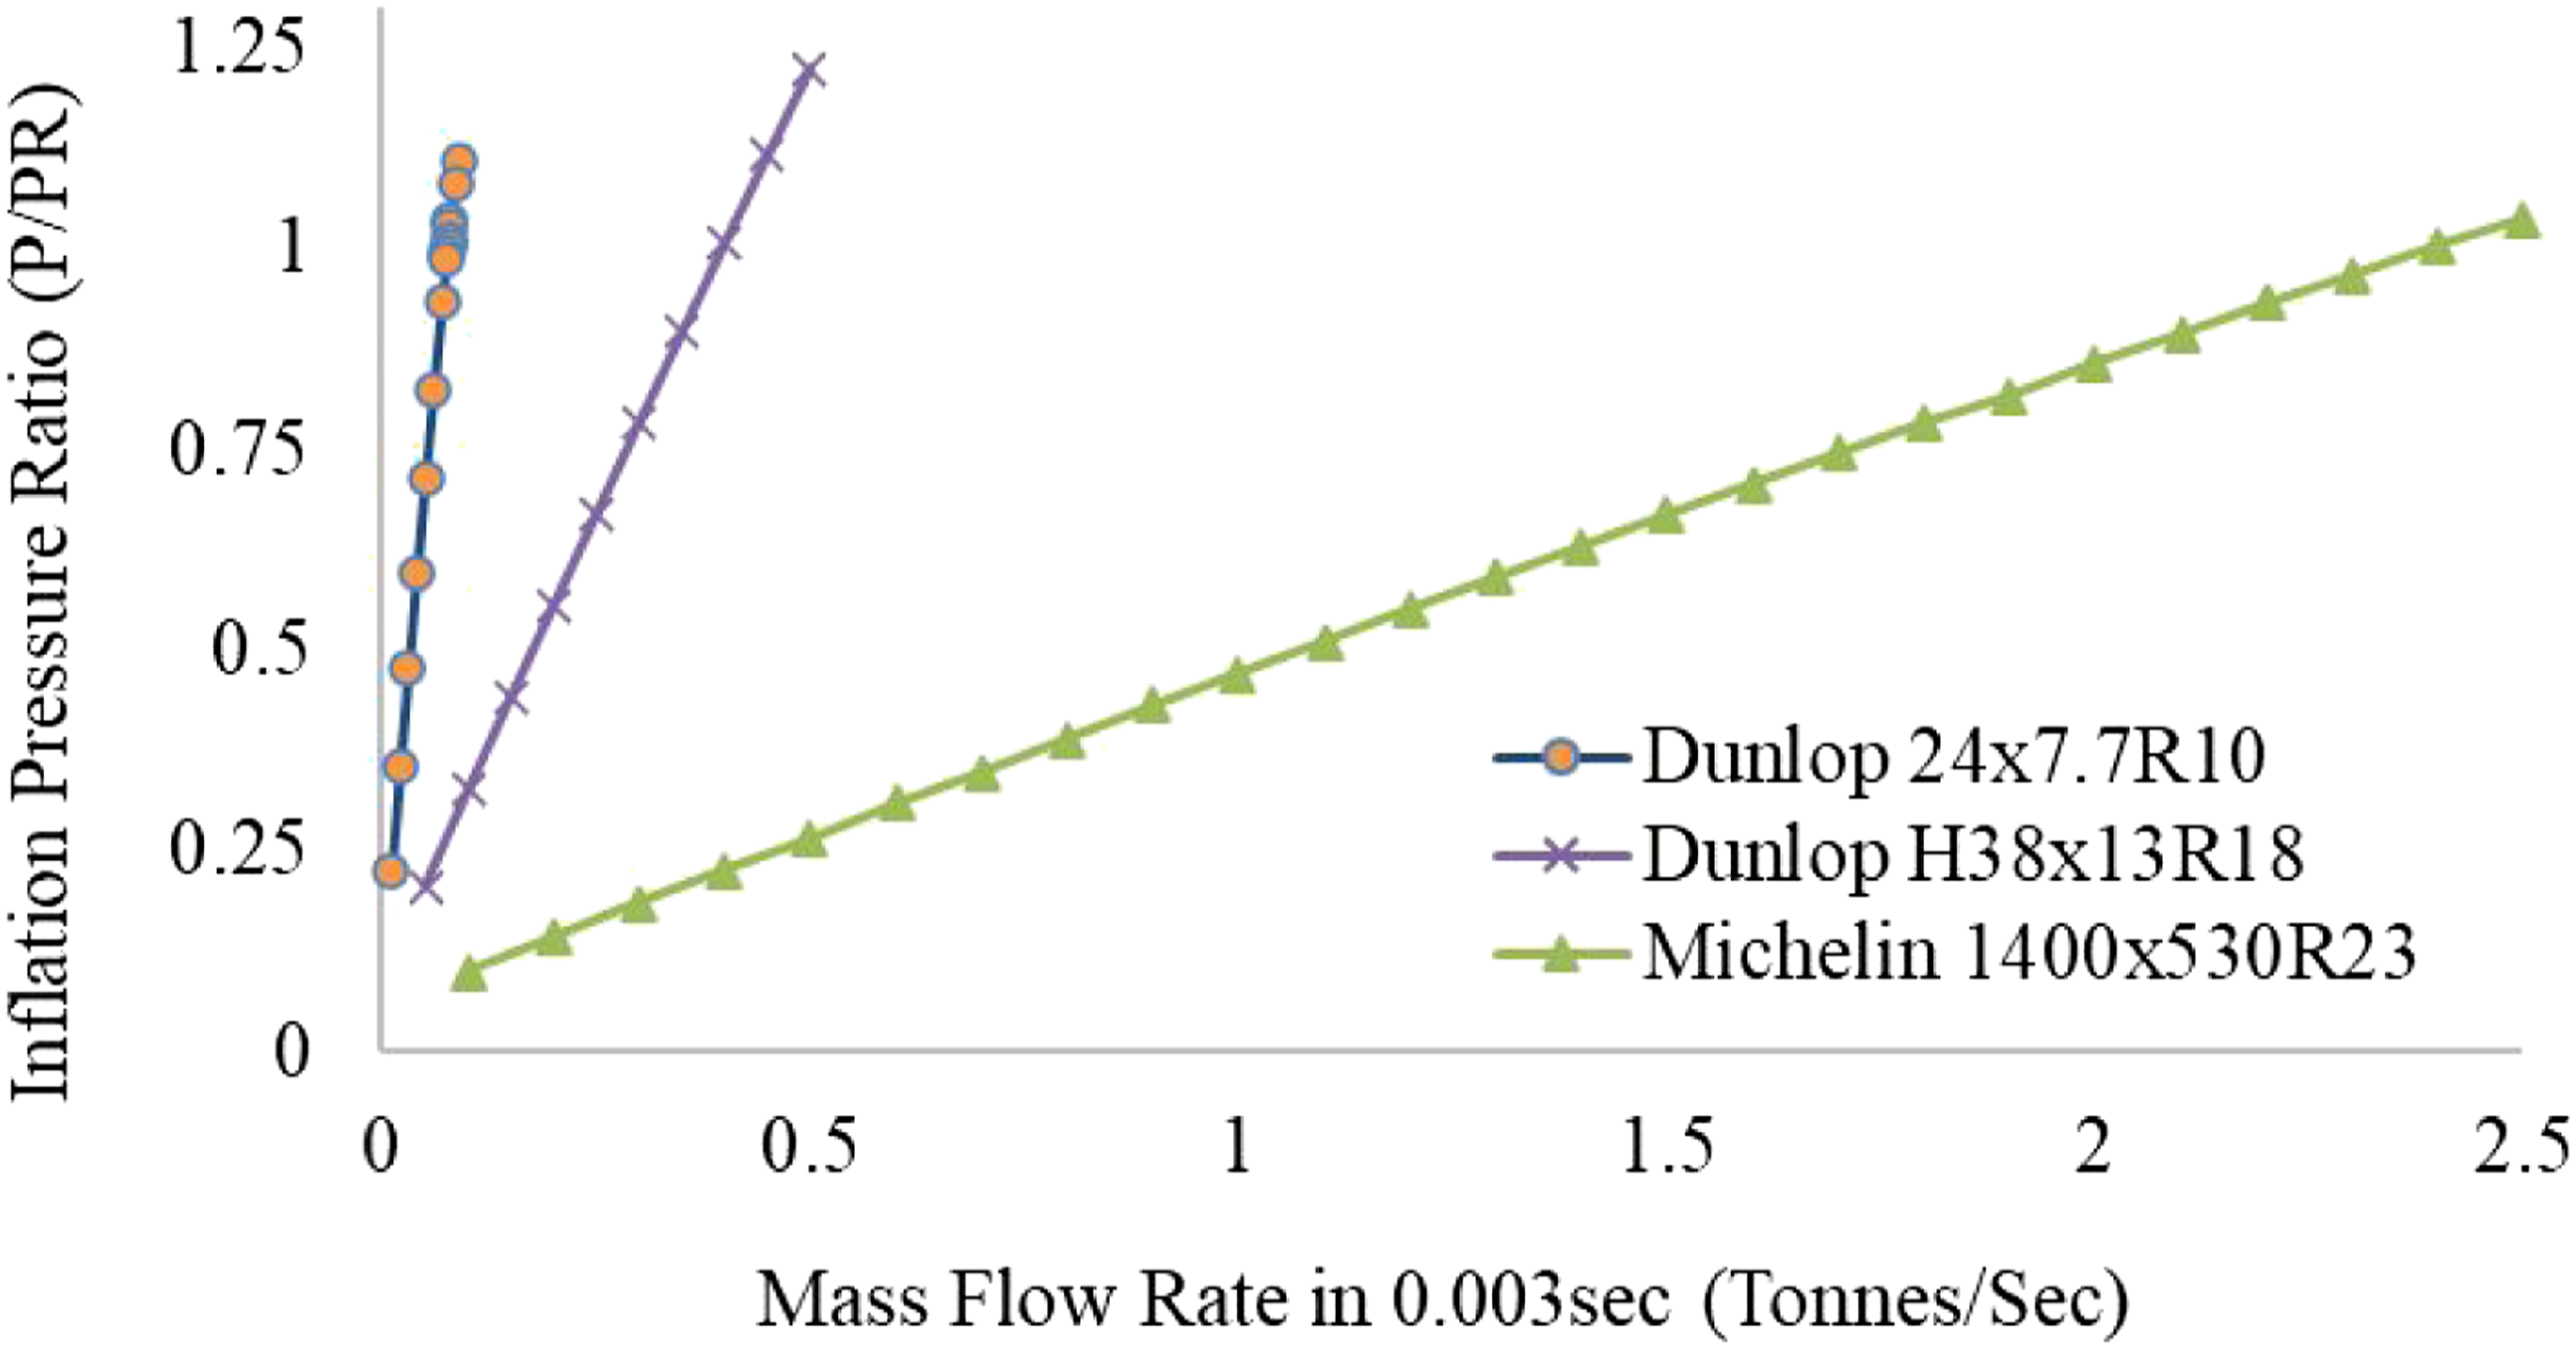
The airbag inflation pressure was set for each case as per the air mass flow rate shown in Figure 6, and the pressure rise due to the vertical loading was checked against equation (4):
18

For the vertical stiffness analysis and subsequent loading directions (Figure 4), a vertical displacement is applied at the centre of the revolute joint with a PRESCRIBED_MOTION function. The displacement corresponding to the vertical load expected to be applied was derived from an initial vertical stiffness simulation setup with the vertical displacement exceeding the rated loading conditions. Using the prescribed displacement methods reduces oscillations and energy dissipation during the simulation allowing for a smoother force-displacement response and avoiding overloading due to inertial effects.
In consideration of the lateral loading, when a stationary vertically loaded tyre is subjected to a lateral force perpendicular to the wheel plane, a lateral deformation, vertical sinking and a lateral shift of the vertical centre of pressure (CoP) are experienced as described by NACA.
18
The correlation between the vertical load and lateral deformation provides the lateral spring constant with each test carried out at a specific vertical deflection ratio
In consideration of torsional loading, when a vertically loaded stationary tyre is subjected to a vertical axis twisting moment, it experiences angular deformation and sinkage. The angular moment variation under non-slip conditions defines the torsional spring constant. For torsional loading, the revolute joint’s DOF are fixed in all directions except in the vertical and vertical axis rotation directions to capture the sinkage and torsional stiffness, respectively. The tyre is vertically loaded until the experimental test conditions or required vertical deflection ratios
Likewise with longitudinal loading cases, the wheel’s revolute joint is locked from rotation with the DOF fixed in all directions except in the vertical and fore-and-aft directions to capture the vertical sinkage and longitudinal stiffness. The tyre is vertically loaded to match the experimental test conditions or for a range of
For modelling the rolling tyre to obtain the un-yawed relaxation length, the tyre is inflated to the required pressure (Figure 6), vertically loaded for various Stages of un-yawed tyre rolling conditions: (a) rear view and (b) top view.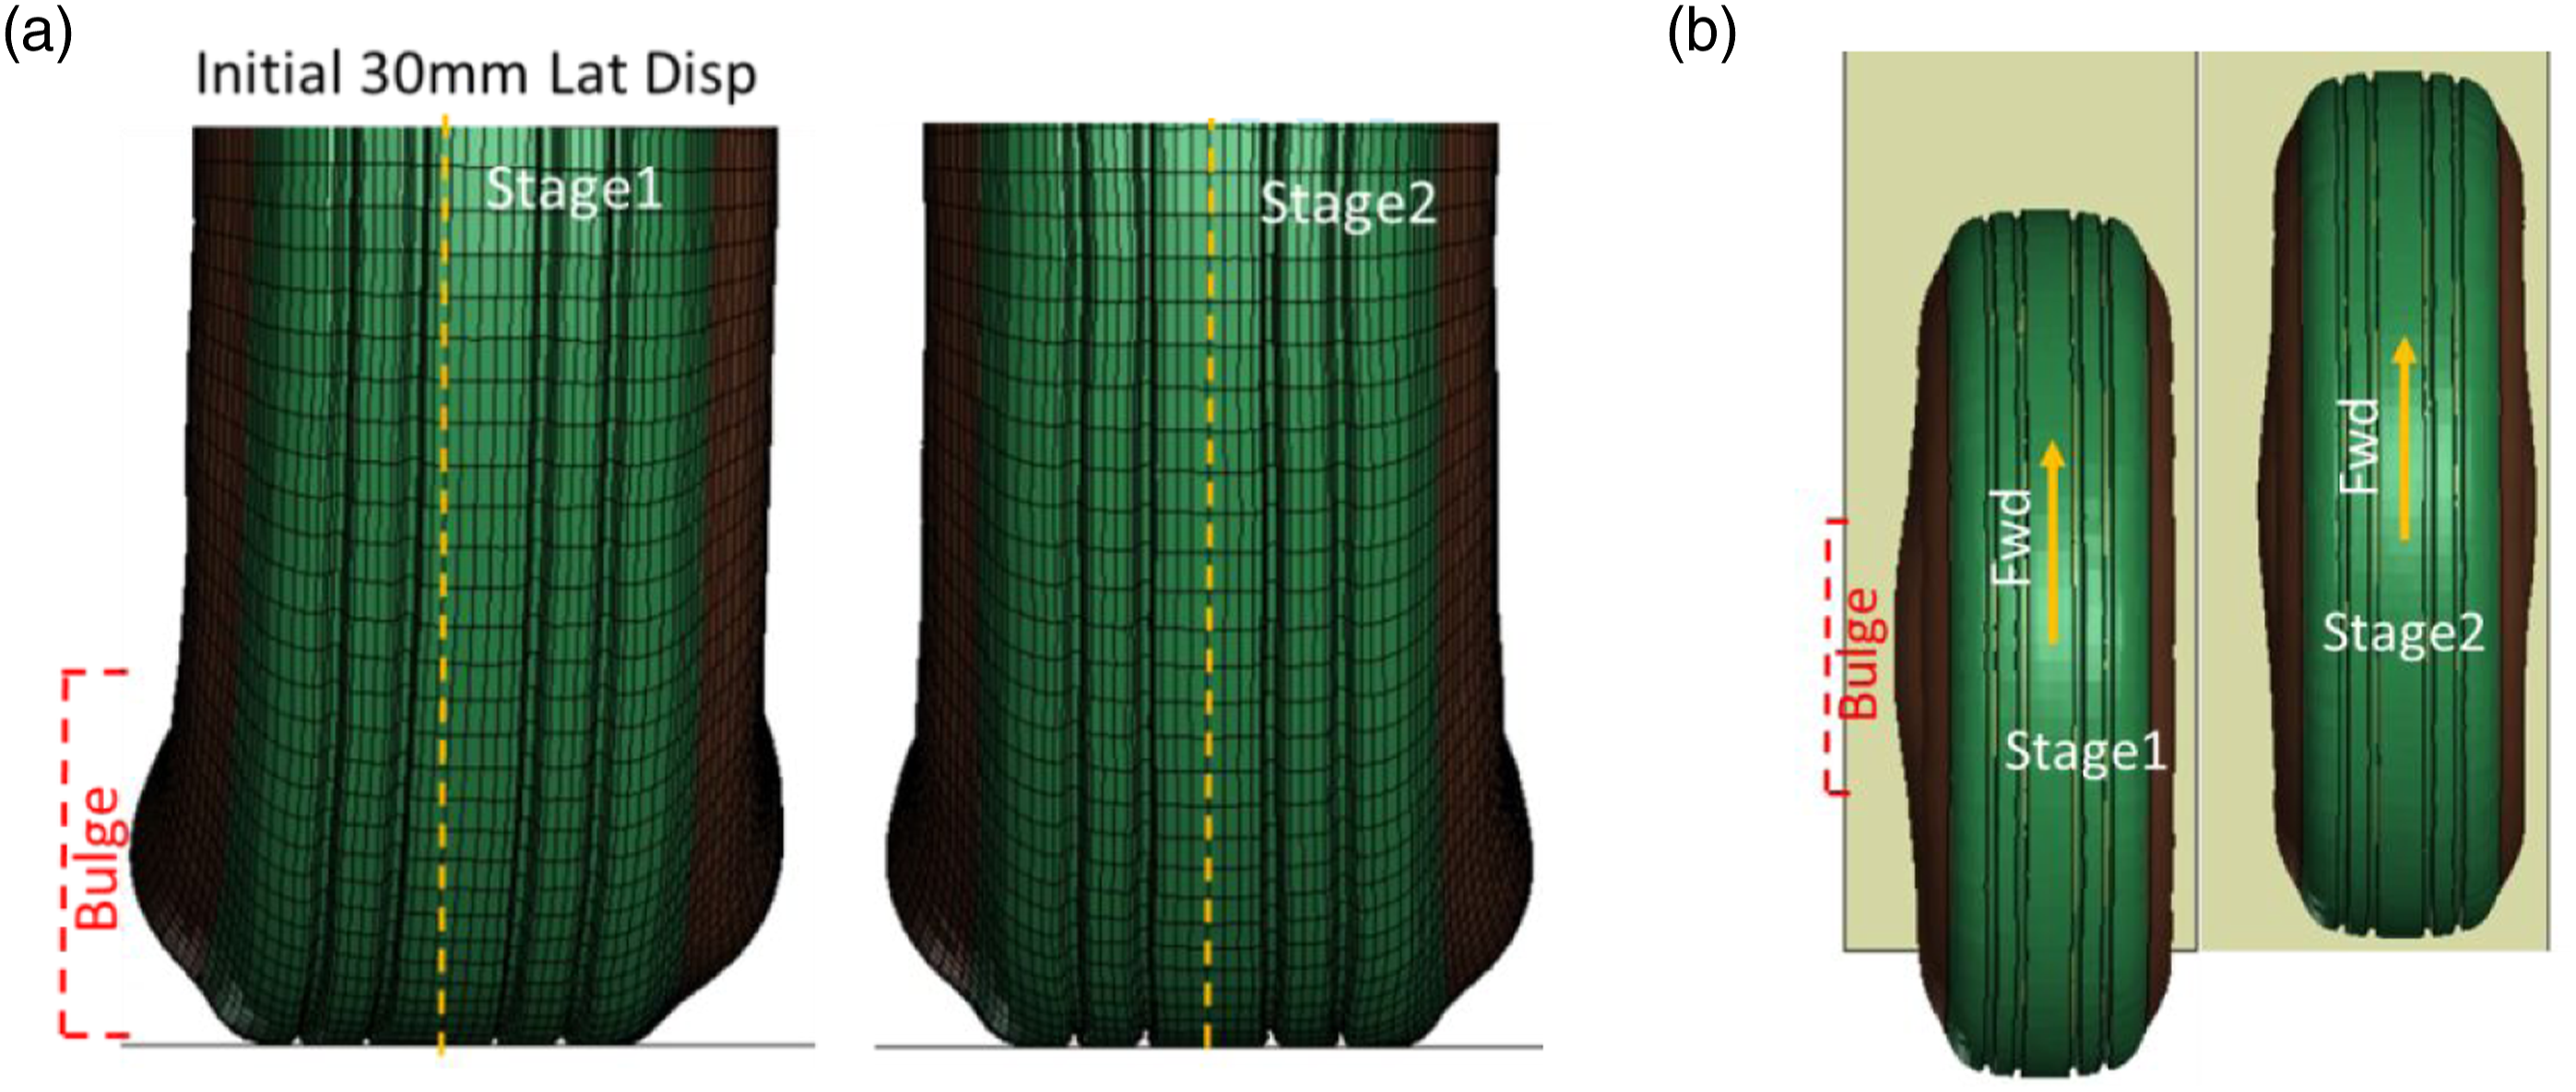
For modelling the rolling tyre in consideration of the yawed relaxation length, the tyre is inflated to the required pressure (Figure 6) and vertically loaded for each Stages of yawed tyre rolling conditions: (a) rear view and (b) top view.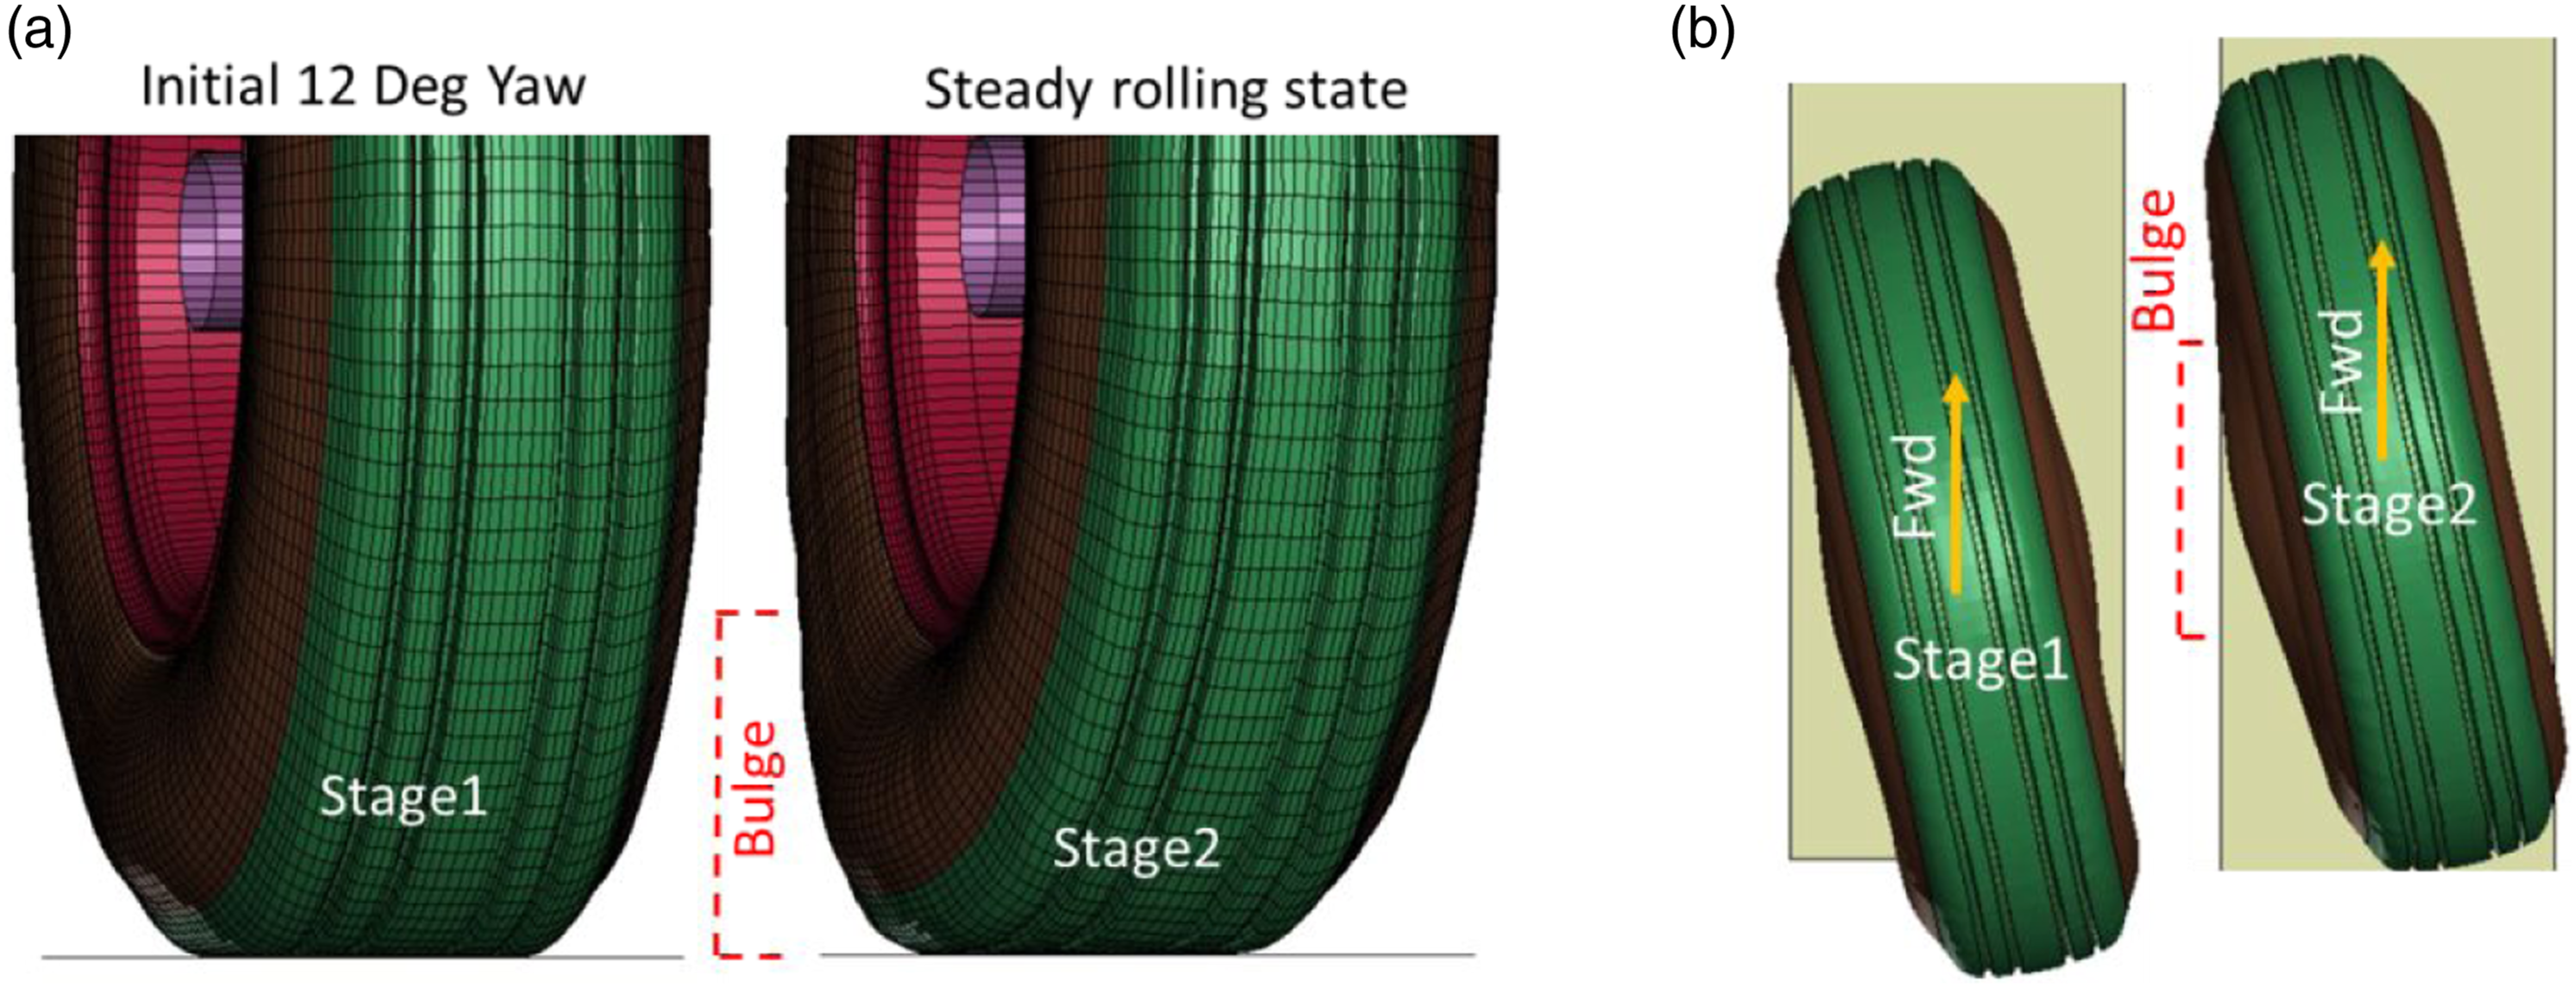
Results and discussion
The stiffness and performance validation of the models have been conducted by comparing the simulated results with the experimental data obtained from the tyre testing at Cranfield University and data provided by the manufacturer.
Quasi-static vertical loading
The correlation of vertical stiffness between the finite element modelling (FEM) and test data for Dunlop 24x7.7R10 in Figure 9 shows good agreement with the stiffness response for the inflation pressure cases and loading range considered. The maximum linear regression error of 2%–3% is observed for the wide-ranging inflation cases such as the 40 psi and 165 psi (Figure 9). Vertical stiffness validation of Dunlop 24x7.7R10 comparing tests (CranTest) against FEA.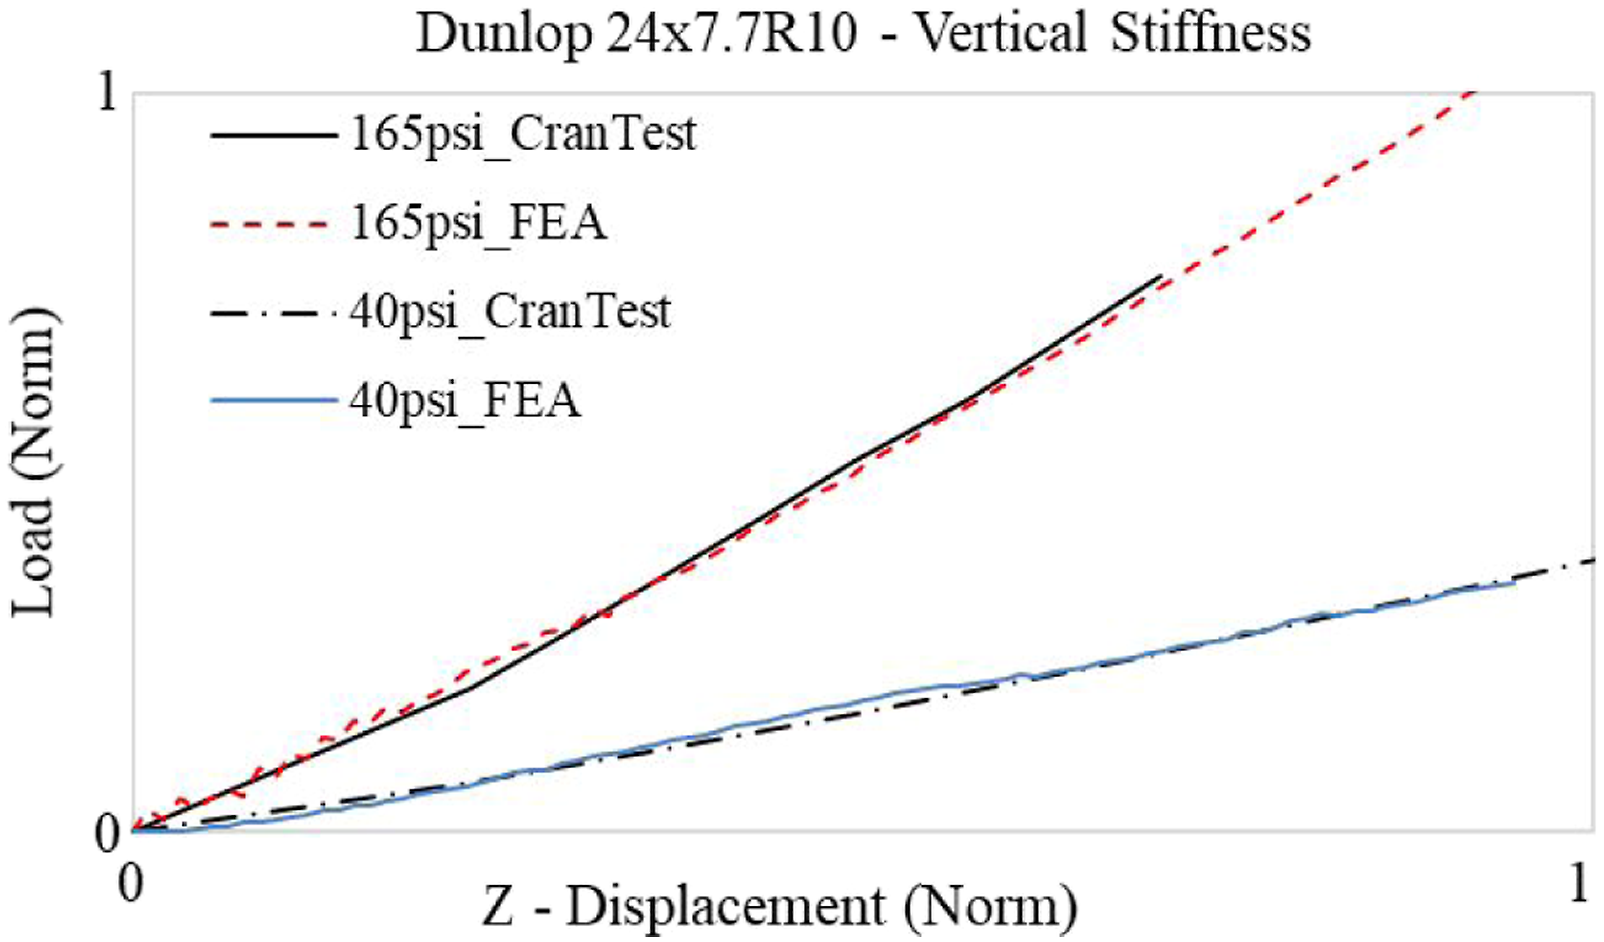
The tyre models have the capability to explore the detailed tyre–ground contact patch using the interface force (INTFOR) files from the tread–ground contact definition. Representative comparisons of Dunlop 24x7.7R10 are made in Figure 10 and Figure 11 against ink-coated test imprints conducted on a static vertical column compression machine. To interpret the interfacial contact patch from the FEM, the contact area can be scaled from the mesh using Image J pixel analysis software or contrast-based Matlab scripts. Maintaining consistency when extracting the footprint area is important to avoid introducing human interpretation factors; hence, a 10-pallet fringe with LCon was activated in LS-PREPOST using post line isobar borders and scaling from a 5 × 5 mm ground mesh. For Figure 10, the test contact area under 165 psi at 11 KN measured 10,073 mm2 (width 128 mm by length 142 mm) and the FEM measured 10,652 mm2 (width 130 mm by length 150 mm). Likewise, in Figure 11, the test contact area under 40 psi at 10.3 KN measured 20,279 mm2 (width 143 by length 218 mm) and the FEM measured 19,742 mm2 (width 140 mm by length 210 mm). The complete contact patch area measurements for multiple loading conditions are presented in Figure 12 for Dunlop 24x7.7R10. Dunlop H38x13R18 and Michelin 1400x530R23 contact data is omitted from this work owing to no test comparisons being available and the scope of the work being focused on the tyre modelling strategy and validation. Footprint contact comparison for Dunlop 24x7.7R10 vertically loaded to 11 KN at 165 psi. Footprint contact comparison for Dunlop 24x7.7R10 vertically loaded to 10.3 KN at 40 psi. Footprint contact for vertically loaded Dunlop 24x7.7R10 comparing experimental (CranTest) and FEA.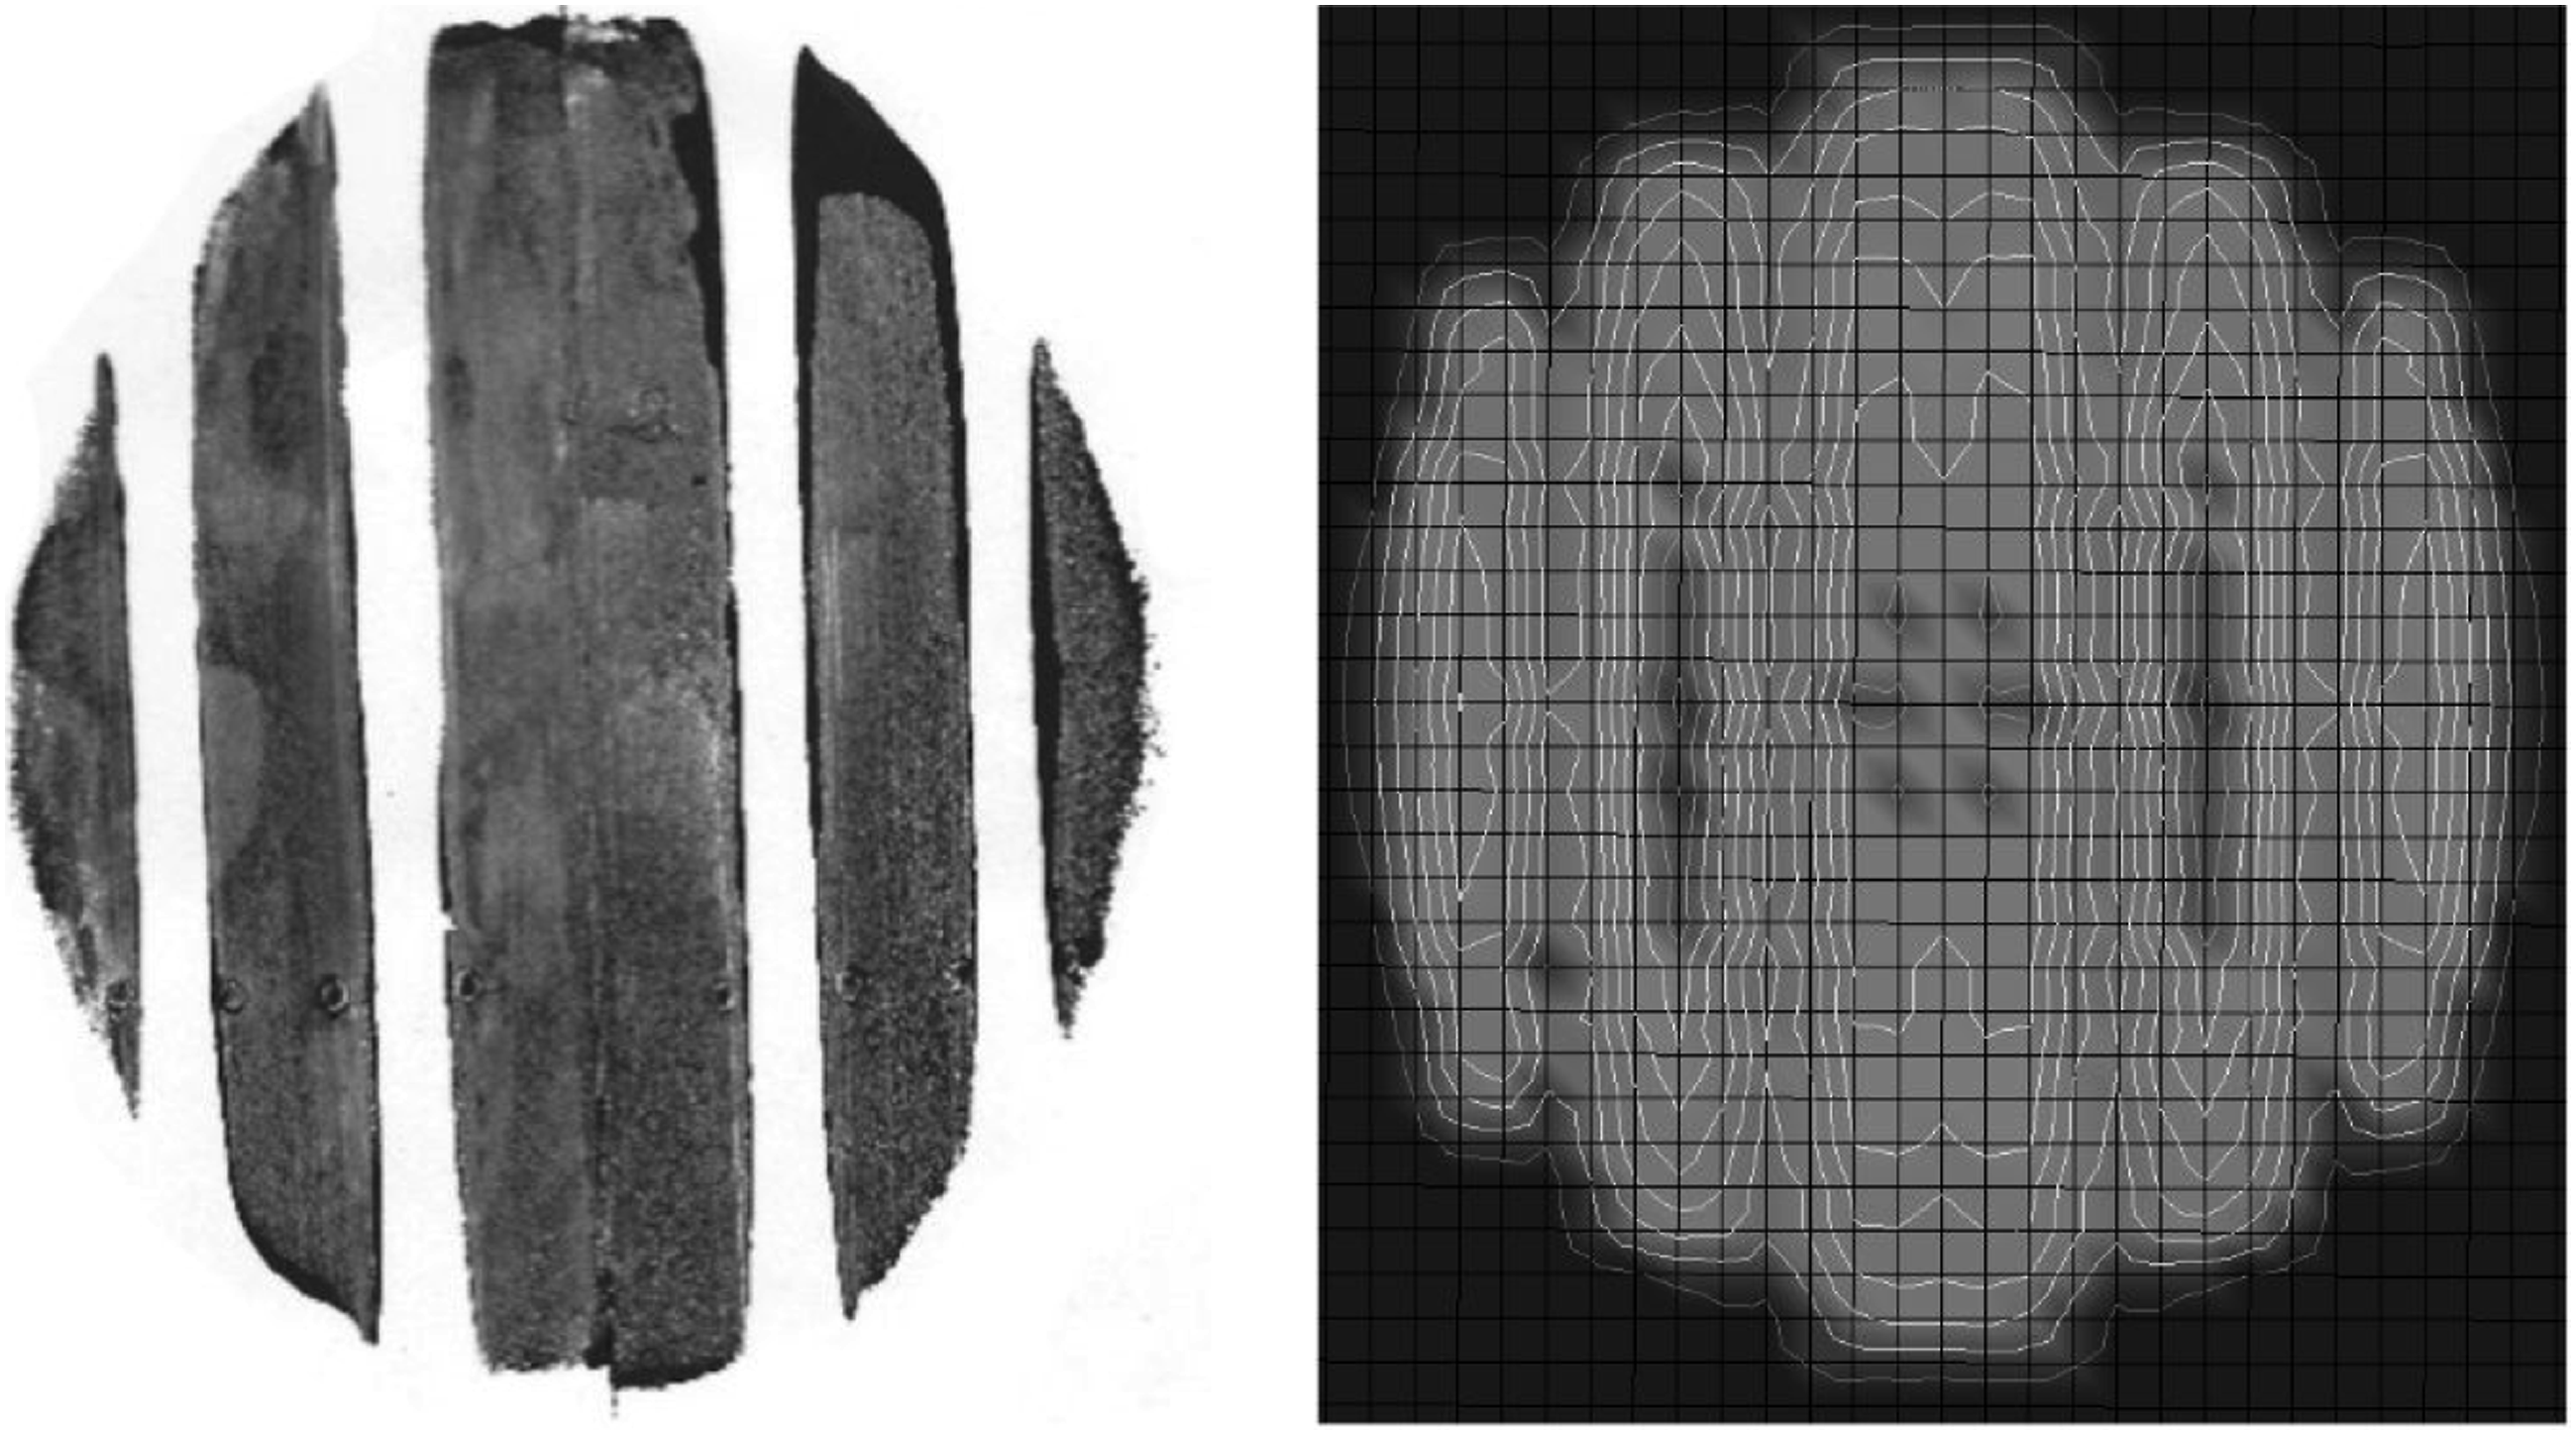
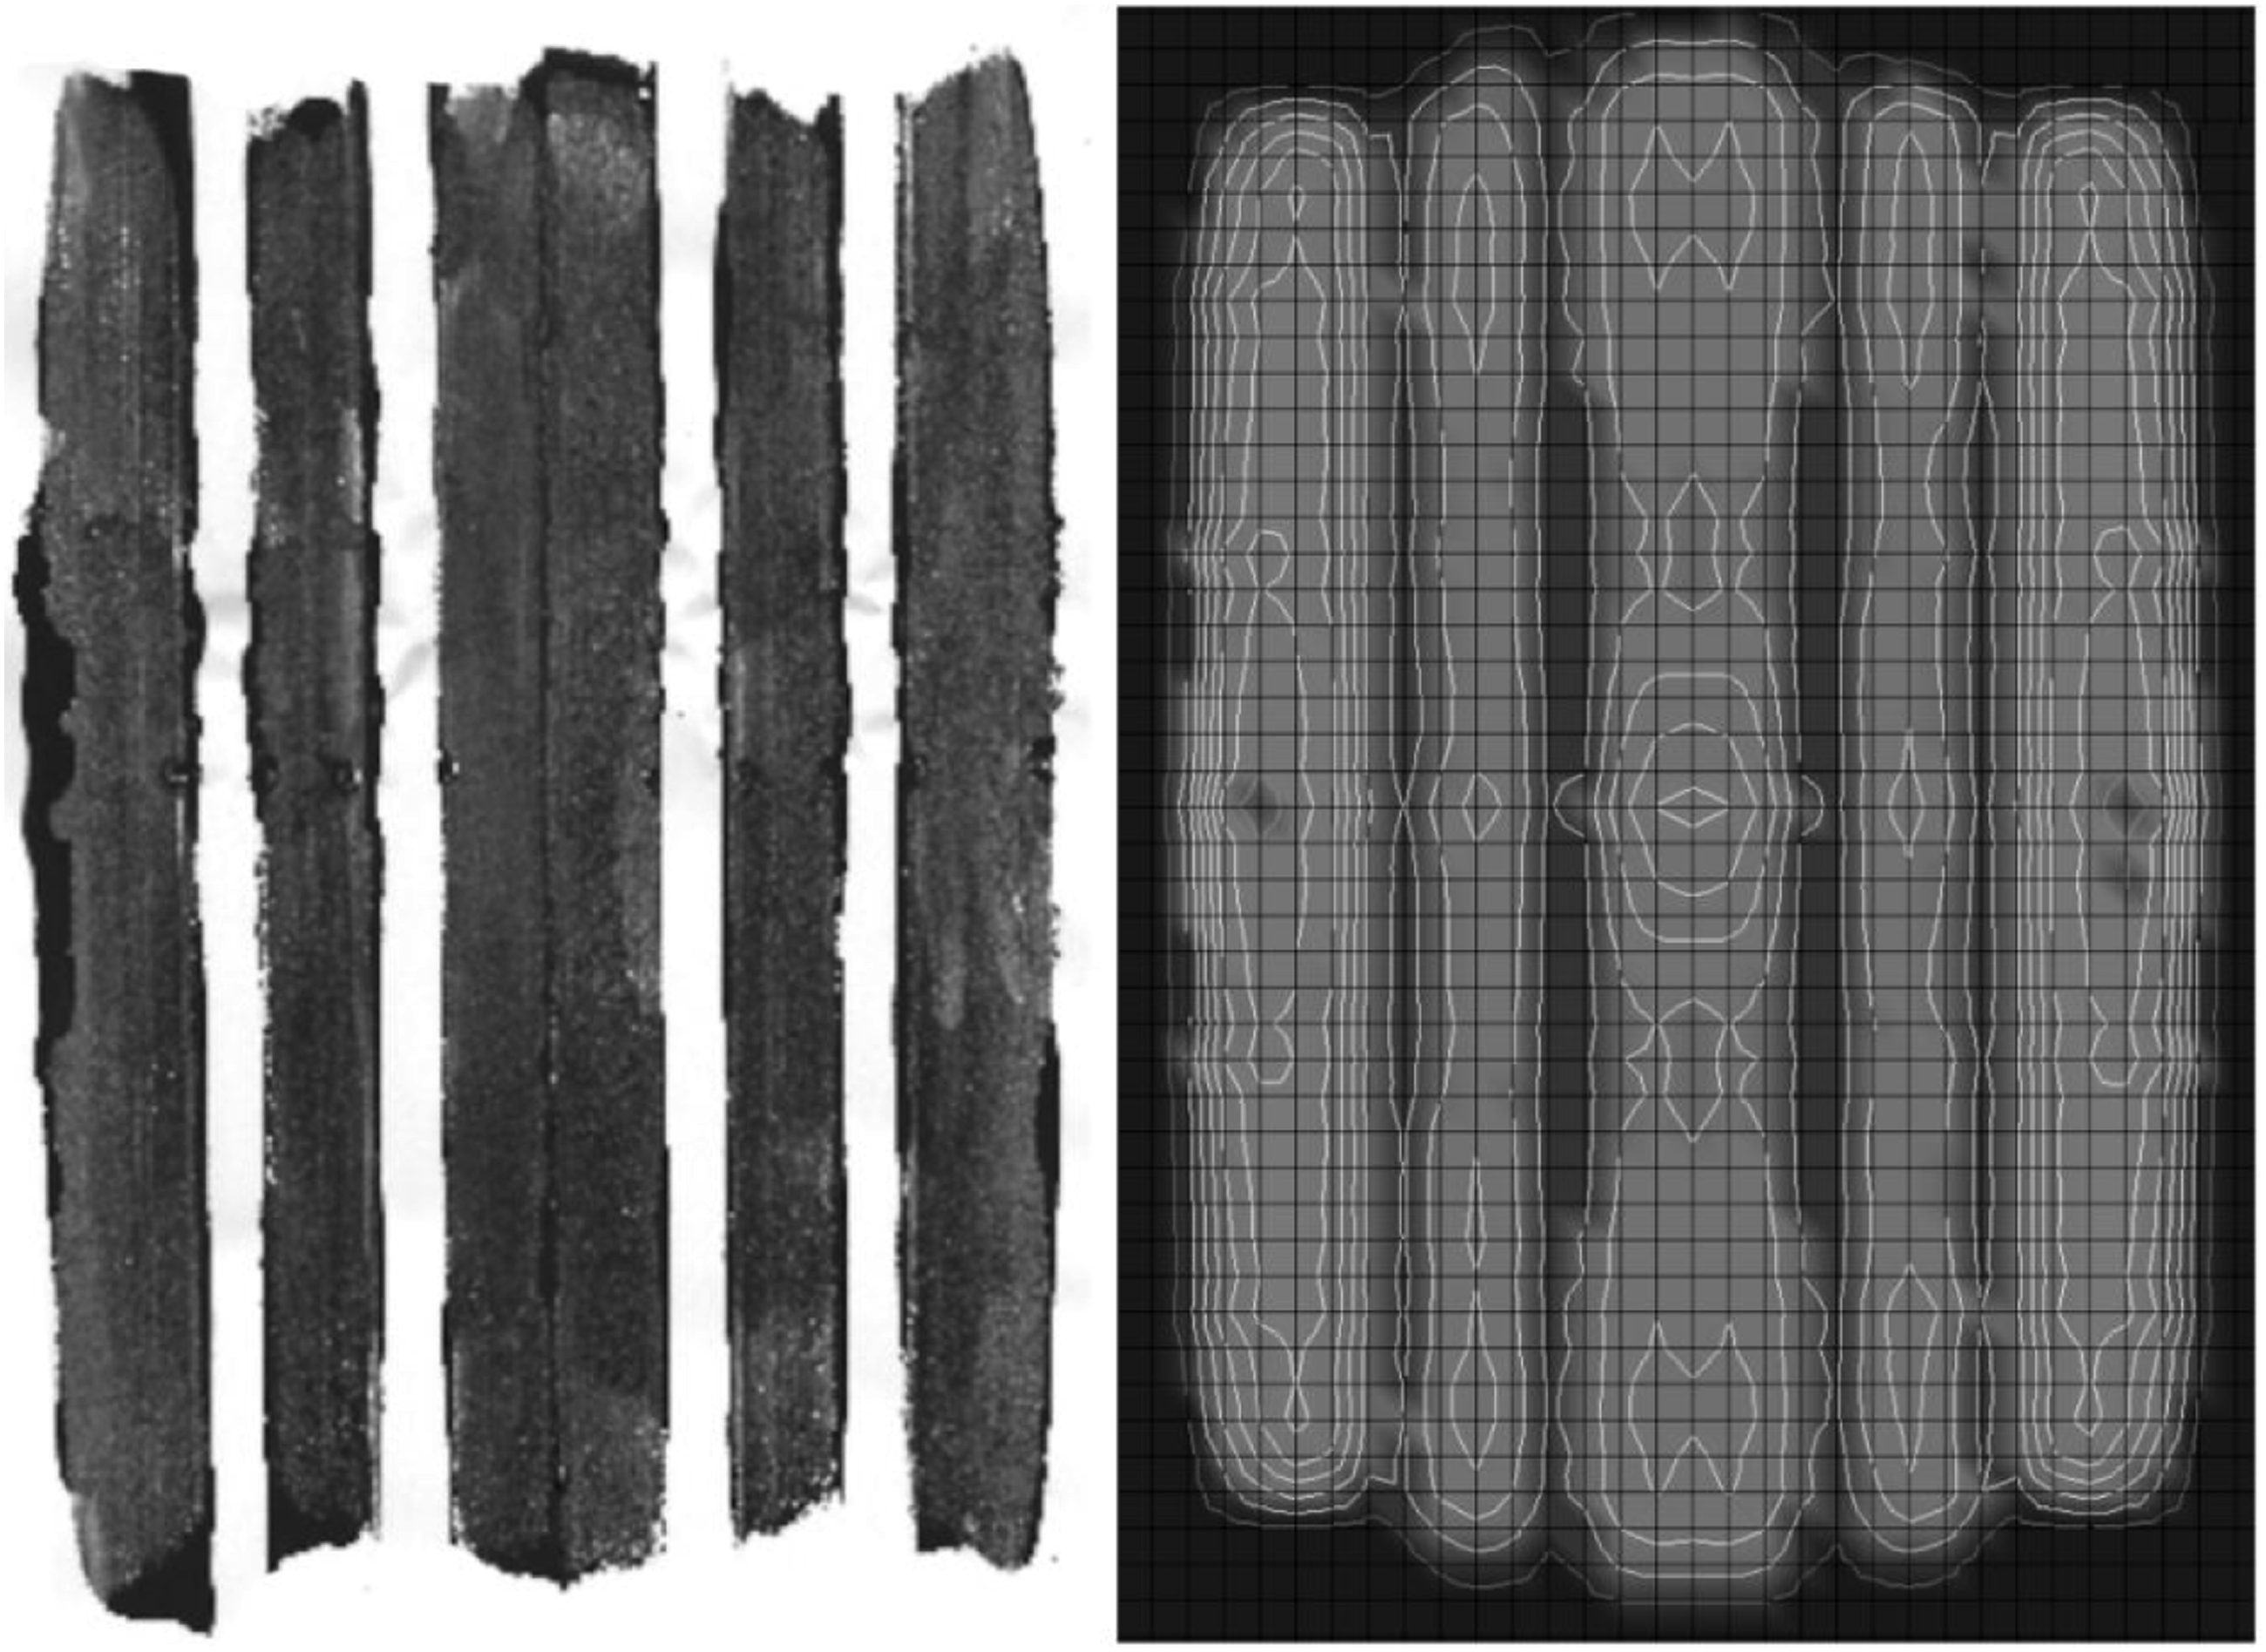
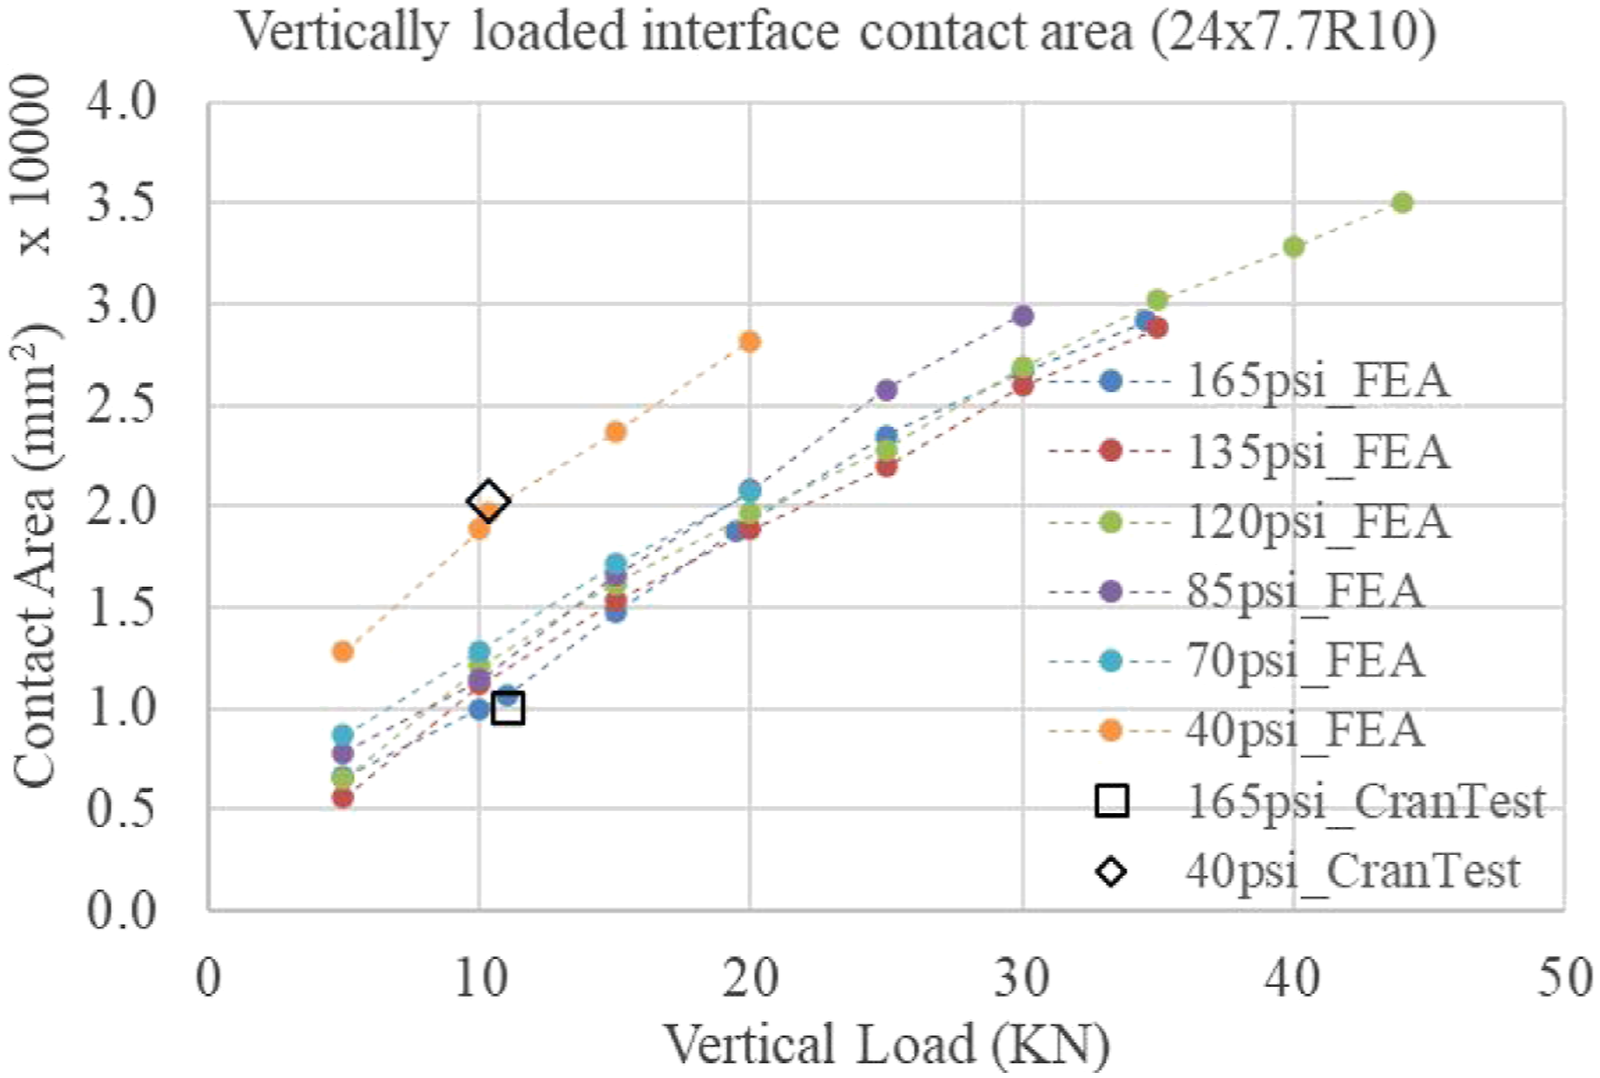
The vertically loaded footprint contact area for Dunlop 24x7.7R10 is presented in Figure 12 for various inflation pressures. The contact area increases with increasing vertical load and decreasing inflation pressure as expected. The two points where physical contact measurements are available from Figures 10 and 11 are used for contact area validation and have a maximum absolute error of 5.7% and 2.6% for the 165 psi and 40 psi inflation pressures, respectively.
The rising inflation pressure for vertically loaded tyres is captured in the FEM and compared in Figure 13 against the NACA report
18
for various inflation pressure ratios Pressure rise trends for Dunlop 24x7.7R10 against NACA
18
Type I tyres.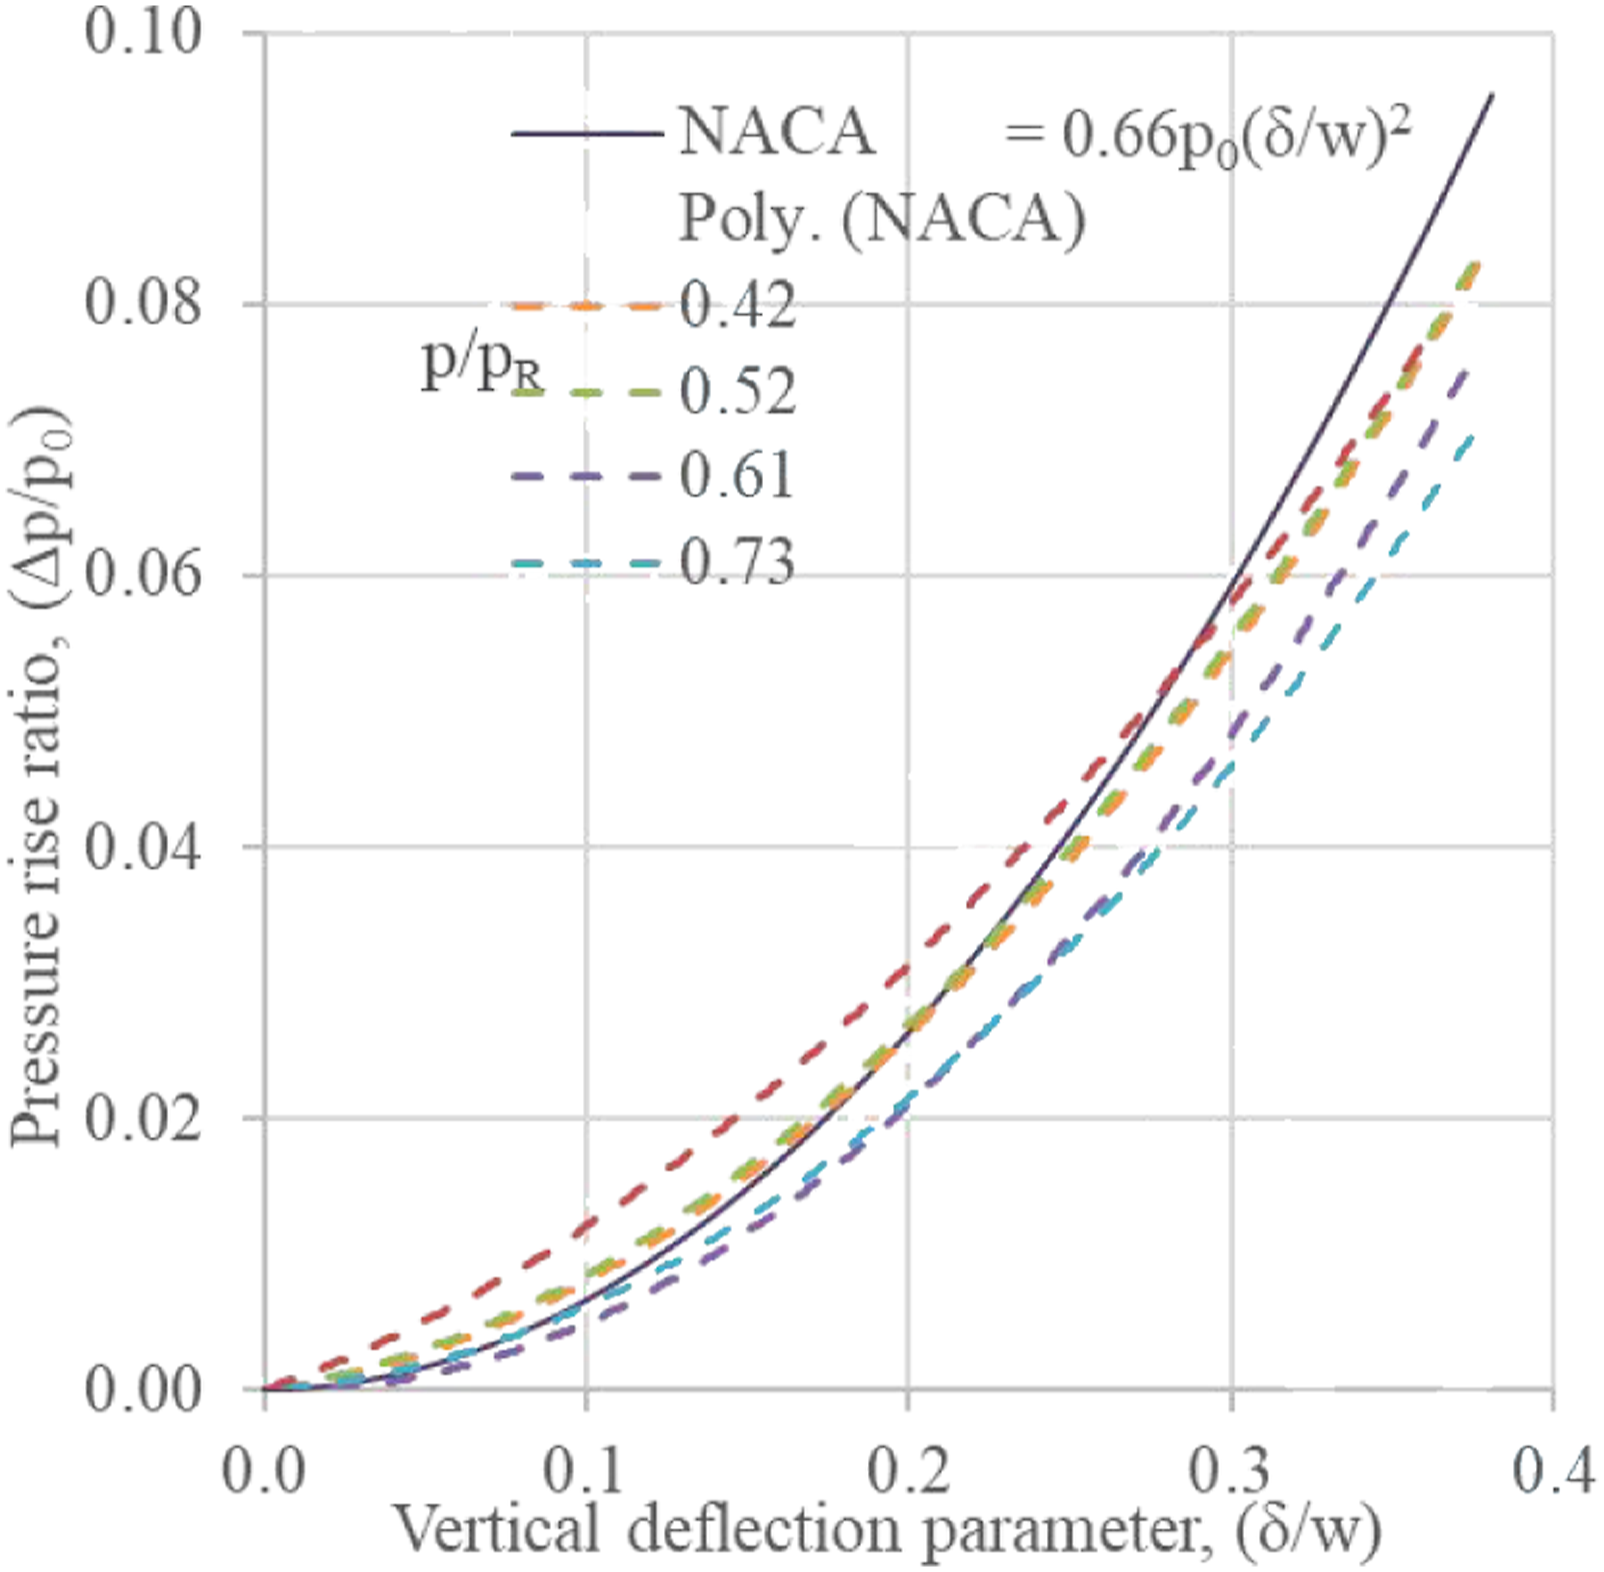
The validation of the FEM for the vertical stiffness for the Dunlop H38x13R18 tyre (Figure 14) also presents a good stiffness correlation with a maximum linear regression error of ≈1% in the mid-load operating region. The low error sensitivity to the inflation pressure difference is due to further maturity of the Dunlop H38x13R18 model and having increased test data available for all loading directions during the FEM creation. Considering the FEM matches the test data for low and high vertical loads and the error primarily being in the mid-loading range, it is suspected that the ≈1% error is due to not achieving the tested inflation pressure in the FEM. Further tuning of the air inflation mass flow rates (Figure 6) can reduce the error; however, given the FEM is matching for low and high vertical loads suggests that the modelling strategy (the Modelling Strategy section) and tyre stiffness is accurately captured. Vertical stiffness validation of Dunlop H38x13R18 comparing tests against FEA.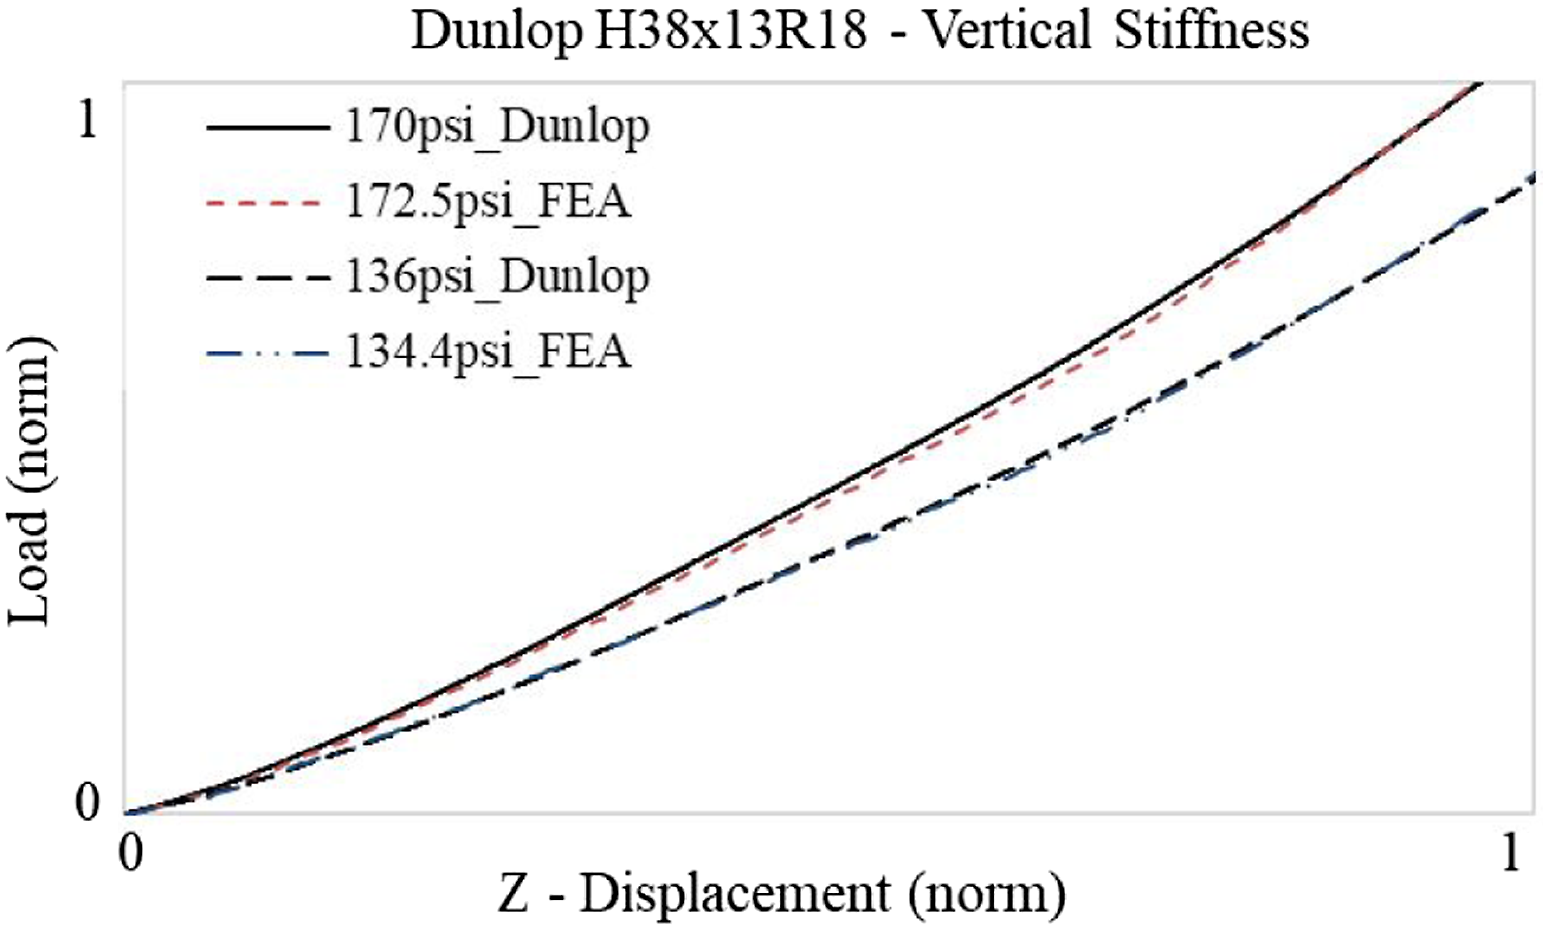
Furthermore, the correlation of vertical stiffness between the FEM and test data for the Michelin 1400x530R23 tyre (Figure 15) demonstrates a suitable stiffness correlation for two of the inflation pressure cases available. The Michelin 1400x530R23 FEM required identifying the rubber and ply configuration to determine its construction. The rubber compounds in Michelin 1400x530R23 were tuned based off simple hardness tests and compared against the known Dunlop compounds. Upon determination of the ply and layered construction, the variables Vf were determined across various regions of the tyre (Figure 3) and used in the calculation for equivalent orthotropic properties using CLT (the Orthotropic Equivalent Composites section). The stiffness response aligns with the snapshot test data as presented in Figure 15. Vertical stiffness validation of Michelin 1400x530R23 comparing tests (CranTest) against FEA.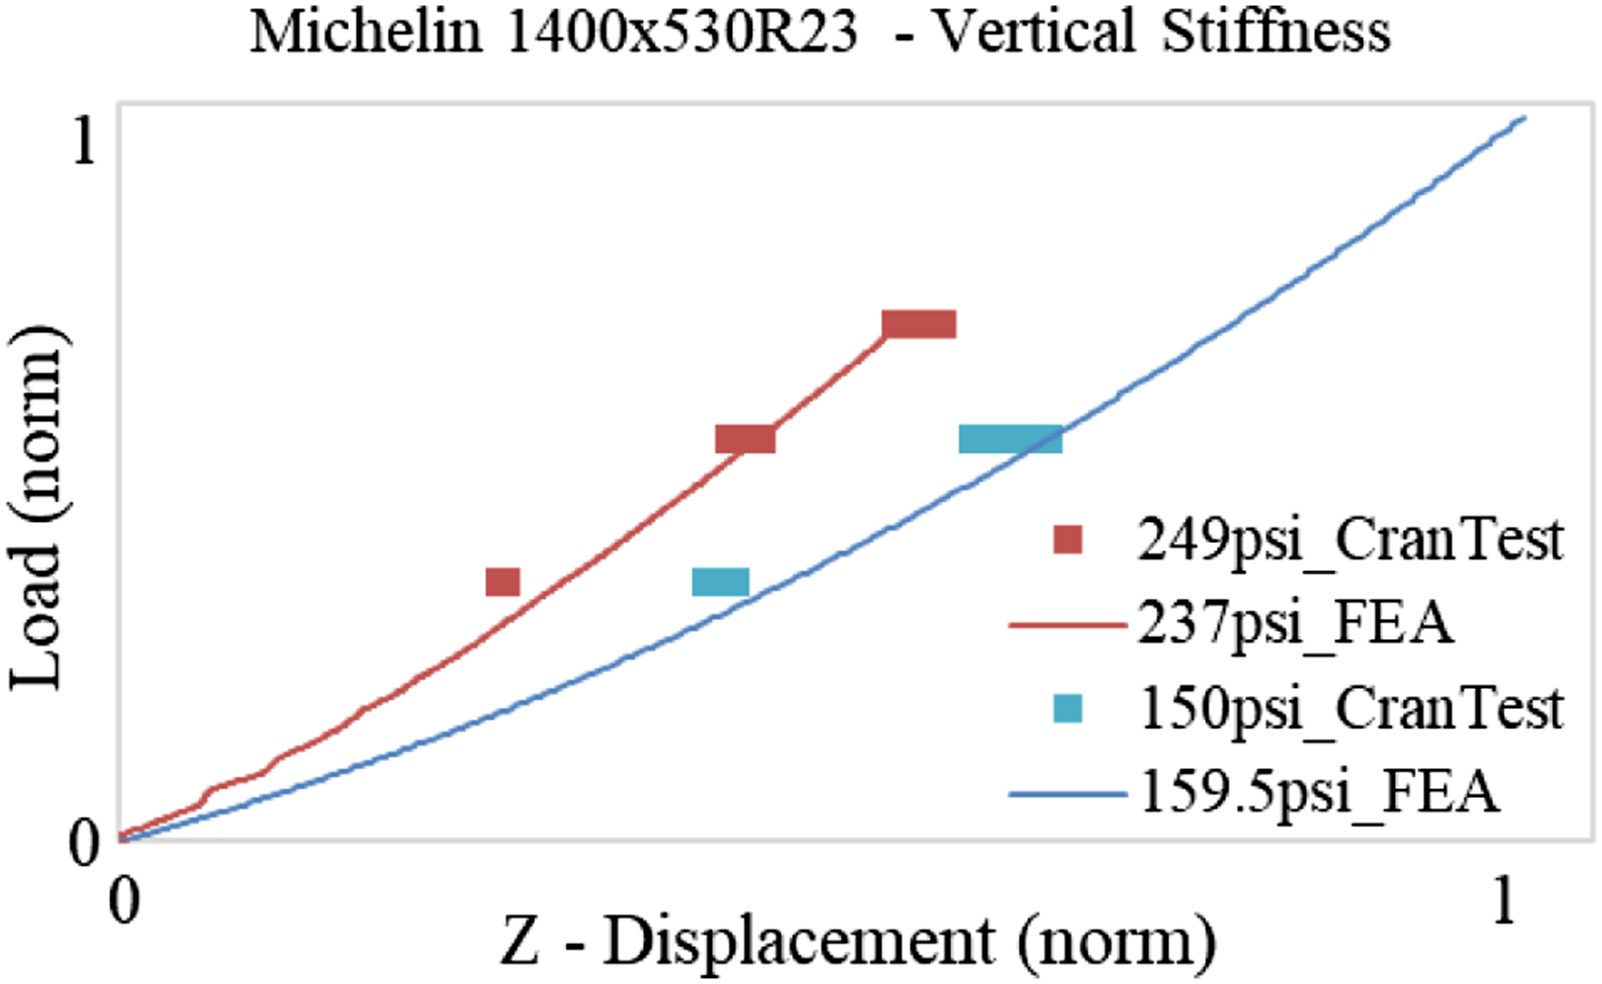
Quasi-static lateral loading
The representative validation of lateral stiffness between the FEM and test data for Dunlop H38x13R18 in Figure 16 demonstrates adequate lateral stiffness correlation against the test data available. The difference in the loading and unloading hysteresis loop is due to the sensitivity of the rubber relaxation parameters and difference in strain rates in the FEM model. The fitted stiffness validation of the FEM against the test data has an error of <1% which is sufficient for subsequent stiffness parameterisation models. Lateral stiffness validation of Dunlop H38x13R18 for 45 kN vertical load inflated to 172 psi.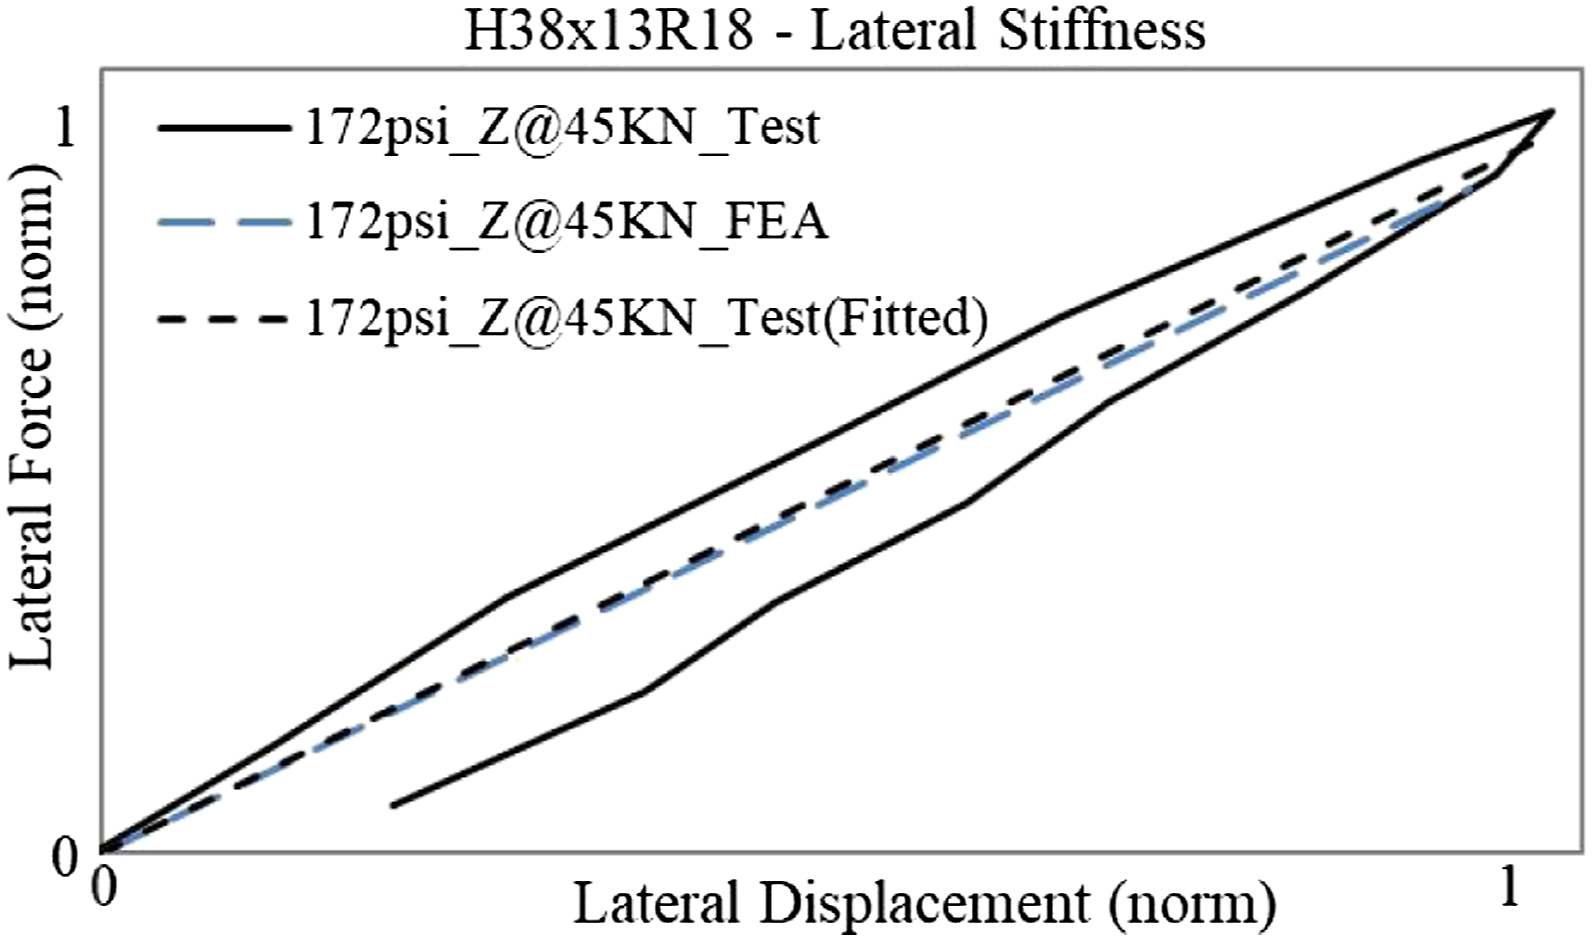
Further validations to compare the lateral sidewall bulge deformation (Figure 17) were obtained using a phased array laser scanning measurement system and illustrated against the outer nodes of the FEM cross section for Dunlop H38x13R18. The comparison presents excellent correlation of the lateral sidewall bulge between the FEM and test scan measurements with deviations mostly amounting from the array density. Representative FEA lateral bulge deformation (dotted line) comparison with scan measurements (continuous line) for Dunlop H38x13R18 with 45 KN vertical load at 172 psi.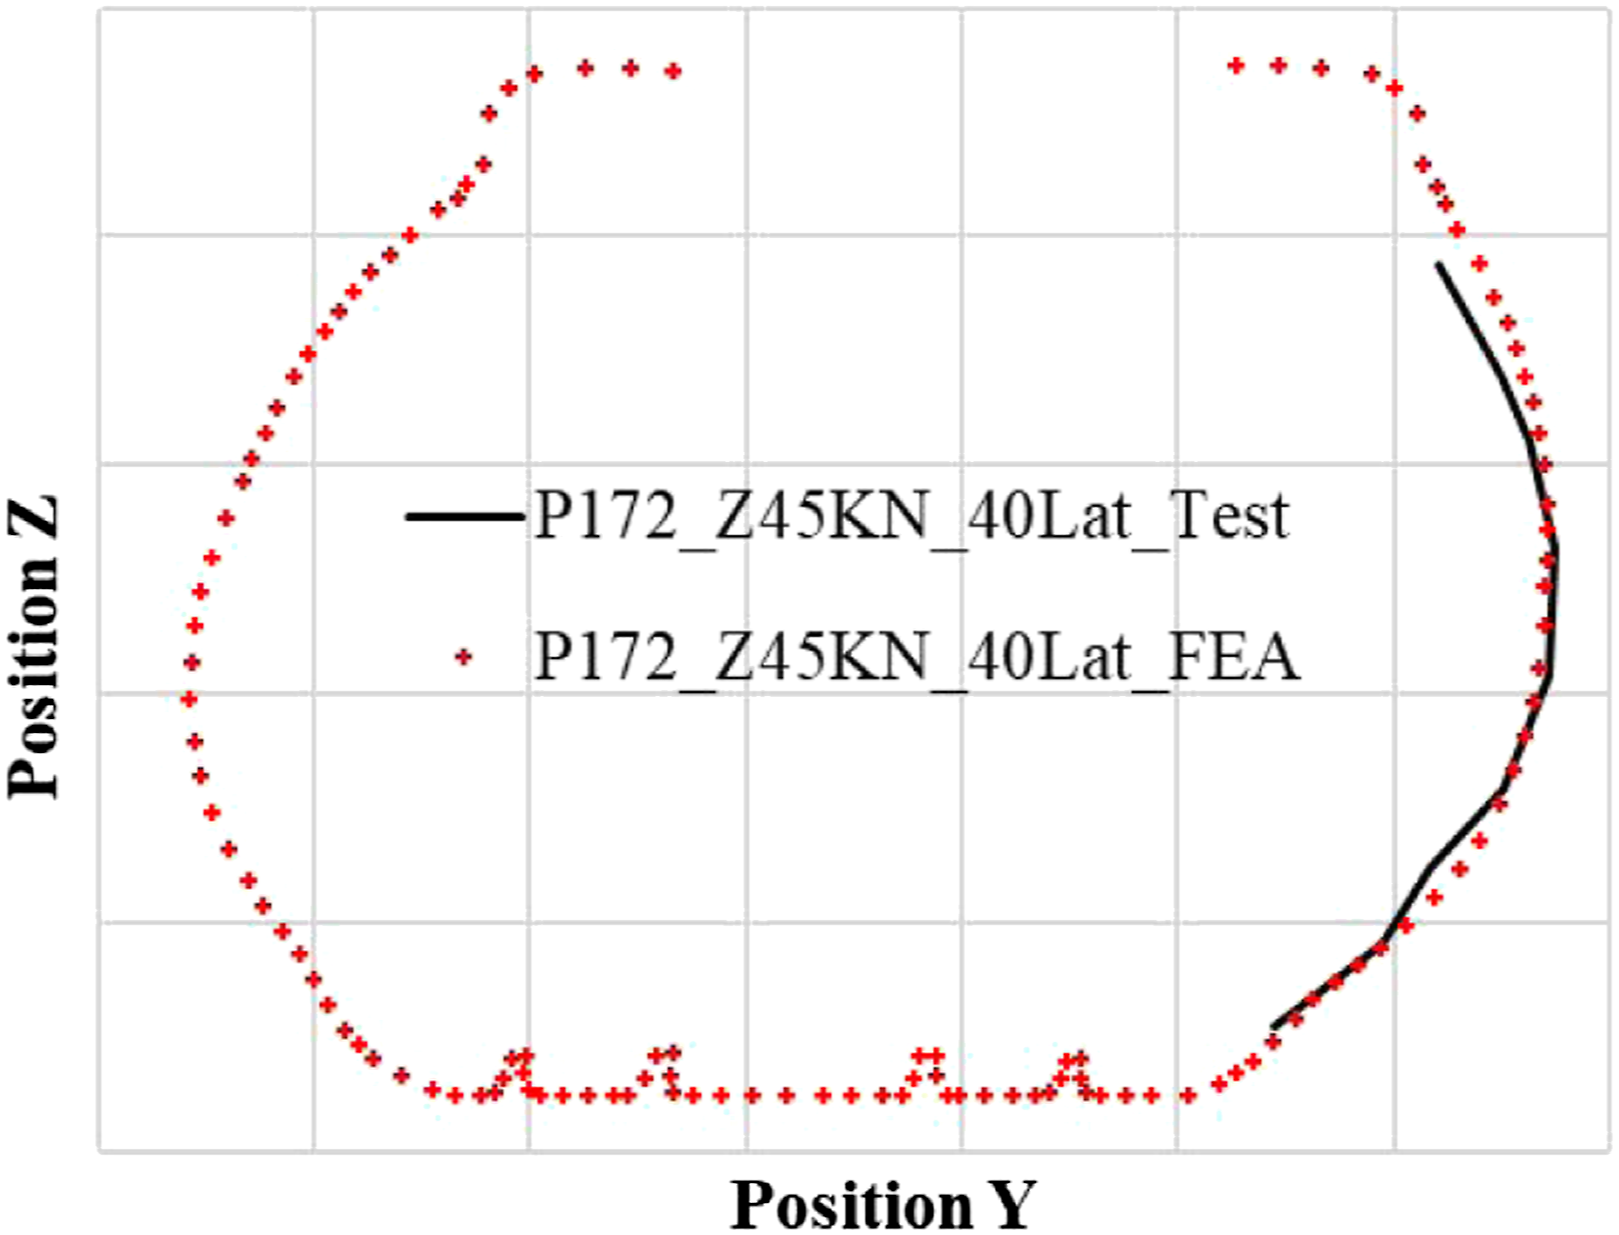
Using the INTFOR files, the FEM can also capture the vertical CoP shift under the influence of a lateral force. The shift during lateral loading is omitted in this work owing to the focus being modelling strategy and validation; however, the interfacial shear vectors in the FEM change directions towards the direction of load and always point towards the tyre’s vertical CoP under non-slip conditions.
Quasi-static torsional loading
The comparison of torsional stiffness between the FEM and test data for Dunlop H38x13R18 in Figure 18 demonstrates good correlation for the available data. The differences in the small angular displacement region are due to the sensitivity of the rubber modelling parameters with the overall stiffness trend having a maximum point-based error of 16%; however, the fitted trend has a maximum error of 12% within the same 5° region. The stick-slip behaviour around this region is due to the contact modelling at the tyre–ground interface where the turning slip would occur as the majority of angular displacement readings have an error of <5%. Representative Dunlop H38x13R18 torsional stiffness comparison of test results (CranTest) against FEA.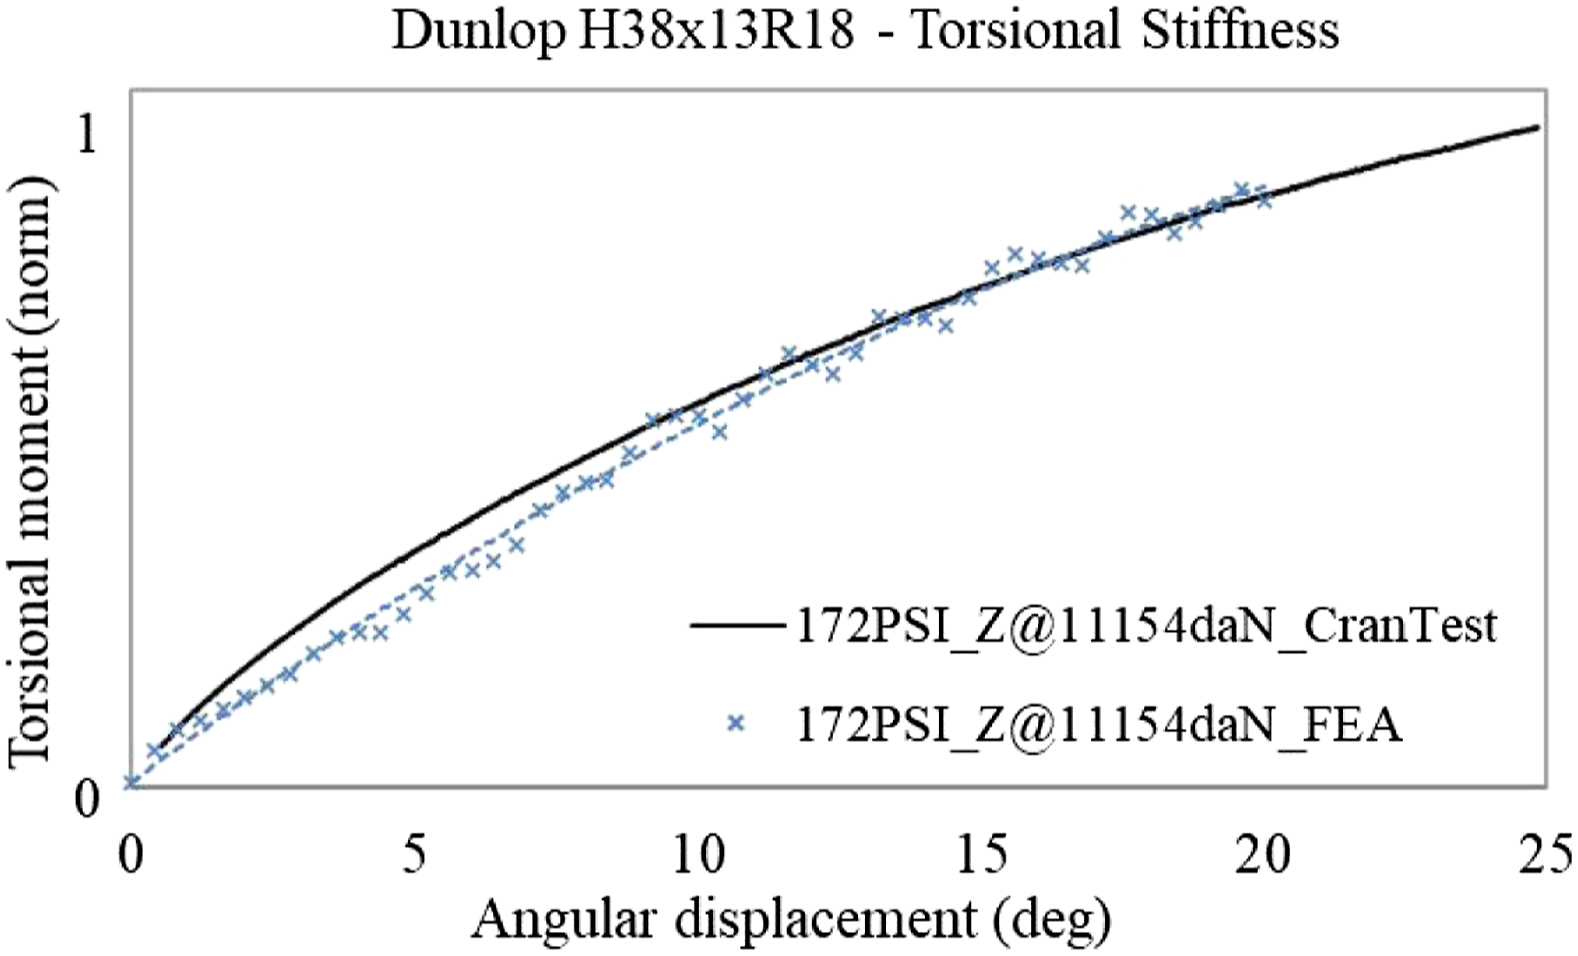
Quasi-static longitudinal loading
The longitudinal stiffness comparison of the FEM and test data for Dunlop H38x13R18 in Figure 19 demonstrates excellent longitudinal stiffness correlation for the representative case considered. Representative longitudinal stiffness comparison for Dunlop H38x13R18 test results (S/N 11277003) against FEA.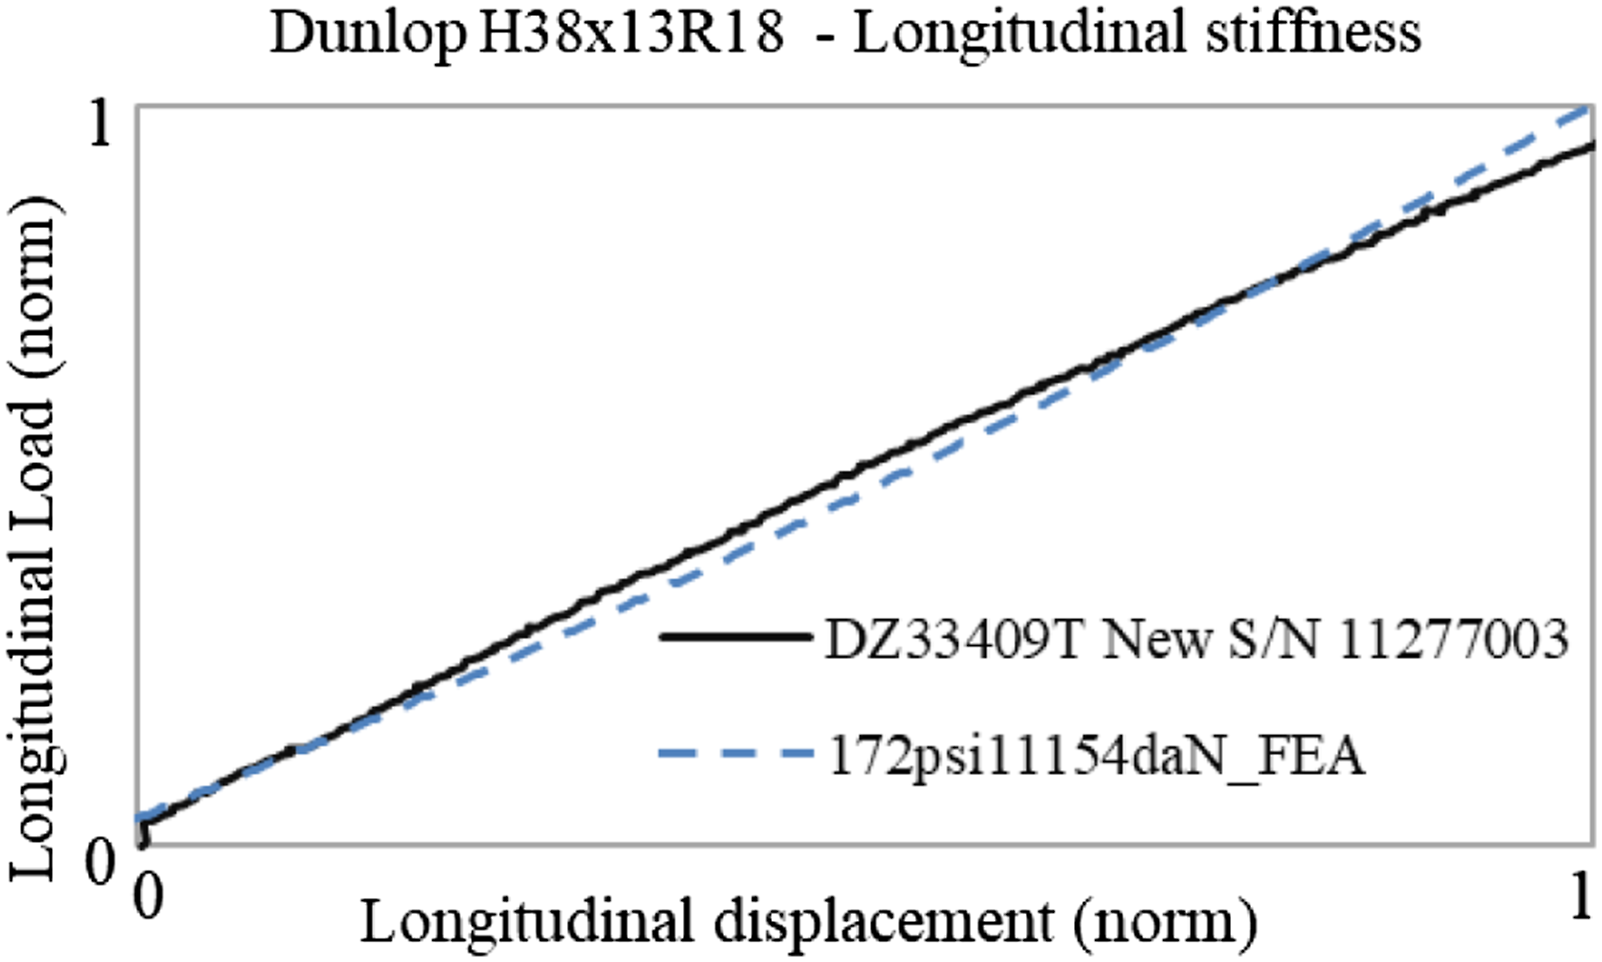
Using the INTFOR files, the FEM can also capture the vertical CoP shift under the influence of a longitudinal force. The shift during longitudinal loading is omitted in this work owing to the focus being modelling strategy and validation. The magnitude and direction of shear vectors would generally align with the loading direction. The peak contact pressure location also redistributes as the longitudinal displacement is applied where the contact pressure is concentrated towards the tyre CoP before the rotation-locked tyre is displaced.
Dynamic results
The dynamic simulations were performed for all three tyre sizes under various inflation pressures and loading conditions to capture data for a parameterised tyre model. In this section a representative example of the simulation data from Michelin 1400x530R23 is presented to illustrate the capabilities and demonstrate the results.
Dynamic un-yawed rolling
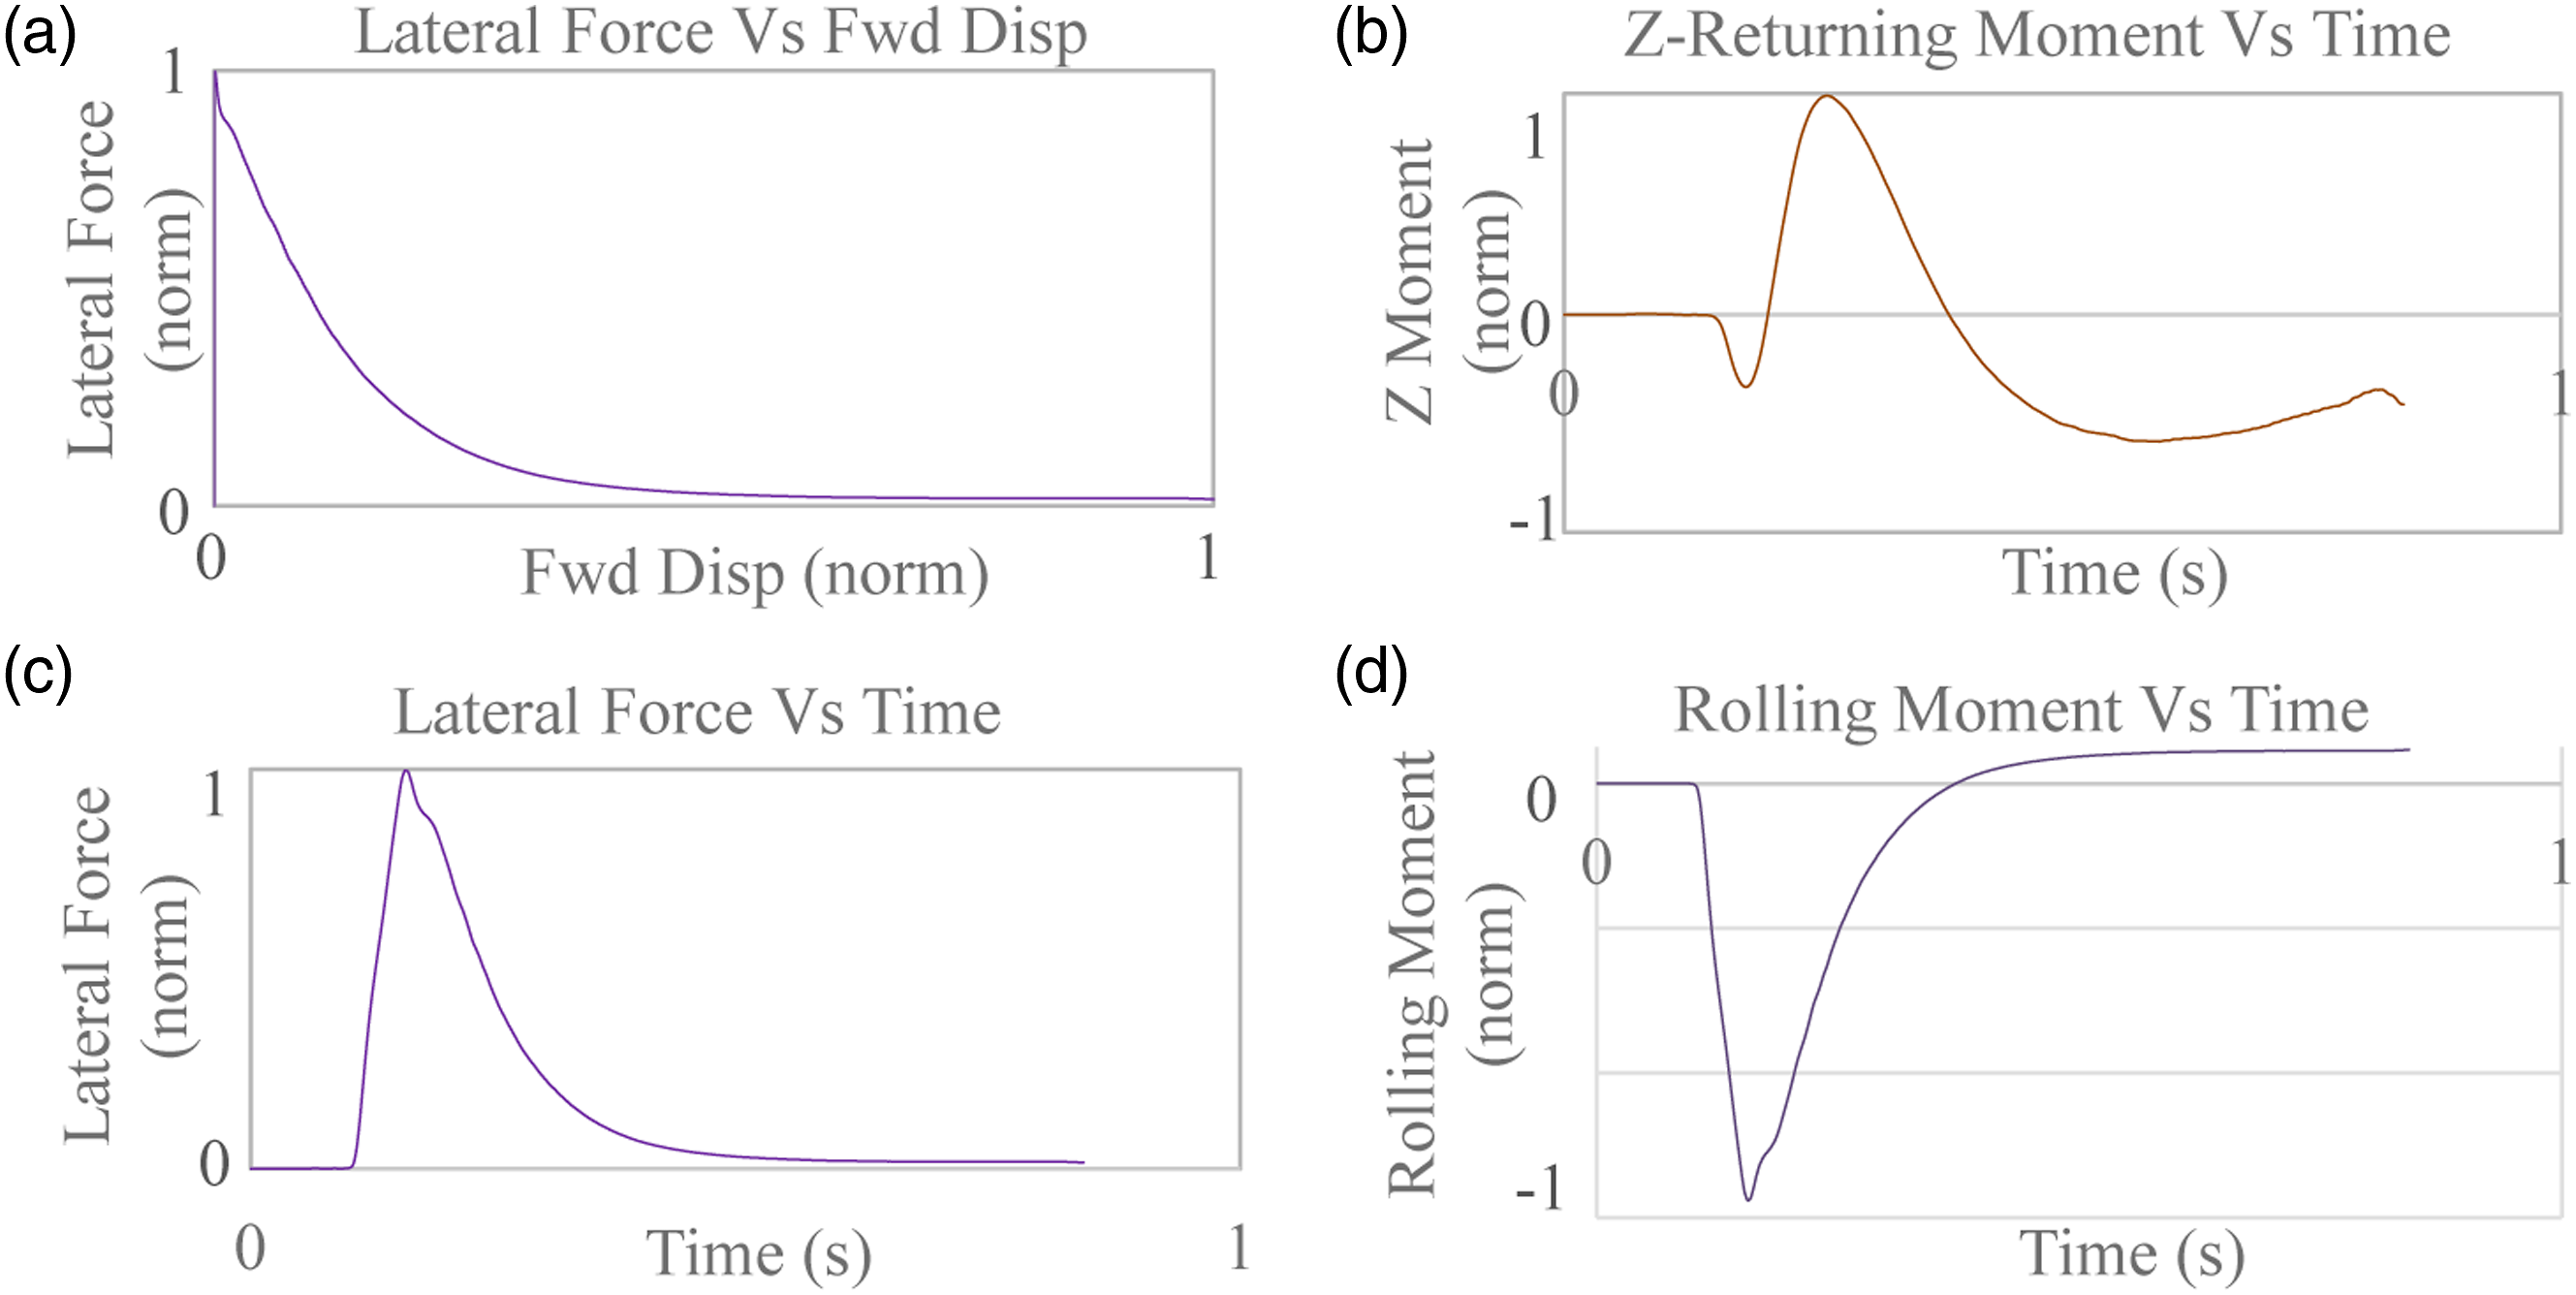
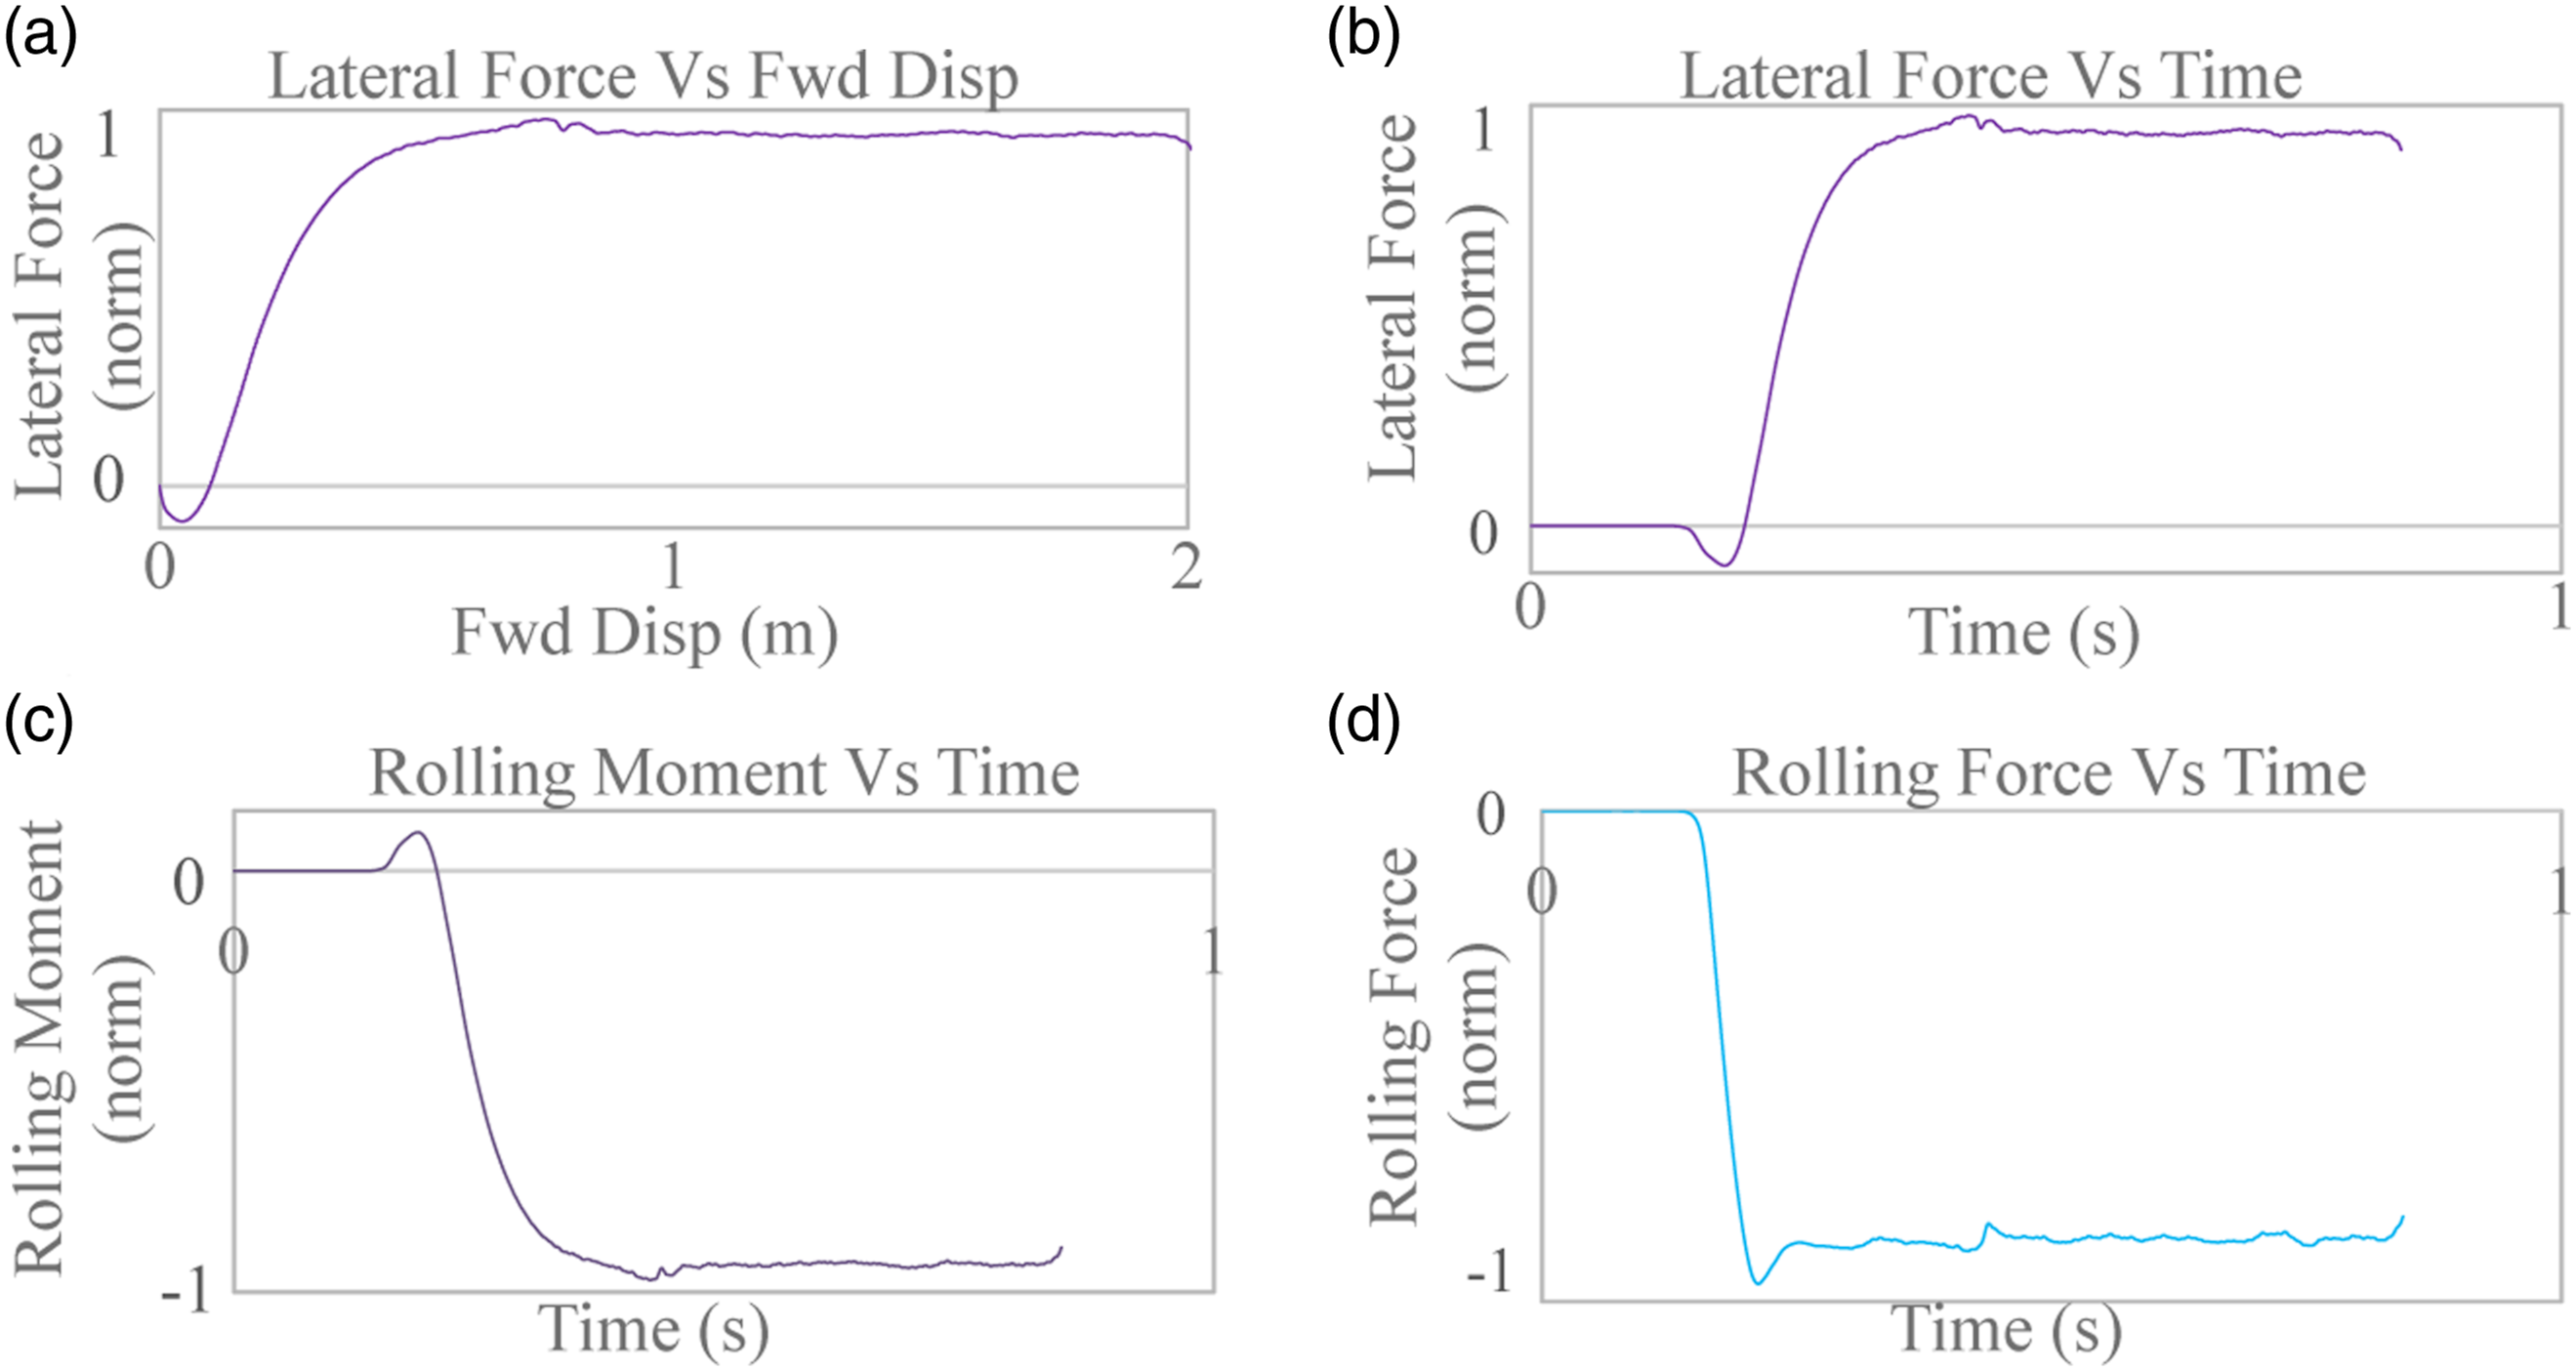
The un-yawed rolling condition was simulated to determine the relaxation length with an initial lateral deflection applied to the tyre and subsequently rolled forward. Figure 20 presents the laterally deformed tyre free-rolling in the forward direction. The representative un-yawed rolling data presents diminishing lateral force as the tyre is rolled forward (Figure 21(a)), a rise and steady fall of the returning moment (Figure 21(b)) and of the lateral force (Figure 21(c)) with the rolling moment stabilising over time (Figure 21(d)). Representative Michelin 1400x530R23 un-yawed rolling with 59 kN vertical load at 237 psi and 20 mm initial lateral displacement. Representative Michelin 1400x530R23 un-yawed rolling with 59 kN vertical load at 237 psi and 20 mm initial lateral displacement.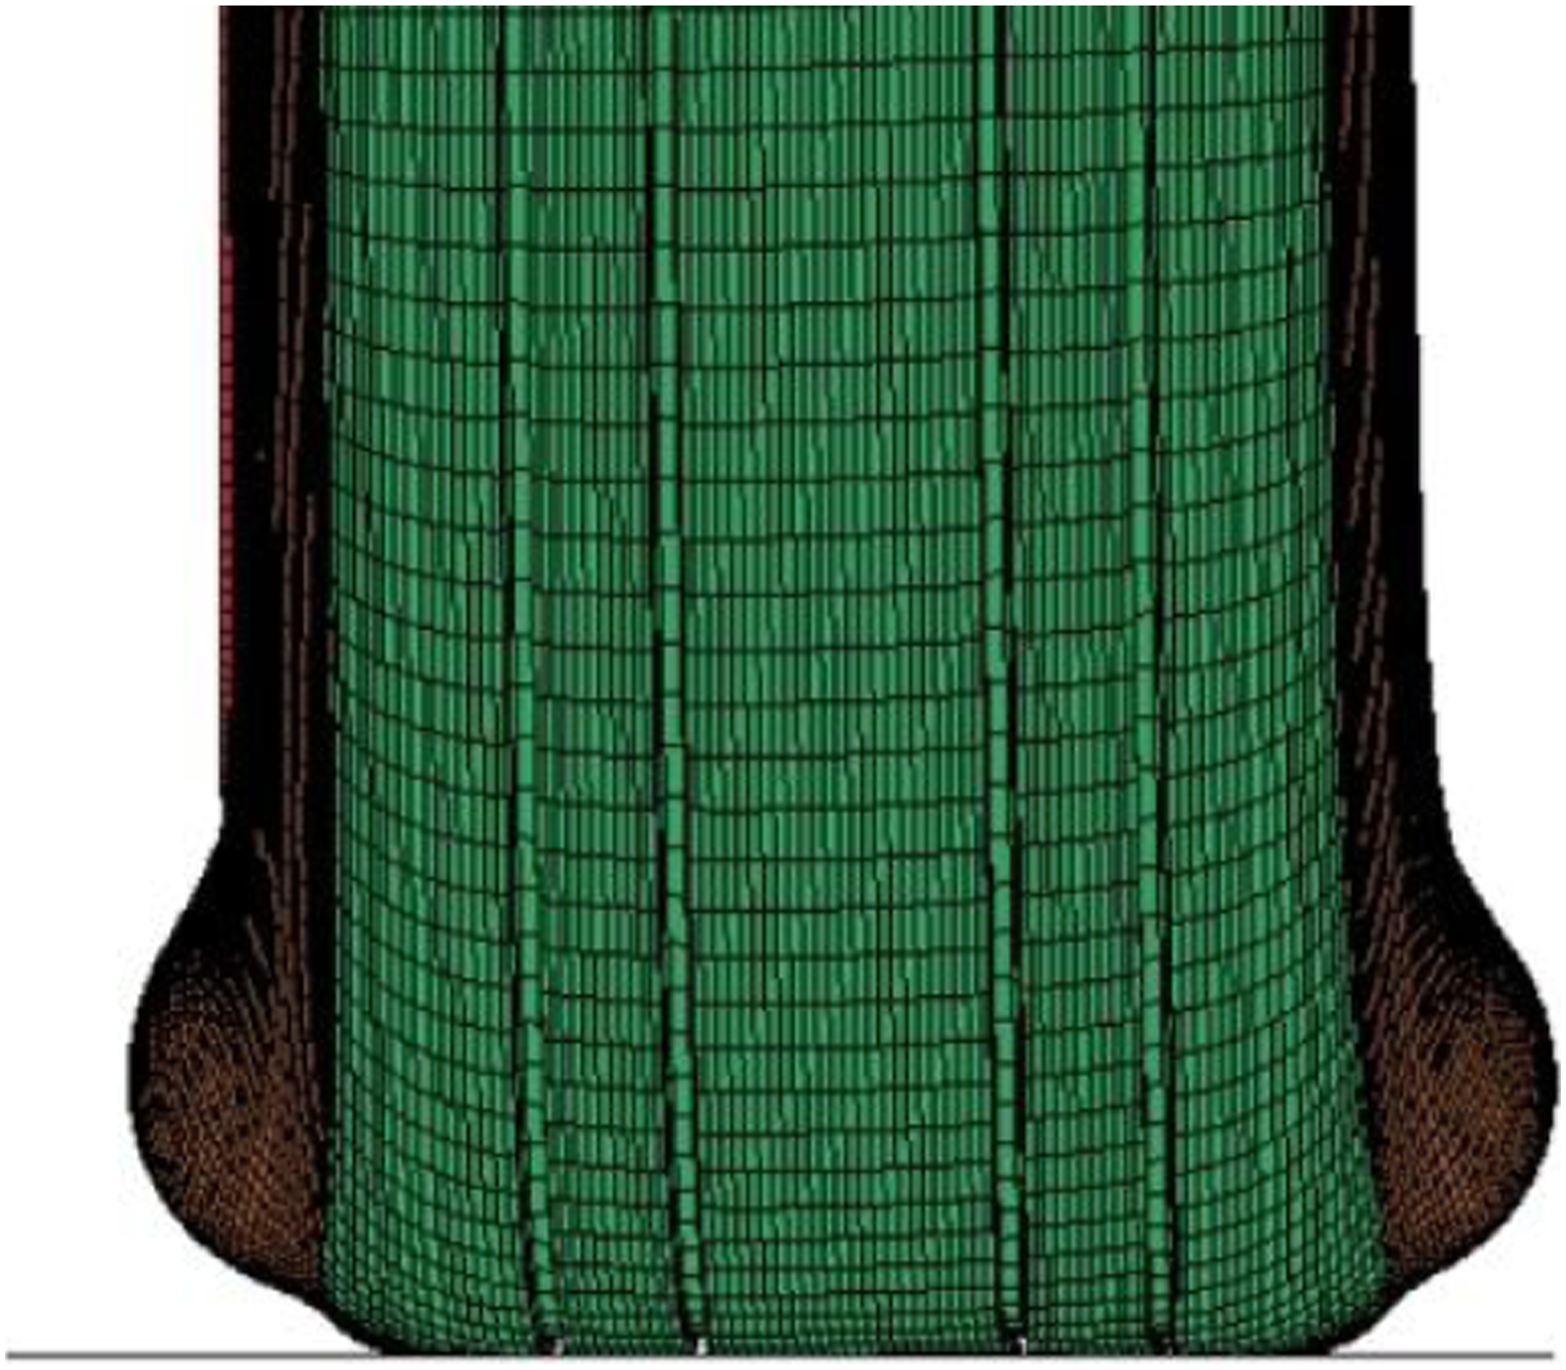
Dynamic yawed rolling
The yawed rolling condition was investigated to determine the cornering force with an initial yaw deflection angle applied to the tyre and subsequently rolled forward. Figure 22 presents the free-rolling deformed tyre rolling in the forward direction with a yaw angle of 8°. The stabilising cornering force over the increasing distance rolled (Figure 23(a)) is identical to that presented in literature.
18
Furthermore, the rolling moment (Figure 23(c)) and rolling resistance force (Figure 23(d)) stabilise once the tyre achieves a steady state rolling condition. Representative Michelin 1400x530R23 yawed rolling with 59 kN vertical load at 237 psi and 8°yaw. Representative Michelin 1400x530R23 yawed rolling with 59 KN vertical load at 237 psi and 8°yaw.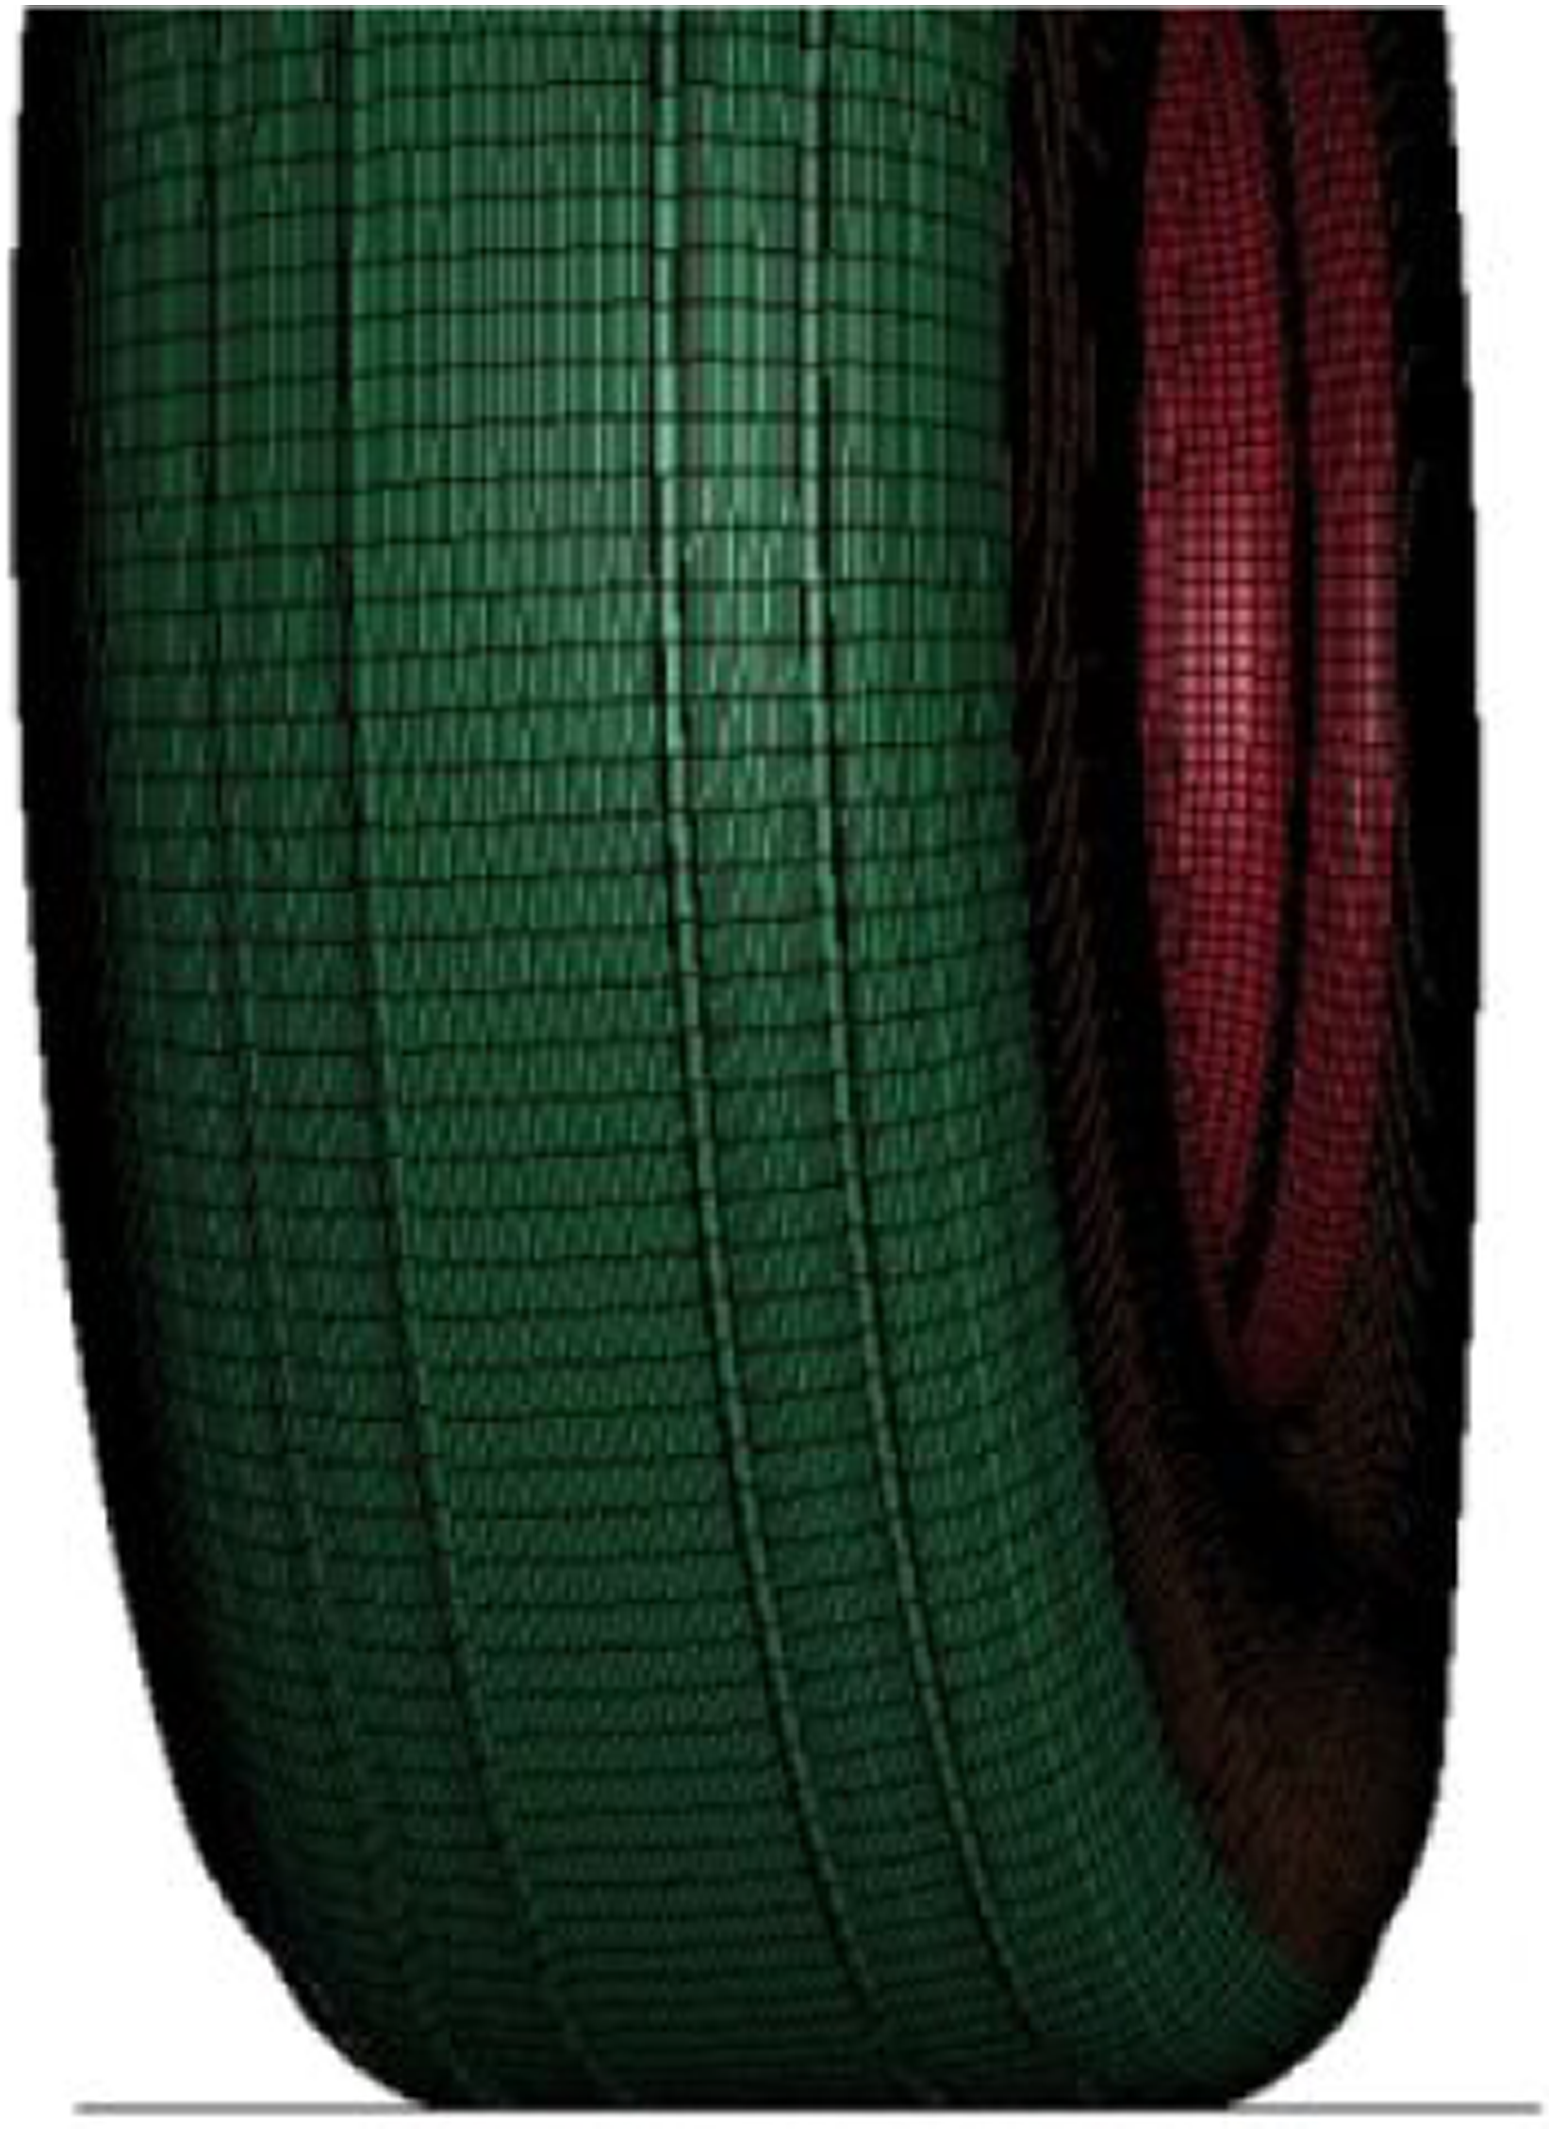
Conclusions
This work presents the simulation strategy to capture the static and dynamic response of an aircraft tyre, using the same FE model for all the scenarios and also retaining computation efficiency. The three FEA models for the Dunlop 24x7.7R10, Dunlop H38x13R18 and Michelin 1400x530R23 tyres are presented. The tyre construction, modelling methodology, material characterisation, sensitivity investigations and validation of the FEM against test data are reported. The following conclusions can be drawn from this work: • RVE calibration of the rubber compounds was essential to accurately capture the vulcanised rubber performance. • Model discretisation to capture variations in Vf and ply discontinuities provided an accurate representation of the tyre construction in a computationally efficient manner. • The stiffness responses align with the test data within a maximum error of 12% against best fit data with most cases being within 2%–3% error for the quasi-static load range considered. • The differences in stiffness and unloading hysteresis loop is justifiable considering the reduced computational effort approach. These are mainly a result of mismatched strain rate effects, target inflation pressure variations and oscillations due to rapid inflation and loading. • The tyre–ground contact area validations have a maximum absolute error ranging from 2.6% to 5.7% for the validated vertical load cases. • The FEM strategy using solid elements for the rubber and orthotropic shells for the ply reinforcements provides excellent correlation against individual test-cases and comparisons against the NACA study.
18
• Overall, the FEM approach had the correct balance of accuracy and computational effort for an all-in-one modelling strategy for generating quasi-static stiffness data and dynamic performance modelling for parameterised tyre property models.
Footnotes
Declaration of conflicting interests
The author(s) declared no potential conflicts of interest with respect to the research, authorship, and/or publication of this article.
Funding
The author(s) disclosed receipt of the following financial support for the research, authorship, and/or publication of this article: This work was supported by Innovate UK as part of the ATI programme Large Landing Gear of the Future [Grant Number: 113077] in collaboration with Safran Landing Systems and Dunlop Aircraft Tyre.