
Abstract
The aim of this paper is to analyse why and how air traffic conflicts occur as a result of the stochastic behaviour of both the ownship and the intruder and to show how system-level characteristics can be derived from such an analysis. Ensemble dynamics in a given traffic scenario have already been analysed using multi-agent simulations by many; however, such an analysis is hardly ever backed up and interpreted in terms of an analytical study. By making use of directional conflict probability maps, characteristics of integral, system-level quantities can be explained, providing further insight into the relationship of speed distribution parameters and system performance quantities, namely, safety and throughput.
Keywords
Introduction
Based on current, general aerospace trends an increase in traffic and the number of vehicles can be forecasted. According to the commercial market outlook 1 traffic will grow 4.0% annually in the next 20 years, with an airline fleet growth rate of 3.1%. Introduction and projected proliferation of Personal Aerial Vehicles (PAVs) would result in an even more intense increase for the urban airspace traffic. The rise in the volume and concentration of traffic leads to vehicle densities never seen before.2,3 This changes traffic management, causes airspace to expand and requires new principles for its traffic control system. 4 Even with the recent social and economic changes, forecasted annual growth for the urban air mobility market is between 12% and 33.9% for the 2022–2050 period.5–12 Although the current market research results show significant diversity (from a $6.9 billion market by 2030 5 to a $9 trillion market by 2050 6 ), the fundamental need for these services does not seem to have changed, and the market growth predicted is significant.
Urban air mobility is defined by NASA as ‘a safe and efficient system for air passenger and cargo transportation within an urban area, inclusive of small package delivery and other urban Unmanned Aerial Systems (UAS) services, which supports a mix of on-board/ground-piloted and increasingly autonomous operations’. 13 Due to the insufficient scalability of currently used Air Traffic Management (ATM) methods,14–16 novel coordination methods are necessary, otherwise high-density operations ‘will stress the current ATM system’. 17 Currently applied methods in ATM are not scalable, because they rely on human involvement for deconfliction, voice-based communication and a structure unsuitable for separation for UAM vehicles. Such systems cannot handle the number and density of operations predicted for UAM. Air traffic control was identified as a major scaling constraint for urban air mobility operations. 14 The traffic management system for the future has to be able to accommodate unpiloted aircraft with high density, keeping or even exceeding the safety level of traditional ATM techniques.
This traffic management system is envisioned to encompass a spontaneous, self-organising, distributed, in-flight strategic deconfliction method. This is aligned with the proposed self-configuration, self-optimisation, self-protection and self-healing properties of UTM. 2 The method being spontaneous, self-organising and distributed comes from the predicted density of UAM operations. A centralised entity with the additional constraints would not be able to handle this density efficiently, due to poor scalability. The most relevant scaling constraints are communication, the type and the duration of operations, and the number of operations that can be handled by a single controller. This is why the fundamental operational concept for UTM relies on a distributed information network of interoperable, highly automated systems. 16 Otherwise, controller workload limitations and separation minima would lead to limited-scale operations, which may not be economically feasible. 14
To preserve the necessary flexibility and the ability to react to deviations from plans, the method applied needs to be in-flight and online. Considering that the number of aircraft that can be handled by tactical technical means (e.g. TCAS, ACAS Xu) is only a few, it is essential to have airspace coordination at a higher level. This is demonstrated by the current paper as well as a recent publication on the topic. 18 The exact formulation of a traffic coordination method for UAM remains an open research question. As explored in the literature review, urban air mobility traffic management methods include offline scheduling, subliminal speed control similar to ATM, manoeuvre coordination, computational guidance and deconfliction using optimisation. This paper aims at contributing to the research towards a scaleable traffic management framework by analysing a system that can be used to coordinate global ensemble dynamics and limit the probability of dangerous intrusions. The technique is based on a distributed algorithm.
Within the scope of this paper, the free flight concept is adopted. 19 Based on this, a decentralised and autonomous traffic management framework is developed. The proposed architecture has a hierarchical, human-over-the-loop structure similar to the one proposed by Valavanis. 20 The overall goal of the framework is to integrate low-level tactical avoidance methods with high-level optimal coordination to improve throughput. This shall be achieved while also providing probabilistic safety margins by limiting the probability of conflicts and the number of occasions tactical avoidance is triggered. All aircraft are assumed to be cooperative. To enable distributed decision making, all aircraft share their state data with others within their communication range via a protocol similar to ADS-B. The proposed framework is built-up of 3 + 1 layers, the top layer being the human supervisor, who monitors the system and intervenes when necessary.14,15 Detailed human factors analysis however is beyond the scope of this paper. The lowest of the three conventional layers handles one-to-one collision avoidance, based on well-established methods. Also, to increase airspace capacity, aircraft create ad hoc formations based on similar heading, leading to clusters. 21 Common heading can be agreed on, for example, by using consensus techniques. 22 Dynamics within the cluster can be controlled by group flight algorithms. Control of collective motion of multi-agent systems may also be based on continuum mechanics. 23
Instead of trying to minimise the number of intrusions, their probability is managed so that conflicts can be resolved should they occur. It is assumed that an intruder can be avoided by the ownship given enough time to react and manoeuvre. One-to-one avoidance is managed by the lowest layer. The time necessary for an aircraft pair to resolve conflicts depends on aircraft performance characteristics, navigation uncertainty, communication latency and other factors. The purpose of the time threshold is similar to the purpose of separation distances in traditional sense and avoid systems. Since not all aircraft have the same characteristics in terms of dynamics and equipage, it is meaningful to consider different separation limits. 24 Also, a sufficient amount of clear airspace is needed to perform the avoidance; hence, it is meaningful to control global intrusion probability, and through that influence airspace complexity. In the current paper, the conflict time threshold is defined based on the expected separation limits for UAM vehicles, their characteristic speeds and yaw dynamics. How the time threshold can be selected and a sensitivity analysis can be found in a previous publication on the topic. 25 The exact relationship between dynamics, equipage and conflict time thresholds should be subject to future research.
This paper focuses on the dynamics and modelling of the middle layer, bridging the bottom and the top layers by applying a bottom-up analysis method. To investigate the effect of parameter changes on the system of aircraft, multi-agent simulation results are used. These are discussed in detail in terms of analytical calculations. With the appropriate combination of methods, further insight can be gained into the underlying dynamics; thus, simulation results can be put into context. The aim of this paper is to calculate system-level metrics for conflict probabilities (without resolution methods) for aircraft in a free flight environment. In this free flight environment, all agents have a speed according to a prescribed distribution (following guidance from the middle layer of the proposed framework).
In the proposed framework, the middle layer is distributed and stochastic by design. The reason for choosing a stochastic method is the robustness advantage. 26 Certain stochastic methods have a ‘self-repair’ property. This means that when perturbed, the system returns to the original, prescribed state without coordination. The distributed system property is essential from a scalability point of view. It is assumed that nominal heading angle and altitude are given by the flight plan (start and destination point). Heading and altitude changes are reserved for this layer. Therefore in the middle layer, the speed is manipulated only.
The aim of the middle layer is to regulate ensemble dynamics so that the probability of collision avoidance being triggered is sufficiently low, thus preserving airspace stability and preventing the domino effect. 21 The domino effect, an indicator of airspace stability, was defined as the event when deconfliction ‘propagates into causing a subsequent conflict with three or more aircraft before the conflict can be resolved’. Therefore, if the number of times conflict resolution is necessary can be reduced, the risk of the domino effect can also be reduced. Another factor to decrease the risk of domino effect is to keep conflict scenarios simple and reduce the number of difficult to solve encounters. 27 The middle layer should be able to shift the encounter probability towards conflicts with fewer aircraft. The practical value for tolerable risk and the method to determine that is outside the scope of this paper. This is ultimately a regulatory question. As a guideline, the SORA methodology (and appendices) may be used. 28 SORA derives the relationship between overall risk and operational safety objectives.
With the increase of air traffic, the operational complexity is expected to increase exponentially. 3 To this end, a distributed stochastic task allocation algorithm 29 is employed, which drives agent behaviour distribution (speed, within the scope of the current paper) to a predefined distribution. This algorithm has been used previously by the authors in the context of multi-agent simulations. 25 The desired distribution is defined in terms of a few parameters, which can be regarded as decision variables. The aim of the top level is to optimise a cost function by tuning these decision variables. Within the scope of this paper two distributions, the exponential and the normal distribution are investigated. The normal distribution can be thought of as an ordinary traffic flow with an inherent perturbation. The distribution of en-route ground speeds resembles a normal distribution. 30
In some exceptional circumstances, if privileged vehicles with higher speeds are present, it may be better to switch to exponential prescribed distribution. This is because exponential distribution generally enables higher, more extreme speeds with higher probability which emergency vehicles can deterministically occupy. Other vehicles would adapt to maintain the desired distribution, creating a self-optimising capability. 2
Since the aim of the middle layer is to decrease the probability of a collision avoidance manoeuvre being necessary, to measure its effectiveness, the notion of speed conflict is introduced. Around the ownship two regions are defined. The outer one is the sensing range
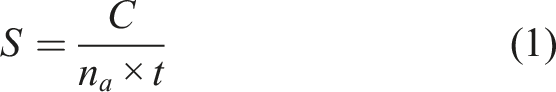
Metrics measuring the effectiveness of the middle layer are safety and throughput. Safety is defined as the probability of a speed conflict for all aircraft with any other aircraft and calculated according to Equation (1). In Equation (1), C is the number of conflicts during a given time period, n
a
is the number of agents in a given area and t is the length of the investigated period of time.
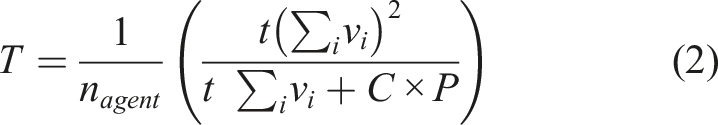
Throughput reflects on the mean speed of agents, taking into account that avoidance manoeuvres to resolve conflicts lengthen routes, leading to longer travel times. In Equation (2), n
a
is the number of agents in a given area and t is the length of the investigated period of time, C is the number of conflicts during a period, v
i
is the speed of the ith agent and P is the avoidance manoeuvre related penalty.
Applicability and performance of several stochastic task allocation methods in terms of distribution distance and transient characteristics were previously analysed using multi-agent simulations.
25
These algorithms can be used to drive an ensemble to a given probability distribution.
26
It was also shown by Jang et al.
29
that organisation is possible using only local information. Application of these methods in a multi-agent simulation environment can reveal the relationship between distribution parameters and performance metrics
The paper is structured as follows. Related research is summarised in the section Literature review. Calculations corresponding to directional quantities are presented in the Directional quantities section. Parameter dependence of integral quantities is derived in the section Integral quantities. Concluding remarks are drawn and future work is summarised in the Conclusion section.
Literature review
Traffic management for urban air mobility has been a subject of extensive research. Generally, suggested methods rely on improved scalability of traditional ATM methods or attempt to use novel UTM methods for UAM. 31 This research area shows significant variety regarding definitions, modelling and solution approaches and the level at which the problem is addressed. Aerial conflicts and deconfliction by optimal planning and scheduling, both in ATM and for UAS and UAM has been investigated in several papers.32–34 Airspace design in an urban setting is also a topic of interest.35–37 Improvement of collision avoidance methods 38 and computational guidance methods could also support the introduction of UAM. In the following, we review selected papers to provide an overview of ongoing research efforts.
An overview of collision detection and resolution is given by Kuchar and Yang. 39 A taxonomy of algorithms is provided based on the conflict detection (decision) definition and several other characteristics. The method for intruder state propagation can be nominal, worst-case or probabilistic. The state dimensions considered can be horizontal, vertical or both. The conflict resolution methods listed are prescribed, optimised, force field and manual. The potential resolution manoeuvres considered are turns, vertical manoeuvres and speed changes. Methods can also be classified according to how multiple conflicts are resolved. Different algorithms can consider all potential conflicts resolutions at the same time (global approach) or handle the problem as a sequence of pairwise deconfliction tasks (pairwise approach). The paper also describes the process of system design form as a series of the following steps. The process starts with choosing assumptions on aircraft motion and environment, trajectory modelling and threshold selection, based on which the method is synthesised. Performance is evaluated by simulations, possibly with fault injection, which also enables tuning of parameters till the number of incidents and false alarms can be balanced. A development step is to consider a probabilistic trajectory model. Following the taxonomic categories, the method presented in the current paper uses probabilistic state propagation in the horizontal plane. Detection threshold selection and resolution and manoeuvres available can be set according to the performance of the underlying resolution method. A key improvement of the method presented is that it takes into account information on global dynamics, thus enabling setting parameters a priori, based on a mathematical formulation, rather than after a simulation study.
Conflicts are detected by the SLIDE algorithm 40 assuming aircraft fly according to a straight-line path, with constant velocity. Conflicts are defined as an overlap between protected zones and detected by calculating the closest point of approach. State information is periodically exchanged. The effect of the selection of the broadcast cycle and look-ahead time is analysed by simulations. Packet losses and resulting errors in state information are also taken into account. Performance is analysed in terms of missed and false alarms. Time-averaged simulation results characterise capabilities appropriately; however, the directionality of conflicts is not analysed.
For UTM to remain scalable, safe and efficient, the overall goal of traffic management is not to minimise the number of potential conflicts, but to reduce the macroscopic complexity of the airspace so that it remains manageable. By combining 4D trajectory optimisation and flight planning an encounter aware flight planning method for free flight can be created. 27 To assess the performance of the method a multi-modal traffic region is simulated. Results show that multi-aircraft encounters cause disproportionately more near mid-air collisions, thus minimising the encounter shift (distribution distance from reference encounter distribution), and through that, the complexity of encounters is proven to be an appropriate control aim.
The method described in this paper relies on the offline scheduling of traffic. Scheduling requires significant computation a priori, that is, before aircraft take-off. Since the schedule is calculated a priori, the method cannot react to real-time disturbances or deviations from plans. This is because all decisions are made and fixed before any practical divergence occurs. Therefore, its resilience in itself is questionable. To compensate for inherent deviations and to handle off-nominal situations, an online method needs to be applied. The strategic and tactical functions in a proposed autonomous ATM system are summarised by Windhorst et al. 41 The method presented by Egorov et al. can be used for strategic scheduling, combined with an online, tactical system, which incorporates feedback. Online coordination methods can use real-time information to drive the system back to the prescribed state after a perturbation. The study was later extended by a stress testing and validation framework. 42
For real-time collision avoidance, velocity planning can be applied effectively. 43 By discretising the airspace and creating a cubic grid, trajectories can be shared efficiently as residence times in a given cell. Conflicts are identified as overlaps in residence times. For velocity planning and deconfliction, a heuristic algorithm based on the combination of the search tree method and tabu search is proposed. The main advantage of the method presented is that it disturbs trajectories as little as possible while taking into account the constraints imposed by the dynamics model of aircraft. The result however relies heavily on the availability of global information, which may lead to issues with scalability. Moreover, the method cannot guarantee a solution for all scenarios or avoid situations where a solution is not possible. Nevertheless, research findings suggest that velocity control is an effective method to globally coordinate aircraft to avoid collisions, similarly to the velocity control applied in the current paper.
Subliminal speed control is shown to effectively reduce both the number and duration of conflicts, even in the presence of aircraft speed perturbations. 44 For speed regulation to remain subliminal for ATC, and because of aircraft dynamics and passenger comfort, only a narrow speed range is used. The paper also highlights that with the development of flight management systems the importance of speed control could increase. To minimise ATCs’ workload, conflict resolution is formulated as a nonlinear optimisation problem. The objectives are to minimise the total conflict duration or to maximise the number of conflicts resolved. The separation equations are linearised to enable a mixed integer program solution. To facilitate the solution, the problem is solved for simplified aircraft dynamics. The results, however, are validated with a realistic performance model, also taking into account uncertainties. The method can be applied by solving the problem periodically with a rolling horizon.
Manoeuvre coordination is also proposed to be used as a collision avoidance method for a high traffic density environment. 45 The technique presented is applicable for fixed-wing aircraft. The set of possible manoeuvre styles is constrained to nine possibilities. The proposed algorithm is composed of five modules: manoeuvre generation, trajectory prediction, threat management, manoeuvre evaluation and manoeuvre activation. In manoeuvre generation, each agent chooses three of the nine available styles, for these choices the trajectories are predicted in the trajectory prediction module. Trajectory errors and uncertainty is taken into account as a conical region. In the threat management module, the three most imminent threats are identified according to a combination of relative distance and relative speed. Combinations of selected manoeuvres are evaluated (using shared information between participants) and activated at the last possible moment to minimise disruption, preserve airspace stability and avoid interference. Even though the principle of noninterference is respected, the effect of conflict resolution on the wider airspace is not analysed. Also, no guarantee is provided that with the constrained set of avoidance manoeuvre styles potential conflicts can be avoided. Although manoeuvre coordination was recently proposed as a collision avoidance method for UAS it still requires significant research to become practically applicable.
Another example for manoeuvre coordination can be found in a paper by Tompa et al. 46 The research focuses on horizontal manoeuvre coordination as it is more relevant for unmanned aircraft. The key hypothesis is that a coordination scheme and agreement between aircraft enhances safety beyond what individual collision avoidance systems can achieve. The problem is modelled as a Markov decision process, using a master-slave approach. The states are relative range, azimuth angle, relative heading angle, speeds and whether aircraft are responding to their advisories. The state space is discretised. The action space is also discretised and contains the possible bank angles. Rewards are negative and are related to NMAC (near mid-air collision), proximity, manoeuvres and the strength of manoeuvres, and can be used to balance safety and efficiency. Only pairwise encounters are considered. The optimal policy for the MDP is determined using dynamic programming. Using the score table a coordination table is created, which contains whether the aircraft should perform the same or opposite actions. These coordination tables can be stored onboard. Coordination message relaying schemes, alternative coordination table generation methods and nonjoint action policies are also investigated. The safety benefit of the method is demonstrated by simulations. The results of the paper demonstrate how manoeuvre coordination can be applied in the future and highlight the difference between pairwise deconfliction and deconfliction in high-density airspace with complex conflicts.
The stochastic nature of air traffic and its effect on collision avoidance is widely researched. Path deviation can be taken into account by calculating the probabilistic reach sets of aircraft formulated as a chance-constrained optimisation problem. 47 The problem can be solved by the scenario approach. The nominal trajectory of aircraft is piecewise linear, which is then perturbed by the stochastic wind. Conflict is defined as an overlap of the ellipsoidal reach sets with a probability higher than a threshold. The resolution assumes spherical reach sets and is reformulated as a second-order cone program. Granted that a stochastic framework improves resilience since the method applies to a specific scenario its performance can only be analysed using simulations. Thus, no global performance metric can be determined, as results are not universal.
Mathematical models for air conflict and collision probability estimation are given by Mitici. 48 Based on mathematical formalism, models can be compared within a unified framework. Safety risk and validation models are also surveyed, creating a hierarchical description, reflecting on their practical applicability and analysing their characteristics. None of the models, however, can describe system-level dynamics of safety and throughput or use model results to deduce characteristics of emergent ensemble dynamics.
Results in the field of operations research have also contributed to the advancements in conflict detection and resolution. The application of decision support tools in ATM is necessary because of the increasing volume of flights. The emergence of urban air mobility is only going to exacerbate the problem. A survey of advancements and a unified mathematical framework is given by Pelegrín and D’Ambrosio. 49 A taxonomy of methods is proposed based on several characteristics, for example, the objective function, the type of model and the type of manoeuvres permitted. Commonly used benchmark scenarios are also outlined. It is noted in the paper that the number of aircraft that can be handled is still limited to several dozens. This is still below the expected number and density of UAM operations. Also, for practical applicability, a larger set of features needs to be considered. Benchmarks including these should also be developed.
Conflict probability can be calculated based on intent. 50 Aircraft trajectories are predicted in a probabilistic manner, using a hybrid dynamics model. The set of flight modes is finite, flight mode intent can be inferred from reported data and utilised for prediction. Conflict probability is calculated by integrating over the conflict zone. During the calculations, only one aircraft is behaving stochastically, due to wind and measurement uncertainty. Within the scope of the current paper, both aircraft are behaving stochastically, according to a predefined distribution.
Emergent behaviour due to the interaction of individual systems is modelled and analysed in free flight safety modelling and simulation. 51 System dynamics are modelled as a stochastically and dynamically coloured Petri net, collision risk is estimated by running Monte Carlo simulations. The analysis is performed in a free flight scenario, which creates a distributed flight control architecture. The aim is to understand the relationship between safety and capacity. Conflict resolution is based on a modification of the potential field method. Results of the analysis show that with the current commercial air traffic density the probability of multiple aircraft conflicts is very low, however, with increasing density it rapidly increases. Traffic densities analysed are much lower than the ones forecasted for urban air mobility.
A self-organising, decentralised method for air traffic can be formulated in 3D. 52 The number of indirect conflicts is expected to rise with air traffic density, deteriorating performance in terms of reliability, efficiency and capacity. Conflicts are detected using relative kinematics, knowing all aircraft intentions, with a safety sphere around each agent. Conflict resolution is formulated as a constrained optimisation problem, either by controlling velocity only during nominal operation or by changing velocity, heading and flight path in emergency scenarios. A distributed, self-organised capability for airspace management can lead to increased performance. Nevertheless, the need for intent information from all other aircraft can be prohibitive on scalability.
Self-organising can also be achieved by extending the Reynolds rules of flocking 53 for autonomous swarm flight collision avoidance. The optimised flocking model consists of the following forces: repulsion, velocity alignment, flock centring, force towards flight target and an additional anti-collision force. The anti-collision force is calculated in a pairwise manner, based on the closest point of approach, by linear extrapolation of the paths. The performance of the method is analysed using simulation, taking into account scenarios where conflict resolution may lead to a domino effect. The technique operates appropriately for the simulated scenarios. However, no evidence is provided for its practical applicability. It would also be important to analyse the limits of the method in terms of the number of aircraft handled, the complexity of the encounter scenario, communication requirements and the solution time. This could help to assess the potential of the technique.
The detection and resolution algorithm of the Traffic Collision Avoidance System (TCAS), the last resort means to reduce collision probability can be modelled using mathematical tools. 54 Moreover, the method is extended with the option of horizontal resolution; thus, multi-aircraft conflicts can be handled better. Using the causal encounter model, developed in a graphical modelling and analysis software, the effect of surrounding aircraft, induced collisions and the domino effect (secondary threats) can be analysed and avoided. While the method can be efficiently used to analysed the downstream effects of an issued resolution advisory in a given encounter scenario, no general conclusion can be drawn regarding global airspace dynamics or airspace stability.
TCAS resolution advisories can lead to induced collisions and induced secondary threats, which need to be analysed. 55 It is understood that increasing traffic densities would lead to potential collision situations. Encounters are modelled using the coloured Petri net formalism, which is then simulated to create a scenario database. This database can be used as a reference in real scenarios also aided by pattern recognition. It is understood from simulations that the TCAS logic can induce collisions, especially in dense traffic, in multi-aircraft scenarios. These densities are much higher than the design density of TCAS; however, the study illustrates why it is important not to focus on individual conflicts, but to control global dynamics in a high-density scenario.
Deconfliction for a free flight aerial sector can be achieved using a combination of speed and altitude changes. 24 This problem can be solved as a mixed integer linear optimisation, seeking to have an equilibrium number of manoeuvres for each aircraft. The paper also describes the advantages and disadvantages of speed and altitude changes. False conflicts and pathological cases can be treated with the proposed formulation. The method is verified by case studies, showing that the solution can be quickly calculated.
Using subliminal speed regulation during a time window for aerial deconfliction was explored by Cafieri and Durand. 56 The problem is modelled and solved as a mixed integer optimisation, the objective of minimising aircraft speed modifications while achieving deconfliction. The performance of an exact solver is shown to deteriorate with the increasing number of aircraft. Therefore, a heuristic based on local exact solutions is proposed, since generally, only a small group of aircraft get potentially in conflict. Using the heuristic, the results have good quality for medium-sized problems. The paper highlights the applicability of subliminal speed regulation in deconfliction.
Conflict resolution is also treated as a mixed integer linear programming problem by Cecen and Cetek. 57 Conflicts are resolved by changing entry points and speed before entering an airspace block because speed changing was identified as the best long-term resolution strategy. Aircraft motion is presumed to be deterministic for a one direction traffic flight level; thus, critical crossing points can be calculated, enabling space discretisation. Minimum separation is defined in terms of time. The set of possible airspeed values is also discrete. For efficient computation, a heuristic model is presented, which produces near-optimal solutions in a reasonably short time. However, the algorithm cannot take into account path or speed deviations and contains no feedback; therefore, its robustness is questionable. Also, the method needs a central entity to perform coordination.
New formulations for mixed integer programming are presented by Dias, Hijazi and Rey. 58 It is shown that disjunctive linear separation conditions are equivalent to traditionally used nonlinear separation conditions. The disjunctive linear separation conditions are nonconvex, so convex relaxation is applied. In 2D, speed and heading changes are both permitted (with preference weighting), and flight level changes are also available after extending the solution with lexicographic optimisation. The method is demonstrated to be scaleable by applying it to several benchmarking problems. It is reported that 87.8% of problems are successfully solved. The method shows promising results and could be adapted for different airspace environments, for example, urban air mobility.
As an alternative to mixed integer optimisation methods ant colony optimisation was proposed by Durand and Alliot. 59 In their seminal paper, they managed to solve problems (in the circular benchmark scenario) for up to 30 aircraft. Manoeuvres are modelled as heading changes and return to the original path. Each aircraft is represented as an ant colony, and a probabilistic optimisation method is used to optimise trajectories. The paper shows the potential for the use of probabilistic methods for deconfliction. However, no results for realistic simulation scenarios are presented.
A collision avoidance method for cooperative UAV clusters can be formulated by employing the complex network algorithm. 60 An important advantage of the approach is that only one resolution is necessary at a time, instead of a sequence of manoeuvres. Conflicts are detected for a given scenario by path extrapolation, based on which the network model can be constructed. For resolution, the key node is selected, and the sense is determined as a solution of an optimisation problem. The objective cost takes into account the number of intruder designated directions, network robustness and the connected component. It is assumed that by minimising the cost the domino effect is also reduced. To apply the method outlined, it is necessary to have global communication between all UAVs and global information needs to be instantaneously available, therefore the practical scalability of the method remains in question.
Using rolling optimisation and predictive state space an efficient collision prediction and avoidance method can be formulated. 61 The airspace shared by all aircraft is divided into cubic cells, and time is discretised to time steps to enable efficient computation; thus, the set of available next waypoints is also limited. The next waypoint is selected according to the roulette method, while also taking into account distance to the goal and heading deviation. Conflict free trajectories are generated by iteration and shortened by using rolling optimisation, minimising flight distance. The algorithm is capable of handling several aircraft at the same time and resolving multiple aircraft conflicts. A weakness of the method is that it needs a central entity with global information to perform the computations, which may be prohibitive as the number of aircraft increases.
A metric to characterise the airspace, complexity is investigated by Koca. 62 Trajectories are defined as a series of 4D waypoints. Based on these, a hierarchical method is outlined to define clusters by identifying relevant aircraft according to spatio-temporal boxes. Also, an ecosystem structure is introduced, taking into account the possible manoeuvres. Simulation results show a shift towards ecosystems with more members in a futuristic traffic scenario. Taking into account ecosystem interdependencies a better insight can be gained to understand underlying airspace dynamics. The definition of complexity and the calculation method presented may help air traffic control officers understand a situation better and resolve conflicts more efficiently, but provides no aid for airspace design.
Global, aggregate, system-level dynamics are usually modelled using macroscopic fundamental diagrams for ground vehicles. The existence of MFDs was demonstrated experimentally, in a large urban area by analysing data gathered. 63 Using the MFD, gating regulators can be designed to improve mobility. 64 Since the basic dynamics of the system are given by the MFD, robust feedback regulators can be designed, which can reduce overall, system-wide delay. An optimal solution for perimeter flow control is given by Aalipour. 65 The paper derives a heterogeneous two-region model, with perimeter controllers as a way to influence traffic flow between the regions. The optimal control policy is derived using Pontryagin’s maximum principle and the Hamilton–Jacobi–Bellman equation and solved by the Chebyshev pseudospectral approach. The paper demonstrates how, if the macroscopic dynamics are appropriately modelled, it is possible to maximise the number of vehicles arriving at their destination within a given time period. This underlines the necessity and importance of the research presented in the current paper.
Reviewing the related literature shows the extent and depth of research into conflict resolution for aerial vehicles. However, no analysis was yet performed to assess how conflict avoidance manoeuvres affect global, system-level characteristics in a stochastic environment. The aim of this paper is to address this issue. It should also be emphasised that the method presented and analysed can be implemented in a distributed manner, unlike any of the methods reviewed.
Directional quantities
To better understand how air traffic conflicts occur in the proposed framework for global ensemble dynamics coordination, directional conflict distribution according to approach angle is calculated using an analytical method. The technique has been previously used by the authors to create the directional probability maps. Full and truncated exponential and normal distributions were defined as prescribed speed distributions for the ownship and the intruder.
It is assumed that there is a range around the ownship within which it can sense an intruder, this is the sensing range
Conflict probability distributions according to the angle where the intruder is sensed on the sensing range
Geometric conflict probability can be calculated according to the following derivation. Both the ownship
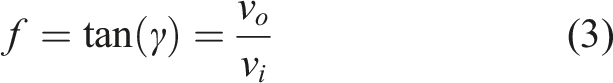
The ratio of velocities is defined as Equation (3).
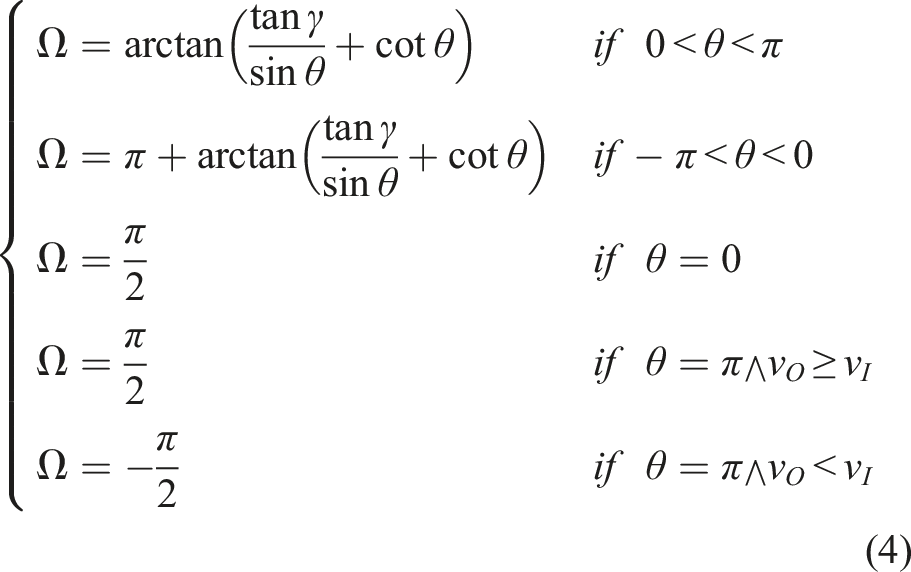
The probability distribution of the apparent path angle
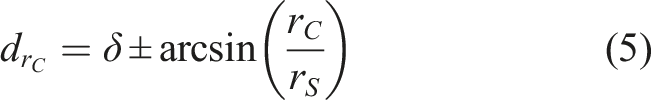
This can then be compared to the angular diameters related to conflict, defined based on the angle corresponding to the conflict range from the entry point on the sensing range. Angular diameter is defined according to Equation (5).
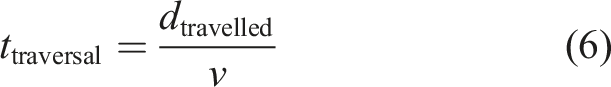
To simplify calculations, the tangent of both sides is taken. For speed conflicts, the traversal time from the sensing to the conflict range is also taken into account as intrusions are considered conflicts if the traversal time from the sensing range to the conflict range is less than a threshold

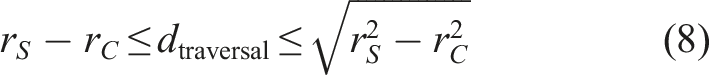
Since the integral corresponding to the actual traversal time cannot be evaluated, a lower and upper approximation is applied (Equation (8)). Also, the integration region is transformed from polar to Cartesian coordinates.
Previously, calculations were based upon the assumption that the probability of appearance of an intruder on the sensing range is uniform. However, in real flight scenarios, this might not be the case. Therefore this assumption is relaxed. Within the scope of the paper, it is assumed that aircraft have a uniform position distribution, which was determined to be the safest. 68
The position of potential intruders is taken relative to the ownship as x and y, in a right-handed coordinate system aligned with the ownship heading. The position can also be given by polar coordinates as
As an example, for perpendicular intruders
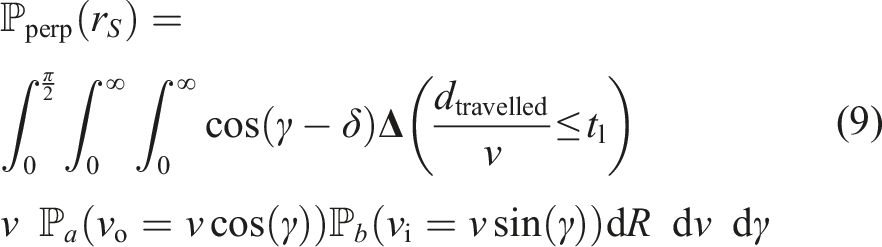
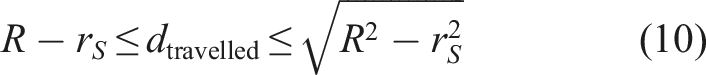
The distance travelled
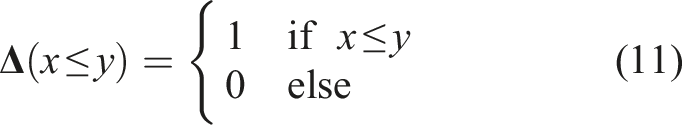
The function
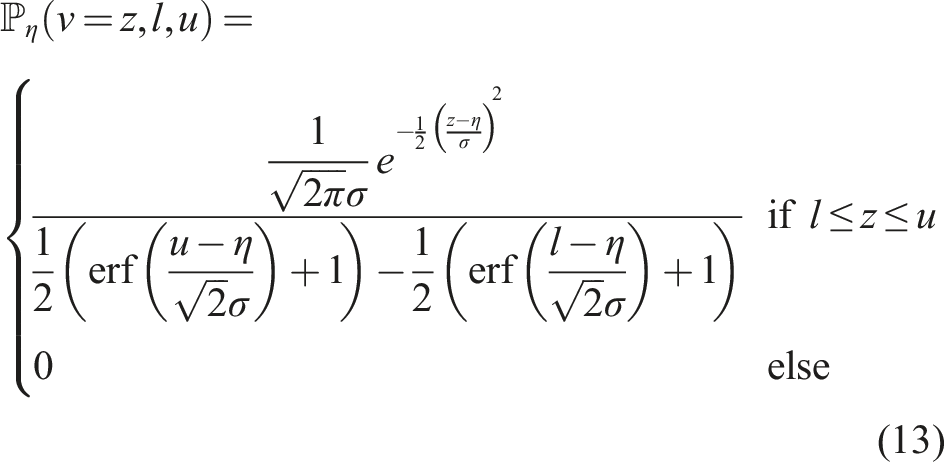
Speed distributions
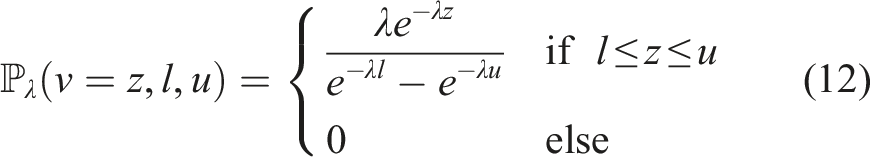
The number of intruders was determined to scale linearly with agent density and elapsed time. To verify the formula, Monte Carlo simulations were performed for a range of parameters. During the simulations, intruders are randomly placed onto the playground and filtered according to the magnitude of the closing rate. Speeds are assigned according to the prescribed distribution. Then, the angle of the apparent path, arrival time at the sensing range and intrusion angle are calculated; thus, the number of intruders can be collected. Correcting for density and simulation time, the results match appropriately for all distribution parameters investigated (Figure 1). Directional distribution of perpendicular intrusion influx for truncated exponential speed distribution 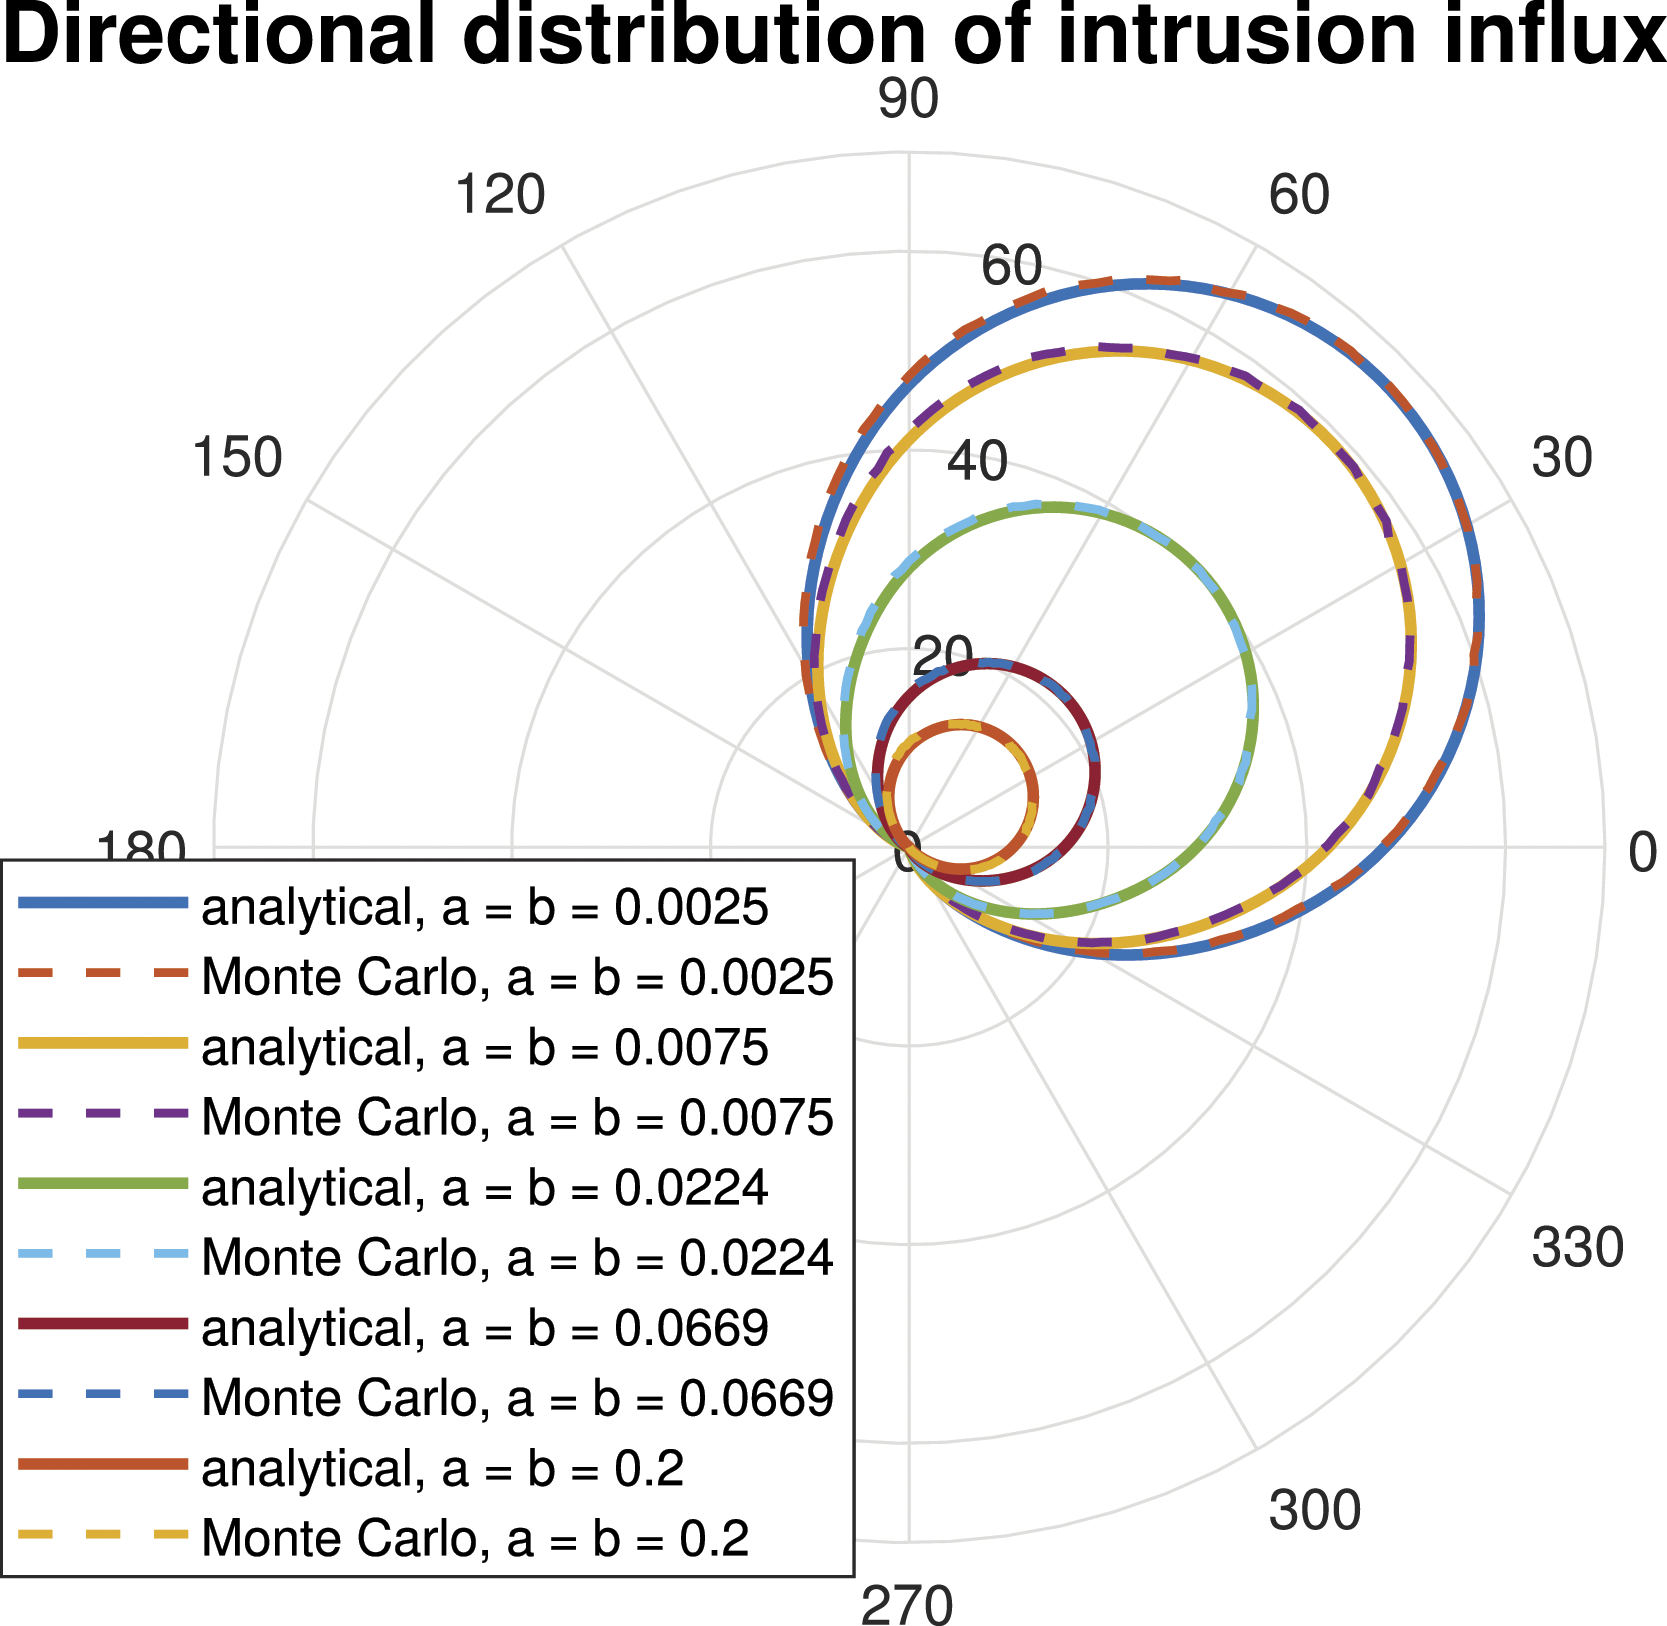
The results of the Monte Carlo simulations are provided in Table A1. The table contains the maximal influxes, the angles where the maximum influx occurs, the maximum and mean difference between the analytical and simulated results and the coefficient of determination.
The scaling factor for the results given by Equation (9) is ρ t
l
r
S
, where ρ is agent density, which is the average number of agents within a given area
In the case of a normal prescribed distribution, calculations can be performed similarly as in the case of exponential distribution by changing the speed distribution probability density functions. For parameters corresponding to the same mean speed, results have a similar magnitude (Figure 2). Directional distribution of perpendicular intrusion influx for truncated normal speed distribution 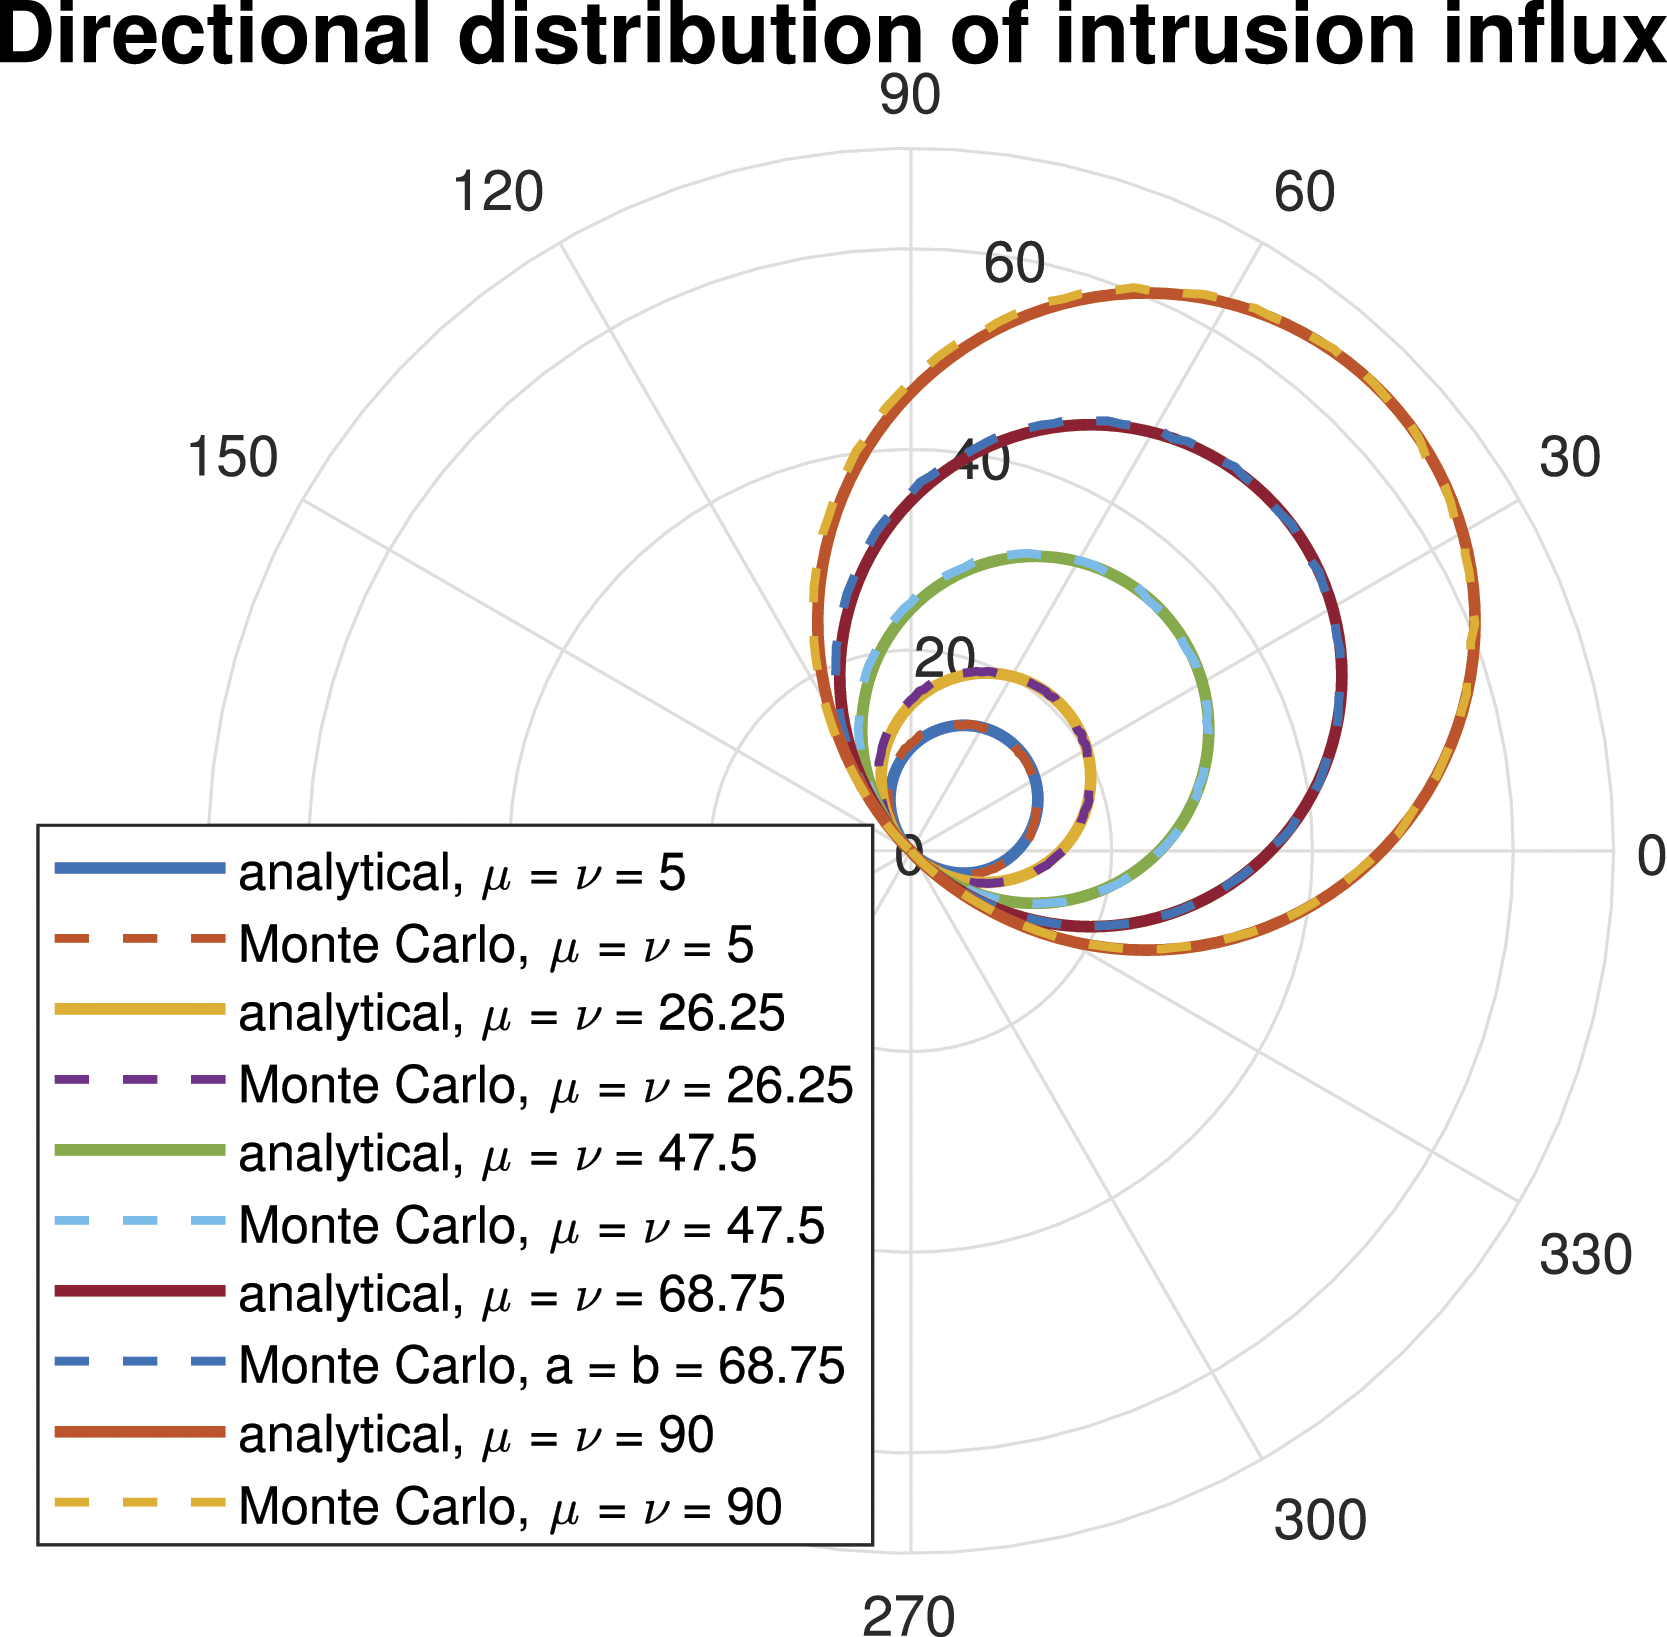
Taking into account the formula for the angle of apparent path (Equation (4)) the calculation can be extended for arbitrary initial intruder headings (Equation (14)).
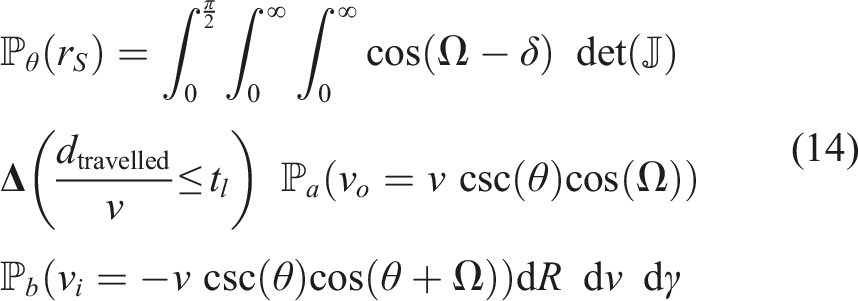
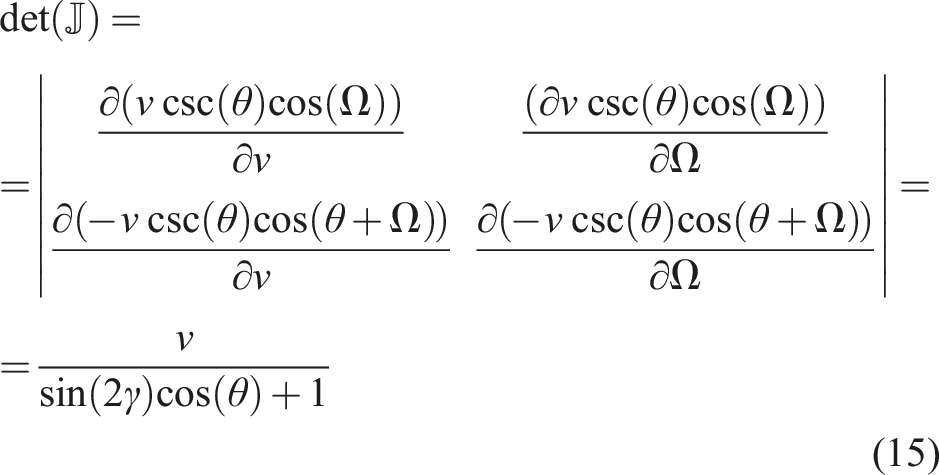
The determinant of the Jacobian of the velocity projections is given by Equation (15).
Results can be verified for both exponential and normal distributions (Figures 3 and 4). Directional distribution of intrusion influx for truncated exponential speed distribution Directional distribution of intrusion influx for truncated normal speed distribution 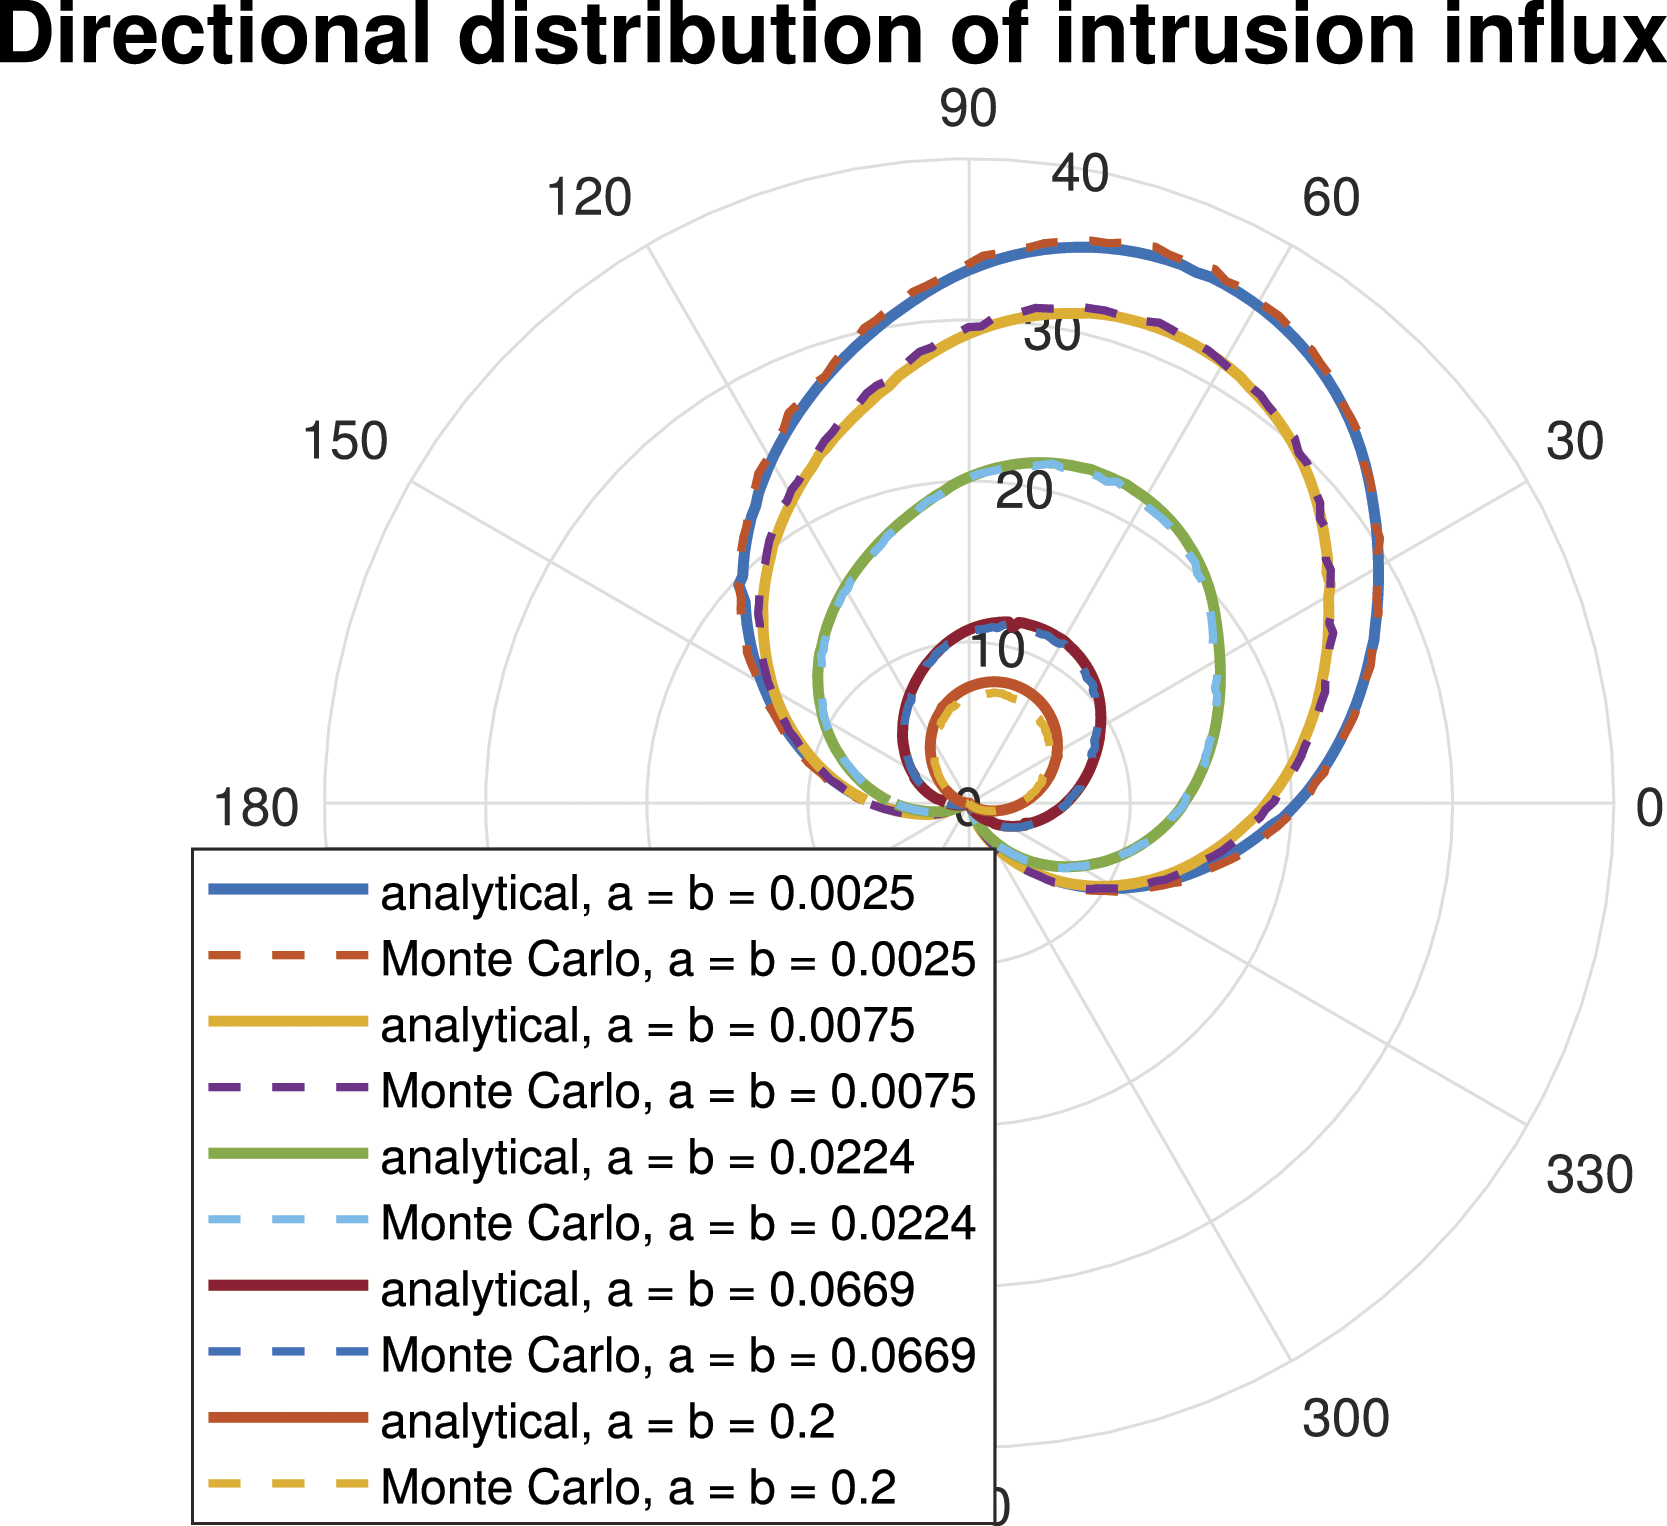
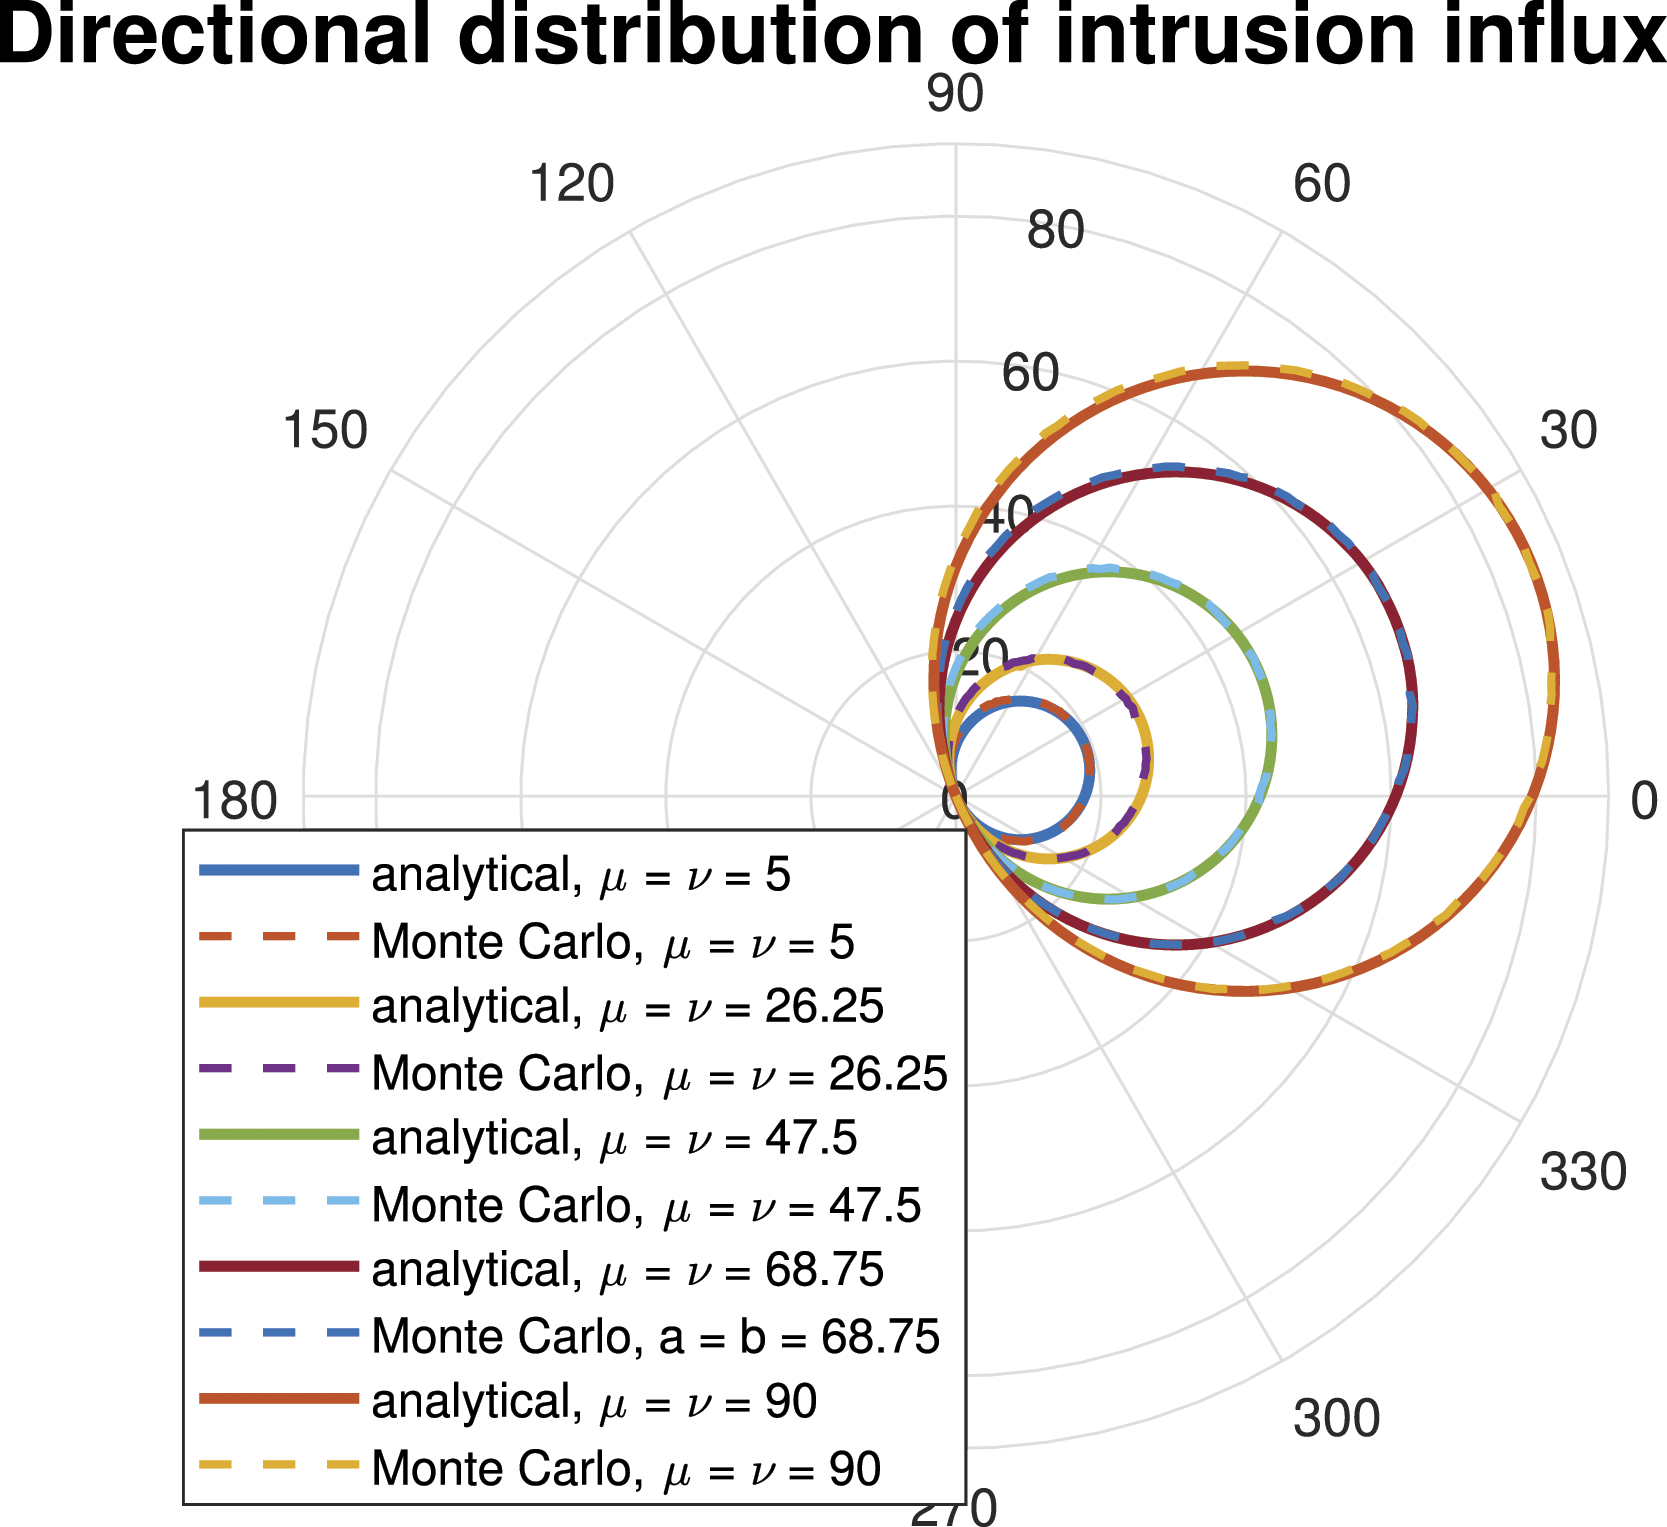
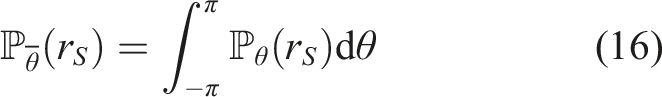
Assuming all intruder headings have the same probability, integrating for all possible headings provides the general intrusion directional map (Equation (16)).
Calculation results once again have been verified by Monte Carlo simulations (Figure 5). Analytical results are matched better for δ angles around 0° since a higher ratio of the sample can be used for evaluation. The scaling factor for the integral stays ρ t
l
r
S
to get the number of intrusions for a given scenario. Directional distribution of arbitrary heading intrusion influx for truncated exponential and normal speed distributions 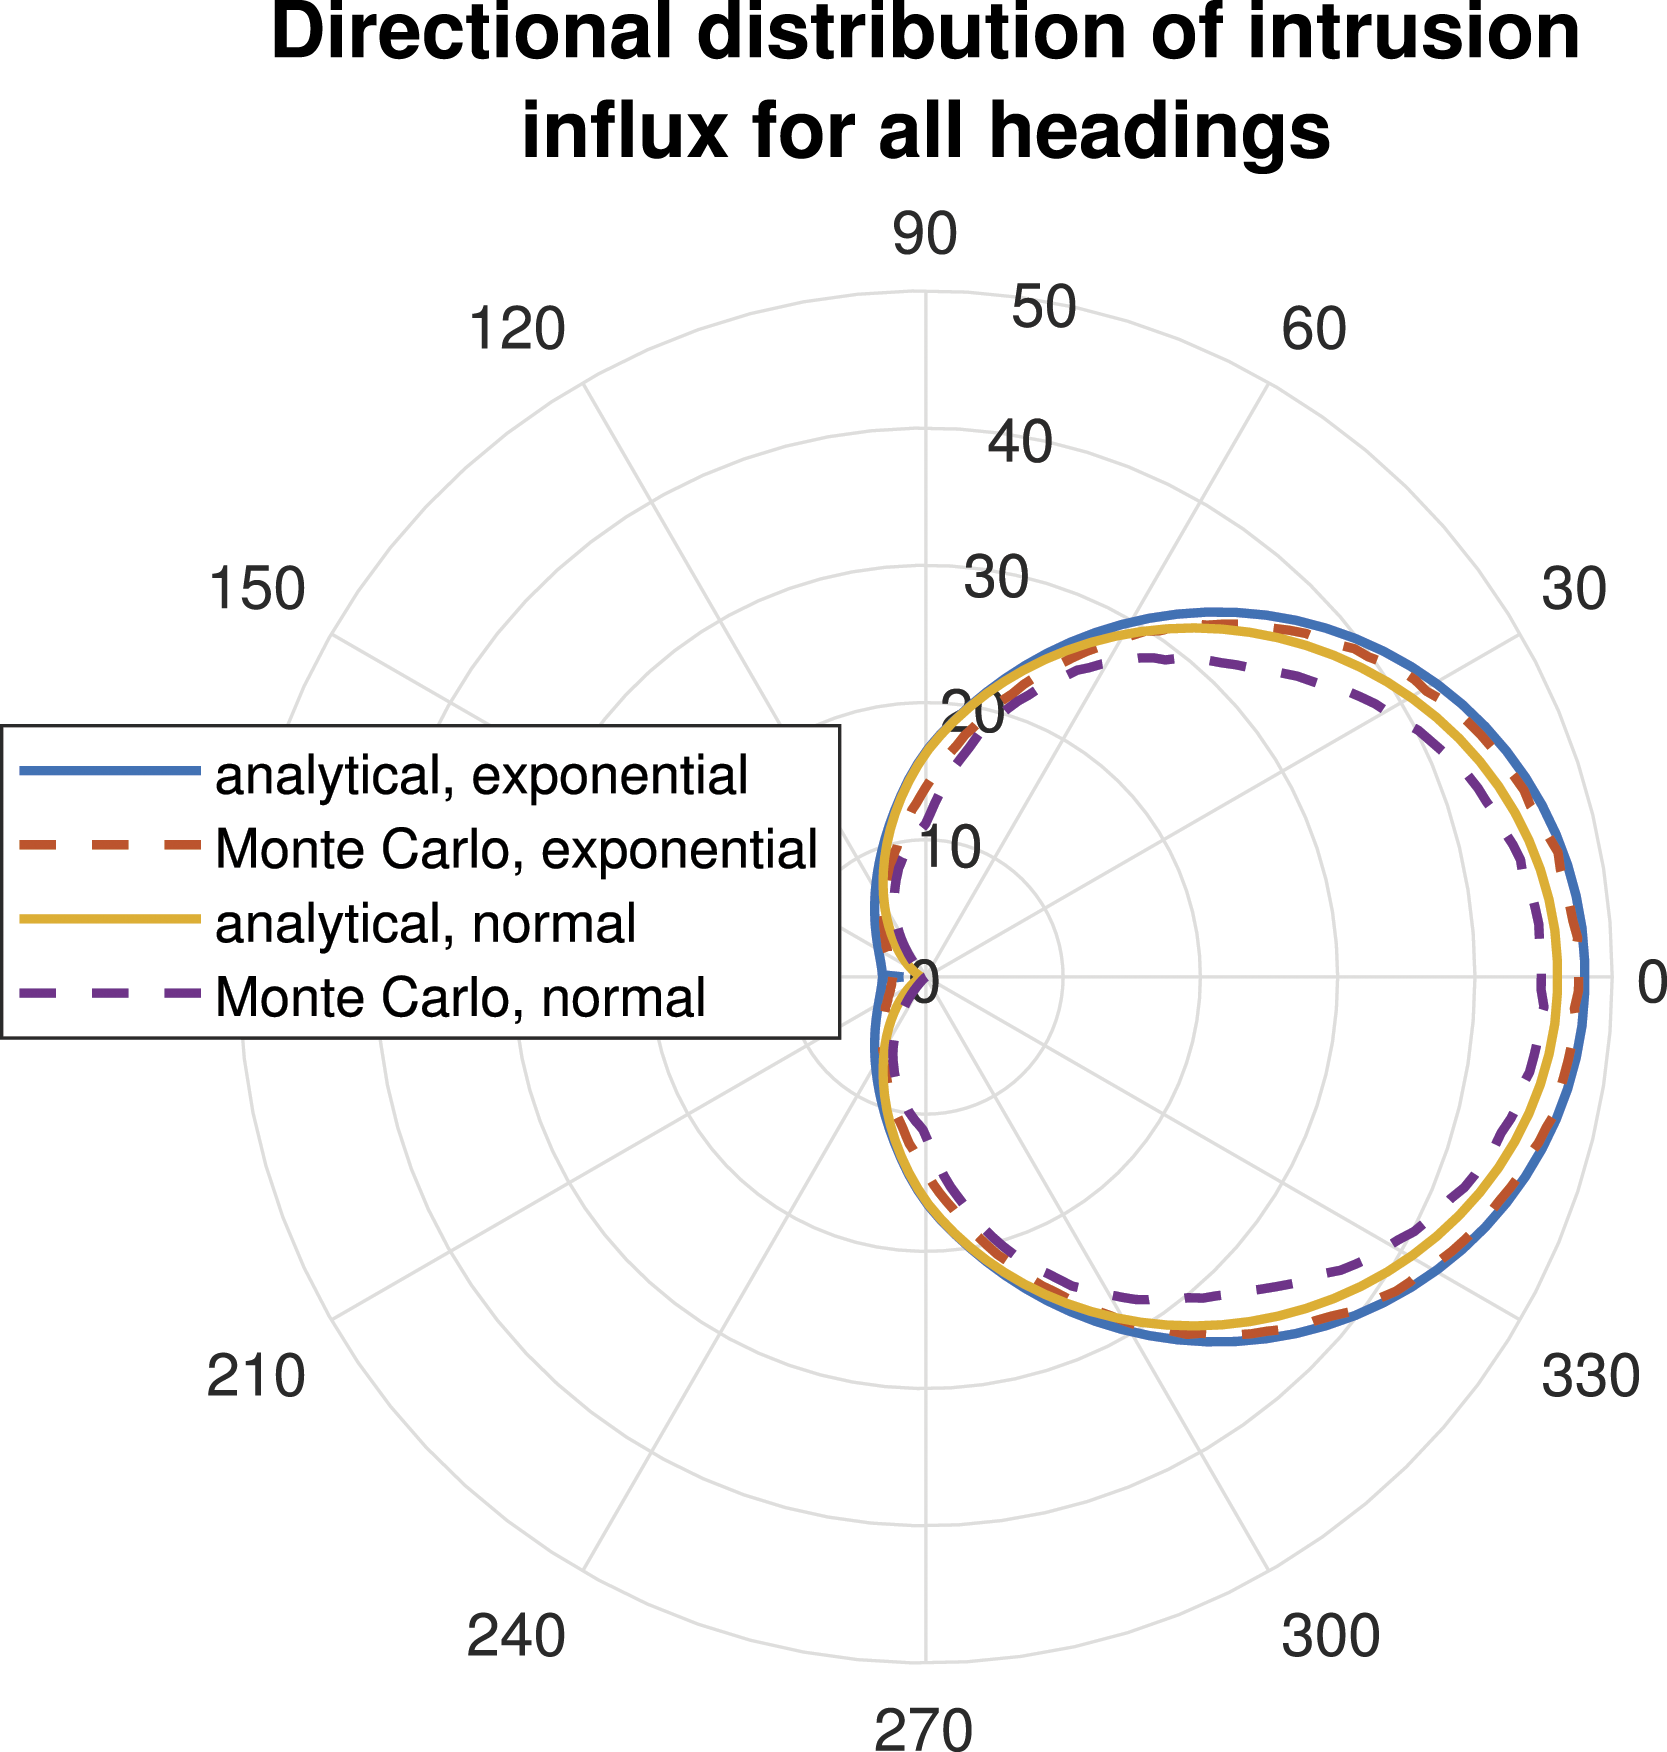
Results show that the appearance probability on the sensing range is not uniform. Adjusting the boundary conditions of previous calculations assuming uniform appearance distribution gives the geometric conflict probability results for uniform position distribution outside the sensing range. It has been established that geometric conflict probability is related to the angular diameter of the conflict range circle from a point on the sensing range (Equation (5)). The formula thus becomes Equation (17).
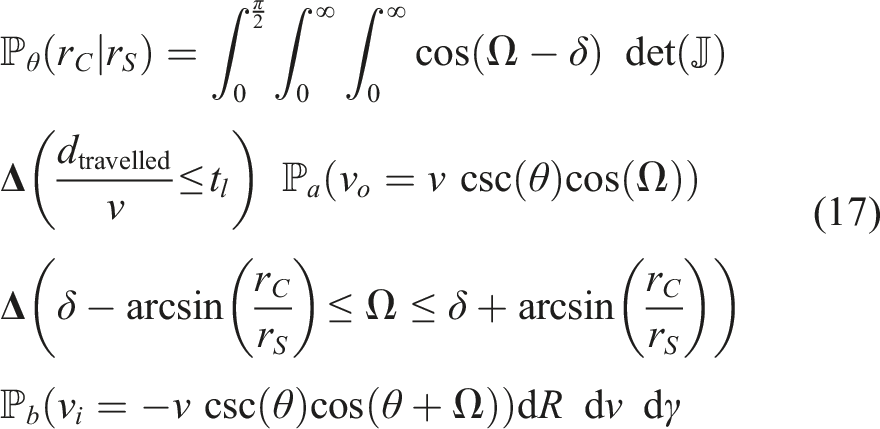
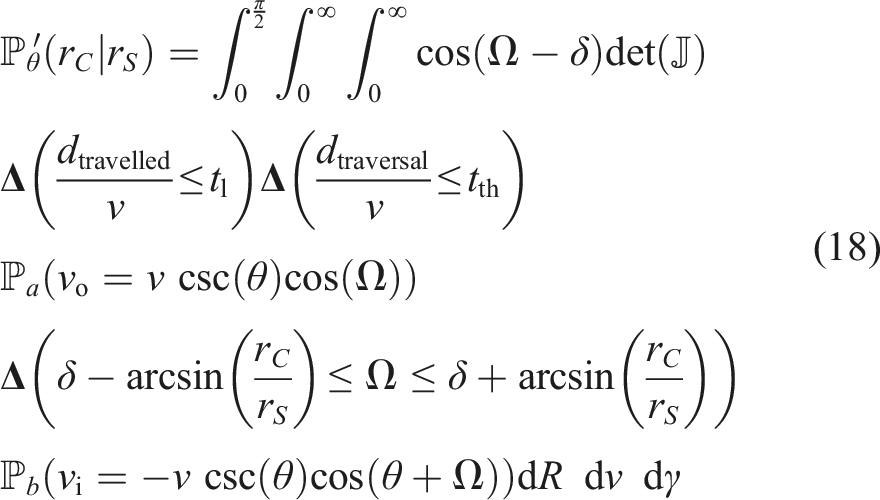
To gain the speed conflict probabilities only the intruders fast enough to complete the traversal within the prescribed threshold time need to be taken into account (Equation (18)). This also affects speed distribution, which is shifted from the prescribed to one with a higher average speed.
Evaluating the integrals leads to the results shown in Figures 6 and 7, and can be verified by Monte Carlo simulations. Directional distribution of geometric and speed conflict probability for truncated exponential speed distribution Directional distribution of geometric and speed conflict probability for truncated normal speed distribution 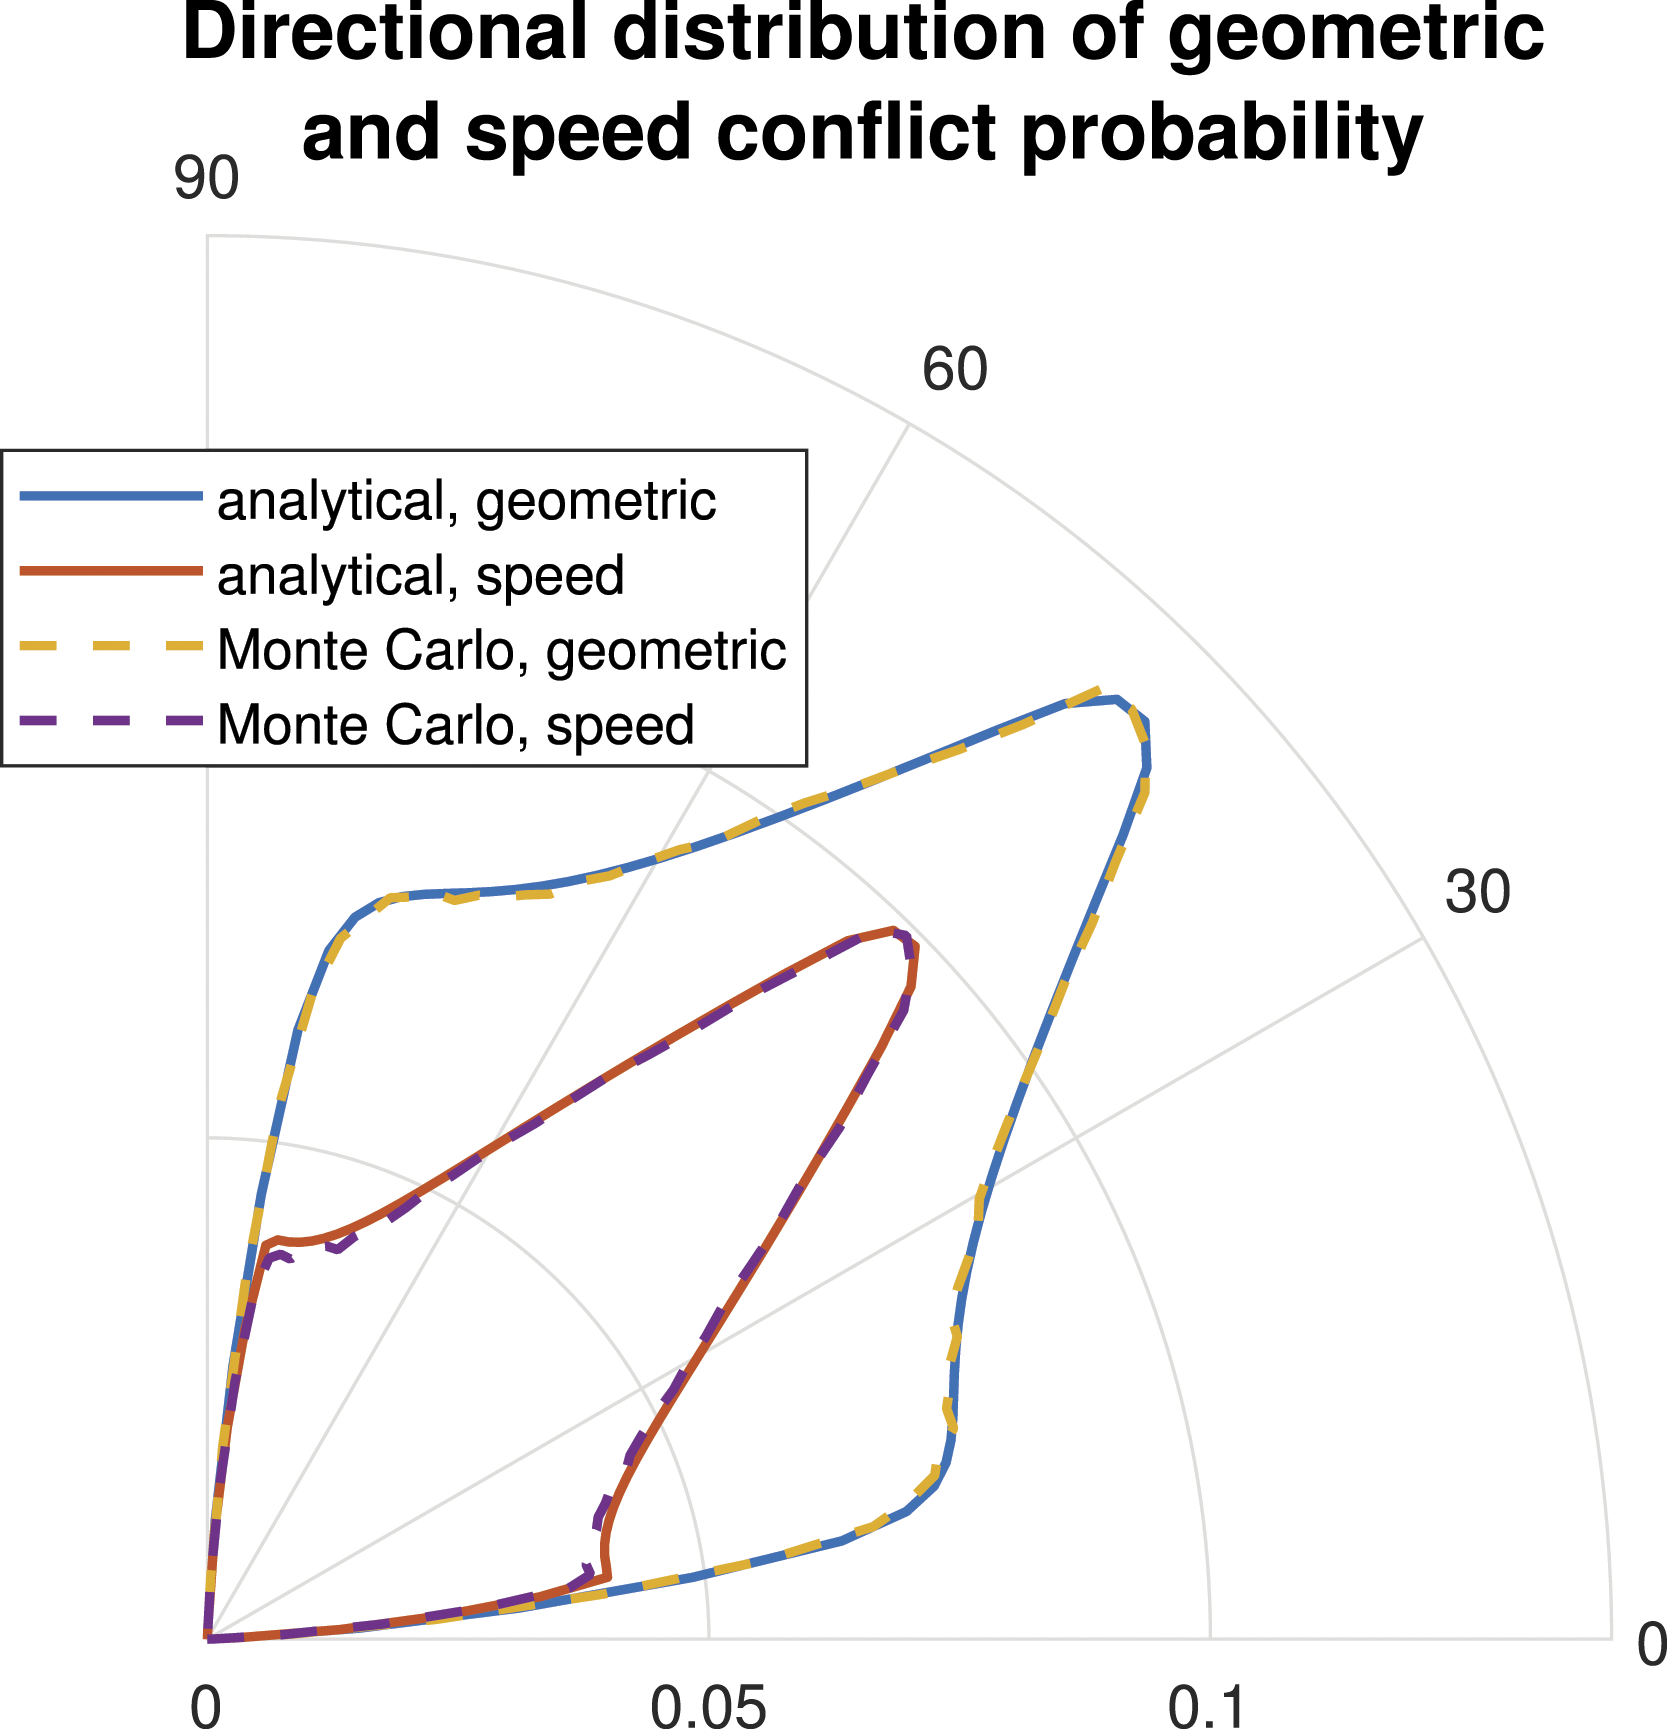
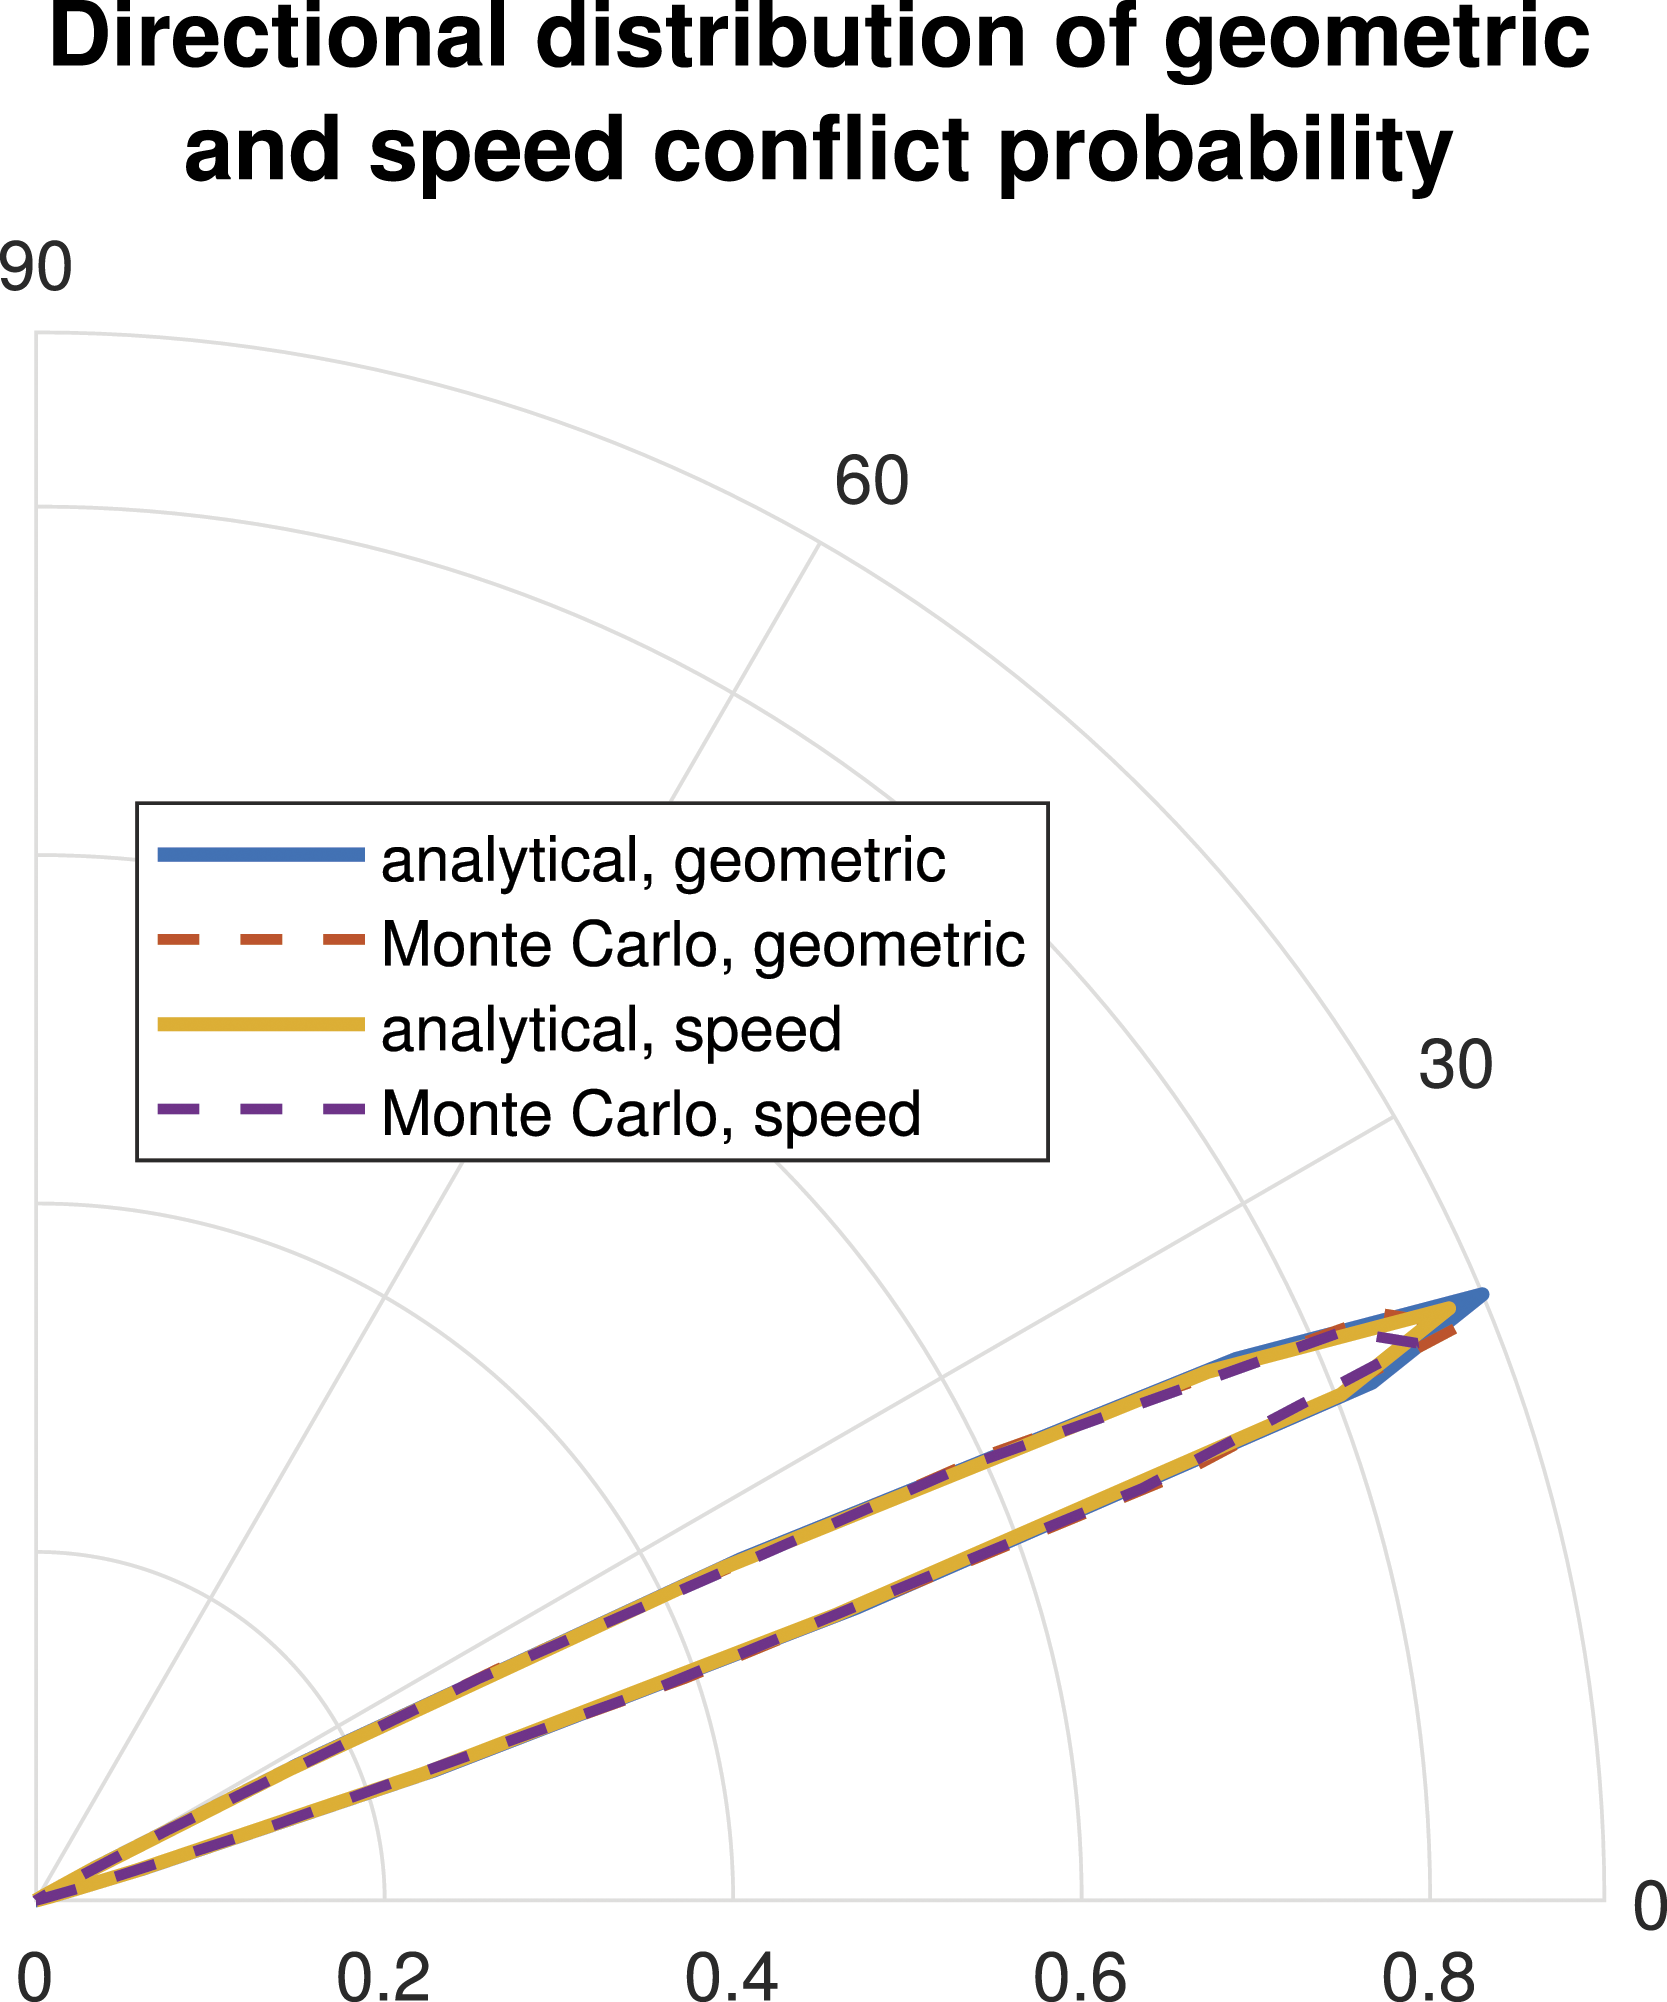
The calculation method presented can be generalised for arbitrary intruder heading, speed and position distributions. In the current scenario, results show that the maximum intrusion probability corresponds to the ownship heading and decreases with increasing relative heading as expected. Also, the relationship between speed distribution and mean speed (governed by the distribution parameter) and intrusion influx magnitudes are characterised. As the uneven distribution of influx to the sensing range is identified, the boundary conditions for conflict probability calculations could be adjusted, leading to more realistic results.
Integral quantities
In the previous section the Directional quantities (intrusion influxes and conflict probabilities) were calculated. These quantities are directional, as they depend on the relative position of the vehicles. The direction in this case is the direction at which the ownship senses the intruder. Integrating the directional conflict probabilities for all angles provides the total conflict probability for a given distribution parameter. This quantity can be used to describe the relationship between the distribution parameter and conflict probabilities, leading to a system-level understanding.
Safety, as defined by Equation (1) can be calculated as the integral of directional conflict probability for all directions (Figure 8). Results have been compared with multi-agent simulations. In these simulations, agents are placed randomly during initialisation, and they choose their speed by applying one of the following Markov chain task allocation methods: Homogeneous Markov Chain (HMC),
26
Inhomogeneous Markov Chain (IMC),
69
Local Information Consistency Assumption Inhomogeneous Markov Chain (LICA IMC)
29
and Asynchronous Local Information Consistency Assumption Inhomogeneous Markov Chain (Async LICA IMC).
29
It was found that results in a quasi-steady state are independent of the method applied. Simulation setup and results are explained in detail in another publication by the authors.
25
The calculated safety metric was then normalised with the number of agents, simulation area and the radius of the sensing range Normalised safety (S) metric according to mean speed – comparison of analytical calculations and multi-agent simulation results (exponential and normal distribution.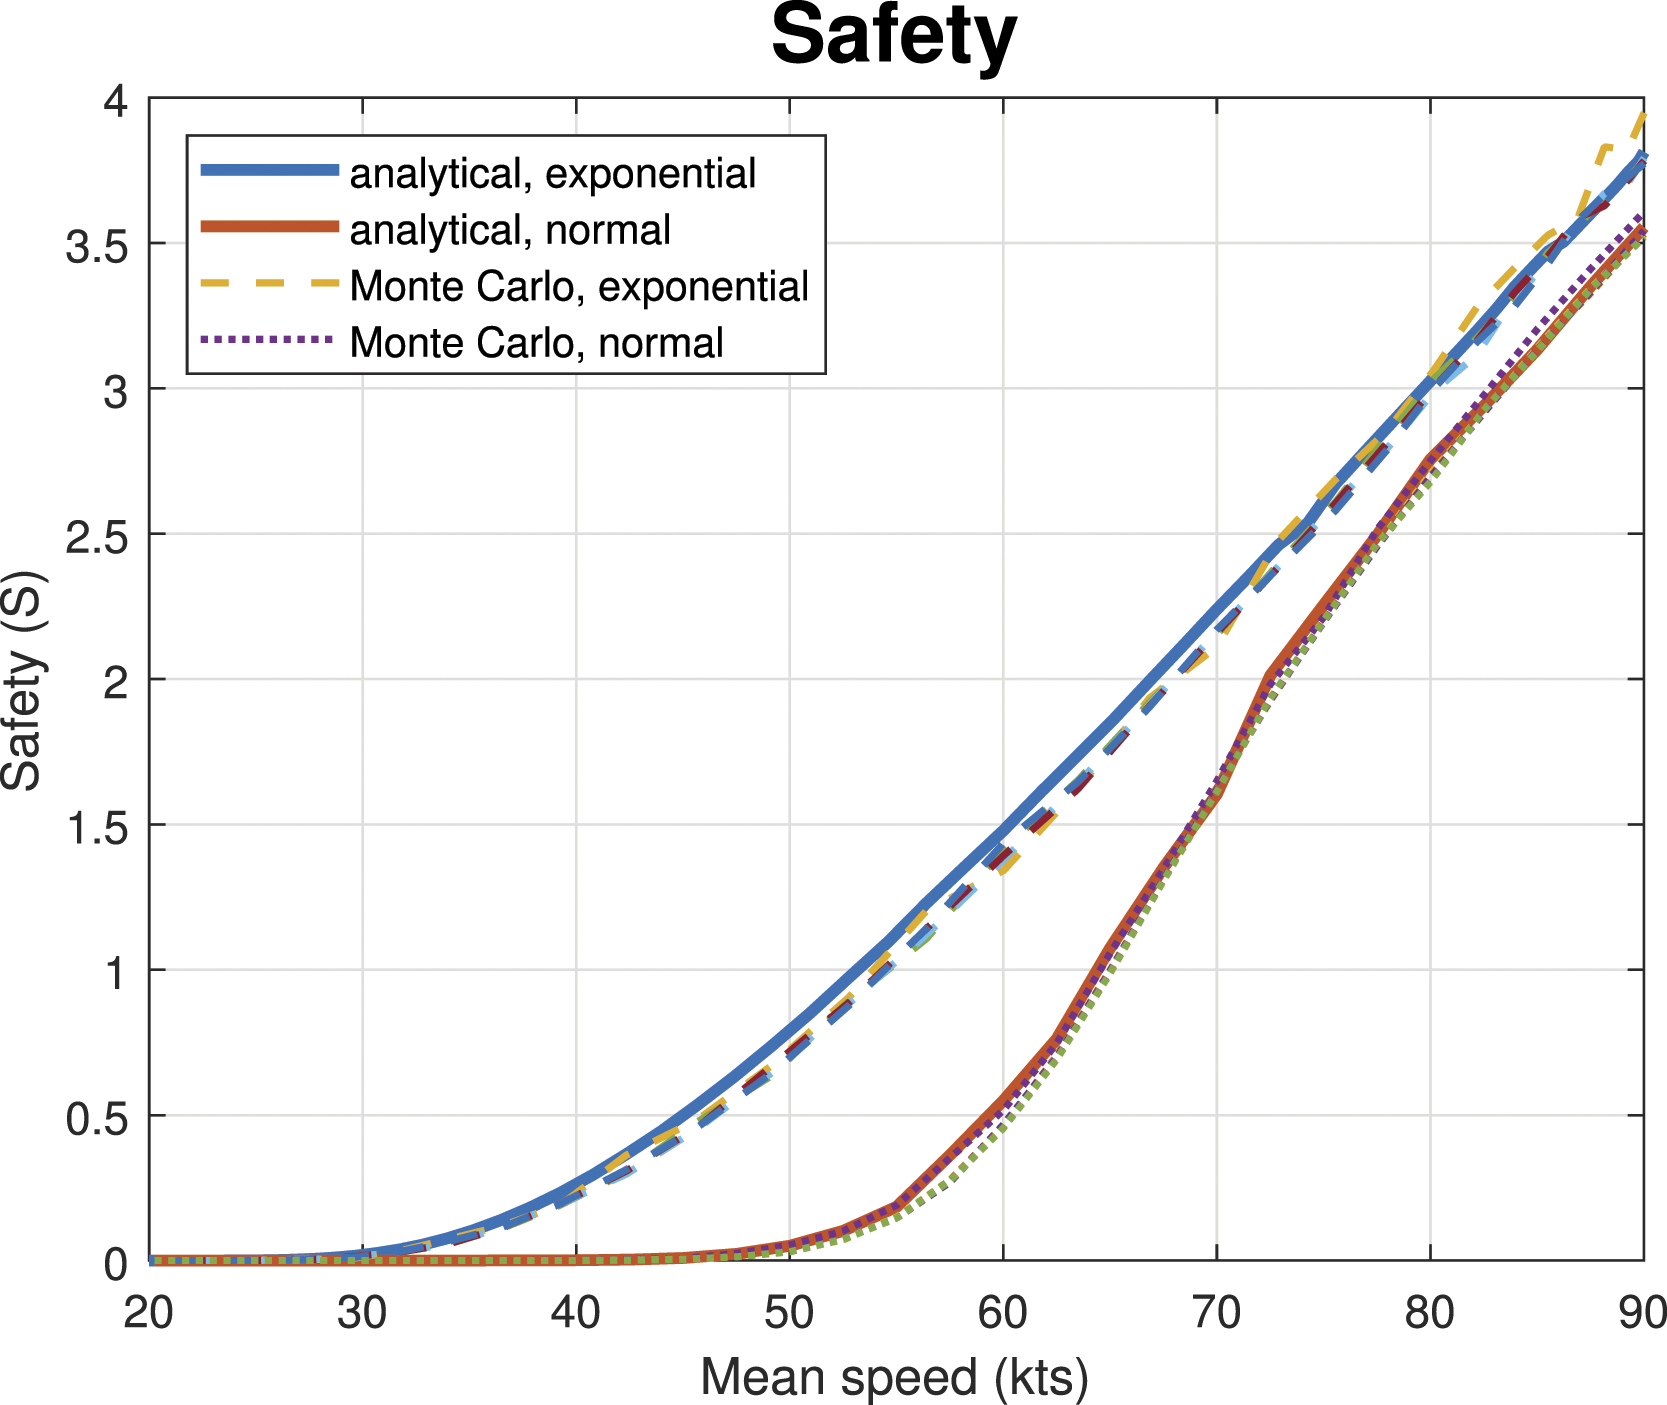
Throughput is defined as in Equation (2) and can be calculated as the mean speed corresponding to a parameter, while also taking into account deviations caused by avoidance manoeuvres. Weighting the calculated number of conflicts for a given scenario by the deviation penalty Normalised throughput (T) metric according to mean speed – comparison of analytical calculations and multi-agent simulation results (exponential and normal distribution).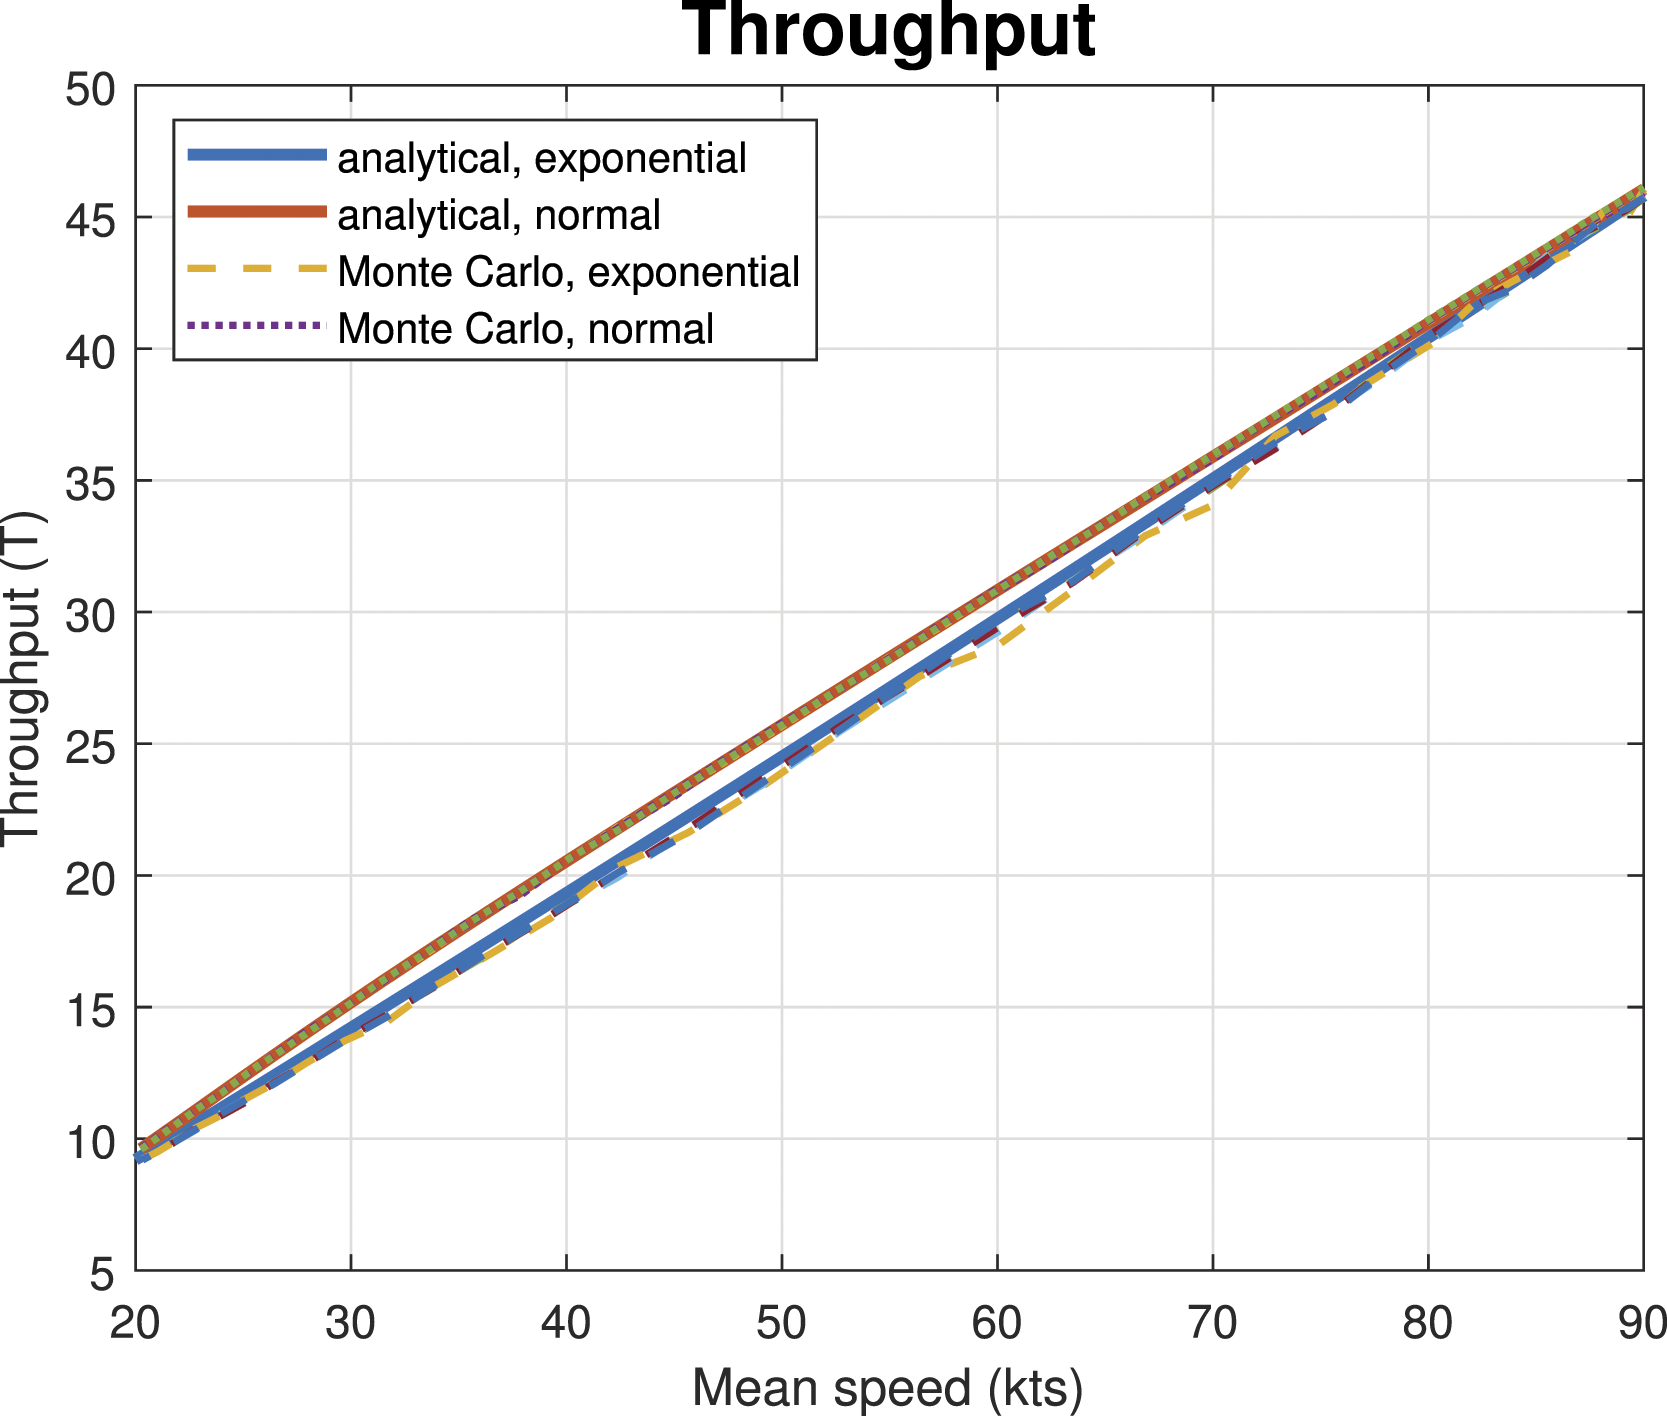
Calculation results show that safety and throughput metrics can be analytically calculated from directional conflict probabilities bridging local conflict avoidance and global traffic management and enabling assured safety coordination. The performance difference between exponential and normal distribution is clearly visible, in the medium speed range the exponential prescribed distribution results in higher conflict probability. For lower and higher speeds, the difference decreases. The technique presented can be applied for arbitrary speed distributions, enabling an optimal formulation of the speed distribution. Understanding the relationship between distribution shaping for conflicts and traffic management performance, and their dependence on speed distribution type and the prescribed parameter allows for their simultaneous co-design.
Conclusion
The paper presents a method to calculate air traffic conflict probabilities if both the ownship and the intruder are behaving according to a stochastic distribution. It is also demonstrated that by applying a bottom-analysis of two-aircraft conflict situations and determining the directional conflict maps, high-level, global characteristics of the system may be derived, namely, system-level safety and throughput. Results were in agreement with validation simulations.
This contributes towards the efforts for a distributed airspace management system with prescribed safety bounds since the acceptable conflict probability and the corresponding distribution parameter can be selected a priori. The method presented can be applied for any arbitrary stochastic distribution, within the scope of the paper the exponential and the normal distributions were analysed. It was shown that for the same mean speed, the exponential distribution results in higher conflict probability for the speed range investigated. Since the proposed distributed, stochastic framework is more scalable and robust than the current ATC system it might help overcome certain limitations of current methods.
The research presented also has its limitations. The applied algorithm requires constant communication between the vehicles to drive the ensemble to the prescribed distribution. This communication can be local and asynchronous. For the dissemination of the parameter, however, communication with a global, centralised optimiser is necessary. Within the scope of this paper, only nominal scenarios were investigated. All aircraft are assumed to be cooperative and can be modelled with the same, simplistic kinematic model. The practical applicability of the framework and the computational complexity of the algorithms were not investigated.
Future work consists of an analysis of the performance of different distributions and integration of the framework with low-level avoidance and high-level optimisation techniques. For more general applicability, the methods are planned to be extended into 3D.
Footnotes
Acknowledgements
The authors gratefully acknowledge that this research was supported by the Engineering and Physical Sciences Research Council, under grant EPSRC EP/N509450/1.
Declaration of conflicting interests
The author(s) declared no potential conflicts of interest with respect to the research, authorship, and/or publication of this article.
Funding
The author(s) disclosed receipt of the following financial support for the research, authorship, and/or publication of this article: This study was supported by the Engineering and Physical Sciences Research Council, under grant EPSRC EP/N509450/1.
Data Availability
The data that support the findings of this study are available from the corresponding author, Zs. Ö., upon reasonable request. The authors confirm that the data supporting the findings of this study are available within the article and its supplementary materials. Raw data is available upon request.
Table of results for directional quantities
Table of Results for Directional Quantities – R2: coefficient of determination.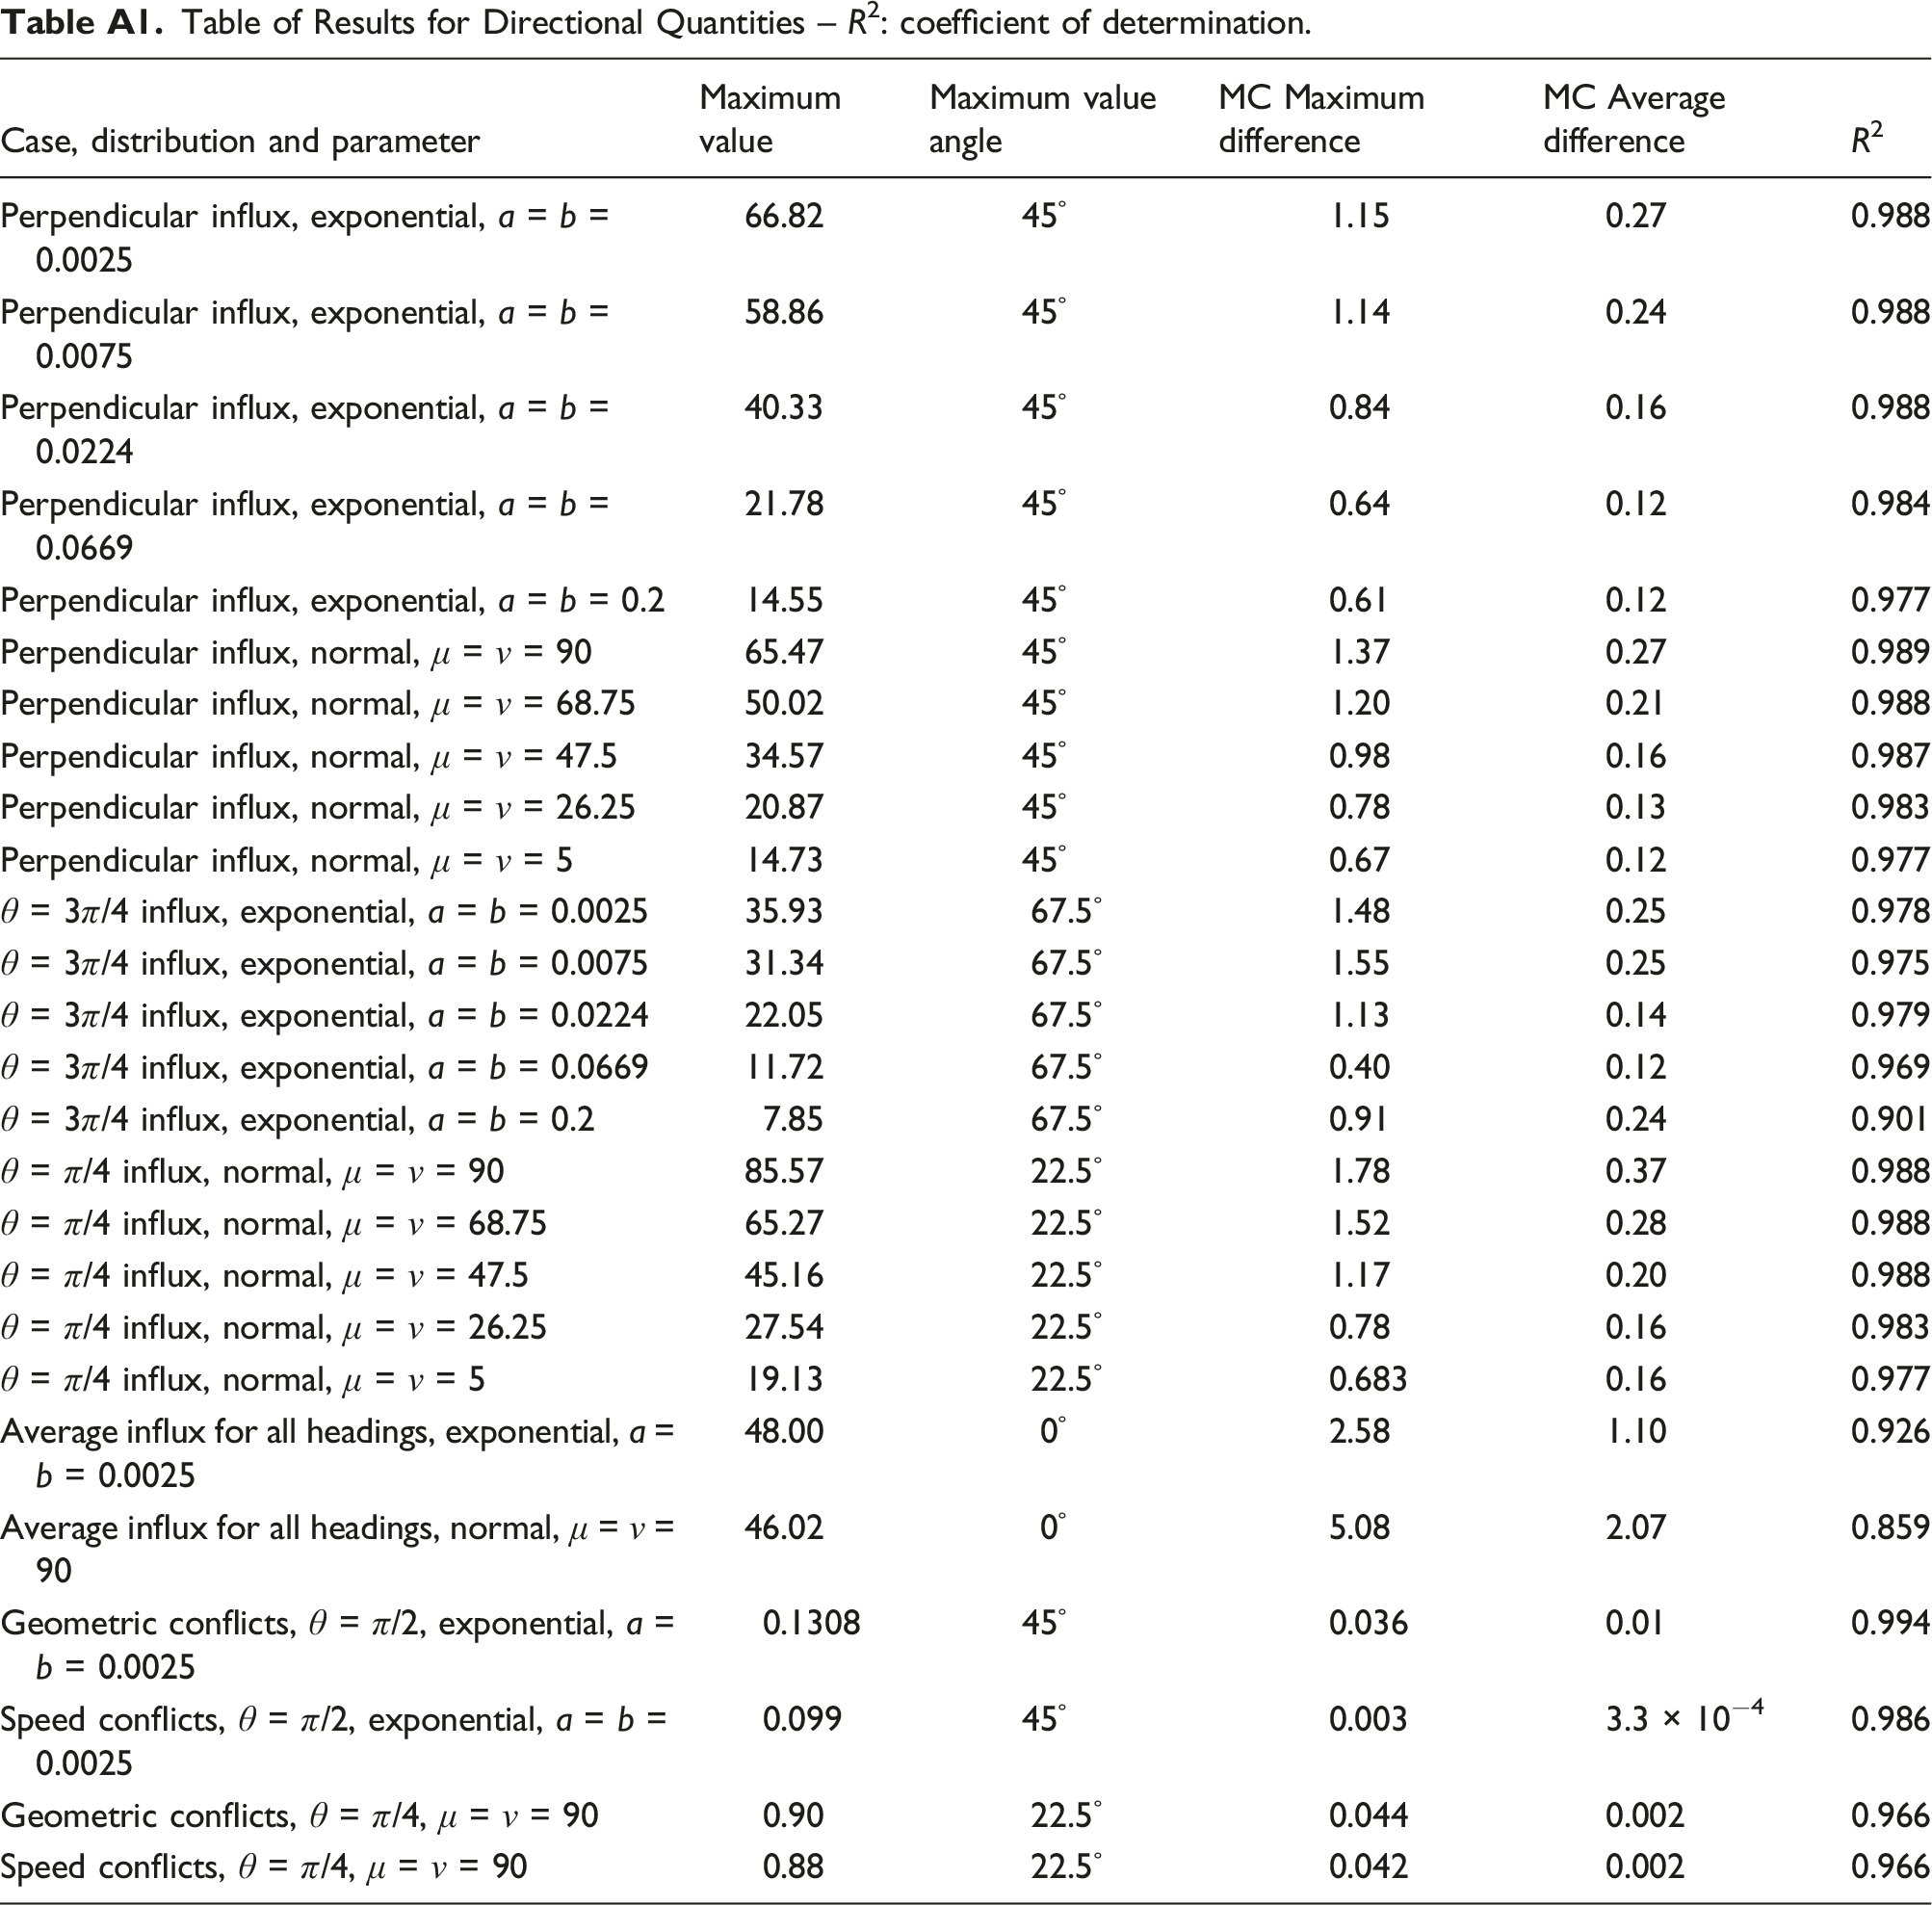
Case, distribution and parameter
Maximum value
Maximum value angle
MC Maximum difference
MC Average difference
R
2
Perpendicular influx, exponential, a = b = 0.0025
66.82
45◦
1.15
0.27
0.988
Perpendicular influx, exponential, a = b = 0.0075
58.86
45◦
1.14
0.24
0.988
Perpendicular influx, exponential, a = b = 0.0224
40.33
45◦
0.84
0.16
0.988
Perpendicular influx, exponential, a = b = 0.0669
21.78
45◦
0.64
0.12
0.984
Perpendicular influx, exponential, a = b = 0.2
14.55
45◦
0.61
0.12
0.977
Perpendicular influx, normal, μ = ν = 90
65.47
45◦
1.37
0.27
0.989
Perpendicular influx, normal, μ = ν = 68.75
50.02
45◦
1.20
0.21
0.988
Perpendicular influx, normal, μ = ν = 47.5
34.57
45◦
0.98
0.16
0.987
Perpendicular influx, normal, μ = ν = 26.25
20.87
45◦
0.78
0.13
0.983
Perpendicular influx, normal, μ = ν = 5
14.73
45◦
0.67
0.12
0.977
θ = 3π/4 influx, exponential, a = b = 0.0025
35.93
67.5◦
1.48
0.25
0.978
θ = 3π/4 influx, exponential, a = b = 0.0075
31.34
67.5◦
1.55
0.25
0.975
θ = 3π/4 influx, exponential, a = b = 0.0224
22.05
67.5◦
1.13
0.14
0.979
θ = 3π/4 influx, exponential, a = b = 0.0669
11.72
67.5◦
0.40
0.12
0.969
θ = 3π/4 influx, exponential, a = b = 0.2
7.85
67.5◦
0.91
0.24
0.901
θ = π/4 influx, normal, μ = ν = 90
85.57
22.5◦
1.78
0.37
0.988
θ = π/4 influx, normal, μ = ν = 68.75
65.27
22.5◦
1.52
0.28
0.988
θ = π/4 influx, normal, μ = ν = 47.5
45.16
22.5◦
1.17
0.20
0.988
θ = π/4 influx, normal, μ = ν = 26.25
27.54
22.5◦
0.78
0.16
0.983
θ = π/4 influx, normal, μ = ν = 5
19.13
22.5◦
0.683
0.16
0.977
Average influx for all headings, exponential, a = b = 0.0025
48.00
0◦
2.58
1.10
0.926
Average influx for all headings, normal, μ = ν = 90
46.02
0◦
5.08
2.07
0.859
Geometric conflicts, θ = π/2, exponential, a = b = 0.0025
0.1308
45◦
0.036
0.01
0.994
Speed conflicts, θ = π/2, exponential, a = b = 0.0025
0.099
45◦
0.003
3.3 × 10⁻⁴
0.986
Geometric conflicts, θ = π/4, μ = ν = 90
0.90
22.5◦
0.044
0.002
0.966
Speed conflicts, θ = π/4, μ = ν = 90
0.88
22.5◦
0.042
0.002
0.966
Table of results for integral quantities
Table of Results for the Integral Quantities – Kts: speed in knots, S: safety, T: throughput, an: analytical, MC: Monte Carlo, exp: exponential distribution, norm: normal distribution.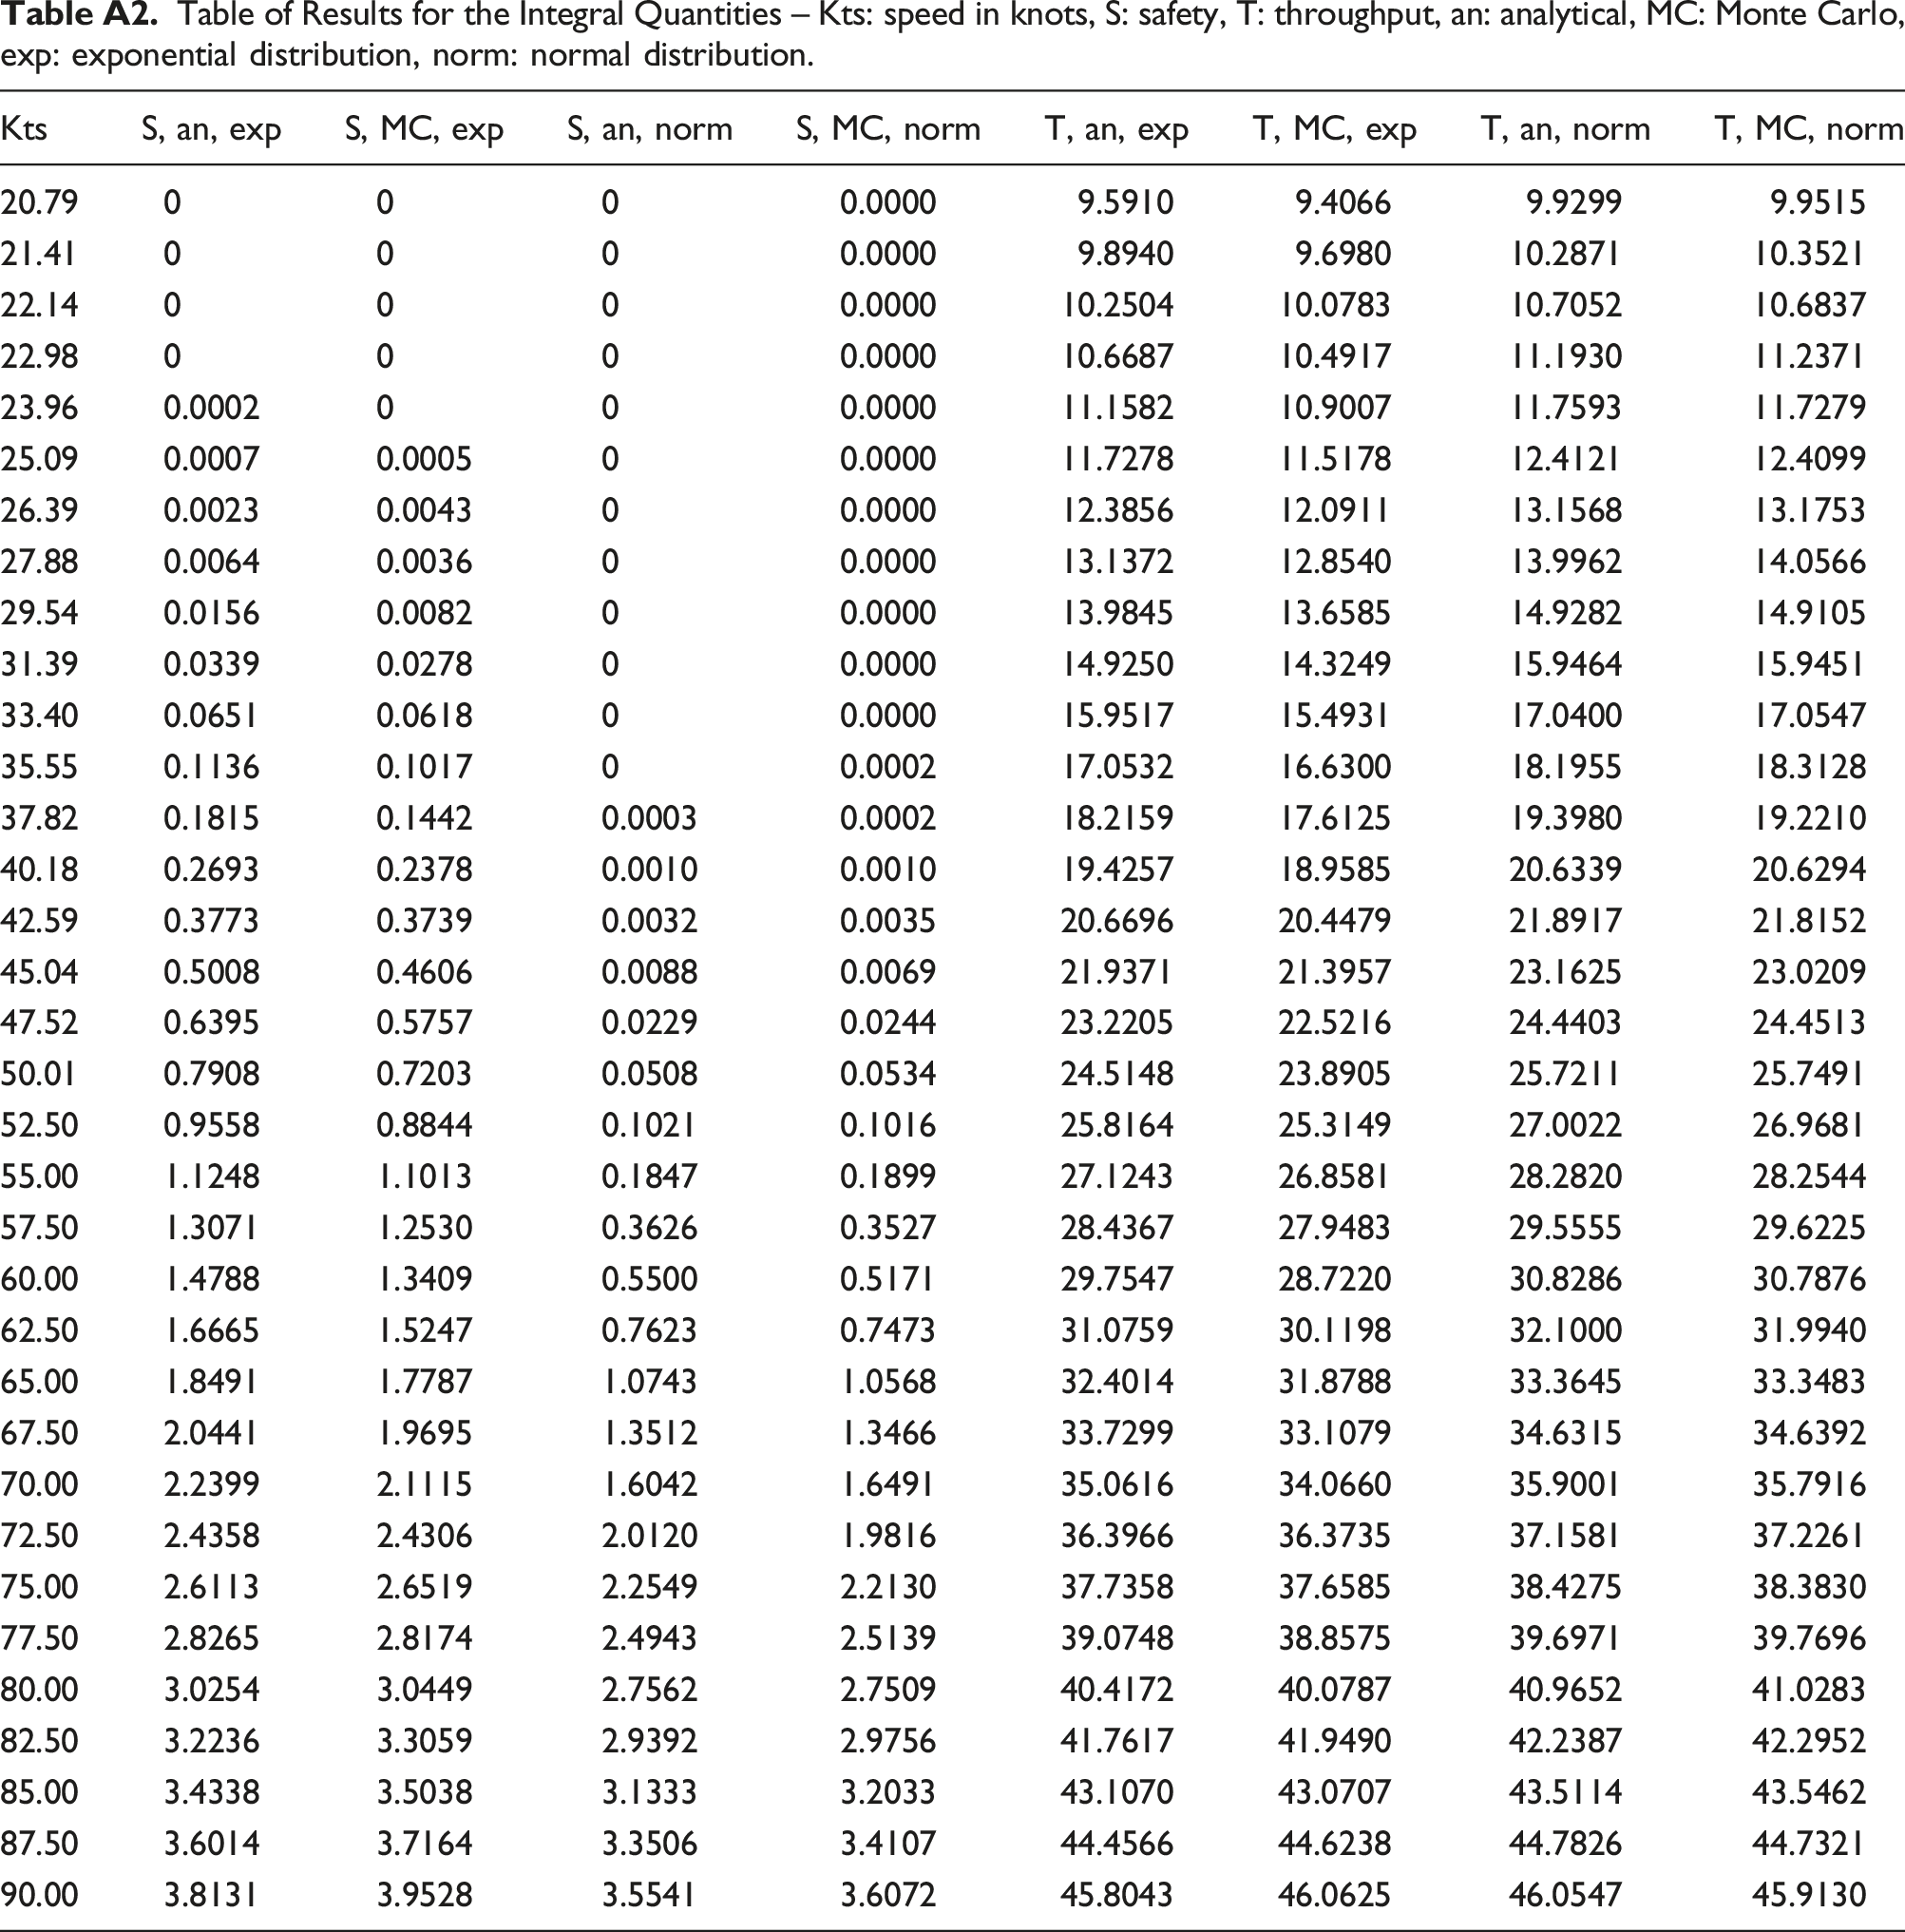
Kts
S, an, exp
S, MC, exp
S, an, norm
S, MC, norm
T, an, exp
T, MC, exp
T, an, norm
T, MC, norm
20.79
0
0
0
0.0000
9.5910
9.4066
9.9299
9.9515
21.41
0
0
0
0.0000
9.8940
9.6980
10.2871
10.3521
22.14
0
0
0
0.0000
10.2504
10.0783
10.7052
10.6837
22.98
0
0
0
0.0000
10.6687
10.4917
11.1930
11.2371
23.96
0.0002
0
0
0.0000
11.1582
10.9007
11.7593
11.7279
25.09
0.0007
0.0005
0
0.0000
11.7278
11.5178
12.4121
12.4099
26.39
0.0023
0.0043
0
0.0000
12.3856
12.0911
13.1568
13.1753
27.88
0.0064
0.0036
0
0.0000
13.1372
12.8540
13.9962
14.0566
29.54
0.0156
0.0082
0
0.0000
13.9845
13.6585
14.9282
14.9105
31.39
0.0339
0.0278
0
0.0000
14.9250
14.3249
15.9464
15.9451
33.40
0.0651
0.0618
0
0.0000
15.9517
15.4931
17.0400
17.0547
35.55
0.1136
0.1017
0
0.0002
17.0532
16.6300
18.1955
18.3128
37.82
0.1815
0.1442
0.0003
0.0002
18.2159
17.6125
19.3980
19.2210
40.18
0.2693
0.2378
0.0010
0.0010
19.4257
18.9585
20.6339
20.6294
42.59
0.3773
0.3739
0.0032
0.0035
20.6696
20.4479
21.8917
21.8152
45.04
0.5008
0.4606
0.0088
0.0069
21.9371
21.3957
23.1625
23.0209
47.52
0.6395
0.5757
0.0229
0.0244
23.2205
22.5216
24.4403
24.4513
50.01
0.7908
0.7203
0.0508
0.0534
24.5148
23.8905
25.7211
25.7491
52.50
0.9558
0.8844
0.1021
0.1016
25.8164
25.3149
27.0022
26.9681
55.00
1.1248
1.1013
0.1847
0.1899
27.1243
26.8581
28.2820
28.2544
57.50
1.3071
1.2530
0.3626
0.3527
28.4367
27.9483
29.5555
29.6225
60.00
1.4788
1.3409
0.5500
0.5171
29.7547
28.7220
30.8286
30.7876
62.50
1.6665
1.5247
0.7623
0.7473
31.0759
30.1198
32.1000
31.9940
65.00
1.8491
1.7787
1.0743
1.0568
32.4014
31.8788
33.3645
33.3483
67.50
2.0441
1.9695
1.3512
1.3466
33.7299
33.1079
34.6315
34.6392
70.00
2.2399
2.1115
1.6042
1.6491
35.0616
34.0660
35.9001
35.7916
72.50
2.4358
2.4306
2.0120
1.9816
36.3966
36.3735
37.1581
37.2261
75.00
2.6113
2.6519
2.2549
2.2130
37.7358
37.6585
38.4275
38.3830
77.50
2.8265
2.8174
2.4943
2.5139
39.0748
38.8575
39.6971
39.7696
80.00
3.0254
3.0449
2.7562
2.7509
40.4172
40.0787
40.9652
41.0283
82.50
3.2236
3.3059
2.9392
2.9756
41.7617
41.9490
42.2387
42.2952
85.00
3.4338
3.5038
3.1333
3.2033
43.1070
43.0707
43.5114
43.5462
87.50
3.6014
3.7164
3.3506
3.4107
44.4566
44.6238
44.7826
44.7321
90.00
3.8131
3.9528
3.5541
3.6072
45.8043
46.0625
46.0547
45.9130