
Abstract
Convoluted aero-engine intakes are often required to enable closer integration between engine and airframe. Although the majority of previous research focused on the distortion of S-duct intakes with undistorted inlet conditions, there is a need to investigate the impact of more challenging inlet conditions at which the intake duct is expected to operate. The impact of inlet vortices and total pressure profiles on the inherent unsteady flow distortion of an S-duct intake was assessed with stereo particle image velocimetry. Inlet vortices disrupted the characteristic flow switching mode but had a modest impact on the peak levels and unsteady fluctuations. Non-uniform inlet total pressure profiles increased the peak swirl intensity and its unsteadiness. The frequency of swirl angle fluctuations was sensitive to the azimuthal orientation of the non-uniform total pressure distribution. The modelling of peak distortion with the extreme value theory revealed that although for some inlet configurations the measured peak swirl intensity was similar, the growth rate of the peak values beyond the experimental observations was substantially different and it was related with the measured flow unsteadiness. This highlights the need of unsteady swirl distortion measurements and the use of statistical models to assess the time-invariant peak distortion levels. Overall, the work shows it is vital to include the effect of the inlet flow conditions as it substantially alters the characteristics of the complex intake flow distortion.
Introduction
The aviation community is constantly striving for more efficient, reliable, environmental-friendly and sustainable air transport solutions which are aligned with future societal and market needs. 1 While the research on conventional aircraft design optimization may be reaching development maturity with focus on incremental enhancement, interest in novel aircraft configurations is emerging. In some of these novel architectures, the propulsion system is closely coupled to the aircraft fuselage to reduce frontal area, wakes and to take advantage from boundary layer ingestion. 2 Recent feasibility studies3–5 predicted a reduction of fuel consumption up to 5% in comparison with UHBR engines. 6 The benefit of fuel economy can be even higher if this technology is used in conjunction with blended wing body aircraft design, which could save more than 20% in fuel burn per seat mile. 6 In some configurations, the engine is embedded or semi-embedded in the fuselage and the air is often ducted into convoluted intakes which feed the propulsion system. 2 The flow associated with these intakes is highly unsteady and distorted due to the flow separations and the secondary flows promoted by the duct bends.7–9 The flow distortion has a direct impact on the propulsion system performance and reliability,10,11 since it can penalize the aerodynamic stability12,13 and can produce forced excitations which can adversely affect the mechanical system compatibility.14,15 Moreover, it has been demonstrated that inlet entry conditions have an impact on the S-duct aerodynamics.16,17 Often, experimental testing and S-duct CFD optimization are required to assess the operability of the propulsion system for a range of different inlet configurations.18–20
Among the non-uniform inlet conditions, the ingestion of vortices and total pressure profiles are of interest especially for the new generation of aircraft. The ingestion of vortices in aero-engines has been investigated for the characterization of ground vortices. 21 This topic is still of importance for aircraft manufacturers, especially in relation to the ingestion of foreign object debris and for cross-wind conditions.22,21 Depending on the configuration, the closer integration of the engine with the fuselage may promote the formation of vortices which arise from the aerodynamic surfaces. In addition, the engine may be exposed to vortices which originate from the inner wing leading edge, canards, strakes and forebody. 23 Understanding the interaction of the vortices with the complex flow field of S-duct intakes is believed to be a cornerstone for the successful integration of the complex intakes with the propulsion system. 24 In addition, the use of devices to assess the impact of inlet total pressure distortion is an established approach. 25 Many design methods and analytical solutions have been used throughout the years 26 and, more recently, additive manufacturing enabled the production of gauzes to generate non-uniform total pressure profiles to a thick approaching boundary layer. 3 The integration of CFD and experimental design methods demonstrate that is possible to generate swirl, total pressure, or combined swirl and total pressure distortion.27–29
Recent advanced experimental methods have provided a notable advance in the characterization of the flow distortion in S-duct intakes. Stereo particle image velocimetry (S-PIV) has been applied to assess the unsteady 3D velocity and swirl distributions at the aerodynamic interface plane (AIP). This offered synchronous non-intrusive measurements with a data density up to two orders of magnitude greater than traditional measurement techniques.30,31 S-duct with a relatively high centreline offset generally presented greater unsteady swirl distortion levels. 32 Proper orthogonal decomposition (POD) revealed the fundamental coherent structures which drive the unsteady swirl patterns at the AIP. 33 The extreme value theory (EVT) estimated upper bounds of the swirl fluctuations beyond the measured dataset. 34 It was demonstrated as a tool to predict the peak distortion for events whose observations would require prohibitively long testing duration. 35 The introduction of time-resolved particle image velocimetry (TR-PIV) enabled the assessment also of the characteristic spectral signature of the swirl distortion. 36 These fluctuations were found to fall in the range in which disturbances may trigger instability of the compressor system, which is from 1-per-rev to the passing frequency of the fan blades for axial compressors. 37
However, there is little evidence of the impact of non-uniform inlet conditions on the inherent flow distortion of S-duct intakes. Only a few published studies have assessed the influence of inlet vortices for S-duct intakes. Most of the research focused on the use of inlet vortex generators as flow control devices to reduce the separations within the intake, the strength of the secondary flows and, consequently the engine fan face distortion.38–40 For example, a study on the reduction of the unsteadiness of the peak swirl with sub-boundary layer vortex generators was conducted by Tanguy et al. 41 Research focused also on methods to generate vortices for engine inlet applications and on the vortex development from the source (i.e. ground vortex or wingtip vortex) to the intake.42–44 A few experimental studies focused on the impact of inlet vortices onto the S-duct aerodynamics. Wendt and Reichert 45 demonstrated that the inlet vortex position influenced the swirl and pressure distortion at the S-duct outlet, but the findings were limited by the experimental capability. 45 Similar conclusions were drawn by Mitchell 46 who found that the wing tip vortex trajectory and impact on compressor surge margin depended on the vortex position along the main vertical intake axis. The greater impact on surge margin was found for the ingestion of the vortex at the centre of the intake, which reduced the non-dimensional surge margin by up to 6%. The inlet vortex had a more significant impact at higher compressor rotational speeds. It also revealed that the rotation direction of the vortex plays a significant role on the impact on compressor surge margin. For a vortex rotating counter to the engine, the surge margin reduced by up to 6%, while for a co-rotating vortex the surge margin reduced by 3%. 46 More recent computational studies by Mehdi 47 confirmed these observations. Contra-rotating vortices drove a raise in compressor pressure ratio, and at the same time, a reduction of isentropic efficiency compared with the effect of co-rotating ones. The greatest loss in compressor pressure ratio was found for high-strength vortices ingested near the hub. He also demonstrated that for constant total vortex circulation, vortices with smaller core size were more detrimental to compressor performance than larger ones because they caused larger separations on the rotor blades. 47 However, in general, there is a lack of investigation of the impact of inlet vortices on the unsteady flow distortion characteristics of S-duct intakes.
Similarly, while a considerable amount of research focused on generalized inlet pressure distortion, very few studies have been published on the impact of boundary layer ingestion on S-duct unsteady aerodynamics. Rein and Koch 48 demonstrated that the distortion at the AIP increases proportionally with the thickness of the inlet boundary layer. Thick boundary layers were found to reduce also the pressure recovery on the intake49–51 and to promote non-uniform radial pressure loading on the compressor blades which could trigger stall inception. 4 Different azimuthal orientations of the approaching boundary layer were also investigated for intakes under yaw and pitch angles52,53,18 were found to notably influence the fan-face pressure and swirl distortion. However, the associated peak distortion levels were not assessed as a part of these previous studies and most studies were limited to investigations on the time-averaged components. 50 The understanding of peak distortion levels is a key aspect for the evaluation of the engine response to the inlet distortion. Indeed, it is believed that peak fluctuations of pressure, vorticity and velocity can all play a role in the spike-type stall inception mechanism, which is a source of instability for modern, highly loaded compressors. 54 Moreover, most of the intake distortion work is based on canonical configurations with uniform conditions, and there is little information on the impact of inlet conditions on the inherent distortion of the S-duct intake.
Within this context, the aim of this work is to quantify the impact of non-uniform inlet conditions, total pressure profile and inlet vortices on the unsteady aerodynamics of the intake, and to characterize the peak level of distortion with a statistical modelling of the extreme events. Flow-conditioning devices are introduced at the inlet of an S-duct intake to generate non-uniform inlet conditions including vortices of different strength and position, and total pressure profiles with different thickness and azimuthal orientation with respect to the intake. The effect of these non-uniform inlet conditions on the inherent S-duct flow distortion is assessed with S-PIV measurement at the AIP. Flow distortion metrics and unsteady analysis methods are applied to assess the measured peak distortion levels for the various test cases, and the extreme value theory is applied as a statistical model to estimate the upper bounds of the unsteady distortion distribution for observations beyond the experimental testing time.
Experimental details and analysis methods
Test rig for S-duct intakes
A comprehensive description of the complex intake facility is outlined in Zachos et al.
30
It comprises a diffusing S-duct intake similar to that of Garnier et al.
9
The rig operating point was set at Mach 0.27, and it was measured at the inlet plane located 1.45Din upstream of the inlet of the S-duct intake (plane 3, Figure 1). Cranfield test facility schematic: 1 – Trailing edge of the vortex generator, 2 – position of the honeycomb gauze screen, 3 – PIV measurement plane at S-duct inlet and 4 – PIV measurement plane at S-duct AIP.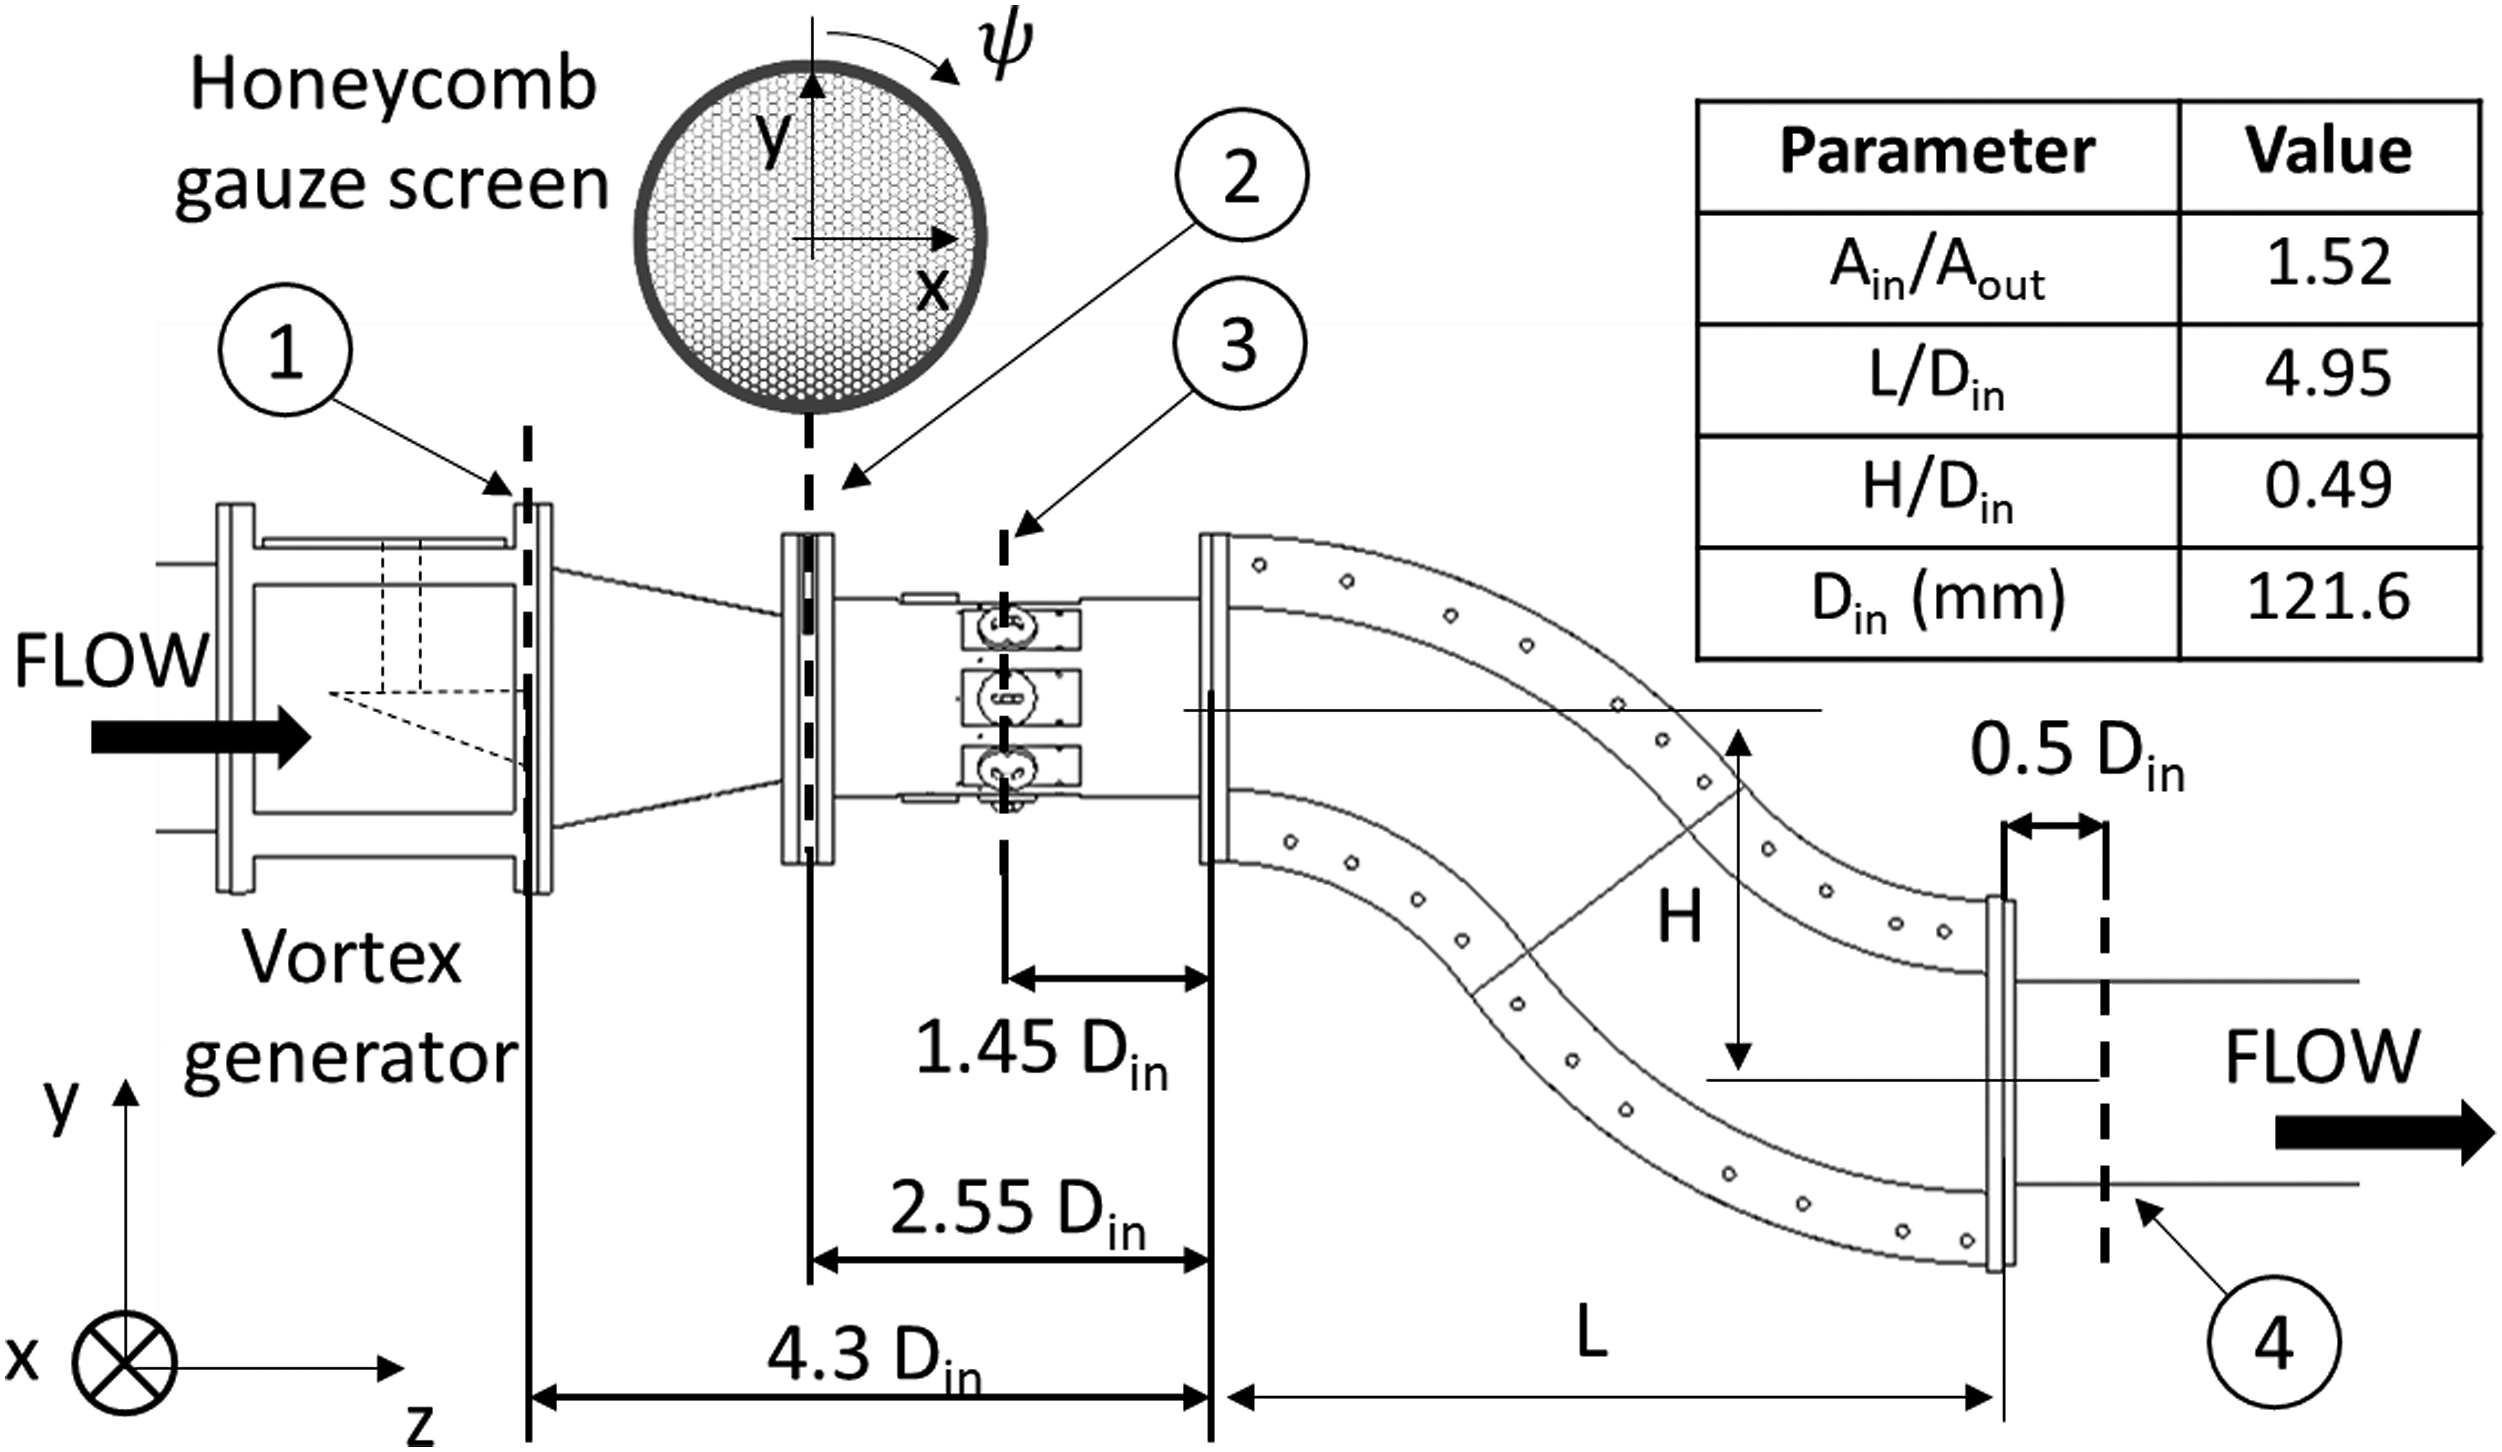
Inlet vortices
Vortices at the inlet of the S-duct were generated with a semi-span delta wing55,56 which was positioned 4.3Din upstream of the S-duct inlet plane (about 3.35 chords). It had a maximum chord length Semi-span delta wing dimensions and definition of the angle of attack (AoA) relative to the incoming flow (top view).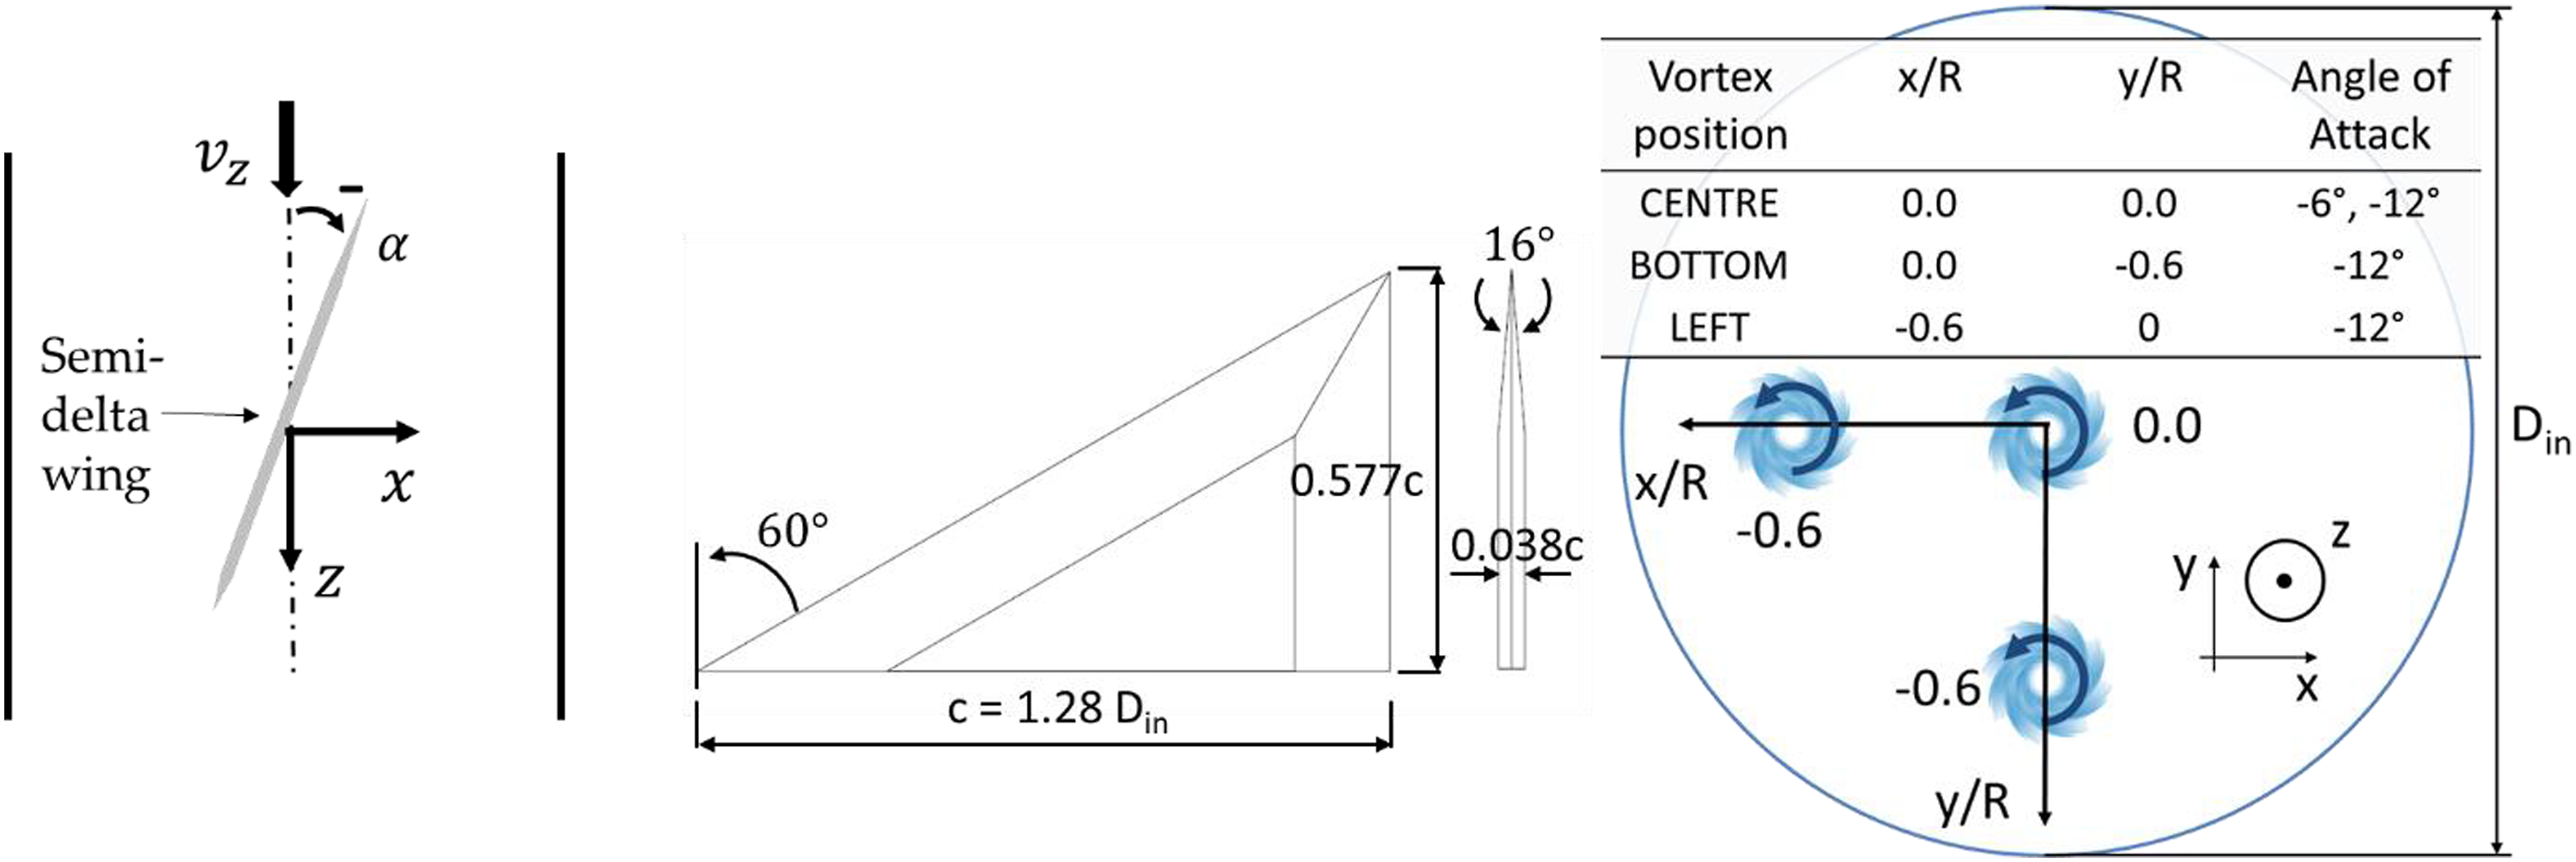
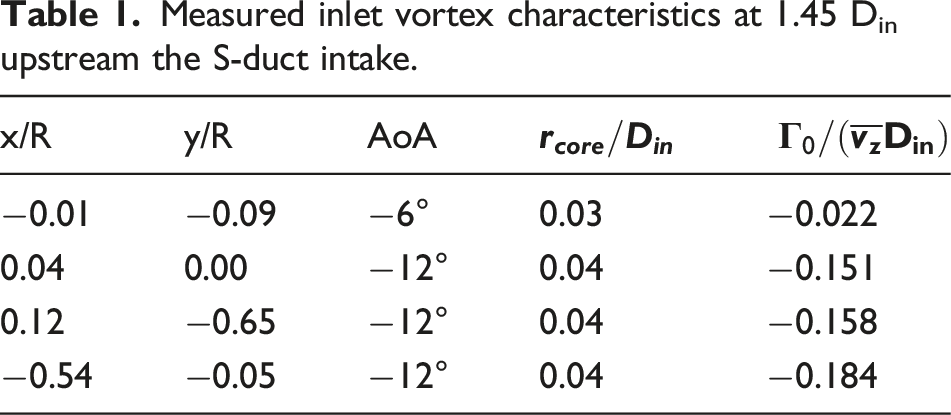
Measured inlet vortex characteristics at 1.45 Din upstream the S-duct intake.
Inlet total pressure distributions
For the generation of non-uniform total pressure distributions at the inlet of the S-duct, distortion gauzes were placed at plane 2 (Figure 1), 2.55Din upstream of the S-duct. A honeycomb gauze screen with variable porosity
3
reproduced a boundary layer–type total pressure profile
59
whose thickness was δ/Din = 0.332 (Profile A)
4
and
TR-PIV experimental setup
Time-resolved PIV was used for the measurements of the velocities at plane 4 (AIP, 0.4Dout, Figure 1). Di-ethyl-hexyl sebacate particles of approximately 1 μm seeded the flow and were spotlighted with a pulsed Nd:YAG laser on cross-flow planes 3 and 4 (Figure 1). A pair of CMOS cameras at each side of the rig were used to record the PIV images. The cameras had 16,600 fps as maximum frame rate, and the sensor resolution was 1280 × 800 px2 (1MP). The acquisition frequency was 4 kHz, which is substantially higher than the main flow frequency of around
Methods for the flow distortion assessment
The swirl distortion patterns have been evaluated with the SAE industrial distortion descriptors.
28
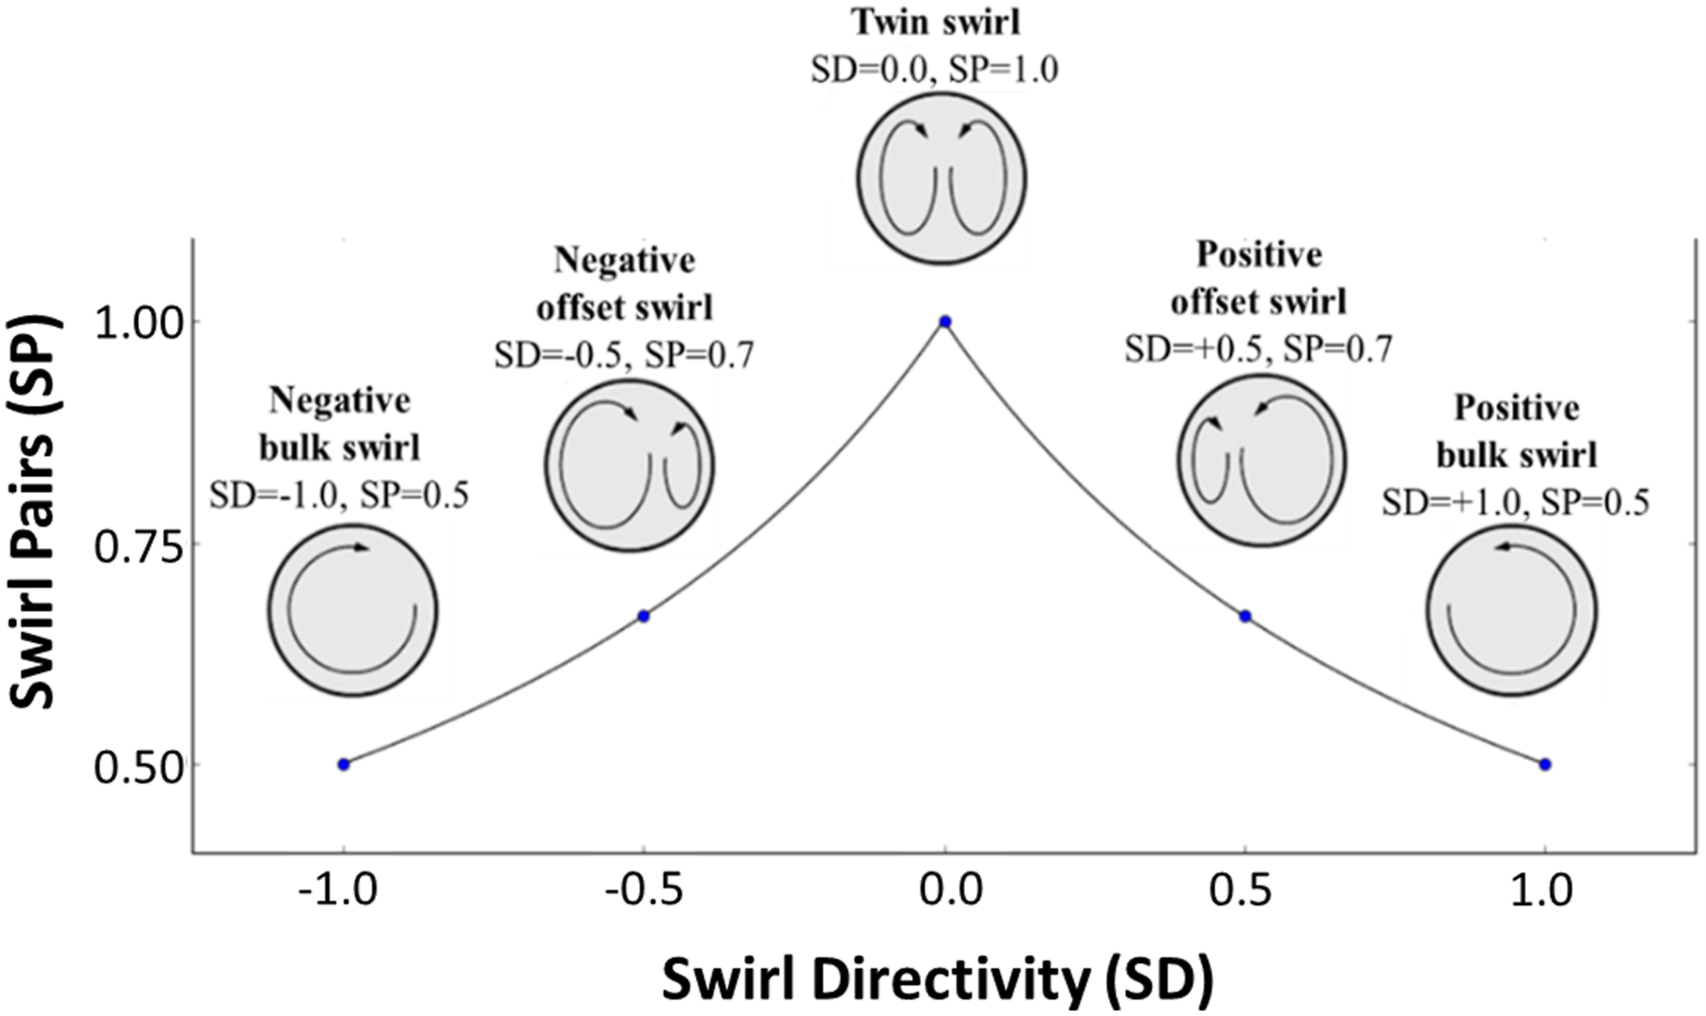
The swirl angle at the AIP is positive in the counter-clockwise direction considering the right-hand rule and the out-of-plane velocity vector. The swirl distortion is evaluated with swirl descriptors computed based on a polar grid of rings at the AIP. The swirl intensity (SI) measures the potency of the swirl, the swirl directivity (SD) the main sense of rotation and the swirl pair (SP) the number of contra-rotating vortices pairs. A more detailed description is reported by Zachos et al.
30
and an overview of the main swirl patterns is shown in Figure 3. The Delaunay triangulation method is used to interpolate the TR-PIV data at the radial locations.
63
The swirl descriptors are evaluated at each timestep of the PIV acquisition. To depict the relative probability of the swirl patterns, the analysis adopted the joint-probability density functions (j-PDF) introduced by Gil-Prieto et al.
36
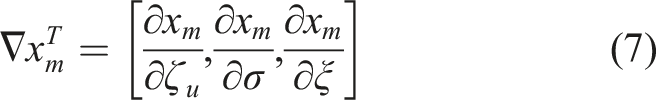
The probability to detect a certain swirl pattern is computed through the integration of the PDF on a discretization of the SI-SP grid (equation (7)) with a resolution of 0.03 for both descriptors. The analysis focuses on the swirl descriptors at a radial location close to the compressor blade tip (r/R = 0.84) since this is the region where stall inception is believed to originate from
54
Correlation between swirl patterns and SAE descriptors adapted from Ref. 28.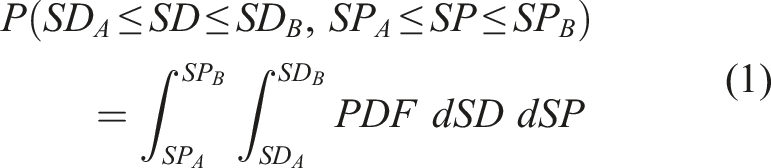
For analysing the spectral signature of the swirl distortion, an average periodogram method was introduced.
64
Each PIV dataset has been divided into 20 parts. The frequency leakage was limited with the application of a Hann window. The resolution of the measured frequency is
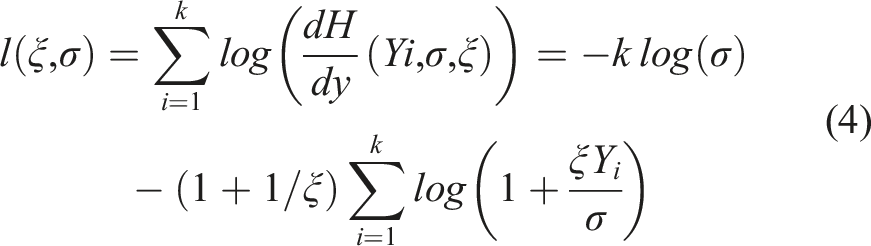
Modelling of the extreme distortion events
The extreme value theory (EVT) was applied to the unsteady data to estimate the peak distortion levels for observations beyond the experimental testing time. The EVT method was introduced in the context of the prediction of peak flow distortion by Jacocks et al.
65
and it has also been used in previous work by Gil-Prieto et al.
34
and Tanguy et al.
35
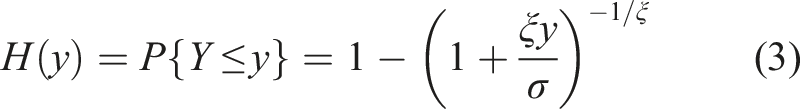
to predict the peak total pressure and peak swirl distortion, respectively, in the context of S-duct flow distortion. This work applies the EVT in the peak-over-threshold formulation which is based on the threshold models reported by Coles,
66
which considers events as extreme if they exceed a certain threshold 


Results
Impact of inlet vortex on the AIP flow distortion
The characteristic flow topology for S-duct intakes is assessed with the TR-PIV measurements at the AIP. The velocity measurements are normalized against the time-averaged, area-averaged streamwise velocity Time-averaged components at the AIP. Streamwise velocity, swirl angle and unsteadiness of the swirl angle. Conditions: uniform inlet and inlet vortex.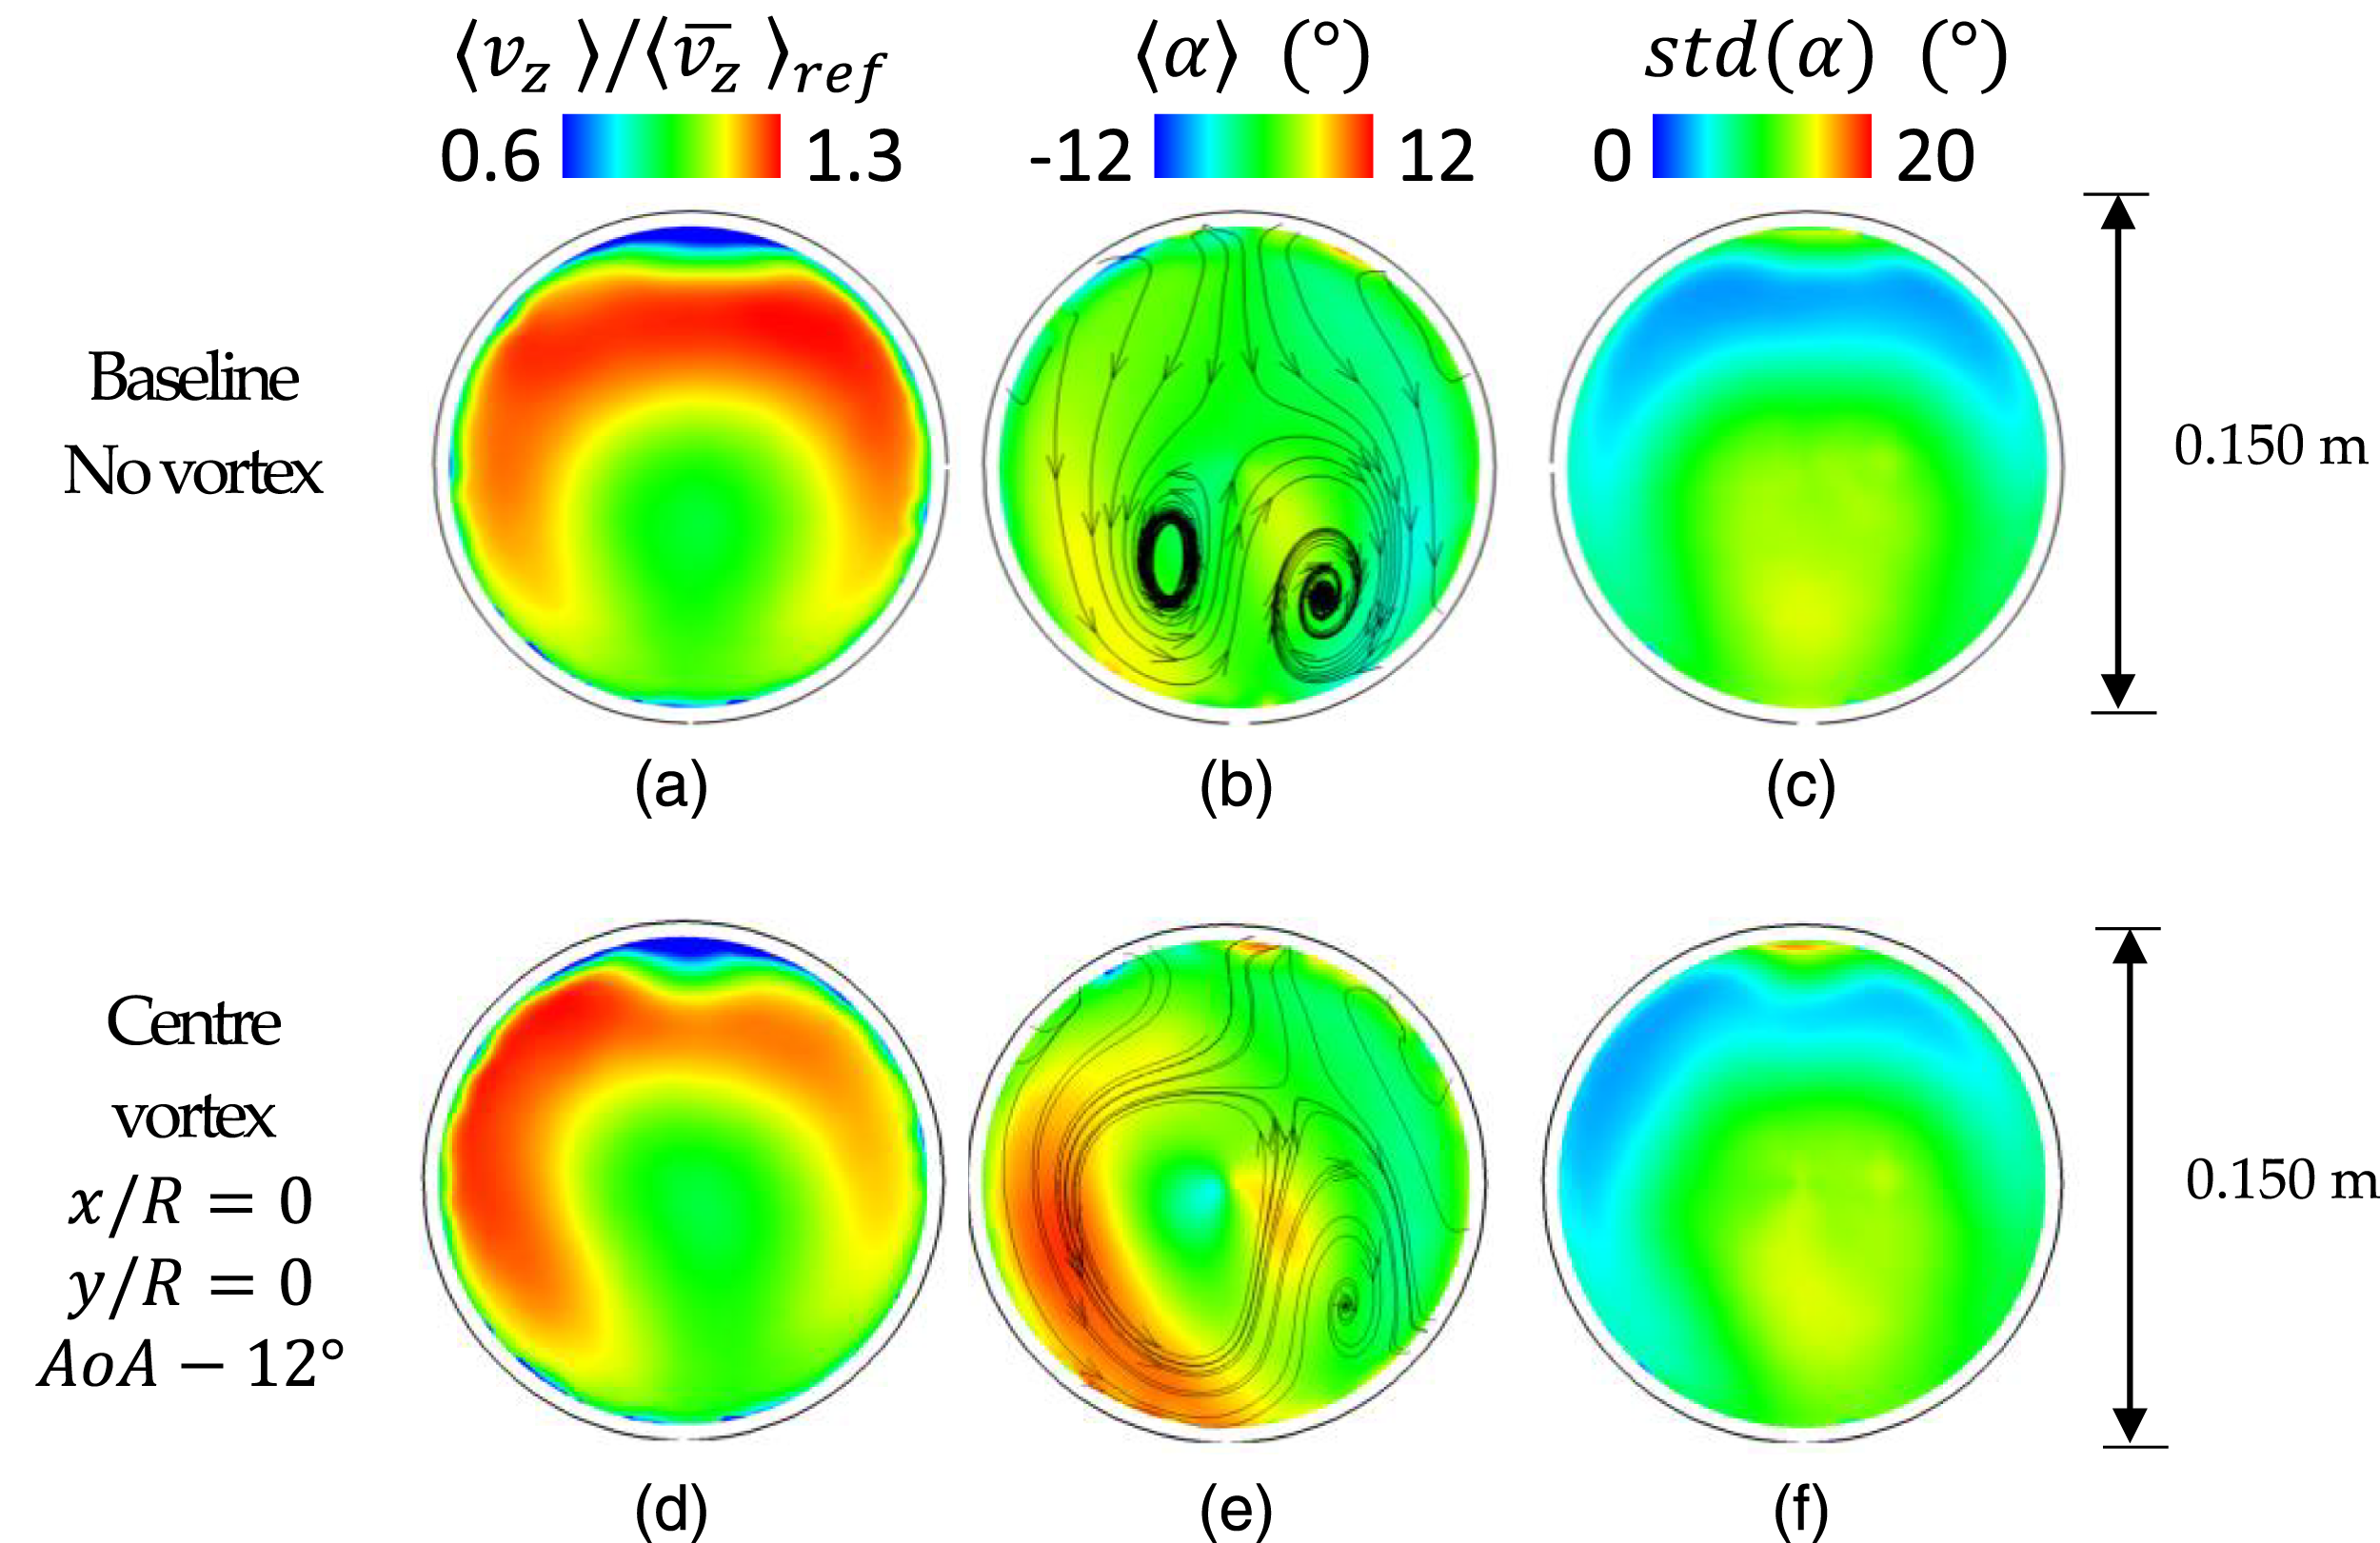
The presence of an inlet vortex at the centre of the inlet section promoted the development of the inherent duct secondary flows, especially with the delta wing AOA = −12° (Figure 4(d) and (f)). The left Dean vortex, which is rotating anti-clockwise as the inlet delta wing vortex, strengthens and becomes predominant, and consequently, the time-averaged maximum swirl angle increases from +8° (baseline case, Figure 4(b)) to +12° (AoA = −12°, Figure 4(e)). This effect is also visible on the out-of-plane velocity distribution for which the magnitude increases towards the left side of the domain (Figure 4(a) and (d)). This vortex increased the positive time-averaged peak swirl located in the left side of the domain from +6° to about +11° (Figure 4(e)) relative to the baseline case (Figure 4(b)). This could represent a challenging operating condition for a compressor rotor since it will likely experience a change in blade loading when passing through this region. Indeed, if the rotor is counter-rotating relative to the vortex (anti-clockwise for this configuration), its blade incidence is likely to be increased, potentially leading to separation and mechanical stress on the blade. 47 Interestingly, on the other hand, the unsteadiness of the swirl angle remains unaffected by the presence of the inlet vortex. The swirl angle fluctuations ranged from a minimum of 3° nearby the top of the AIP to a maximum of 14° approximately near the AIP centre (Figure 4(c) and (f)) in both baseline and vortex configurations. Although the bulk flow is redistributed, the presence of the vortex does not contribute to the unsteady fluctuations of the AIP flow distortion.
When the vortex strength was reduced (AoA = −6°), the impact on the flow distortion notably weakened. The impact on the out-of-plane velocity component
The analysis of the probability of swirl patterns with uniform inlet conditions was discussed by Gil-Prieto et al.
36
with j-PDF maps (Figure 5(a)). The alternation between these swirl patterns is caused by the swirl switching mode. Further evidence was reported in other work by MacManus et al.
31
and Gil-Prieto and al.
68
However, the ingestion of an inlet vortex disrupts this characteristic switching mode and promotes mainly positive bulk events (SD = +1). This is correlated with the strengthening of the anti-clockwise vortex reported in Figure 4(f). The higher the inlet vortex strength, the more evident is the predominance of positive bulk swirl events (Figure 5(b)) in contrast with the oscillatory mode of the baseline inlet conditions (Figure 5(a)). The presence of the vortex causes a slight increase of the maximum swirl intensity (SI) for bulk swirl patterns (SD = +1). In contrast to previous considerations on the time-averaged data, the disruption of the switching mode and the slight increase of SI were observed independently of the inlet vortex strength (AoA = −6° and −12°, Figure 5(b)). Thus, in summary, inlet vortices have a considerable impact on the probability characteristics of the flow topology at the AIP but have a small impact on the peak swirl intensity. Given the increase in the probability of bulk events and the previous work by Mitchell,
46
the potential impact on a compression system will depend on the relative spinning direction of the vortex and the engine. j-PDF of SI-SD distributions measured at the AIP at r/R = 0.84 for baseline and inlet vortex configuration.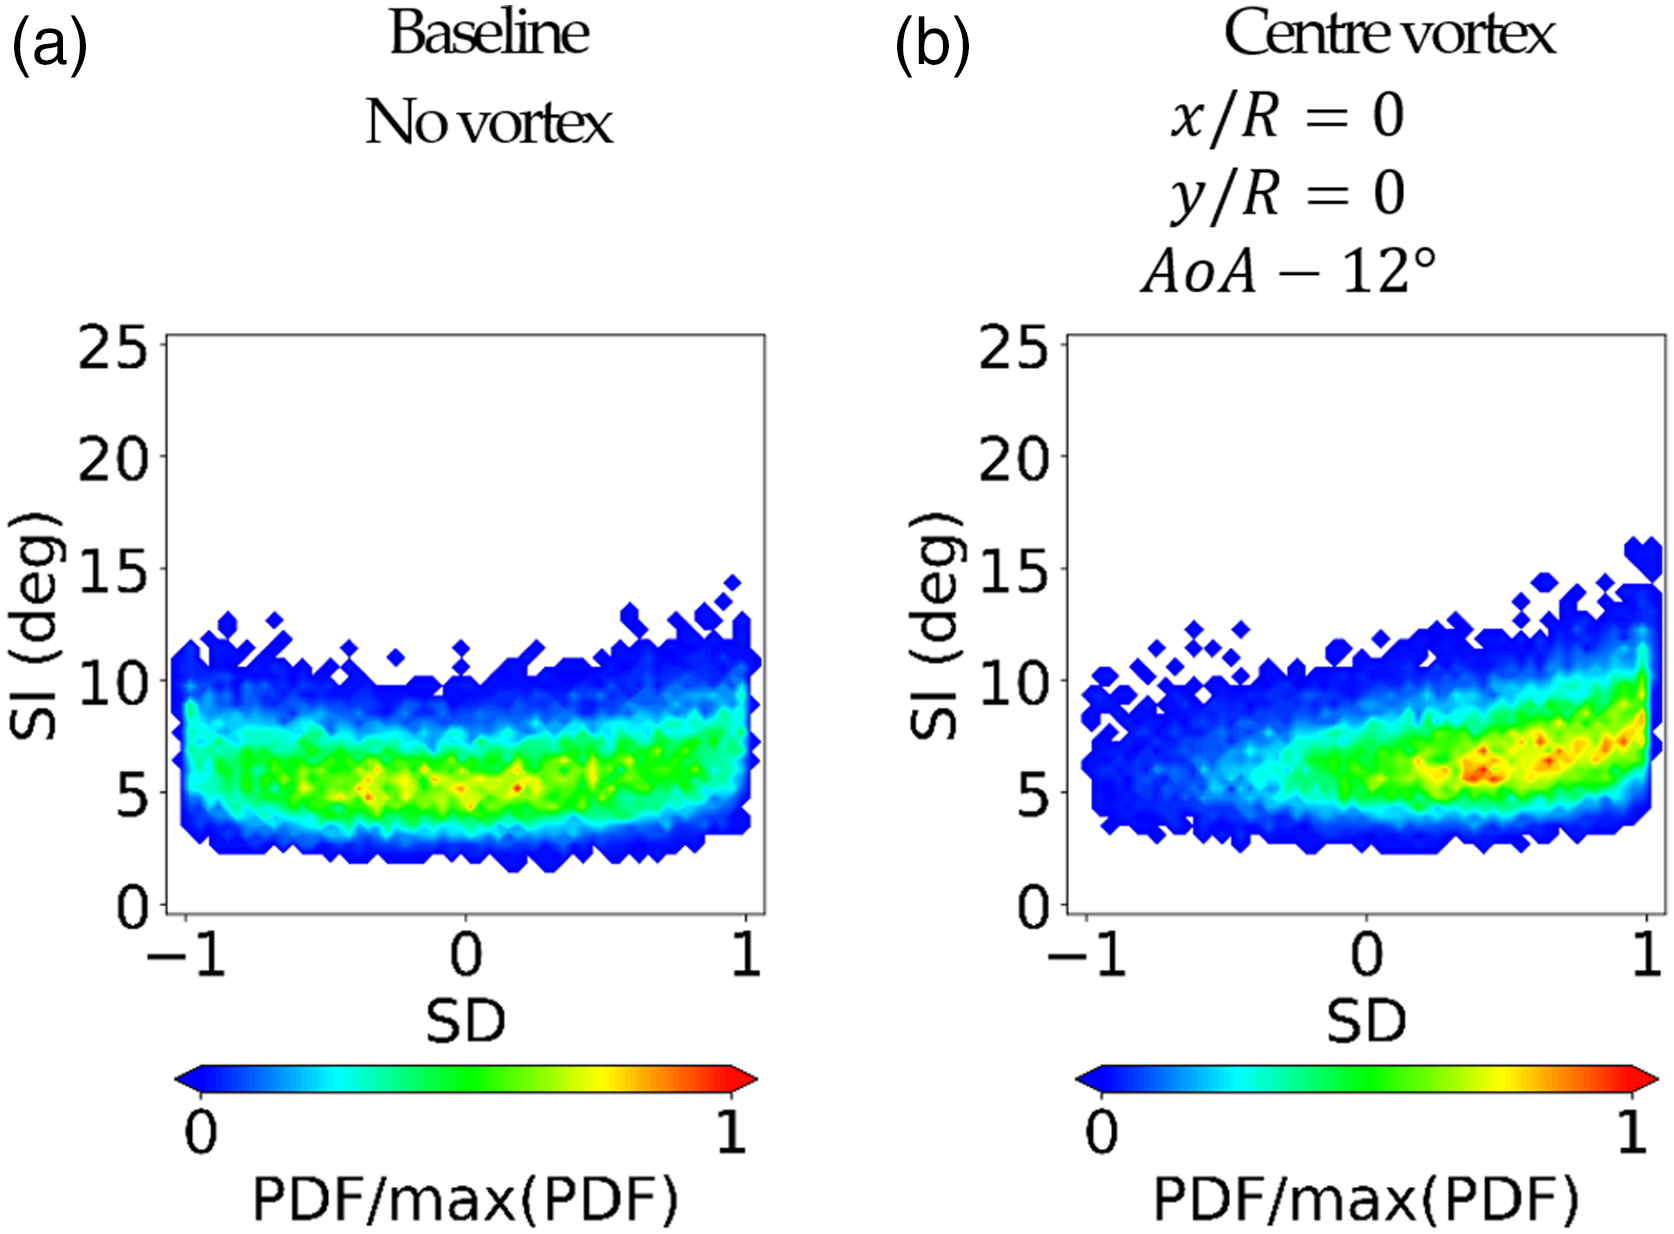
The evaluation of the peak distortion for the different configurations is of primary importance for the assessment of the intake-compressor compatibility and integration. It is known that the fan responds to the unsteady fluctuations of the flow 37 and that extreme swirl distortion events can trigger instabilities for the propulsion system. 54 As demonstrated by the j-PDF maps (Figure 5), peak swirl events are likely to be double the time-average swirl values and the statistical prediction with EVT showed even higher levels of peak distortion.34,35 The swirl intensity exhibited a correlation with the compressor pressure ratio and surge margin 47 ; thus, the assessment of the maximum level of swirl distortion may determine the propulsion system operability limits.
Impact of vortex ingestion position on flow distortion
For an embedded engine, it is possible that a discrete vortex could manifest in the forward regions of the intake system from a variety of sources, either ingested
46
or generated within the duct.
8
It is of interest to evaluate the interaction and the impact of additional distorted inlet conditions on the inherent distortion generated from the duct. Previous work revealed that the trajectory and the impact of inlet vortices depended on the ingestion position along the vertical intake axis.
46
The location at which the vortex is ingested depends on many factors, such as the origin position, the direction of the flow relative to the intake and the ground clearance.
44
In this work, the vortex generator has been translated along the vertical and horizontal direction in order to depict the influence of the vortex position relative to the inlet of the S-duct on the flow distortion at the S-duct AIP. During this process, the angle of attack of the delta wing was kept constant at AoA = −12° so that the total circulation was kept approximately constant at Time-averaged components at the AIP. Streamwise velocity, swirl angle and unsteadiness of the swirl angle. Conditions: inlet vortices configurations. j-PDF of the SI–SD distributions measured at the AIP at r/R = 0.84 for different positions of the inlet vortex relative to the S-duct inlet.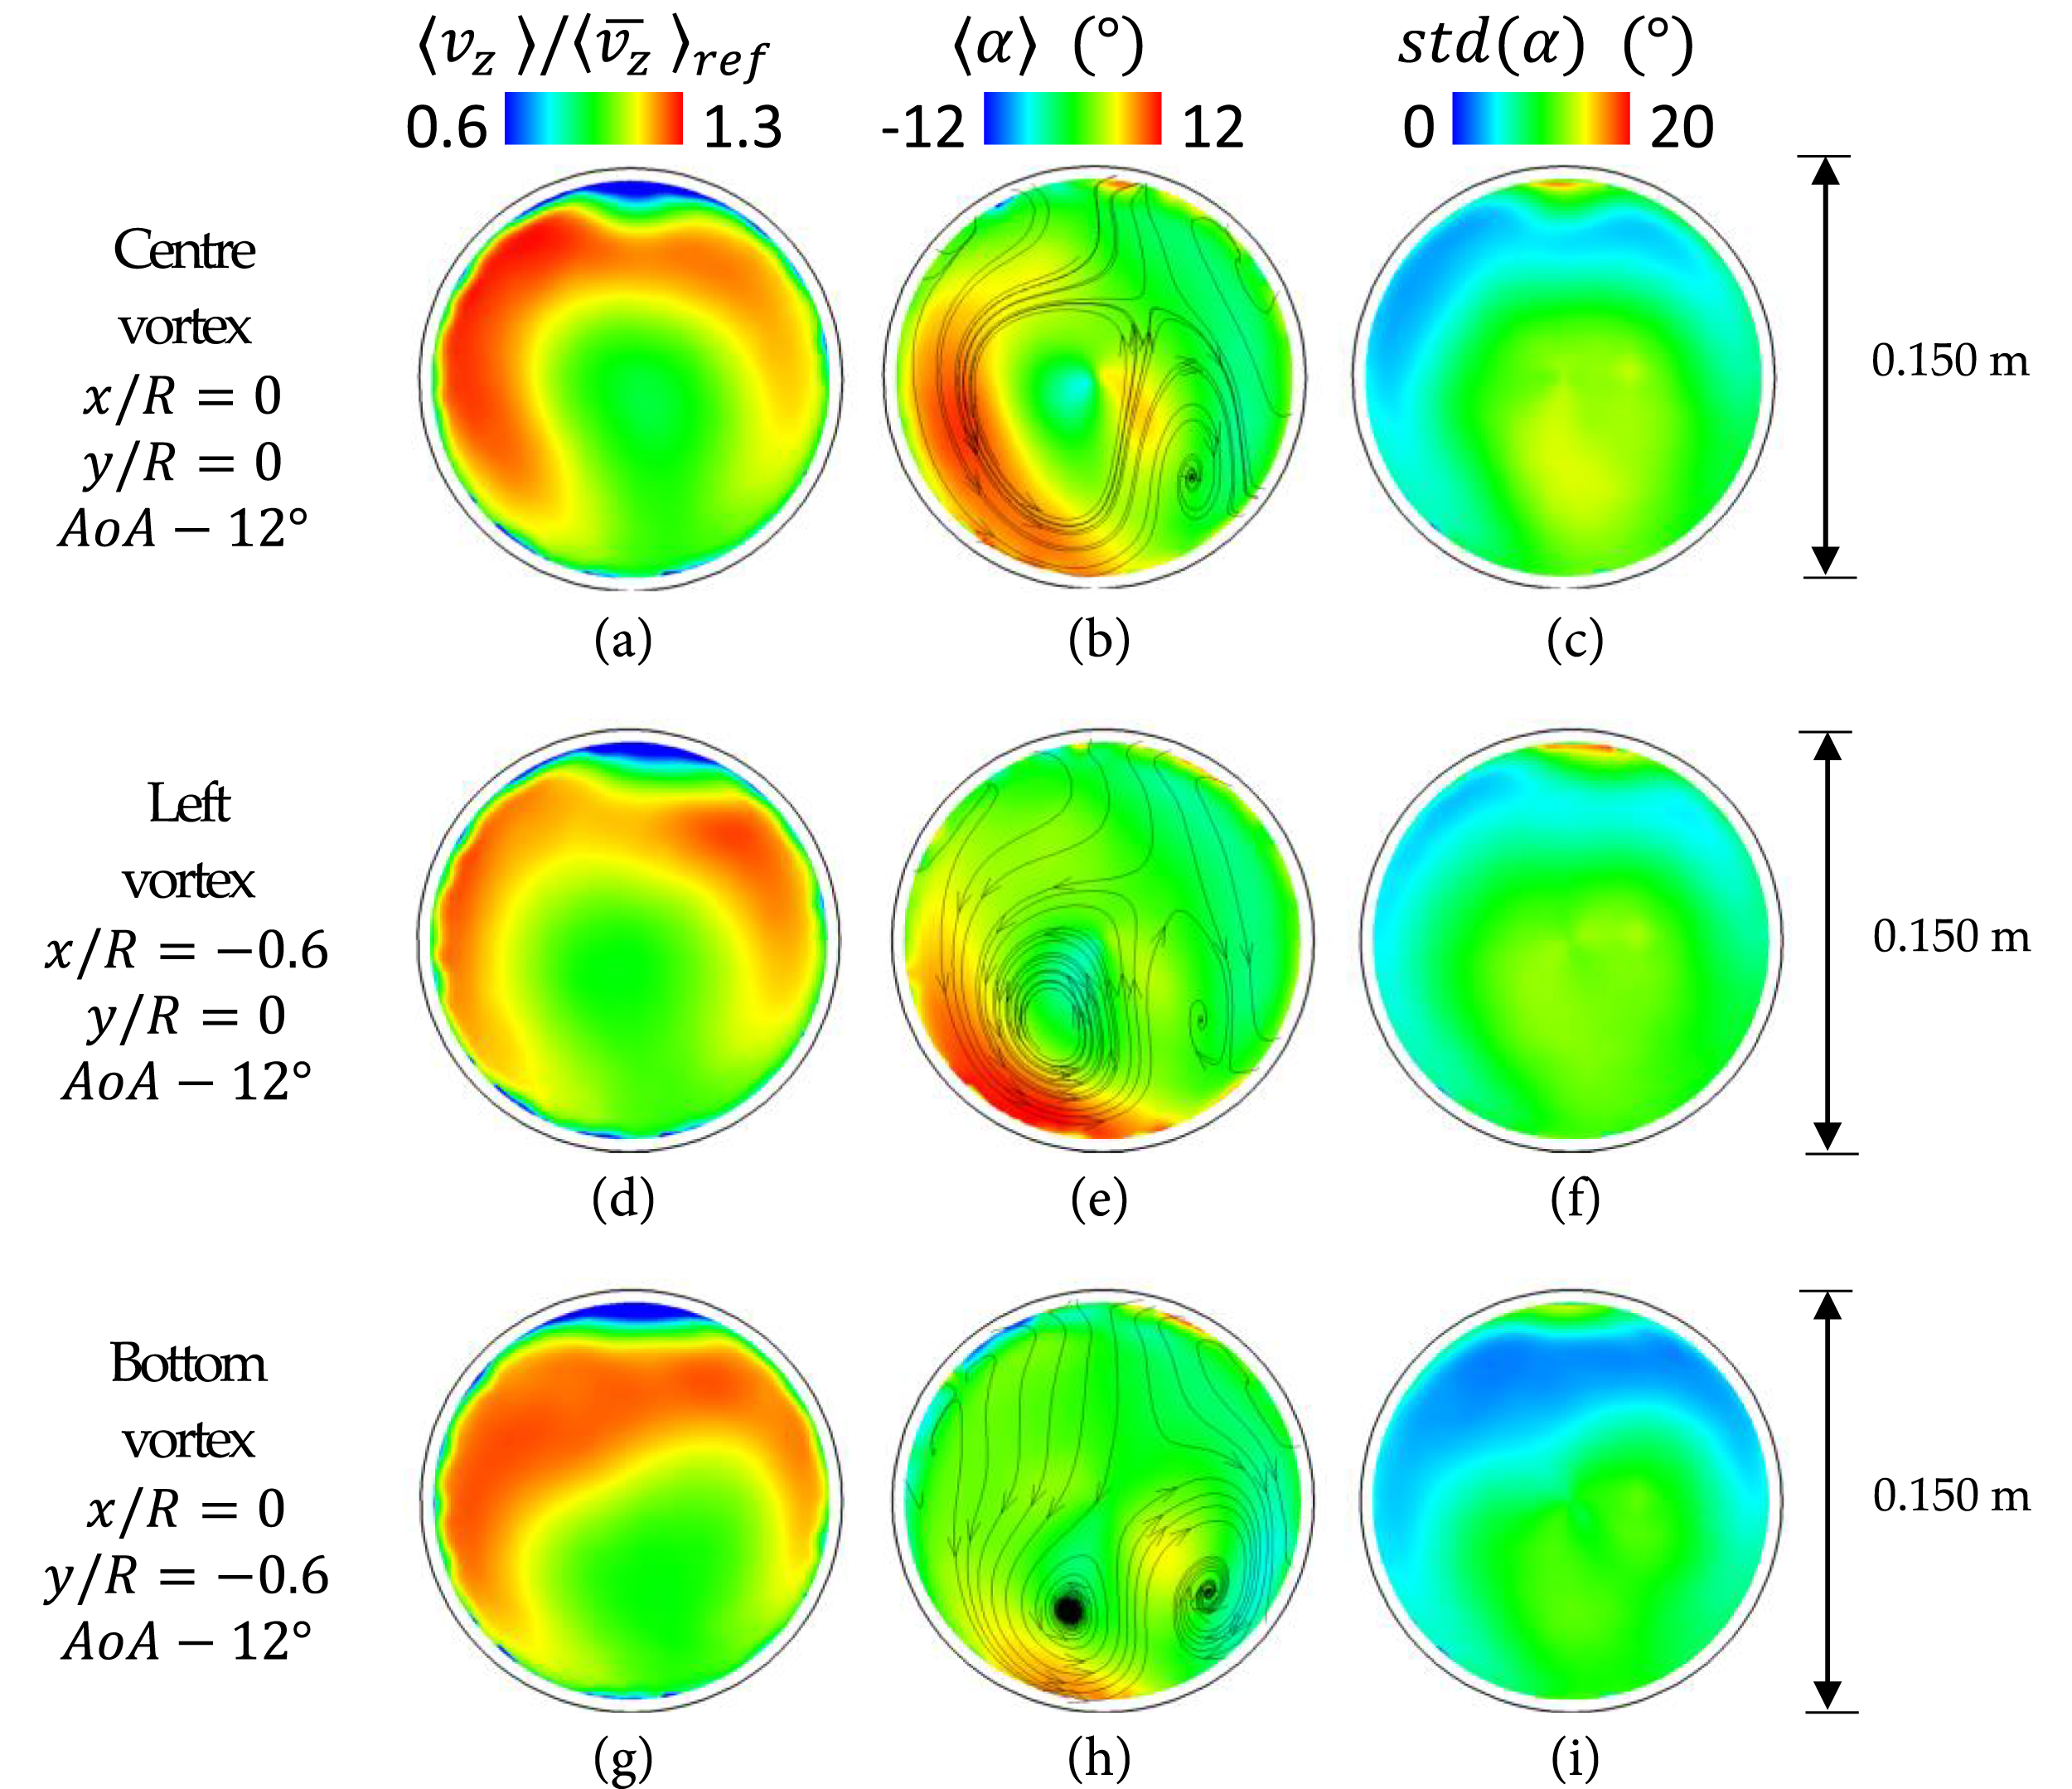
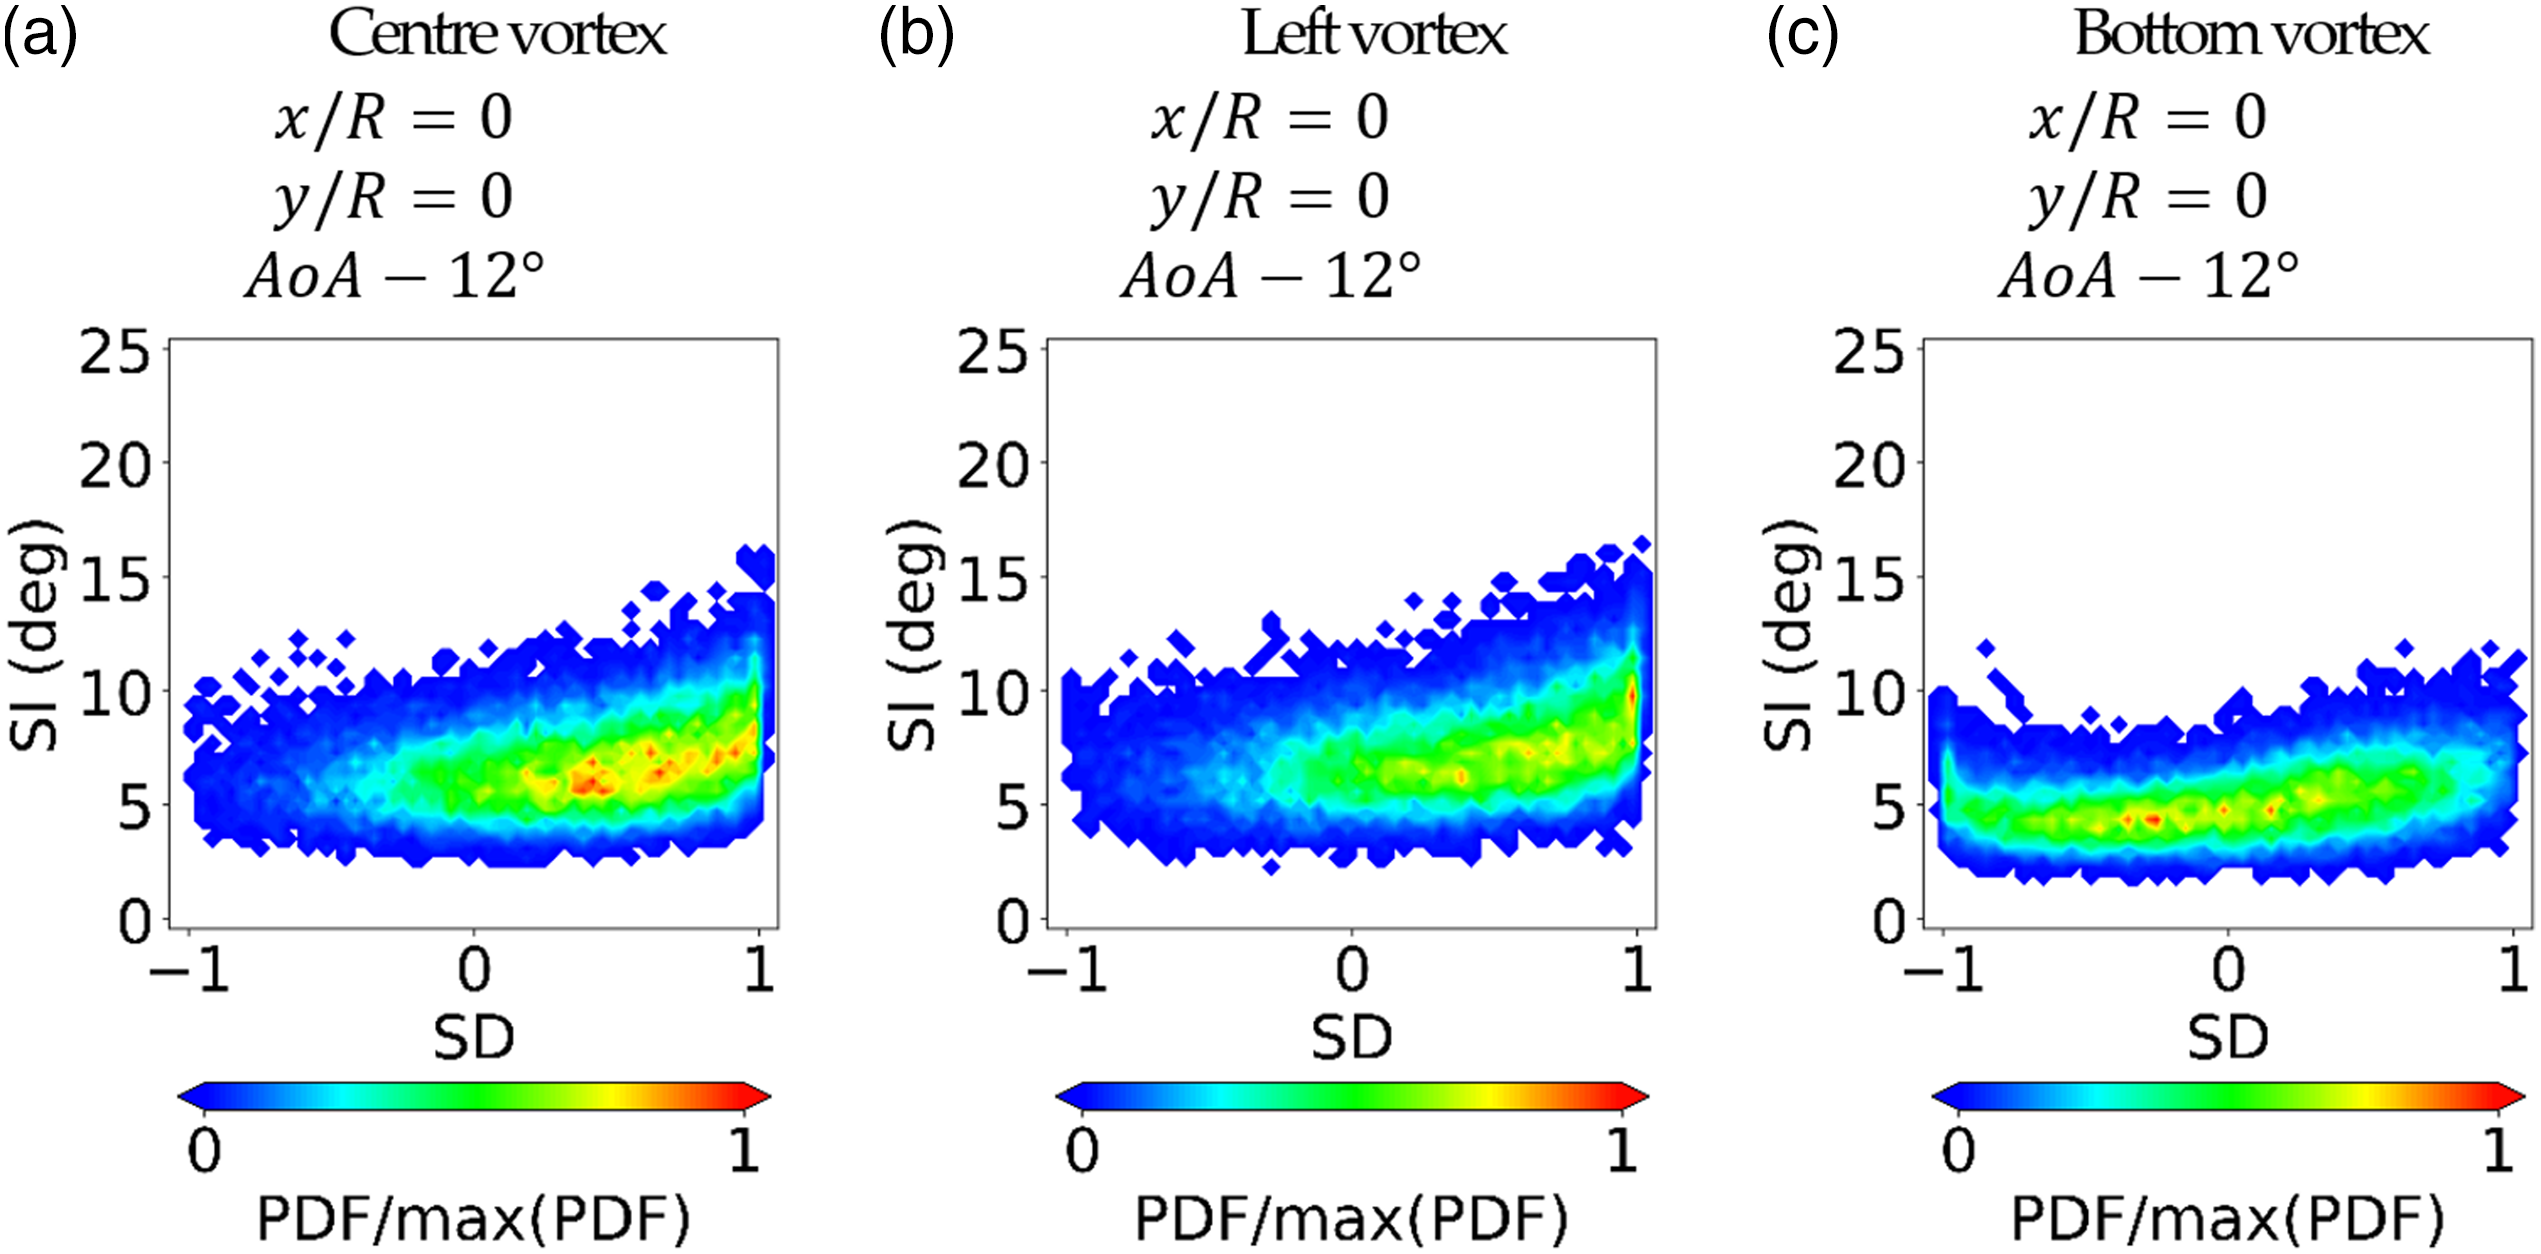
On the other hand, the vortex translation towards the lower part of the S-duct intake (x/R = 0, y/R = −0.6) caused a more pronounced impact on the AIP flow distortion. With the vortex at the lower part of the inlet section, the out-of-plane velocity (Figure 6(g)) redistributes and becomes more uniform and more similar to the distribution of the baseline inlet configuration (Figure 4(a)). This is accompanied with a reduction of the peak swirl angle from +13° to +9° (Figure 6(h)) when compared to the centre vortex configuration (Figure 6(b)). The area-averaged swirl angle unsteadiness (Figure 6(i)) also reduced by about 25% in comparison with the central vortex position (Figure 6(c)). The vortex at the inlet lower part reduced the AIP peak swirl intensity (SI) from 16.5° to about 13° compared to the centre and left inlet vortices (Figure 7(a) and (b)). A similar reduction was observed by the time-averaged swirl angle distribution whose maximum decreased by about 4° on average compared to the centre vortex case (Figure 6(g)). This reduction of peak SI can be considered beneficial as it is also lower than the baseline case with uniform inlet flow (Figure 5(a)). The reduction in SI of about 3.5° is comparable to passive flow control studies with vortex generators at the S-duct inlet plane, which reduced the peak SI by 3° to 7° depending on the vortex generator configuration. 41 In these previous investigations, multiple vortex generators were introduced at the bottom half of the S-duct inlet to reduce the fluctuations of the swirl angle at the AIP and promote a uniform distribution of the out-of-plane velocity component. However, while for previous work the vortices were generated within sub-boundary layer scales and influenced mostly the separation after the first S-duct bend, in this work, the vortex is on a much larger scale and interacts mainly with the bulk secondary flows. In contrast, the bottom inlet vortex ingestion did not promote the bulk swirl events (Figure 7(c)). Indeed, the switching mode is still predominant in the SI–SD distribution (Figure 7(c)).
In general, the ingestion of a vortex at the centre or left side of the S-duct inlet increased the time-averaged peak swirl angle and disrupted the flow switching mode. Instead, the ingestion of the vortex towards the duct's lower side showed a beneficial impact on the AIP flow distortion since it promoted the uniformity of the out-of-plane velocity component, and it also produced a slight reduction of the swirl angle fluctuations. Overall, the swirl intensity and peak distortion is modestly sensitive to the vortex position at the S-duct inlet and, in some cases, can even be beneficial. Nevertheless, this work demonstrates how the inlet vortex interacts with the duct flow field and walls. The effect of the inlet vortex is stronger when the vortex is close to the inlet's lower side since it interacts more strongly with the secondary flows and greatly reduces the flow distortion unsteadiness.
Impact of inlet total pressure profiles on flow distortion
The impact of inlet total pressure profiles on the flow distortion at the S-duct AIP was assessed as part of previous studies by McLelland et al.
52
and Migliorini et al.
59
For completeness and to enable the comparison between the influence of the inlet total pressure profiles and the impact of inlet vortices, some results by Migliorini et al.
59
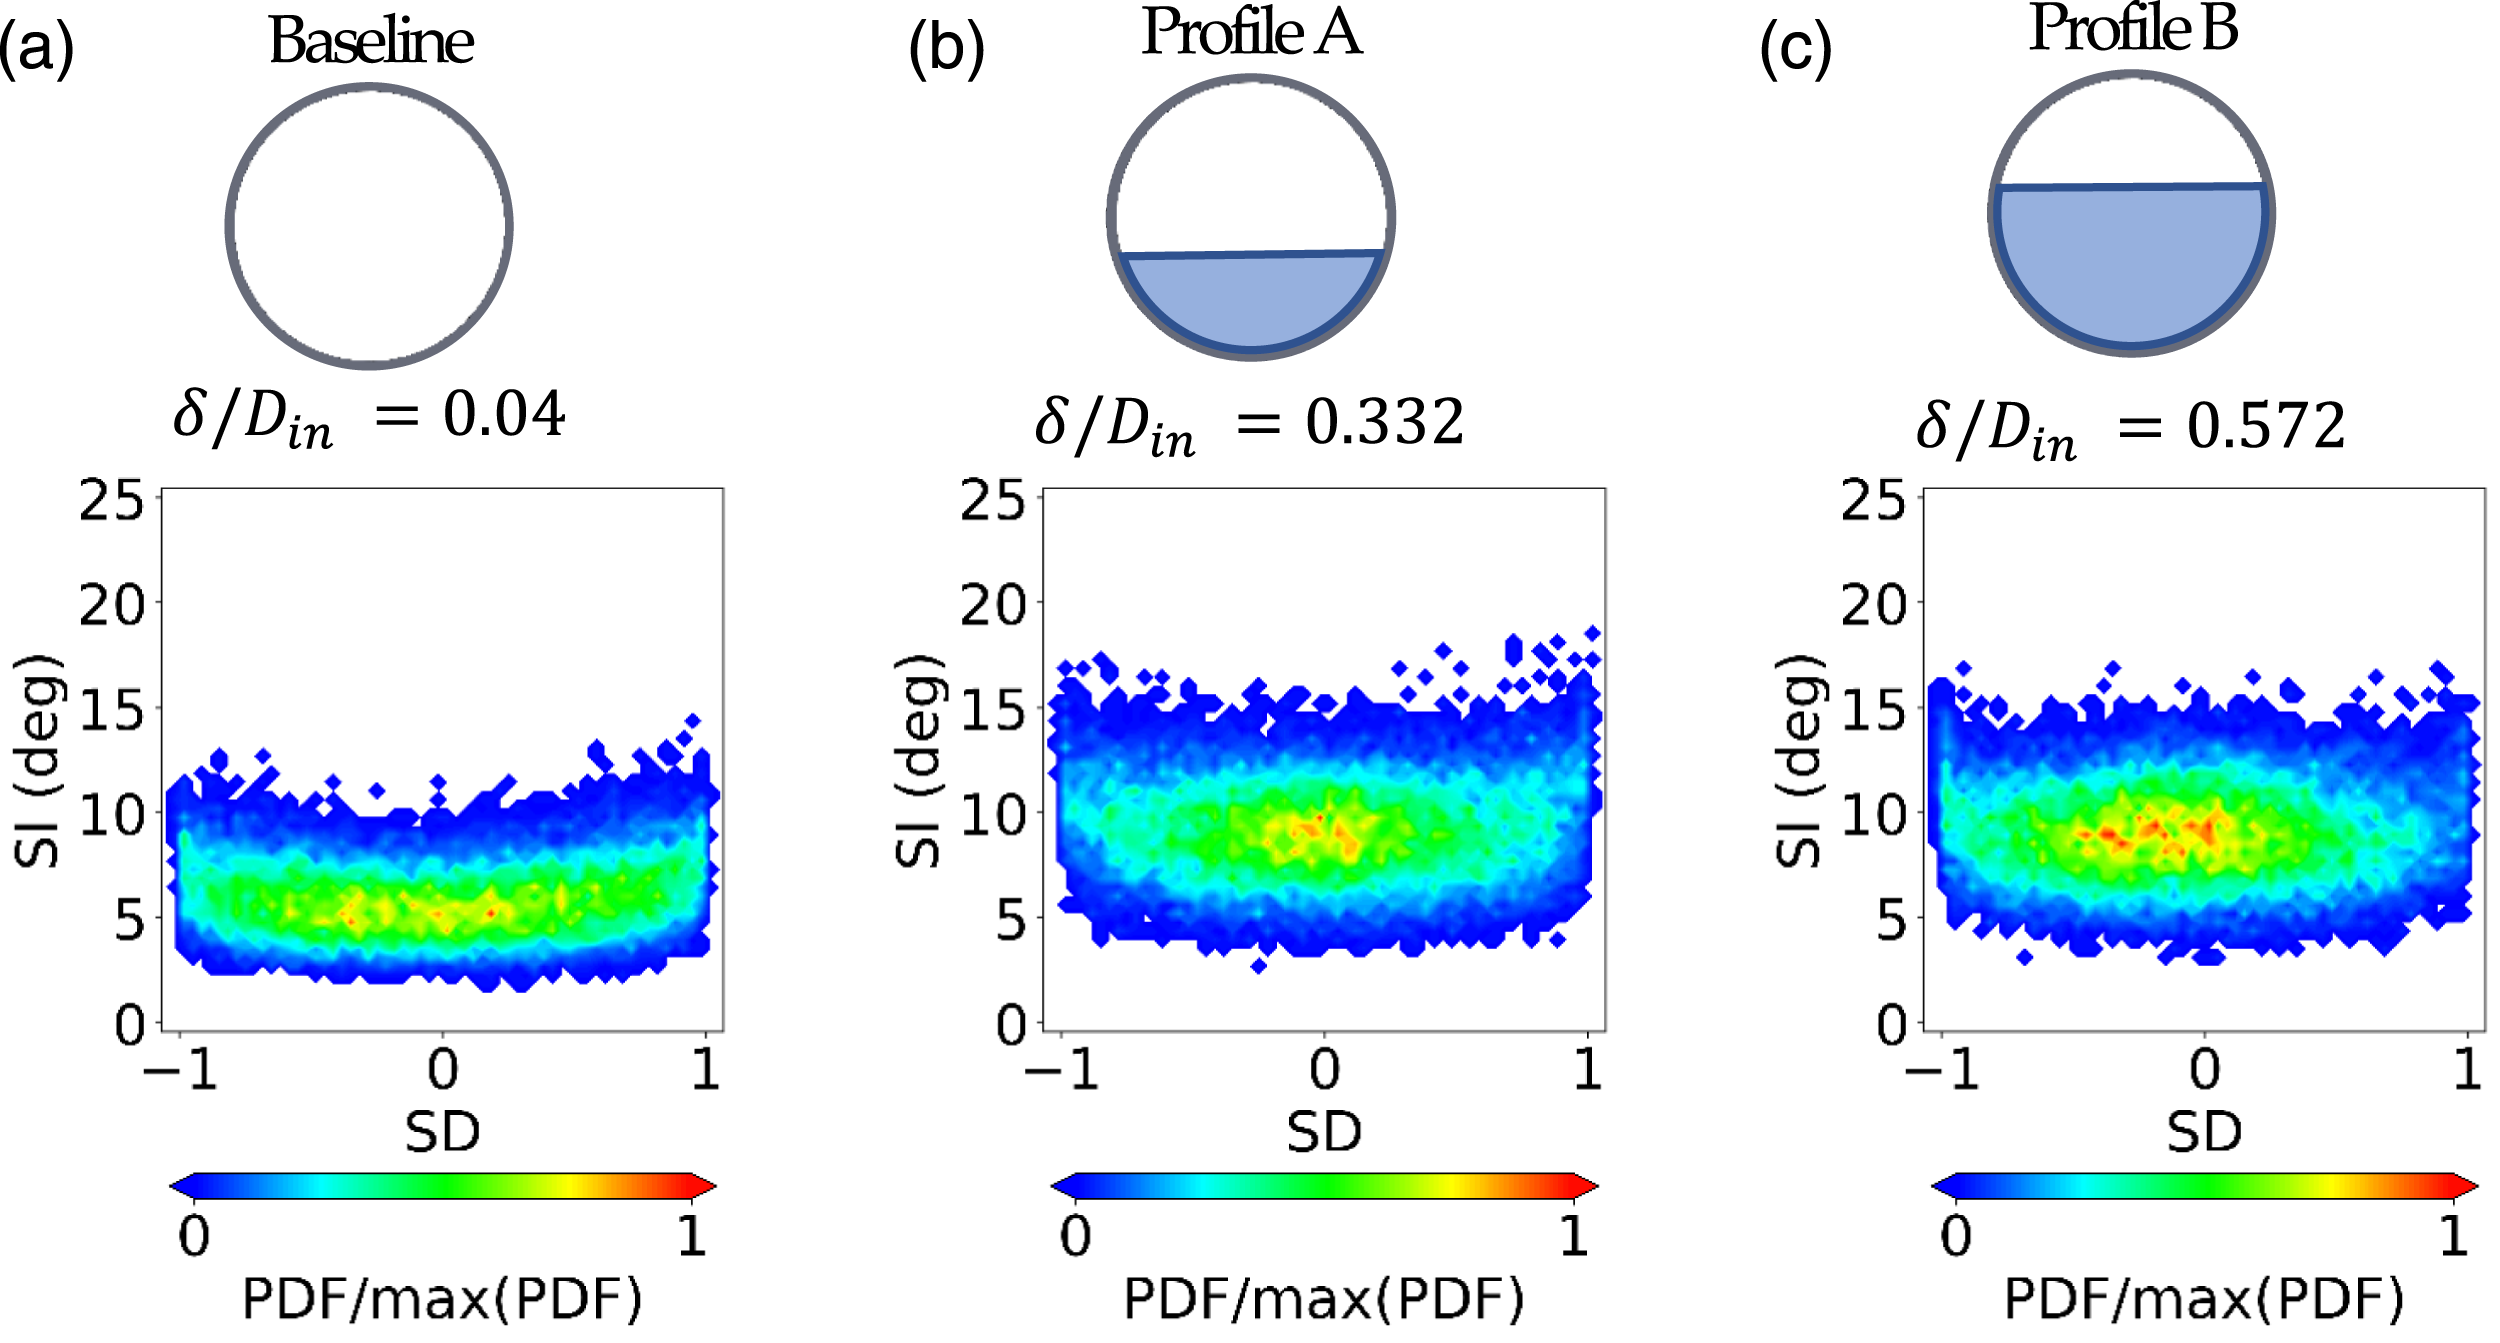
are also reported as part of the current paper. In general, the introduction of inlet total pressure profiles strengthened the secondary flows and thus produced an increase of the time-average swirl angle and its associated unsteadiness Time-averaged components at the AIP. Streamwise velocity, swirl angle and unsteadiness of the swirl angle. Conditions: inlet total pressure profile configurations. j-PDF of the SI-SD distributions measured at the AIP at r/R = 0.84 for different inlet conditions: baseline, Profile A and Profile B (δ/Din = 0.04, δ/Din = 0.332 and δ/Din = 0.572, respectively).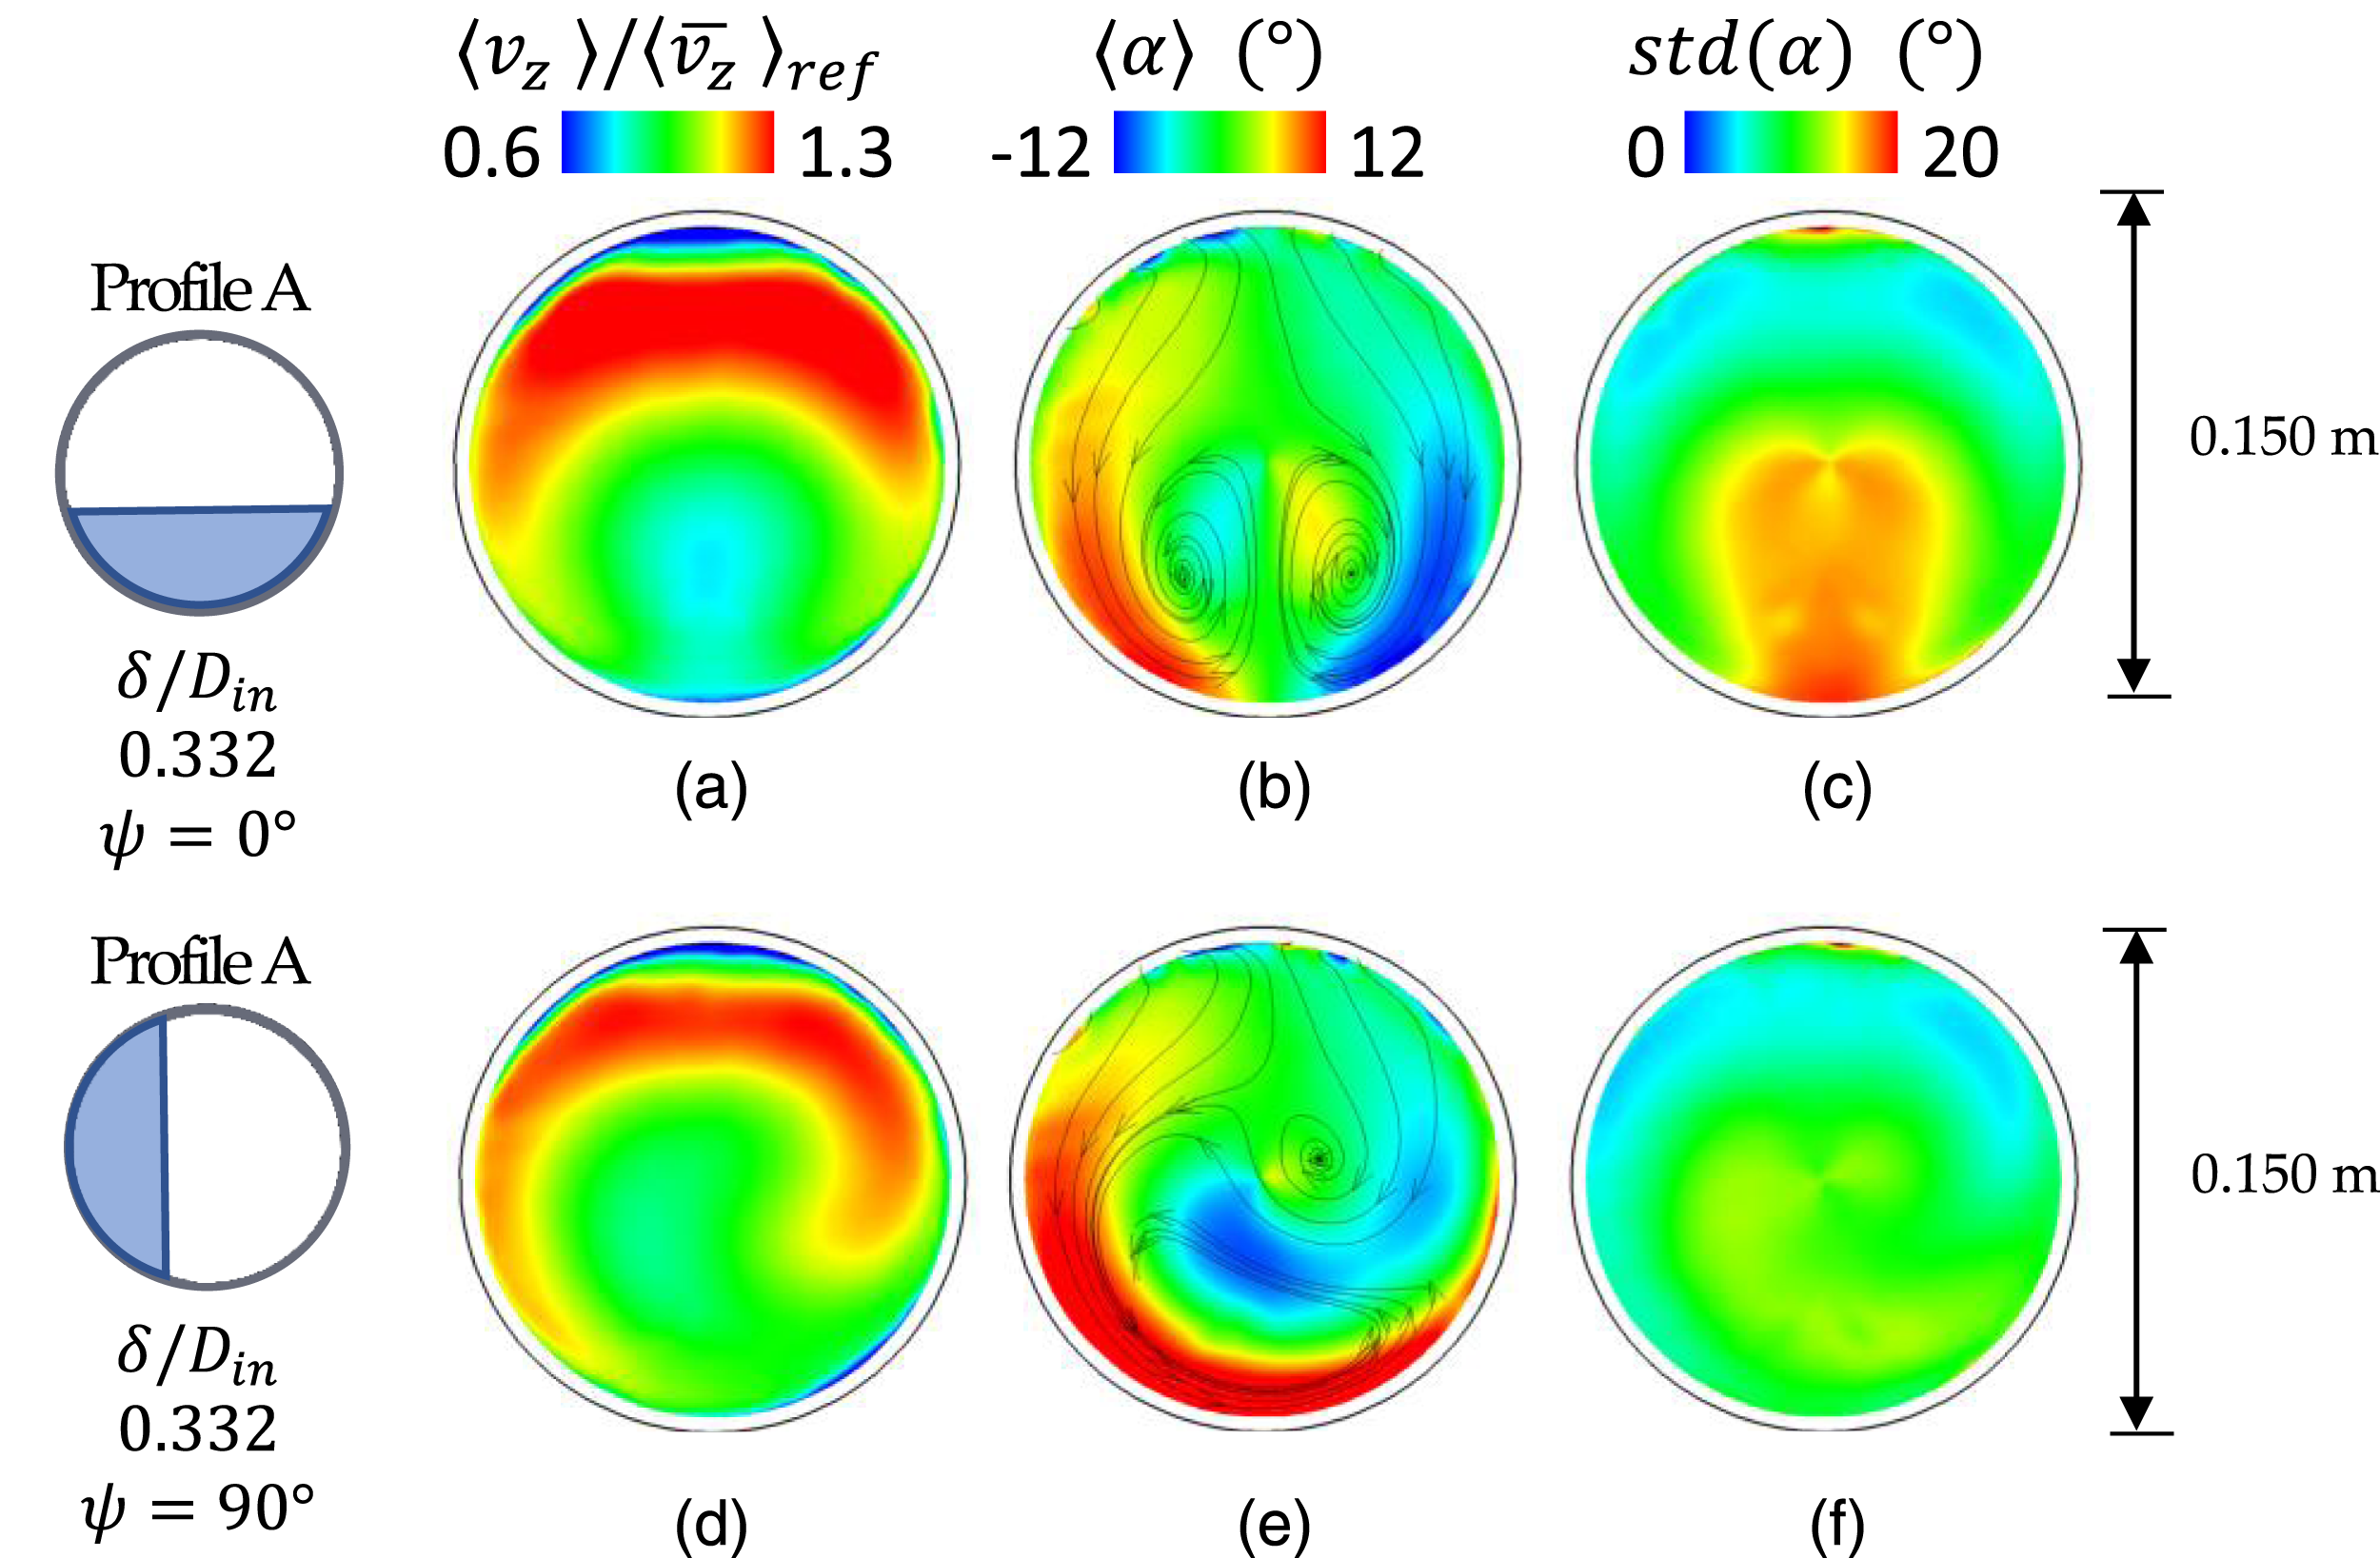
The operation of the intake at high pitch and yaw manoeuvres or cross-wind conditions was also simulated with the variation of the azimuthal orientation of the inlet total pressure profile from j-PDF of the SI-SD distributions measured at the AIP at r/R = 0.84 for inlet Profile A and Profile B (δ/Din = 0.332 and δ/Din = 0.572, respectively) at azimuthal orientations 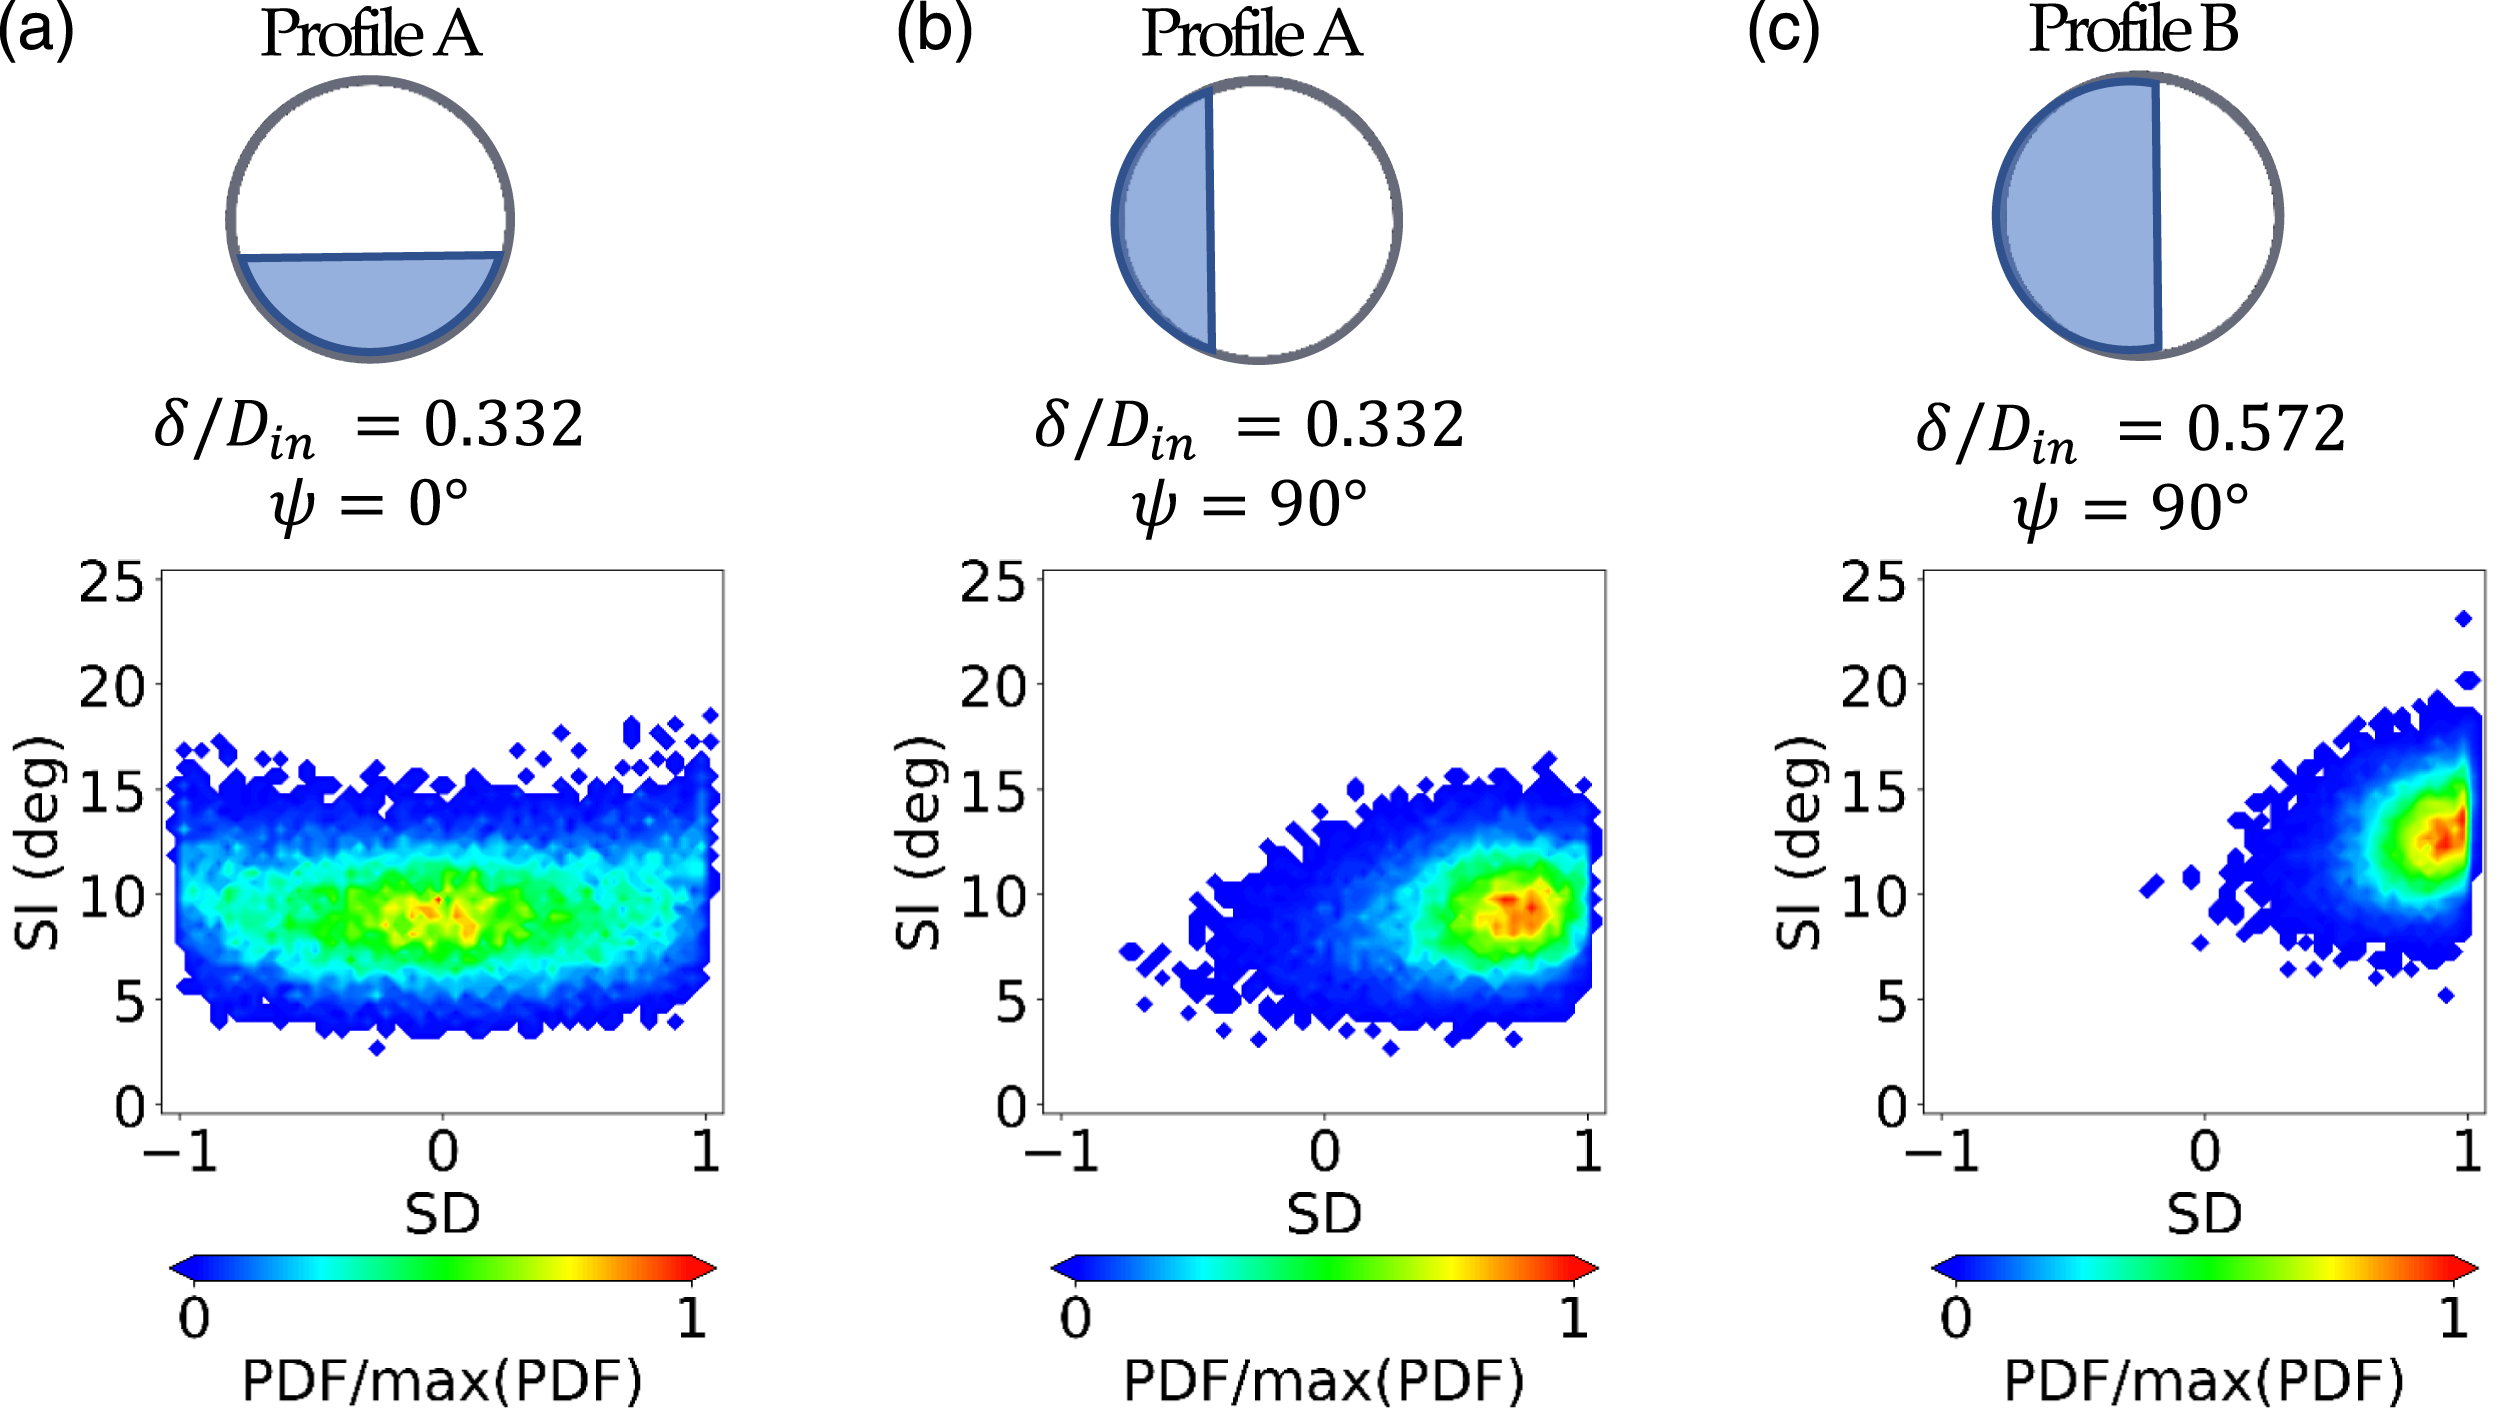
Spectral analysis of flow distortion for different inlet conditions
The unsteady flow distortion generated by the S-duct intake could have an impact on the engine stability. For a typical propulsion system, flow disturbances in a range of frequencies between 1 engine order and the passing time of a 5-blade sector may generate instabilities in propulsion systems. 10 This corresponds to a frequency range of Strouhal number St = 0.8–3.3 considering a representative transonic rotor. 69 More recently, researchers showed that this range of frequencies is likely also to encompass lower frequencies which are related to the main resonant frequency of the rotor, 70 which is in the order of St = 0.7, or disturbances of even lower frequencies. 47
The spectral analysis of the AIP flow field reveals the main frequency content of the flow distortion (Figure 11) with a resolution of Spectral signature of 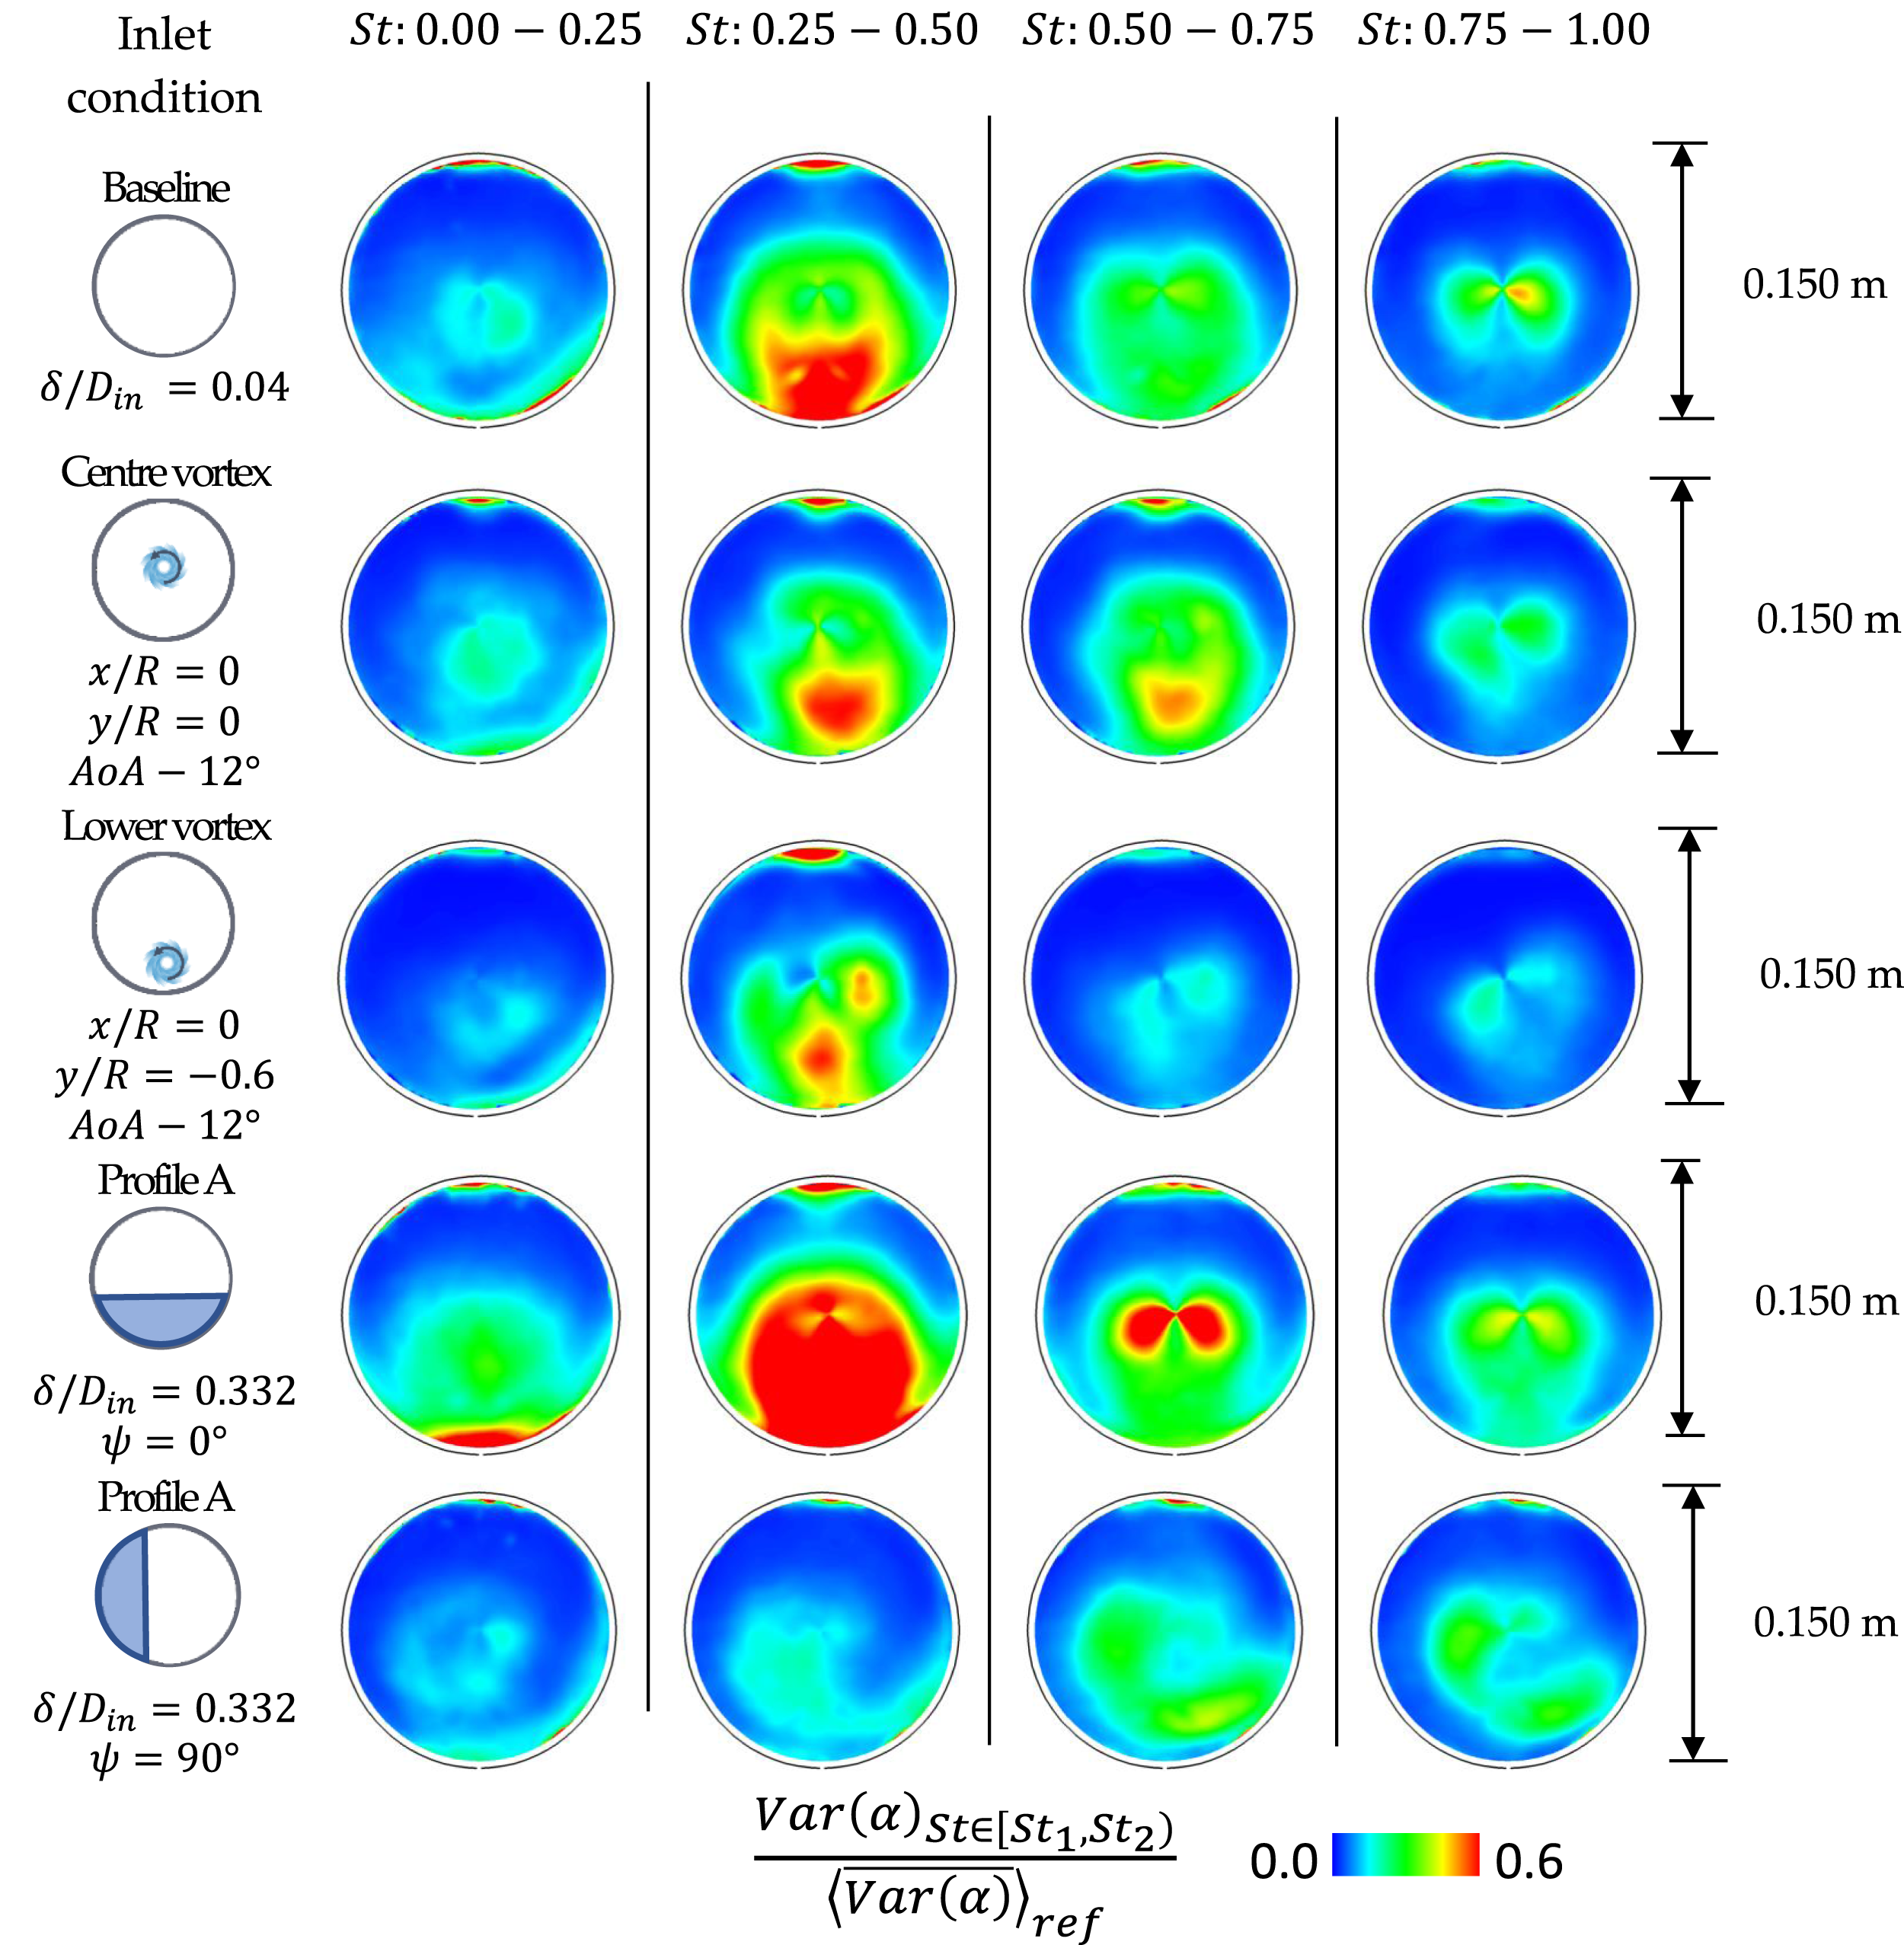
Besides the interest in baseline configurations and inlet conditions, there is a need to understand if changes in the inlet condition can modify the underpinning frequency of the flow distortion. The introduction of the vortex does not change the main frequency contribution of the flow distortion (Figure 11), which remains in a band St = 0.25–0.50 independently from the vortex strength and for the different vortex ingestion positions. In case of vortex ingestion at the inlet centre (x/R = 0, y/R = 0, AoA = −12°), the distribution and the strength of the fluctuations across the different bands remain constant relative to the inlet baseline case with no vortex ingestion (Figure 11). A similar behaviour was also observed when the vortex was ingested towards the left side of the inlet (x/R = −0.6, y/R = 0, AoA = −12°). Instead, for the vortex ingestion at the lower side of the inlet (x/R = 0, y/R = 0, AoA = −12°), there was a noticeable reduction of the strength of the fluctuations across the frequency bands, especially between St = 0.5–1.0 (Figure 11). Since the strength of high-frequency fluctuations which may promote propulsion system instability is suppressed, this highlights the potential benefit of the vortex ingestion at the lower inlet side.
On the other hand, the impact of the inlet total pressure profile is much more pronounced. Relative to the datum inlet condition (δ/Din = 0.04), Profile A (δ/Din = 0.332,
Overall, it can be concluded that inlet vortices have an impact on the strength of the swirl angle fluctuations, but they do not change the main spectral signature. On the other hand, inlet total pressure profiles had a greater impact and they modified both the amplitude and the frequency of the swirl angle fluctuations at the AIP and may impose a more challenging operating condition for the propulsion system.
EVT predictions for peak swirl distortion
EVT model parameters for the different test cases.
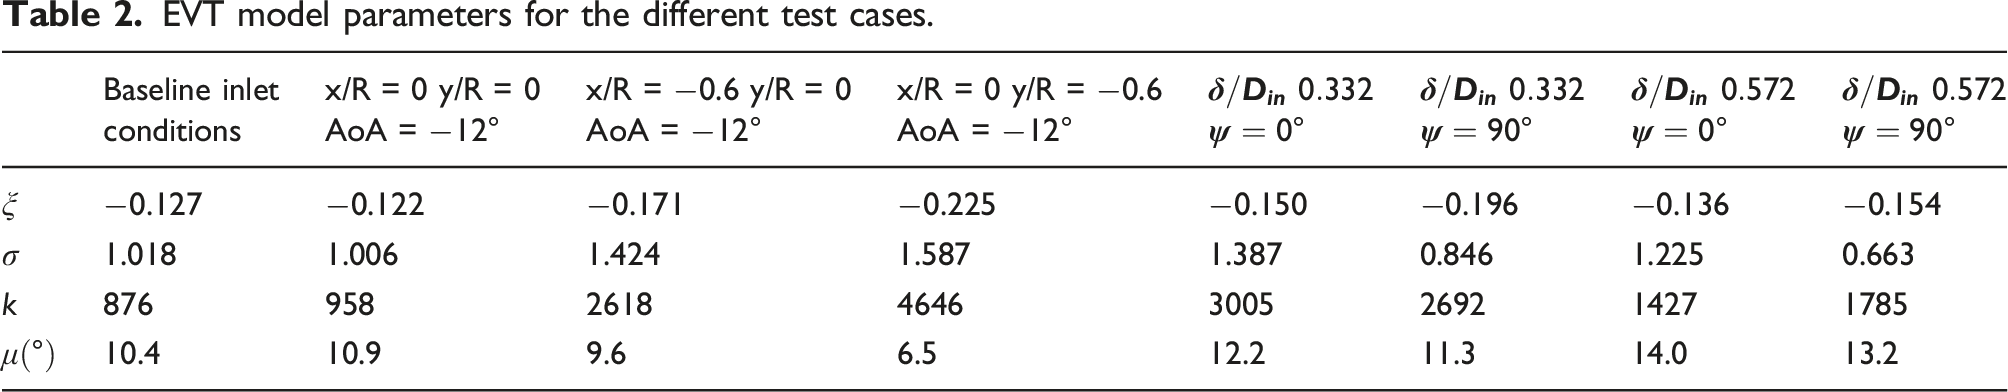
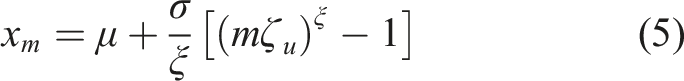
The EVT model was used to estimate the peak area-averaged swirl intensity (SI) for a number of observations two orders of magnitude greater than the experimental ones, which is a typical practice for these statistical assessments
65
(Figure 12). The application of the EVT also estimated the asymptotic level EVT predictions for the peak 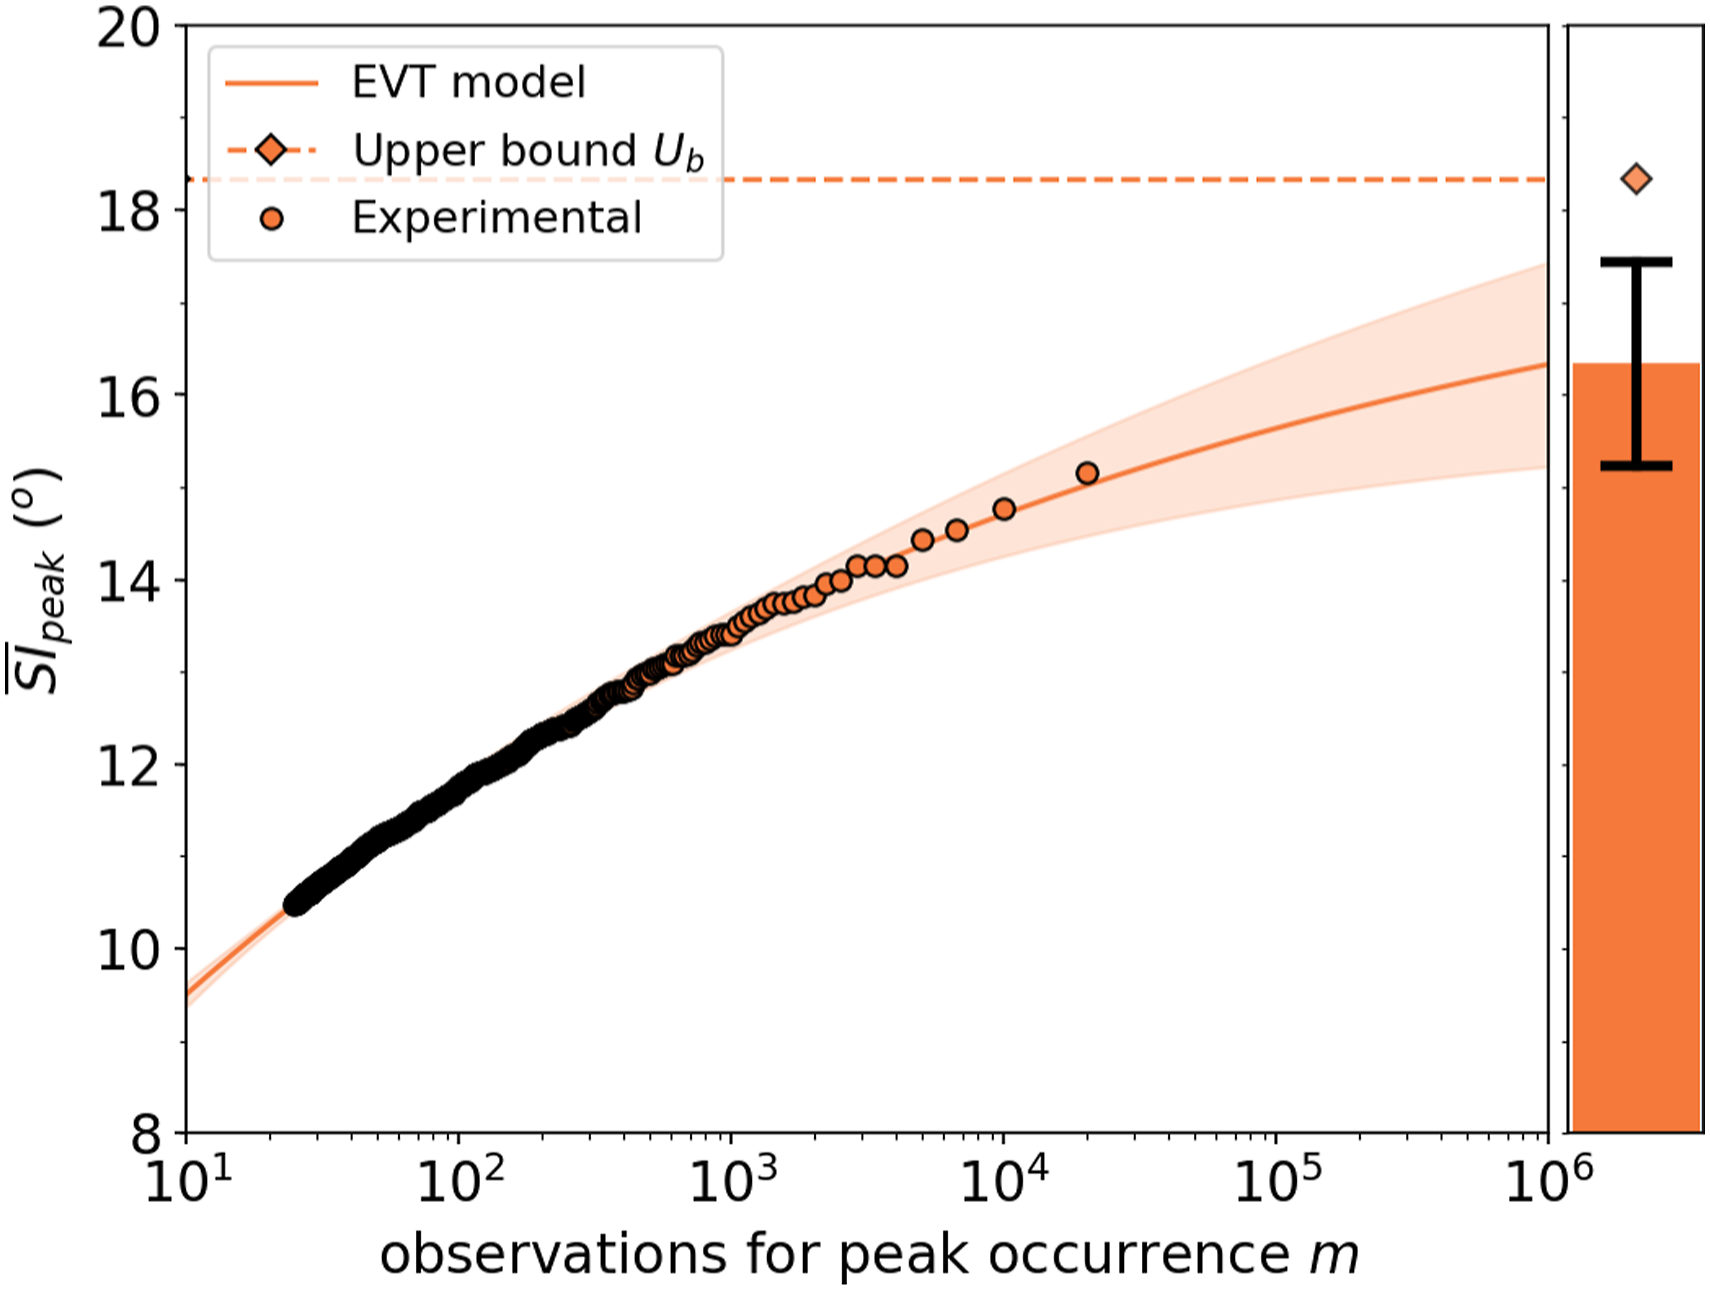
In this experimental study, it was possible to construct an EVT model and to extract peak
The EVT method has been applied to the cases of non-uniform inlet conditions. The impact of the vortex onto the peak EVT predictions for the peak Prediction of the peak 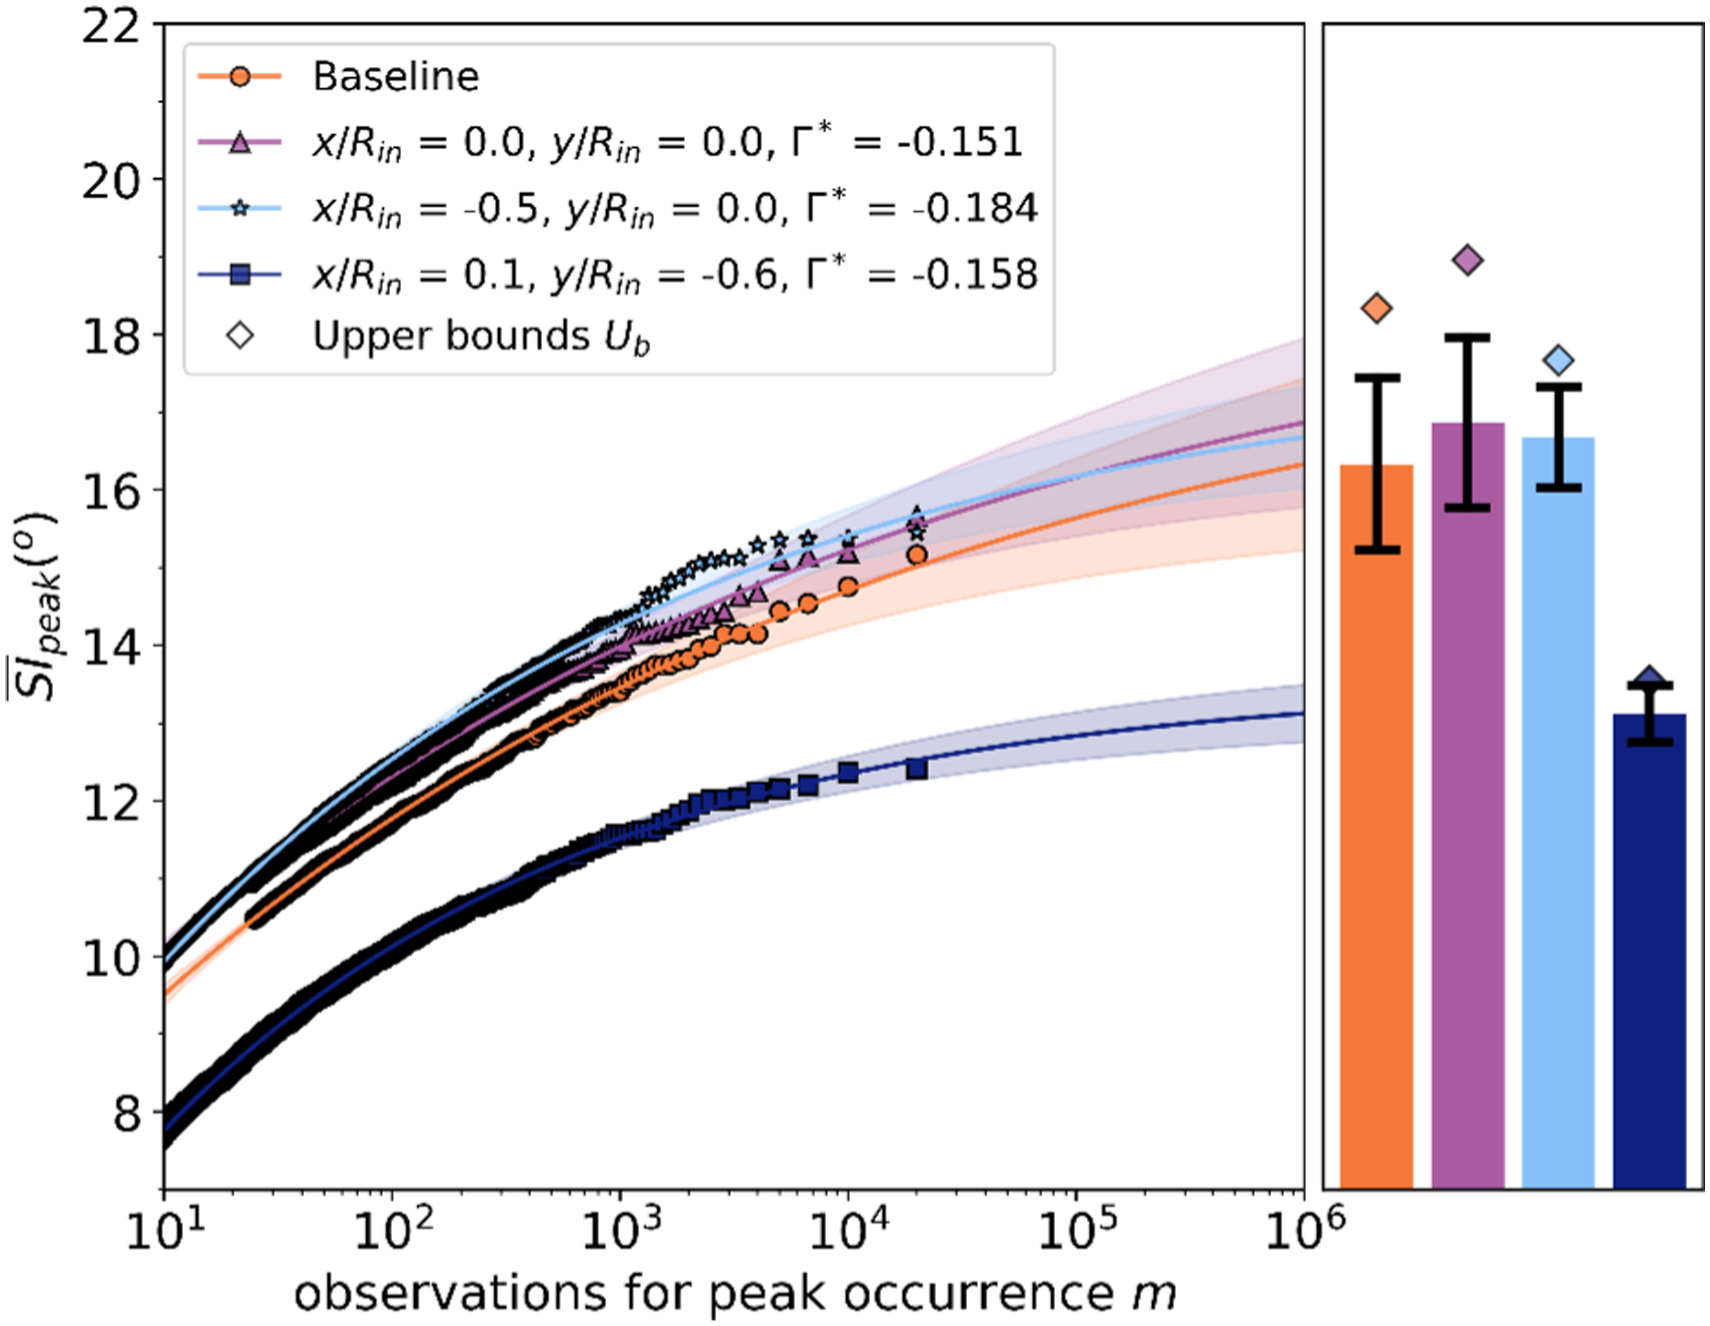
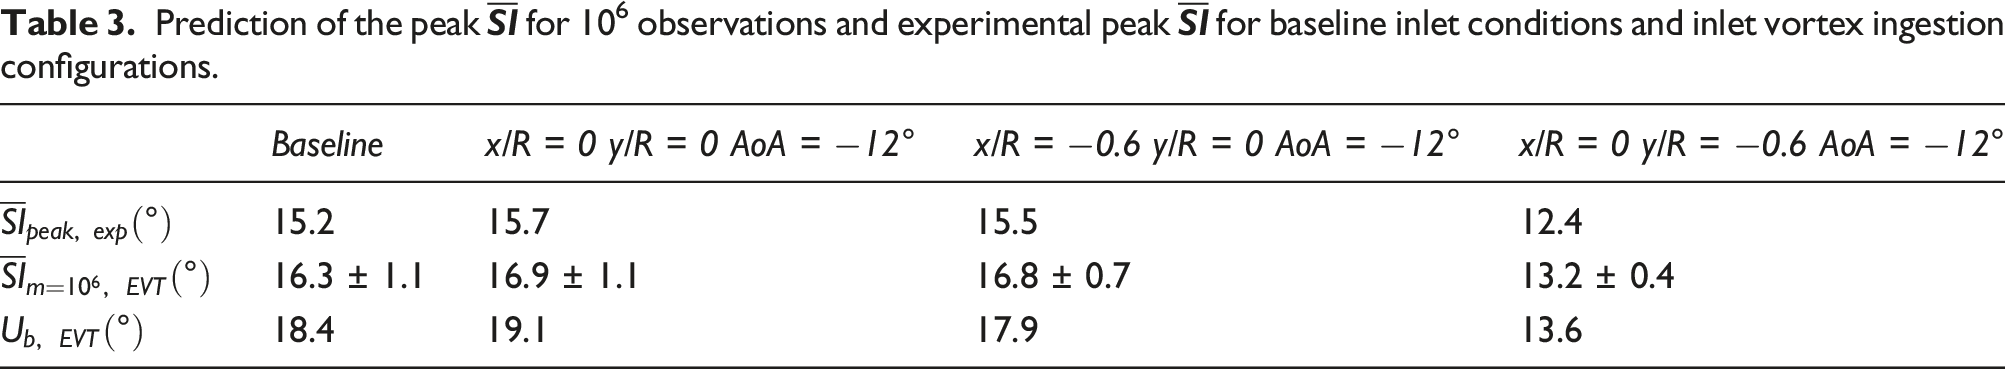
Prediction of the peak
EVT predictions of the peak
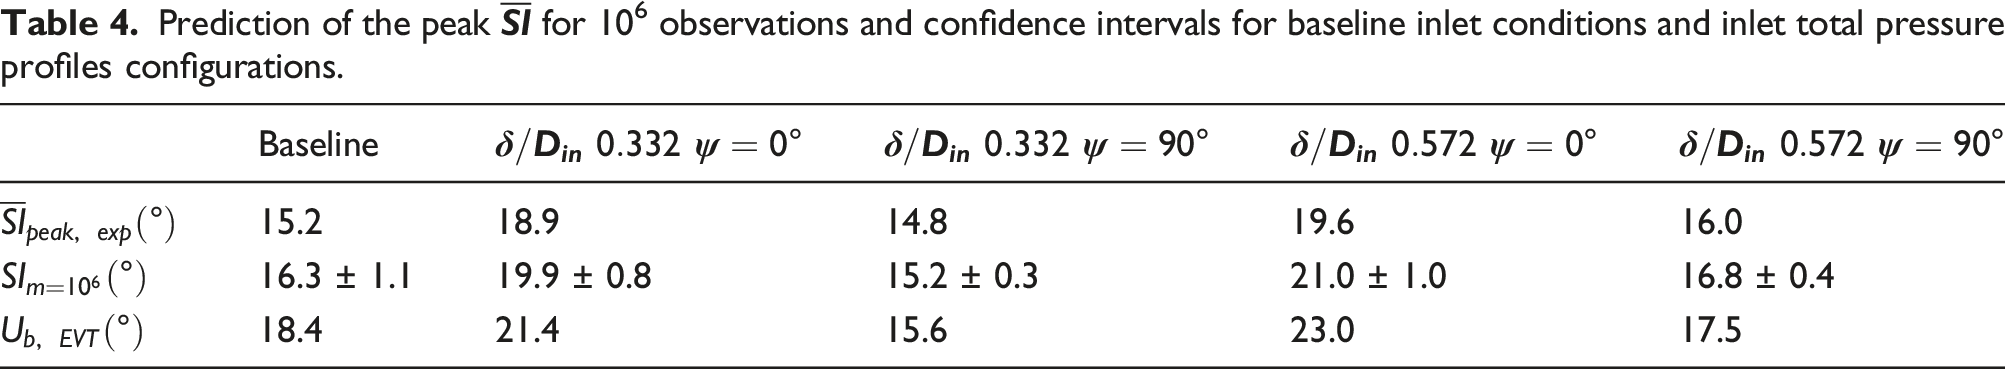
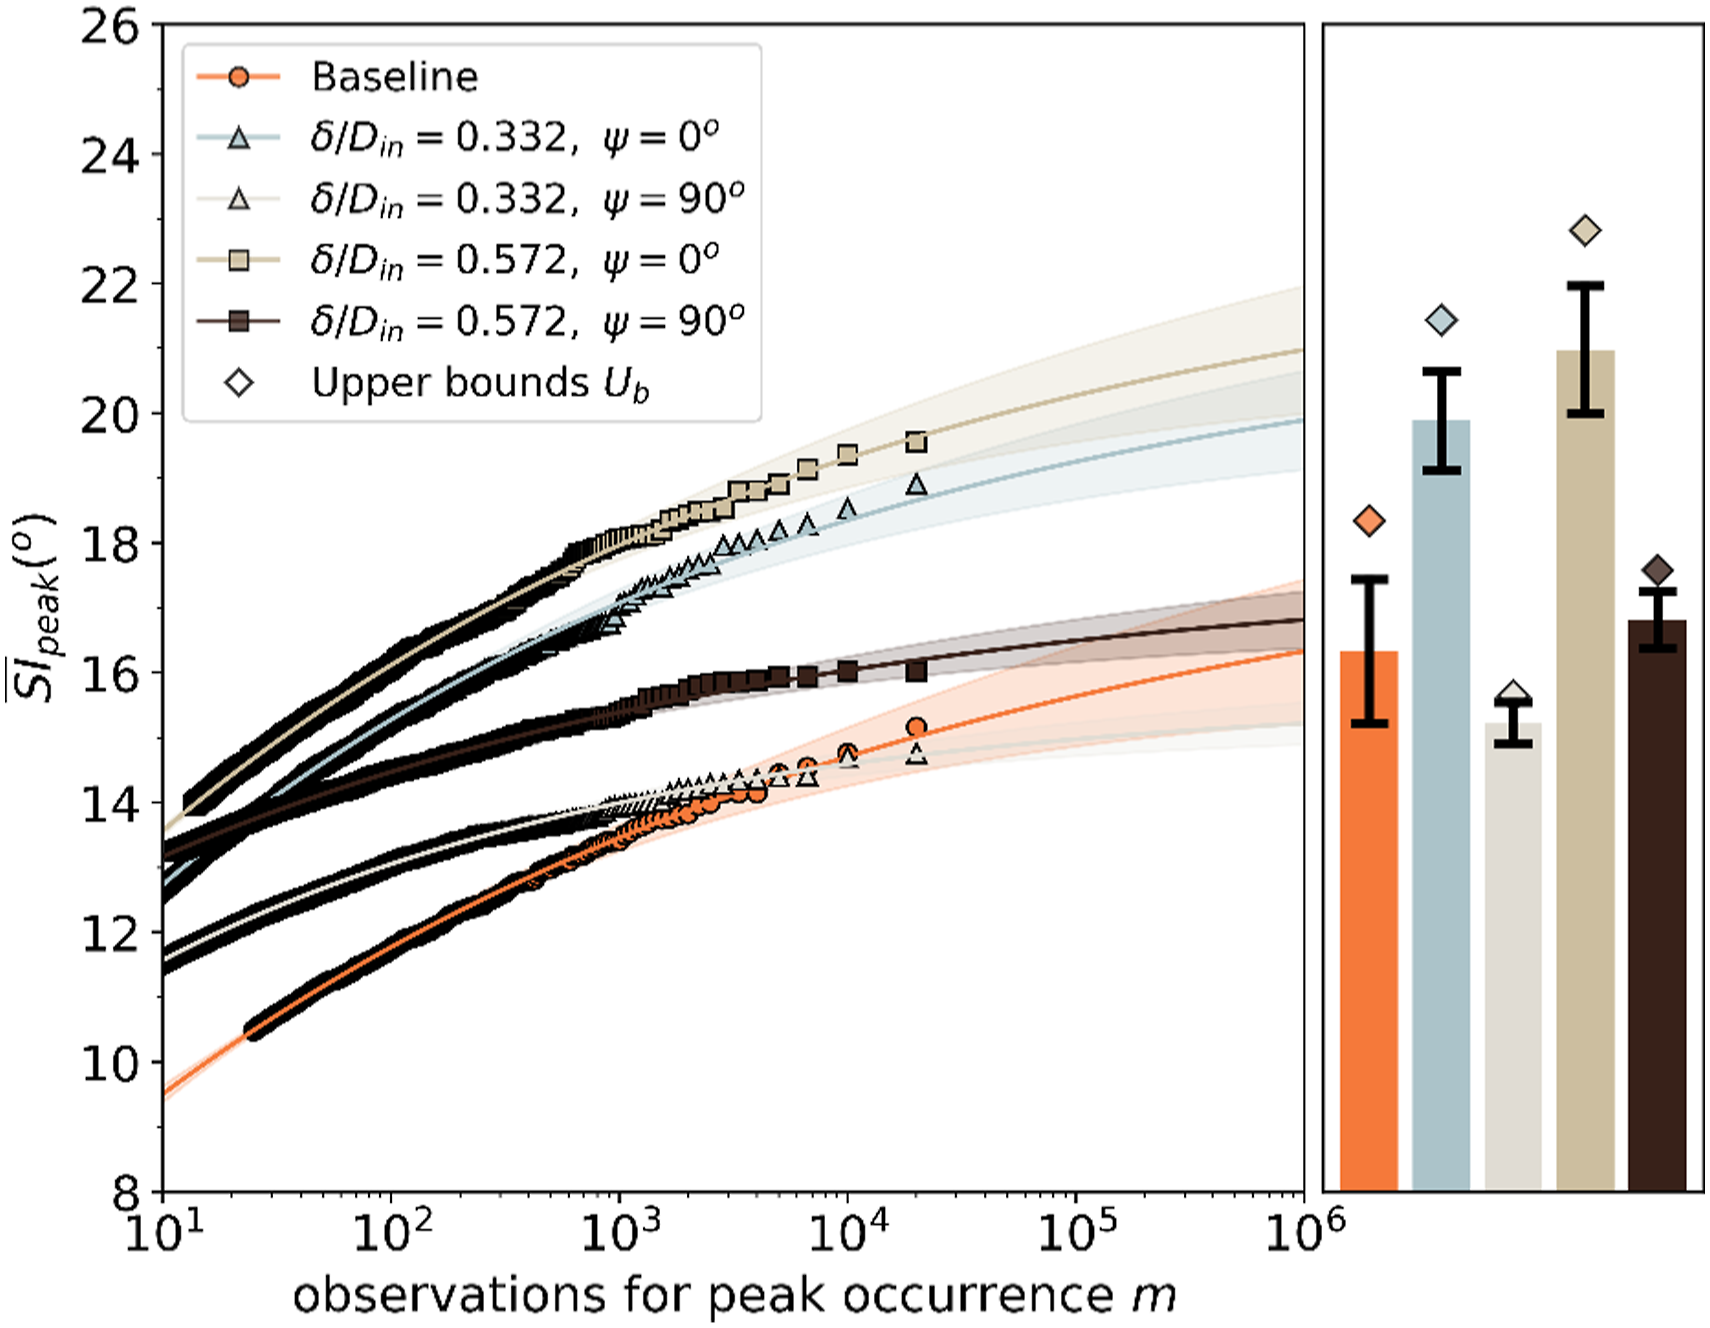
The orientation of the inlet total pressure profiles at EVT model growth rate of the peak 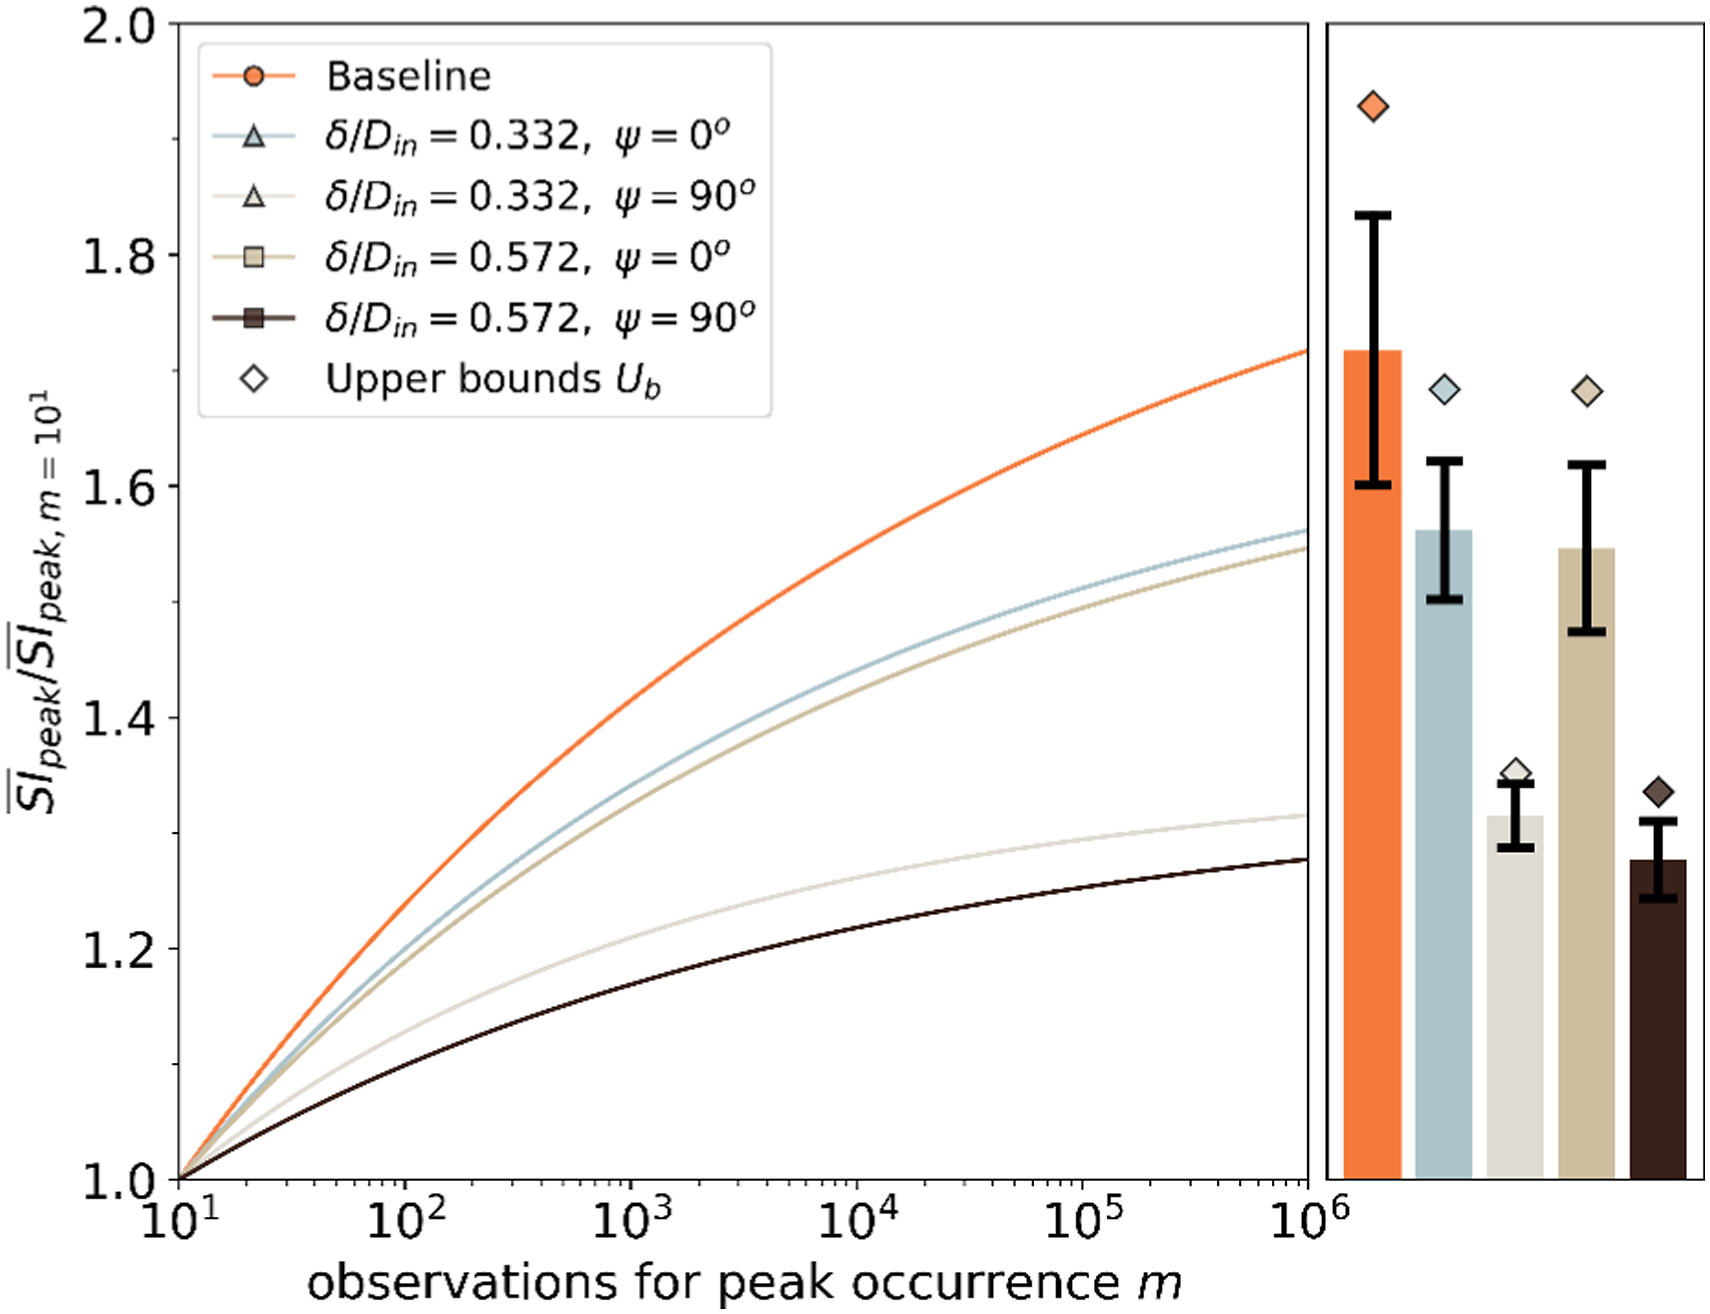
The EVT also provides an estimate for the projected upper bound which highlights the differences in the EVT signatures for the different configurations. The growth rates for the baseline and Profile A (δ/Din = 0.332,
In conclusion, both inlet vortex and inlet total pressure profiles increased the levels of peak distortion at the AIP. Overall, maximum levels of distortion were observed for inlet total pressure profiles oriented at
Conclusions
This work assessed the impact of the inlet conditions on the unsteady aerodynamics of complex intakes. While most of the previous work on S-duct intakes focused on canonical assessments of the flow distortion with uniform inlet conditions, this work represents a notable step forward in the characterization of the unsteady distortion for various inlet conditions. This investigation assessed the impact of inlet vortices of different strengths and positions and inlet total pressure profiles’ thickness and orientation.
The presence of an inlet vortex influenced the secondary flows of the intake and augmented the vortex which was spinning in the same direction of the inlet vortex. This disrupted the characteristic S-duct switching mode and biased the swirl pattern towards bulk swirl events. In general, the inlet vortex had little or no impact on the swirl angle unsteadiness and on the peak swirl intensity. However, when the vortex was ingested at the inlet lower side, the swirl unsteadiness reduced by 25% compared to other inlet vortex ingestion positions and a reduction of the unsteadiness was observed across all the frequency bands. For this configuration, the recorded peak swirl intensity reduced by 3° compared to the uniform inlet configuration.
Inlet total pressure profiles had a strong impact on the AIP flow distortion. In the baseline symmetric orientation, they increased the swirl angle unsteadiness and the peak swirl intensity. The azimuthal rotation of the inlet profile caused a bias of the secondary flows and the growth of one of the Dean vortices. This effect was similar but more augmented to the effect of inlet vortices. The azimuthal rotation caused a raise in swirl angles; however, it reduced the unsteadiness because the swirl bias induced a more stable condition for the AIP flow. The frequency of the swirl fluctuations depended strongly on azimuthal rotation of the inlet profile. For the symmetric inlet condition, the frequency fluctuations reduced. However, for the asymmetric inlet condition, they increased to a range of St = 0.5–1.0. This may represent an important condition for the operability of the propulsion system. Overall, this work shows that the characteristics of the S-duct flow distortion depend on the inlet conditions, and thus, it is recommendable to evaluate the intake duct flow distortion also for a range of inlet conditions other than uniform.
The extreme value theory estimated the peak distortion beyond the experimental observations. For some configurations, the EVT predicted an increase in swirl intensity by up to 3° compared to the experimental values. Thus, this projected increase of swirl intensity should be considered for the design of distortion-tolerant propulsion systems. The EVT revealed that the flow unsteadiness may have a large impact on the projected upper bound and growth rate of the extreme events. The growth rate of the extreme events may be substantially different also in configurations in which the same peak distortion level was measured experimentally. Indeed, it is demonstrated that the evaluation of distortion based on the measured peak distortion can be misleading, and it is recommended to use a statistical model such as EVT to evaluate the growth rate and projected peak distortion levels. This evidences also the need of unsteady measurements of the flow distortion with a high spatial resolution.
Footnotes
Declaration of Conflicting Interests
The author(s) declared no potential conflicts of interest with respect to the research, authorship, and/or publication of this article.
Funding
The author(s) disclosed receipt of the following financial support for the research, authorship, and/or publication of this article: This work is partially funded by the UKRI, grant reference no. 2202953. The supporting data is not available due to confidentiality agreements.