Typically, the evaluation of nacelle drag in preliminary design is required to find an overall optimum engine cycle and flight trajectory. This work focuses on the drag characteristics of aero-engine nacelles with separate jet exhausts. The main body of analysis comes from 3D numerical simulations. A new near-field method to compute the post-exit force of a nacelle is presented and evaluated. The effects of the engine size, Mach number, mass flow capture ratio and angle of attack are assessed. The results obtained from the numerical assessments were used to evaluate conventional reduced-order models for the estimation of nacelle drag. Within this context, the effect of the engine size is typically estimated by the scaling ratio between the maximum areas and Reynolds numbers. The effect of the angle of attack on nacelle drag is mostly a function of the nacelle geometry and angle of attack. In general, typical low-order models based on skin friction and form factor can underestimate the friction drag by up to 15% at cruise operating point. Similarly, reduced-order models based solely on Reynolds number, and Mach number can underestimate the overall nacelle drag by up to 74% for free stream Mach number larger than the drag rise Mach number.
Increasing the bypass ratio (BPR) of an aero-engine is one direct way of improving its propulsive efficiency.1 Historically, this has generally resulted in larger fan diameters for a specified uninstalled cruise thrust.2 In particular, for medium and long range aircraft, it is expected that there is still a potential for overall fuel burn reduction by increasing the engine BPR.2 However, the drag, detrimental interference effects and engine weight increase with the growth in engine size. These negative effects impact the overall aircraft performance and potentially outweigh the advantage gained from the improved propulsive efficiency.3
The increase in BPR has a direct positive effect on the noise and specific fuel consumption (SFC).2–4 Nevertheless, as Daggett et al.4 highlight, the increase in drag, aerodynamic loads and weight are additional problems associated with larger BPRs. For instance, for a Boeing 777-200 class aircraft with a nominal 3000 nm mission and 70% passenger load factor, an optimum BPRs is estimated to be 14.3 for an installed geared turbo-fan engine and 11 for a direct drive engine.4 To highlight the effective limit on BPR, the mission fuel burn increased by approximately 3.6% when the BPR was increased from the optimum value of 14.3–21.5 on the engine with a geared fan.4 Similarly, for the mission with the direct drive engine, the fuel burn increased by 3.5% when the BPR was increased from 11 to 13.4 Within this context, it is useful to develop a methodology for the assessment of nacelle drag at a preliminary design stage. For example, an optimum fan diameter and therefore the best engine thermodynamic cycle cannot be determined if the aspects such as the nacelle drag are not taken into account. The understanding and quantification of the aerodynamics of aero-engine nacelle drag is required for an estimation of the impact on the overall engine and aircraft performance.
Low-order models (LOM) for the estimation of nacelle drag (Dnac) with different levels of fidelity have been previously developed.5–9 In general, these methods compute the skin friction coefficient as a function of free-stream Mach number () and fan cowl Reynolds number (Re). The skin friction coefficient is multiplied by a form factor (λ) to account for pressure drag in the methods advocated by Raymer,6 Roskam7 and Engineering Sciences Date Unit (ESDU).5 In contrast, details of the pressure distribution over the fan cowl are required to compute the nacelle pressure drag in the methods by Street9 and Tabakoff and Sowers.8 In general, the form factor (λ) proposed by Raymer6 and Roskam7 are sole functions of the fan cowl fineness ratio. In the more comprehensive method proposed by ESDU,5λ is based on fan cowl geometry, and mass flow capture ratio (MFCR). The drag estimated with the methods presented by Raymer,6 Roskam7 and ESDU5 is only applicable to nacelles at zero angle of attack. Overall, the uncertainty has only been reported for the method advocated by ESDU.5 Uncertainty of ±25% on nacelle drag for Mach numbers less than or equal to 0.7 has been typically achieved by the approach by ESDU.5 However, the fidelity of this method has been generally assessed with experimental data with a cylindrical section after the fan cowl trailing edge (TE).5,10 A cylindrical section after the TE is normally expected to generate a relatively low post exit force in the drag domain.5
Typically, experimental data10 show a relatively small variation of the nacelle drag with an increase in Mach number up to a certain . The Mach number, where Dnac starts to increase rapidly with increases in , is referred to as drag-rise Mach number (MDR). Laban11 has adopted the aircraft MDR as the free-stream Mach number when for studies of the effect of engine installation. Within this context, ESDU5 provides a methodology to estimate the drag-rise Mach number for nacelles in isolation at zero angle of attack. The ESDU approach5 to estimate MDR assumes the standard NACA110 initial fore-body radius. In general, the method advocated by ESDU estimates MDR within an accuracy of ±0.02.5
Methods developed for bodies of revolution such as fuselages can be used to estimate the effect of the angle of attack (α) on the nacelle drag.7 On the basis of this approach, two different models by Roskam7 and Kelly12 for the estimation of the increase in drag due to α on blunt-based bodies of revolution can be adopted for nacelles. These methods compute the increase in drag as a function of the nacelle geometry and the angle of attack.7,12 However, the method suggested by Roskam7 is generally applicable to long nacelles with fineness ratios larger than 2.7
Two approaches are typically adopted for the assessment of nacelle drag in computational studies. Near-field methods are generally based on the integration of the pressure forces and wall shear stresses on the nacelle surface.13–16 In contrast, far-field approaches are usually based on momentum conservation applied to a volume around the nacelle and whose interfaces are relatively far from the cowl.13,17–19 The studies presented in this paper have used and developed a near-field approach.14,16,20 In general, the near-field drag of an engine comprises the pre-entry force, the force on the fan cowl and the post-exit force.21 The split between these force components is not trivial, and a modified near-field approach has been presented by Christie et al.14,16,20 to compute the pre-entry and fan cowl forces on numerical studies. It is based on momentum conservation on the pre-entry stream-tube.14,16,20 Similarly, different methods such as Jones thrust or Pearson thrust have been suggested to compute the post-exit component of the drag.22 Jones thrust uses the assumption of isentropic flow within the exhaust jets.22 Pearson thrust splits the exhaust jets into a region of constant pressure and adiabatic flow and a region with isentropic flow.22 The post-exit force in the drag domain is considered to be relatively low or even equal to zero for a range of operating conditions.15,23,24 The accuracy of Jones and Pearson methods to compute the post exit force in the drag domain has not been published previously. Similarly, the assumption of negligible post-exit force for a range of operating conditions has not been assessed. On the basis of these ideas, a new method based on the direct integration of the pressure forces over the post-exit stream-tube is presented in this paper which is used to evaluate the accuracy of both Jones’ and Pearson’s methods. Within this context, the overall aim of this paper is to provide an assessment of preliminary design methods for nacelle drag estimation in aero-engines with separate streams based on detailed numerical studies. The approach involves the evaluation of these methods and sensitivity of nacelle drag to ranges of free-stream Mach number, MFCR, angle of attack and engine size. The approach uses a combination of an engine thermodynamic modeling tool (Turbomatch)25 and a method for the analysis and aerodynamic design of engines with separate jets (GEMINI).26,27
Methodology
The framework to evaluate the drag of isolated aero-engines with separate streams links reduced-order model for nacelles at α = 0° with methods for the estimation of the effect of engine size and α on the nacelle drag. The numerical method developed for the assessment of this framework includes the association of engine geometry, thermodynamics and aerodynamics. Within this context, a new method for the near-field evaluation of the post-exit force in the drag domain is presented. The current work focused on the assessment of two different engines which are representative of regional aircraft with rear-mounted architectures. Reynolds number, thrust setting, angle of attack and Mach number typical of regional aircraft with rear-mounted engines were selected for these studies. Several LOM available in the literature were evaluated with the detailed computational analysis.
Engine models
To enable the assessment of the engine aerodynamics and the sensitivity to operating conditions, a thermodynamic model of the engine was generated using the engine performance modeling tool Turbomatch.25 Turbomatch25 is a zero-dimensional gas turbine performance code developed and established by Cranfield University.25 It has been typically shown to evaluate the engine performance at design point within 4% of measured mass-flow, TET and gross thrust.28
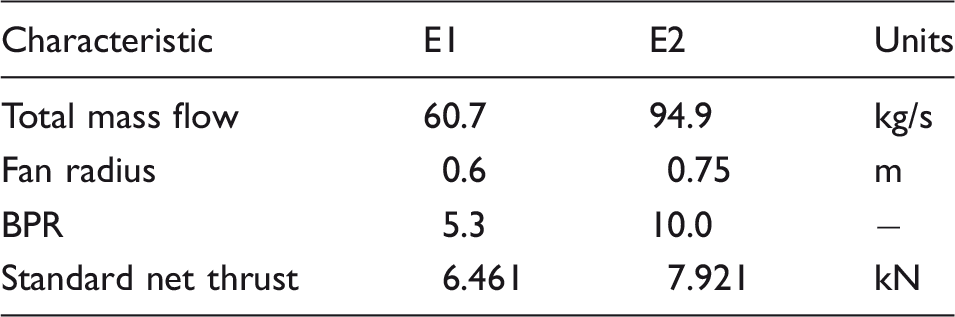
Based on open source literature for technology levels and engine characteristics such as component efficiencies, pressure ratios and operating temperature,29,30 two engine cycles were developed. The baseline engine cycle (E1, Table 1) is similar to the GE CF34-8C5, with thrust, mass-flow and SFC matched within 0.01% with published information.31 An engine cycle with 26% lower specific thrust (E2, Table 1) was included for the evaluation of the effect of the engine size on nacelle drag. The thermodynamic cycle of the E2 engine was designed to match the turbine entry temperature and MFCR of the E1 at the design point.
Main characteristics of the engines developed for the numerical studies at their design point (h = 11,280 m, ISA + 15, = 0.74).
Characteristic
E1
E2
Units
Total mass flow
60.7
94.9
kg/s
Fan radius
0.6
0.75
m
BPR
5.3
10.0
−
Standard net thrust
6.461
7.921
kN
Nacelle geometries
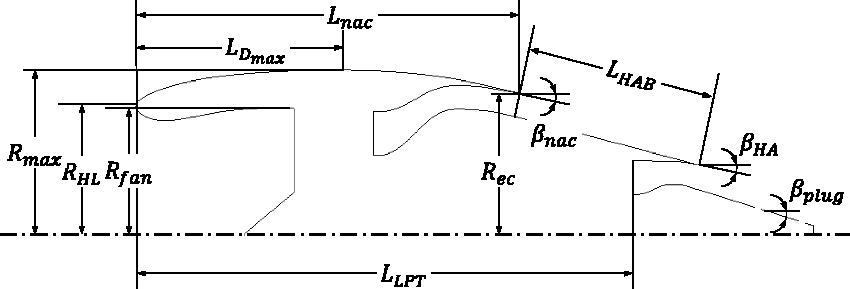
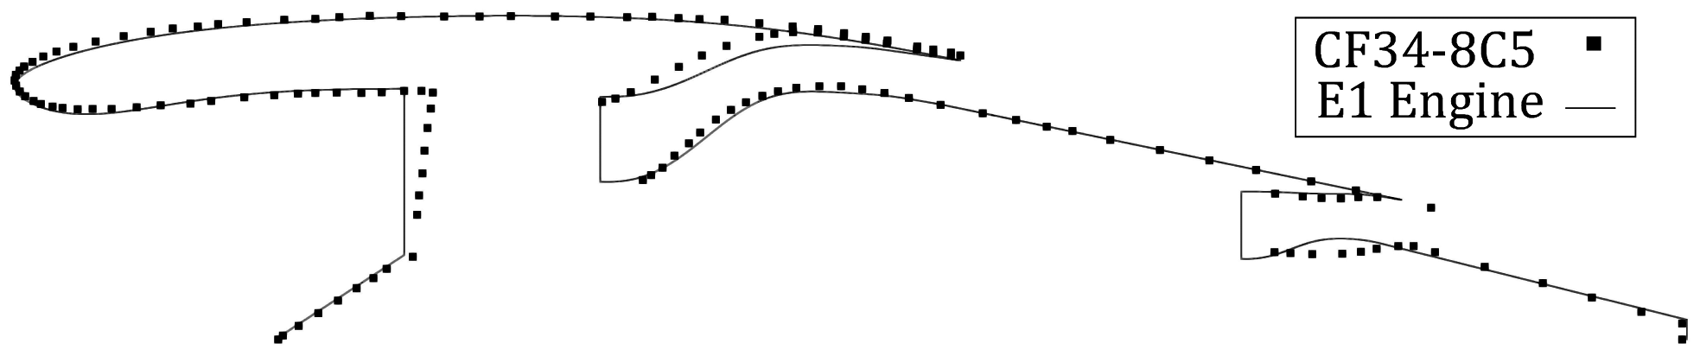
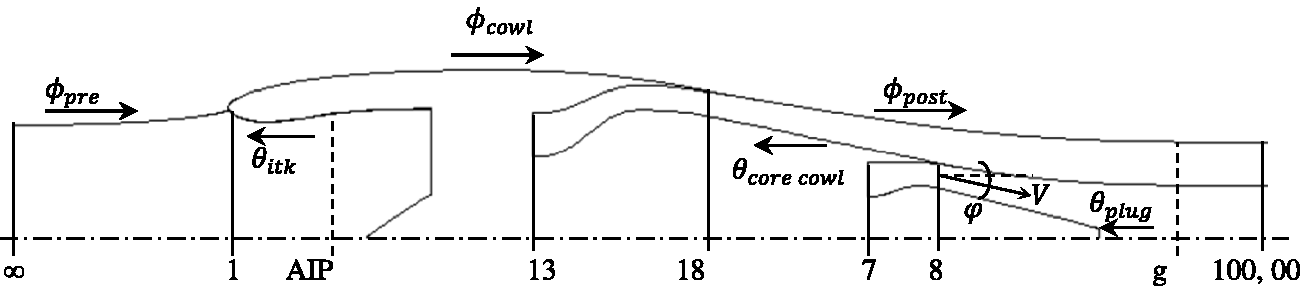
The aerodynamic design of the nacelles with separate jet exhausts nozzles was created with the integrated tool GEMINI.26,27 GEMINI links modeling methods for engine performance, geometry parametrization and viscous flow CFD calculations.26,27 The parametric geometry definition developed in GEMINI is based on the class shape transformations (CST).26,27 GEMINI26,27 requires the engine cycle and a prescribed set of key geometrical-hard points as input. These hard-points were defined to make the geometry of the nacelle and exhaust system on the E1 engine (Table 2 and Figure 1) similar to the GE CF34-8C5 engine used by the CRJ700 (Figure 2). The geometry of the intake and fan cowl for the E2 engine was directly scaled from the E1 engine. The exhaust system of the E2 engine was designed to follow the nozzle areas required by the engine cycle.
Schematic of key engine dimensions for the parametric generation of the geometry.
Nacelles for the E1 engine and the CF34-8C5 in the CRJ700.32
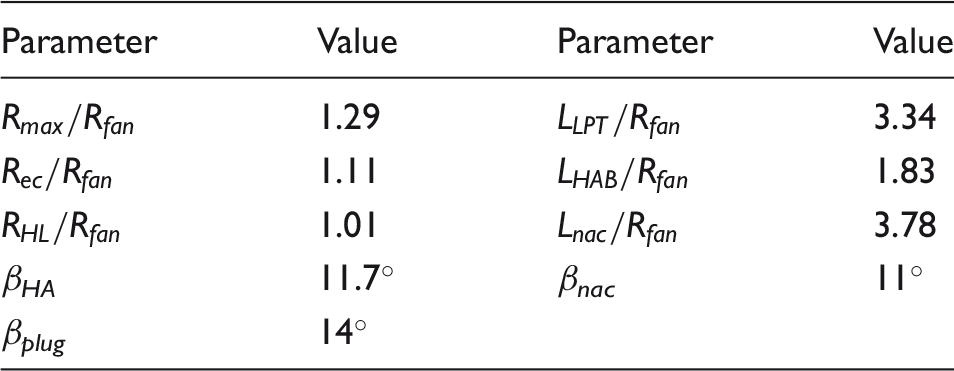
Non-dimensional ratios and boat-tail angles for the geometrical definition of the E1 engine (Figure 1).
Parameter
Value
Parameter
Value
1.29
3.34
1.11
1.83
1.01
3.78
βHA
11.7°
βnac
11°
βplug
14°
Numerical method
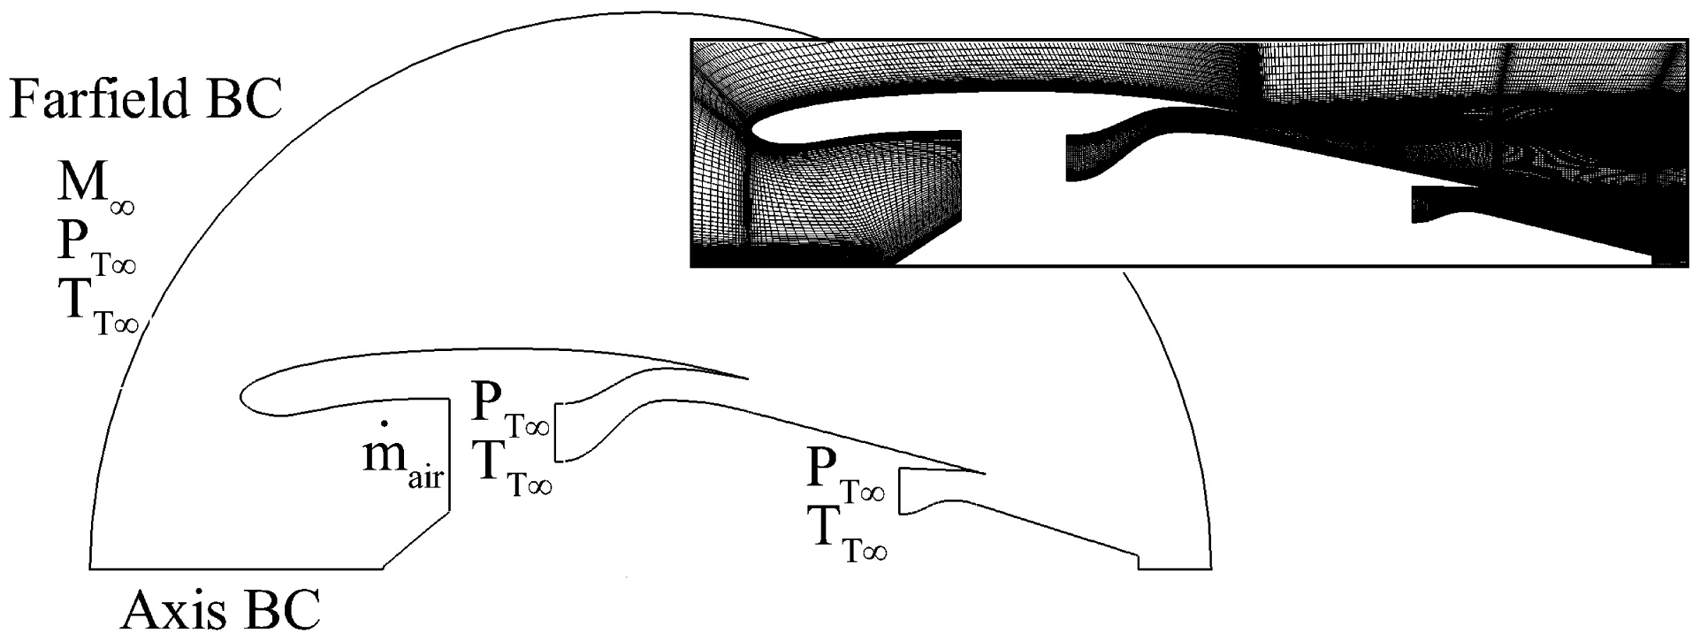
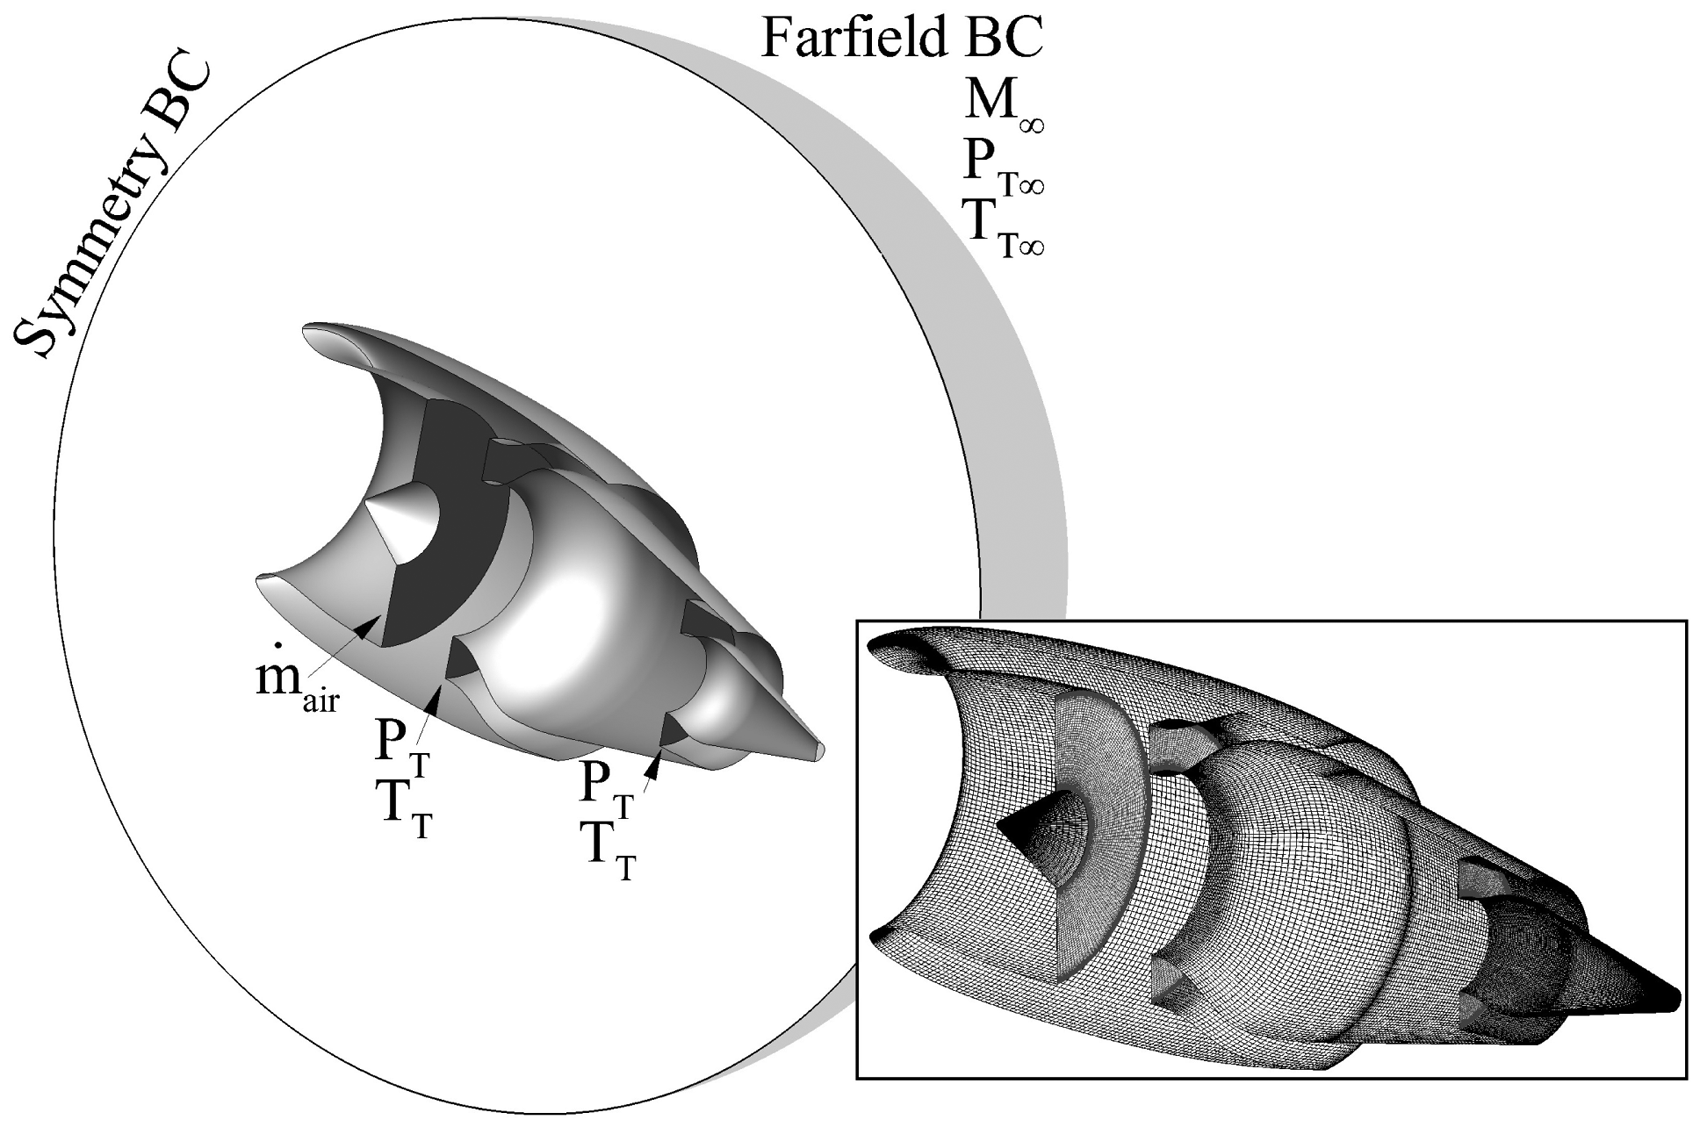
Two different approaches were adopted to evaluate the drag of aero-engines in isolation. A 2D axisymmetric model was used to assess the effect of Mach number, Reynolds number and MFCR on the nacelle drag at zero angle of attack (Figure 3). This methodology allows the study of a broad set of operating conditions and is a common simplification to capture the main drag characteristics in preliminary design.23 The 2D axisymmetric model used a jet-off approach similar to the studies established by Heidebrecht et al.23 Ambient total pressure () and temperature () were set at the nozzle inlets for the jet-off computations (Figure 3). The other approach used a 3D model within a hemi-spherical domain for the assessment of the effects of the angle of attack on the nacelle drag (Figure 4). A jet-on approach was developed in the 3D studies with boundary conditions established from the engine cycles. At the nominal fan-face plane (Figures 3 and 4), a mass flow-out boundary condition was prescribed to achieve the required MFCR. At the inlet to the bypass nozzle and core nozzle (Figures 3 and 4), an inlet boundary condition was used to specify the required total pressure and total temperature.
2D axisymmetric domain and grid used for the numerical studies with uninstalled aero-engines.
Hemi-spherical domain and grid used for the numerical studies with uninstalled aero-engines.
The studies with both axisymmetric and 3D models were performed using a Reynolds-averaged Navier–Stokes approach coupled with the SST turbulence model.33 A steady, implicit, density-based formulation was used for all the cases. Second order was used for the spatial discretization of the flow and turbulence model variables k and ω. The gradients in the flow field were computed with the Green–Gauss node-based method.
The air was defined as an ideal gas for density computations and the Sutherland method with three coefficients was used for viscosity estimation. Thermal conductivity and specific heat were computed with kinetic theory and eight-order piecewise polynomial, respectively. Therefore, air viscosity and specific heat were computed as sole functions of the local temperature. Solutions were typically considered as converged when scaled residuals were below and forces over the walls oscillated within a maximum of 0.05% over 200 iterations.
Meshing approach
A fully structured multi-block mesh approach was used for the spatial discretization of the domains (Figures 3 and 4). The cell distribution on the boundary layer blocks was defined to keep y+ below 1 in the first cell from the walls. The growth ratio of the cells was 1.25 in the boundary layer block and below 1.5 for the rest of the domain. The sensitivity of the engine net thrust (FN) and modified nacelle drag ()34 to domain size and grid resolution was studied at typical cruise conditions for the E1 engine. Free-stream Mach number of 0.78, MFCR of 0.72, and engine angle of attack of 0° were used for these analyses.
For the 2D axisymmetric model, the domain sensitivity was studied with radii between the engine spinner and the farfield (Figure 3) of and . Domain studies were done with radii between the spinner and the farfield of and for the hemi-spherical model (Figure 4). An overall sensitivity in standard thrust and modified drag of less than 0.002% was found for the range of domain radii studied on both the 3D and the 2D axisymmetric models. Domain radii of for both approaches were selected for the numerical studies.
A grid independence assessment followed the method advocated by Roache,35,36 which uses grid convergence index (GCI) and Richardson extrapolation. Hemispherical meshes with approximately and cells were used for the grid sensitivity studies. The hemispherical grid selected for the studies, which contains approximately cells, leads to spatial discretization errors of less than 0.04% in FN and . The grid sensitivity studies for the 2D models were done with meshes with approximately and cells. The 2D axisymmetric grid selected for the studies, which contains approximately cells, leads to spatial discretization errors of less than 0.15% in FN and . The hemispherical and two axisymmetric meshes used for these studies were within the asymptotic range in FN and . Overall, the domain and grid independence studies are considered acceptable for the current studies.
Previous validation of the CFD method for nacelle drag
The numerical approach and grid topology used in these computational studies were similar to the methods presented by Stańkowski et al.16,37 That computational approach was validated16,37 with the experimental data presented by Langley10 for two different nacelle designs. The nacelle originally referred to as Cowl 110 was included in the validation studies due to its high drag rise Mach number MDR = 0.846.16,37MDR was defined as the Mach number, where .16,37 A nacelle denominated as Cowl 310 was also incorporated in the validation analysis due to its relatively good performance in terms of spillage.16,37 Mach numbers between 0.4 and 0.95 and MFCR between 0.2 and 0.9 were included in the experimental studies.16,37 All the experimental campaign was developed with zero angle of attack.16,37
The accuracy of the models to compute drag rise Mach number was assessed at a MFCR = 0.7 for a range of Mach numbers from 0.4 to 0.9.16,37 and MFCR from 0.4 to 0.73 were established to evaluate the spillage characteristics.16,37 Overall, the computed drag agrees with the experimental data within when was lower than MDR.37 The drag-rise Mach number obtained in the CFD studies has been reported to be within ±0.015.37 The critical MFCR (MFCRcrit) is the mass flow ratio where flow separation over the fan cowl starts to appear.5 The validation studies16,37 defined the MFCRcrit as the MFCR, where . In general, the numerical studies over-estimated MFCRcrit by 0.025 and 0.02 for the Cowls 1 and 3, respectively.37 Overall, the numerical methods applied in this paper work capture main drag characteristics as MFCRcrit and MDR within and ±0.015,37 respectively. Within this context, the results in drag rise Mach number and spillage achieved with the numerical models in this paper are considered satisfactory.
Validation of the CFD method for propulsive nozzle
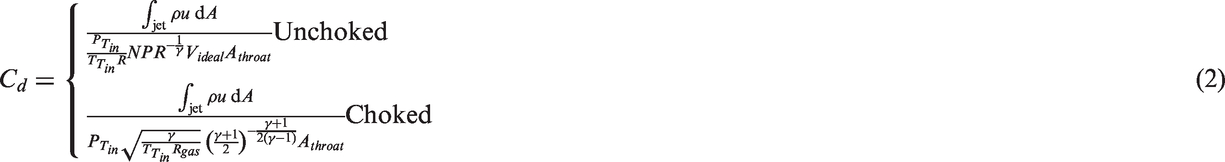
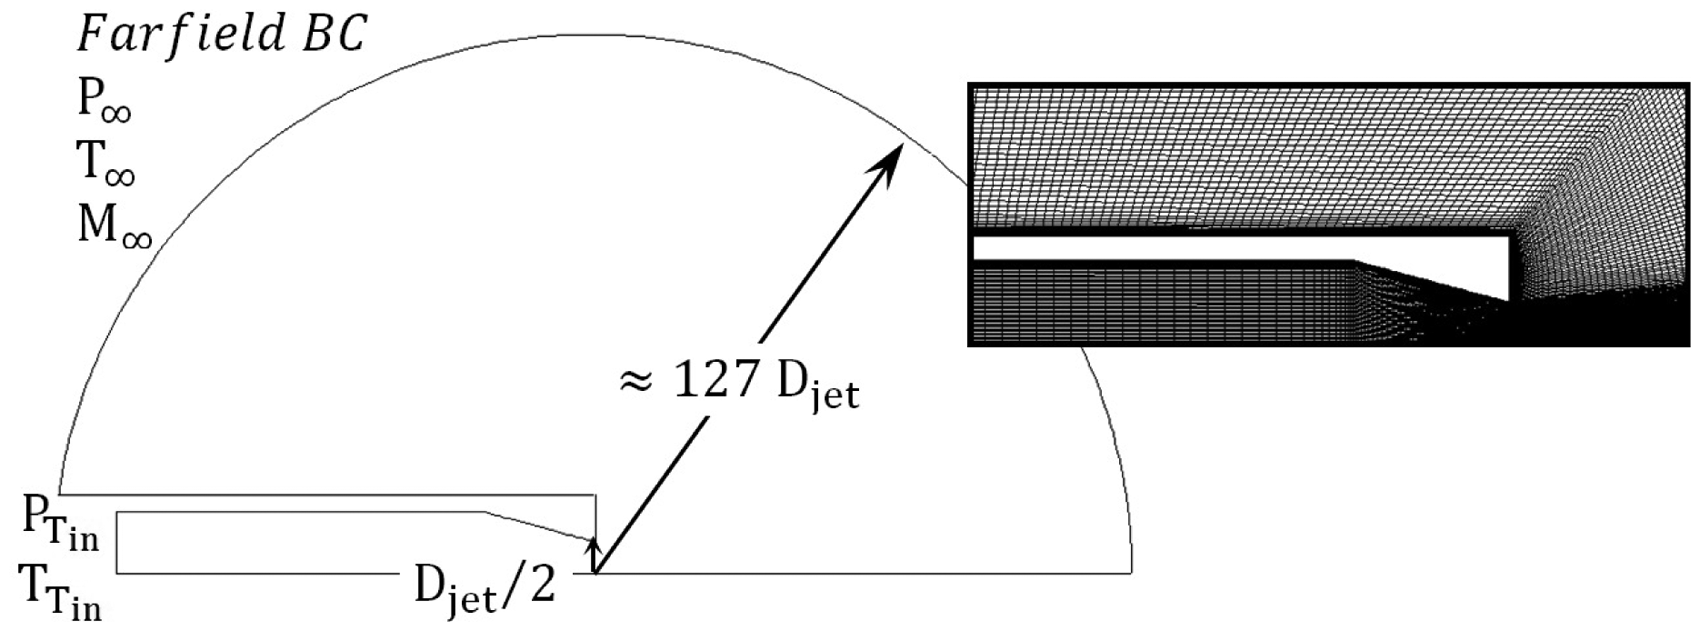
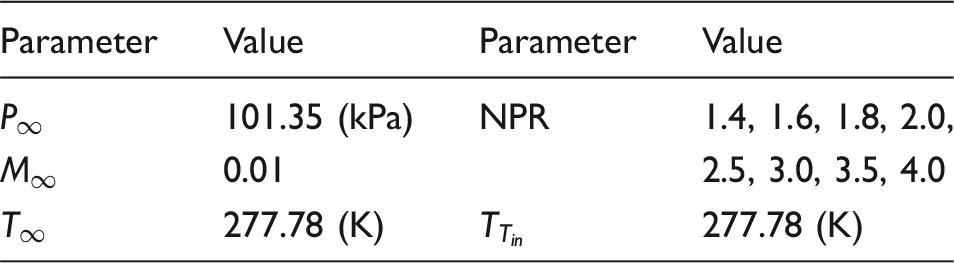
The convergent nozzle with a half angle of 15° (Figure 5) defined for the first propulsion aerodynamics workshop (PAW) was studied to validate the models used in the numerical studies with propulsive nozzles.38 The flow conditions and experimental results were presented by Thornock and Brown.39 A range of nozzle pressure ratios (NPR, equation (1)) with fixed total temperature at the inlet of the nozzle () and fixed external conditions was studied (Table 3). The nozzle performance metrics used in the PAW38 were used to evaluate the test case. Discharge coefficient (Cd, equation (2)) and total velocity coefficient (Cv, equation (3)) were computed to verify the numerical approach adopted in these studies. Videal is the velocity of the ideally expanded jet (equation (4)). In general, the solutions were considered as converged when the scaled residuals were below and forces over the walls oscillated within 0.01% over 200 iterations
Axisymmetric domain and grid used for the computation of the PAW conical nozzle, where .
Scope of the computations with the PAW conical nozzle.
Parameter
Value
Parameter
Value
101.35 (kPa)
NPR
1.4, 1.6, 1.8, 2.0,
0.01
2.5, 3.0, 3.5, 4.0
277.78 (K)
277.78 (K)
The effect of the computational domain and the spatial discretization on the computed nozzle Cd and Cv was assessed at a NPR of 2.5. Domains with radii of (Figure 5) and were established to evaluate the sensitivity of the model to the domain size. The discharge coefficient increased by less than 0.0002% due to the change in the domain diameter from to . The velocity coefficient decreased by approximately 0.003% for the same change in domain size. A domain radius of was selected for the studies with the PAW nozzle because the change in the nozzle performance metrics was considered practically insensitive to the change in domain size. Grid independence studies with a radius of the computational domain of (Figure 5) were performed with three meshes with and elements. Richardson extrapolation and the GCI method advocated by Roache35,36 were used to evaluate the sensitivity of the PAW case to the spatial discretization. The grid used, which contains approximately elements, led to spatial discretization errors of less than 0.01% in both Cd and Cv with a safety factor of 1.25. The three meshes included in the studies were found to be within the asymptotic range for both performance metrics.
The numerical results obtained with the PAW nozzle were compared to the experimental data.39 The Cd typically agreed with the experimental data within . The absolute maximum disagreement of approximately 1.1% occurred at NPR = 1.4. This level of disagreement at low NPR is lower than the results from Zhang et al.40 and Dippold41 who reported accuracies on Cd at NPR = 1.4 of 1.2 and 1.6%, respectively.
The largest difference of the computed Cv was 0.43% at NPR of 2.0. For NPR larger than 2, the absolute difference decreases below 0.12%. This level of agreement is similar to the accuracy obtained by Zhang et al.40 who had a disagreement in Cv between 0.2 and 0.5% with the experimental data. Dippold41 achieved accuracy levels in the calculation of Cv between 0.5 and 1%. The models used in this project are in line with the published best practices as shown by this set of results, which gives confidence in the model adopted for this research.
Drag force analysis
The study of the drag of a jet engine requires the accurate decomposition of the domain around it. Typically, for a near-field approach, the forces at the interior of the stream-tube are considered as components of thrust, while those on the exterior are accounted in the drag domain (Figure 6). A standard system for engine station designation21 was adopted for the analyses (Figure 6). The drag of the nacelle (Dnac) can be split in three different forces (equation (5)): and (Figure 6).21 The integration of the pressure forces acting on the surface of the pre-entry and post-exit stream-tubes defines and , respectively.21 is defined as the sum of the integrated pressure and skin friction forces over the fan cowl from the stagnation point to the TE21
Standard designation of the engine stations.
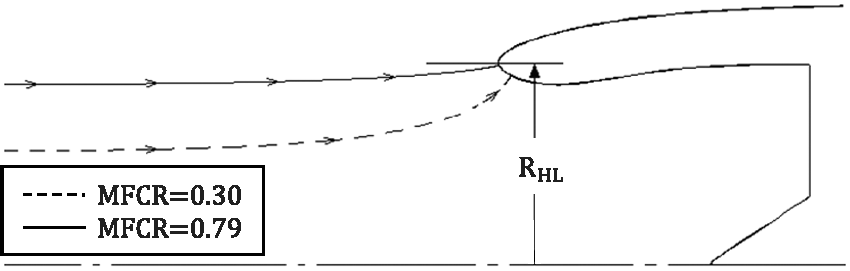
The attachment point of the pre-entry stream-tube and the fan cowl TE defines the boundaries of and (Figure 6). However, the location of the attachment point on the engine intake is unknown for most of the operating envelope (Station 1, Figure 6). The location of the stagnation line is typically affected by the MFCR and angle of attack20 and therefore by different operating conditions (Figure 7). MFCR is defined by the ratio between the highlight area (, Figure 1) and the stream-tube area far upstream (, Figure 6).
Typical attachment point of the pre-entry streamtube for two MFCR at .
The modified near-field method14,16,20 allows the computation of the forces on the pre-entry stream tube and fan cowl (equation (6)). and are the gauge stream-tube forces at the AIP and station ∞, respectively (Figure 6). The viscous (τw) and gauge pressure forces from the AIP face (Figure 6) to the fan cowl TE are integrated over the surface of the intake and fan cowl (equation (6)). is the static free-stream pressure and ϑ is the local inclination of the surface
A momentum balance may not be adopted to compute due to the unknown momentum flux far downstream of the nozzles exit (Stations 100 and 00, Figure 6). At stations 100 and 00, the static pressure is assumed to be equal to the free-stream static pressure (), but the velocities in the jet wakes are unknown. Methods to compute the momentum flux in 00 and 100 (Figure 6) such as Jones thrust or Pearson thrust are discussed in the literature.22 These estimate the wake terms based on the parameters known at the nozzles exit (Stations 8 and 18, Figure 6). A new method for direct integration of the force is proposed to increase accuracy in drag extraction for computational studies.
Jones thrust
One of the suggested methods22 assumes an isentropic process from the nozzle exit (Stations 8 and 18, Figure 6) to far downstream (Stations 100 and 00, Figure 6). The transfer of momentum or energy between the stream-tube and its surroundings are not accounted in the process which expands the gas to free-stream static pressure (, Figure 6). These assumptions allow the computation of the jet velocity at stations 100 and 00 for each of the engine nozzles (equation (7)). The assumption of one-dimensional isentropic stream-tube from the nozzles exit to far downstream has also been suggested for wind tunnel testing.42 This set of assumptions was used by von Geyr and Rossow42 to compute the post exit forces in an experimental campaign with turbine-powered simulators. However, post-exit shock patterns are created in exhaust systems with separate-jets at typical NPR.43 These shocks, boundary layer growth and mixing increase entropy and decrease the accuracy of the assumptions made in the Jones thrust model
Pearson thrust
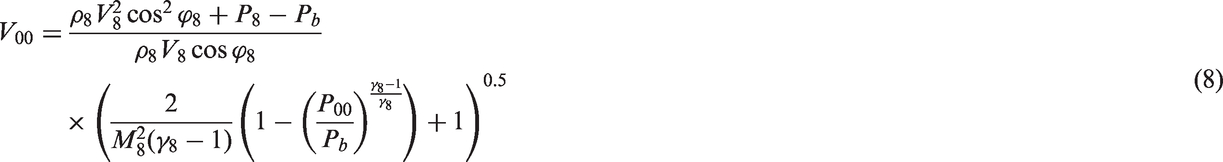
Pearson’s method22 assumes an adiabatic compression or expansion from the nozzle exit to a station g (Figure 6). At the station g (Figure 6), the static pressure of the internal flow is assumed to be equal to the pressure around the nozzle TE (Pb). The direction of the flow at g is assumed as completely axial. Pb is assumed to be constant on the exterior of the stream-tube from the nozzle exit to the station g (Figure 6). From station g to stations 100 and 00 (Figure 6), the flow undergoes an isentropic process to reach a pressure equal to the free-stream pressure. This set of assumptions makes possible the estimation of V00 (equation (8)) and V100. In general, the assumption of adiabatic flow provides a better description of the post-nozzle stream-tube than isentropic flow. However, the assumption of constant external static pressure around the post-exit stream-tube needs to be tested
Direct integration
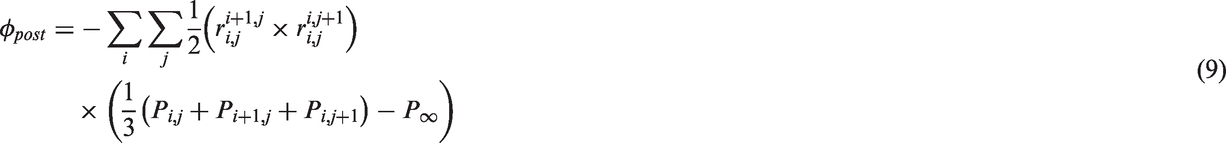
One way to compute the post-exit force is the direct integration of the static pressure over the post-exit stream-tube. In numerical studies, it is possible to obtain a discrete distribution of static pressure over a finite number of path lines starting from the TE of the fan cowl (Figure 8). The individual force on the triangular zone formed by three adjacent points (Figure 8) is computed by the product of the area and the average gauge static pressure (equation (9)). This method assumes a small variation of static pressure within the vertices of the discrete triangles. The sum of the individual forces over the discretized stream-tube results in . The shear stresses between the jet stream and the external flow are not taken into account by the method of direct integration. The direct integration method has been used to post-process the results developed in this paper
Extraction of the post-exit path-lines for computation of with the method of direct integration.
LOM to estimate nacelle drag
Different LOM for the estimation of the nacelle drag in isolation have been published by several authors.5–8 In general, they use a flat-plate skin friction approach multiplied by a form factor (λ) to account for pressure terms (equation (10)). Even though the overall strategy is similar, the methods change in the specific approaches to compute both the form factor and the skin friction coefficient (Cf).
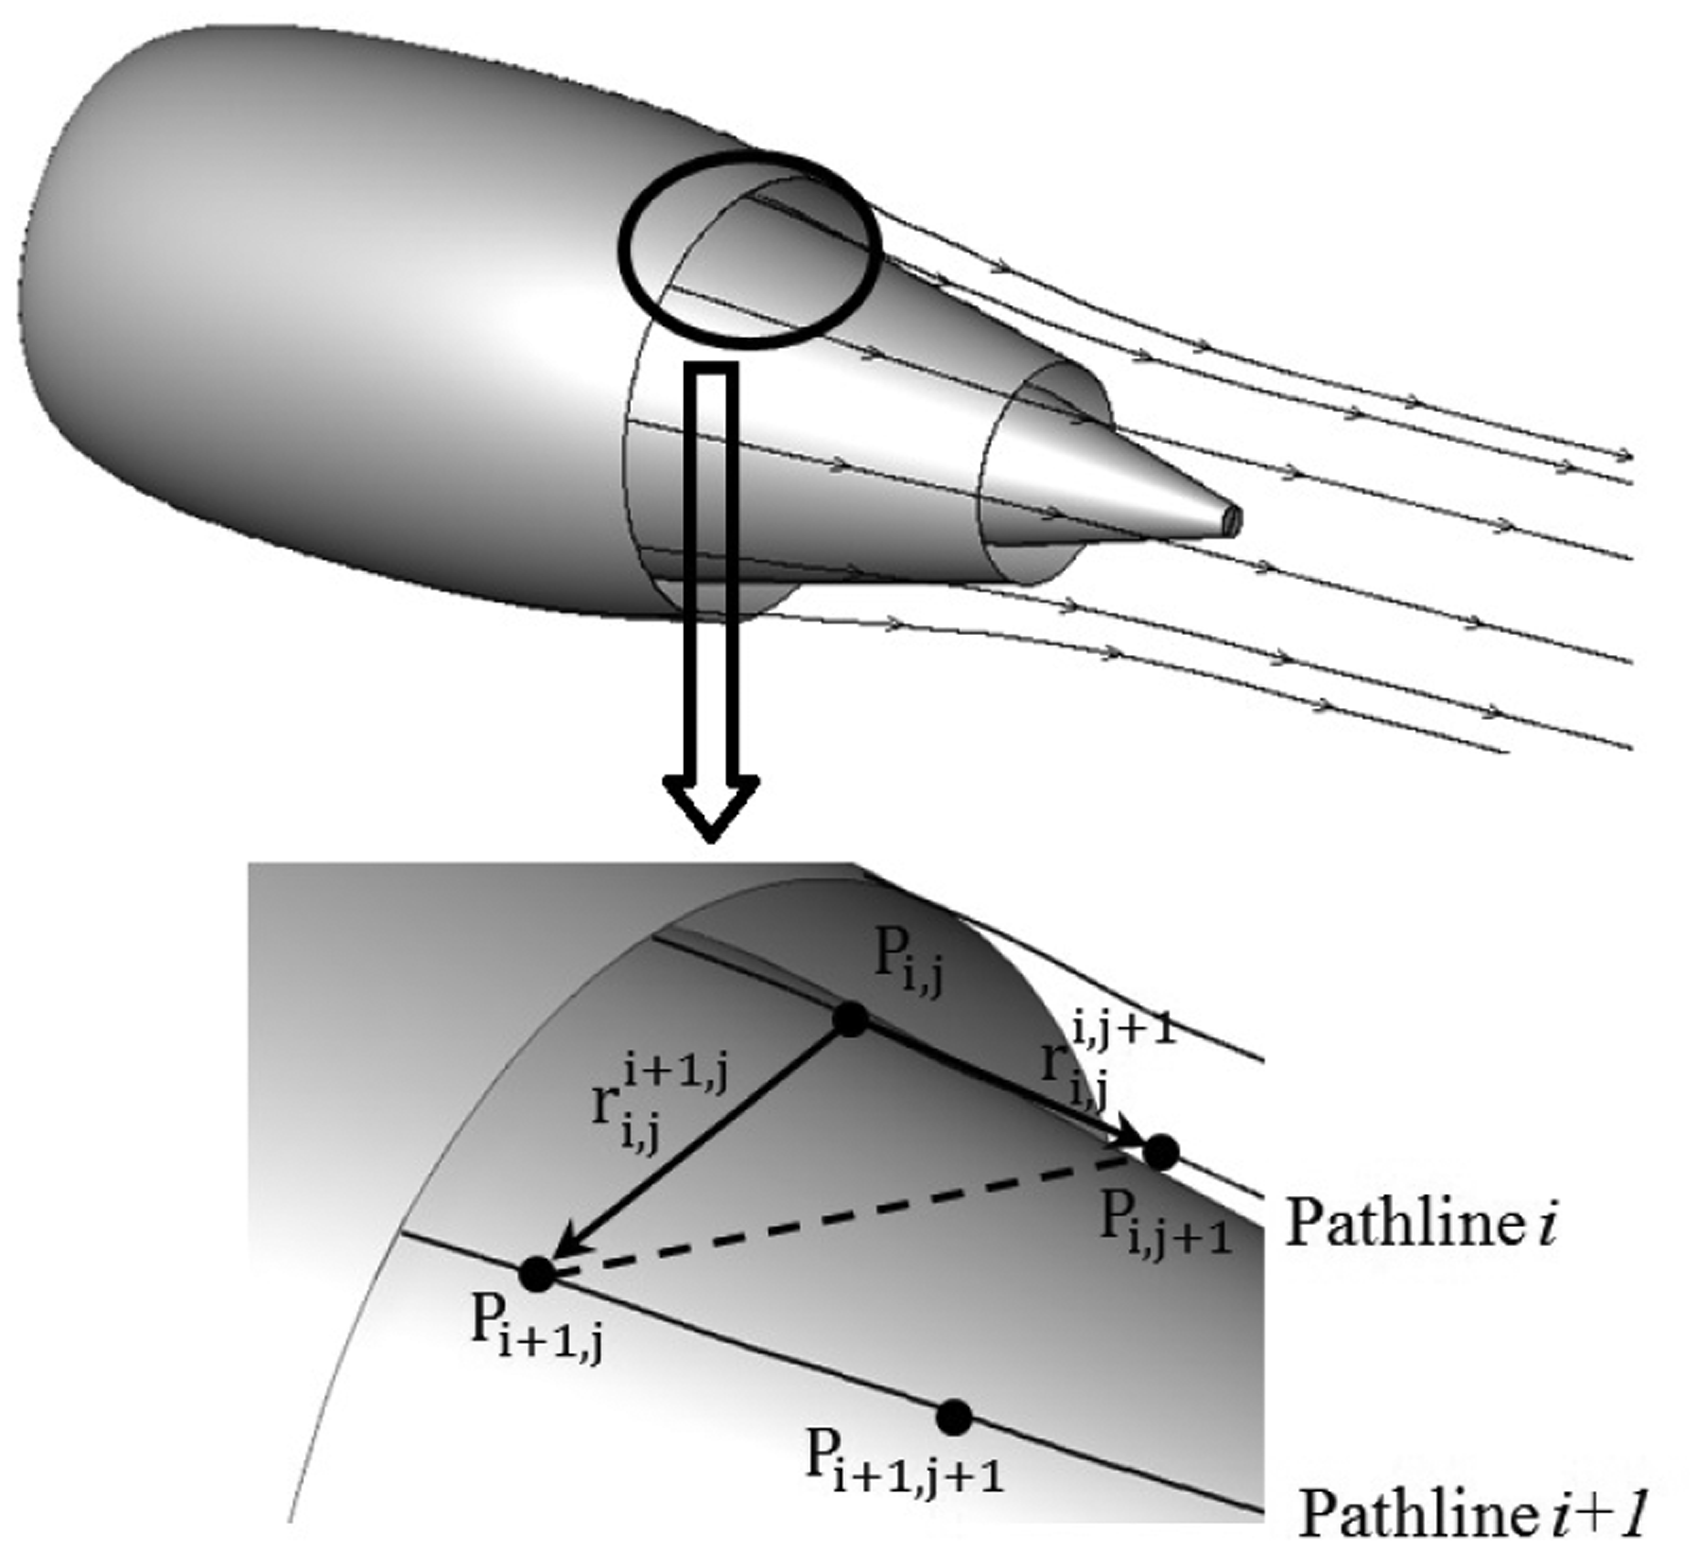
Tabakoff and Sowers,8 Raymer6 and Street9 compute the skin friction coefficient of the fan cowl as a function of and Reynolds number based on the fan cowl length (Re, equation (11)). Although these methods are similar, all of them use different coefficients (equation (11)) for the computation of Cf (Table 4). The use of semi-empirical data to estimate the skin friction coefficient of the fan cowl is suggested by Roskam7 and ESDU 810245
Coefficients used by different authors to compute the skin friction coefficient (equation (11)) of a fan cowl.
The methods advocated by Tabakoff and Sowers8 and Street9 require the distribution of measured static pressure over the fan cowl to compute the pressure drag. Consequently, these two methods are typically inadequate for the estimation of nacelle drag in preliminary design. On the contrary, ESDU,5 Raymer6 and Roskam7 suggest different methods for the computation of the form factor. A reduced fidelity λ is estimated as a function of the nacelle fineness ratio on the approaches suggested by Raymer (equation (12)) and Roskam (equation (13)). The form factor in ESDU 810245 is a more complex function of nacelle shape, MFCR and free-stream Mach number. ESDU 81024 has been validated with experimental data for a range of nacelle shapes, Re, and MFCRs.5 Although ESDU is the most comprehensive approach among the methods considered, it is restricted to axisymmetric fan cowls with sharp TEs in subsonic flow.5 None of the considered methods account for the effect of the angle of attack on the nacelle drag
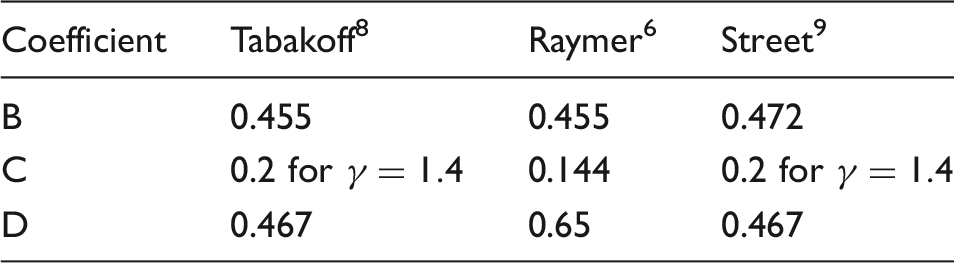
The increase in nacelle drag due to the increase in angle of attack (α, Figure 9) can be estimated by a cubic polynomial on angle of attack (equation (14)) originally developed for fuselages.7 This approach requires the fan cowl base area (, Figure 9) and planform area (Spa, Figure 9), the ratio of the drag coefficient of a finite cylinder to that of an infinite cylinder (η) and the steady-state cross-flow drag coefficient for 2D circular cylinders (). η and are both obtained from empirical data presented by Finck.44 However, data for the estimation of η are only presented for larger than 2.7 Fineness ratios between 2 and 3 are typically found on long-duct nacelles.45 However, modern and future nacelles tend to be shorter with fineness ratios lower than 2. Therefore, the method recommended by Roskam7 may not be applicable for future short fan cowls
Definition of the engine angle of attack and fan cowl areas.
A method originally developed for the estimation of for blunt bodies of revolution12 could be adopted following the approach advocated by Roskam.7 The approach developed by Kelly12 and suggested by DATCOM44 uses a fourth-order polynomial on α for the estimation of (equation (15)). This approach can only be applied when α < 10°, and the criterion of is met.12,44 Current engines at typical cruise conditions are expected to be within the applicability range of the model by Kelly.12 From the empirical data presented by Finck,44 if . The product is generally below 0.2 for subsonic and typical transonic flight with angles of attack lower than 10°
Results and discussion
Fidelity of the methods for the computation of
The Pearson thrust and direct integration methods can be compared to Jones thrust for the evaluation of their fidelity in the computation of . The Jones thrust approach is the analytic method to obtain if the post-exit stream-tube is isentropic.22 Therefore, the post-exit force can be determined analytically in shock-free Euler flow with the Jones thrust method. A range of for the 2D axisymmetric model and non-viscous shock-free flow was computed to benchmark the three approaches for the computation of (equation (16) and Figure 10). Free-stream total pressure () and temperature () were established as boundary conditions in the nozzle inlets to avoid the presence of shock waves in the post-nozzle stream-tube (Figure 3)
calculated by different approaches for the 2D axisymmetric model of the E1 engine at MFCR = 0.72 as a function of in Euler flow.
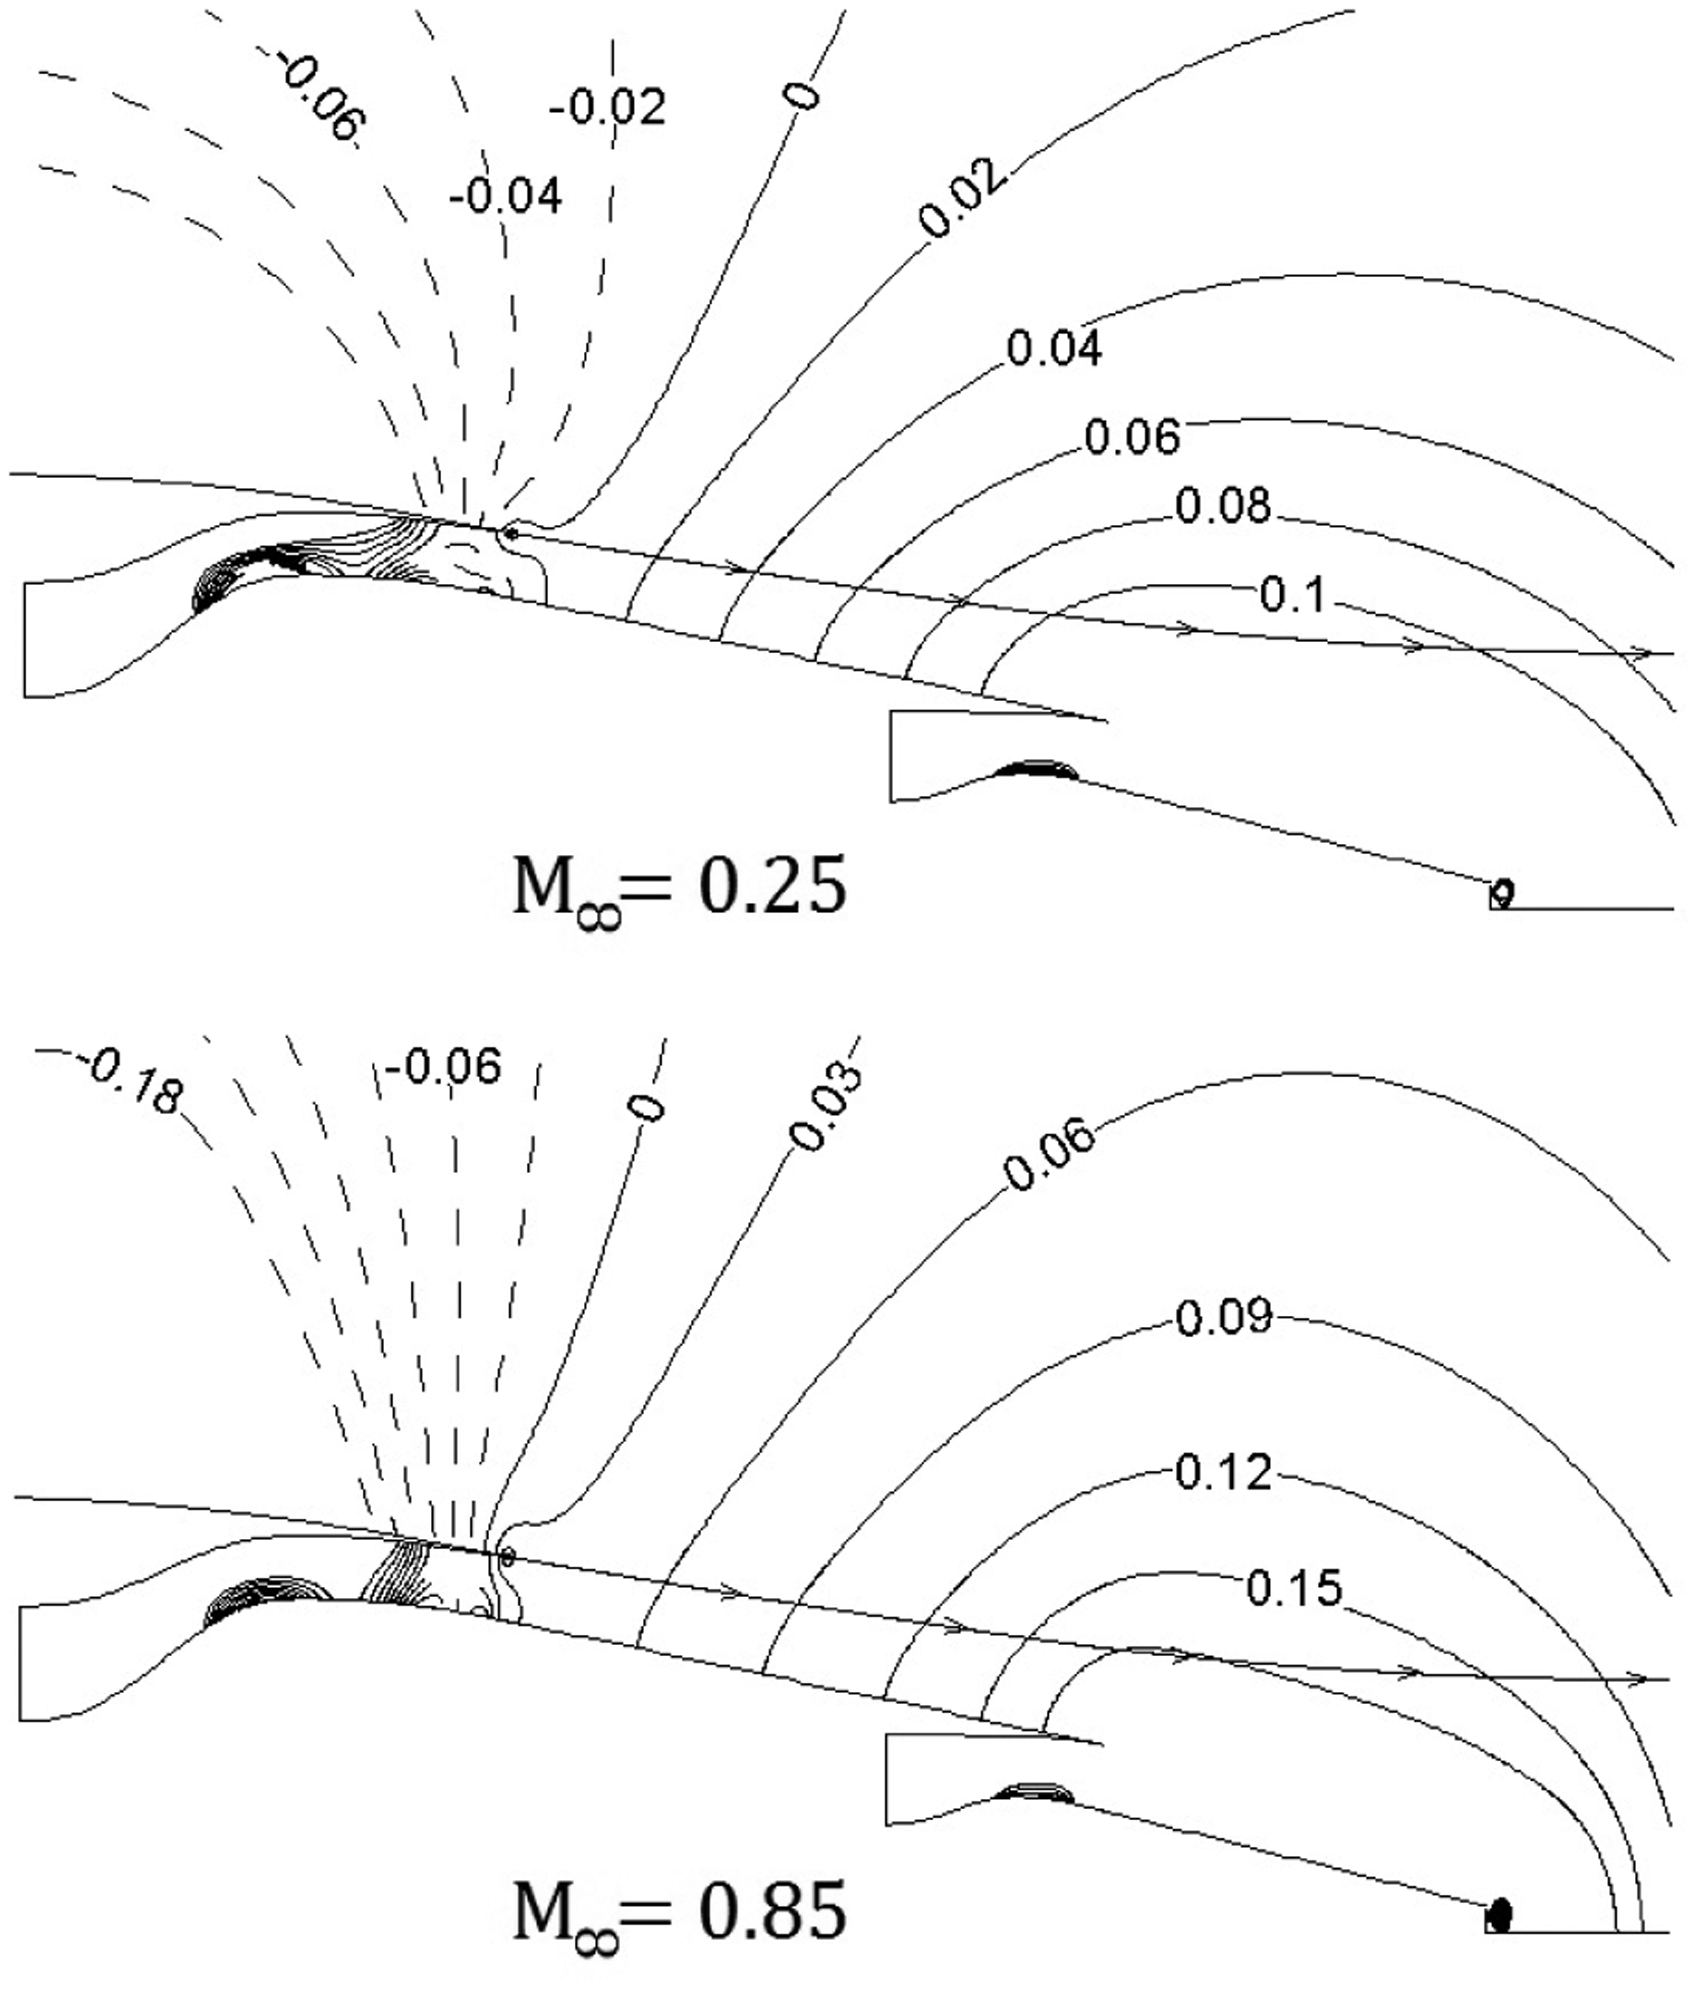
The external flow in the close proximity to the TE of the fan cowl has an inclination similar to its boattail angle (βnac, Figure 1). A concave turn of the external flow from this angle to a purely axial direction far downstream of the nozzle exit is typically expected when the engine angle of attack (Figure 9) is equal to zero (Figure 6). In general, an increase in pressure follows this concave change in the direction of the external streamlines (Figure 11). A larger free-stream velocity usually results in larger velocities at the fan cowl TE if the MFCR and velocity are kept constant. The combined effect of larger free-stream Mach number and concave curvature of the post-exit streamlines creates a relatively larger pressure increase (Figure 11). increases as a function of the free-stream Mach number (Figure 10) due to the integration of a relatively larger pressure over the post-exit stream tube (Figure 11).
CP distribution over the post-exit steam-tube with jet-off condition in Euler flow for the E1 engine.
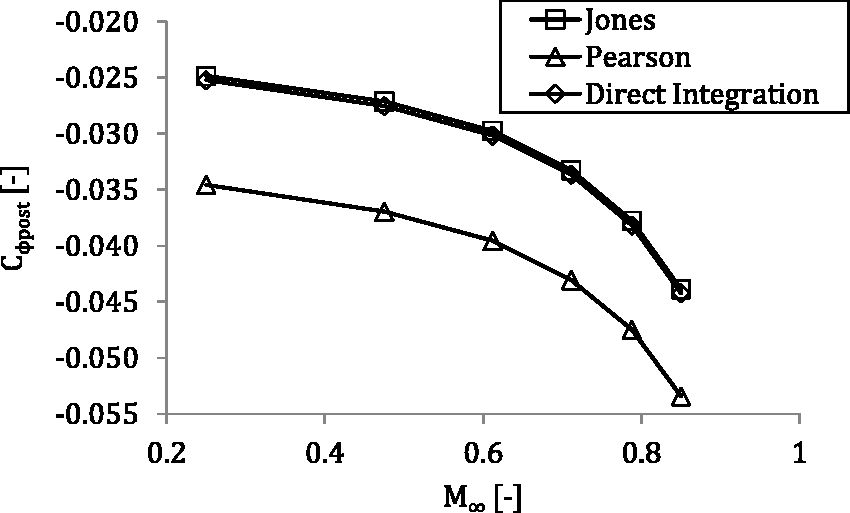
In general, the Pearson thrust approach underestimates by between 22 and 39% when it is compared to the results obtained with the Jones thrust (Figure 10). The computed with the direct integration method typically agrees within 1.6% with the post-exit force calculated with the Jones thrust method (Figure 10). The main difference in the Pearson thrust compared to the other two approaches is the assumption of a constant pressure over the stream-tube. This assumption is typically inaccurate due to the presence of pressure gradients over the core cowl (Figure 12). Consequently, the post-processing of detailed numerical results with Pearson thrust decreases the fidelity achieved with the CFD studies. As a result, only the Jones thrust and the direct integration methods have been assessed in viscous compressible flow for the selection of a suitable post-processing approach.
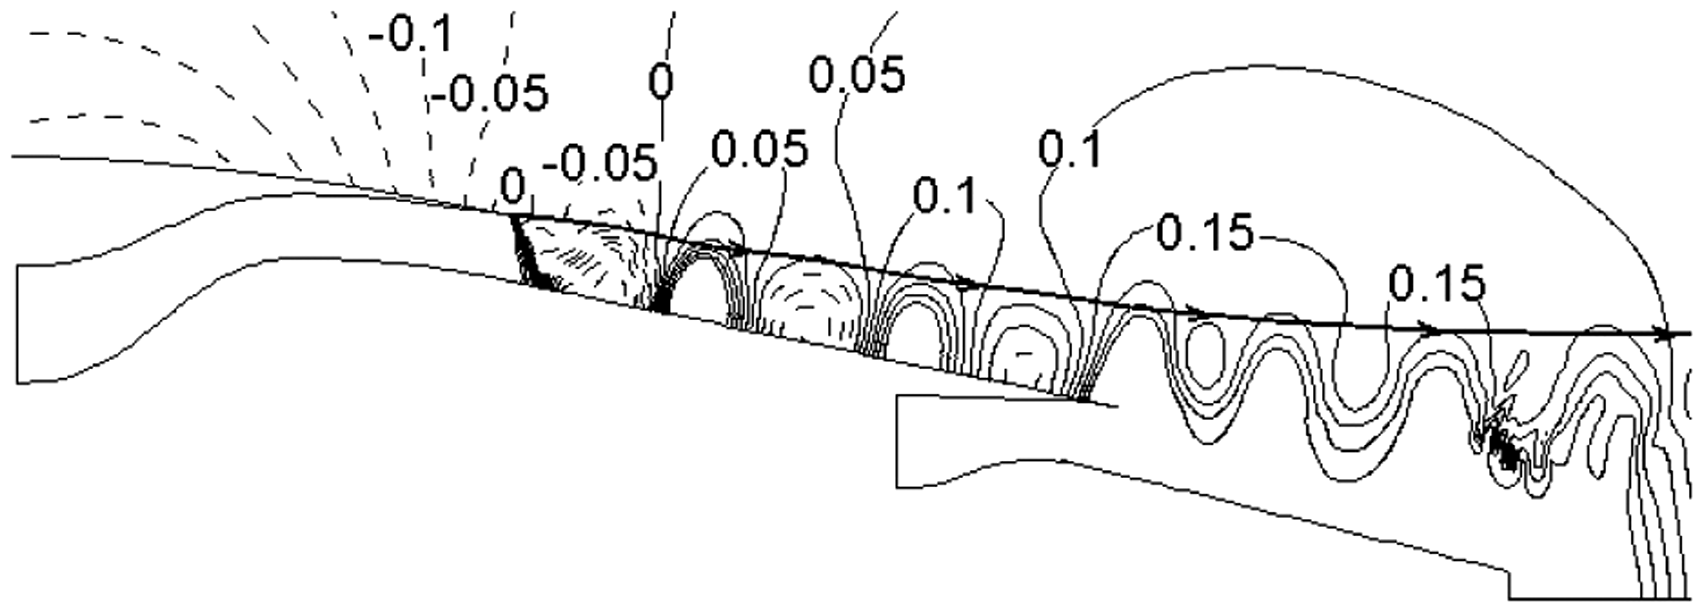
CP distribution over the post-exit steam-tube at , MFCR = 0.72, FNPR = 2.58 and CNPR = 2.27 for the E1 engine in viscous compressible flow.
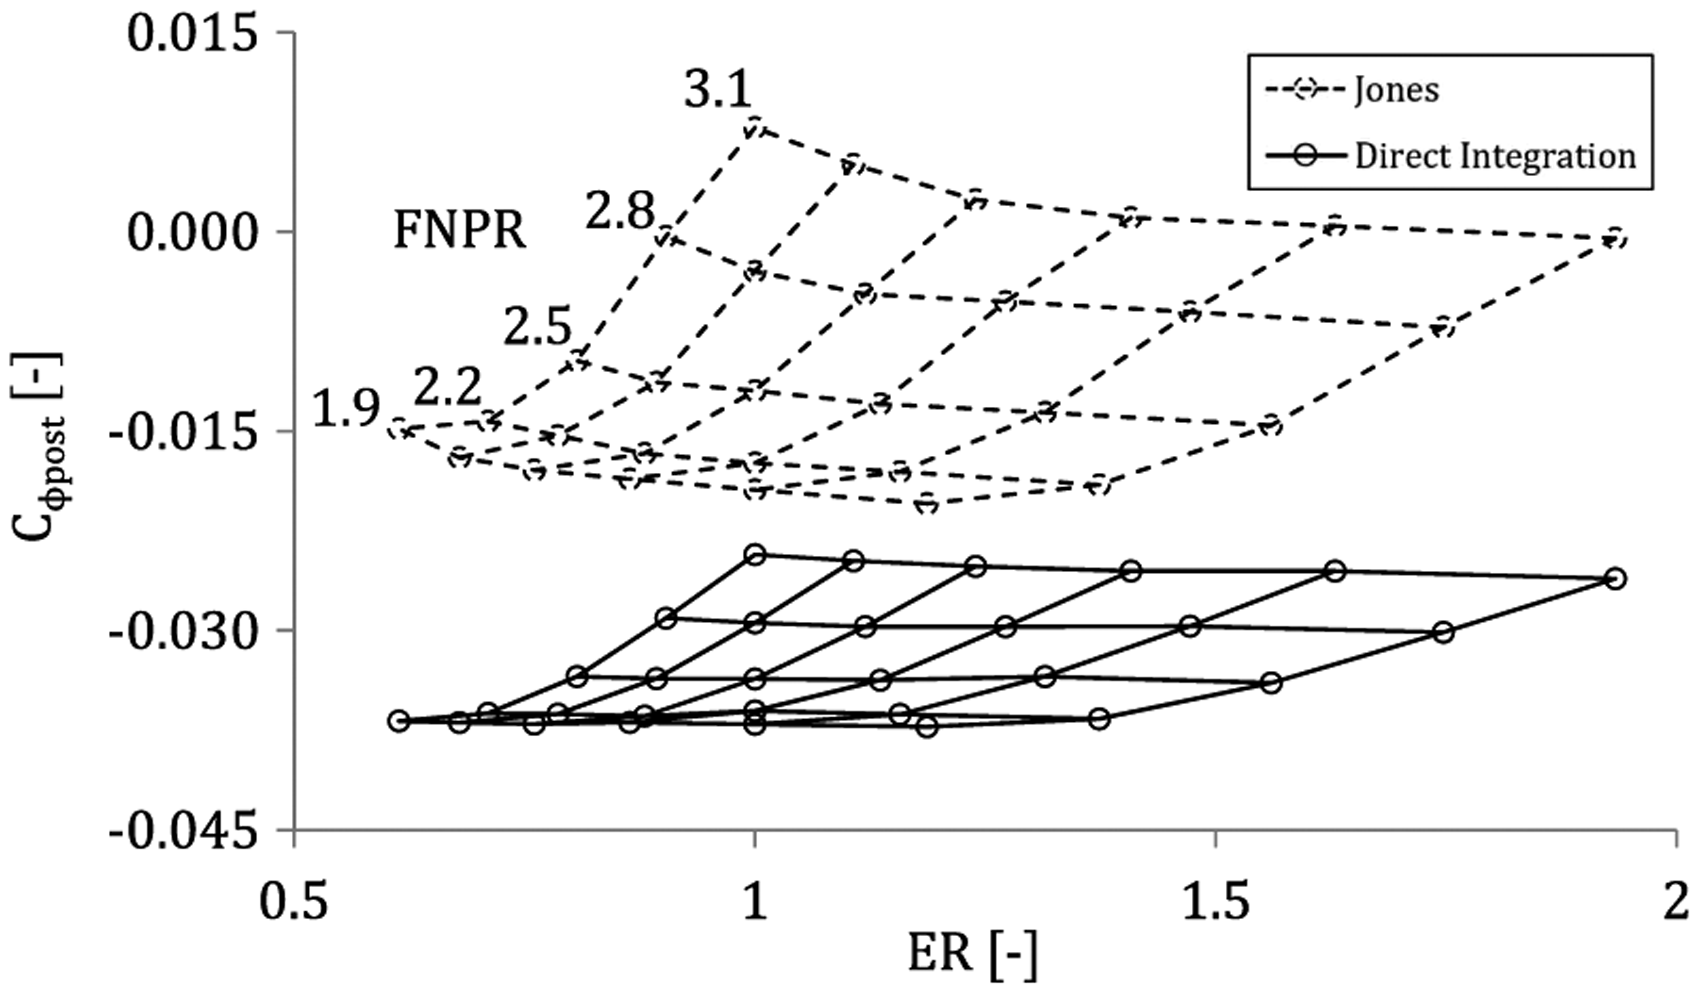
A decrease in the accuracy of the Jones thrust method is expected for configurations with viscous compressible flow. Viscous stresses, mixing and shock wave patterns increase entropy and reduce the validity of the assumption of isentropic flow. A range of fan nozzle pressure ratios (FNPR) and core nozzle pressure ratios (CNPR) for the 2D axisymmetric model with viscous flow were computed to assess the effect of realistic flow in the Jones thrust method. The results (Figure 13) are presented as a function of the extraction ratio . In general, the post-exit force computed with the Jones thrust approach over-estimates the post-exit force compared to the direct integration method (Figure 13). In this perspective, computations with the Jones thrust typically over-estimate the detrimental drag force (equation (5) and Figure 6). As expected, the increase in the strength of the shocks generated by larger FNPR increases the level of disagreement between the two methods (Figure 13). For example, the post-exit force coefficient is over-estimated by the Jones method by 45–48% at a FNPR of 1.9 and ER of 1.19–1.0 (Figure 13). Convergent nozzles are typically choked at cruise operation46 with FNPR usually above 1.89–1.99.47 Generally, the FNPR has a larger effect over the post-exit force than the CNPR (Figure 13). The relatively stronger effect of the bypass flow on is created partially by the area of the nozzle, NPR and mass-flow, which are larger compared to the core flow. The use of Jones thrust to post-process numerical studies decreases the accuracy obtained with the computational analyses. Within this context, the direct integration method has been adopted for these studies.
computed with the Jones thrust22 and direct integration method for ranges of FNPR and ER with the E1 engine at in viscous compressible flow.
Importance of in the computation of Dnac
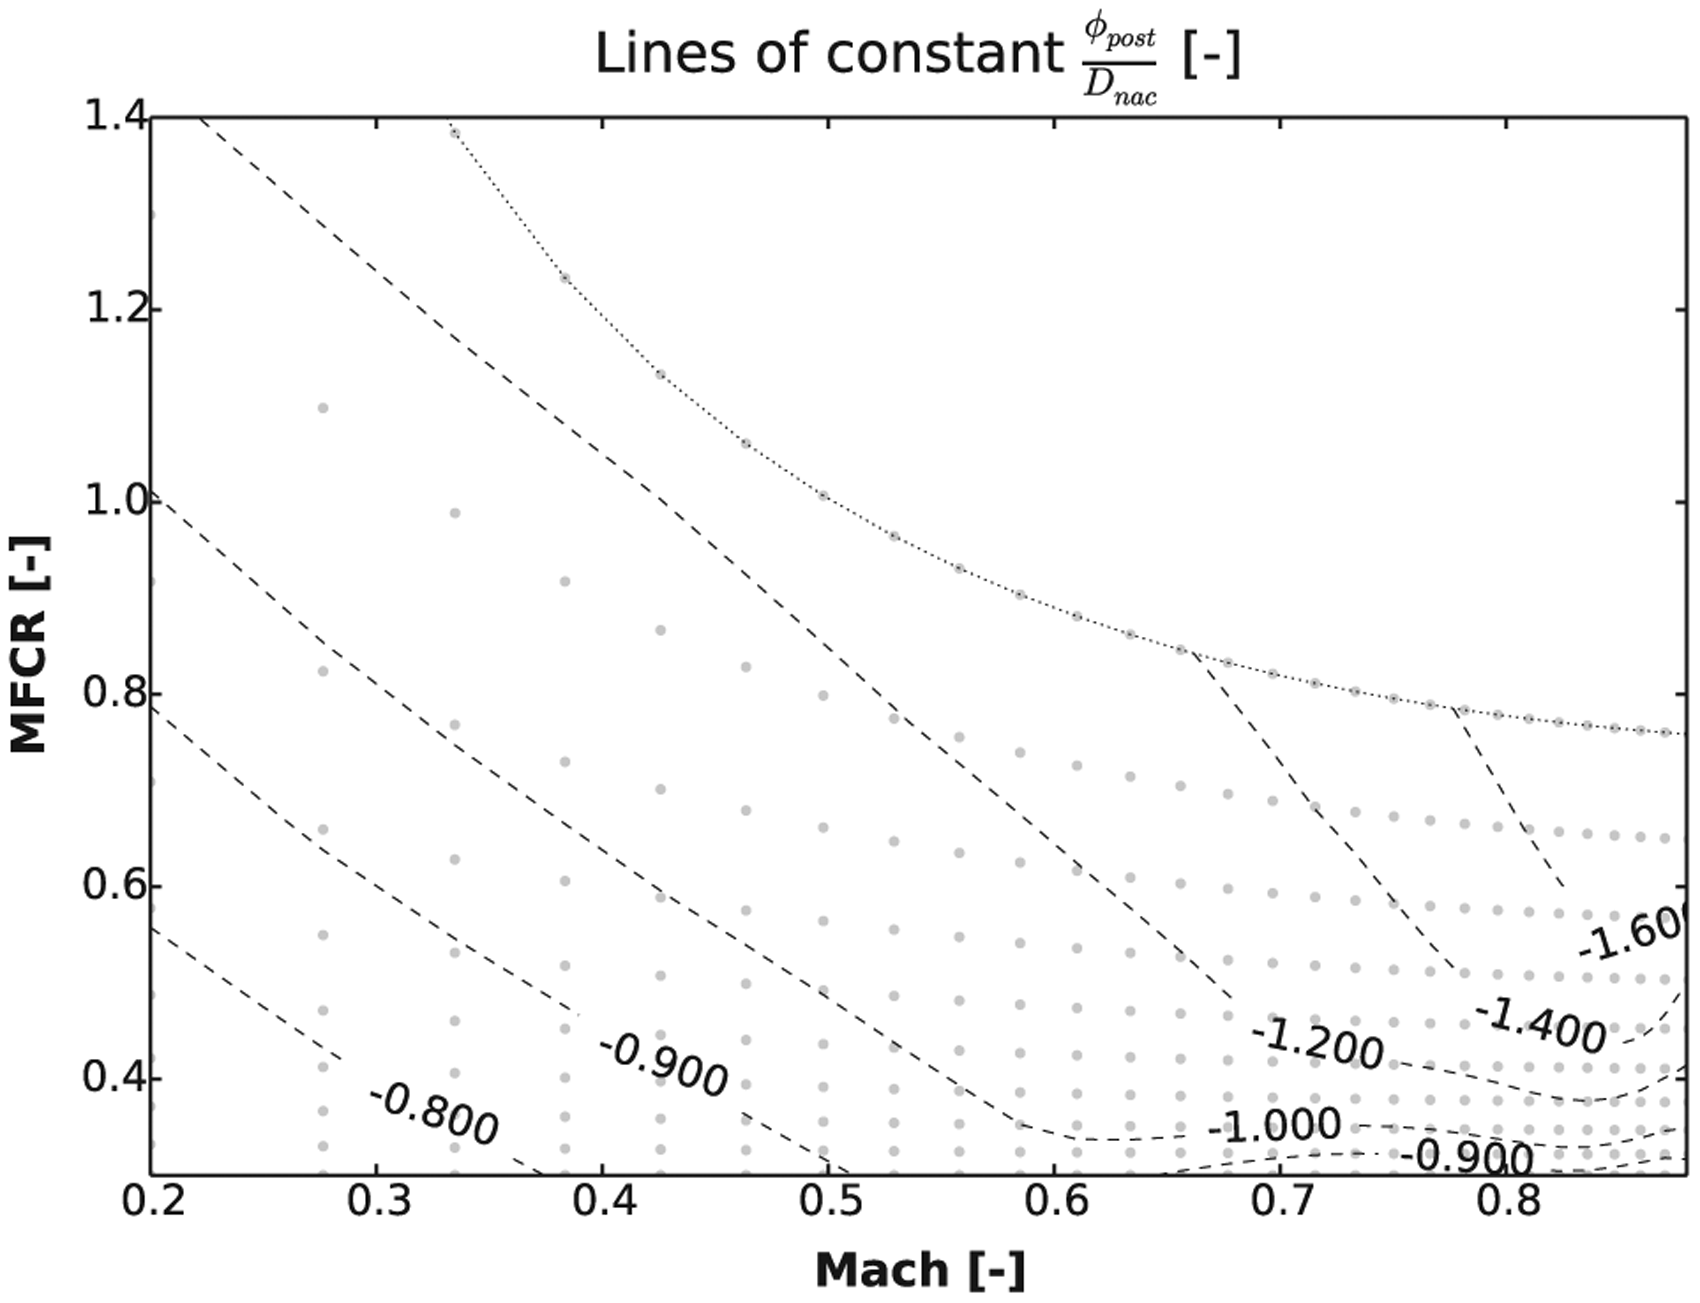
Dnac is equal to zero for the infinite body (Figure 6) composed of the pre-entry stream tube, the fan cowl and the post-exit stream-tube in potential flow.21 Therefore, the force (equation (5)) balances the rearward force in potential flow. An exact balance of with is not possible in real flow due to viscous or wave drag effects.21 Within this context, the estimation of (equation (16)) by a method developed for intakes with sharp leading edge in one-dimensional flow5 has shown that can be up to for a typical nacelle48 at and MFCR = 0.75. This large pre-entry force in comparison to the overall level of nacelle drag is partly compensated by . Most of the compensation to occurs over the fan cowl in nacelles with single nozzle exit and relatively low .5,23 However, a relatively larger compensation is expected in the post exit stream-tube for short nacelles with separate streams. For instance, the magnitude of is been between 0.8 and 1.6 times the overall drag of the engine for a broad range of and MFCR (Figure 14). In particular, the post-exit force is between and for and MFCR typical for cruise operation (Figure 14). Consequently, the computational assessment of nacelle drag by a near-field approach should include the computation of due to its relevance in the overall drag of an engine.
for the E1 engine with pressure matched nozzles at . Symbols show the points computed.
Typically, the integration of the gauge pressure over the post-exit stream-tube on an aero-engine with separate jets results in a forward force (, Figure 14). As a consequence, (equation (16)) attenuates the rearward force created by the pre-entry and the fan cowl forces (). In general, each of these three components of Dnac (equation (5)) is a function of operating conditions as MFRC, or Re. For instance, the spillage becomes a dominant effect in the overall drag of the nacelle at low values of the MFCR.23 Therefore, the relative importance of the in the overall drag decreases when the MFCR decreases at a constant (Figure 14). The magnitude of has been shown to decrease by 38% in comparison to Dnac when MFCR decreased from 0.78 to 0.41 at (Figure 14). Similarly, the forward force (Figure 6) increases with (equation (16) and Figure 10) due to the concave turning of the external flow over the post-exit stream-tube. Additionally, the increase in typically decreases the friction (equation (11)) component of . These combined effects of on and can potentially decrease the proportion of in Dnac by 23% when increases from 0.38 to 0.61 at MFCR = 0.73 (Figure 14). Overall, is a critical component of Dnac regardless of the operating conditions and should be carefully accounted in drag studies.
Effect of the Mach number and MFCR on nacelle drag
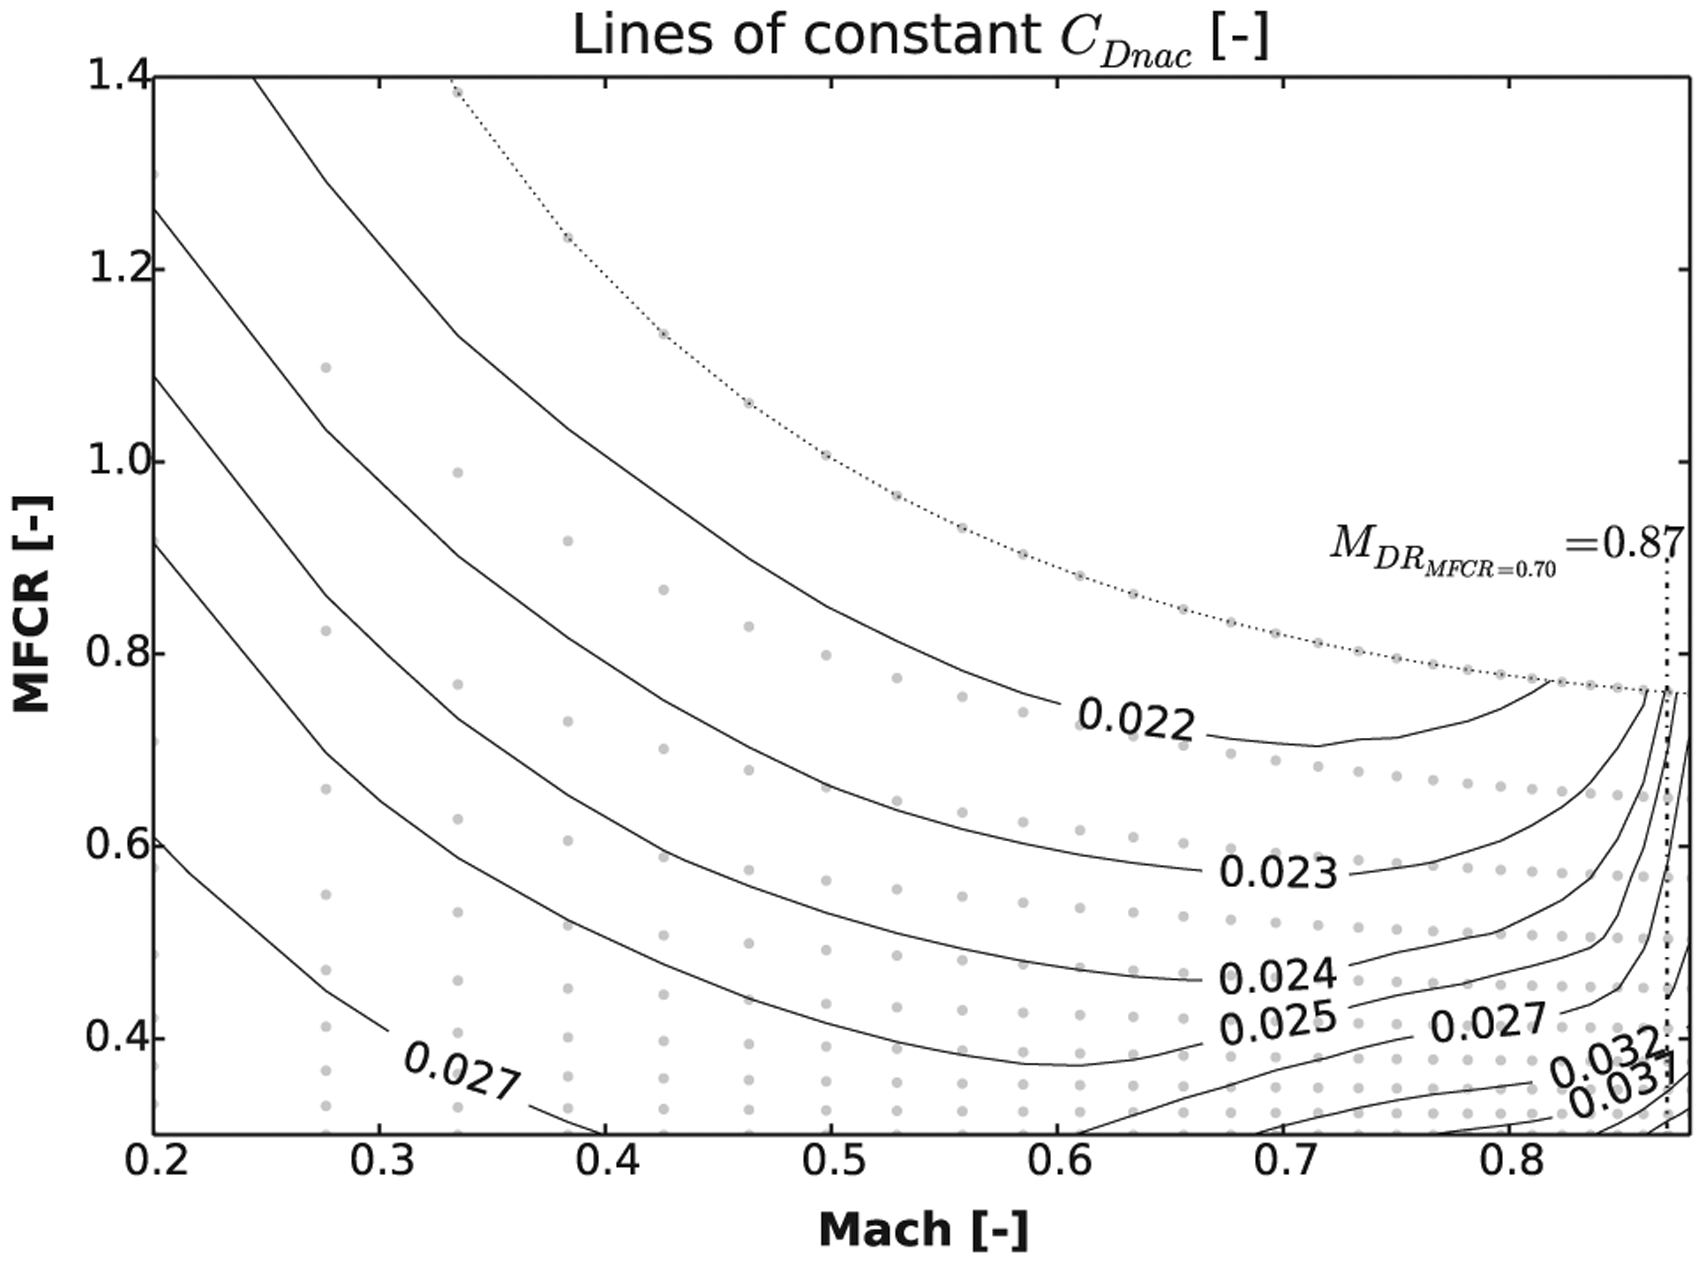
Generally, the nacelle drag increases when MFCR decreases (Figure 15) from unity as was demonstrated analytically by Seddon and Goldsmith,46 numerically by Heidebrecht et al.23 and experimentally by Obert48 and Langley.10 The combination of low MFCR and high Mach number leads to a substantial increase in (Figure 15) due to the presence of shock waves over the fan cowl.5,10,46 Typically, low sensitivity of the nacelle drag to changes in free-stream Mach number is expected when is lower than MDR10,48 (Figure 15). An increase in free-stream Mach number above MDR leads to relatively steep increases in nacelle drag10,23 (Figure 15).
Effect of the MFCR and on for the E1 engine at different Mach numbers.
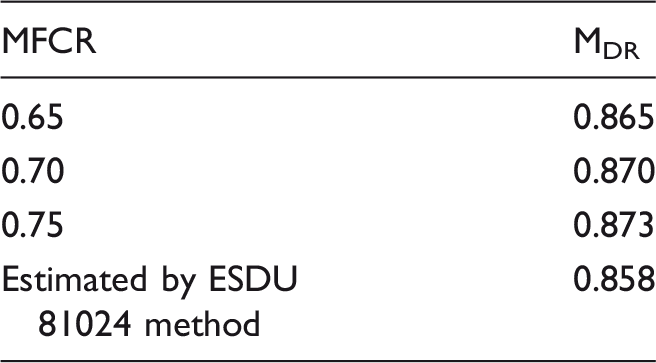
Typically, the drag rise Mach number (MDR) of an aero-engine varies as a function of the MFCR23 (Table 5). For example, on the E1 engine, the drag rise Mach number increased from 0.865 at MFCR = 0.65 to 0.873 at MFCR = 0.75 (Table 5). On the basis of these ideas, ESDU5 suggests a low-order methodology to estimate the MDR for aero-engines mostly as a function of the fan cowl geometry.5 The MFCR is accounted in the computation of the MDR only when the MFCR is below (MFCRcrit).5 Experimental data for several NACA-1 cowls were used to develop the method advocated by ESDU.5 ESDU claims accuracies of ±0.075 and ±0.02 in the estimation of the MFCRcrit and MDR, respectively.5 The MDR estimated by ESDU has agreed with the numerical data within 0.015 for a fan cowl design different to NACA-1 (Table 5).
MDR for the E1 engine in the CFD studies at three MFCR and estimated by the method in ESDU 81024.5
MFCR
MDR
0.65
0.865
0.70
0.870
0.75
0.873
Estimated by ESDU 81024 method
0.858
Effect of the nacelle size on the nacelle drag
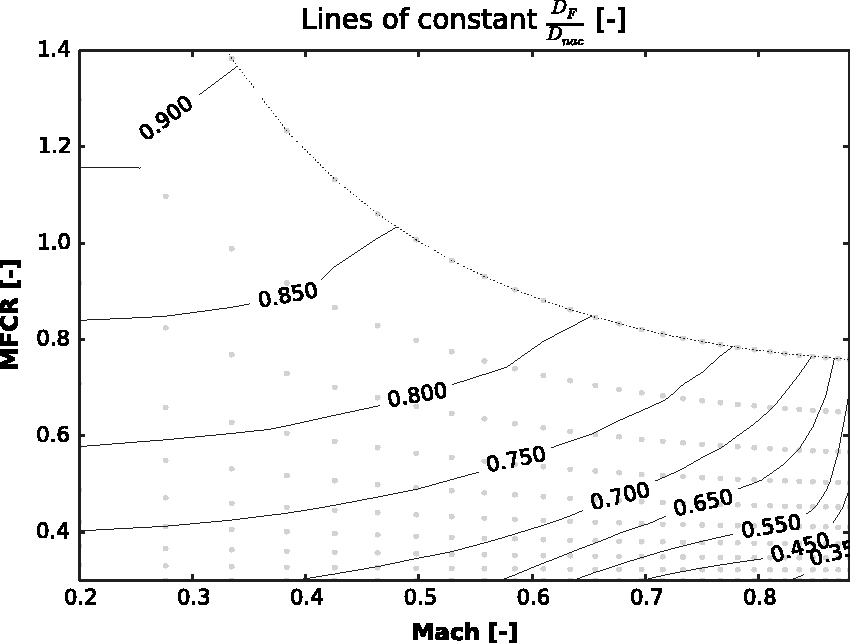
One key question in preliminary design is the impact of the engine size on the drag of the nacelle. Ideally, a scaling factor on nacelle drag based on is expected when the engine size is increased. However, a more complex scaling factor is expected if the effect of the Reynolds number on the skin friction is taken into account. In general, larger Reynolds numbers result in relatively lower skin friction coefficients (equation (11)). Therefore, the increase in nacelle drag due to the increase in engine size is approximated by the ratio of the skin friction coefficients (equation (11)). The combination of equations (10) and (11) provides the relative increase in nacelle drag due to the increase in fan diameter (equation (17)). The increase in drag of a larger engine (E2) relative to a baseline engine (E1) is a function of their wetted area (Swet) and Reynolds numbers based on fan cowl length (equation (17))
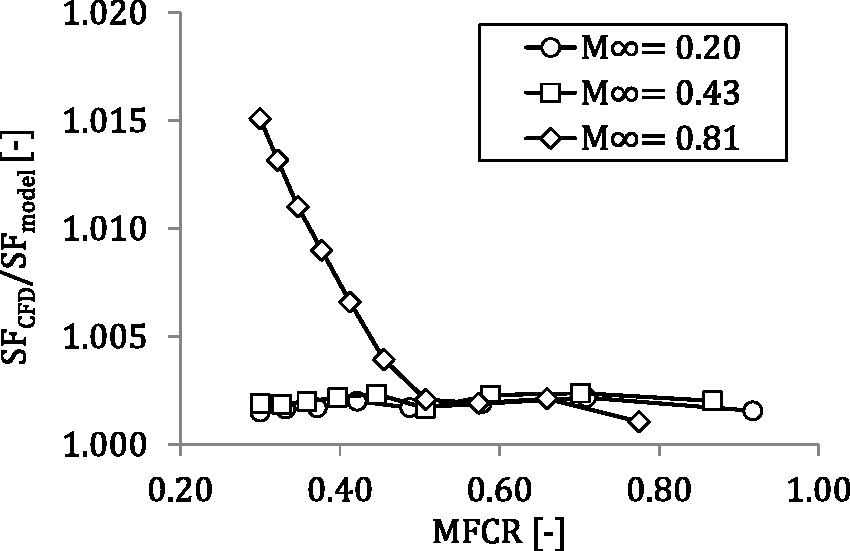
It was typically found that the effect of an increase in engine size on the nacelle drag was mostly captured by equation (17). The relative increase in drag due to the increase in engine size from the E1 engine to the E2 engine (Table 1) was captured by equation (17) within 0.5% for free-stream Mach numbers lower than 0.87 and MFCR larger than 0.5 (Figure 16). The presence of shock waves at larger free-stream Mach numbers and lower MFCR decreases the accuracy of equation (17) to approximately 1.5% (Figure 16). This increased disagreement is caused by the interaction between the shock wave and the boundary layer. The presence of a shock wave with a relatively different boundary layer thickness affects the pressure distribution after the shock. However, the combination of large and low MFCR is unlikely in typical operation. For example, the MFCR of aero-engines in cruise operation is typically expected to be close to 0.7.47 Overall, a good agreement between detailed numerical studies and the scaling factor in nacelle drag (equation (17)) has been achieved.
Ratio between the SF computed in CFD studies and estimated by the Reynolds model (equation (17)) for the E2 and E1 engines.
LOM for the estimation of nacelle drag
The LOM assessed in this paper estimate the skin friction drag and multiply it by a form factor to evaluate the drag of the nacelle. The friction part of ideally includes the forces from the attachment point on the intake to the fan cowl TE. However, these LOM use the length of the fan cowl from the highlight to the TE to compute the skin friction drag. The difference in the axial distance between the attachment point and the highlight is relatively small for MFCR typical of cruise operation (Figure 7). Therefore, this difference in length has a small effect on the overall result of the LOM for the estimation of Cf (equation (11)).
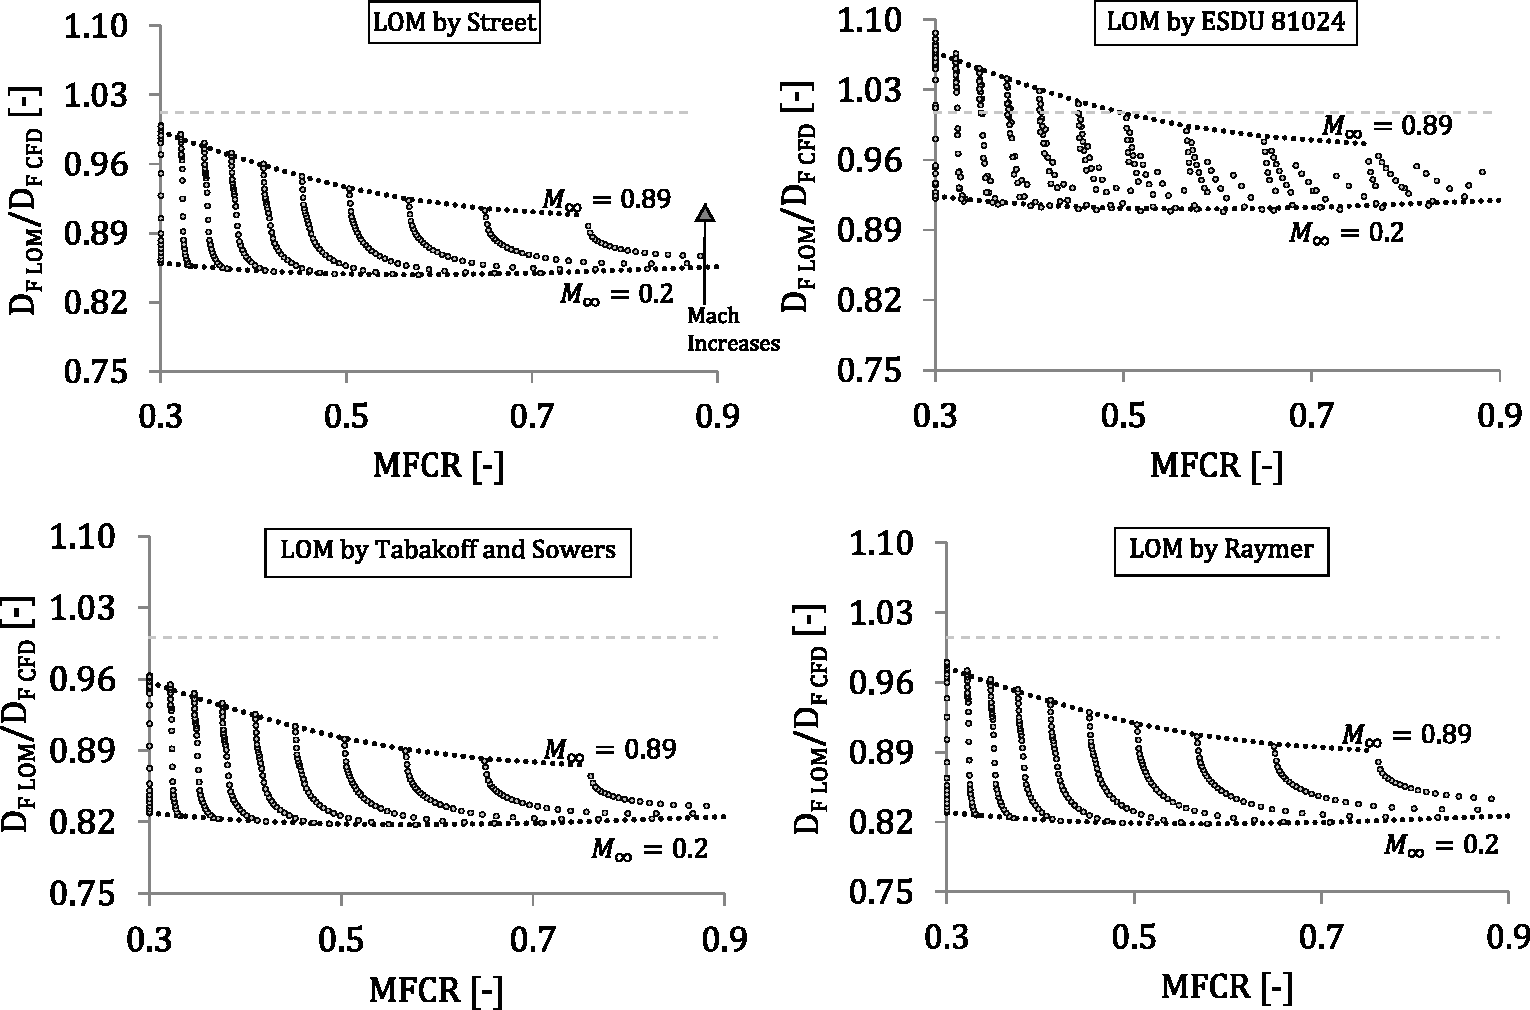
The friction drag estimated by the approaches by ESDU,5 Tabakoff and Sowers,8 Raymer6 and Street9 () was assessed with the friction drag in the numerical studies () (Figure 17). The models by Tabakoff and Sowers,8 Raymer6 and Street9 typically under-estimate the fan cowl DF with a difference of approximately 18% for between 0.2 and 0.89 (Figure 17). In general, the best agreement with the numerical studies was achieved with the ESDU5 method (Figure 17). An error band of at cruise typical of regional aircraft with rear-mounted engines and an overall error band of were obtained with the approach advocated by ESDU.5
Ratio between the friction drag estimated with LOM and calculated in numerical studies for ranges of and MFCR with the E1 engine.
In general, the friction force over the fan cowl (DF) at cruise conditions has been found to be between 70 and 75% of the total drag force of the nacelle (Dnac) (Figure 18). Therefore, pressure drag accounts for approximately 30–25% the total drag of the isolated aero-engine at typical cruise operation. The inclusion of the form factor (λ) to account for the pressure terms is necessary for an accurate estimation of the nacelle drag in typical operating conditions. The friction drag of the engine decreases in relation to the overall nacelle drag due to both, the increase in and the decrease in MFCR (Figure 18). The generation of spillage drag and wave drag decreases the relative contribution of friction drag on the overall nacelle drag to approximately 55% for and MFCR = 0.4 (Figure 18).
Ratio between skin friction drag on the fan cowl and the total drag of the nacelle for the E1 engine for a range of conditions.
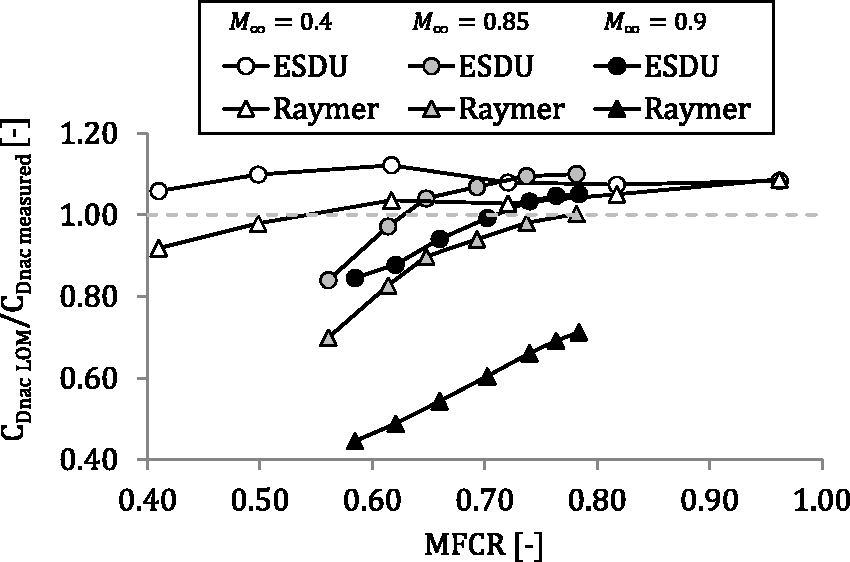
A MFCR close to 0.7 is typically expected for aero-engines in cruise operation.10,47 Subsequently, the MFCR is expected to decrease up to approximately 0.6 at the end of cruise.10 between 0.25 and 0.4 and MFCR between 0.25 and 0.4 are typically expected for an inoperative engine.10,48 Within this context, ESDU 810245 agrees with the experimental data between –3% at MFCR = 0.6 and at MFCR = 0.7 for (Figure 19). A slightly larger disagreement for the ESDU method is expected for cruise operation at high Mach number (Figure 19). ESDU typically agrees with experimental data from –1 to –13% when MFCR decreases from 0.7 to 0.6 at (Figure 19). For operating conditions typical of an engine inoperative, is over-estimated by with the ESDU 810245 approach (MFCR = 0.4 and , Figure 19). This, within the stated accuracy of the method, is estimated to be of in profile drag coefficient, in spillage drag coefficient for and in wave drag coefficient for MFCR ≤ 0.85.5 In contrast, the approach by Raymer6 underestimates measured data by –6% at the nominal cruise operating condition (MCFR = 0.7 and , Figure 19) and by –17% at a typical end of cruise (MFCR = 0.6 and , Figure 19). The accuracy of the method by Raymer6 reduces to between –40 and –53% for a typical high-speed operation at mid-cruise and end of cruise, respectively (Figure 19). In addition, the method by Raymer6 underestimates the nacelle drag of a typical inoperative engine by –8% (MFCR = 0.4 and , Figure 19).
Ratio between the nacelle drag computed with the methods advocated by Raymer6 and ESDU 810245 and the drag measured 10 for the Cowl 1.10
Overall, nacelle drag is a complex function of geometry and operating conditions due to the existence of spillage and wave drag. In general, the model suggested by Raymer6 is expected to capture mostly the effect of the Re and on friction drag (equation (10) and Table 4). Therefore, the error of the model suggested by Raymer6 increases from similar levels as ESDU 810245 at typical cruise operation to approximately –60% when the joint effect of spillage and wave drag increases due to relatively low MFCR and large (MFCR = 0.58 and , Figure 19). In contrast, the error in estimated by the Raymer6 approach is 2% larger than the error by ESDU 810245 approach for operating conditions typical of an inoperative engine (MFCR = 0.4 and , Figure 19). The difference in the levels of accuracy for these two LOM as a function of the operating conditions can be partly explained by the relative importance of friction drag in the total drag . for the E1 engine increased from approximately 0.6 at and MFCR = 0.6 to nearly 0.75 at and MFCR = 0.4 (Figure 18). In other words, pressure drag can account for approximately 40% of total drag at the end of cruise and for approximately 25% of Dnac with an engine inoperative. Consequently, the inclusion of wave drag and spillage drag in the estimation of the form factor (λ, equation (10)) are particularly important for typical of cruise operation. A comprehensive approach for the estimation of is required for the calculation of the performance of the entire flight mission.
Sensitivity of nacelle drag to angle of attack
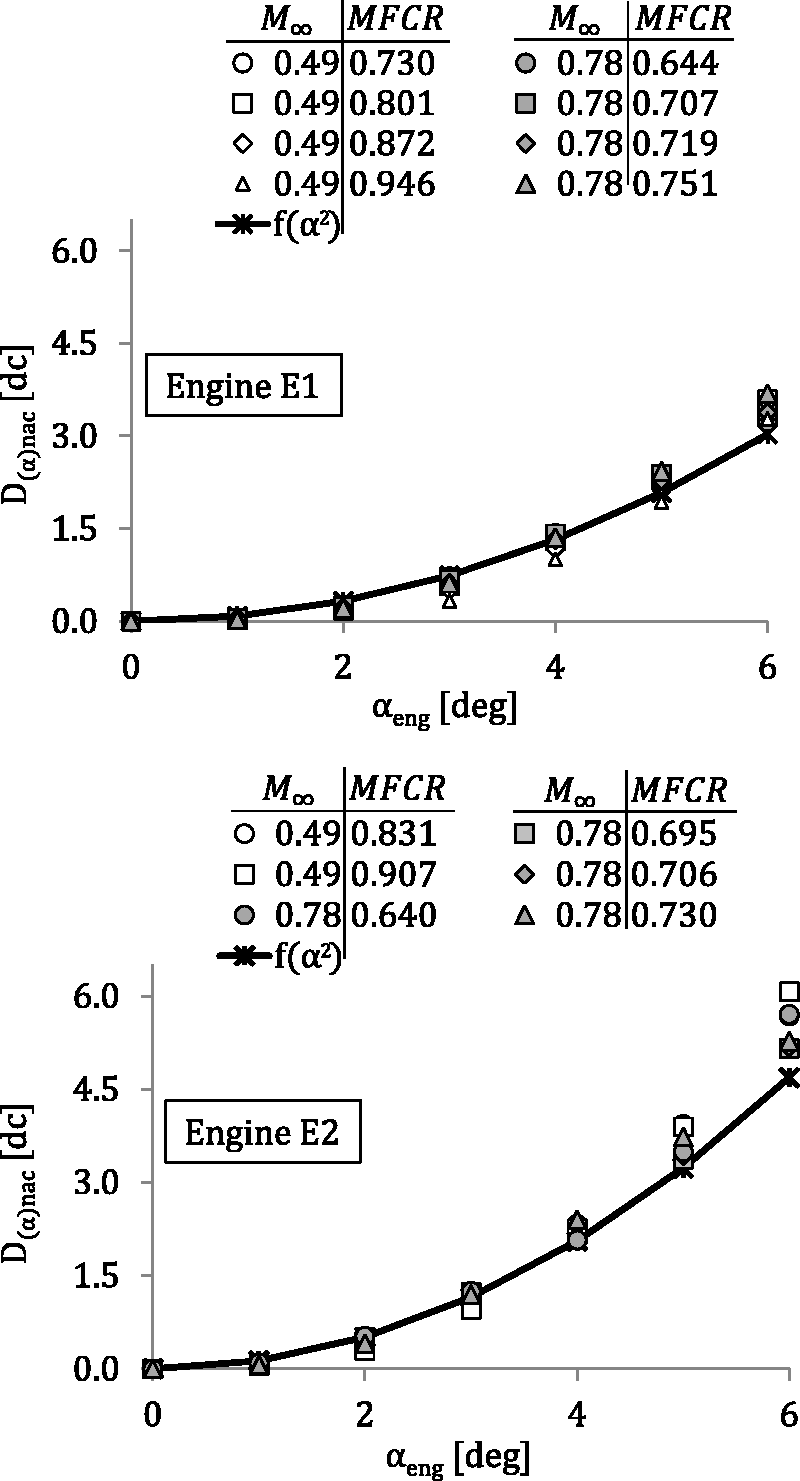
To put the effect of the angle of attack (α, Figure 9) on the nacelle drag in context, the gross wing area of the CRJ700 regional aircraft49 is taken as a reference for the presentation of the results in drag counts (dc). Three-dimensional engine configurations with jet-on conditions were established for the assessment of the angle of attack on the nacelle drag. Clear trends on the nacelle drag due to the angle of attack () as a function of the free-stream Mach number and MFCR were not found for the set of operating conditions computed (Figure 20).
Increase in Dnac due to the increase in αeng for two engines at different operating conditions and computed with . .
Overall, the effect of the angle of attack on is mostly explained by the first term in equation (15). The square of the angle of attack dominates due to the relatively low contribution of for the range of conditions typical of aero-engines. Within this context, it was shown that was typically one-order of magnitude larger than (equation (15)) for typical modern fan cowls. Therefore, the effect of the engine size on the nacelle drag due to the angle of attack typically scales with (Figure 20). The sensitivity of to the angle of attack is typically captured by within approximately 1 dc (Figure 20).
Conclusion
This paper presents a comprehensive analysis of drag for aero-engines with separate exhaust streams. The enhancement of a near-field method for drag extraction was presented and evaluated. The effects of engine size, free-stream Mach number, MFCR and angle of attack were assessed for a range of conditions. The effectiveness of publicly available models to estimate nacelle drag was also assessed.
Under typical aero-engine operating conditions, post exit terms are relatively large and must be included in computational studies of nacelle drag. The assumptions on Jones and Pearson thrust approaches are typically inadequate for detailed numerical studies. Within this context, an over-estimation of approximately 45% in has been calculated with the Jones thrust at typical operating conditions. The direct integration of the pressure force over the post-exit stream-tube is a meaningful way to extract this force in computational studies.
The effect of engine size on nacelle drag coefficient is mostly explained by the change in the Reynolds number. The development of spillage and wave drag decreases the accuracy of the scaling factor based on Reynolds number. Relatively low MFCR and high free-stream Mach numbers decrease the accuracy by approximately 2%. The free-stream Mach number has a relatively small effect on the nacelle drag coefficient if it is below the drag-rise Mach number. Within this context, the method advocated by ESDU 81024 for the estimation of MDR has been assessed with an aerodynamic definition of nacelle different to NACA-1. The agreement within 0.015 with detailed numerical studies is in the accuracy range claimed for the method. Overall, reduced-order methods based solely on Reynolds number and Mach number fail to estimate accurately nacelle drag coefficient for free-stream Mach number larger than MDR. Disagreement in nacelle drag coefficient with measured data larger than 30% is typically expected for reduced-order models in these cases.
The effect of the angle of attack on the drag of an isolated aero-engine is described mostly by a quadratic function of angle of attack. The effect of engine size in is relatively small compared to . Similarly, free-stream Mach number and MFCR have a relatively small impact on the effect of the angle of attack. In general, the effect of and MFCR on was less than 1 dc. A scale factor based on describes the effect of the engine size on . Overall, the sensitivity of to α is generally captured by a quadratic function of the angle of attack within approximately 1 dc.
LOM for the estimation of nacelle drag have been assessed. These methods are typically a function of the friction drag and a form factor for the inclusion of the pressure drag. On the basis of these ideas, the models advocated by Tabakoff, Raymer and Street generally underestimate friction drag by up to 18% in comparison to detailed numerical studies. Similarly, the uncertainty band in DF is typically for the ESDU approach. Overall, pressure drag accounts for approximately 30% of the nacelle drag in cruise conditions. Accuracy in nacelle drag estimation within –3 and was obtained with the ESDU approach at an angle of attack of zero with operating conditions typical of cruise. The accuracy of the method advocated by Raymer in has agreed with the measured data within –17 and for a typical cruise operating condition. However, the error in the approach by Raymer increases up to 60% with spillage and wave drag at relatively large and low MFCR. As expected, the model advocated by Raymer is unable to capture changes in pressure drag due to spillage or shock waves.
Footnotes
Acknowledgements
The authors would like to thank Rolls Royce plc for their support.
Declaration of Conflicting Interests
The author(s) declared no potential conflicts of interest with respect to the research, authorship, and/or publication of this article.
Funding
The author(s) disclosed receipt of the following financial support for the research, authorship, and/or publication of this article: Colombian Administrative Department of Science, Technology and Innovation (Colciencias) under the grant number 568.
ORCID iD
Santiago Ramirez-Rubio
References
1.
HoheiselH. Aerodynamic aspects of engine-aircraft integration of transport aircraft. Aerosp Sci Technol1997; 1: 475–487.
2.
Ewald B and Smyth R. The role and implementation of different nacelle/engine simulation concepts for wind-tunnel testing in research and development work on transport aircraft. In: AGARD conference proceedings No. 301 aerodynamics of power plant installation, Fluid dynamics panel symposium, Toulouse, France, AGARD, London, UK: Technical Editing and Reproduction Ltd, pp.22-1–22-35.
3.
GreenJE. Air travel – greener by design mitigating the environmental impact of aviation: opportunities and priorities. Aeronaut J2005; 109: 361–416.
4.
Daggett DL, Brown ST and Kawai RT. Ultra-efficient engine diameter study. Technical Report NASA/CR – 2003-212309, NASA, 2003.
5.
ESDU. Drag of axisymmetric cowls at zero incidence for subsonic mach numbers. Technical Report ESDU 81024, ESDU International, London, UK, 1981.
6.
RaymerDP. Aircraft design: a conceptual Approach, Washington, D.C.: American Institute of Aeronautics and Astronautics, 1992.
7.
RoskamJ. Airplane design: part I-VIII2006; vols. I–VIIILawrence, KA: DAR Corporation.
8.
TabakoffWSowersH. Drag analyses of powered nacelle fan jet engine model test. Mag Flight Sci (German:zeitschrift Flugwissenschaften)1969; 4: 134–144.
9.
Street PG. Thrust/drag analysis for a front fan nacelle having two separate co-axial exhaust streams. Technical Report ARC/CP-1311, Aeronautical Research Council, 1975.
10.
Langley M. The design of axisymmetric cowls for podded nacelles for high by-pass ratio turbofan engines. Technical Report Reports and memoranda No. 3846, Aircraft Research Association Ltd, Bedford, 1979.
11.
Laban M. Aircraft drag and thrust analysis (airdata) publishable synthesis report. Technical Report NLR-TP-2000-473, NRL, 2000.
12.
KellyHR. The estimation of normal-force, drag, and pitching-moment coefficients for blunt-based bodies of revolution at large angles of attack. J Aeronaut Sci1954; 21: 549–555.
13.
TrappLGArgentieriHG. Evaluation of nacelle drag using computational fluid dynamics. J Aerosp Technol Manag2010; 2: 145–153.
14.
Christie R, Ramirez S and MacManus DG. Aero-engine installation modelling and the impact on overall flight performance. In: Advanced aero concepts, design and operations, Bristol, UK, 2015. New York: Curran Associates, Inc., pp. 319–332.
15.
YufeiZHaixinCSongF, et al.Drag prediction method of powered-on civil aircraft based on thrust drag bookkeeping. Chin J Aeronaut2015; 4: 1023–1033.
16.
StańkowskiTPMacManusDGSheafCT, et al.Aerodynamics of aero-engine installation. Proc IMech E, Part G: J Aerospace Engineering2016; 230: 2673–2692.
17.
Paparone L and Tognaccini R. A method for drag decomposition from cfd calculations. In: Grant I (ed) 23nd congress of international council of the aeronautical sciences (ICAS 2002). Harrogate, UK: ICAS, pp.1113.1–1113.9.
18.
MalouinBGariepyMTrépanierJ, et al.Engine pre-entry thrust and standard net thrust evaluation based on the far-field method. Aerosp Sci Technol2015; 45: 50–59.
19.
Deng Y, Zhang Y and H C. Drag prediction and decomposition of a real aircraft based on middle-field and far-field methods. In: 7th European conference for aeronautics and space sciences (EUCASS). Milan, Italy: EUCASS, pp.1–12. EUCASS2017-380.
20.
Christie R. Propulsion system integration and modelling synthesis. PhD Thesis, School of Aerospace, Transport and Manufacturing, Cranfield University, UK, 2016.
21.
Ministry-Industry Drag Analysis Panel (MIDAP) Study group. Agardograph no. 237 guide to in-flight thrust measurement of turbojets and fan engines. Technical Report AGARD-AG-237, AGARD, 1979.
22.
Definitions Panel of the Aeronautical Research Council. Report of the definitions panel on the definitions of the thrust of a jet engine and of the internal drag of a ducted body. Technical Report C.P. 190, Aeronautical Research Council, 1955.
23.
Heidebrecht A, Stankowski T and MacManus D. Parametric geometry and cfd process for turbofan nacelles. In: Proceedings of ASME 2016 turbo expo: turbomachinary technical conference and exposition, Seoul, South Korea. New York, USA: ASME, pp.1–13. GT2016-57784.
24.
ChristieRHeidebrechtAMacManusD. An automated approach to nacelle parameterization using intuitive class shape transformation curves. J Eng Gas Turbines Power2017; 139: 062601–1–062601-9.
25.
Palmer J and Pachidis V. The turbomatch scheme for aero/industrial gas turbine engine design point/off design performance calculation, 1999. Course Lecture Notes. School of Engineering, Cranfield University, UK.
26.
GoulosIStankowskiTOtterJ, et al.Aerodynamic design of separate-jet exhausts for future civil aero-engines, part I: parametric geometry definition and computational fluid dynamics approach. J Eng Gas Turbines Power2016; 138: 1–14.
27.
GoulosIOtterJStankowskiT, et al.Aerodynamic design of separate-jet exhausts for future civil aero-engines, part II: design space exploration, surrogate modeling, and optimization. J Eng Gas Turbines Power2016; 138: 1–12.
28.
MacMillan WL. Development of a modular type computer program for the calculation of gas turbine off design performance. PhD Thesis, School of Mechanical Engineering, Cranfield University, UK, 1974.
29.
MattinglyJD. Elements of propulsion: gas turbines and rockets, Reston, VA: AIAA Education Series, 2006.
30.
WalshPPFletcherP. Gas turbine performance, Oxford, UK: Blackwell Science, 2004.
31.
GunstonB. Jane’s aero-engines, Coulsdon, UK: Jane’s Information Group, 2011.
ANSYS I. Ansys fluent theory guide, 2013. Release 15.0.
34.
RobinsonMMacManusDGSheafC. Aspects of aero-engine nacelle drag. Proc IMechE, Part G: J Aerospace Engineering2018; 233: 1–16.
35.
RoacheP. Perspective: a method for uniform reporting of grid refinement studies. J Fluid Eng1994; 116: 405–413.
36.
RoacheP. Verification and validation in computational science and engineering, Albuquerque, New Mexico: Hermosa Publishers, 1998.
37.
Stańkowski T. Aerodynamics of propulsion system integration for modern aero-engines. PhD Thesis, School of Aerospace, Transport and Manufacturing, Cranfield University, UK, 2016.
ThornockRLBrownEF. An experimental study of compressible flow through convergent-conical nozzles, including a comparison with theoretical results. J Basic Eng1972; 94: 926–930.
40.
ZhangYChenHZhangM, et al.Performance prediction of conical nozzle using Navier Stokes computation. J Propul Power2015; 31: 192–203.
41.
Dippold VF. Computational simulations of convergent nozzles for the aiaa 1st propulsion aerodynamics workshop. Technical Report TM 2014-218329, NASA, 2014.
42.
von Geyr HF and Rossow CC. A correct thrust determination method for turbine powered simulators in wind tunnel testing. In: 41st AIAA/ASME/SAE/ASEE joint propulsion conference and exhibit. Arizona, USA: AIAA, pp.1–12. AIAA 2005-3707.
43.
Domel ND. Perspectives on propulsion cfd for nozzle applications relevant to the AIAA propulsion aerodynamics workshop. In: 51st AIAA/SAE/ASEE joint propulsion conference, AIAA propulsion and energy forum. Florida, USA: AIAA, pp.1–13. AIAA 2015-3778.
44.
Finck RD. Usaf stability and control datcom. Technical Report AFWAL-TR-83-3048, McDonnell Douglas Corporation, 1977.
45.
Kundu A, Price M and Riordan D. Theory and practice of aircraft performance. Aerospace Series, West Sussex, UK: Wiley, 2016. ISBN 9781119074199.