
Abstract
Deterioration of axial compressors is in general a major concern in aircraft engine maintenance. Among other effects, roughness in high-pressure compressor reduces the pressure rise and thus efficiency, thereby increasing the specific fuel consumption of an engine. Therefore, it is important to improve the understanding of roughness on compressor blading and their impact on compressor performance. To investigate the surface roughness of rotor blades of a compressors, different stages of an axial high-pressure compressor and a first-stage blisk (BLade–Integrated–dISK) of a regional aircraft engine is measured by a three-dimensional laser scanning microscope. Fundamental types of roughness structures can be identified: impacts in different sizes, depositions as isotropically distributed single elements with steep flanks and anisotropic roughness structures direct approximately normal to the flow direction. To characterise and quantify the roughness structures in more detail, roughness parameters were determined from the measured surfaces. The quantification showed that the roughness height varies through the compressor depending on the stage, position and the blade side. Overall complex roughness structures of different shape, height and size are detected regardless of the type of the blades.
Keywords
Introduction
Gas turbine performance deteriorates during flight operation for numerous reasons. A critical area for deterioration which influences significantly the aerodynamic performance is the blade surface. In this paper, the roughness of first-stage rotor blades of high-pressure compressors is part of the investigation. The task of compressors is to increase the total pressure. For this reason, compressor airfoils are at great risk for boundary layer separation which decreases stage efficiency and may lead to stall or surge. The risk of these phenomena depends mainly on Reynolds and Mach numbers and of course roughness. 1
Leipold et al. 2 explored the critical role of the Reynolds number in a high-pressure cascade in conjunction with surface roughness. They varied the Reynolds number from 3 × 10⁵ to 1 × 10⁶ based on inlet conditions. The inlet Mach Number was set to 0.67 to generate a peak Mach Number close to Ma = 1. An important finding was that the loss coefficient rises with the Reynolds Number. Above 5 × 10⁵ thin boundary layers lead to turbulent boundary layer separation on the suction side of rough blades. Particularly for high-pressure compressors with Reynolds Numbers of 1 × 10⁶ and higher, this effect is relevant. Back et al. 3 found equivalent results in a low-speed compressor cascade. Like Leipold et al., 2 they found decreasing performance at a critical Reynolds Number of about 6 × 10⁵ with a critical roughness Ra between 2.0 and 2.9 µm. The cascade performance is mainly reduced by roughness on the suction side but an entirely rough blade reduces the performance even further. The main focus of their studies was on the mass-averaged profile losses, which is mostly affected by the suction side in the downstream half-chord of the blade. Another important result of their study was that an increase of the area covered with roughness decreases the critical Reynolds number. Schaffler 4 found the same trend in a five-stage high-pressure compressor rig. He reported lower polytrophic efficiency beginning for a chord-based Reynolds Number of 3.1 × 10⁵ in the first rotor. He analysed the machining roughness of different manufacturing techniques of blades, leading to different roughness results.
Bammert et al. 5 investigated a low-speed compressor cascade with five different roughness levels at a fixed Reynolds Number 4.3 × 10⁵ and an Inlet Mach Number of 0.11. They used sand grain roughness levels ks/c from 2.3 × 10⁻⁴ to 5.6 × 10⁻³. They determined increasing profile losses by raising the sand grain roughness. With higher roughness at the trailing edge, separation occurs on the suction side along with a reduced turning. Because of the effect of the reduced turning on the following blade row, Bammert et al. 5 investigated comparable roughness levels in a three-stage axial compressor. All airfoils were roughened equally. The complete rig suffered from 6% to 13% loss of efficiency and an overall pressure ratio reduction by 30% with respect to their comparative configuration.
Suder et al. 6 analysed a transonic compressor rotor while adding roughness and thickness to the blades. The roughness was applied by coating the blades, which increased the leading edge thickness by 10% at the hub and 20% at the tip. The coated configuration had a roughness Rq between 0.5 µm and 3.2 µm. Because of this procedure, the roughness could be studied without mixing the effects of adding roughness and increasing blade thickness. The highest rotor roughness results in a 9% pressure ratio loss with regard to the baseline rotor. Suder et al. 6 also investigated the influence of roughness position along the blade. They can show that the first 2% of distance from leading edge affects the boundary layer thickness and therefore the interaction with the shock. This results in an increased blockage and a reduced diffusion in the blade passage. Gbadebo et al. 7 examined the influence of surface roughness on stator blades of a single-stage low-speed axial compressor. They used a centre-line averaged roughness of about 1.5 to 2.0 µm obtained from a turbofan engine after a long period of airline operation. The roughness was applied by a strip covering 50% to 100% of span and about 20% of chord length at different positions. Their experiments showed that roughness induces a larger hub-corner-separation which resulted in high losses, increased blockade and deviation compared to their baseline experiment. The three-dimensional end wall separation was triggered by a leading edge roughness extending the affected area up to 30% of the span compared to the baseline configuration.
The impact of surface roughness on axial compressor performance was studied by Syverud and Bakken. 8 They compared performance test data of the GE J85-13 engine with loss models addressing friction, blockage and deviation. They used the same approach for surface roughness characterisation like Gbadebo et al. 7 Their results show a gap between the model prediction and measured test data of a real engine. However, similar to Suder et al., 6 the results give a hint how important surface roughness due to compressor performance can be.
In addition, the roughness effect due to erosion and fouling is another effect which has to be considered. Fouling describes the process of deposition of particles on the surface of blades due to operational pollution. Another critical effect is a change of roughness and geometry due to deposits. Syverud and Bakken 9 showed that deposits of different types such as salt or oil have the same impact on the performance of a compressor. As done by Gbadebo et al. 7 and Syverud and Bakken,8,9 the roughness in most of the literature is measured only at few discrete points on the blade but applied on the whole blade with the assumption of conformity. However, it was shown that local variations in the roughness on a compressor blade can lead to different loss increases depending on the roughness position.10,11 As a result, a detailed analysis of the roughness distribution over the blade surface and the structures itself is important to understand and model the effects of real surface roughness in engines.
Roughness measurements and quantification
All investigated roughnesses were measured with confocal laser scanning microscopes of the same type (Keyence VK-X200). The measurements are contact free, and a three-dimensional representation is obtained. The used laser scanning microscope has two optical paths. One for a white-light source with a CCD chip for high-resolution colour pictures and a second optical path using a laser diode with a wavelength of 658 nm. To obtain highly detailed pictures of the surface-roughness, an objective lens with 20× magnification was used for the single-blade measurements, and for the blisk blade, a lens with 50× magnification was used. The size of each measurement patch with a 20× magnification is 704 µm by 528 µm and 270 µm by 203 µm for a magnification of 50×. For both cases, the physical resolution is 1024 by 768 pixels per pitch. In addition, the measurements of the 20× magnification are stitched together to receive a wider measurement field. In total, four measurements are stitched together with a final resolution of 1296 by 1863 pixels and an area size of 890 µm by 1280 µm. To resolve the picture in the height axis, the surface scan is replicated from the bottom of the sample to the scanned surface.
Measurement error of the used Keyence microscope is given by the manufacture and depends on the vertical measurement range (

For a good comparability, the measurement range (


The above-mentioned parameters are defined for two-dimensional surface measurements. Three-dimensional surface data are divided into several tracks with a 1 pixel width. Roughness parameters were calculated for each track individually and all tracks are directed in the flow direction. Finally, the average value of the determined parameters was evaluated. This method guarantees that the complete measured surface is taken into account for the determination of the statistical parameters. Considering the position of the blade, all measurements performed in this work were equally aligned.
To characterise a surface from an aerodynamic point of view, the shape and density parameter Λ
S
was defined by Sigal
13
and modified by Bons
14
for two-dimensional roughness functions h(x)


One challenge for the measurements on the blisk is the small passages between two rotor blades. The pitch between two blades is too small to measure the surface roughness directly. Another challenge for the single-blade roughness was measuring the roughness directly from individual high-pressure compressor blades which were on ground only for service. To use the microscope for direct measurements on the single blades would take too much time. Also, to avoid distortions because of the handling of the blades after the complete removal from the compressor module, the surface structures must be preserved as early as possible. To solve both problems, an indirect measurement method was used by applying a casting compound based on a two-component silicone to take impressions. Due to this measurement strategy, an indirect measurement of the surface structures with the laser scanning microscope could be performed.
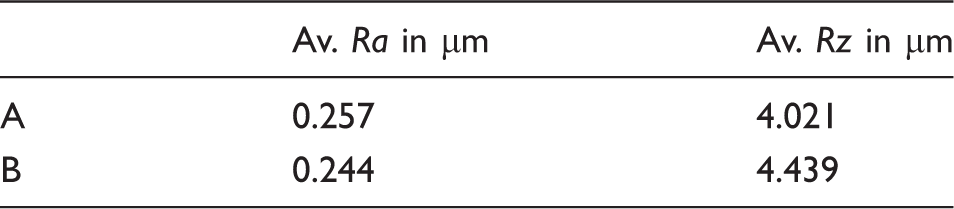
In order to verify the method, direct test measurements of a blade roughness were compared to indirect measurements using a casting compound. Figure 1 shows measurements of a real surface and of a casting compound of the same surface. The casting compound measurement is presented inverted. The same structures can be seen in both figures in a proper resolution to analyse the surface structures. The average roughness Ra was determined for both measurements and differs by about 0.013 µm. The average surface roughness Rz differs by about 0.418 µm (Table 1).
Qualitative verification of indirect roughness measurements with casting compound and the direct measurement of a reference surface roughness. Measured surface roughness from the test surface for the direct measurement A and indirectly with casting compound measurement B.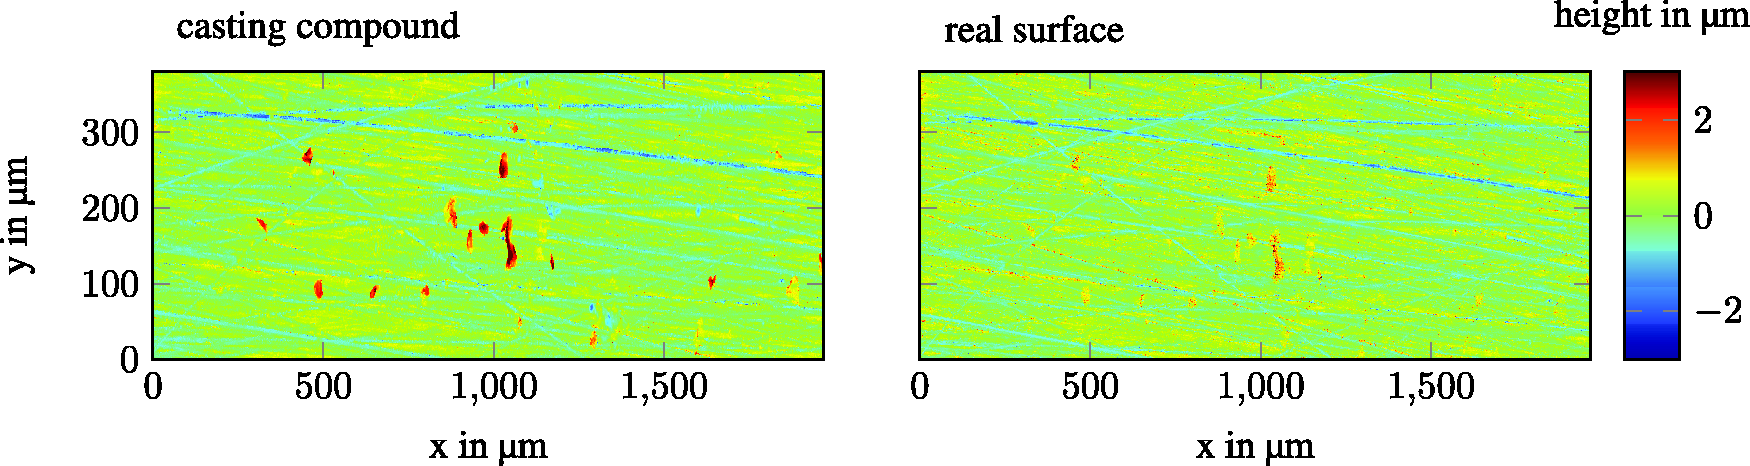
Measured surfaces
Summary of the origin of the measured surfaces.
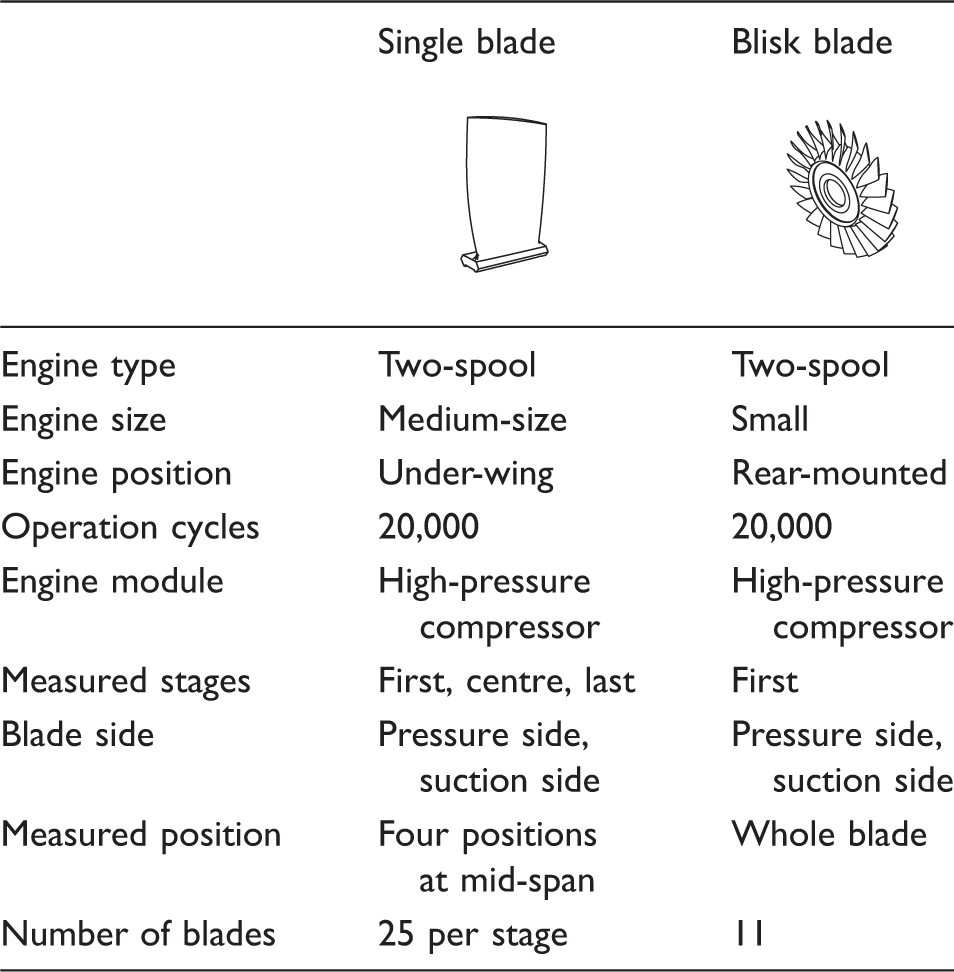
Single-blade roughness was measured in high-pressure compressors of a medium size high-bypass aircraft engine in an under-wing position. The engine has been in operation in flight regions with little natural environmental or anthropogenic effects. 16 The blades are measured after a typical flight operation time of 20,000 cycles by the Institute of Turbomachinery and Fluid Dynamics at the Leibniz University Hannover. The measured blisk blades roughness was measured from a blisk, installed in a rear-mounted engine of a regional aircraft with short flight cycles, which has been in operation for about 20,000 cycles, too. The roughness measurements on the blisk were performed by the Institute of Jet Propulsion and Turbomachinery at the Technical University of Braunschweig. Both measurements were performed by using the same type and model of microscope.
The roughness of the single-blade high-pressure compressor blades was measured at four positions on the suction side and four positions on the pressure side at mid-span. The first position is at the leading edge, the second position at 30% of the chord length, the third position at 60% of the chord length, and the fourth position near the trailing edge at 90% of the chord length. To get an impression of the roughness distribution through a high-pressure compressor, three stages are investigated: The first-stage blades at the inlet, the centre stage blades, and the last stage blades. From each stage, the roughness of five blades were measured. Overall blades from five engines were investigated (25 blades per stage).
The blisk blade roughness is measured over the whole surface of the pressure side and the suction side. The measurement grid is shown in Figure 4. In total, 14 blades of one blisk were measured.
Results
Single-blade roughness
The results of the roughness quantification of the single-blade roughness are summarised separately for the pressure side and the suction side in Figure 2. The mean values for each stage are calculated with the corresponding standard deviation. The standard deviation contains the systematic measurement error and the variation of the roughness measurements. Thus, the standard deviation can be seen as a measure of the variation of the roughness height itself in each measurement position. A position with a high standard deviation shows higher level of variations in the roughness than positions with a lower standard deviation.
Results of the roughness measurements on the single-blade roughness from a high-pressure compressor of a mid-size aircraft engine. The error bars represent the standard derivation of the performed measurements on the specific position and not the measurement error of the measurement system.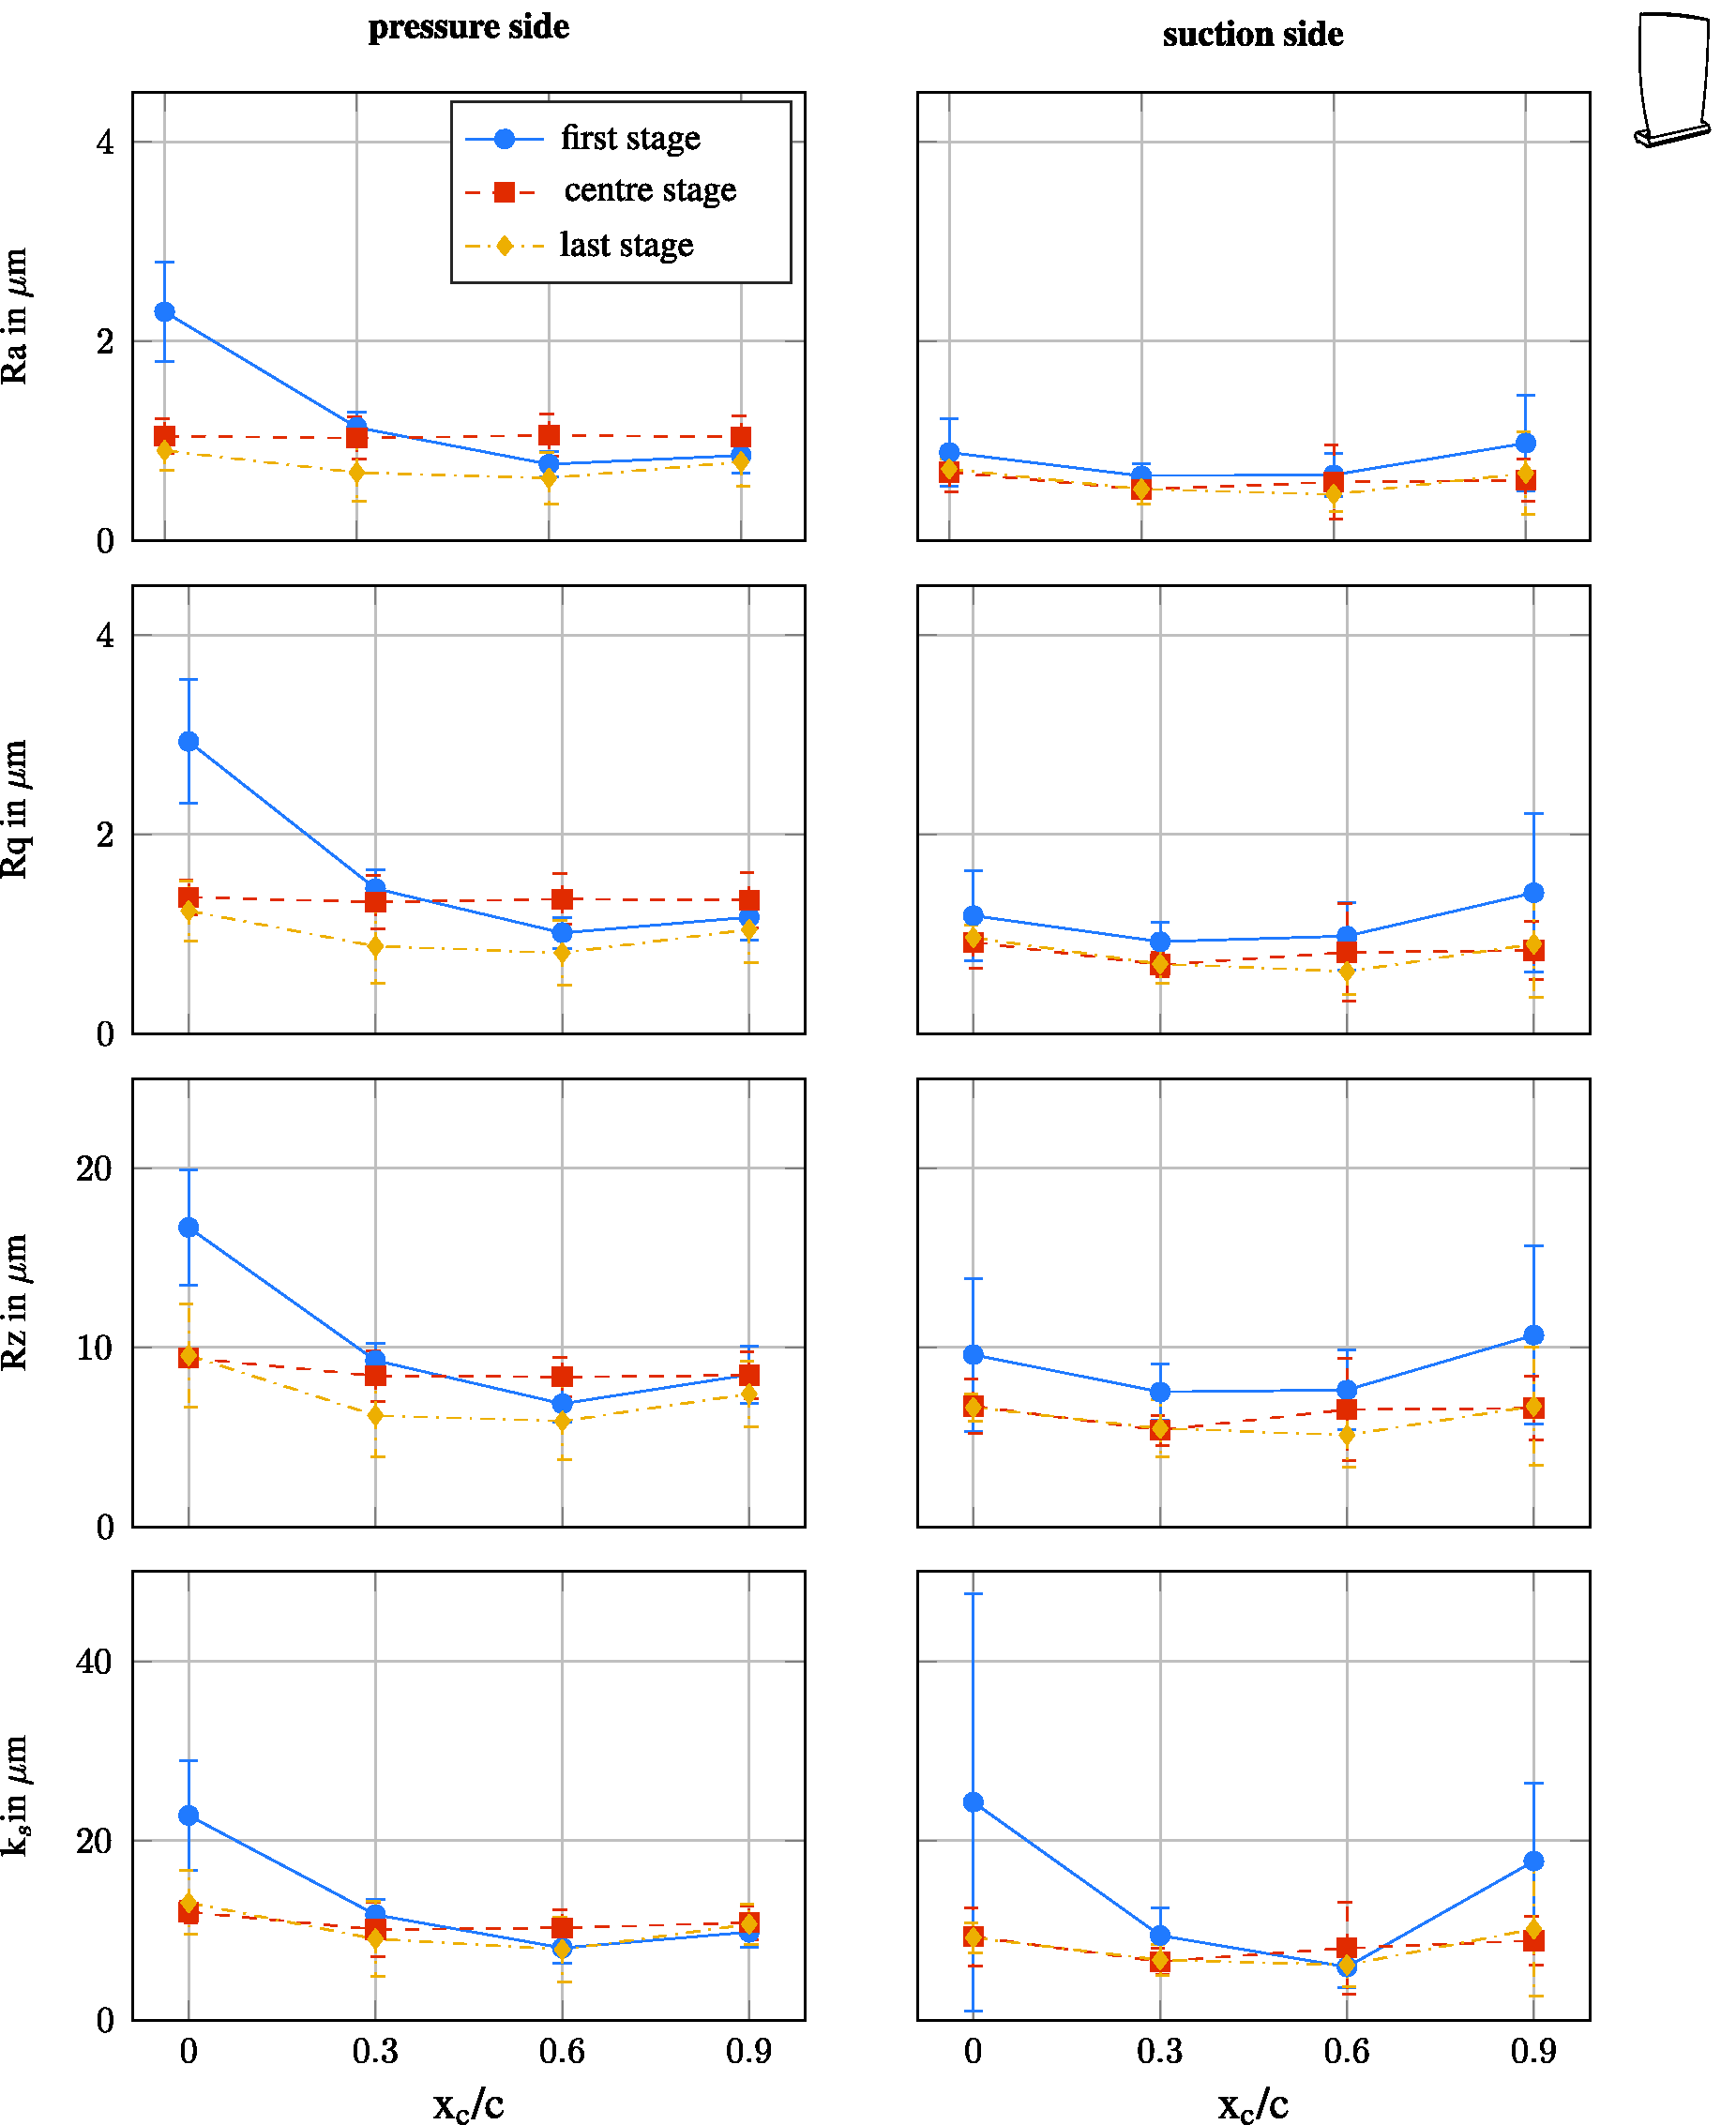
The pressure side roughness quantification shows entirely a uniform distributed roughness height 10 µm along the chords of stages, excepting the first stage. In the first stage, a higher level of the roughness height is detectable. The values for the equivalent sand grain roughness ks vary from 24 µm at the leading edge to 10 µm in the trailing edge region. The roughness distribution for the centre stage and the last stages shows only slight variations along the chord. Especially, the sand grain roughness height for the roughness of the centre stage is nearly constant and varies around 10 µm. The roughness height of the last stage is overall the lowest but follows the trend of the first-stage roughness height by having its maximum at the leading and lower roughness height in the centre and near the trailing edge. The standard deviation of the leading edge roughness of the first stage is ±5 µm and for the other stages and positions on the pressure side approximately ±3 µm.
To correlate the determined roughness parameters with the real surface roughness structures, a qualitative analysis of the roughness structures is performed. Examples for representative roughness structures for each stage and position on the blade are shown in Figure 3. On the pressure side, different fundamental structures in the roughness are observed. A mix of impacts characterised by round depressions of different size and erosion or depositions characterised by isotropic distributed roughness elements of different size are detected. Correlated to the highest values of roughness height on the leading edge of the first stage, the biggest roughness elements can be detected in the qualitative analysis, too. This roughness mainly consists of isotropic roughness elements which can also be detected in smaller size, at the Examples of single-blade roughnesses from a high-pressure compressor of a mid-size aircraft engine from different stages and measurement positions. The size of the measurement area is 0.890 mm by 1.280 mm. Results of the roughness quantification of the blisk blade roughness measurements. The black dots are the measurement positions. The colour plot is a cubic interpolation to show the roughness distribution over the whole surface.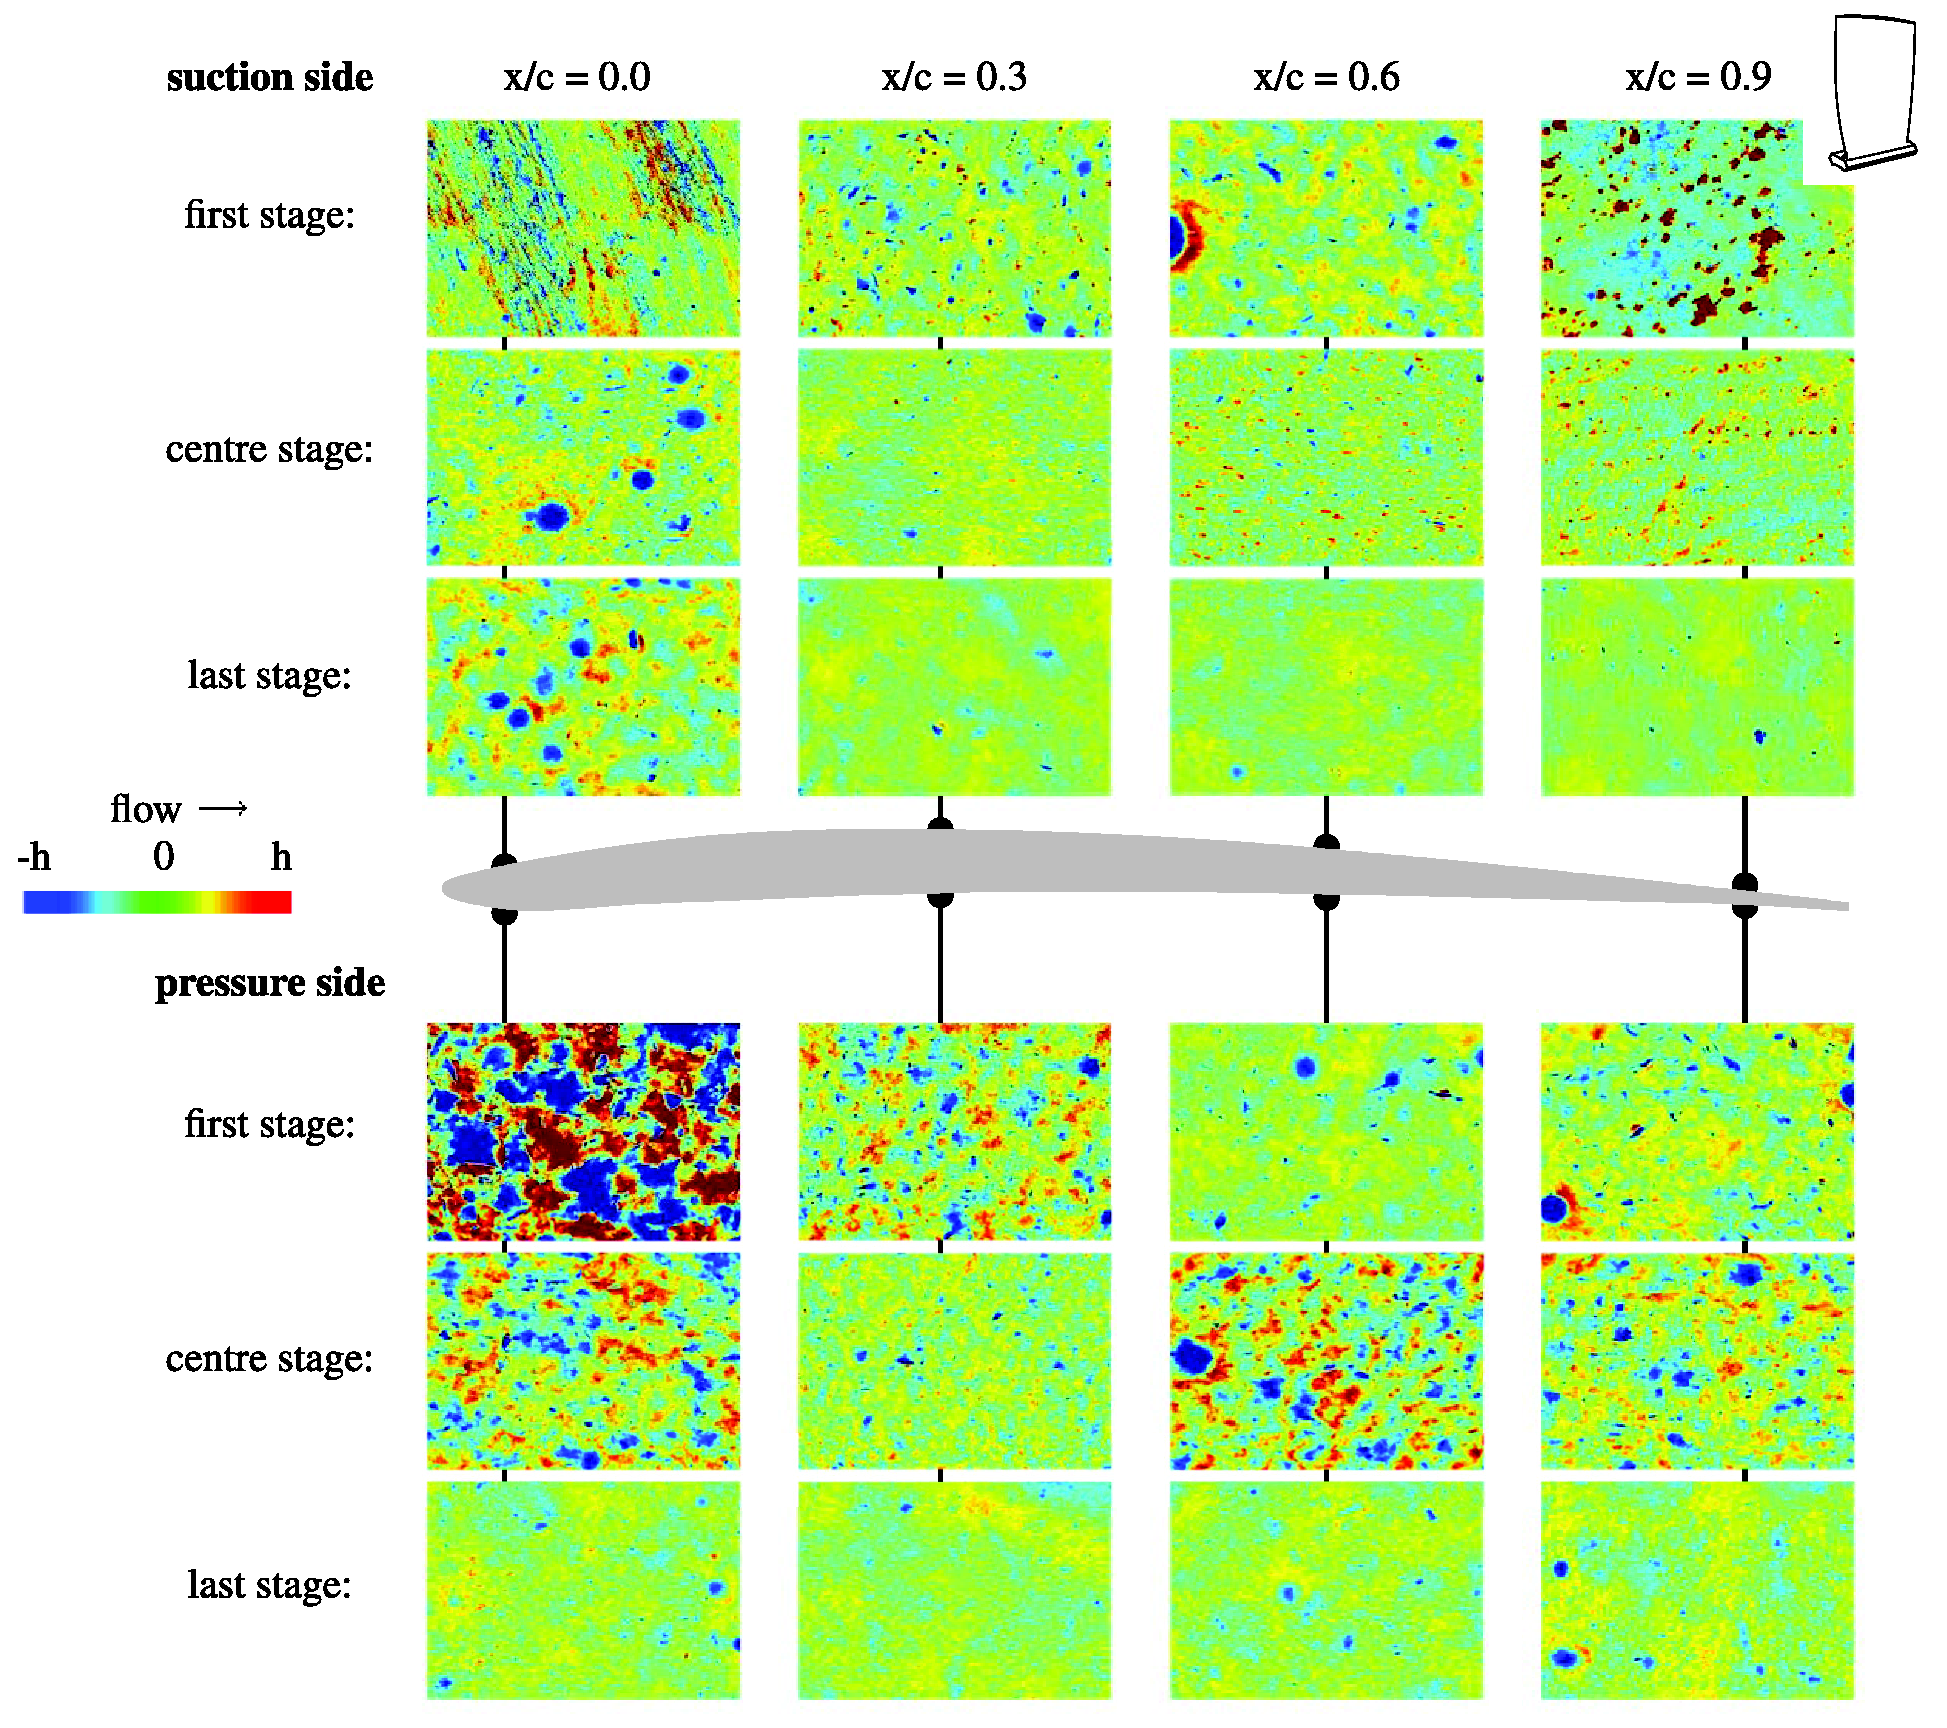
The roughness height distribution on the suction differs partly from the pressure side roughness. Especially, no increased roughness height at the leading edge of the first stage is detected, if only the standard parameters (Ra, Rq and Rz) are considered. However, an increased roughness height is detected by using the ks parametrisation. A roughness height of ks = 22 µm is determined with a high standard deviation of ±15 µm. The high standard deviation indicates high fluctuations in the roughness size and shape. An explanation can be given by looking at the roughness structures itself on this position (Figure 3). Only on this position mainly, anisotropic structure can be detected. The structures are directed in a normal direction to the flow. The dependency of the ks determination method leads to a higher sensitivity of this parameter for the anisotropy and direction of the roughness structures. Other investigations showed19,20 that because of oil leakage from the bearing system of the engine, sticky liquid can enter the flow path and is transported along the blades because of the centrifugal force. At the leading edge region, particles will only stick on the surface with this oil, because otherwise particles will be transported further downstream, because of the high shear stresses near the wall. 19 With lower shear stress rates further downstream on the blades, more and more deposition can build up resulting in higher values for the roughness height in all roughness parameters. Especially, in the first stage, a significant increase can be detected in the trailing edge region. The roughness structure shape is isotropically scattered with steep flanks and represents depositions.17,19,20 The size and quantity of the depositions decrease through the compressor, and at the trailing edge region of the last stage almost no depositions are detectable.
Blisk blade roughness
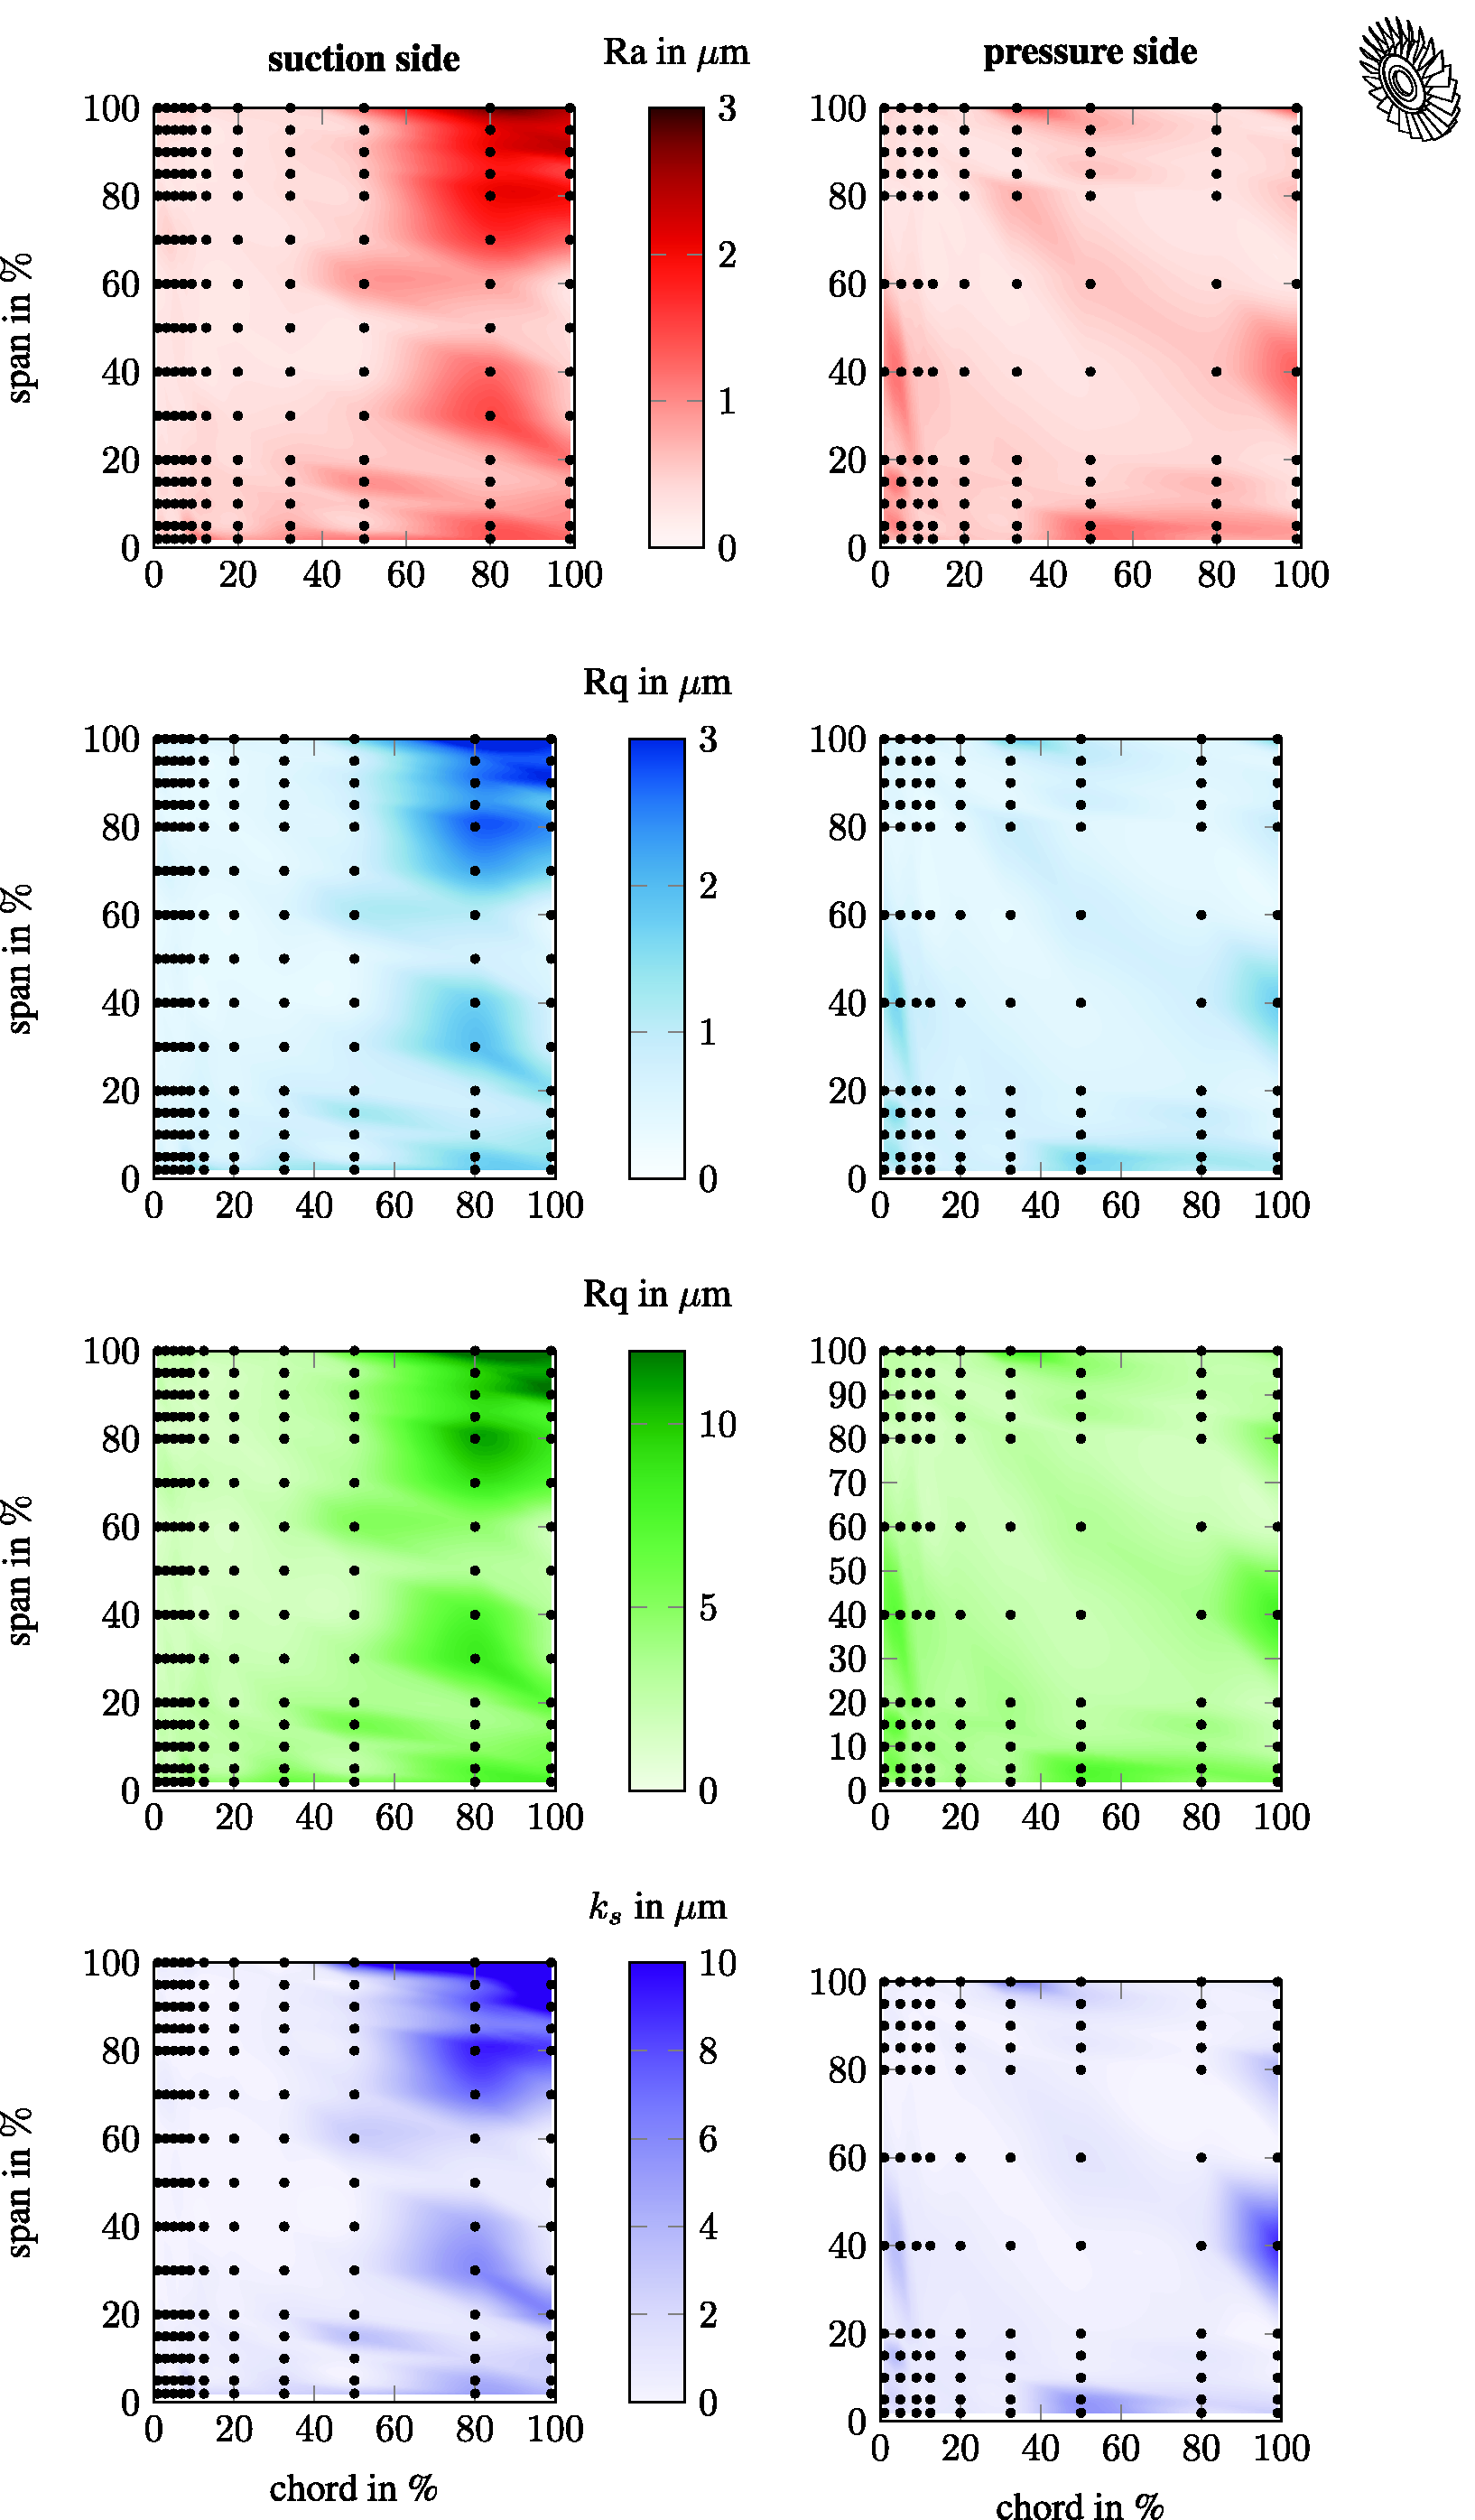
The mean values of the measured blisk roughnesses are summarised in Figure 4 for all four determined roughness parameters (Ra, Rq, Rz and ks) and all measured positions of the blisk blade. The colour map is created by a cubic interpolation of the mean values of the measurements to visualise the changes in the roughness over the blade.
The overall mean of the measured roughness height on the suction side is Ra = 0.60 µm (Rq = 0.78 µm, Rz = 3.35 µm, ks = 1.60 µm), but it varies along the chord, in particular in the tip region. In the tip region, the highest roughness heights are detectable (Ra = 3.04 µm, Rq = 3.74 µm, Rz = 14.35 µm, ks = 17.05 µm) near the trailing edge. In positions on the suction side, the roughness structures consist of two fundamental shapes, impacts and isotropic distributed roughness elements of different size (Figure 5). No anisotropic structures are detectable on the measured surfaces. The roughness height distribution correlates with observation of other investigations. The lower shear stress on the surface and separation, e.g. because of the tip vortex in the tip region on the suction side, leads to good conditions for depositions. The depositions cause big roughness structures.19–22
Examples of the blisk blade roughness of a small aircraft engine. The size of the measured area is 0.270 mm by 0.203 mm.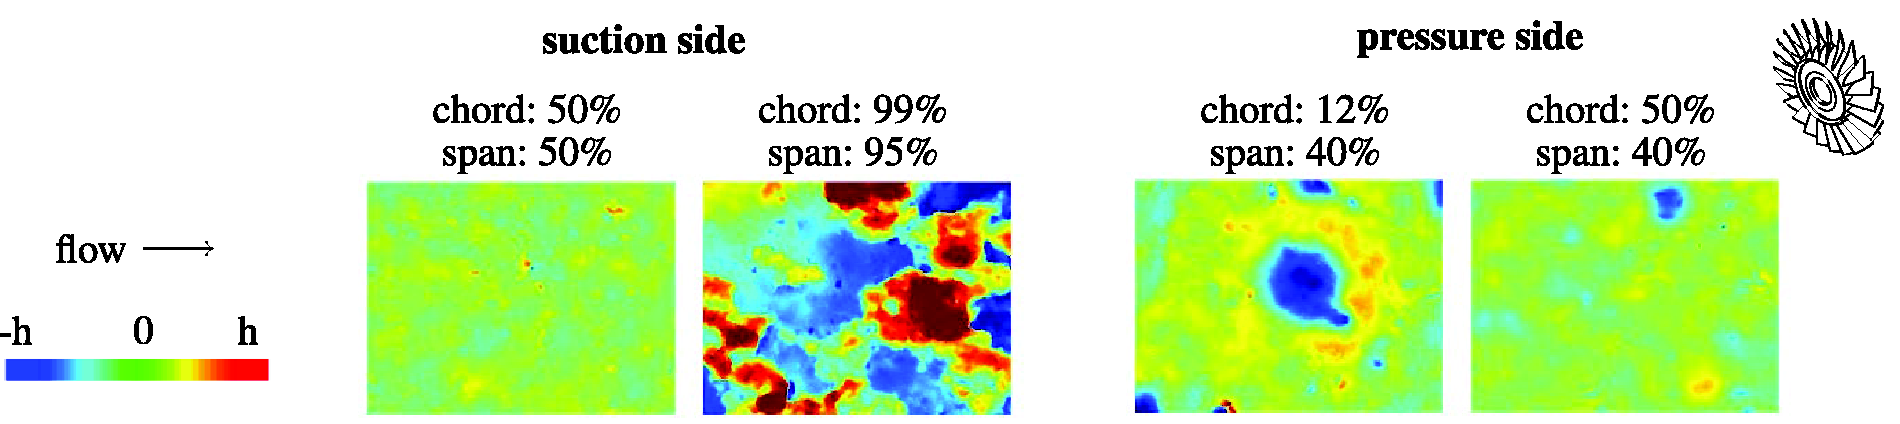
On the pressure side, an overall mean of Ra = 0.6 µm (Rq = 0.76 µm, Rz = 3.47 µm, ks = 1.17 µm) is determined. Also, slight variations along the chord and the span are detectable, but these variations are smaller compared to the suction side roughness. The higher values are located near the edges of the blade and have maxima of Ra = 1.85 µm (Rq = 2.14 µm, Rz = 9.23 µm, ks = 8.78 µm). The overall roughness height of the blisk blade roughness is equal to the single-blade roughness. In particular, the roughness distribution along the chord on the suction side shows a similar trend, with higher roughness values in the trailing edge region on the blisk. This may result from the different sizes of the investigated engines. Smaller engines such as the blisk-bladed engine of the presented investigation lead to more fouling. 22 However, the roughness on the blisk blade near the mid-span is equally distributed, and the blisk blades and all of the roughness parameters in this region show the same trend.
Conclusions and outlook
The investigated real surface roughness of operationally used compressor blades of an under-wing mid-size aircraft engine and blisk blades of a small-size rear-mounted shows complex roughness structures depending on stage, position and side of the blade, and also the type of the engine. The variations are detectable in the roughness height (quantified by roughness parameters Ra, Rq, Rz and ks) and also qualitatively in the shape of the roughness structures. The biggest roughness height is detected in the first stage followed by the centre stage and the last stage of the compressor. Fundamental types of roughness structures can be identified: impacts as round depressions in different sizes, depositions as isotropically distributed single elements with steep flanks in different size and anisotropic roughness structures. However, anisotropic structures are detectable only at the leading edge of the single-blades in the first stage of the mid-size engine. These structures are oriented at an angle ranging from 45° to 90° normal to the flow direction and are the result of leakage oil and flow particles. These structures lead to a higher equivalent sand grain roughness (ks) magnitude, which is not detectable in the standard roughness parameters (Ra, Rq and Rz). On the pressure side, the highest roughness is detected at the leading edge, identified as a mix of erosion, impacts and depositions. Further downstream, an increased density of depositions is detected, resulting in increased roughness values near the trailing edge on the suction side. This effect decreases with increasing number of the stage as well as the roughness height. On the blisk blade, the biggest roughness height and structures are detected in the tip region on the suction side, resulting from lower shear stress rates and the tip vortex, and correlate with the observations of other investigations.
After characterisation and quantification of the compressor blade roughness, further investigation will be performed to determine the effect of the measured complex roughness on the compressor blade performance. Therefore, the near wall flow and the blade losses because of the roughness will be investigated in detail to develop or enhance surface roughness models and to improve the prediction of the roughness effect on the flow. It is also planned to publish the surface data used for presented work.23
Declaration of Conflicting Interests
The author(s) declared no potential conflicts of interest with respect to the research, authorship, and/or publication of this article.
Funding
The author(s) disclosed receipt of the following financial support for the research, authorship, and/or publication of this article: The present work has been carried out in the subprojects B3 and D4 within the Collaborative Research Center (CRC) 871 ‘Regeneration of Complex Capital Goods’, which is funded by the DFG (Deutsche Forschungsgemeinschaft) under grant of CRC871. The authors would like to thank the DFG for their support.