
Abstract
A novel construction assurance methodology was developed and tested on the Overhead Line Equipment (OLE) as part of the Midland Mainline Electrification (MMLE) Kettering to Wigston (K2W) project in the UK. Implemented alongside the National Technical Specification Notices (NTSN) Energy (ENE) standard (section 6.2.4.5), this approach ensures compliance while reducing project duration, minimising interface complexities, and lowering costs by quantifying pantograph-OLE dynamic performance to as-fitted OLE. High-resolution, non-contact measurement techniques captured the static geometry, which was subsequently analysed using OLE StAT© - a Static Analysis Toolbox specially designed for this application. By overlaying design and installed geometry, deviations impacting dynamic performance were identified and categorised as allocation or construction errors via automated root cause analysis. The methodology meets NTSN construction assurance requirements while streamlining quality control, regulatory compliance, and project efficiency. It offers a powerful, new, cost-effective solution for optimising OLE construction, ensuring safe dynamic performance, and improving overall electrification project delivery.
Keywords
Introduction
The UK’s commitment to achieving carbon neutrality by 2050 is driving the expansion of the country’s electrified rail network. As part of this transition, substantial investment has been placed on reducing the environmental impact and cost of rail travel. This shift is exemplified by major projects such as the Midland Main Line (MML) upgrade, which focuses on electrifying key routes to boost capacity, cut emissions, and improve passenger services.
Within the past few years, the Midland Mainline electrification (MMLe) Kettering to Wigston (K2W) infrastructure project has delivered 77 Single Track Kilometers of newly electrified 2-track and 3-track infrastructure. Electrification has been achieved on all tracks from Kettering to Wigston using the high-tension derivative of UK Master Series (UKMS) design range, the UKMS 125, which can support train speeds of up to 125 mph (200 km/h).
Following the construction of an interoperable constituent overhead contact system, the quality of the as-built infrastructure must be verified using a dynamic interface testing in order to validate the interaction between overhead contact line and pantograph. The construction assurance methodology is outlined in Technical Specifications for Interoperability 1 within the EU and National Technical Specification Notice Energy (NTSN ENE) 2 in the UK, with the specific aim to ‘identify allocation and construction errors, but not to assess the basic design in principle’. This is a costly and demanding validation process that is essential in certifying the safety of the resulting Overhead Line Equipment (OLE).
The work presented here is part of the construction assurance processes implemented in NTSN ENE section 6.2.4.5 entitled, ‘Assessment of dynamic behaviour and quality of current collection (integration into a subsystem) requirements.’ The alternative approach detailed herein, has substantial potential to help reduce the costs of railway electrification in future projects and has therefore garnered substantial industrial interest. This ‘enhanced’ assurance methodology combines static wire profile data with a high-resolution compliance analysis to offer a superior understanding of allocation design and construction errors when compared to the existing NTSN testing requirements.
As outlined below, the new approach was able to identify the location and root cause of all significant OLE construction and allocation errors prior to instrumented pantograph testing, thereby validating a ‘non-contact’ procedure as a benchmark for future electrification projects. Adopting this alternative approach can dramatically reduce the time and cost associated with Entry into Service (EiS) requirements by leveraging readily available data as part of an innovative construction assurance process. Ultimately, the integration of this method within project construction requirements will improve OLE infrastructure testing, while providing a fully digital database of all construction outcomes which can be perpetually monitored throughout the asset’s lifecycle.
Motivation and significance
The NTSN ENE provides a rigorous approach to qualify current collection throughout newly built infrastructure to guarantee the asset meets interface performance criteria. The approach involves collecting pantograph to Overhead Contact System (OCS) interface force data which is collected at maximum permissible speed using a single instrumented pantograph. The route is separated to individual tension lengths (wire-runs) and statistically analysed to prove compliance to the specified thresholds set out within the NTSN and 50367. 3 The requirements for testing are laid out in 50317 4 and additionally involve dynamic uplift measurements in two locations as set out in 2.6.2.1.1 of the Guide for the application of the Technical Specifications for Interoperability (TSI). 5 A comprehensive report is then submitted to the Notified Body (NoBo) for review and approval prior to Entry into Service (EiS).
The MMLe project test plan included the following high-level milestones which were necessary to conform to the NTSN specifications: • Instrumentation of a Brecknell Willis High Speed X pantograph to British Standard (BS) European Norm (EN) 50317 requirements • Tethered testing to establish the aerodynamic compensation of the pantograph in line with BS EN 50317 requirements • Progressive linespeed increments (30/60/85/110 mph) to identify construction and OLE allocation errors in line with Locomotive & Passenger Rolling Stock Technical Specification for Interoperability
6
section 6.1.3.7 requirements • Dynamic uplift testing at open route location(s) at maximum design speed of 110 mph
Several other parts of the programme related to the test-train specification, operation, path planning or pantograph integration on bespoke car formations are also necessary. The above outlined process results in complex interfaces between multiple stakeholders with significant timescales and cost added to the project after construction completion.
The NTSN method ensures acceptable current collection quality is achieved for all possible train paths while providing construction support in case of serious exceedance observations. The more the as-fitted wire geometry adheres to the system basic design and allocation principles, the more likely is for the interface force standard deviation not to exceed the σ/Fmean > 0.3 set out in the NTSN performance criteria. In addition, the wire-run specific analysis flags exceedances of minima and maxima Fmax and Fmin at ‘discrete’ locations where allocation and design errors may have occurred.
However, the force sample outcomes often vary significantly between different pantograph types, test train configurations, speeds or under different parts of the infrastructure. Equally, force impulses measured near ‘discrete’ wire features which exceed the calibration input force bands in the EN50317 may often result in significant variation of peak force distribution. These restrictions often limit the ability to monitor the progress of infrastructure defects at later stages of the asset’s life cycle.
In addition, the NTSN has a hard pass-fail criterion which is restricted by the worst-case scenario where the train formation consists of runs with multiple pantographs, therefore force limitations do not always trigger for single pantograph tests at the same speed. A method which can identify and classify overhead infrastructure defects consistently can address these fundamental construction assurance standard requirements and further support the infrastructure maintenance beyond the early commissioning stages.
Recent industrial studies have focused on identifying critical OCS faults, such as dropper failures, 7 often through the analysis of historical maintenance records. Other approaches rank failure modes by severity using techniques such as Failure Mode and Effects Analysis (FMEA) 8 or probabilistic models like Bayesian Networks, 9 which generate quantified assessments of catenary condition.
Non-contact measurement techniques and image-based diagnostics are commonly used to detect OCS faults,10–12 while dynamic interface analysis examining the interaction between the pantograph and the overhead line has been employed to assess fault risk and system performance.13,14 These methods vary in terms of spatial resolution, data richness, and diagnostic accuracy.
However, a notable gap in the literature is the limited correlation between static wire profiling and dynamic force measurements. Most train-borne diagnostic systems do not incorporate infrastructure design data, which can be critical for identifying high-risk components such as section insulators, crossovers, low-clearance zones, and overlaps. The proposed methodology addresses this gap by linking static geometric deviations to dynamic interface performance, offering a more targeted and design-informed approach to fault detection and maintenance planning.
In Baimpas et al. 15 discrete force traces were successfully correlated with OCS wire profile ‘kinks’ arising from unwinding of the Contact Wire (CW) from the spool as well as ‘z’ dropper installations intended to reduce wire ‘hogging’. This exercise proved the direct link between the analysed static wire geometry and the observed interface force which is key to exploring the feasibility of non-contact methods to replace dynamic interface force measurements proposed in this article.
Emerging infrastructure monitoring techniques in the railway sector increasingly utilise advances in sensor technologies such as accelerometers, high speed video, and LiDAR, combined with machine learning and cloud-based data processing. These approaches, often integrated into passenger services, provide continuous real-time condition monitoring and alerting across the network. While these methods deliver strong operational surveillance, they generally lack the spatial resolution and design-informed analysis required for construction assurance. The proposed methodology addresses this gap by offering high fidelity, span-level geometric assessment immediately after installation, linking as-built conditions to design intent and lifecycle performance. This capability complements machine vision and digital twin frameworks by providing a scalable non-contact solution that enhances compliance, supports predictive maintenance strategies, and strengthens the integration between construction assurance and long-term asset management.
Enhanced construction assurance
The enhanced construction assurance methodology was implemented following OCS construction in the Kettering to Wigston (K2W) project but in advance of instrumented pantograph testing. The existing quality assurance checks include static pantograph assessment, visual checks and at every support and mid-span. The focus of these methods and is to ‘check’ compliance to basic design criteria such as gradient, system depth and steady arm heel setting to fulfil system installation tolerance thresholds. This means that other parameters related to the overall overhead design application over the existing track or specific undulations of the CW profile are not monitored. The NTSN construction assurance methodology relies heavily on instrumented pantograph testing to confirm that the interface performance is in line with the system specifications and any ‘discrete’ wire geometry nuances are identified prior to Entering into Service (EiS).
These checks are achieved by exploiting the mechanical OCS to pantograph interface to ‘identify construction and allocation errors’ in line with the NTSN (or TSI) requirements in accordance with EN 50317. This manuscript outlines the first route wide application of this method and therefore the results are correlated and validated against the instrumented pantograph testing outcomes. For the purpose of analysing the static and dynamic interface data, the two software packages OLE Static Analysis Toolbox (OLE StAT) 16 and the Perpetual OLE tool (P-OLE) 17 have been used and further developed.
Methodology tools
OLE static analysis toolbox (StAT)
The OLE Static Analysis Toolbox is a high-resolution static wire profilometry conformance measuring tool that has been developed by Network Rail, AtkinsRéalis and Train-Rail Infrastructure Solutions (T-RIS). It was introduced to analyse static wire profile survey data produced during the construction or renewal OLE infrastructure projects. The tool has further been developed to enable inputs from Light Detection and Ranging (LiDAR) survey equipment and automatic analysis of successive survey outputs to monitor the development of infrastructure geometry defects. LiDAR equipment availability and dedicated feature extraction software are fundamental starting points for high resolution static wire extraction. These are essential inputs for ‘enhanced’ wire conformance analysis. For this study a Trimble MX50 Mobile Mapping Device was used to capture the entire asset in a single shift. The system was mounted to a Road-to-Rail Vehicle (RRV) as shown in Figure 1(a) which was driven at 5 mph. Low speed is necessary to create statistically significant volume of point in relation to the wires. (a) Mobile mapping device on an RRV, (b) Highlighted wire feature extraction from LiDAR, (c) Analysed wire profile from OLE StAT for a single wire run. Vertical lines indicate the location of the OLE structure. The analysed static wire geometry (red) and allocation geometry (blue) are shown.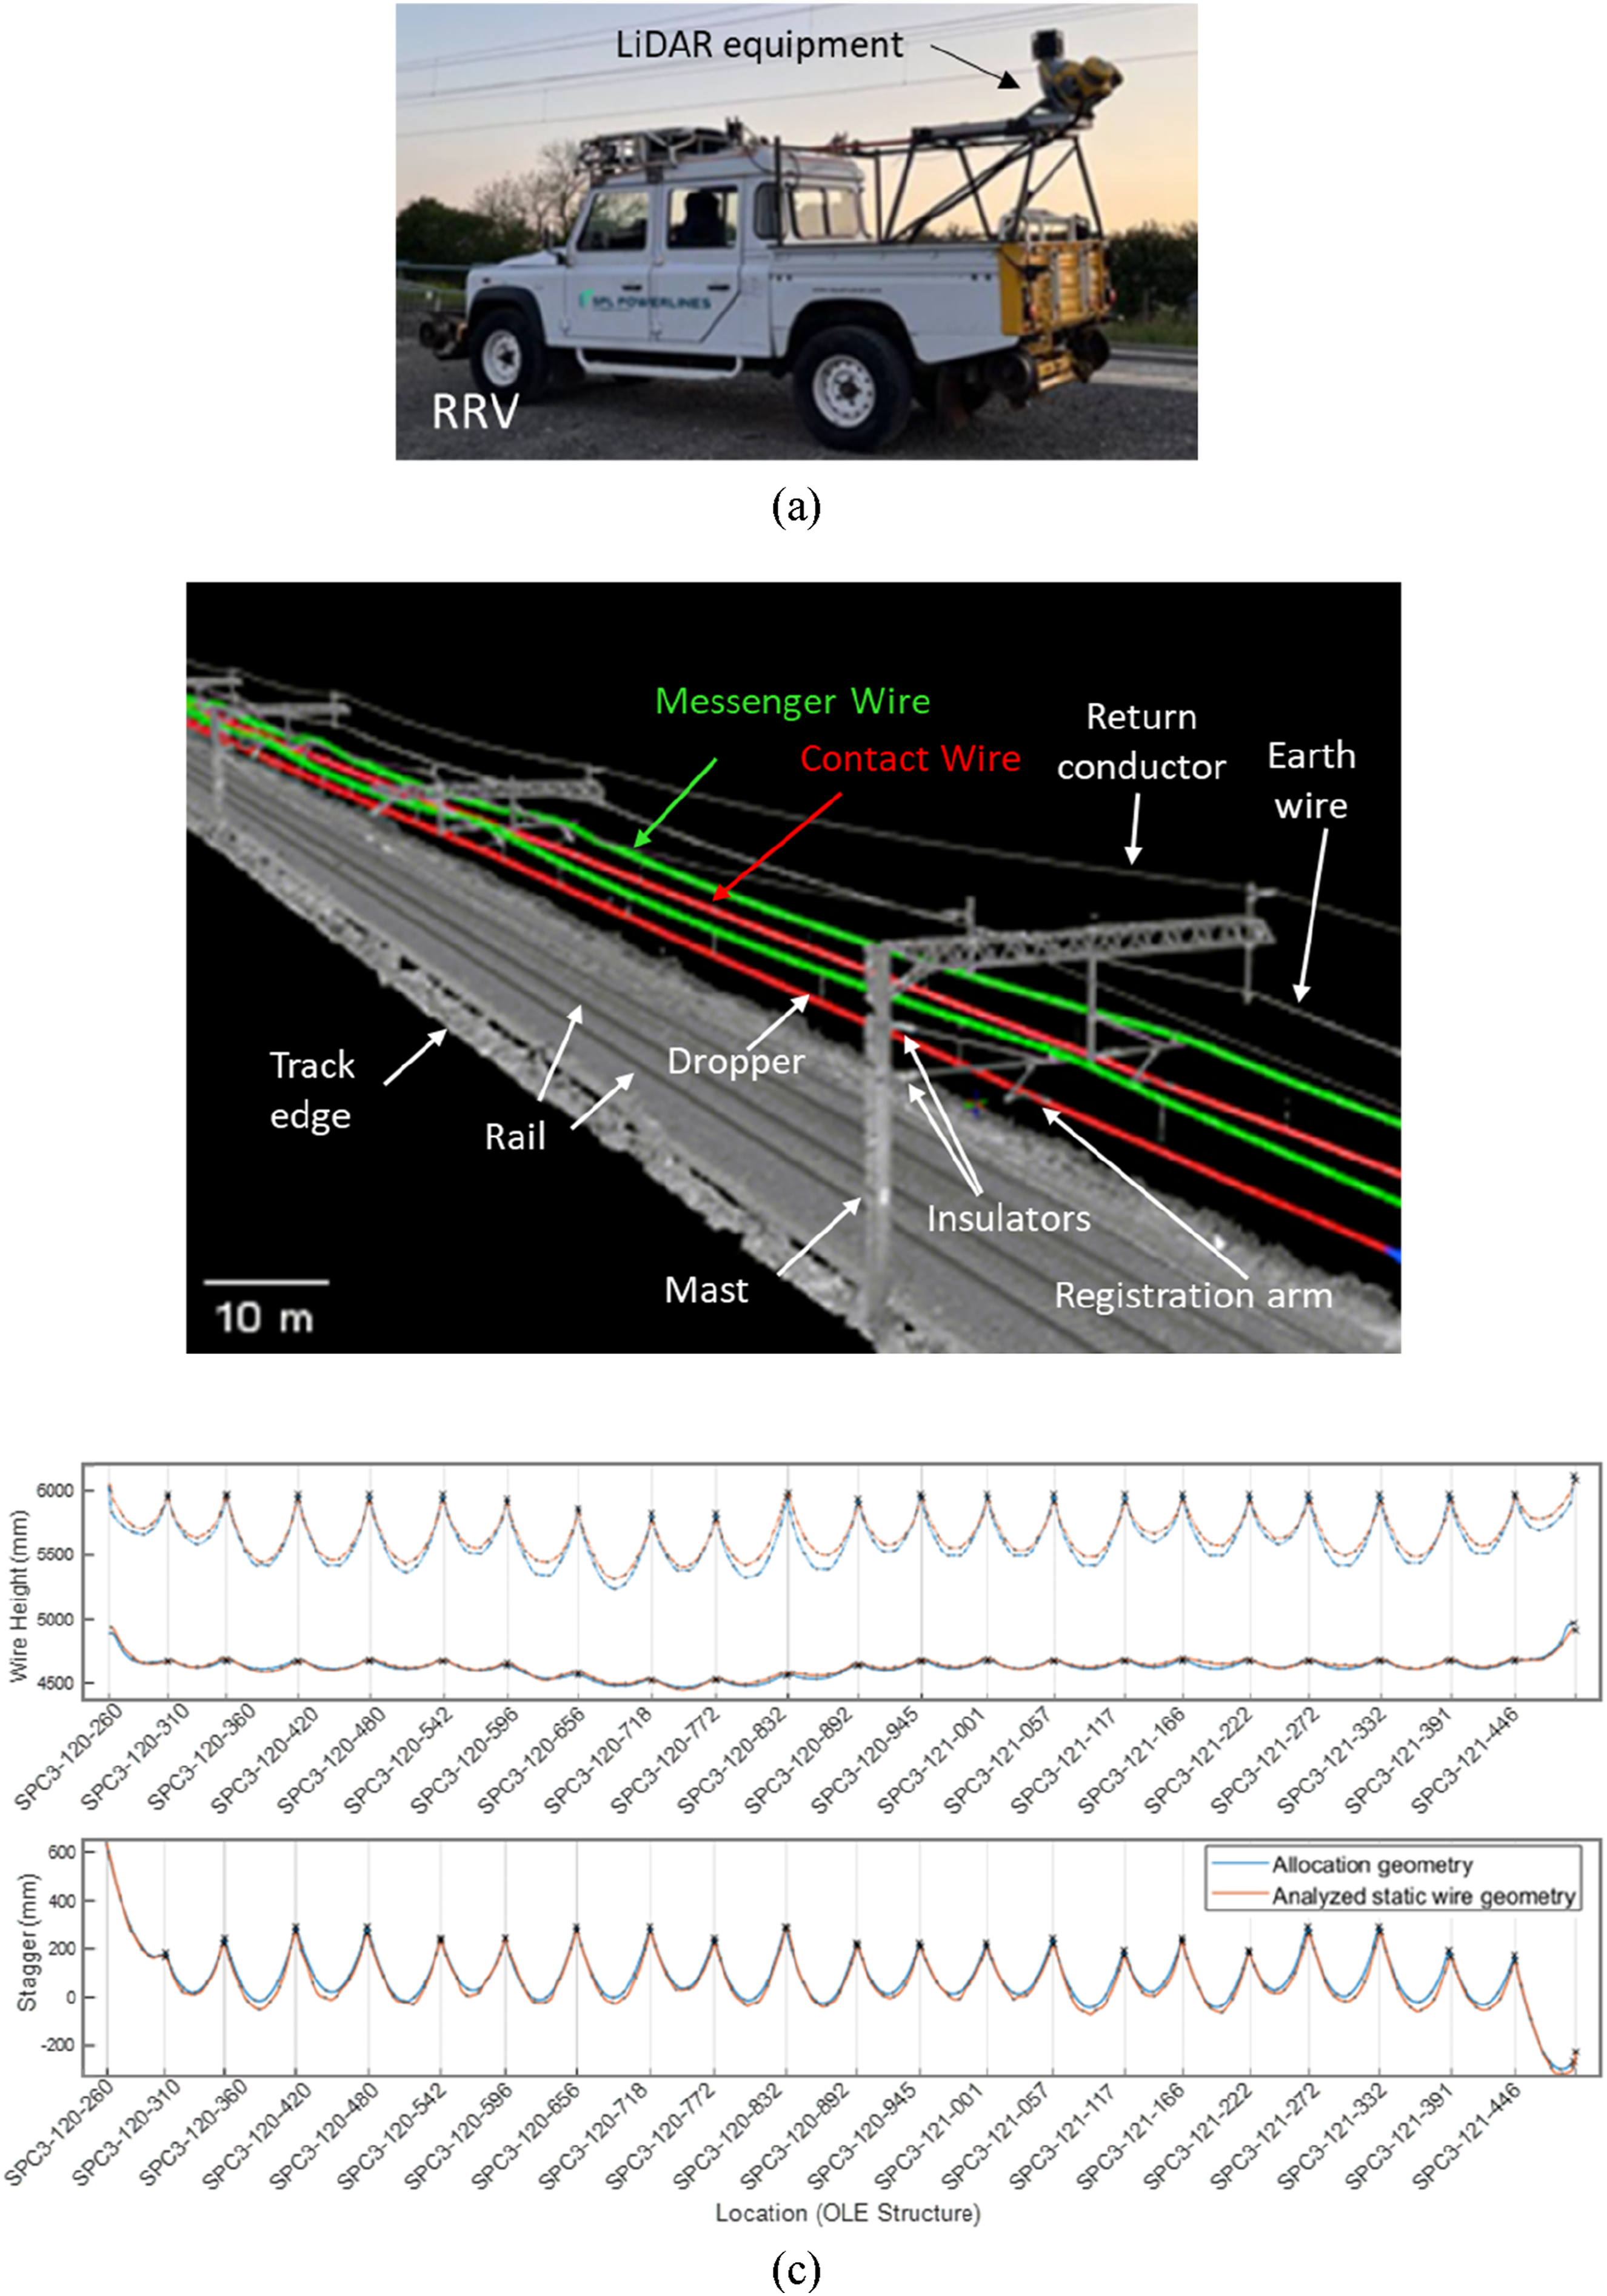
Uncertainty in LiDAR-based measurements is governed by four main factors: (i) range noise and angular resolution of the MX50 LiDAR sensors, (ii) trajectory errors from the CORS-corrected GNSS/INS solution, (iii) residual misalignment between the LiDAR sensor frame and the track reference frame, and (iv) true physical movement of the contact and catenary wires due to wind and temperature. Acquisition at low speed (5 mph) increases the point density at wire level and reduces motion-related artefacts, while mounting the system on the RRV ensures a mechanically stable platform that is directly linked to the track geometry. Environmental variability was controlled by restricting acquisition to periods with cross-track winds below 10 m/s. This wind speed was determined via preliminary tests which showed that higher winds introduce systematic lateral displacement of the wires. Datasets collected in wind speeds ≥10 m/s were therefore rejected and re-acquired. Ambient temperature and time-of-day were logged for each run to allow interpretation of thermally induced changes in wire sag. However, for the data set presented in this study these effects remained small compared to the design tolerance band and could therefore be treated as a secondary source of uncertainty.
The LiDAR sensors are offset by 35° degrees and set to record 500,000 points/sec which results in a highly dense point cloud. The data was post processed using inputs from the Continuously Operating Reference Station Global Navigation Satellite System (CORS GNSS) Network and was loaded into the Trimble GEDO Scan Office for visualisation as shown in Figure 1(b).
For each 200 mm sample along the tracked wire, the position is estimated from a cluster of LiDAR points. Assuming uncorrelated point-level noise, the standard error on the wire position decreases with the square root of the number of returns in the cluster. In practice, the high point density achieved at 5 mph yields sub-sample variability that is small relative to the separation between conformant and non-conformant geometry. Using the initially derived trajectory, the software extracted the running edge rail position by Iterative Cloud Point Matching. This process uses a rail head template which is checked for similarity against the scanned rail head and a running edge position is created every 3 m with a confidence level >95%. Any extracted profile not reaching the 95% confidence level was manually checked and adjusted. This was repeated for all tracks.
With the rail trajectories fixed, the next stage was to automatically detect and extract the OLE Contact and Catenary wire strings. This was achieved using a function which searches for clusters of points and takes the lowest and most central point as a wire position every 200 mm increments. This was achieved using CADD Ltd. N4ce Designer (With Feature Extraction Bolt-On) which was used to export the contact and catenary wire height and stagger as continuous csv strings.
Environmental conditions such as cross-track winds, ambient temperature, and time-of-day were monitored during LiDAR acquisition. Data collection was conducted on the down main track to enable simultaneous capture across adjacent tracks. It was observed that wind speeds exceeding 10 m/s introduced measurable deviations in wire profile readings, necessitating iterative filtering and validation. Additionally, areas where the LiDAR field of view was obstructed, such as under overbridges or near platform canopies, required separate targeted acquisitions to ensure data completeness.
To assess the sensitivity and reliability of the LiDAR system, a comparative analysis was performed using overlapping infrastructure sections previously surveyed by the New Measurement Train (NMT) at 125 mph. The LiDAR data, collected at 5 mph, demonstrated a deviation of less than 1% when compared to NMT’s laser-based optical measurements. This confirms that the LiDAR-derived wire profiles meet the required accuracy thresholds for integration into asset condition assessments.
Potential failure modes of the methodology include misclassification of wire types in areas with minimal system depth (e.g., overbridges), and reduced feature extraction performance in zones with high structural clutter or reflective interference. These limitations are mitigated through post-processing validation, manual review of flagged segments, and integration with design data to cross-reference expected wire positions.
While the method is robust for most operational scenarios, its performance may be constrained in highly congested urban environments or during adverse weather conditions. Future work will explore adaptive filtering techniques and multi-sensor fusion to further enhance reliability in such contexts.
A combined multi-wire run file was processed in OLE StAT which identifies the successive wire change over locations (overlaps) and span support locations. The peak-based detection of droppers in OLE StAT
15
uses both the localised peak shape and known mechanical and geometric properties of the catenary to distinguish true droppers from noise in the point cloud, further reducing the influence of random measurement errors on the identification of span support locations. This approach also identifies droppers using a peak finding process
15
which determines the exact dropper location from the localised peak shape in combination with the CW dimensions (cross-section), mechanical (pretension, gravity) and material (mass) properties. The tool is then able to correlate the as-built geometry with the basic design and allocation parameters of each individual span. Integrating the OCS design into the analysis enables detailed insight into the configuration of each span, including those with in-line insulators, overlap sections, and crossovers. By comparing the ideal wire profile, generated using the OLE Static Analysis Toolbox (OLE StAT), against the actual installed geometry, the system establishes a direct benchmark. This allows for the detection and categorisation of even minor deviations, such as vertical exceedances of less than 5 mm. A high level list of the design parameters checked are: (1) Installed span lengths (at the CW registration point) (2) Dropper along track position and correlation with allocation design (3) Dropper length correlation with allocation design (4) Span CW pre-sag correlation with basic design (5) Span specific CW shape conformance to OLE basic design and tension (normal encumbrance, bridge approach, in-line insulator spans, etc.) (6) Circumflex at overlaps in terms of correlation with basic design (7) Height and stagger correlation with installation tolerances in accordance with system installation manual (8) CW defects, for example wire ‘kinks’- See Case Study in Section 2.4 (9) CW shape, particularly in regions affected due to crossing wire design (10) CW profiles, for example those affected due to Neutral Section (NS) or Section insulator (SI)
OLE StAT displays all measured metrics and automatically flags likely root causes for each span on a dashboard application which can be reviewed to inform on-site onsite interventions. This is typically referred to as ‘snagging’ and occurs after the main construction works and is based on feedback from construction assurance activities. An example of the dashboard plotting functionality is given in Figure 1(c). The analysed static wire geometry (amber) is overlaid with the design and allocation geometry (blue). Corrective dropper schedules or a proposed OLE design can then be exported. Specific in-span locations such as defects or inconsistent wire profiles at cross-overs and NS locations are also graphically displayed.
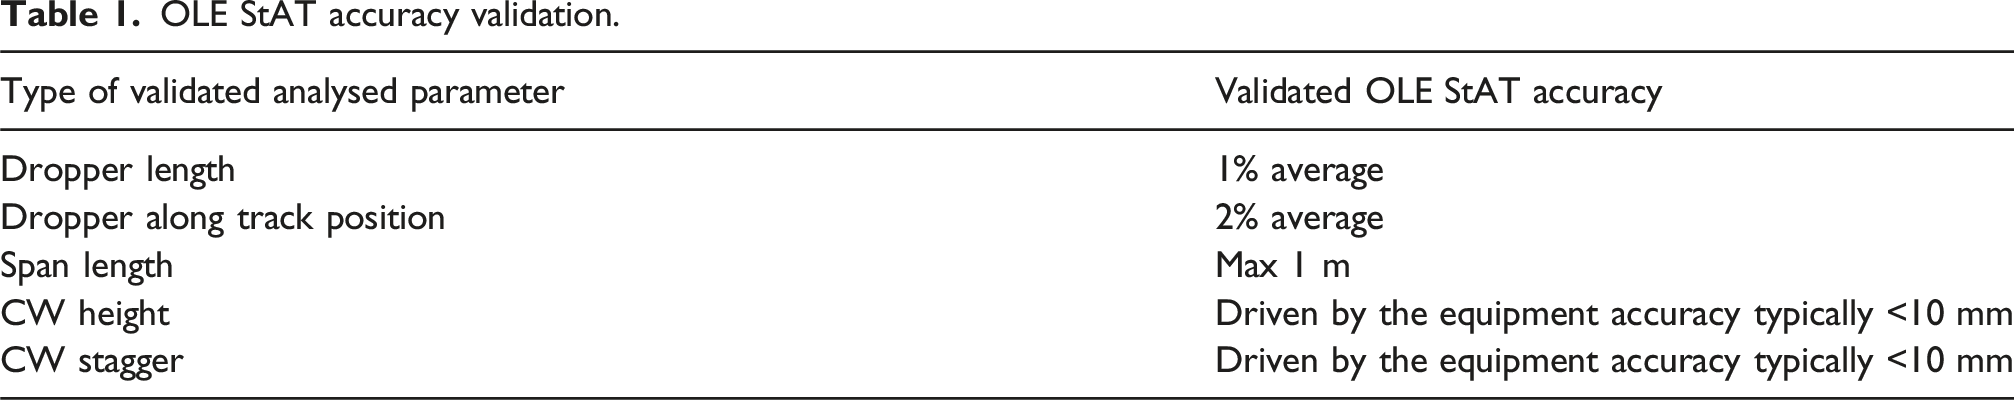
OLE StAT accuracy validation.
The use of LiDAR data, captured via a RRV, has proven effective as a non-contact method for profiling static wire geometry. A key advantage of this approach is the ability to collect multi-track data in a single pass, although limitations related to speed and site access must be considered. Feature extraction algorithms successfully identified both contact and messenger wire profiles, with particular improvements observed in low-clearance areas such as overbridges, where the contact and catenary wires run in parallel due to zero system depth. 20
This methodology is scalable to more complex rail environments, including urban systems, mixed traffic corridors, and tunnel infrastructure. Its adaptability lies in the non-intrusive nature of data collection and the robustness of the feature extraction process, even in constrained or geometrically complex settings. Furthermore, the approach can be integrated into existing asset management systems as a low-risk alternative to manual Height and Stagger surveys. By automating the detection of geometric deviations and linking them to dynamic performance indicators, the methodology supports predictive maintenance planning and long-term infrastructure health monitoring.
OLE StAT has been deployed at scale across diverse infrastructure types to validate its robustness and generalisability. The tool has processed more than 50% of the UK’s high-speed electrified network, encompassing approximately 1000 wire runs operating at speeds of 100 mph or greater. These datasets include all legacy and NTSN-compliant equipment families, integrated within the algorithmic design framework to ensure compatibility with multiple tensioning regimes and span geometries. Beyond high-speed applications, the methodology has been implemented on metro systems such as Sydney Metro in Australia, where twin contact wire configurations were analysed under constrained system depth conditions. In these cases, OLE StAT outputs were combined with dynamic interface modelling to quantify sensitivity to geometric deviations and validate compliance against EN 50317 performance thresholds. This breadth of application demonstrates scalability across different operational contexts and confirms the capability of the approach to support assurance processes for both conventional and complex overhead contact system designs.
Perpetual OLE (P-OLE)
The Perpetual-OLE (P-OLE) tool has been developed to jointly analyse the dynamic testing outcome with the analysed static wire profile geometry. The cross-correlation of the two independent samples is key in terms of the validation and future monitoring of the infrastructure condition or movements.
This is achieved by initially adjusting the instrumented pantograph force trace sample to match design locations using dynamic stagger outputs. The force sample is then dynamically filtered at +/− 3σ increments which are aligned with the ends of each span in order to identify high or low force exceedances. The dynamic force threshold overlay to the instrumented pantograph force trace is illustrated in Figure 2 (top). The respective dynamic stagger (bottom) is also shown as part of the processing to indicate that design support locations (black vertical lines) coincide with the aligned stagger sample. The force exceedance picked out from the filtration process illustrated in Figure 2 coincides with a crossing wire when transitioning from the Down Main track to the Up/Down Slow. The influence of the CW force has been identified by the filtration process and has been assigned a green marker to match the respective root cause previously identified in OLE StAT. The filtration can be further adjusted until the highest number of geometric exceedances matches the respective discrete force locations in the pantograph sample. In terms of validation, it should be highlighted that P-OLE does not adjust the interface force sample recorded and is instead reliant on established standard EN 50317 in terms of the level of accuracy of outputs. P-OLE dynamic filter window showing static and dynamic exceedances.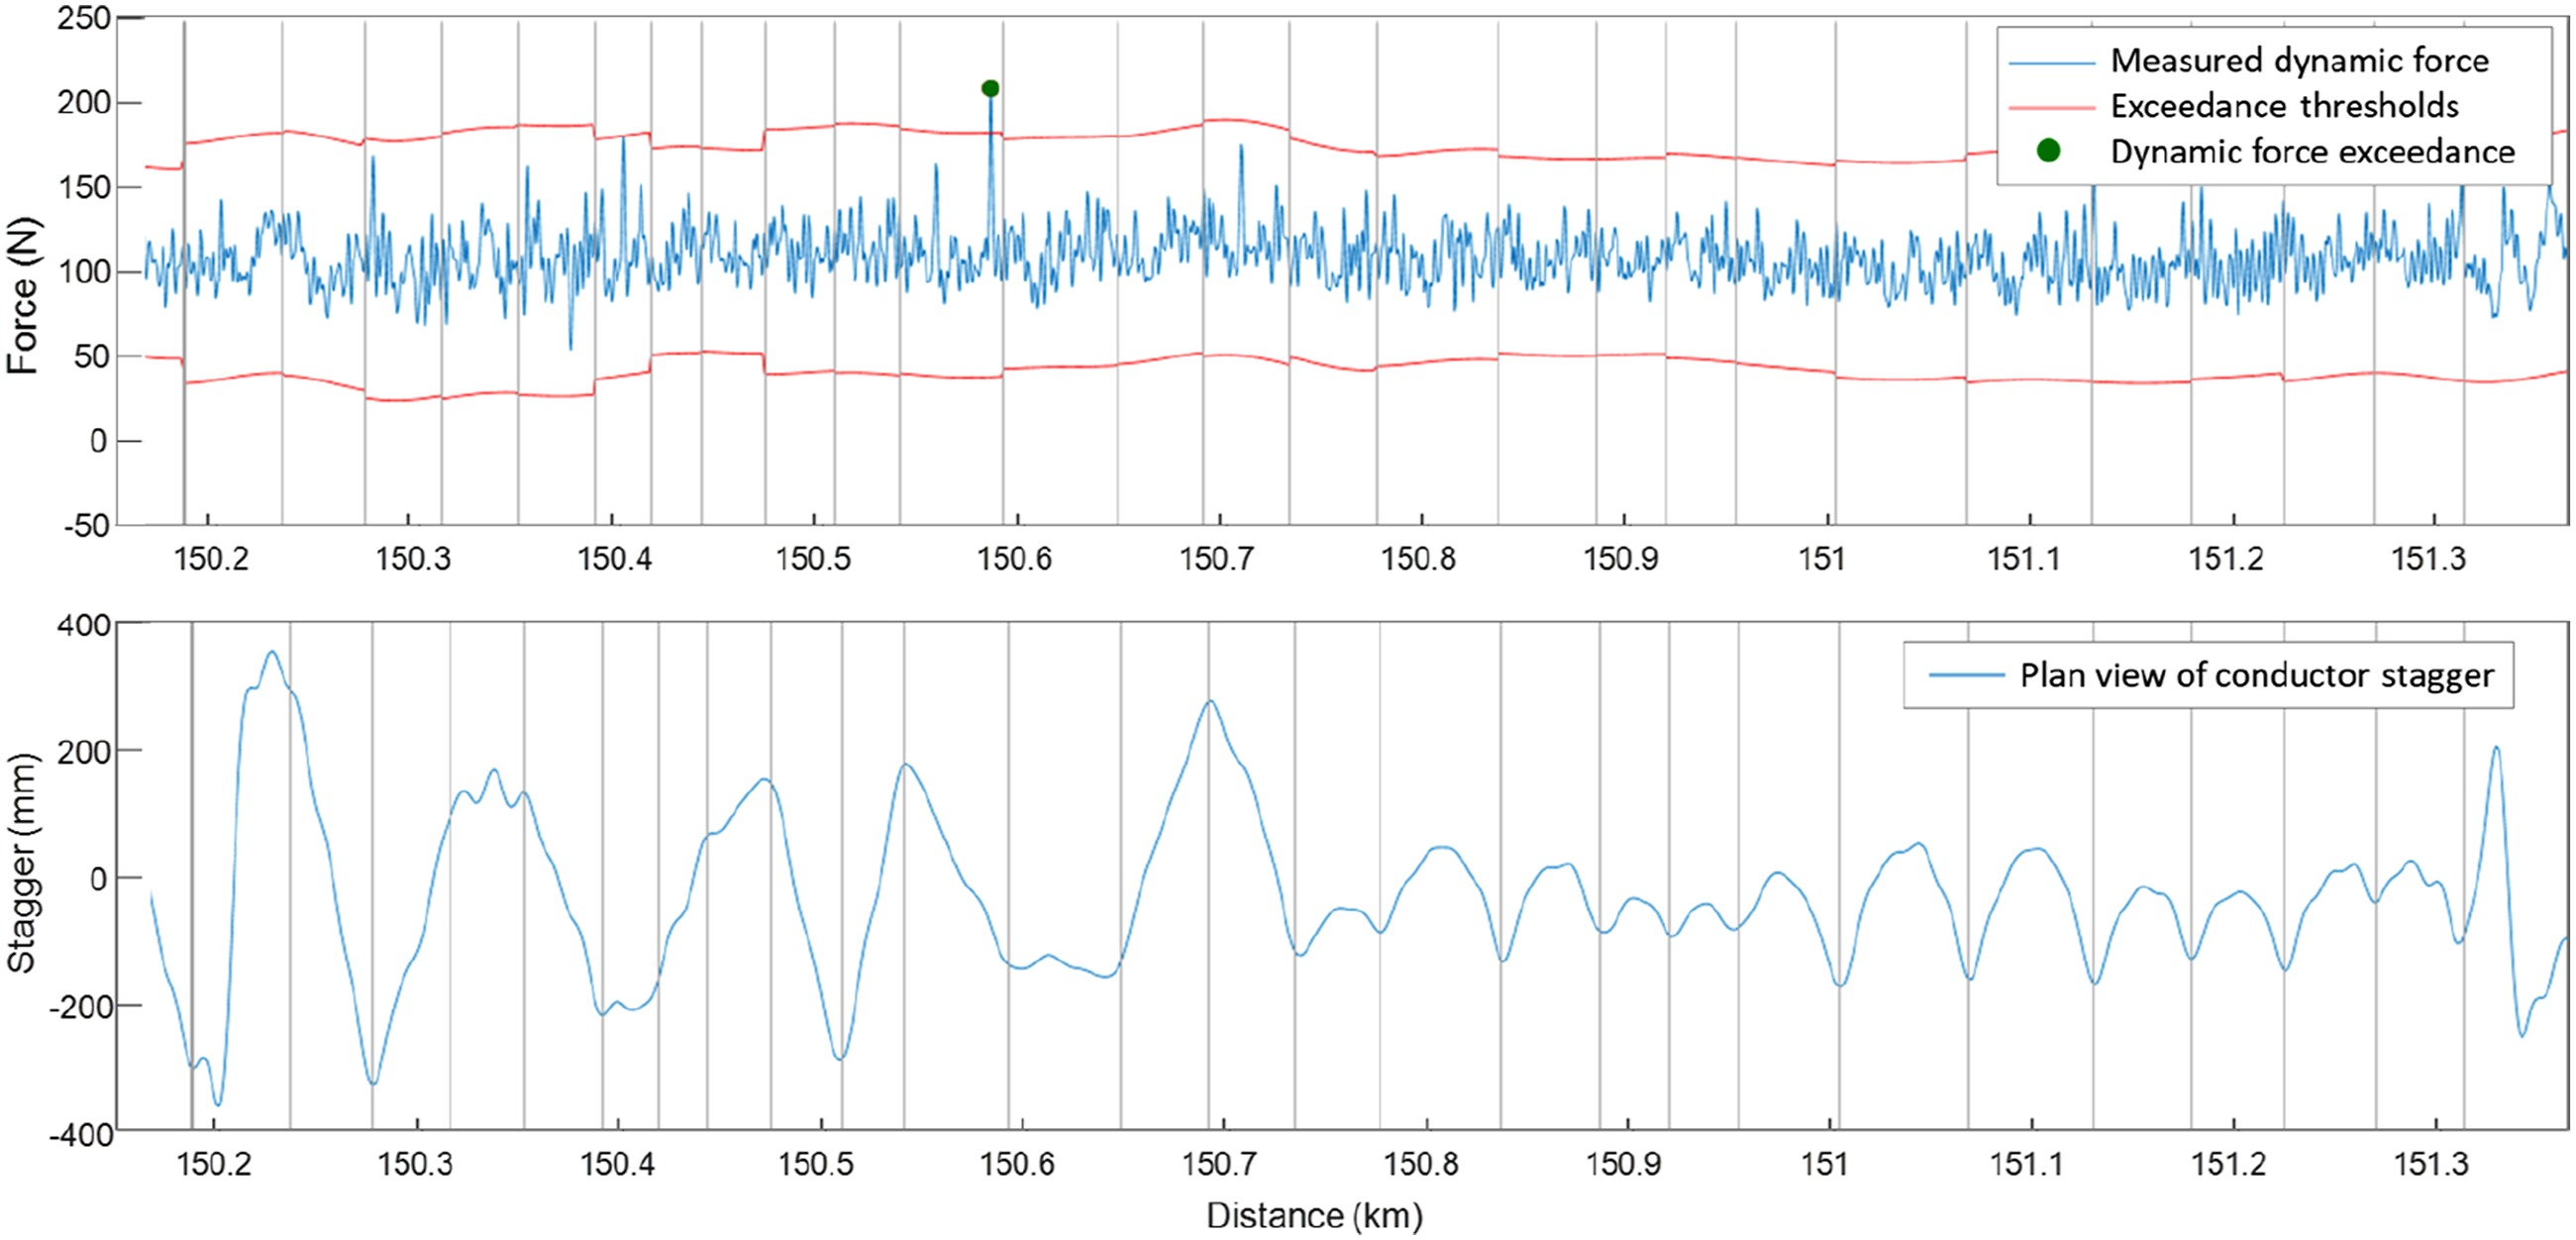
Method validation
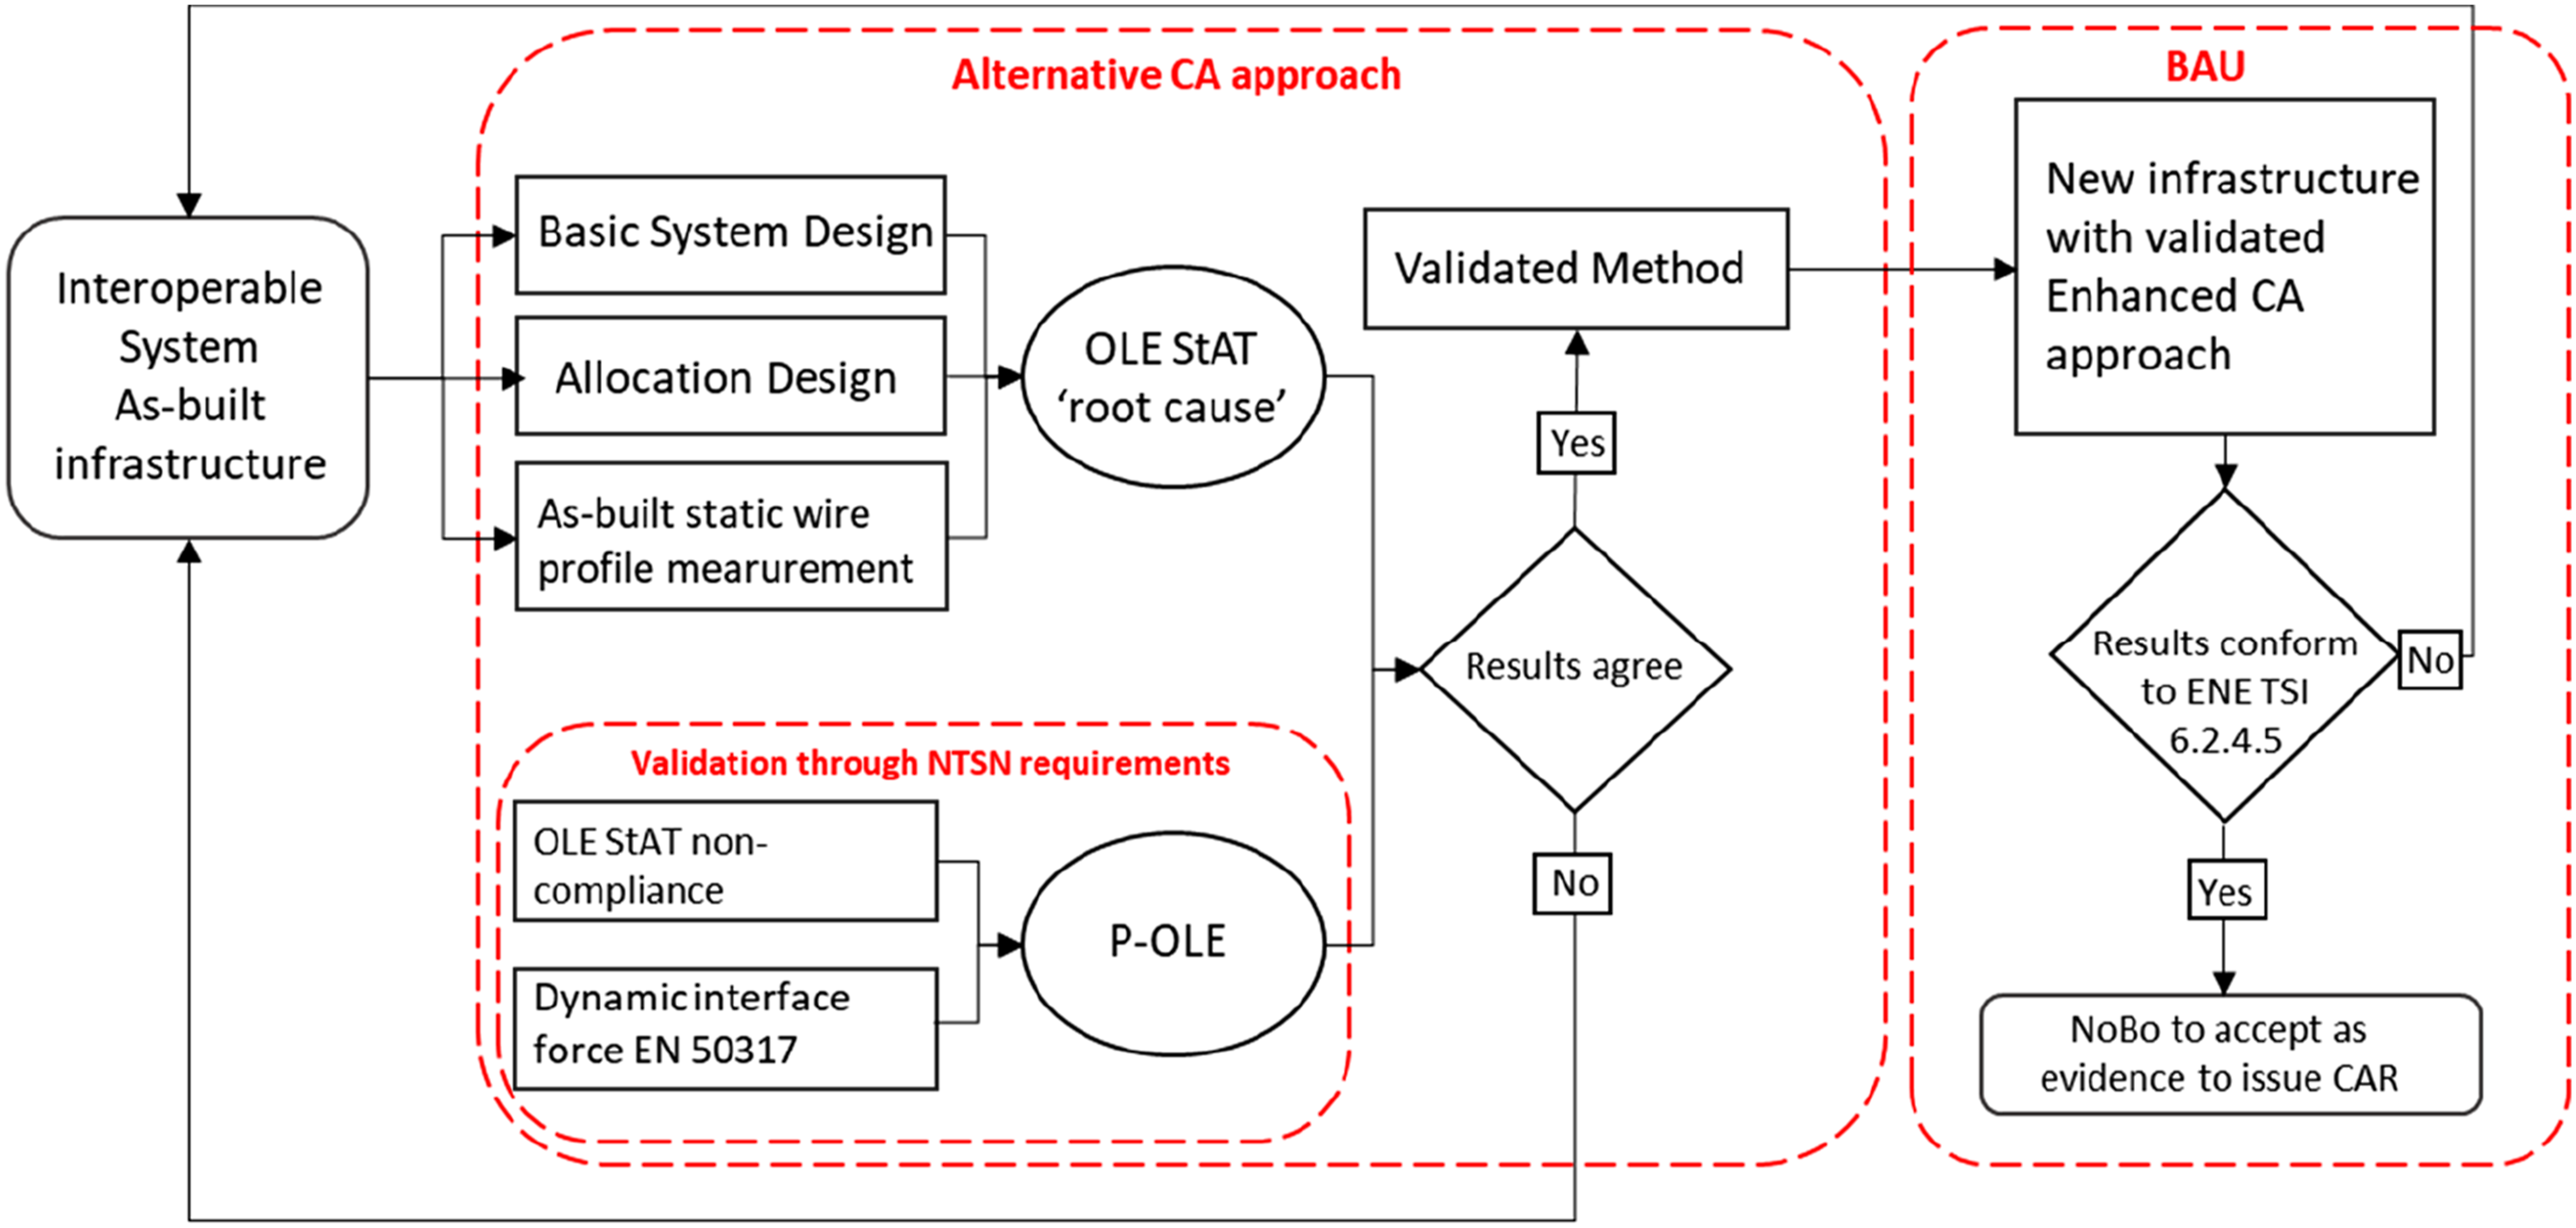
To test and validate the enhanced construction assurance method at full scale, it was applied to the K2W project in accordance with process outlined in Figure 3. This involved the following key steps: (1) Static wire profile data was collected following construction and prior to instrumented pantograph testing. OLE StAT analysis of each span was then used to identify sub-optimal wire setup at specific locations and with specific root causes. An exceedance schedule was then issued with all noted geometric exceedances falling within the UKMS125 system installation tolerance envelop. (2) Instrumented pantograph testing with an interoperable pantograph took place on all paths with increasing speed increments up to maximum permissible speed. The outcome force samples were aligned and correlated to match the corresponding geometric exceedances using P-OLE. Enhanced construction assurance validation methodology used in K2W project.
Summary of span-level analysis linking geometric deviations to force exceedances during K2W testing.
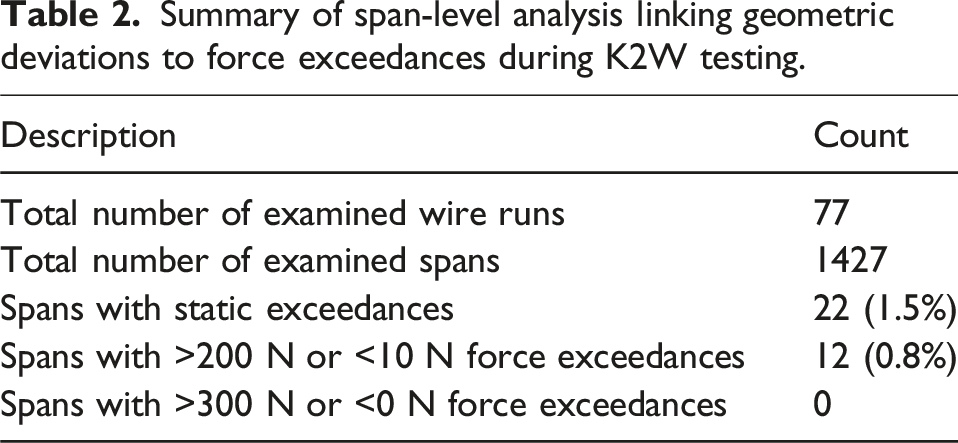
Of the 1427 spans examined, 22 (1.5%) exhibited geometric exceedances. Among these, 12 spans (0.8%) showed discrete force events exceeding 200 N or falling below 10 N, values within the NTSN thresholds. These spans will be subject to ongoing monitoring. Notably, no spans exhibited force exceedances beyond 300 N or below 0 N. The remaining exceedances were addressed during early snagging activities and are considered statistically negligible. No further on-site interventions were required after the final week of testing, and the validated data were submitted to the NoBo to support infrastructure authorisation and Entry into Service.
The conventional NTSN dynamic testing programme on the Midland Main Line incurred a direct cost of approximately £2 million, with an additional £5 million attributed to programme extensions following core construction activities. In comparison, the proposed static profiling methodology requires an estimated £200–300k, representing an approximate 85–90% reduction in direct testing expenditure. Time savings are equally significant: dynamic testing typically spans 12–16 weeks due to train path allocation, instrumented pantograph setup, and multi-speed validation, whereas LiDAR-based static profiling can be completed within a single shift, followed by automated analysis. Computational efficiency is achieved through batch processing of wire profile data, enabling full-route analysis in less than 24 h compared to several weeks of manual interpretation for dynamic force traces.
It is proposed that subsequent project dynamic testing requirements can be progressively scaled down in parallel with the further development and deployment of high-resolution wire profile analysis availability and verification. The concept of adopting non-contact wire profile analysis techniques in a Business-as-Usual model should be implemented in line with the NTSN and TSI ENE standard provisions and guidance for the method acceptance criteria based on the carried-out validation steps to come up with suitable intervention increments. This method can also integrate as a direct replacement of Quality Assurance (QA) checks such as Heights & Staggers at the low-speed regime (<120 km/h) of the NTSN and TSI ENE providing substantially more information in relation to the achieved spatial resolution in addition to improved consistency and accuracy. Lastly, the cost, duration and human factor error of QA checks is drastically reduced compared to existing conventional methods.
Additional benefits arise when compared to rotating OCS inspection schedules. Traditional inspection regimes require repeated track access, manual height and stagger measurements, and visual checks, introducing safety risks associated with “boots on ballast” and operational disruption. The proposed approach eliminates these requirements by enabling non-contact acquisition from a stable platform, reducing access dependency and improving workforce safety. Furthermore, the method provides comprehensive spatial coverage and perpetual condition monitoring capability, allowing subsequent measurements to be analysed automatically to track trends at previously identified exceedance locations, validate corrective interventions, and detect new deviations. This combination of cost reduction, accelerated programme delivery, and enhanced safety positions the methodology as a scalable alternative to both dynamic testing and conventional inspection practices.
Dropper allocation and wire ‘kinks’ as well as insulator component setup must follow specific tolerances which can be progressively agreed by the industry stakeholder driven by the availability of data. Some case study examples below are illustrated as a demonstration of the proposed methodology accuracy and outcomes.
Case study I – High speed alternating current neutral section
A notable example of the benefits realised in the project was the improvement in dynamic performance of a particular NS section known as the ‘Arthur Flurry NS’ in the Down Main direction. Specific instructions were provided to the Contractor’s Responsible Engineer (CRE) in relation to the height and stagger to be achieved at each dropper location. This included spring dropper pretension levels and lever arm setup. These changes achieved a notable decrease of contact interface force from Fmax = 246 N to 180 N when trains passed at 100 mph. The before and after recorded forces at the area are illustrated against the geometry changes in Figure 4. The instructions were provided based on the ‘enhanced’ Dynamic – Rail System Simulation (D-RSS)
18
dynamic interface simulation software. This provides a realistic wire implementation based on the UKMS basic design principles, the location specific OLE allocation design as well as specific setup instructions provided within the Arthur Flury installation manual. D-RSS was certified by the National Certified Body (NCB) UK in 2022 for compliance with EN 50318 standards. More recently, the NCB also certified that the D-RSS achieved an average accuracy of 98% across all performance thresholds for Line Test Data Validation (Annex B), when compared to EN 50317 interface force measurements taken from all three pantographs of a single electric multiple unit. P-OLE analysis using dynamic data before and after intervention to NS between the structures SPC3-131-029 and SPC3-131-089. The maximum contact interface force at 100 mph, decreases from 246 N to 180 N. The zoomed window shows NS dropper positions (highlighted by dots) before and after an intervention, as well as the proposed geometry.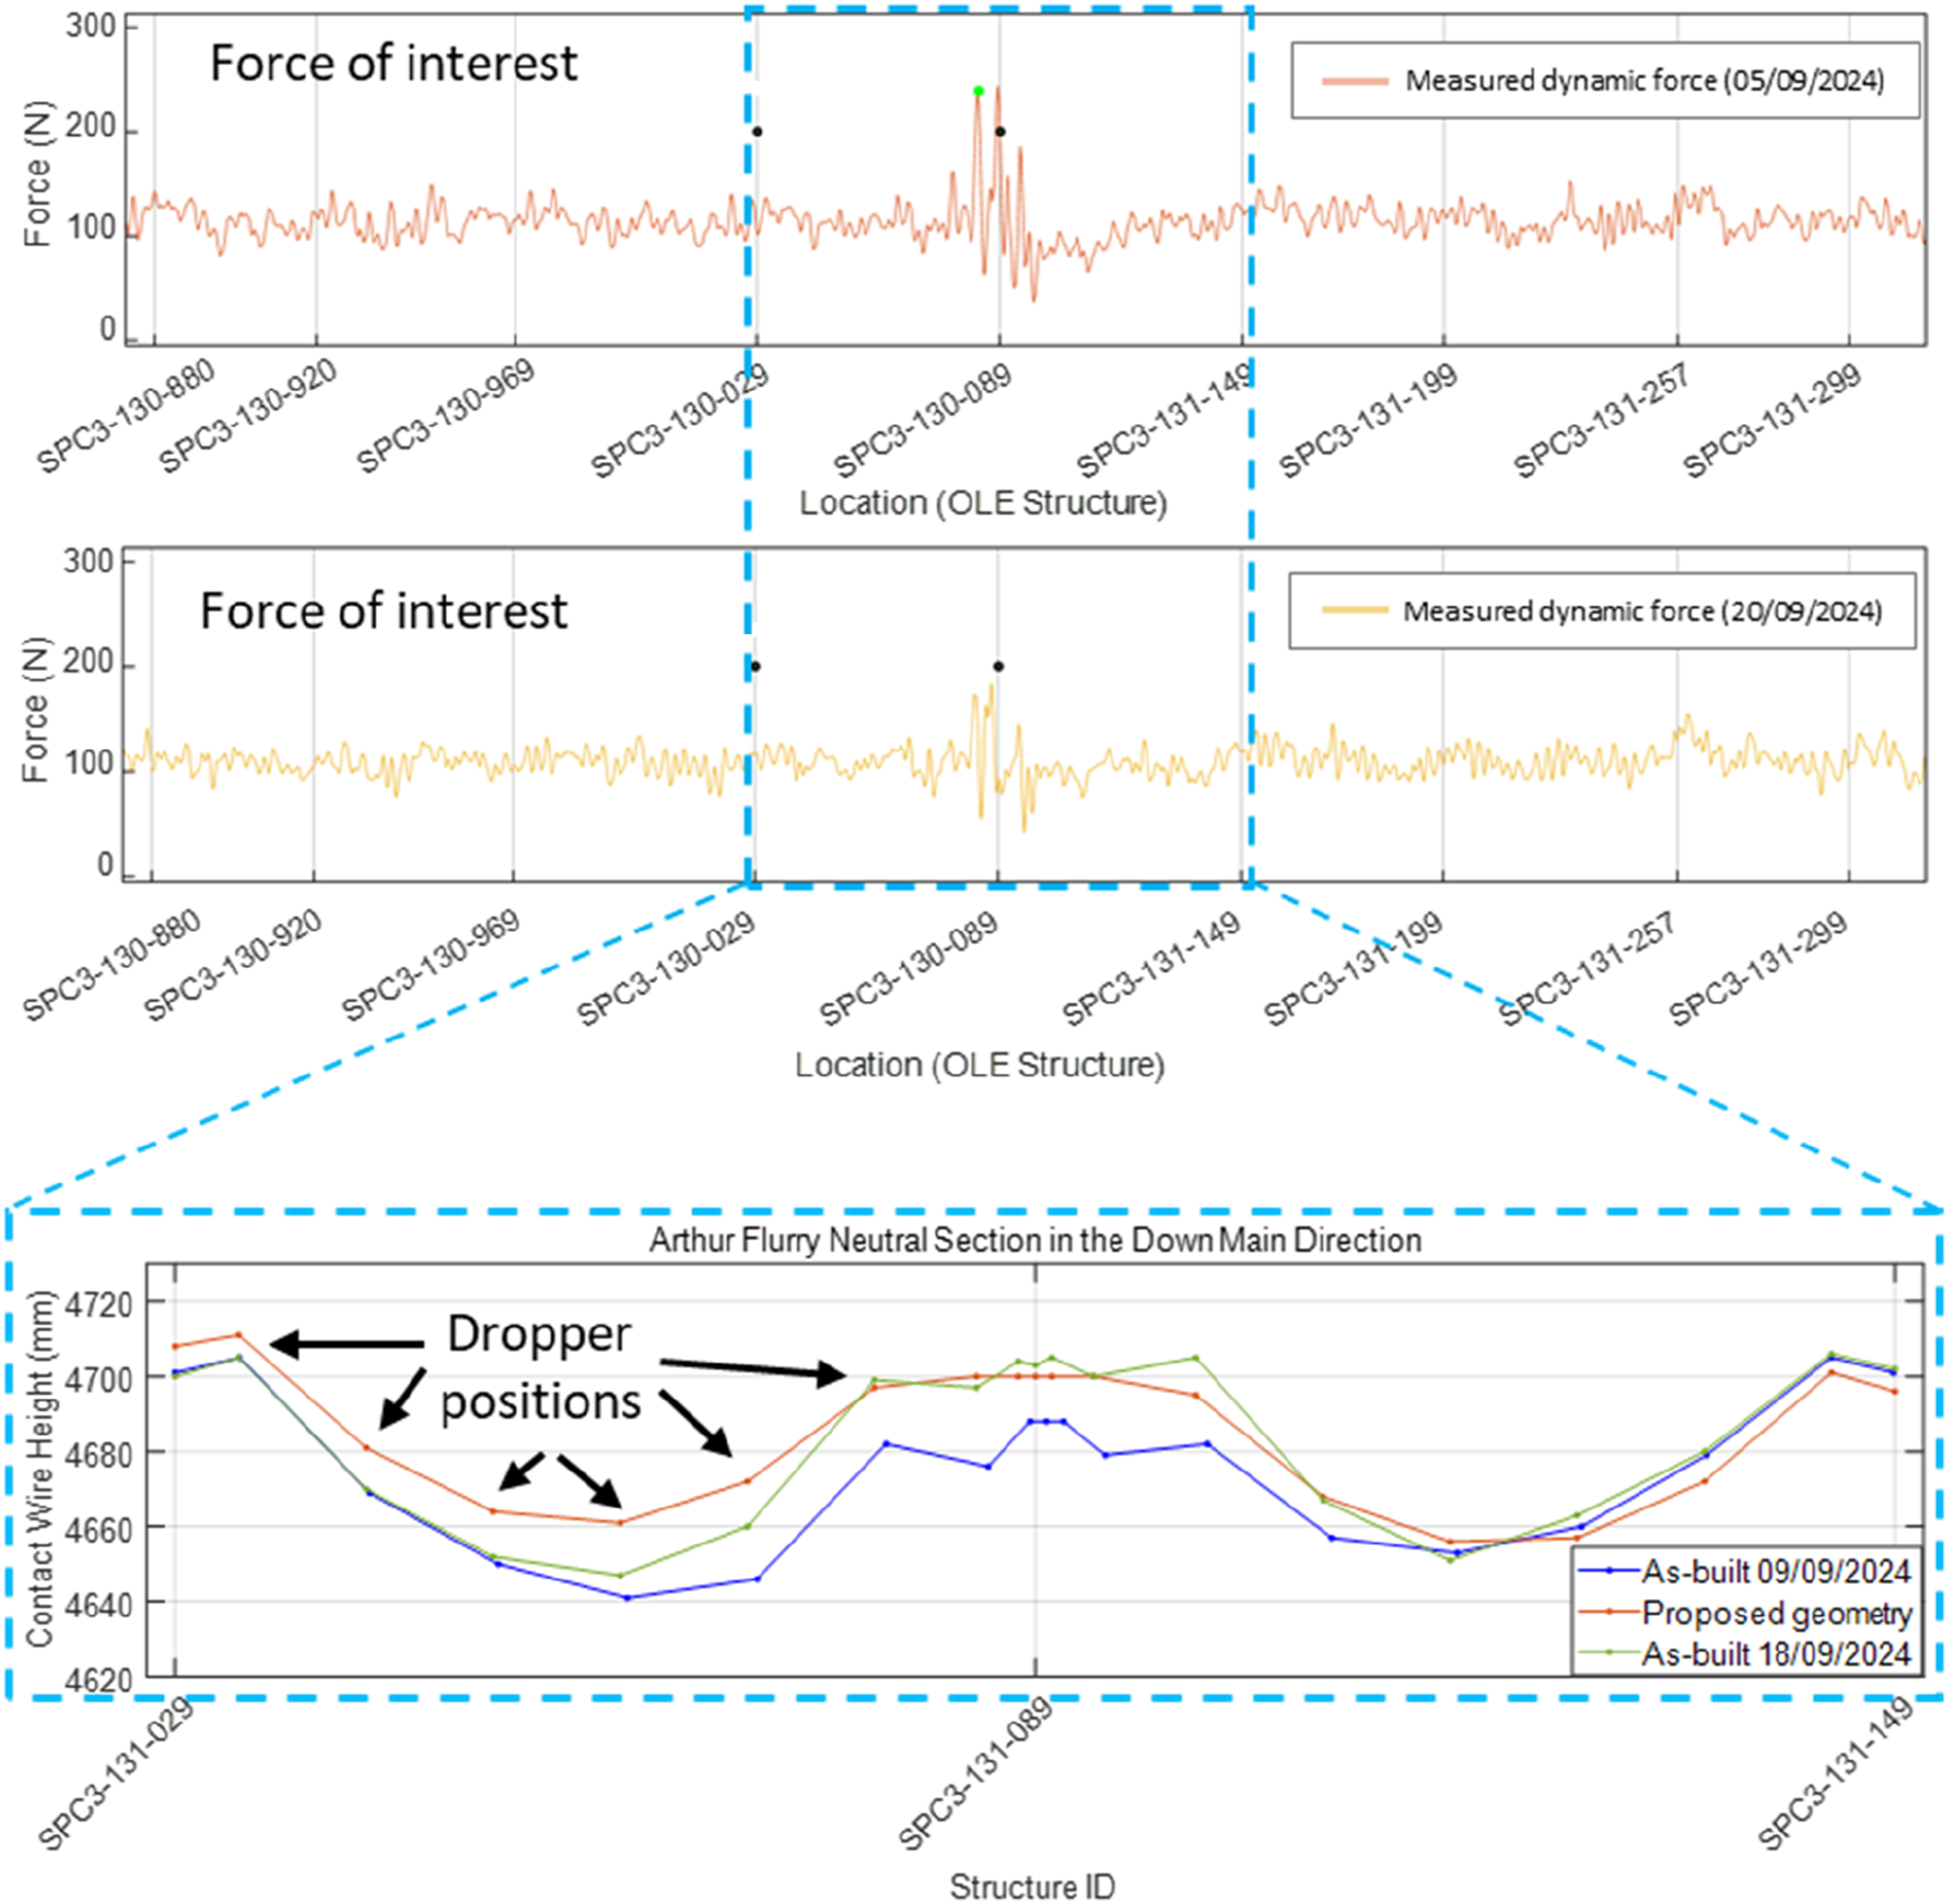
Case study II – Wire ‘kink’
Another notable example was around an observed wire geometry non-conformance that was identified by the OLE StAT and classified as a wire ‘kink’. It is important to note that the identified geometric exceedance falls within the permissible system tolerances, and therefore it was deemed that no further rectification necessary. Instrumented pantograph testing identified a significant force feature at the exact location, however this increase does not exceed permissible force thresholds and therefore this is not further addressed by construction. Figure 5 presents the data analysis along with a photograph from the wiring-train video which clearly shows the mapped defect on the CW profile. Wire ‘kink’ example (a) P-OLE analysis, (b) site observation.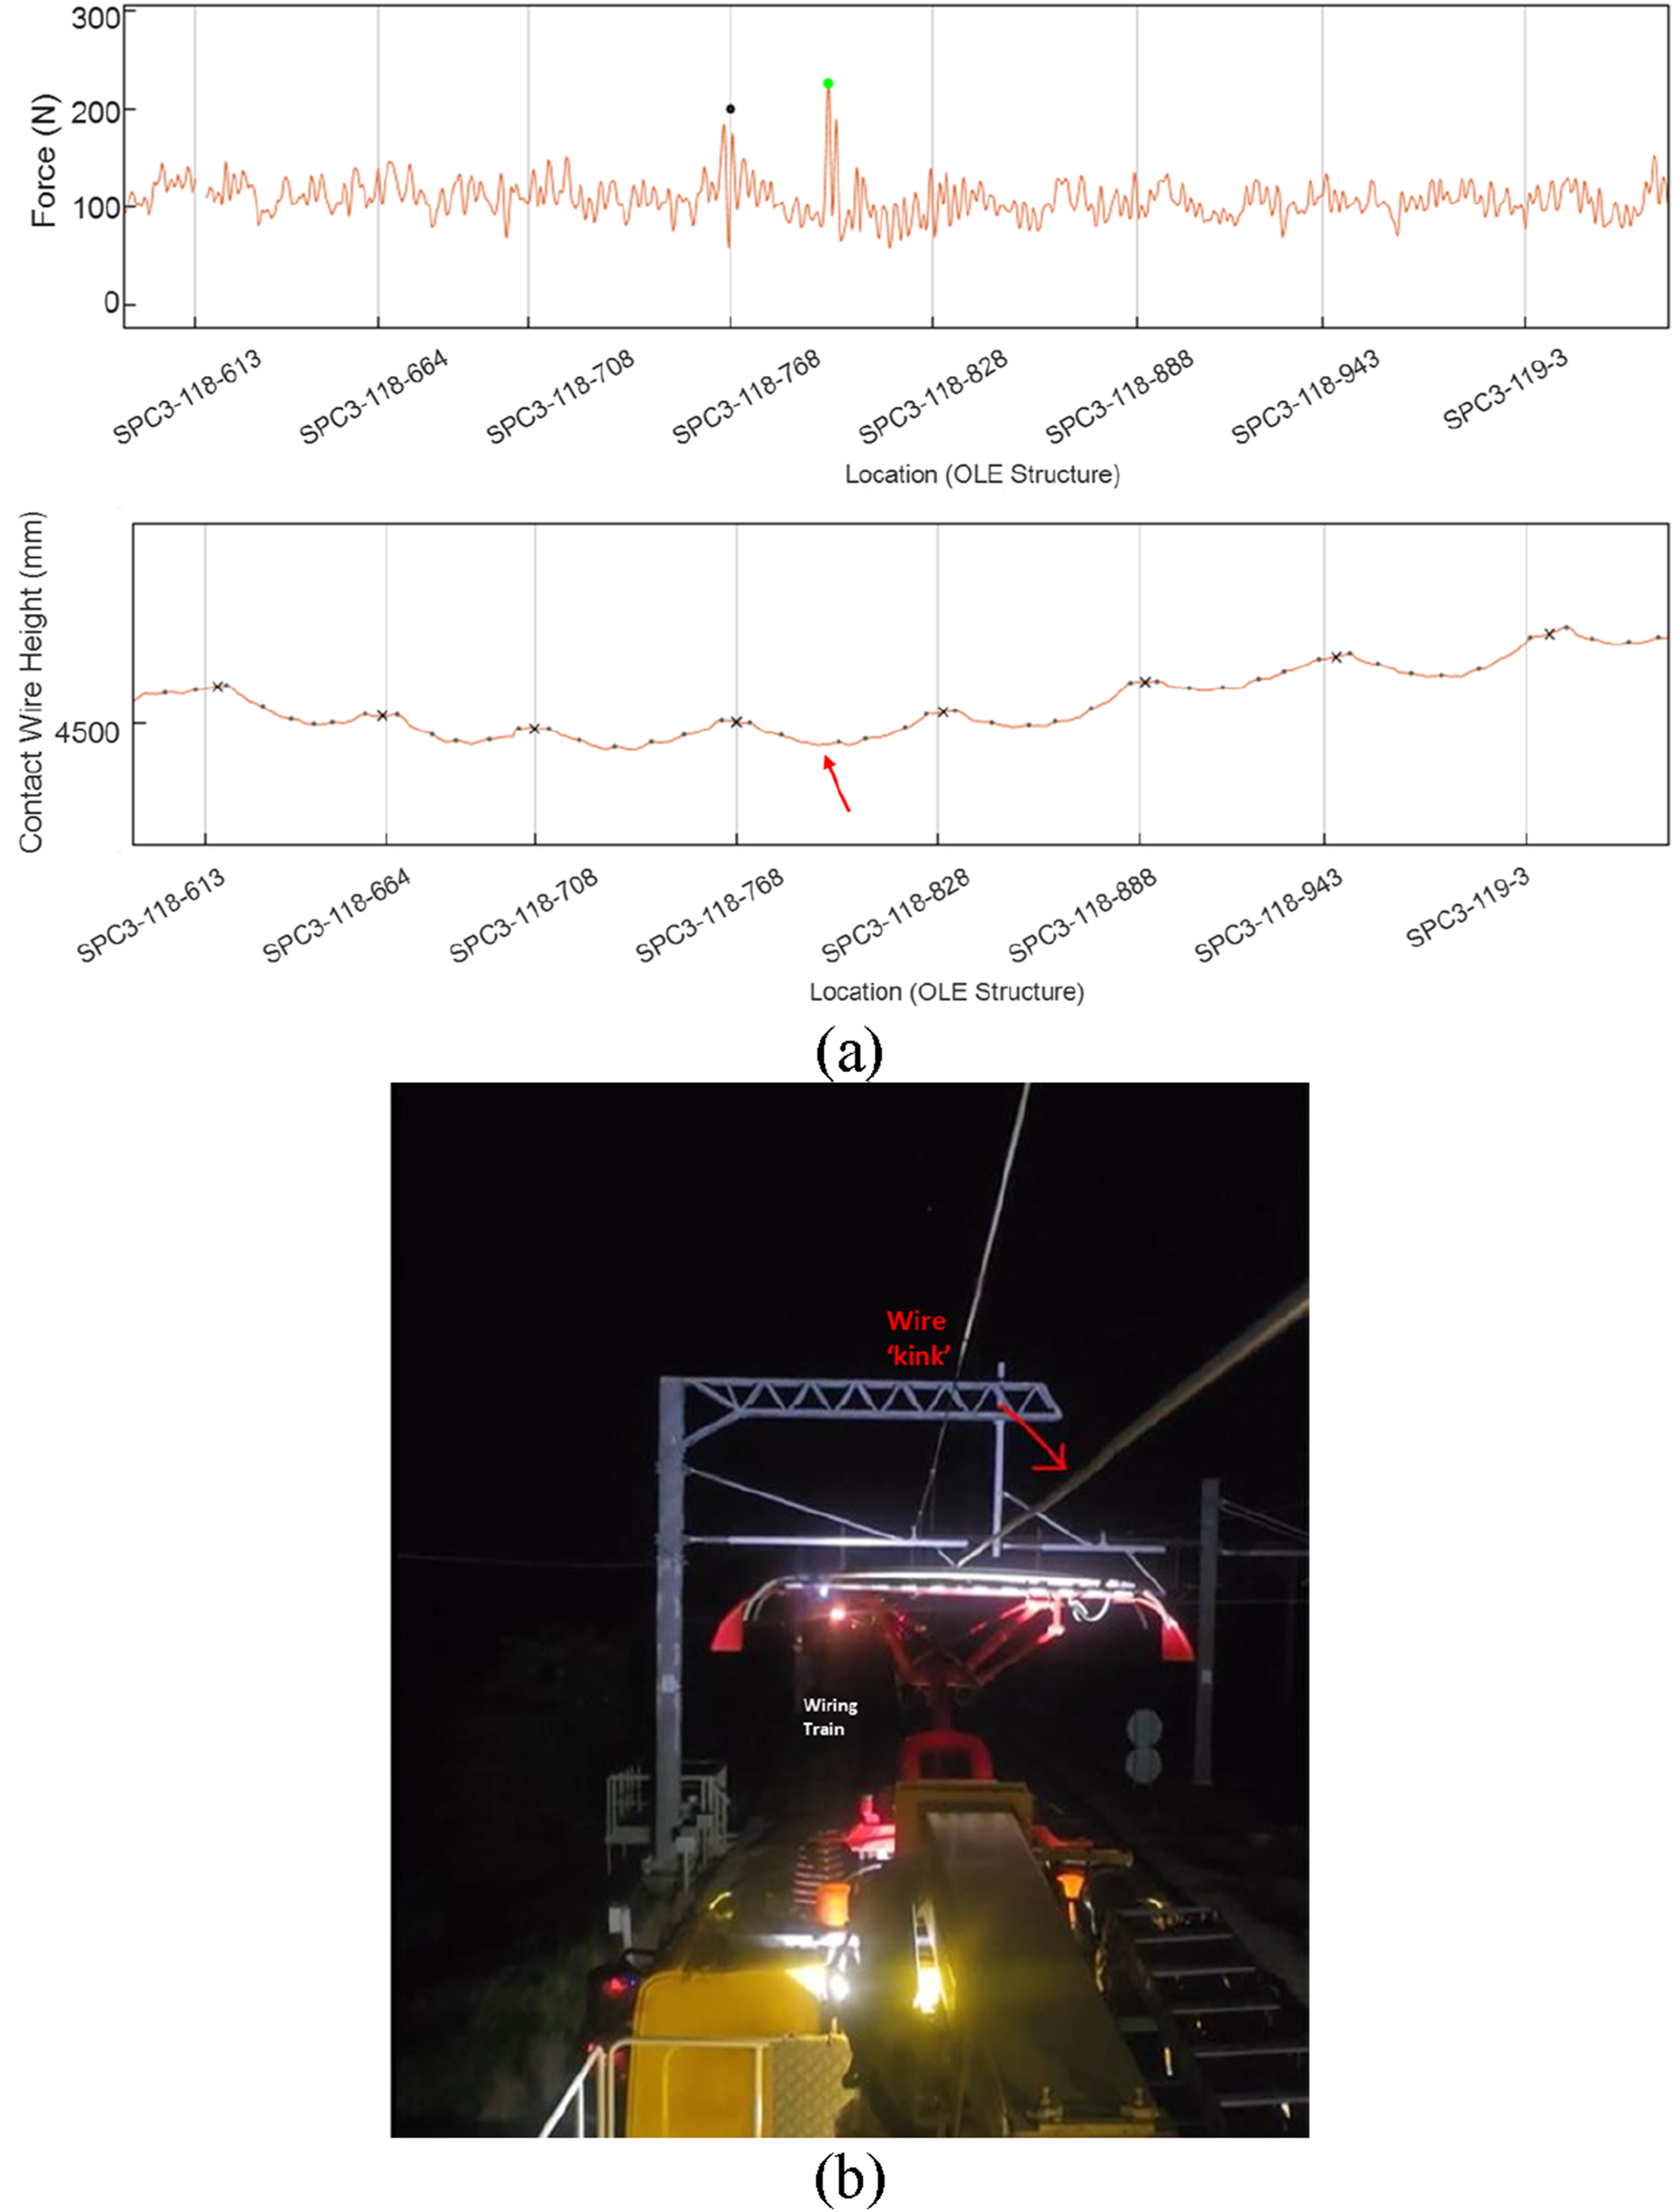
This is a clear indication that hard pass-fail NTSN criteria might hinder the ability of the project to maximise the benefit at the infrastructure interface performance and long-term monitoring of hard spots. Future refinement of the installation tolerances can further improve the value from such exercises as part of the proposed enhancement in construction assurance activities.
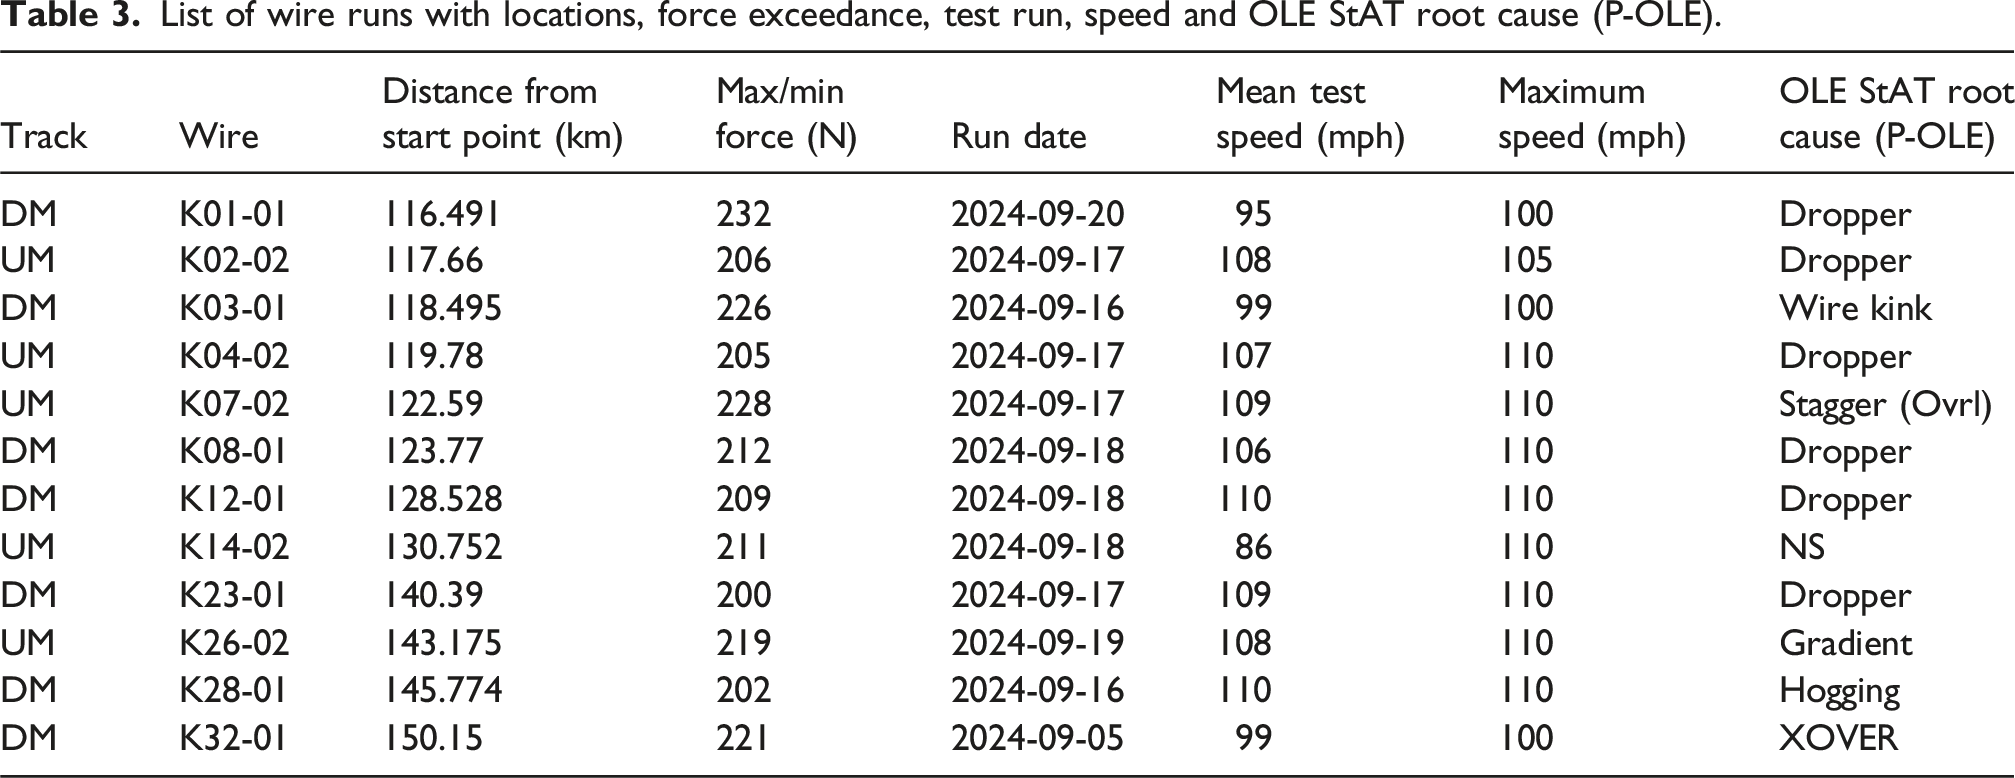
Route wide analysis
List of wire runs with locations, force exceedance, test run, speed and OLE StAT root cause (P-OLE).
Construction assurance requirements matrix
Construction assurance methodologies proposed alternative matrix.
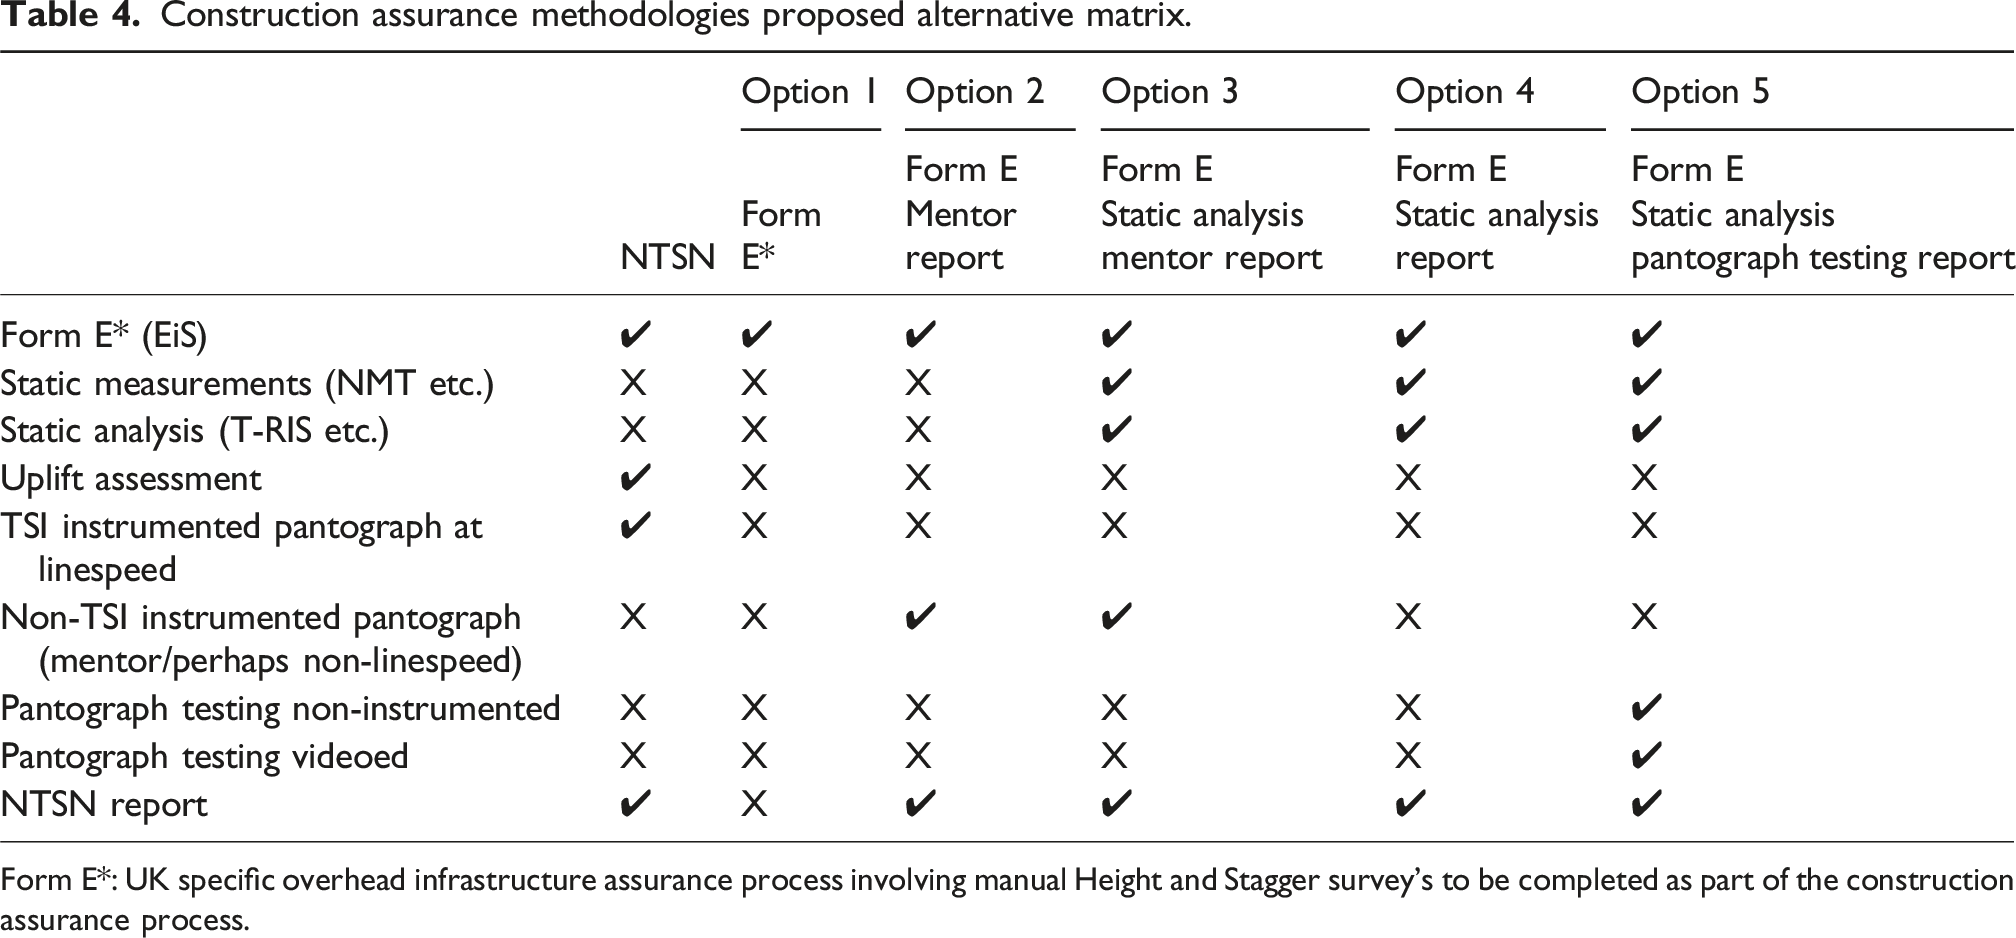
Form E*: UK specific overhead infrastructure assurance process involving manual Height and Stagger survey’s to be completed as part of the construction assurance process.
Option 1 is based on a simplified approach where a Certificate of Engineering Entry into Service is issued by the contractor signed by the Chief Responsible Engineer. This is in Appendix C of the EPF/GEN/009 Certificate of Engineering Entry Into Service - Form E (electrical power) standard in the UK. Within this framework, existing height and stagger evidence will be complemented with one measurement at the beginning and middle of every span.
Option 2 is based on the availability of Mentor, which is an instrumented Service train in compliance with EN 50317. Mentor is capable of travelling at 100 mph which when combined with appropriate analysis, is sufficient to identify any construction or design allocation errors in the route. The evidence will be subject to NTSN type report and approval with the notable difference that multiple pantograph testing or testing at maximum speed will not be a requirement. The benefit of that approach is that existing monitoring train runs are easier to plan in alignment with project completion and can thereafter be used as a benchmark to compare against later runs from the same pantograph layout.
Option 3 is based on both OLE StAT analysis as well as an EN 50317 non-TSI pan instrumented test run. This option provides higher level of granularity to pin-point exact locations and root causes of any observed exceedances in the dynamic interface data. The evidence will be subject to NTSN type report and approval.
Option 4 is solely based on the OLE StAT type analysis. It has been observed that OLE StAT can easily identify all geometric exceedances related to construction or design allocation errors. Once these errors are addressed and the influence of implemented changes are confirmed the final report will be passed on for final approval. This option does not involve any instrumented pantograph testing.
Option 5 relies on the OLE StAT type analysis to identify construction or design allocation errors, but in addition a non-instrumented pantograph test run will be required. It is proposed that CCTV footage with GPS location will be used to identify locations of contact loss in conjunction with the static analysis.
Conclusions
The decision to limit or potential eliminate traditional Test Train (TT) programme brings a significant opportunity for cost and schedule reduction in large scale electrification infrastructure projects. Typically spanning 3–4 months, TT campaigns require operational train paths, bespoke signage and extensive coordination with multiple suppliers, introducing avoidable complexity, risk, and expenditure. By contrast, modern static analysis and advanced wire profile mapping methods, such as LiDAR or existing train borne mapping capability, offer a safer, faster, and more efficient alternative.
Non-contact wire analysis methods, when deployed with appropriate accuracy thresholds, enables high-fidelity mapping of the overhead line equipment (OLE) during or post-construction. This method not only supports compliance within a refined geometric tolerance envelop, but also helps identify potential long-term operational issues, such as accelerated wear before they manifest in service. These insights can be gained without the need to run a train, reducing exposure to operational risk.
Importantly, evidence from past TT exercises shows that the deviations detected typically fall within permissible limits, reinforcing the reliability of a build-to-tolerance approach. If the system is constructed correctly and within specification, performance should be within standard deviation thresholds, rendering instrumented pantograph testing obsolete.
Beyond technical assurance, the greatest benefit lies in programme acceleration. Bypassing the TT phase allows projects to progress directly to Entry into Service and Authorisation for Placing Into Service, potentially shaving months off delivery timelines. With project management overheads often exceeding £2 million per month, the combined savings in capital expenditure and reduced burn rate underscore a compelling case for change. In complex infrastructure delivery, programme is king, and eliminating unnecessary steps like test trains can be a decisive factor in delivering faster, safer, and more cost-effective outcomes.
The proposed method provides a resolution of 0.2 m with individual analysis for each span based on the decided metrics that can accelerate required adjustments to construction. The outcome of the adjustments are subsequently verified and the final infrastructure geometry is delivered in a metadata, tabulated or dashboard format which can be used as a benchmark for maintenance. Future track movements can also be identified and cross-validated due to the data repeatability, particularly in the cases where a reference track distance to the structure can be established alongside the relative movements of the wire. This is a key benefit of such type of measurement as the wire profile can be measured throughout the lifecycle of the asset to monitor potential changes. This forms a competitive advantage over measuring interface force performance which is statistically averaged and can vary based on the available pantograph and formation, as well as external factors such as speed and weather.
Footnotes
Author note
It is important to note that the three tools outlined in this report (OLE StAT, P-OLE and D-RSS) have all been evaluated and validated by independent bodies. However further academic assessment of their performance would be welcomed. Please contact the corresponding author, or copyright holders if this is of interest.
Acknowledgements
The authors wish to express their thanks to Sam Hinks and Singaram Gandhi for the construction and design support. Instrumented pantograph data delivery was supported by Mike Lipscomb and management of the ‘Electra’ train operation was led Humphrey Willshire. Additionally, Sean Dunne and Matt Parkin are acknowledged for their active support during testing.
Funding
The authors received no financial support for the research, authorship, and/or publication of this article.
Declaration of conflicting interests
The authors declared no potential conflicts of interest with respect to the research, authorship, and/or publication of this article.