
Abstract
A novel model has been created in order to investigate the use of onboard energy storage to remove the exposed conductor rail from stations in top contact third rail electrified systems and instead use an onboard energy storage system to power the train in to and out from the station with discontinuous electrification. Top contact third rail electrified systems are an alternative electrification method to overhead line equipment, however due to their exposed conductor rail there is a significant safety concern, despite being a potentially cheaper method of electrification. For example, in Great Britain (GB) the safety concerns have created a presumption against expansion of top contact conductor systems. Of the major injuries and fatalities caused by electrocution on third rail networks in GB, 33% of these incidents are recorded as having occurred at the station. The model is able to simulate the mechanical, electrical and energy storage requirements needed for this novel discontinuous application and is able to evaluate the energy draws, requirements and losses in the application. It is found that using an energy storage system can bridge 300 m gaps in the conductor rail within stations effectively with minimal impact on the timetabled journey time and, depending on the size of the energy storage system, showed a potential to reduce energy consumption by up to 10% compared to the fully electrified system. These results demonstrate that a discontinuously electrified system can be applied on DC third rail networks to improve passenger safety, with potential for future energy savings.
Keywords
Introduction
Top contact third rail electrification
Top contact third rail systems are a common DC electrification system. In Great Britain (GB) they are used on 4468 single-track kilometers (STK) such as those in the Southern region, London and & Merseyside. Although an established system of electrification,1–3 it poses a potential hazard due to the exposed live conductor rail, with risks including arc-eye and electrocution through contact with the live conductor rail. This is most accessible at stations and public level crossings as shown in Figure 1. A Merseyrail Class 507 at Leasowe Station Operating on a Third Rail System with the Conductor Rail within the Station Bounds (Top) & Shoe Gear and Conductor Rail Configuration on a Top Contact Third Rail System (Bottom).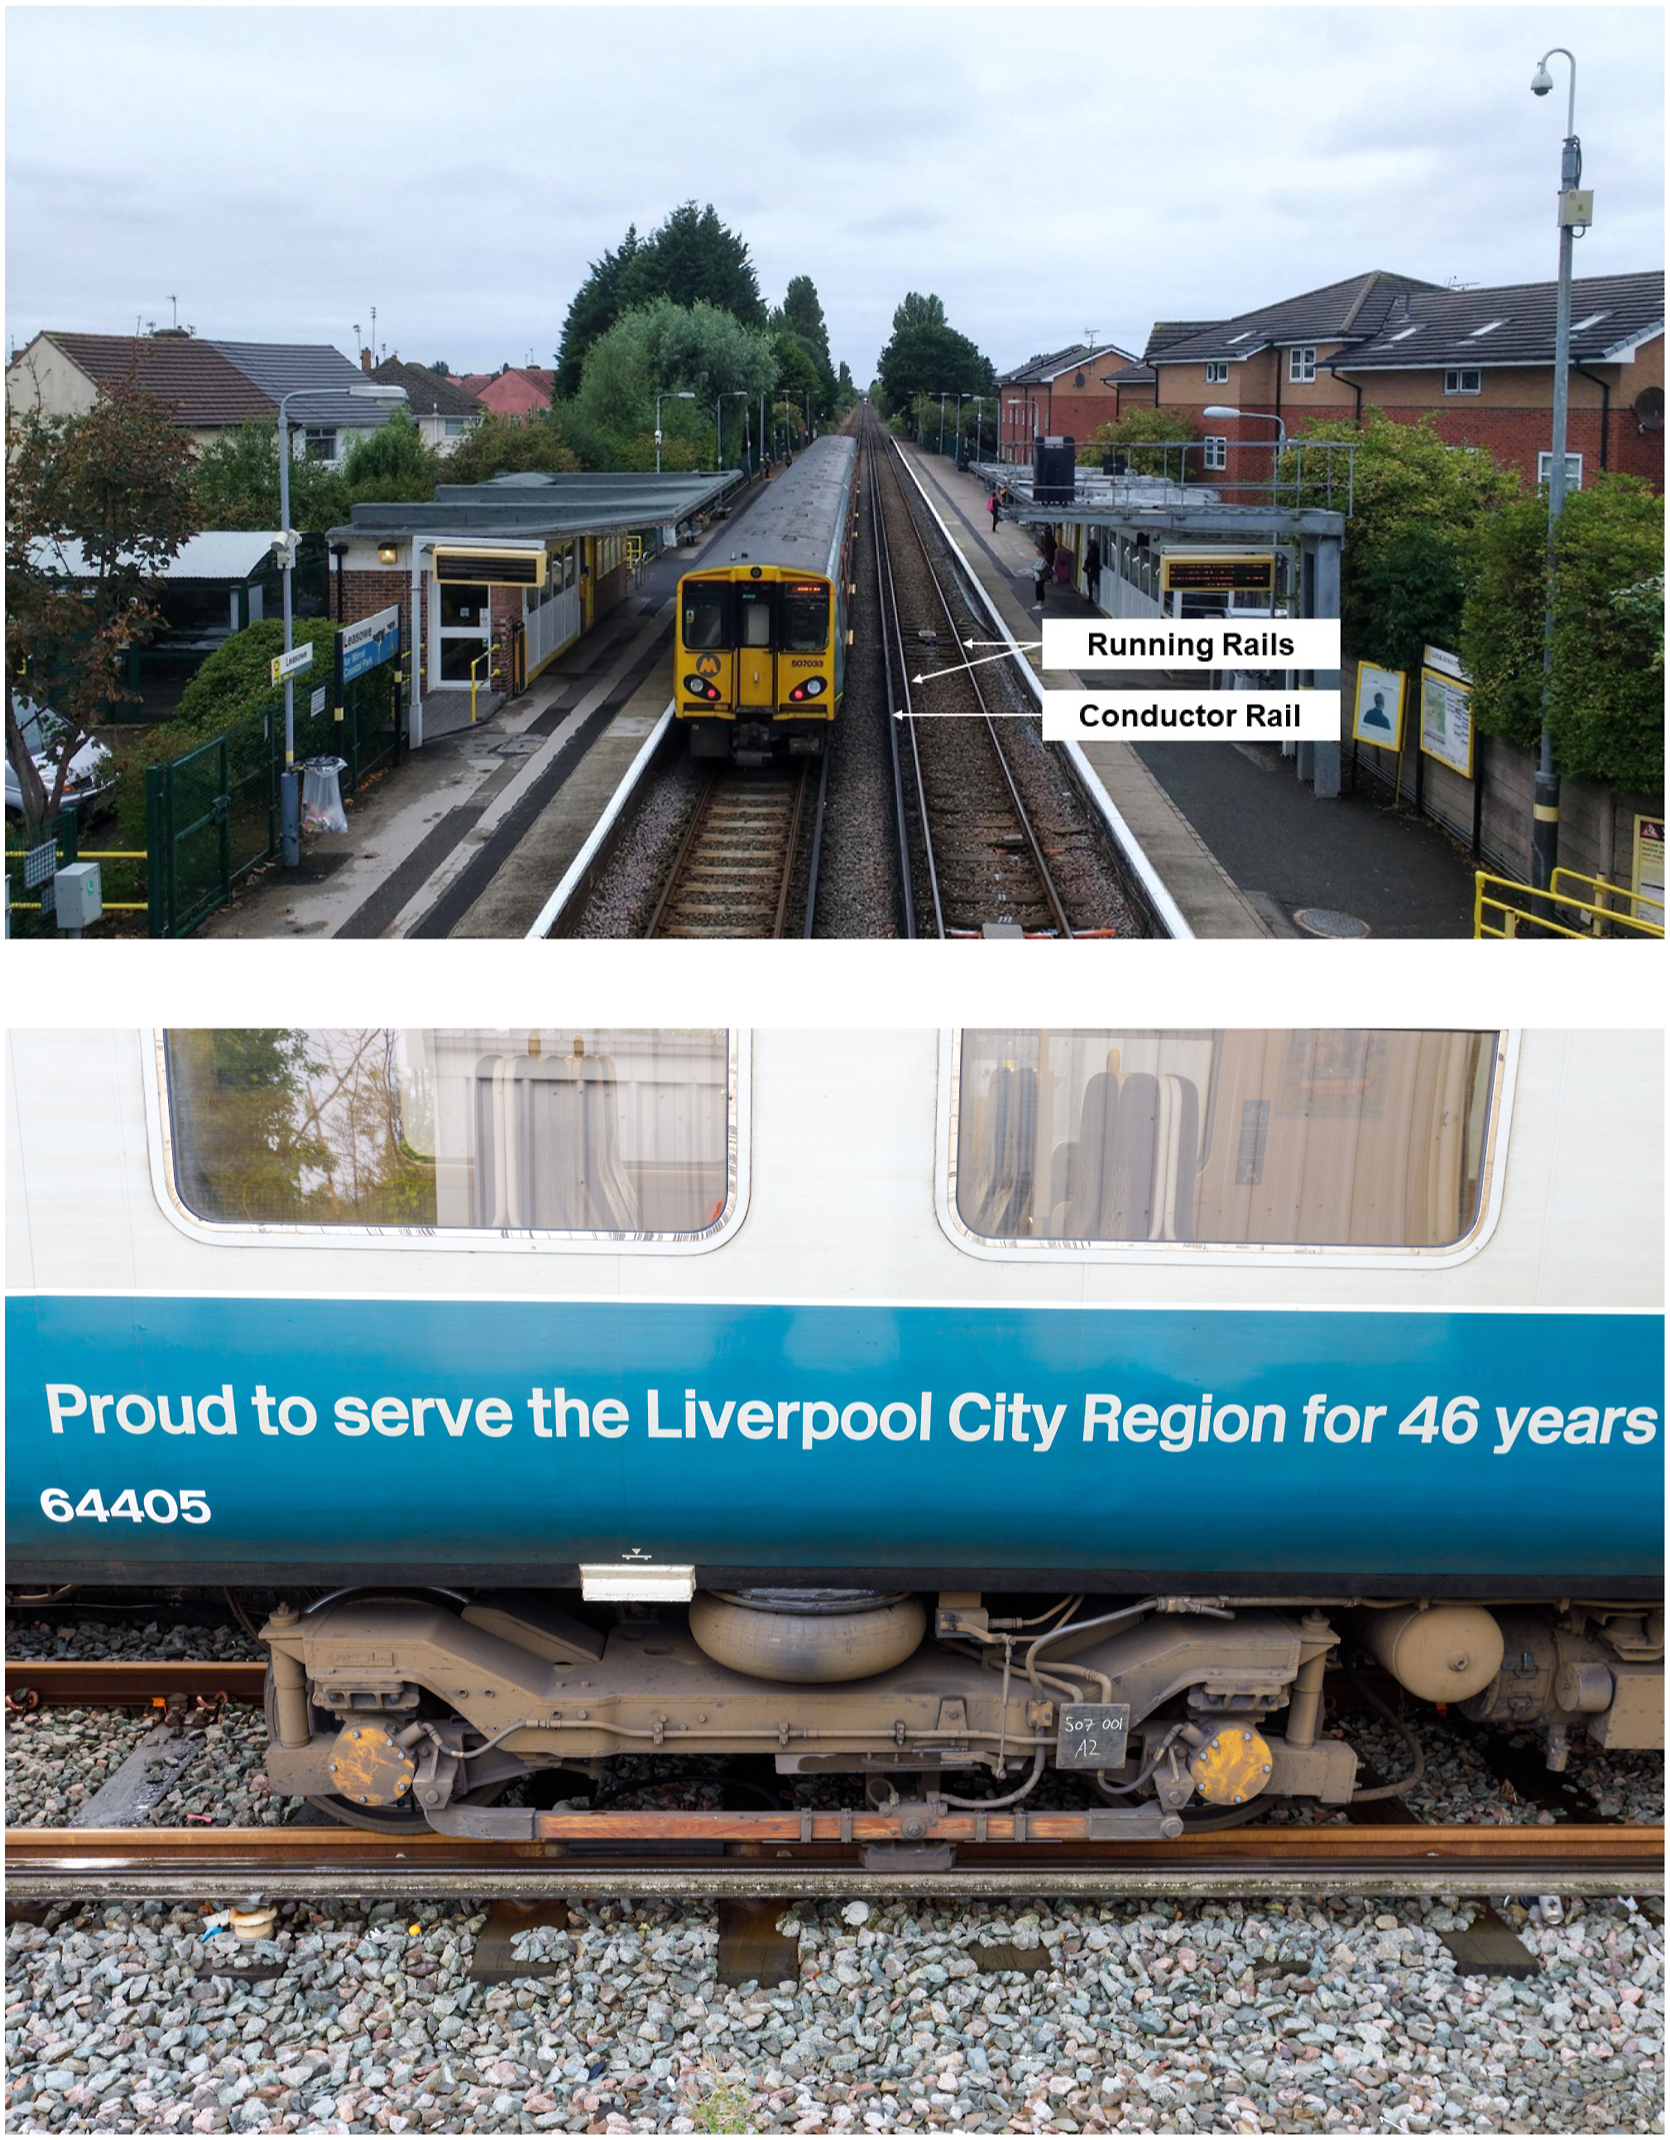
Top contact systems are comprised of a live conductor rail placed adjacent to the running rails. The train collecting the current uses a shoe that makes contact with the top of the live conductor rail. The return current then passes through the wheel sets into the running rails. Such a setup can be seen in Figure 1.
Despite the safety concerns associated with these top contact systems, they have been used extensively in rail systems across the world such as the Chicago “L”, Toronto Subway, Tainjin Metro, New York City Subway and the London Underground.
Injuries & fatalities from electrocutions on third rail networks
Due to the safety concerns associated with third rail DC systems for electrification, The Office for Rail and Road (ORR) issued a policy against the expansion of third rail networks. 4
Some solutions exist to improve the safety of third rail, such as covered conductor rails, however a novel approach of removing the conductor rail in certain locations and using an Onboard Energy Storage System (OESS) whilst in these gapped locations could achieve a similar effect. The approach in this paper is to investigate the conversion to gapped locations with energy storage.
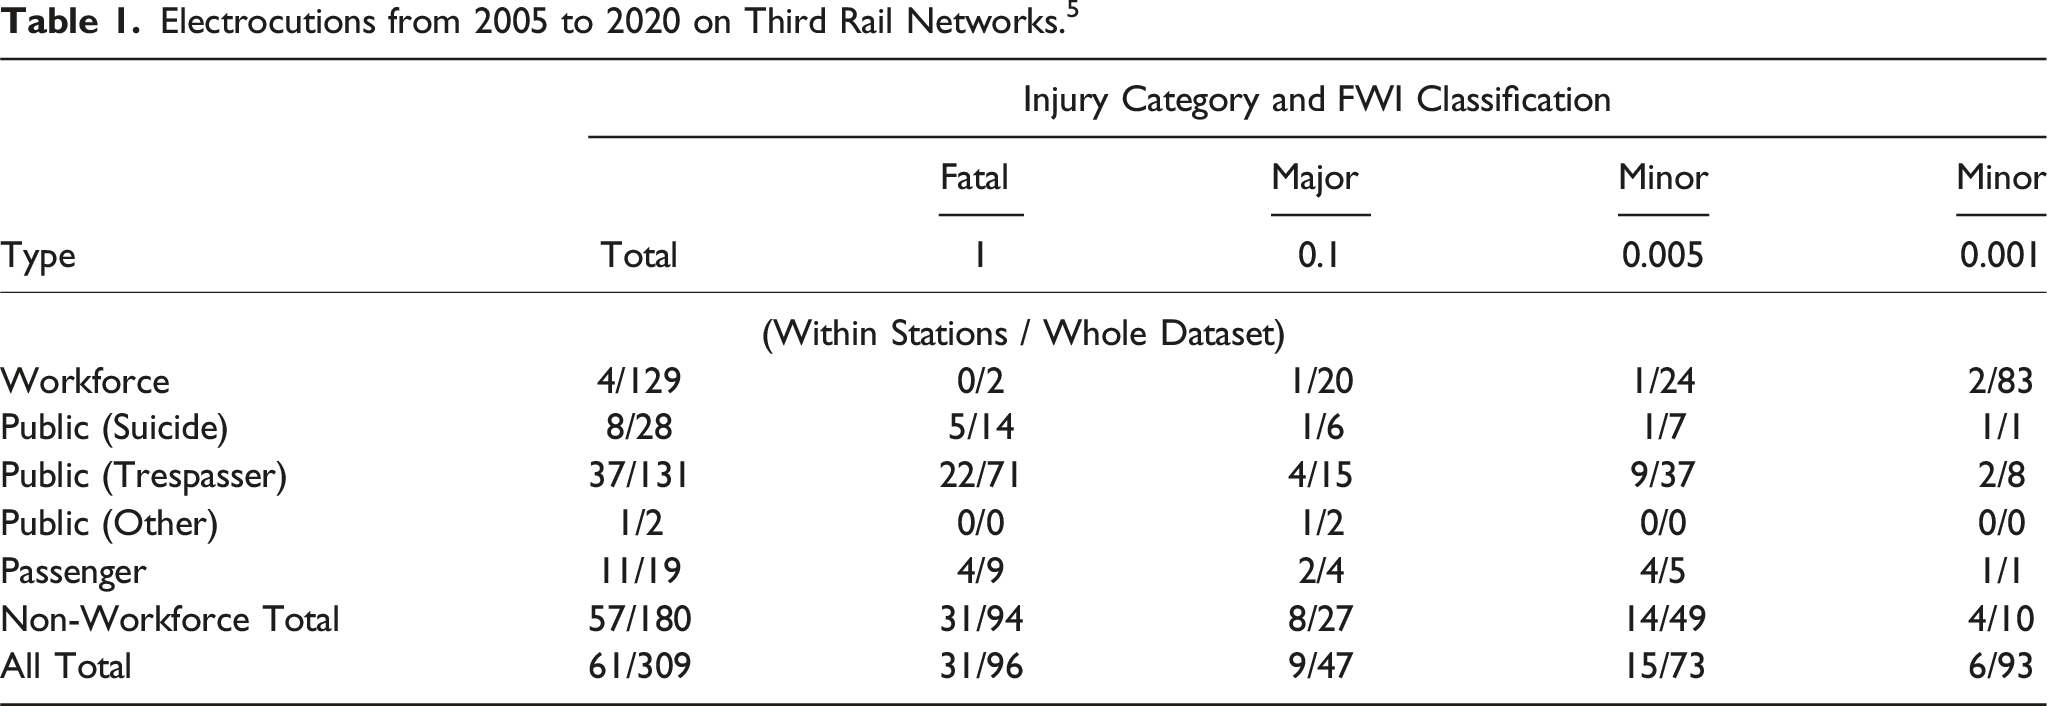
From Table 1 it can be shown that 33% of of the fatal electrocutions that occur to non-workforce persons happen within station bounds. This shows that, theoretically, if the conductor rail were to be removed from within the station bounds and an OESS were employed on the trains serving these “Gapped” stations, fatalities and injuries inflicted upon non workforce public or passengers from direct contact electrocution could be reduced by around 1/3.
Discontinuous electrification
A Railway Safety and Standards Board (RSSB) study, T1214, 5 indicated that an alternative or innovative form of traction to cover extended gapping of more than 40 m could be considered to bridge extended gaps in the conductor rail, up to and including removing the conductor rail within stations completely. This approach was assessed to have a low maturity at the time of the reports publication but with new battery powered Independently Powered Electric Multiple Units (IPEMUs) currently operating on third rail networks such as Merseyrail,6–8 a novel OESS solution could be applied in order to realise this approach.
This application would take a previously fully electrified network and convert it to a discontinuously electrified network, of which previous literature has viewed in the context of using OESS to provide traction power for a single train over a non electrified section of railway from an electrified section to another electrified section. Previous work such as that by Silmon et al. 9 approach discontinuous electrification from the position of using OESS to bridge existing electrification gaps rather than intentionally removing areas of electrification, in this case to improve safety.
A model to investigate this novel approach must be able to account for the necessary mechanical & electrical principles of a conventionally electrified DC railway system as shown in Alnuman et al.
10
or Fletcher et al.
11
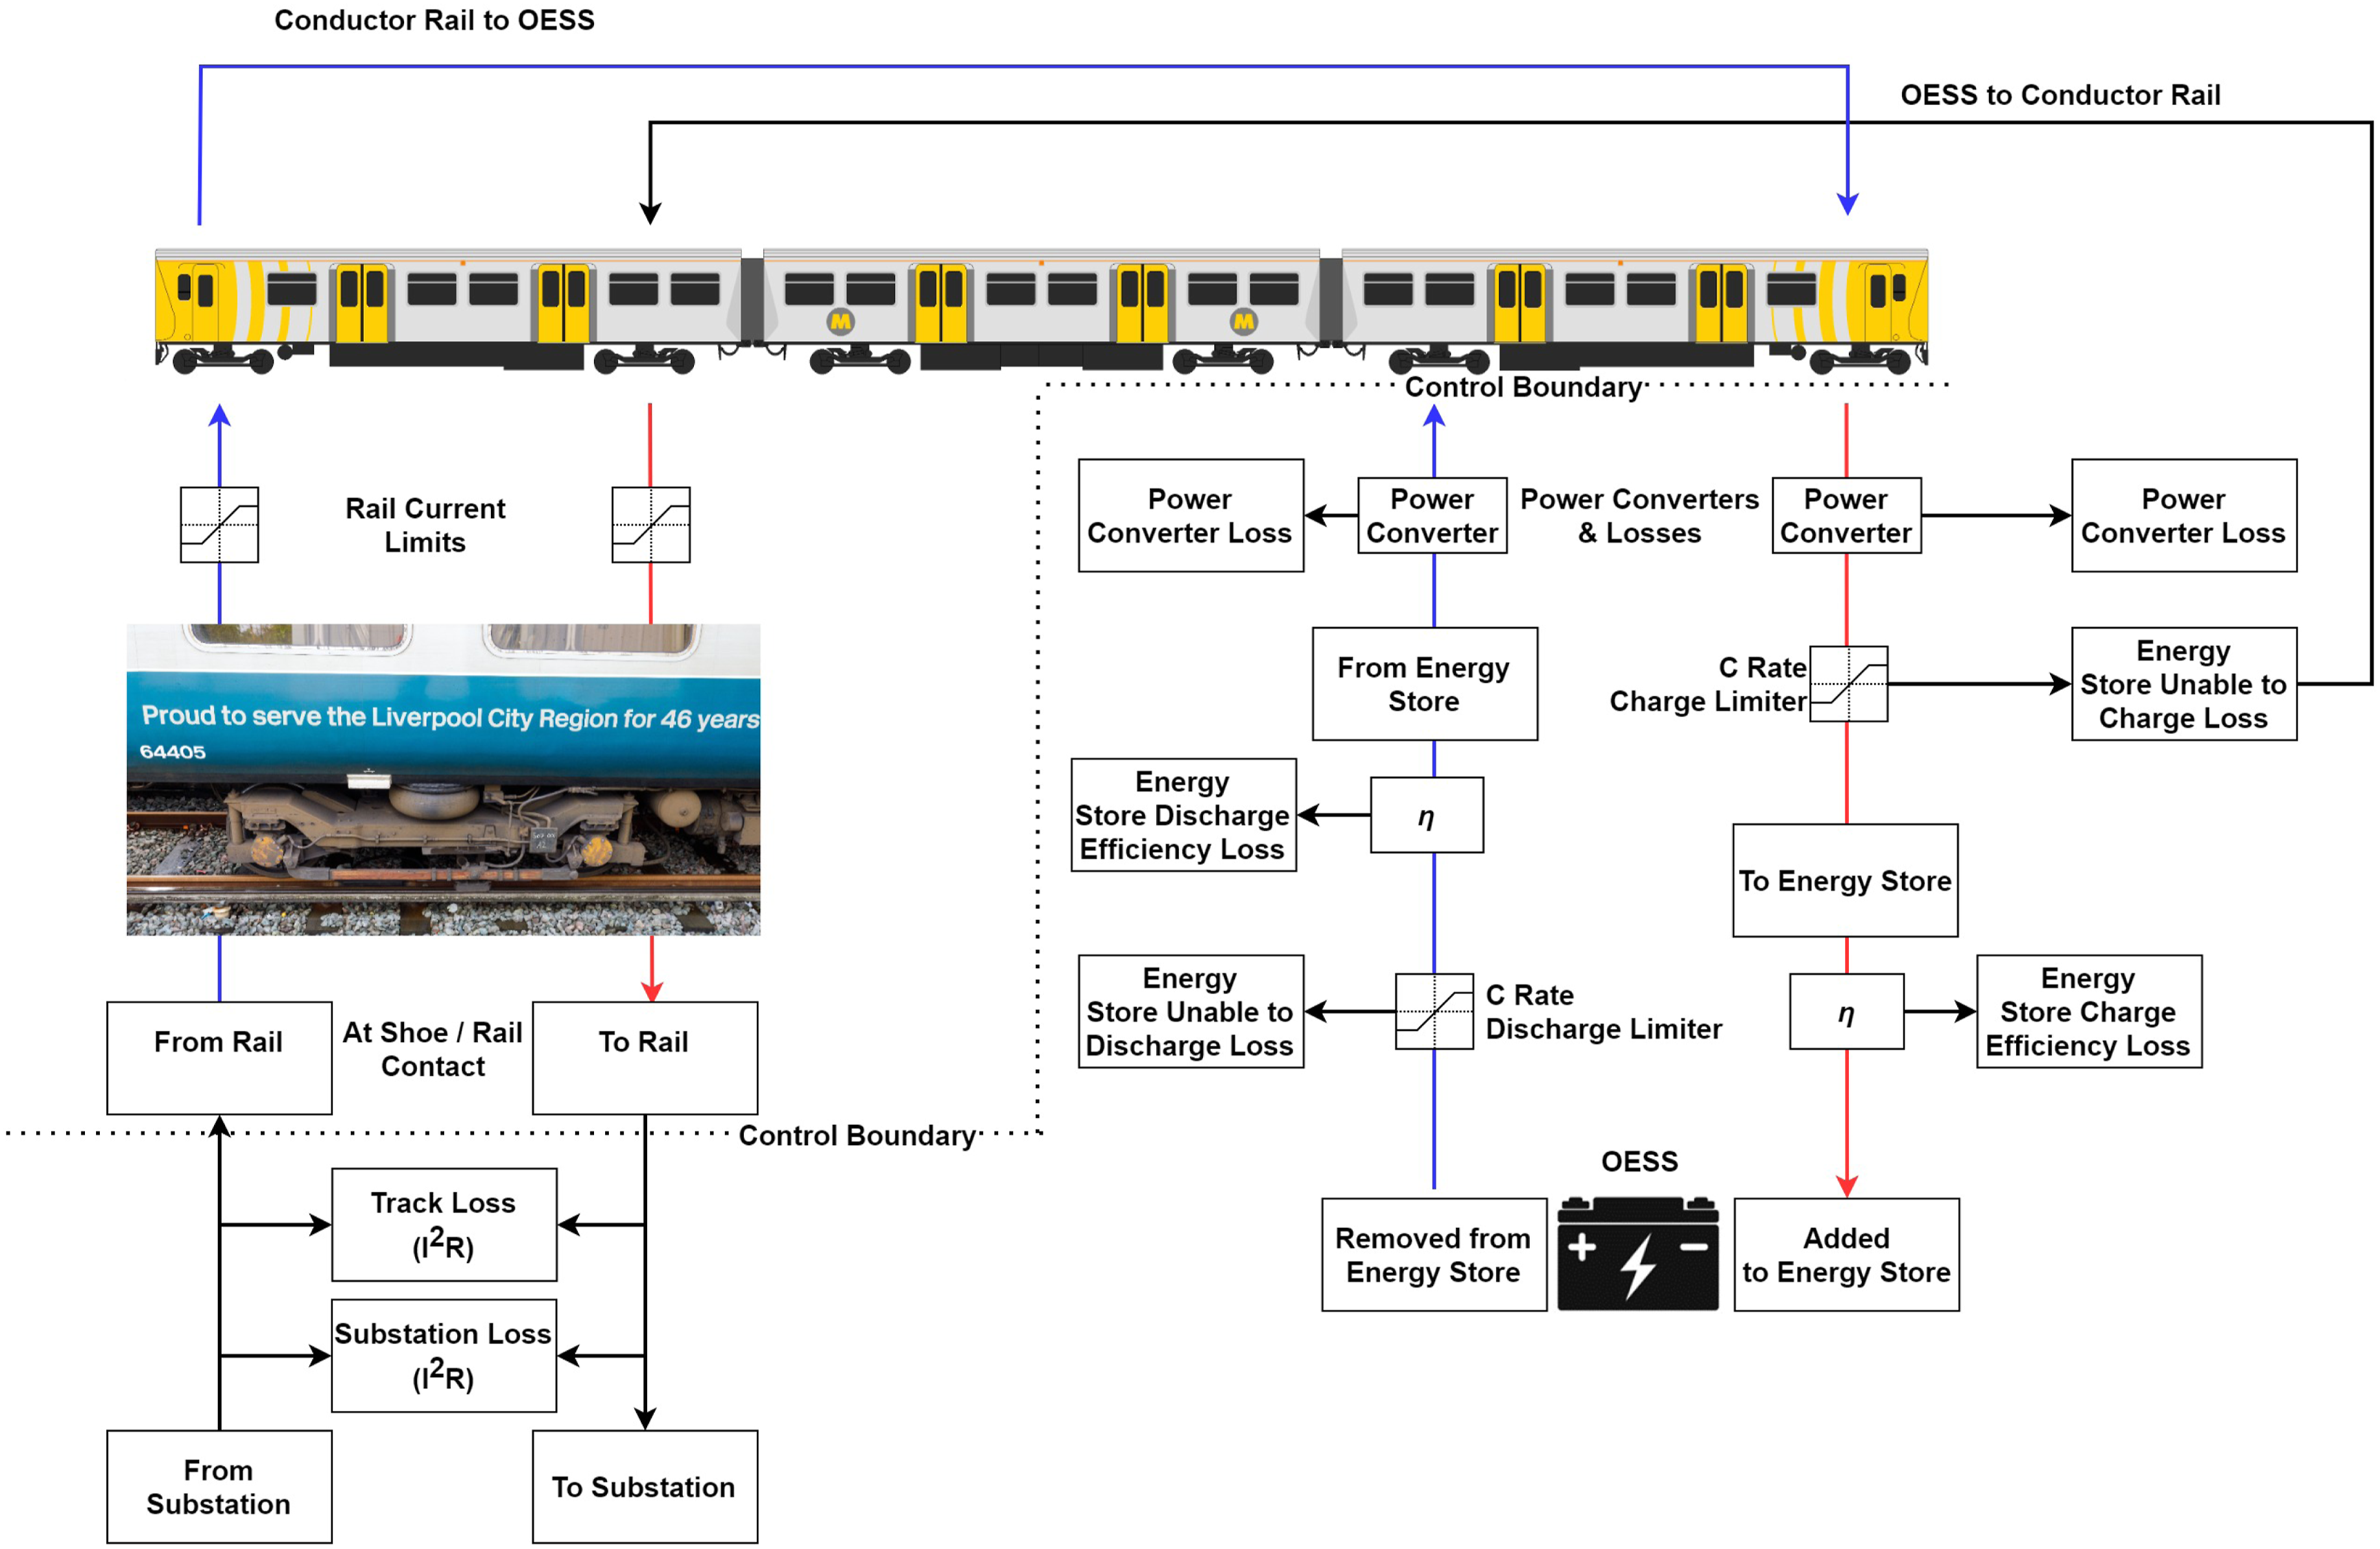
as well as incorporating the energy to and from an OESS, as shown in Figure 2. The work by Fletcher et al.
11
included energy storage but located line side in substations and, as in Alnuman et al.,
12
there were no gaps in the electrical network - it was fully electrified. These models didn’t consider onboard energy storage. System Overview of Traction Power Supply Systems (TPSS) and Energy Flows, both for Onboard Energy Storage Systems and Lineside Energy Storage Systems (LESS). Detailed Diagrams for the OESS and TPSS are shown in Figure 4.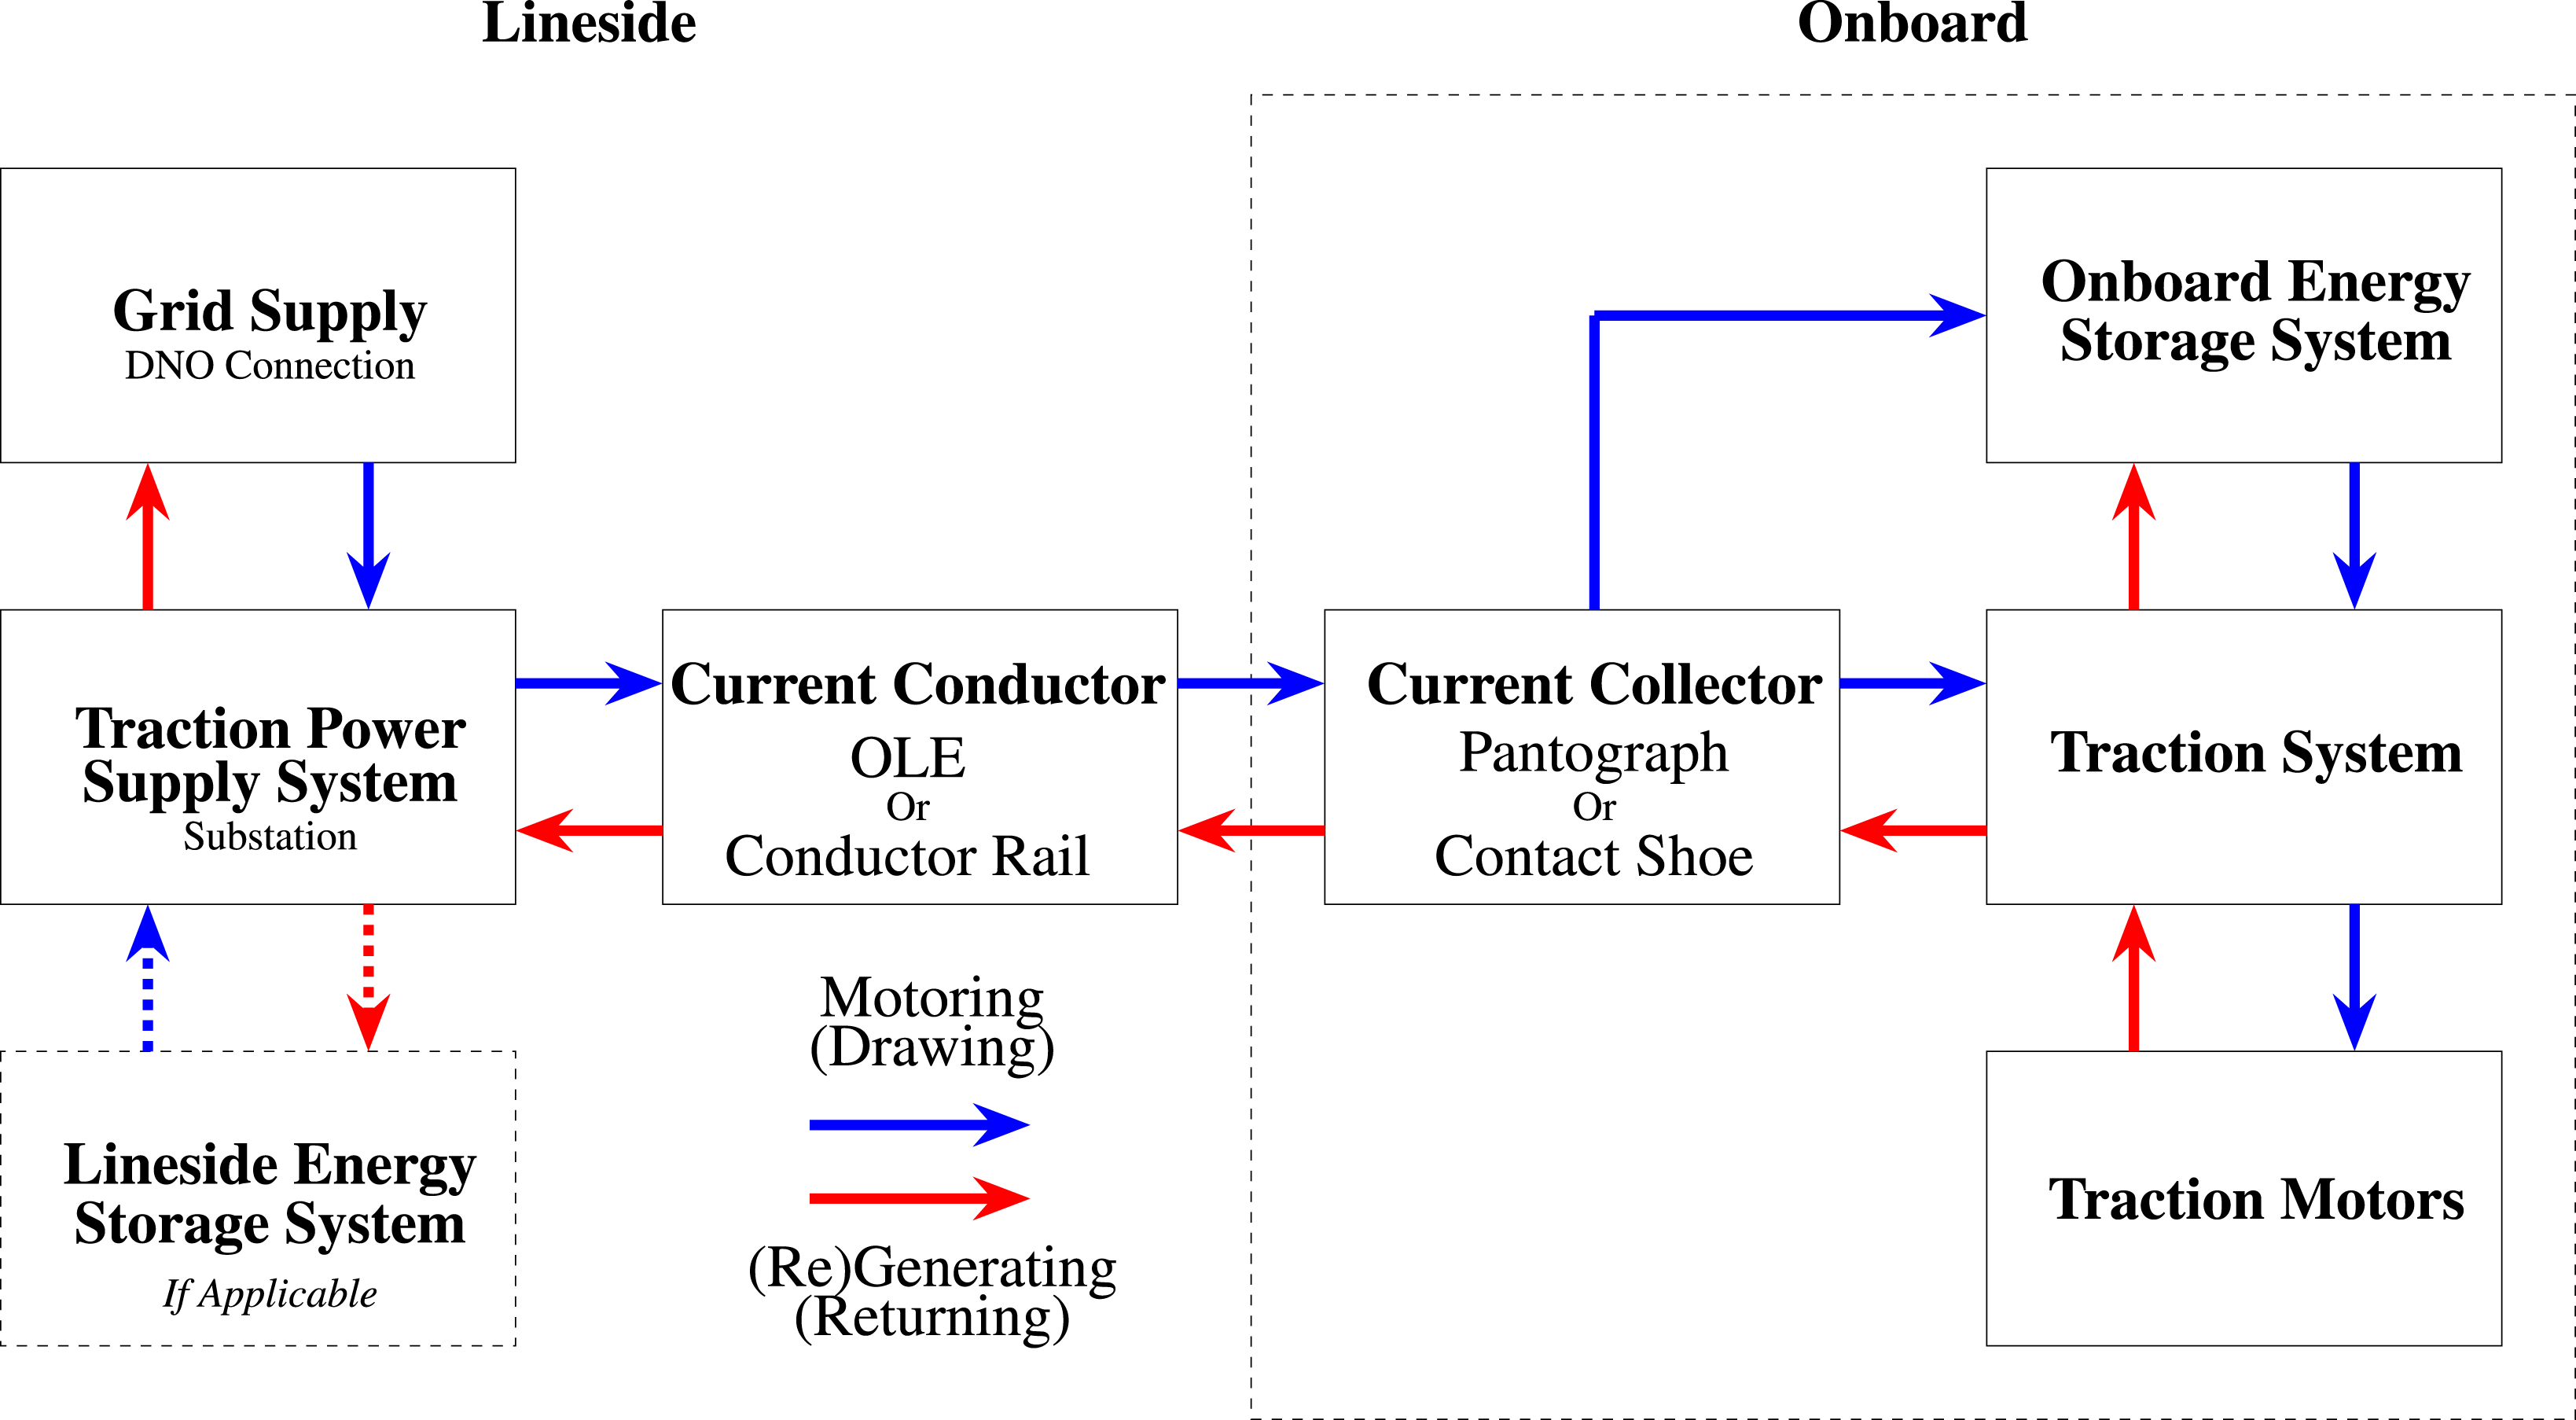
Other models presented by Silmon and Hillmansen 9 or Hoffrichter et al. 13 do consider onboard energy storage in their models, however these applications are focused on long distances of unelectrified track. In the application posed for removal of conductor rails in stations on third rail, the gaps in electrification are much smaller, being hundreds of meters as opposed to several kilometers.
Methodology
Individual models for the mechanical, electrical and energy storage elements must be individually modelled and linked together. Models may be based in either time or distance11,14,15 and train motion can be then broken down into discretized steps of either time or distance.
Distance based stepping is more suited for applications where points in distance, such as braking or acceleration points, are clearly defined, for instance in Goodwin et al. 14 or Howlett et al. 16 However, time steps were deemed more suitable by Fletcher et al. 11 for application in a model to examine synchronous energy drawn by multiple trains along a given electrical section of line.
The approach in this model utilises coupled modelling. This is the process of separating the model into multiple but linked sections. The physical model of the train with the driver and speed regulation, which takes into consideration the physical geography as inputs, is then linked to a separate electrical model which is used to measure the impact on a network or an energy storage system. 10 These separate physical and electrical models are then linked to the energy storage model.
This coupled approach has been used extensively in other literature where modelling has combined both mechanical and electrical aspects.17–19 The principles for modelling the mechanical and electrical areas detailed below follow a similar methodology to that shown by Fletcher et al., 11 Alnuman et al. 12 and Alnuman et al. 10
Mechanical model
There are several mechanical equations that govern the kinematics and forces associated with the movement of railway vehicles essential for modelling.20,21 They are adopted from Newton’s Second Law of motion, that the force applied to an object is directly proportional to the rate of change of linear momentum,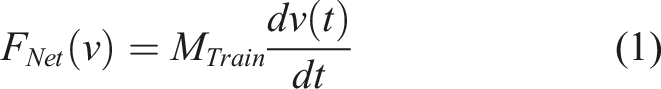
Here F
Net
(v) is the force on the train in Newtons, m the mass in kilograms, v(t) is the velocity at time t in ms−1 and t is time in seconds. When braking, rolling resistance and gradients are considered the above equation expands to: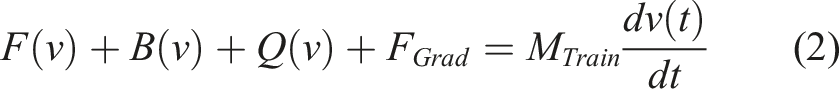
Here B(v) is the braking force in newtons, Q(v) is the rolling resistance represented by the Davis coefficient for the given train and F Grad is the additional force caused by gravity acting on the mass when the train is set at an incline.
Power p for both traction and regenerative braking can be obtained from the forces and velocity at time intervals, as given by Equations (3) and (4):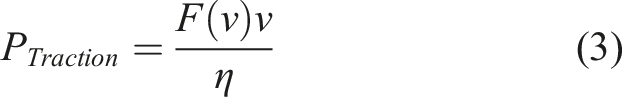


These powers for both traction and regeneration/braking can then be used to find the energy used by integrating to find the total used for a timeframe: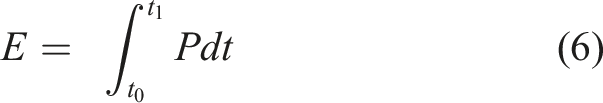
Electrical model
From the mechanical modelling side, powers, positions, and speeds can be obtained which can then be used as an input to the electrical side of the model, either for a single train or for a network. Substations are considered to be open circuit voltage sources with an internal resistance based upon work by Tomlinson
22
and Matsuda et al.
23
forming a Thevenin equivalent circuit24–26 given by the equation:
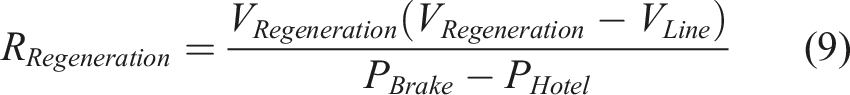
Electrical sections of a DC network can be abstracted to observe the current flows and voltages from multiple trains either drawing power or regenerating on the same electrical subsection. Some, such as Goodman & Chymera 29 consider these networks to be analogous to transmission lines with capacitances and inductances alongside resistances. Both conductor and return rails have a varying resistance based upon the distance the train is from the substations it is drawing power from. Fletcher et al. 11 represent a train drawing power as a variable resistance whose value depends upon the voltage seen at the line such that power drawn electrically is matched to the power calculated from the mechanical model, and a train regenerating to be a voltage source with an internal resistance. However, Alnuman et al. 10 model individual trains as current sources with braking resistors in parallel to the current source where the current source is calculated as a function of the power being drawn and the voltage seen by the train.
Resistances for the train are dependent upon both the power being regenerated or drawn and the voltage of the line as seen by the train and are given in Equations (8) and (9) with R
Traction
& R
Regeneration
being resistances for traction and regeneration in Ohms (Ω), P
Traction
, P
Brake
& P
Hotel
being powers in Watts (W) and V
Line
& V
Regeneration
being voltages for both the electrical line and fixed regeneration voltage in Volts (V):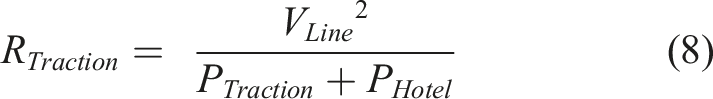
The series of equations shown allow an electrical model to be linked to a physical model in a coupled approach where both models are an output and an input to each other.
In this model, substations are considered to be reversible and that as such can absorb all the energy returned to them through the conductor rail but they do not contain any Lineside Energy Storage Systems (LESS).
To model the gapped locations at stations, the train sees the electrical infrastructure as mechanically discontinuous that is the conductor rail is physically broken or a dead section within the gapped bounds and it cannot draw or return electrical current. However the electrical infrastructure sees the mechanically discontinuous gaps as electrically continuous, as if a cable were to be run instead of a conductor rail with the same electrical properties as the conductor rail. As such no additional substations are introduced for the discontinuous system. Any mechanical or electrical impact loads from mechanically making and breaking contact with the conductor rail in this discontinuous approach are assumed to be negligible.
Each track section in this model may be fed as either a “single-end”, where the electrical section is only powered by one substation, or a “double-end”, where the electrical section has a substation at either end. 30 In the model it is assumed that only up to two substations can feed one track section with each side of the substation being electrically independent from each other. Where there is a single-end with no substation physically present, it is modeled as a high resistance with no voltage source to simulate an open circuit.
Energy storage model
Batteries relevant to railway traction have previously been modelled by Royston et al. 31 who used a MATLAB/Simulink based model to take an input power profile in a backwards modelling approach and then compared the simulated results from the model with a representative physical energy storage system.
Hutchinson & Gladwin 32 also employed a Mathworks MATLAB & Simulink approach to develop a model to incorporate degradation with the ‘Bucket Model’ principle, also used by other literature such as Gundogu & Gladwin 33 or Alnuman et al. 12 This approach of using a bucket model means an energy storage system can be treated as an integrator where energy is either added or subtracted from the store at time intervals. Hutchinson & Gladwin 32 then were able to add more complex systems such as self-discharge, degradation and efficiencies around this core part of the model.
Bauer et al. 34 instead model the battery as an equivalent electric circuit and use SoC cycles to be the determining factor for degradation. Novak M and Novak Z 35 also use equivalent circuit modelling to model an Lithium-Titanate Oxide (LTO) and evaluate the merits of the number of Resistor–Capacitor (RC) parallel networks used in the model, where networks with 2 or 3 RC elements were found to be suitable. This approach is suited to evaluating one specific type of cell when the parameters of the equivalent circuit are known but the approach favoured by Hutchinson & Gladwin, 32 Gundogu & Gladwin 33 and Alnuman et al. 12 allows more versatility when modelling between different energy storage systems.
For the current model a bucket store similar to Hutchinson & Gladwin 32 and Royston et al. 31 has been chosen due to the flexibility it offers when investigating different types of energy storage system. This approach allows the properties of different stores being represented without the need for complex individual modelling.
Model principles
As the model is designed to investigate energy consumption of a train with an OESS, a time stepped approach was deemed best suited. This allows the model of the OESS, electrical draws, and physical kinematics to be connected together and synchronized. An overview of operation is shown in Figure 3. Model Procedural Overview (Top) & OESS Management System (Bottom). Energy Flow Diagram for the Developed Model. This Expands on the Overview in Figure 2 with Respect to the OESS and TPSS. Contains material reproduced from Wikimedia Commons licensed under CC BY-SA 3.0.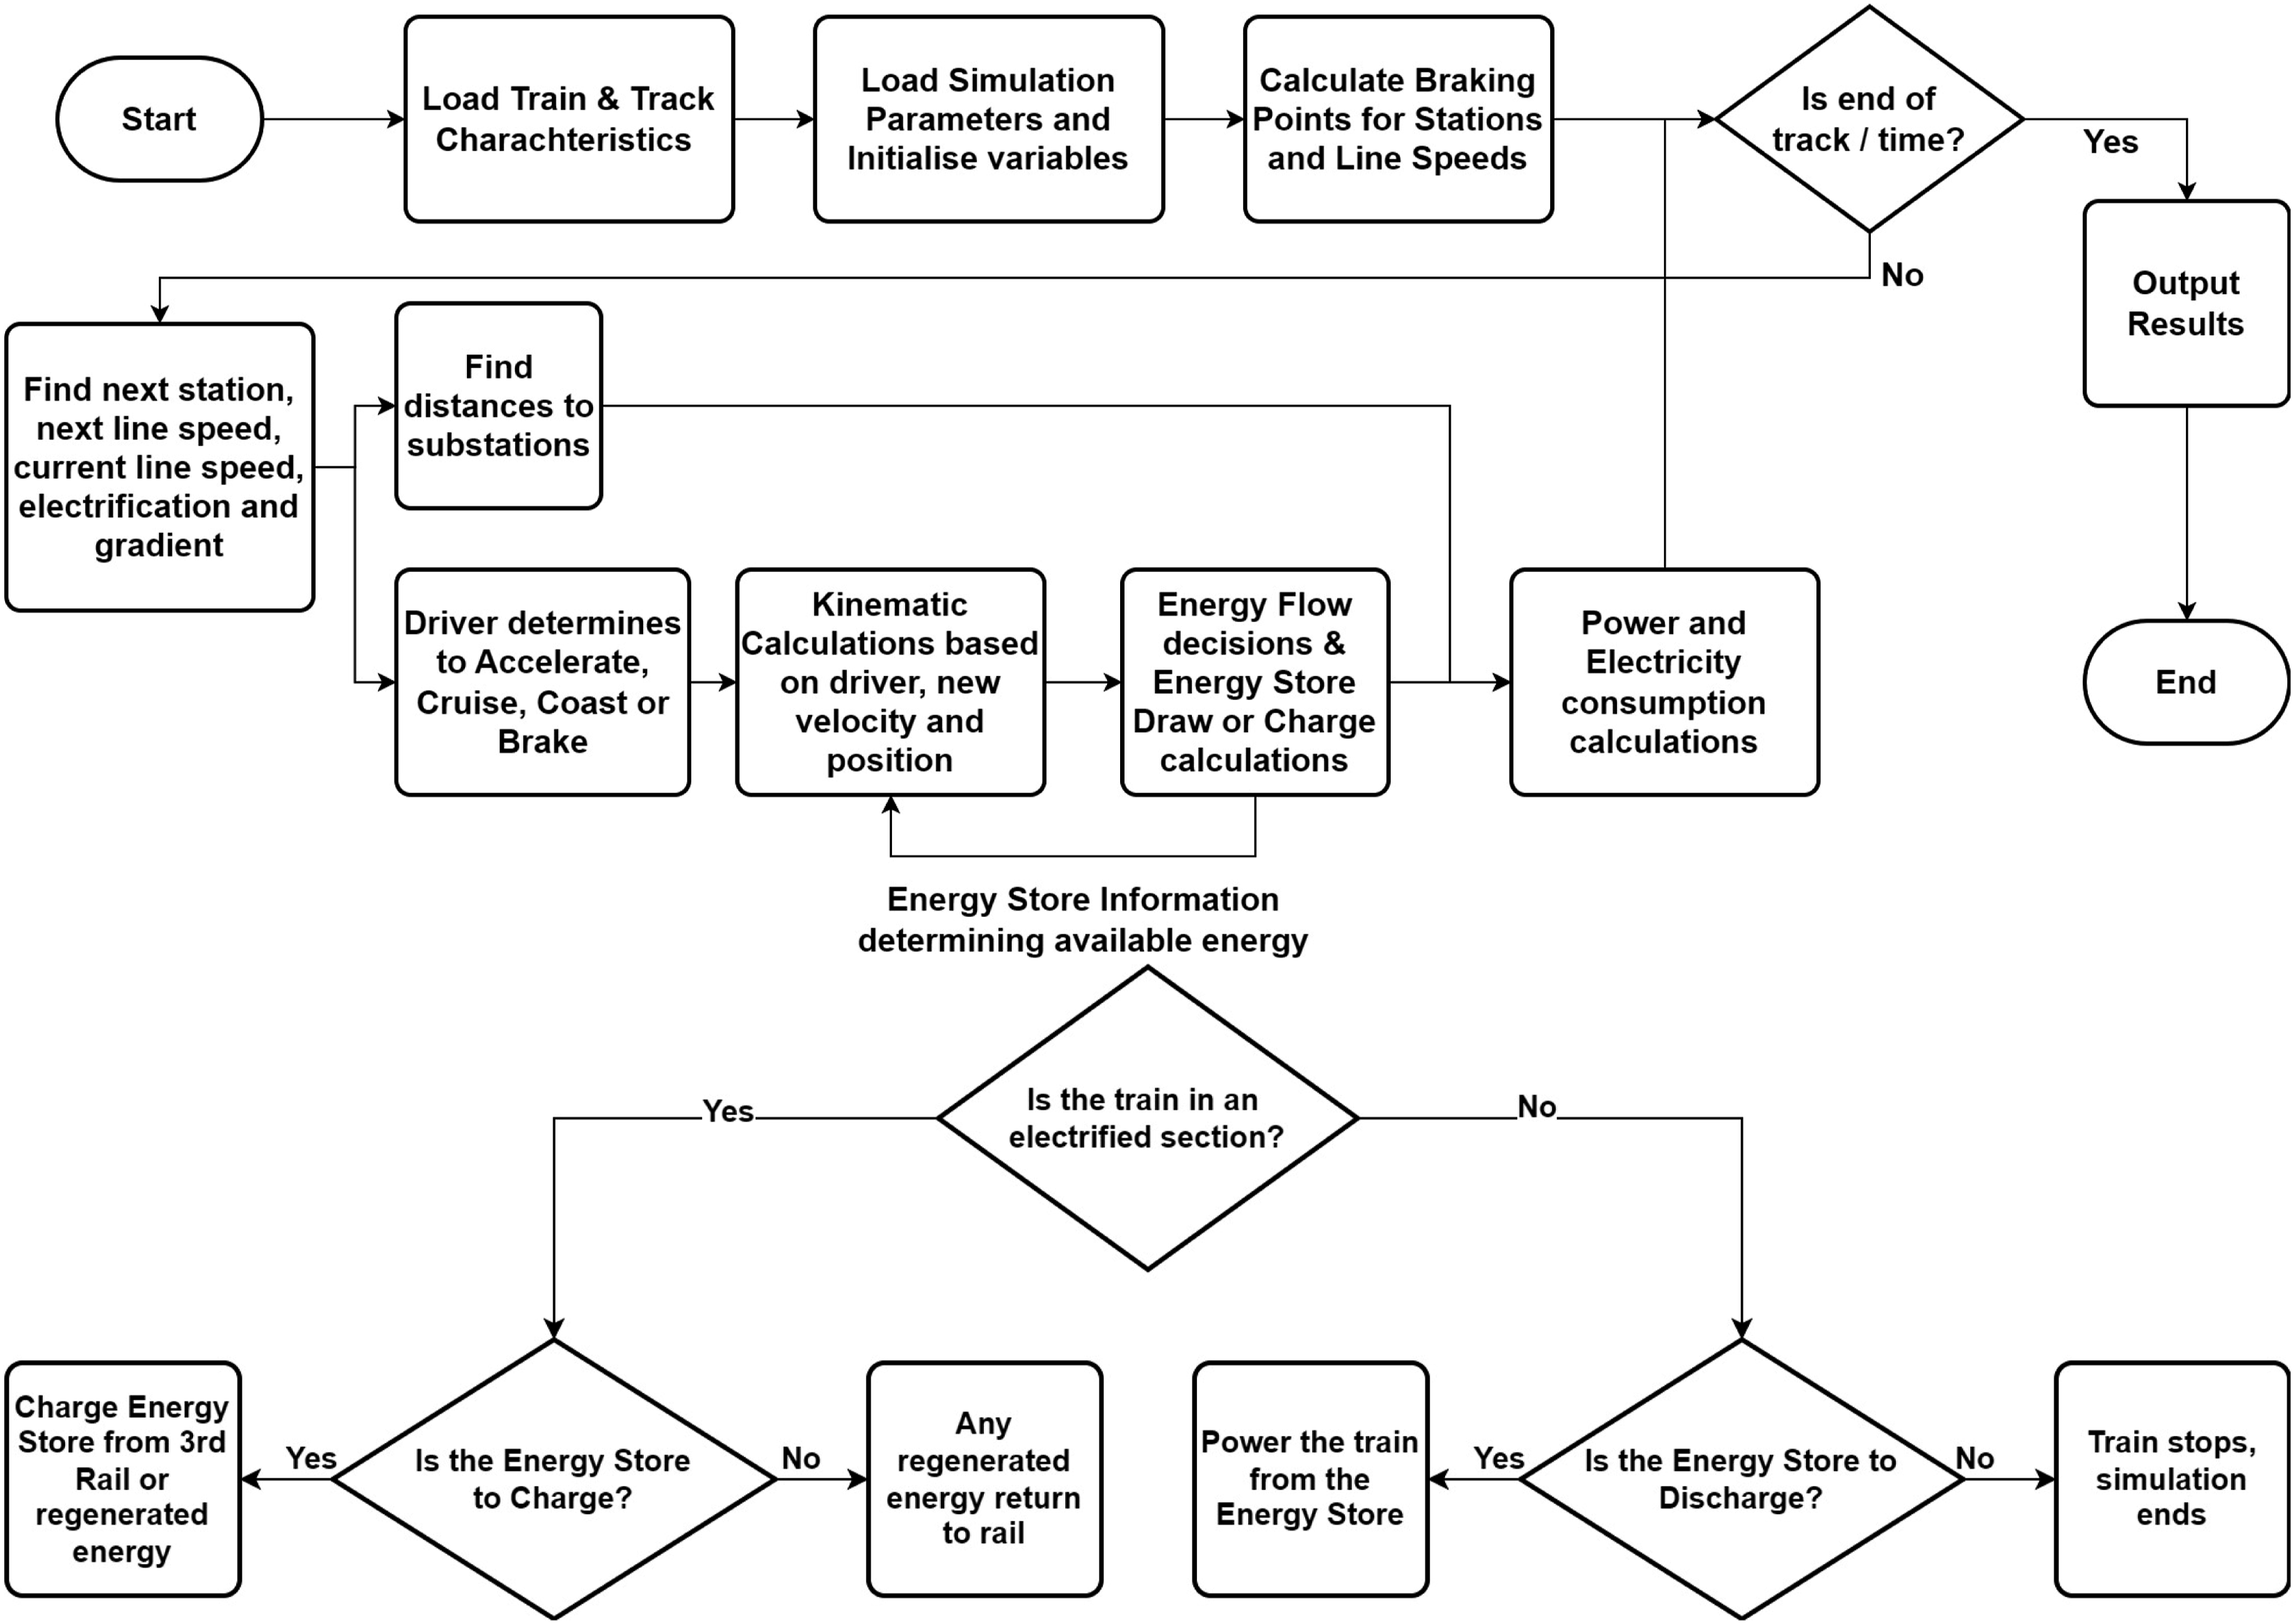
The model simulates both mechanical movement, electrical draws and stored energy usage concurrently in a coupled model approach resulting in a mechanical model responding to the battery model limitations and vice versa with the electrical model responding to changes in the mechanical model.
At each timestep interval the model determines the driving mode required (either motoring, braking, coasting or cruising) using an algorithm based off back-calculated distances to braking points or stations and then uses kinematic equations as outlined earlier to step the train along in time calculating its displacement and velocity amongst other variables.
The gradient, line speed, electrification locations and station stop data are stored in arrays. At each time interval these arrays are interrogated with the previous iteration’s final displacement of the train to obtain the current geographical information. This displacement from the previous iteration is also used to identify the substations the train is between on the electrical network and hence calculate the electrical resistance of the conductor rail from the train to each adjacent substation.
The driving style is modelled as flat out driving till the target line speed is reached before cruising at that desired speed then braking up to the maximum of 1 m/s2 to the next target speed, either a reduction in the line speed or stopping at a station. Braking distances are pre-calculated with a lookup table created that can be referred to during the running of the model to avoid computationally intensive processes being performed at each timestep. The braking force applied can be varied with a coefficient factor in order to alter the braking profile of the train trajectory. A range of initial speeds are compared against speed reductions and the distances between them stored in a indexed lookup table.
The tractive and braking equations for force are used in conjunction with the velocity at each time step in order to calculate the power being used for the tractive effort or the power recovered in the regenerative braking. When used with regenerative braking equations a line voltage can be obtained by having varied the resistance of the train with using the line voltage from the previous iteration as the starting point to find the line voltage for this iteration after the resistance and current draw have been calculated.
The OESS is modelled as a bucket source where energy is added and removed as and when required with a set of rules to determine whether it can be charged or discharged based upon its SoC and at pre-determined C-Rates, the ratio of the output power to the OESS capacity. Efficiencies of 95%, as seen in Royston et al., 31 are applied to the energy being both added and removed from the OESS.
A simple management decision matrix for the removal or addition of energy to the store is shown in Figure 3, similar to that presented in Royston et al. 31 For initial exploration in the model, this is implemented in a simple form but is able to be adjusted to various State of Charge (SoC) limits. Initially the OESS is set to charge if the SoC is below 0.7 on an electrified section and below 0.95 on a non electrified section. This is to allow headroom for regenerated energy to be used to charge the OESS. In both electrified and non electrified cases, the OESS will not discharge if the SoC is less than 0.2. A SoC of 0.95 is chosen as an upper limit for the OESS as, in the case of batteries, SoCs higher than this can cause cell balancing issues at higher power demands. Operating down to a SoC of 0 would remove an energy reserve and excessive depths of discharge greater than 0.8 could cause accelerated degradation in a battery. 36
Rate limiters have also been applied to ensure that the maximum C rates for charging and discharging are not exceeded. When operating at the maximum C rate for discharge, the mechanical model is limited to only utilise the power available from the OESS when operating from the OESS. When operating over electrified sections then the mechanical model takes limits from the electrical model as to the maximum power available given the current draw of the train and position between substations as to not incur low line voltage levels. Combinations of both low charge and discharge rates with low OESS capacity will sometimes lead to a train being stranded in a non-electrified section without the energy to move into an electrified section.
Merseyrail rolling stock model
Whilst the model can accommodate any rolling stock given the vehicle characteristics, for an initial demonstration, the rolling stock to model is from the Merseyrail network, chosen for multiple reasons. Firstly, previous studies11,24,37,38 give a useful comparison to be able to validate any model. Secondly the Class 777/1 is in operation on this network as the first battery operated trains in passenger service in the UK. Finally, the network is also electrified using a top contact 750 V DC third rail so provides a good case study to investigate energy storage solutions for third rail systems. The Class 777s replaced Class 507s and Class 508s studied in previous works,7,8,39
Figure 5 is a basic but representative overview of the systems in place for the model. Of note is a common DC bus where any motor can be powered by any shoe gear or the ESS, equally any regenerated energy can be transferred to the line, brake resistors or the ESS. Tractive Power System Overview of Class 777 / Class 777/1 Electrical Systems. Contains material reproduced from Wikimedia Commons licensed under CC BY-SA 4.0.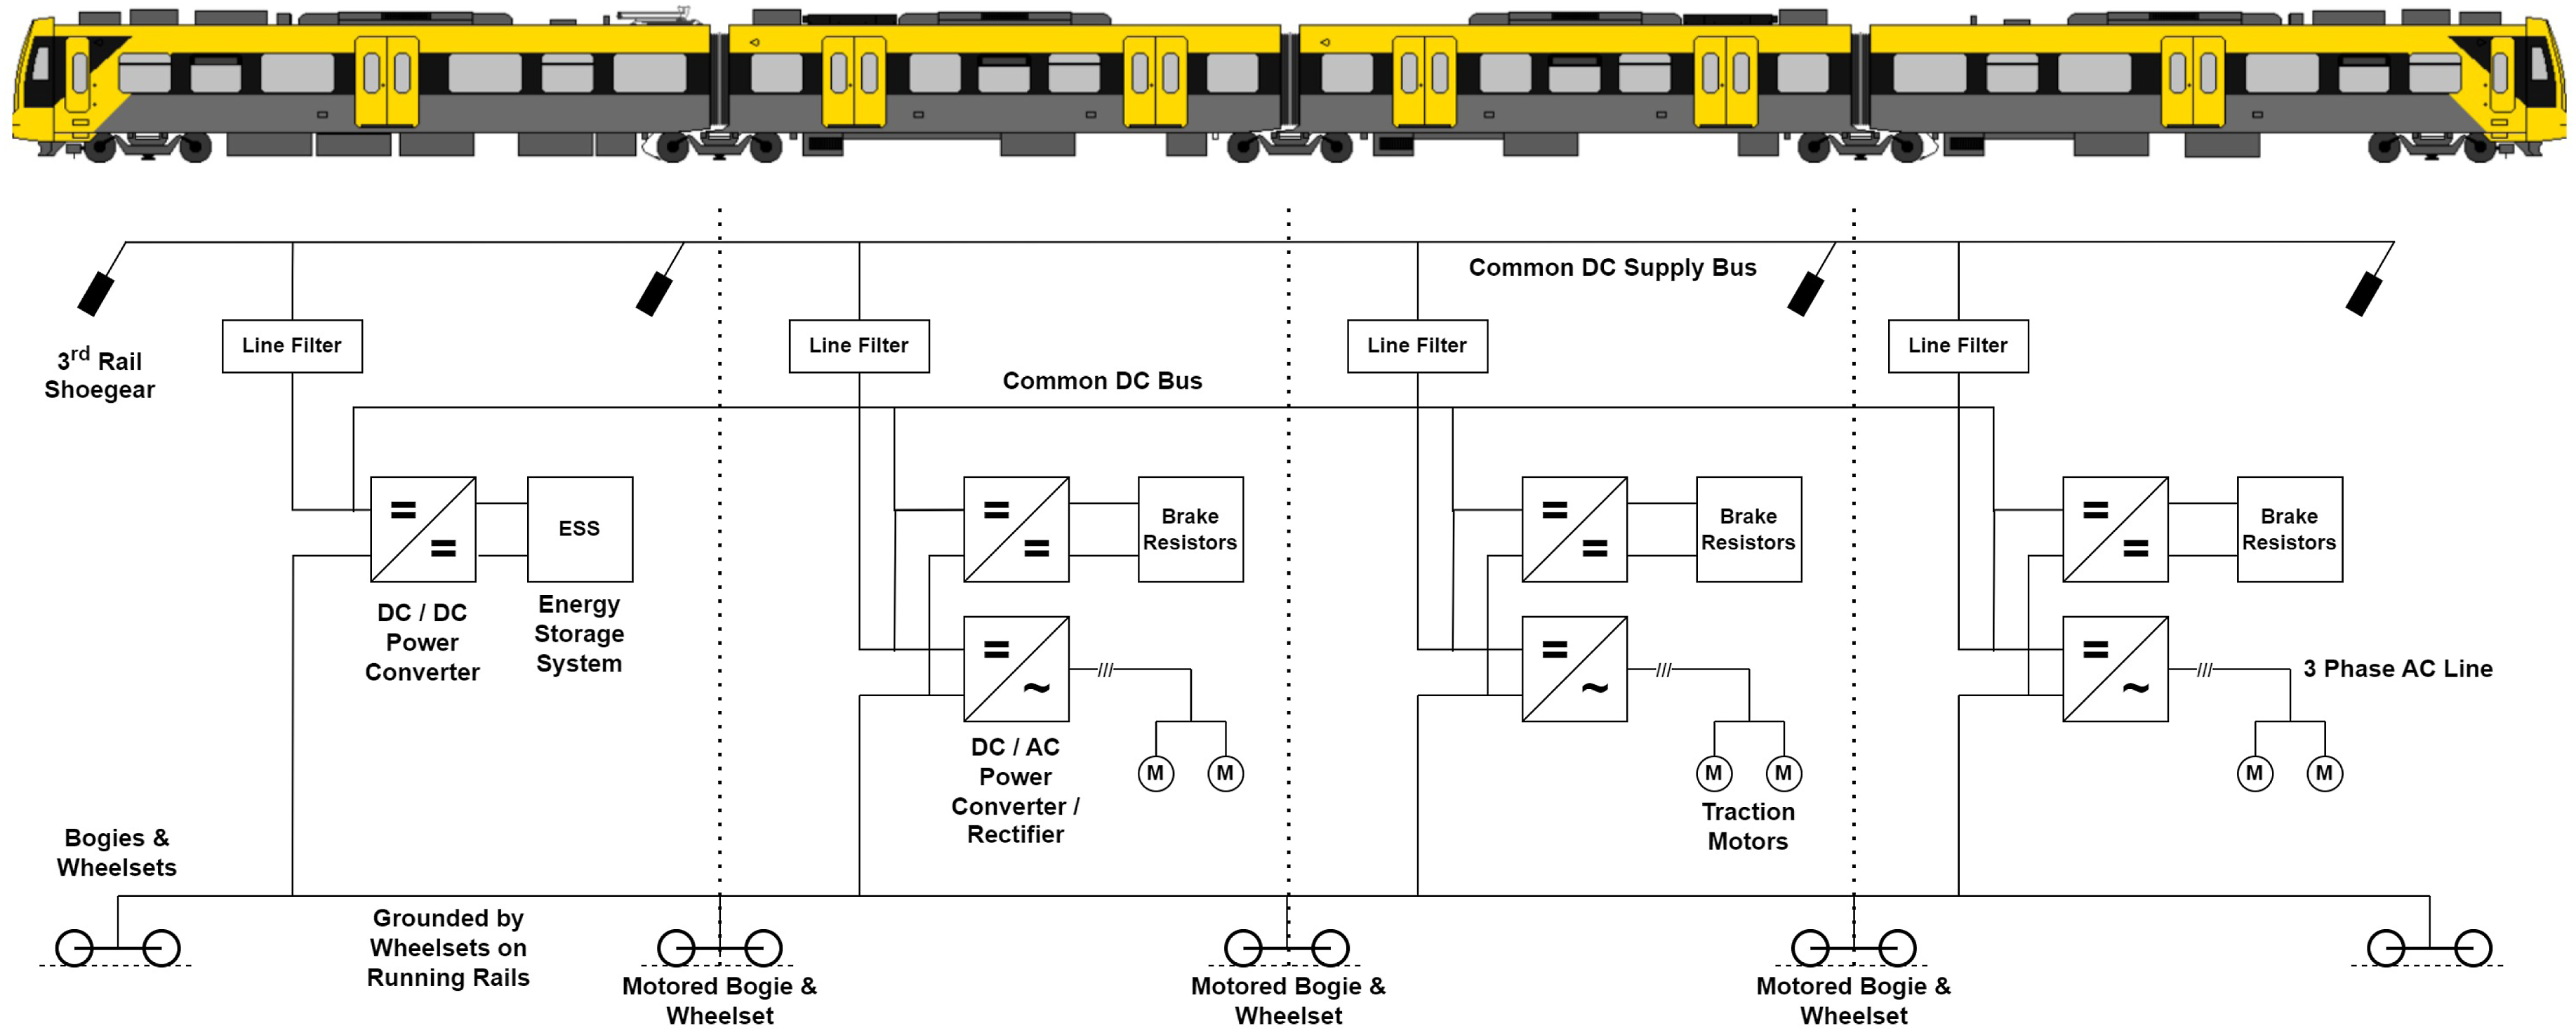
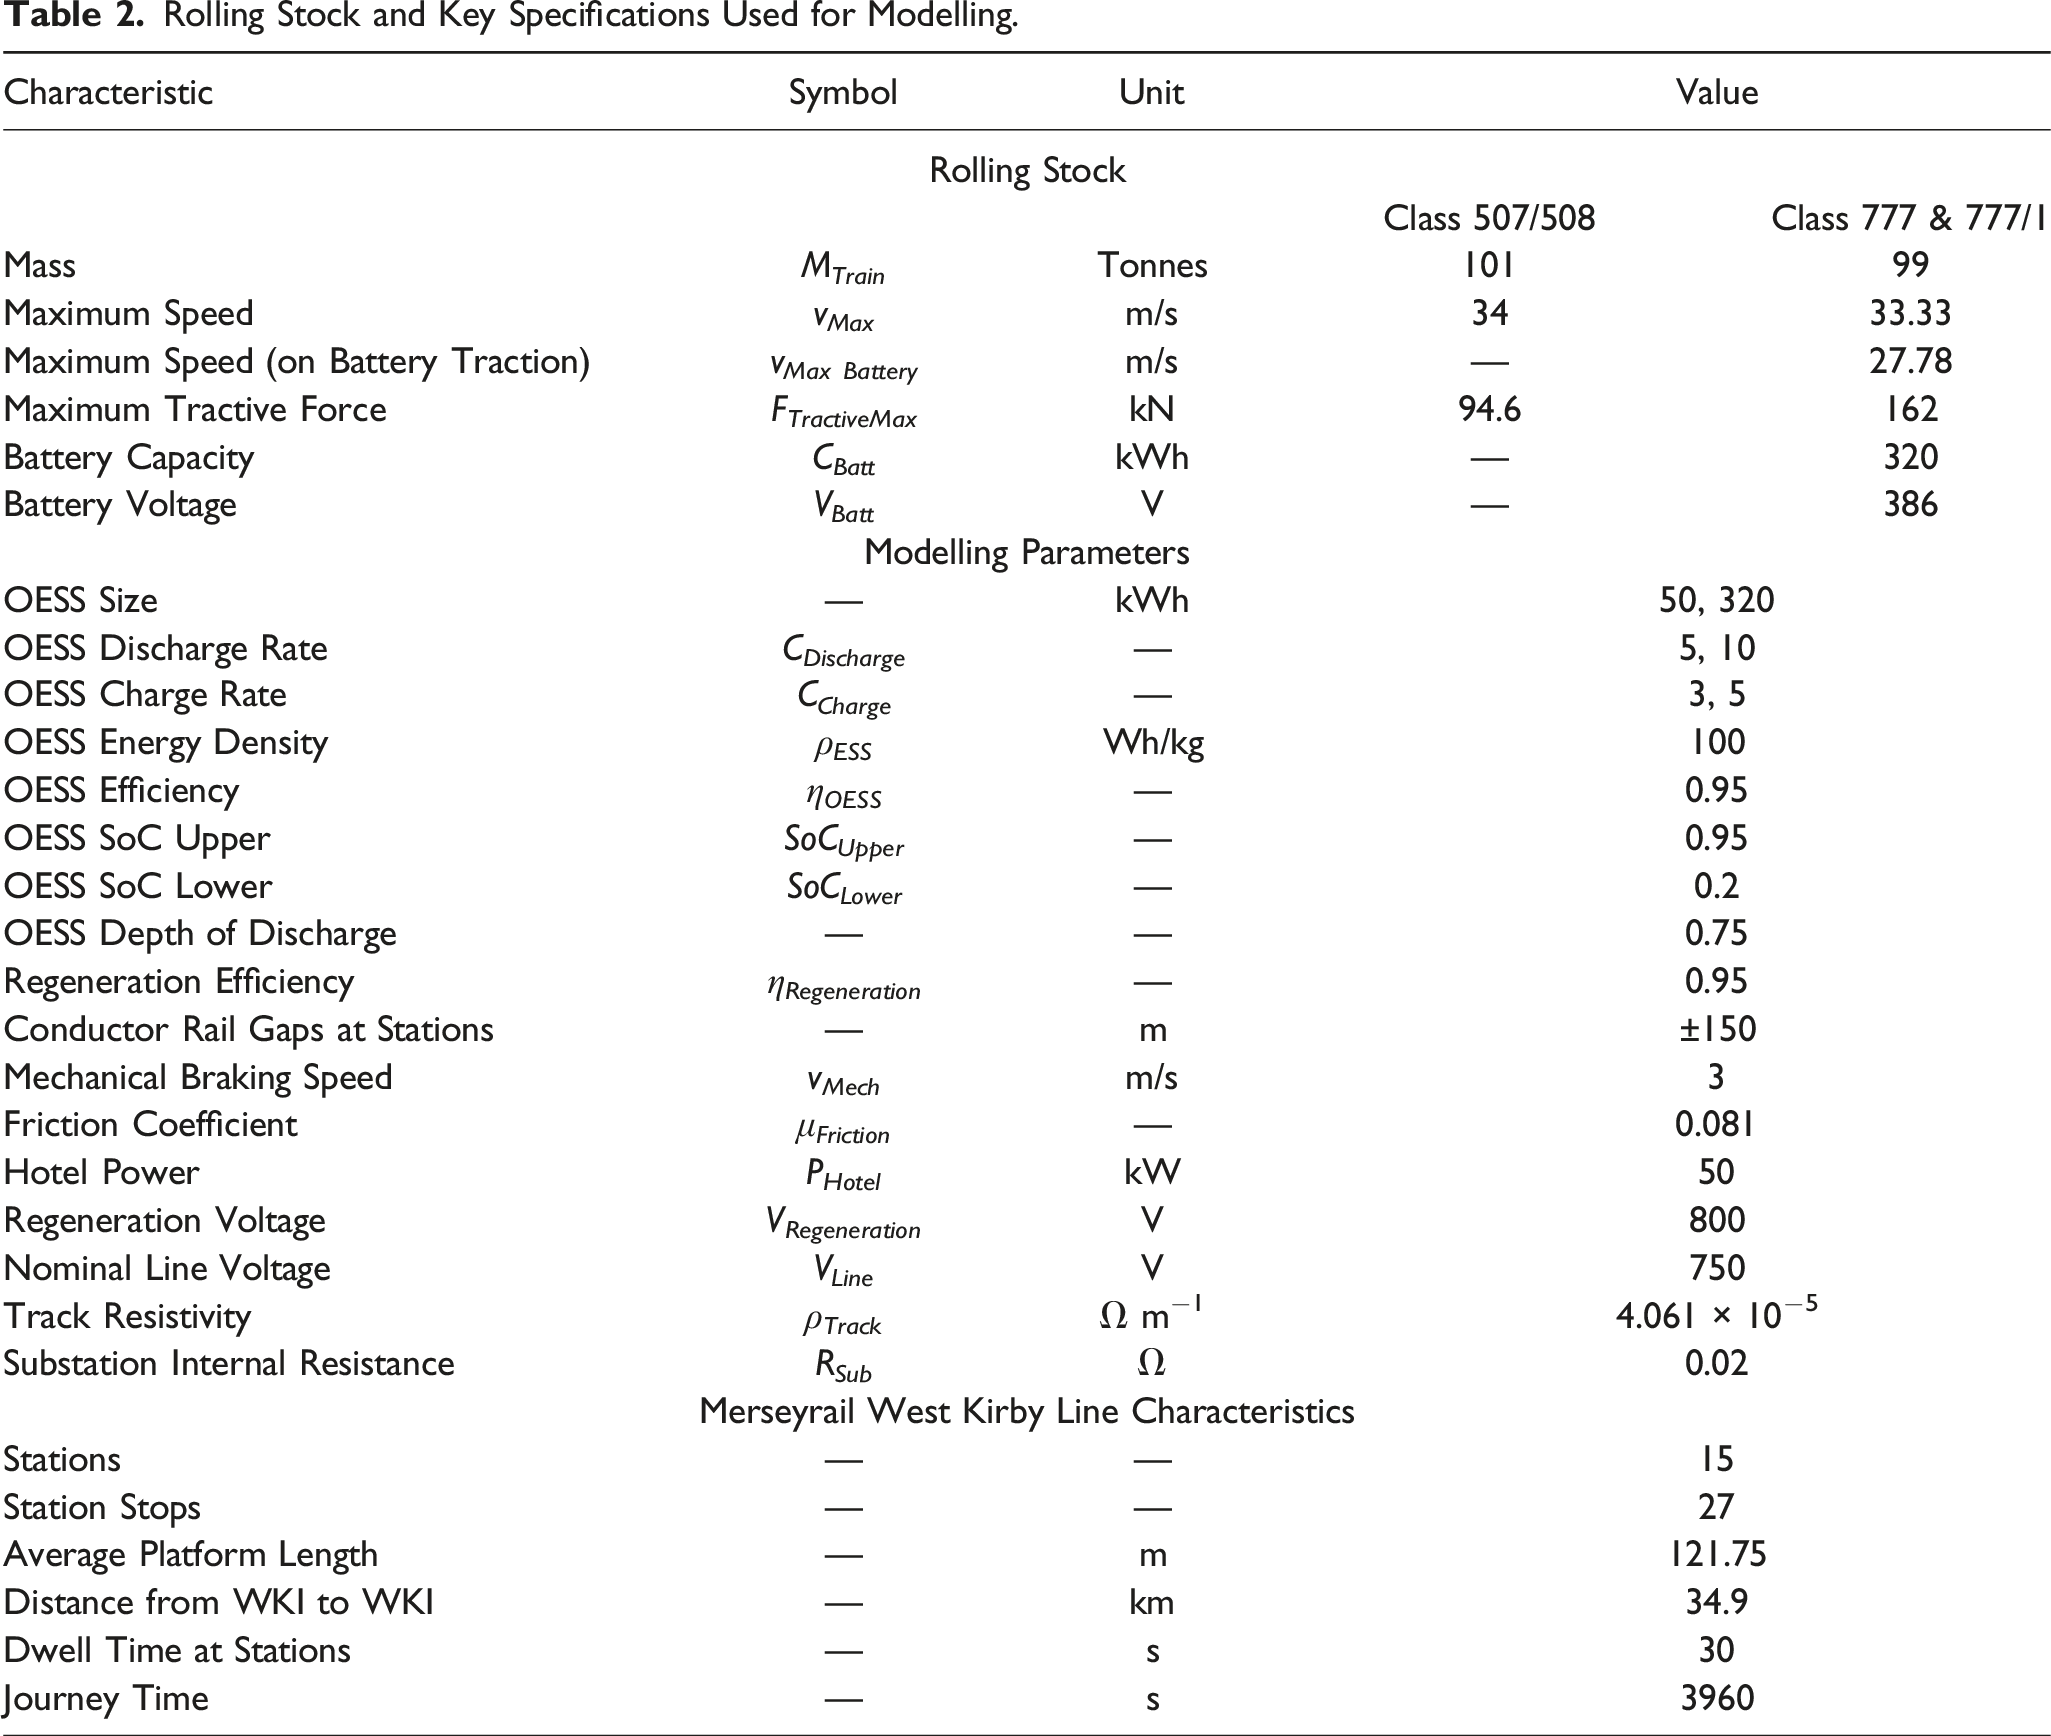
For the purposes of this work the vehicle parameters are inspired by the Merseyrail Class 508s and Class 777s, while not being a specific vehicle due to limited data availability for those fleets. Tractive effort and vehicle mass is from Class 777 data whilst rolling resistance coefficients are from Class 508 data. Key specifications for the model and OESS are shown in Table 2.
An iterative process was used to initially size the OESS and 50 kilowatt-hours (kWh) was chosen as a preliminary size as to be comparably smaller compared to the 320 kWh store on the Class 777/1 which has a 55 km range.
Merseyrail case study & calibration
West Kirby branch line
The line chosen for calibration was the West Kirby branch line on Merseyside. Key characteristics of which are summarised in Table 2. It is a suburban line, electrified with a top contact third rail system.
Information for this line is obtained through Network Rail open-source data extracts.40–43 Locations for substations are obtained from the presented information in Fletcher et al. 11
The average platform length on this route is just over 120 m. Therefore the chosen size for gaps in the conductor rail will be 300 m. This is over double the length of the existing platforms so will offer conductor free protection for over half the length of the platform in each direction.
GPS data for calibration
In order to calibrate the model, GPS data was collected in February 2024 using a USB GPS tracker connected to a laptop to record the position and speed of the trains between West Kirby (WKI) and Birkenhead Park (BKP) in both directions. This section of track is above ground and is therefore possible to obtain a GPS position as opposed to the underground tunnel sections that start after Birkenhead Park. Six services in each direction were recorded.
Driver and calibration
The driver isn’t the focus of this model so for the purposes of this model the driver bears sufficient resemblance to be relevant. The driving style for the model, explained earlier in Model Principles, is a flat out style with the driver always using maximum available acceleration and braking. In order to control some of the characteristics of the train trajectory and to bring the model in line with the real world data, a coefficient is used to limit the maximum available acceleration and tractive power used and the maximum braking force applied. Using this, the model can be calibrated to run to a given time required by the timetable, and different implementations of continuous or discontinuous electrification can all run to the same time required by the timetable.
Continuously electrified model validation
A comparison between the model and GPS validation data is shown in Figure 6. It can be seen that there is close agreement in the trajectories at each station under acceleration and when braking into the next station. A divergence occurs when reaching higher speeds due to the model limiting the tractive effort and the modelled driver not coasting which occurs in reality, seen most notably in the Down direction between Moreton (MTR) and Meols (MEO). The model gives some positive features that the acceleration out of and braking into stations correlates well to the GPS validation data which is of high importance and relevance when implementing an energy storage system to power the train over gaps in the conductor rail when accelerating way from and braking into stations. The mechanical model can be said to be validated against the collected data. Class 777 Model against Class 777 GPS Data for Up West Kirby (UWK) and Down West Kirby (DWK) Directions.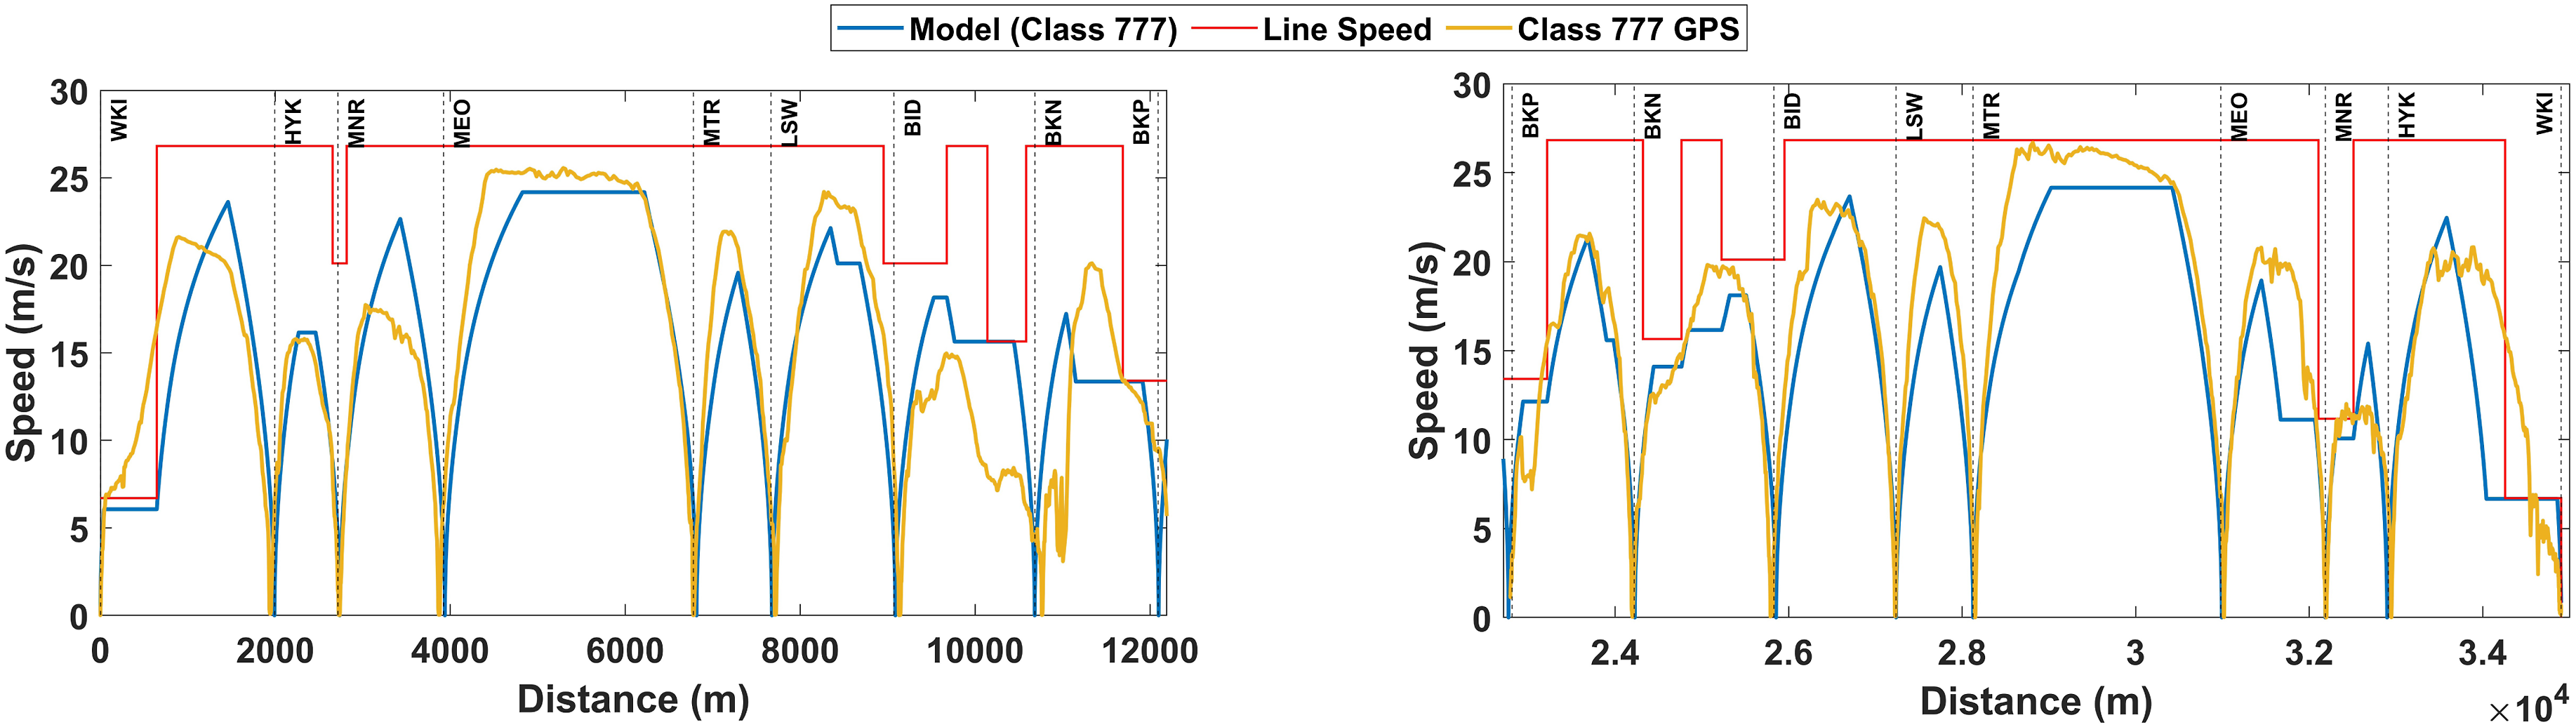
The model has been run in accordance with PD CLC/TS 50641-2:2024 Fixed Installations for Railway Applications — Requirements for the validation of simulation tools used for the design of electric traction power supply systems Part 2: Specific Urban DC Case. 44 The calculated energy consumed from the model in this study for a single train on the validation test case is within the tolerance limits as laid out within PD CLC/TS 50641-2:2024. However, this standard does not extend to fully cover the scope of the model in this study due to our work focusing on single train, discontinuous electrification with onboard energy storage systems.
Results
When run with a time step of 0.2 s, the MATLAB model requires approximately 200 s of running on a Intel i9 laptop with 32 GB of RAM. Time steps smaller than 0.2 s do not carry any great improvement on the results shown but increase computation time significantly. Time steps such as 0.5 s or 1 s reduce computation time further however they show a divergence in the trajectory from the GPS data with more instances of over accelerating or braking.
Discontinuous electrification
In order to obtain a journey specified in the Working Timetable (WTT), the train simulated on the gapped discontinuously electrified scenario is calibrated to be driven with a higher maximum acceleration than on continuously electrified in order to keep the journey time the same. This is because during the acceleration phase out of a station, less power can be provided by the energy storage as compared to direct electrification. This is shown by the limiters in Figure 4. The impact of the utilisation of the OESS is seen in Figure 7 as a noticeable change in gradient of the velocity when accelerating out of the station after the position reaches 150 m away from the stations, marked with vertical dashed lines. Velocity, Line Voltage, Current Draw and OESS SoC Profiles for Continuous and Discontinuous Case Runs for the Given Case Runs and 300 m Gaps at Stations.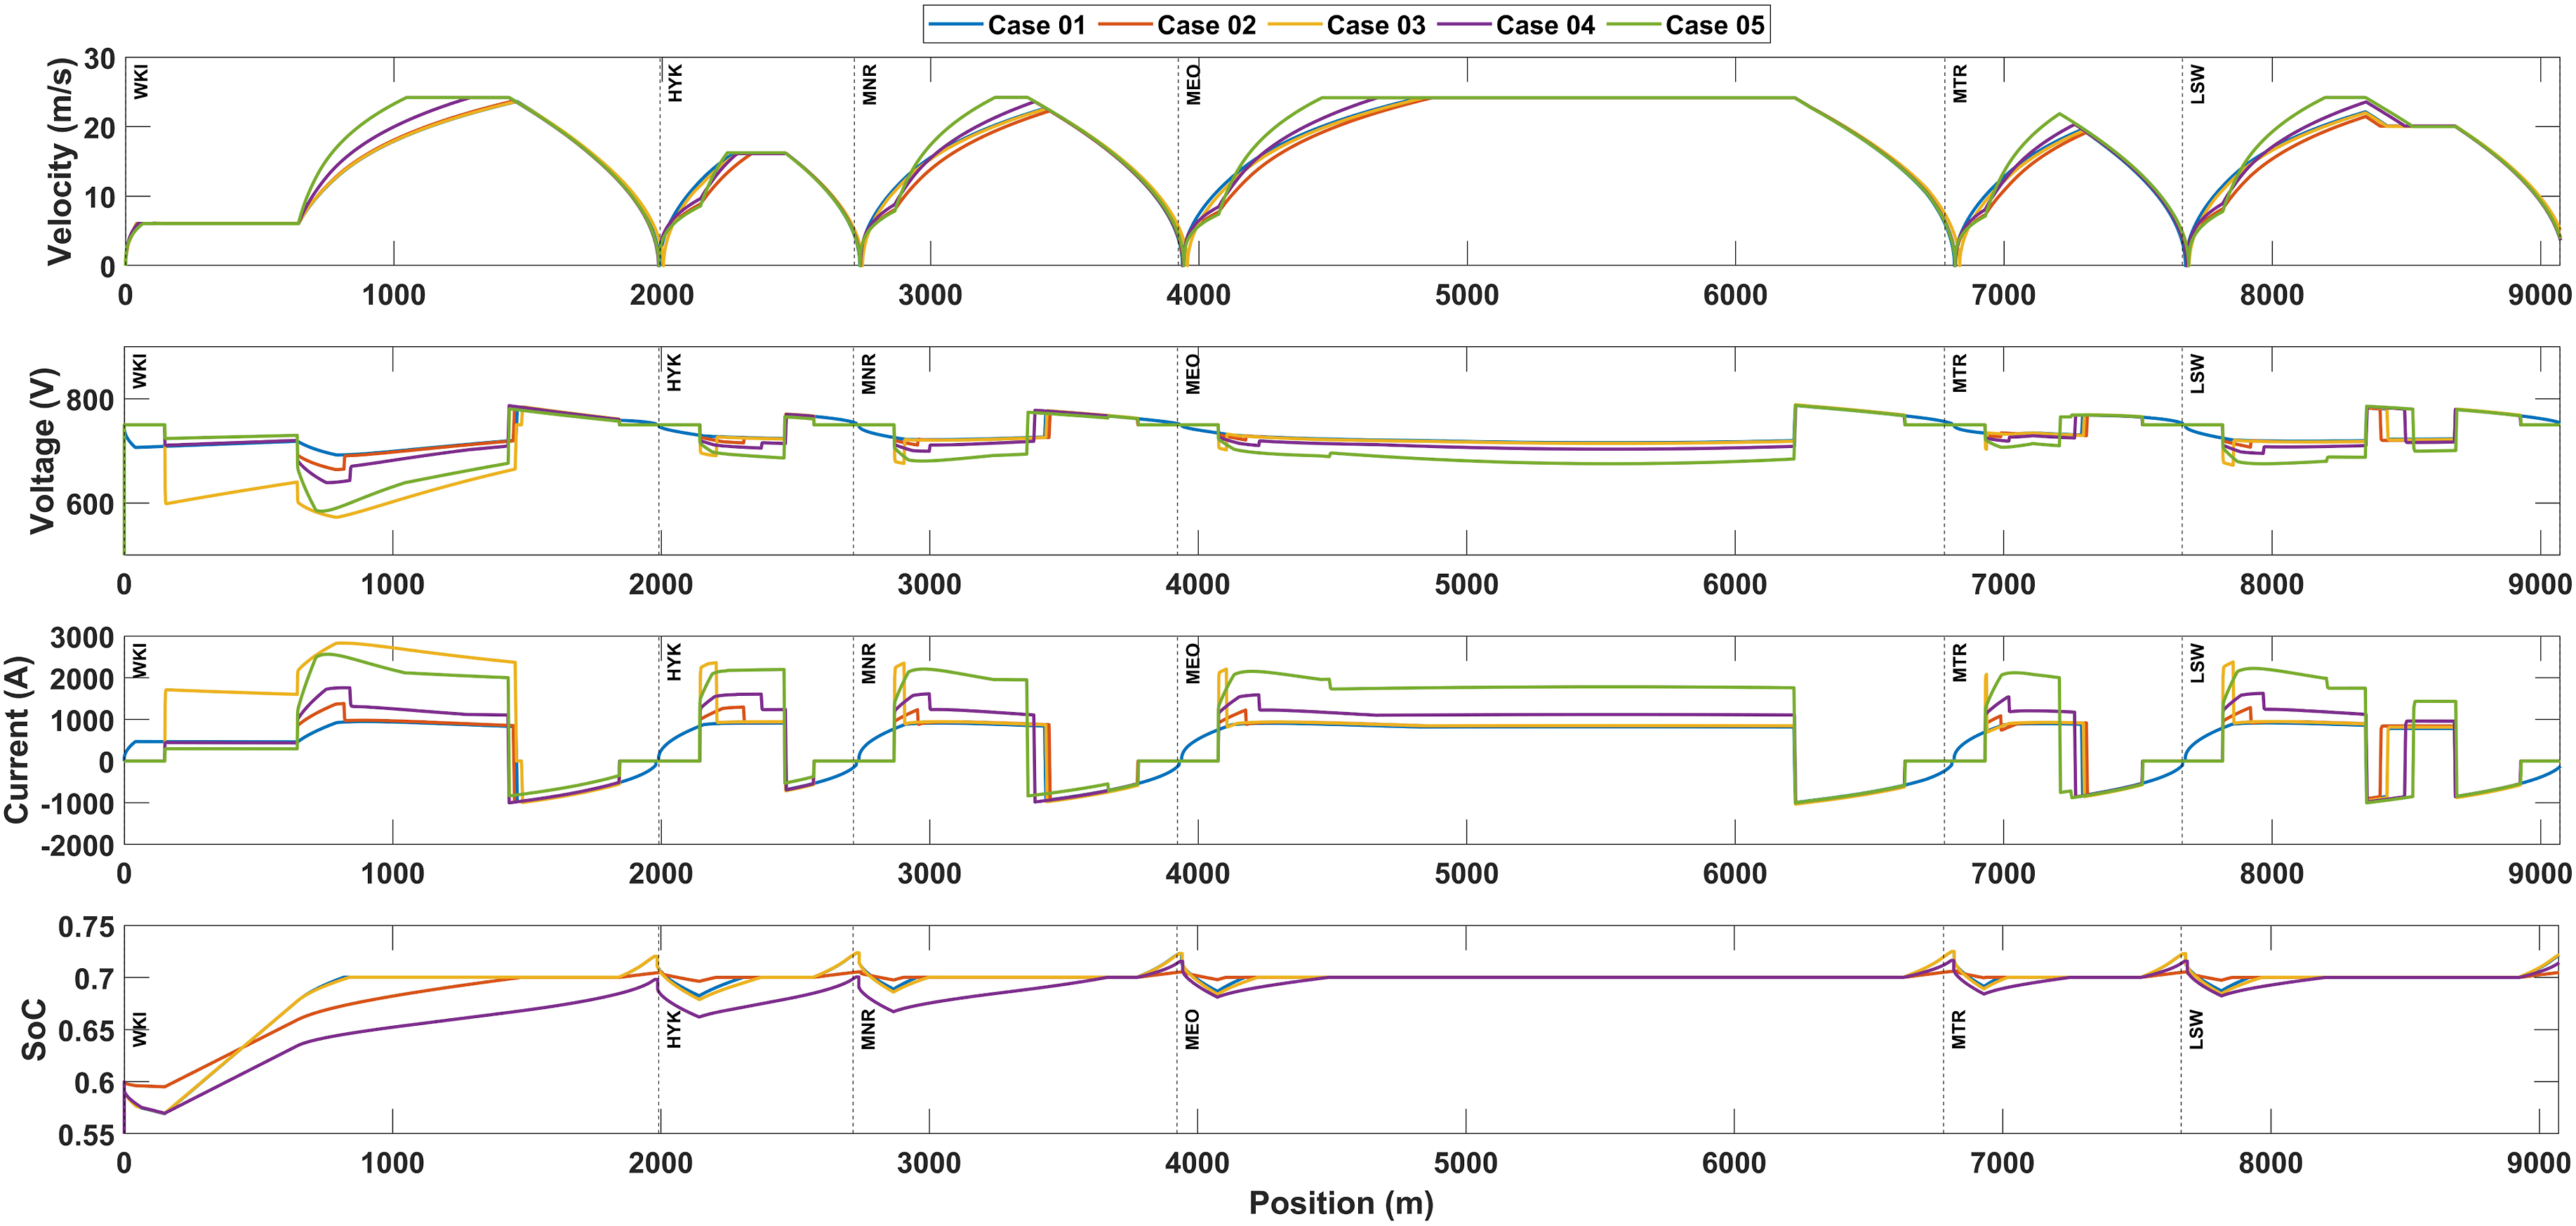
Energy storage for discontinuous electrification
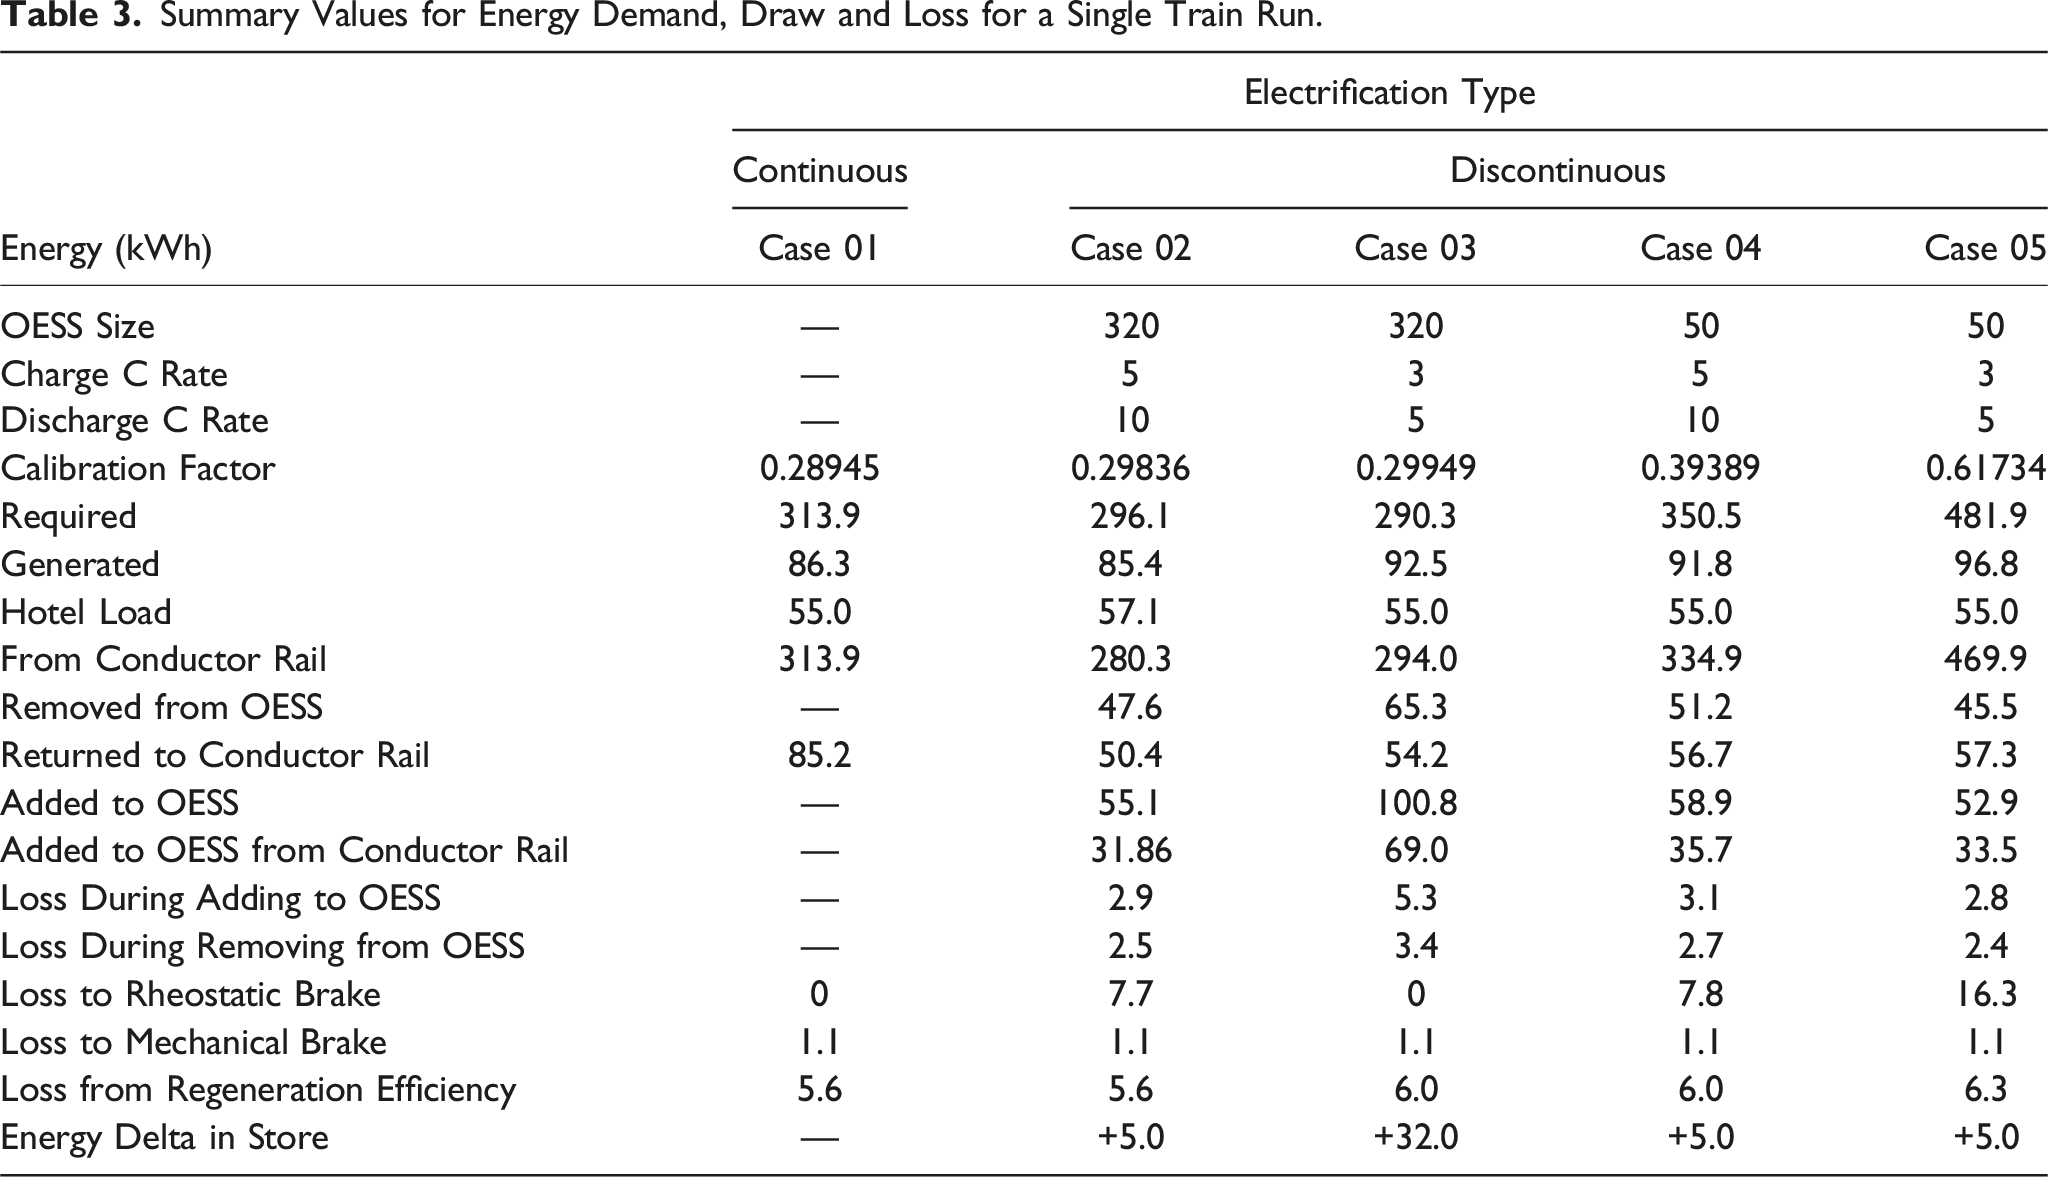
Two different onboard energy storage systems were used for this study, with parameters outlined in Tables 2 and 3. These were sized at 320 kWh and 50 kWh. The 320 kWh OESS is representative of that on the Class 777/1, a LTO-NMC chemistry 8 with C-Rates of approximately 3C for charging and 5C for discharging. To contrast this large store with a range of 55 km, 8 a demonstrably smaller store of 50 kWh was chosen. As the application of discontinuous gaps in the conductor rail at stations requires a high traction power, an increased discharge rate of 10C was chosen and a 5C charge rate. These are representative for LTO chemistries or a supercapacitor-battery hybrid system.8,36,45 The C Rates were then duplicated across both sizes to illustrate the impact of the different available tractive power.
Running each test case as outlined in Table 3, and with specifications as outlined in Table 2, the resultant State of Charge (SoC) change over time for each run is shown in Figure 7. As the train uses the onboard energy storage where there is no conductor rail, this is shown as a draw from the OESS. When regenerating, energy is able to be absorbed by the OESS, and when on an electrified section of track the OESS is able to recharge. The resultant summary energy draws, requirements and losses are shown in Table 3 for each test case.
Energy consumption
The aim of this work was to maintain the timetable and not to optimize for least energy used, further optimizations could be conducted to balance these two objectives but were not within the scope of this work. Differences in the energy consumption between the OESS assisted discontinuously electrified simulation from the continuous electrification can be attributed to the higher calibration factor used in the discontinuously electrified simulation in order to achieve the required time to complete the journey. It should be noted that the values for energy to and from the conductor rail are taken from the point at which the train makes electrical contact with the conductor rail that is the third rail shoe. This is designated by the control boundary shown in Figure 4. As such the energy losses and draws from the substation are a separate subject to be further investigated independently despite being modeled.
From the presented data in Tables 3 and it can be seen that Cases 02 and 03 draw less from the conductor rail than the continuously electrified Case 01, offering at most a 10% reduction in the energy being drawn from the conductor rail. This however does necessitate a higher capacity OESS which increases the overall mass of the train.
Conclusions
A model has been developed that can simulate the trajectory and energy consumption of an electrified train with or without onboard energy storage over continuously or discontinuously electrified sections of a railway network. Developed for a novel system of electrification, the model is able to adapt to different route and rolling stock data configurations provided and been validated against GPS data for 12 journeys undertaken for this investigation on the Merseyrail West Kirby line for energy consumption investigation. The principles used in this model allow the three key areas of the mechanical, electrical and energy storage models to interact with each other in such a way that they are able to impact the performance of one another for a more realistic model. The model has shown that it could be of value to further investigations where there are onboard energy storage systems on trains operating on discontinuously electrified networks.
The initial investigations show that with a modest OESS of only 50 kWh, a system could be adopted with the removal of 300 m of conductor rail in and around stations on top contact Third rail networks. This could improve safety for the passengers and general public that use these stations. Larger OESS systems such as the 320 kWh store explored in this paper could potentially reduce total energy consumption. Should gaps in the conductor rail be introduced through stations, around 30% of major injuries and fatalities caused by electrocution to non-workforce persons could be avoided. There would still be risks of electrocution elsewhere on the line and would not reduce instances of Arc-Eye however it presents a potential safety improvement to passengers travelling on those networks.
There has also been shown to be a predictable and repeatable draw from the OESS with regards to its SoC, however as the OESS has been modeled as a high power density energy storage system rather than representing a commercially available battery or super-capacitor, further sizing and characterization is required. The management system for charging and discharging the store can also be implemented to bias recovering more or less energy from what is being regenerated or the electrified contact rail. The impact of this repeatable draw on the life cycle of the OESS will also need to be evaluated.
Optimization could be performed on the OESS characteristics in order to minimize the energy being used and to best characterize the size of the onboard store. This would potentially reduce the amount of energy being both drawn and returned to the conductor rail. Although some energy will be lost to the charging and discharging of the OESS, the power delivery through the third rail also incurs losses depending on the distance from the substation. This offers potential for energy savings by reducing the losses from the third rail by using the onboard energy storage for making better use of energy recovered from braking or using the stored energy where losses from the third rail are at their highest.
The results presented in this paper show the potential for further energy savings when considering the use of the energy recovered during regeneration. If this was all to be absorbed by the OESS it could reduce the amount of energy required from the substations. This is to be explored further in conjunction with different OESSs and management systems.
Copyright
For the purpose of open access, the author has applied a Creative Commons Attribution (CC BY) license to any Author accepted manuscript version arising from this submission.
Footnotes
Acknowledgements
The authors are grateful for support from Sheen Matthews at Merseyrail Electrics, Merseyrail Electrics, Stephen Phillips at Siemens Rail Infrastructure, Siemens Motability, Great Western Railway and Richard Stainton at Network Rail Infrastructure Limited.
Declaration of Conflicting Interests
The author(s) declared no potential conflicts of interest with respect to the research, authorship, and/or publication of this article.
Funding
The author(s) disclosed receipt of the following financial support for the research, authorship, and/or publication of this article: The Authors would like to thank the Engineering and Physical Sciences Research Council (EPSRC) for financial support through their University of Sheffield Doctoral Training Partnership grant (EP/T517835/1). The authors also thank Network Rail Infrastructure Limited for their financial and supervisory support to undertake this research.