
Abstract
A new optical monitoring system has been developed to photograph in-situ in real time the initiation of damage on the running surface of a rail steel twin-disc sample undergoing wear testing. The line-scan camera system has been demonstrated on the Sheffield University ROlling Sliding 2 (SUROS2) twin-disc machine. The results show the system can continuously track the development of wear flakes, with wear flake initiation and stabilisation of wear flake size observed without test interruption for the first time. Image analysis to quantify the total wear flake shadow pixel count showed a good correlation with the mass loss results, indicating the potential for the optical data to quantify rail steel wear without interruption to testing. Furthermore, in a water-lubricated test the new system enables observation of rolling contact fatigue (RCF) crack initiation through a water layer present on the specimens, without requiring test interruption. The improving knowledge of the wear and RCF performance of rail steels available from the new observation method can help improve understanding of steel performance and support to the selection of rail steel grades according to their performance.
Introduction
The repeated cyclic interaction between rail and wheel very often produces wear and rolling contact fatigue (RCF) damage on rail steels while in service. The accumulation of damage from these mechanisms can affect the integrity of a rail steel and the safe running of a railway network. Wear damage can change the rail profile and widen the track gauge, potentially leading to dynamic issues; whereas RCF damage left unchecked can cause rail breakages and shelling. To counter these processes and ensure the safe operation of a rail network expensive rail maintenance programmes (grinding, milling, weld repair, replacement) are normally undertaken. Although wear can limit rail life, it can also be beneficial in helping to remove RCF damage from the running surface, 1 especially considering the relatively more difficult nature of rail RCF in terms of monitoring and prediction compared with wear damage.
The wear and RCF behaviour of rail steels are complex and depend on a range of different mechanisms. For wear damage, the mechanisms involved depend on the rail-wheel contact conditions and the wheel and rail material properties. Mild cases of wear normally the result of an oxidation wear process. 2 More significant instances of wear damage, however, are typically the result of a delamination wear process where the accumulation of plastic deformation, due to repeated rail-wheel contact cycles, results in the ductility exhaustion of the rail steel surface material, and thus causes material to be removed as wear flakes. 3 The mechanisms associated with RCF damage are related to the length and depth of RCF cracks, including ratcheting initiation and early growth, fluid-assisted crack growth, and rail bending and branching crack growth. 4 Overall, better understanding of the wear and RCF behaviour of rail steels can help allow the selection process of rail steel grades to be better targeted to the duty they will perform in-service; therefore, potentially helping to optimise the service life of a rail.
A variety of approaches have previously been used for investigating the wear and/or RCF behaviour of rail steels under rail-wheel contact. These include pin-on-disc2,5,6 or ball-on-disc7–9 tribometers, small-scale twin-disc machines,10–13 full-scale rail-wheel contact laboratory tests,14–16 and field measurements.7,16–18 Out of these approaches, small-scale twin-disc machines provide a good balance between accurately representing the rail-wheel contact, accessibility, and affordability. The drawback of small-scale twin-disc tests, however, is that information about rail steel wear and RCF damage development and material performance is only obtained after a test is interrupted or has finished. This provides a record of the rail steels material response only intermittently. Moreover, it can be prohibitively expensive to conduct separate tests of different contact cycle durations to fully quantify material behaviour.
To increase the amount of data obtained from twin-disc machines about rail (or wheel) steel behaviour a range of different techniques have been utilised. The practice of regularly interrupting a twin-disc test for recording measurements, such as mass loss, or visual observation is a commonly used technique.19–21 These test interruptions, however, introduce transient effects into the experiments due to the delay in re-establishing contact load and traction after every test resumption. These transient effects are disadvantageous as they can influence the development of wear and RCF damage on a twin-disc sample. Technologies, such as eddy current sensors 22 and electro-magnetic array sensors 23 have also been used with twin-disc machines to improve the quantity of data obtained about material behaviour. These are limited, though, to quantifying surface damage with no defect morphological details provided. In addition, these sensors can only measure the development of RCF cracks and not the wear performance of rail steels. Optical monitoring systems are another technology previously explored for use with twin-disc machines. These systems have either relied on correlating damage to a speckled pattern based on the reflectivity of the twin-disc samples running surface,24–26 photographing the running surface of a sample by regularly interrupting a test, 27 or creating section profiles of the running surface from optical data. 28 However, these optical systems have yet to enable visualising the morphological development of wear flakes or RCF cracks in-situ in real time during an uninterrupted twin-disc test.
This paper presents the development of a novel optical monitoring system intended for use with twin-disc machines. The system created is capable of near continuously photographing in-detail the development of morphological features, such as wear flakes and RCF cracks, on the surface of a twin disc sample in-situ during an uninterrupted twin-disc test. This is achieved through the application of very high intensity LED lighting in combination with high-speed image capture using a line-scan camera. The first twin-disc tests using the optical monitoring system are reported here to explore its capabilities for visual examination of rail steel wear and RCF behaviour.
Equipment description
The new optical monitoring system has been demonstrated on the Sheffield University ROlling Sliding 2 (SUROS2) twin-disc machine. SUROS2 is a modified TE 72 twin-disc machine designed by Phoenix Tribology that works using the same principles as the SUROS twin-disc machine and was modified to accept the same 47 mm diameter 10 mm wide running track sample design. 29
As shown in Figure 1(a), the SUROS2 twin-disc machine comprises two roller driveshaft assemblies, onto which a pair of disc samples are fitted to conduct a test. The roller driveshaft used by the wheel sample is fixed whereas the roller driveshaft used by the rail sample can traverse across the machine worktable via a linear slider to allow the specimens to be brought in and out of contact. The driveshafts are independently rotated by two AC motors with power transferred to the driveshafts via timing belts. To achieve creep in the twin-disc contact, the rotation speeds of the roller driveshafts are adjusted so that the running track surface velocity of the wheel sample is greater than that for the rail sample, that is simulating a driving wheel. The rotational speed and revolution count of the roller driveshafts are recorded via shaft encoders. In addition, a torque transducer connected to the rail roller driveshaft records the torque for subsequent calculation of traction coefficient at the disc contact. The twin-disc samples are loaded together using a pneumatic air bellows capable of normal contact forces up to 8.2 kN, equivalent to a maximum contact pressure up to 1600 MPa. A load cell mounted between the pneumatic air bellow and the rail roller driveshaft frame records the normal contact force and, consequently, maximum Hertzian contact pressure within the contact. To cool the discs during tests, an electronic fan is mounted and directed towards each of the specimens. The sensing and control equipment communicate with a central computer and are managed using COMPEND software.
30
Equipment configuration (a) Schematic drawing of the SUROS2 twin-disc machine. (b) Internal detail of the optical monitoring system.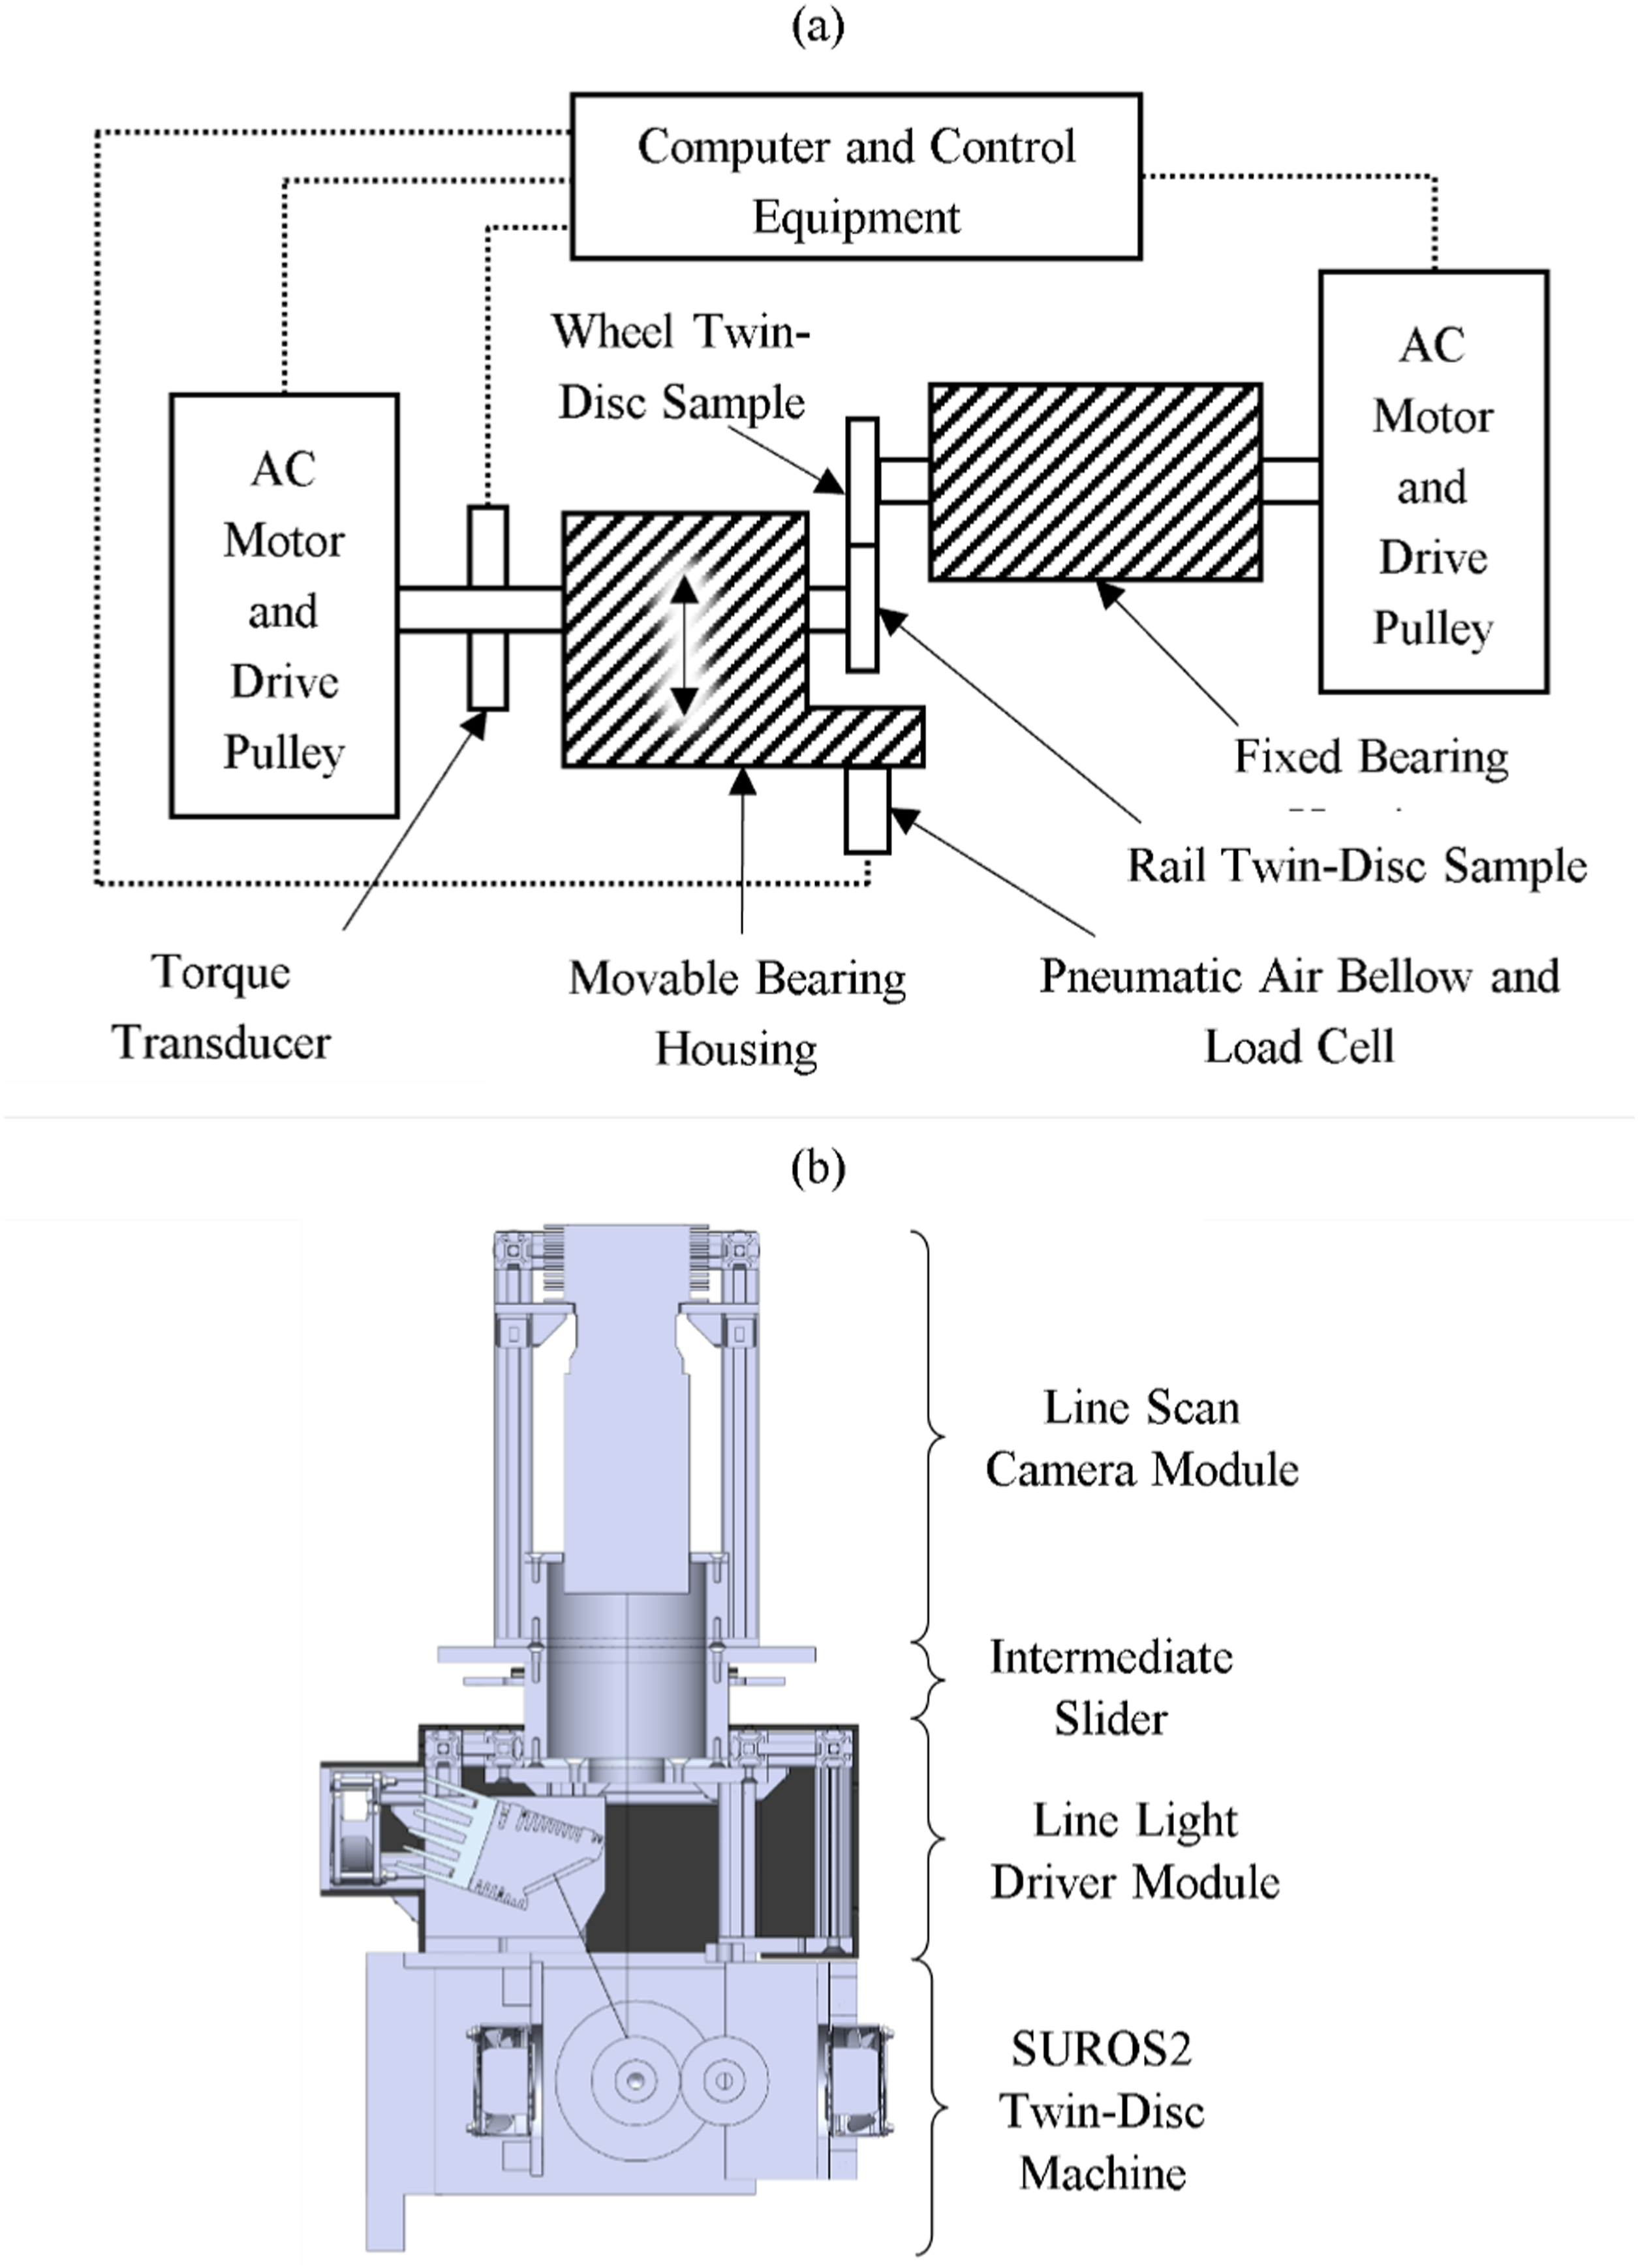
SUROS2 optical monitoring system
The optical monitoring system, as shown in Figure 1(b), was designed as two detachable modules (camera module and line light driver module) that can be mounted onto the SUROS2 machine. When in use, the two modules are connected by an intermediate slider on the machine guarding and the line light driver module is mounted onto the rail roller driveshaft frame to allow the entire system to move with the rail sample. This enables the system to create a stable image of the rail disc running track. For alternative test machines or if the wheel sample were of greatest interest the detachable modules can be remounted.
Camera module
A Basler sprint spl4096-70kc colour line scan camera equipped with a manual focus Nikon f/2.8105 mm macro lens is used to photograph the running track of the rail sample during tests. A line scan camera was chosen over a more conventional area scan camera for this application as it can observe a cylindrical specimen running surface without the final image being affected by perspective distortion. A sequence of line scans taken at high frequency while the disc is rotating can be stitched together to create a complete 2D photograph of the entire disc circumference, which would be very difficult without introducing distortion when stitching images from an area scan camera. Once captured, the data obtained is recorded using a PIXCI EL1 frame grabber card 31 connected using CameraLink cables. Postprocessing of the data was carried out using XCAP image processing software developed by EPIX 32 to stitch together individual line scans into a single complete image.
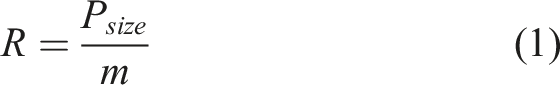
The line scan camera and macro lens combination have a 10 μm sensor pixel size and an optical magnification of 0.5. The spatial resolution, R¸ for the system can, therefore, be determined by Equation (1)
33
:
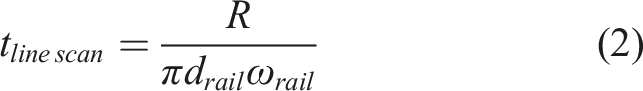
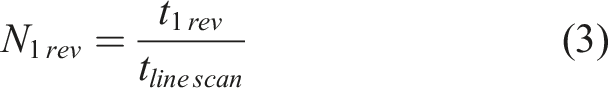
The XCAP image processing software is set to capture marginally more lines than needed for one full rotation of the sample allowing complete surface visualisation. The optimal line capture time, t
line scan
, and the minimum number of line scans needed to create an image corresponding to one full rotation, N
1 rev
, are found by Equations (2) and (3), respectively
33
:
The aperture selected for the optical monitoring system needed to strike a balance between providing sufficient depth of field while maximising light entering the camera to meet the intended exposure time and line capture frequency. This is to allow the rail twin-disc sample to be observed while also accounting for the change in sample diameter during testing because of wear. The depth of field, T, for macro photography can be determined using Equation (4)
33
:
Within the XCAP image processing software, the data collected by the line scan camera was captured using a 12-bit four channel colour configuration with zero colour offset (colour “temperature” of the darkest points in the image) and no shading correction applied. The gain for the green colour channel was reduced by 1.8 dB in the software while red and blue channels were unchanged, to correct (by eye) the colour of the images collected. This was done because of the greater green colour information obtained by the camera used in this work due to the Bayer sensor pattern which has two green, one red, and one blue sensor for every pixel. As the purpose of the system, however, is to observe the morphological change of surface features, such as wear flakes and RCF cracks, photorealistic colour was not essential.
Line light driver module
Due to the extremely short line capture times needed, it was necessary for the running surface of the rail twin-disc samples observed by the line scan camera to be brightly illuminated. To provide sufficient lighting, a Chromasens Corona II LED line light 34 was used with the optical monitoring system. This light source can deliver up to 500,000 lux of illuminance onto the sample running track at the required 95 mm operating distance imposed by machine construction and guarding restrictions. The LED line light is controlled by a Chromasens XLC4 control unit that communicates with the optical monitoring computer via an ethernet cable and is programmed using Chromasens XLC4 Commander software.
The position of the LED line light in the module can be changed allowing the light source to provide either brightfield or darkfield illumination. Brightfield illumination, illustrated in Figure 2(a), involves the LED line light positioned so that the main reflected light path from the sample running surface runs directly into the line scan camera. For darkfield illumination, shown in Figure 2(b), the line scan camera is instead positioned to receive light that has been reflected from any defects on the sample running surface. Illustration of how the optical monitoring system can achieved (a) brightfield and (b) darkfield illumination.
Methodology
Twin-disc tests
To understand the performance of the new optical monitoring system, two experimental studies were undertaken: (i) A preliminary rail damage visualisation assessment using discs of known condition rotating without a counterface, and (ii) a live experimental performance study running with the discs in contact and consequently with surfaces evolving over time.
Rail damage visualisation assessment
The rail damage visualisation assessment study focused on assessing the ability of the optical monitoring system to visualise wear flakes and RCF cracks from a disc running track. Images were captured for three twin-disc samples rotating at 400 r/min with known existing surface features: (i) a rail sample of R260 grade steel previously tested against an R8T wheel steel with pre-existing wear damage was used for the example of wear flakes; (ii) an eddy current crack detection calibration disc with a crack spark eroded onto the running surface parallel to the disc’s lateral direction 22 providing a well-defined surface defect of known geometry; (iii) a new unworn sample that provided a baseline to compare the surface features identified by the optical monitoring system from the two other samples. For each sample examined using the system, images were captured with the LED line light positioned for brightfield and darkfield illumination. This enabled assessment of which illumination method provided the best way of visualising wear flakes and surface cracks.
Live experimental performance study
Illustration of the orientation the (a) rail and (b) wheel twin-disc samples were machined out of a full-sized rail and railway wheel.
During the dry contact twin-disc test, the optical monitoring system recorded an image of the rail sample running track every 15 s (approximately every 100 contact cycles). In the water-lubricated test an image was recorded of the rail sample running track every 3 s (approximately every 20 contact cycles). A faster image capture rate was used due to the unknown nature of how quickly visible RCF cracks initiate in rail steel as it had not been previously possible to observe this phenomenon in a running test. A portion of the sample shoulder was included in the images captured to provide a location of identification markers that were used to help keep track of angular position of the sample during the tests. For this purpose, labels A-D were written on the rail disc shoulder every quarter revolution.
Results and discussion
Rail damage visualisation assessment study results
Figure 4(a)–(f) shows the results obtained from the rail damage visualisation assessment study. For brightfield illumination, shown in Figure 4(c) and (e), the outline of the wear flakes and RCF calibration slot can be easily identified by the shadow these defects cast onto the sample running surface, in comparison to Figure 4(a) for an untested surface in which primarily machining marks were visible. In addition, the brightfield illumination images was also able to provide insight on tarnishing and scuffing that occurs on the running track. For the darkfield illumination images (Figures 4(d) and (f)) the wear flakes were recognised as bright spots in the image, due to light reflecting off the back of wear flakes peeling away from the running track. Figure 4(b) provides the comparable untested surface indicating some staining of the surface (not visible with the naked eye) even after acetone cleaning, but no surface flaking. These bright spots were associated with wear flakes; however, bright spots can also be created by surface roughness, making it hard to distinguish between the two. This could especially be the case when wear flakes just start appearing as it would be expected that the size of the bright spots created due to wear flakes and surface roughness would be comparable. For the RCF calibration disc, darkfield illumination was unable to illuminate the spark eroded crack as it is recessed below the disc surface, making it less visible compared to brightfield illumination. Images obtained from the optical monitoring system for a new (a, b), wear (c, d) and RCF calibration (e, f) twin-disc sample rotating at 400 r/min using brightfield (a, c, e) and darkfield (b, d, f) illumination.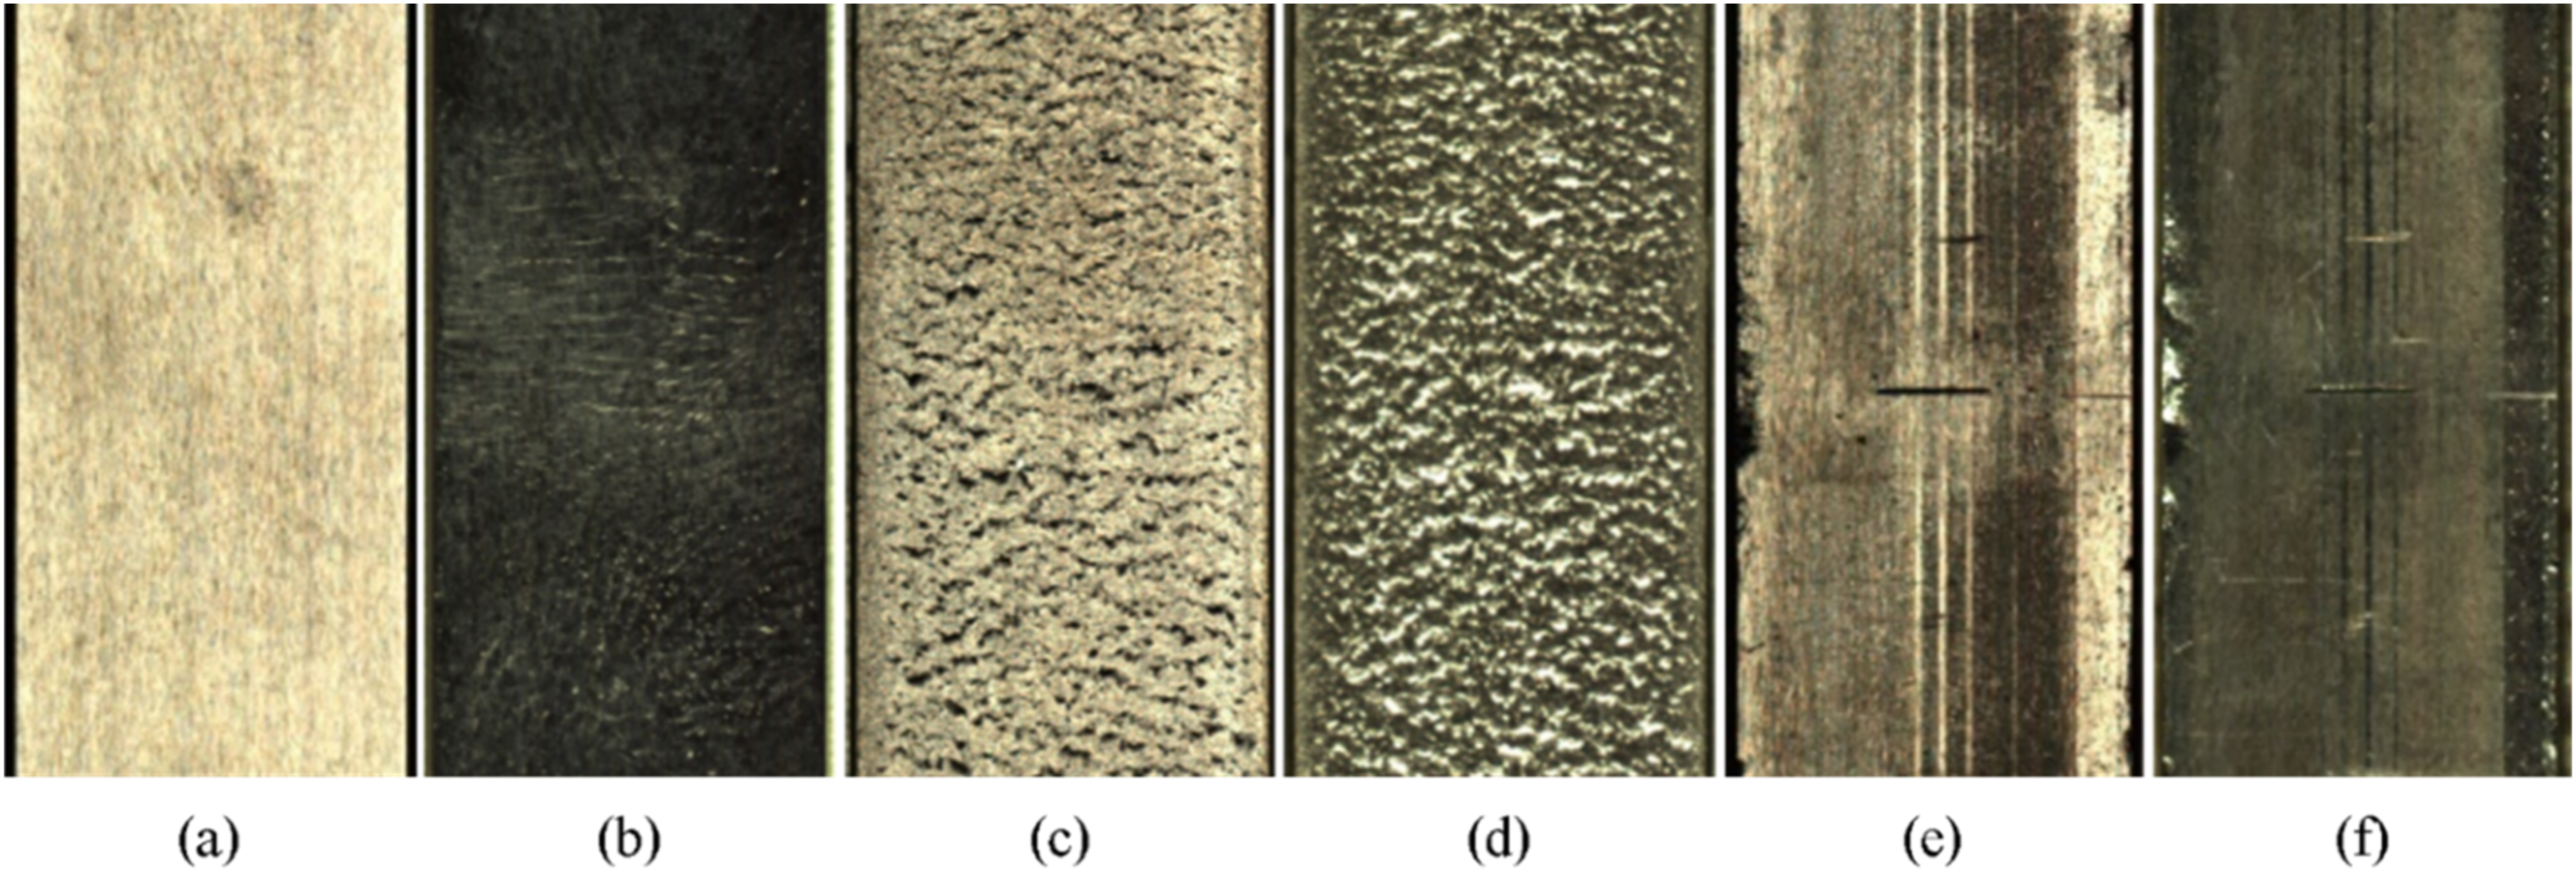
Real time experimental performance study results
Following assessment of the images from the rail damage visualisation assessment in Section 4.1, both dry and water-lubricated live experiment tests were undertaken using brightfield illumination. The photographs captured of the rail running track during the dry contact test are shown in Figure 5. The images show that the new optical monitoring system can very effectively visualise the development of wear flakes on the rail sample while the specimens are running in contact. As evident from the lighting intensity of the sample shoulder, it was required to occasionally increase the intensity of the LED line light to ensure the running track retained similar brightness in the images obtained throughout the experiment. This counteracted the change in reflectivity of the twin-disc running track observed during the test, possibly caused by the changing surface roughness and/or accumulation of wear debris on the running track. Manual control of the illumination helps reveal these changes that might be overlooked with automated correction of light levels. In terms of wear flake development, the photographs showed an initial stage of running surface darkening, potentially caused by oxidation, that lasted for around the first 1000-2000 contact cycles into the test. No wear flakes were seen on the running surface until after 3100 cycles when the gradual development of easily recognisable wear flakes was identified via their shadows cast onto the running track. Wear flake size increased until about 10,000-12,000 contact cycles when the size of the wear flakes stabilised for the remainder of the experiment. In addition to wear flakes, the optical monitoring system was also able to observe the occasional creation of regions of dark banding on the disc running track. Images of the R260 twin-disc samples running track after approximately 0, 200, 1,000, 3,000, 6,000, 9,000, 12,000 and 50,000 contact cycles into the test with 1500 MPa, 1% slip, dry contact conditions while rotating at 391.3 r/min. Labels A and B on the sample shoulder were used for identification of angular position.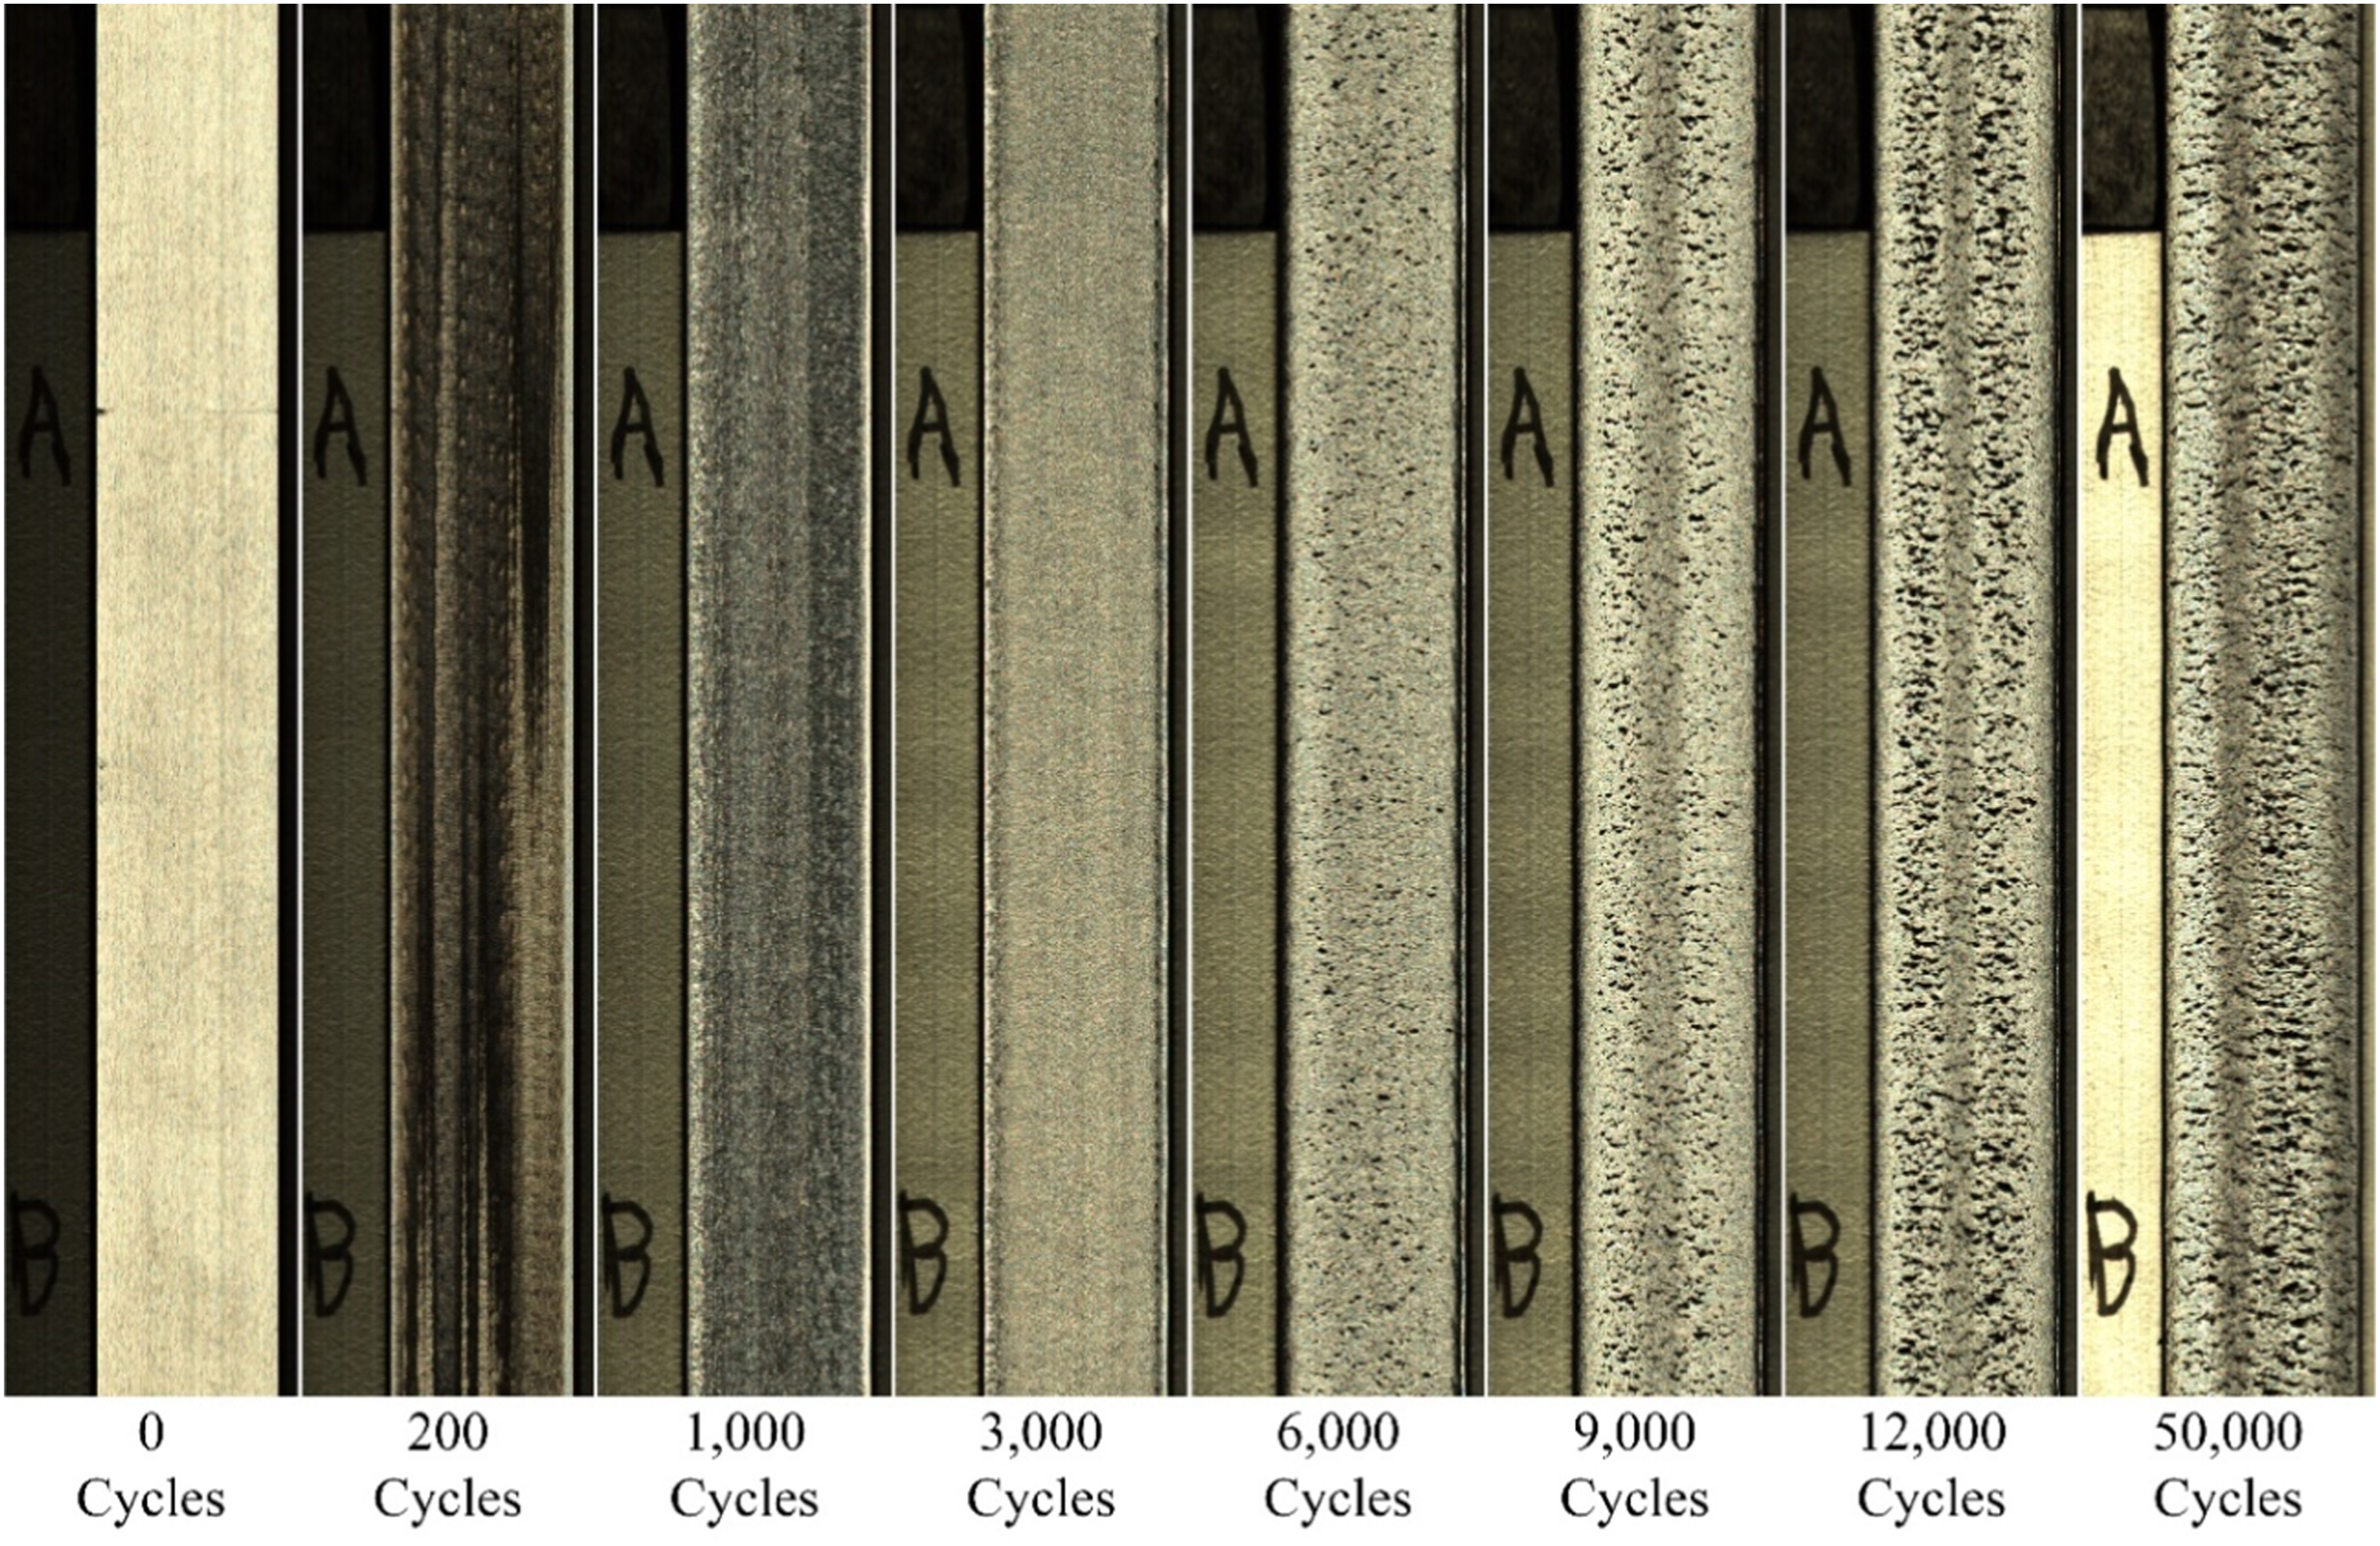
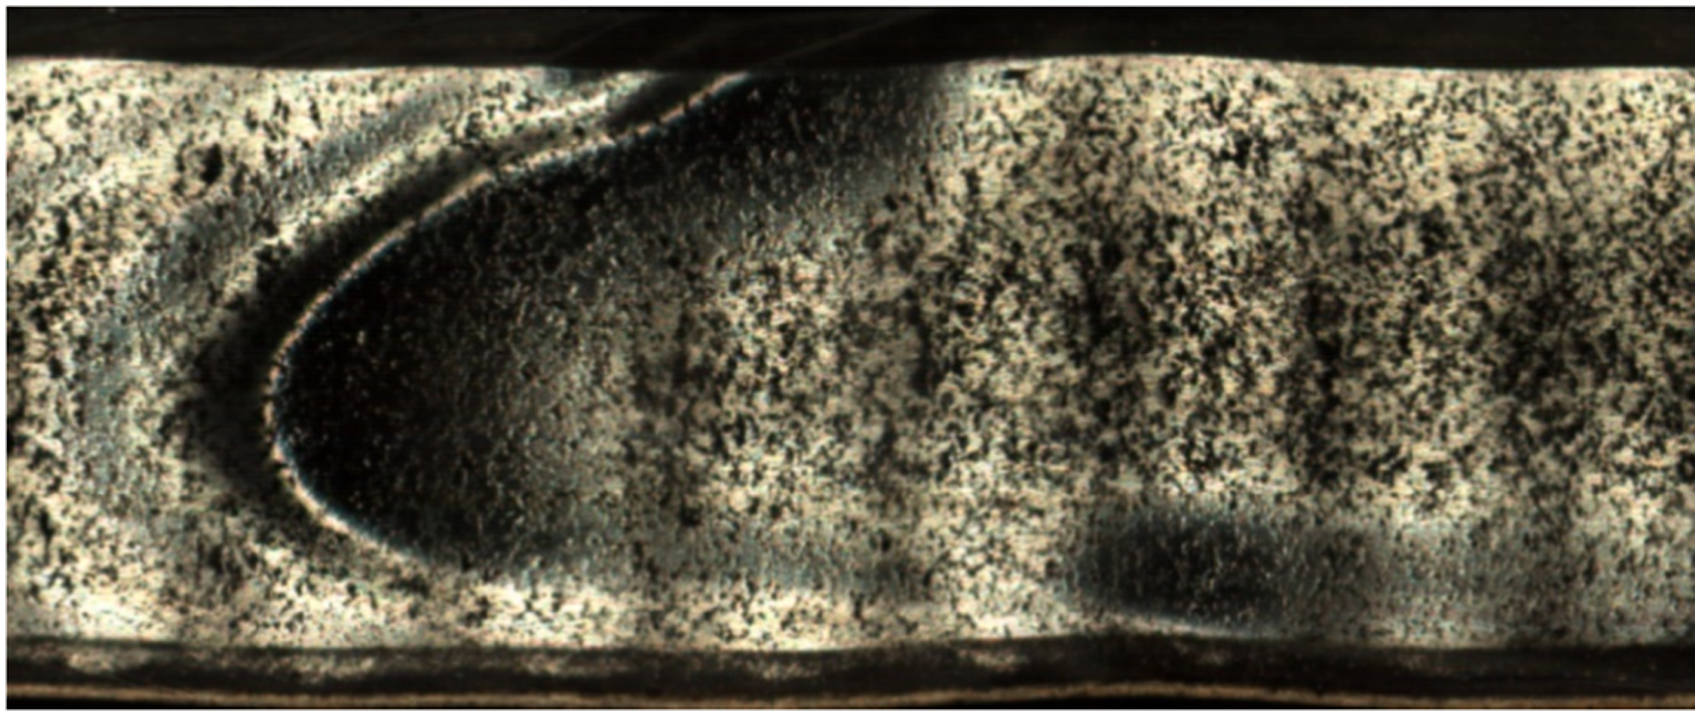
The photographs captured of the rail sample during the water-lubricated contact test are shown in Figure 6(a)-(b). The images obtained show that the optical monitoring system was able to capture images of the disc beneath the water film on the surface enabling observation of rail surface damage development. Compared with the dry contact experiment, however, the damage observed during the water-lubricated test was not as clear due to interference caused by the water present on the sample. In addition, occasional distortion caused by the water film made it difficult to observe running track features, as shown in Figure 7. Despite these issues, the equipment was still able to observe the development of RCF cracks on the running track. The images showed an initial stage of surface damage accumulation similar to that for wear flakes. After regions of damage reached a critical size (in this case) approximately 1.2 mm, either by gradual growth or by merging with adjacent regions of damage their growth was observed to accelerate. A distinct crack-like surface damage feature develops that can be tracked throughout the remainder of the test. (a) Images of the R260 twin-disc samples running track during the water-lubricated contact experiment at approximately 18,800, 20,200, 22,900, 23,900, 24,700, and 26,000 contact cycles into the water-lubricated contact portion of the test. (b) Measurement of the surface features critical length before its growth was observed to accelerate. An example of the ripples that occasionally occur with the water film on the rail twin-disc sample during the water-lubricated contact twin-disc, which causes visualisation issues for observing defects on the specimens running track.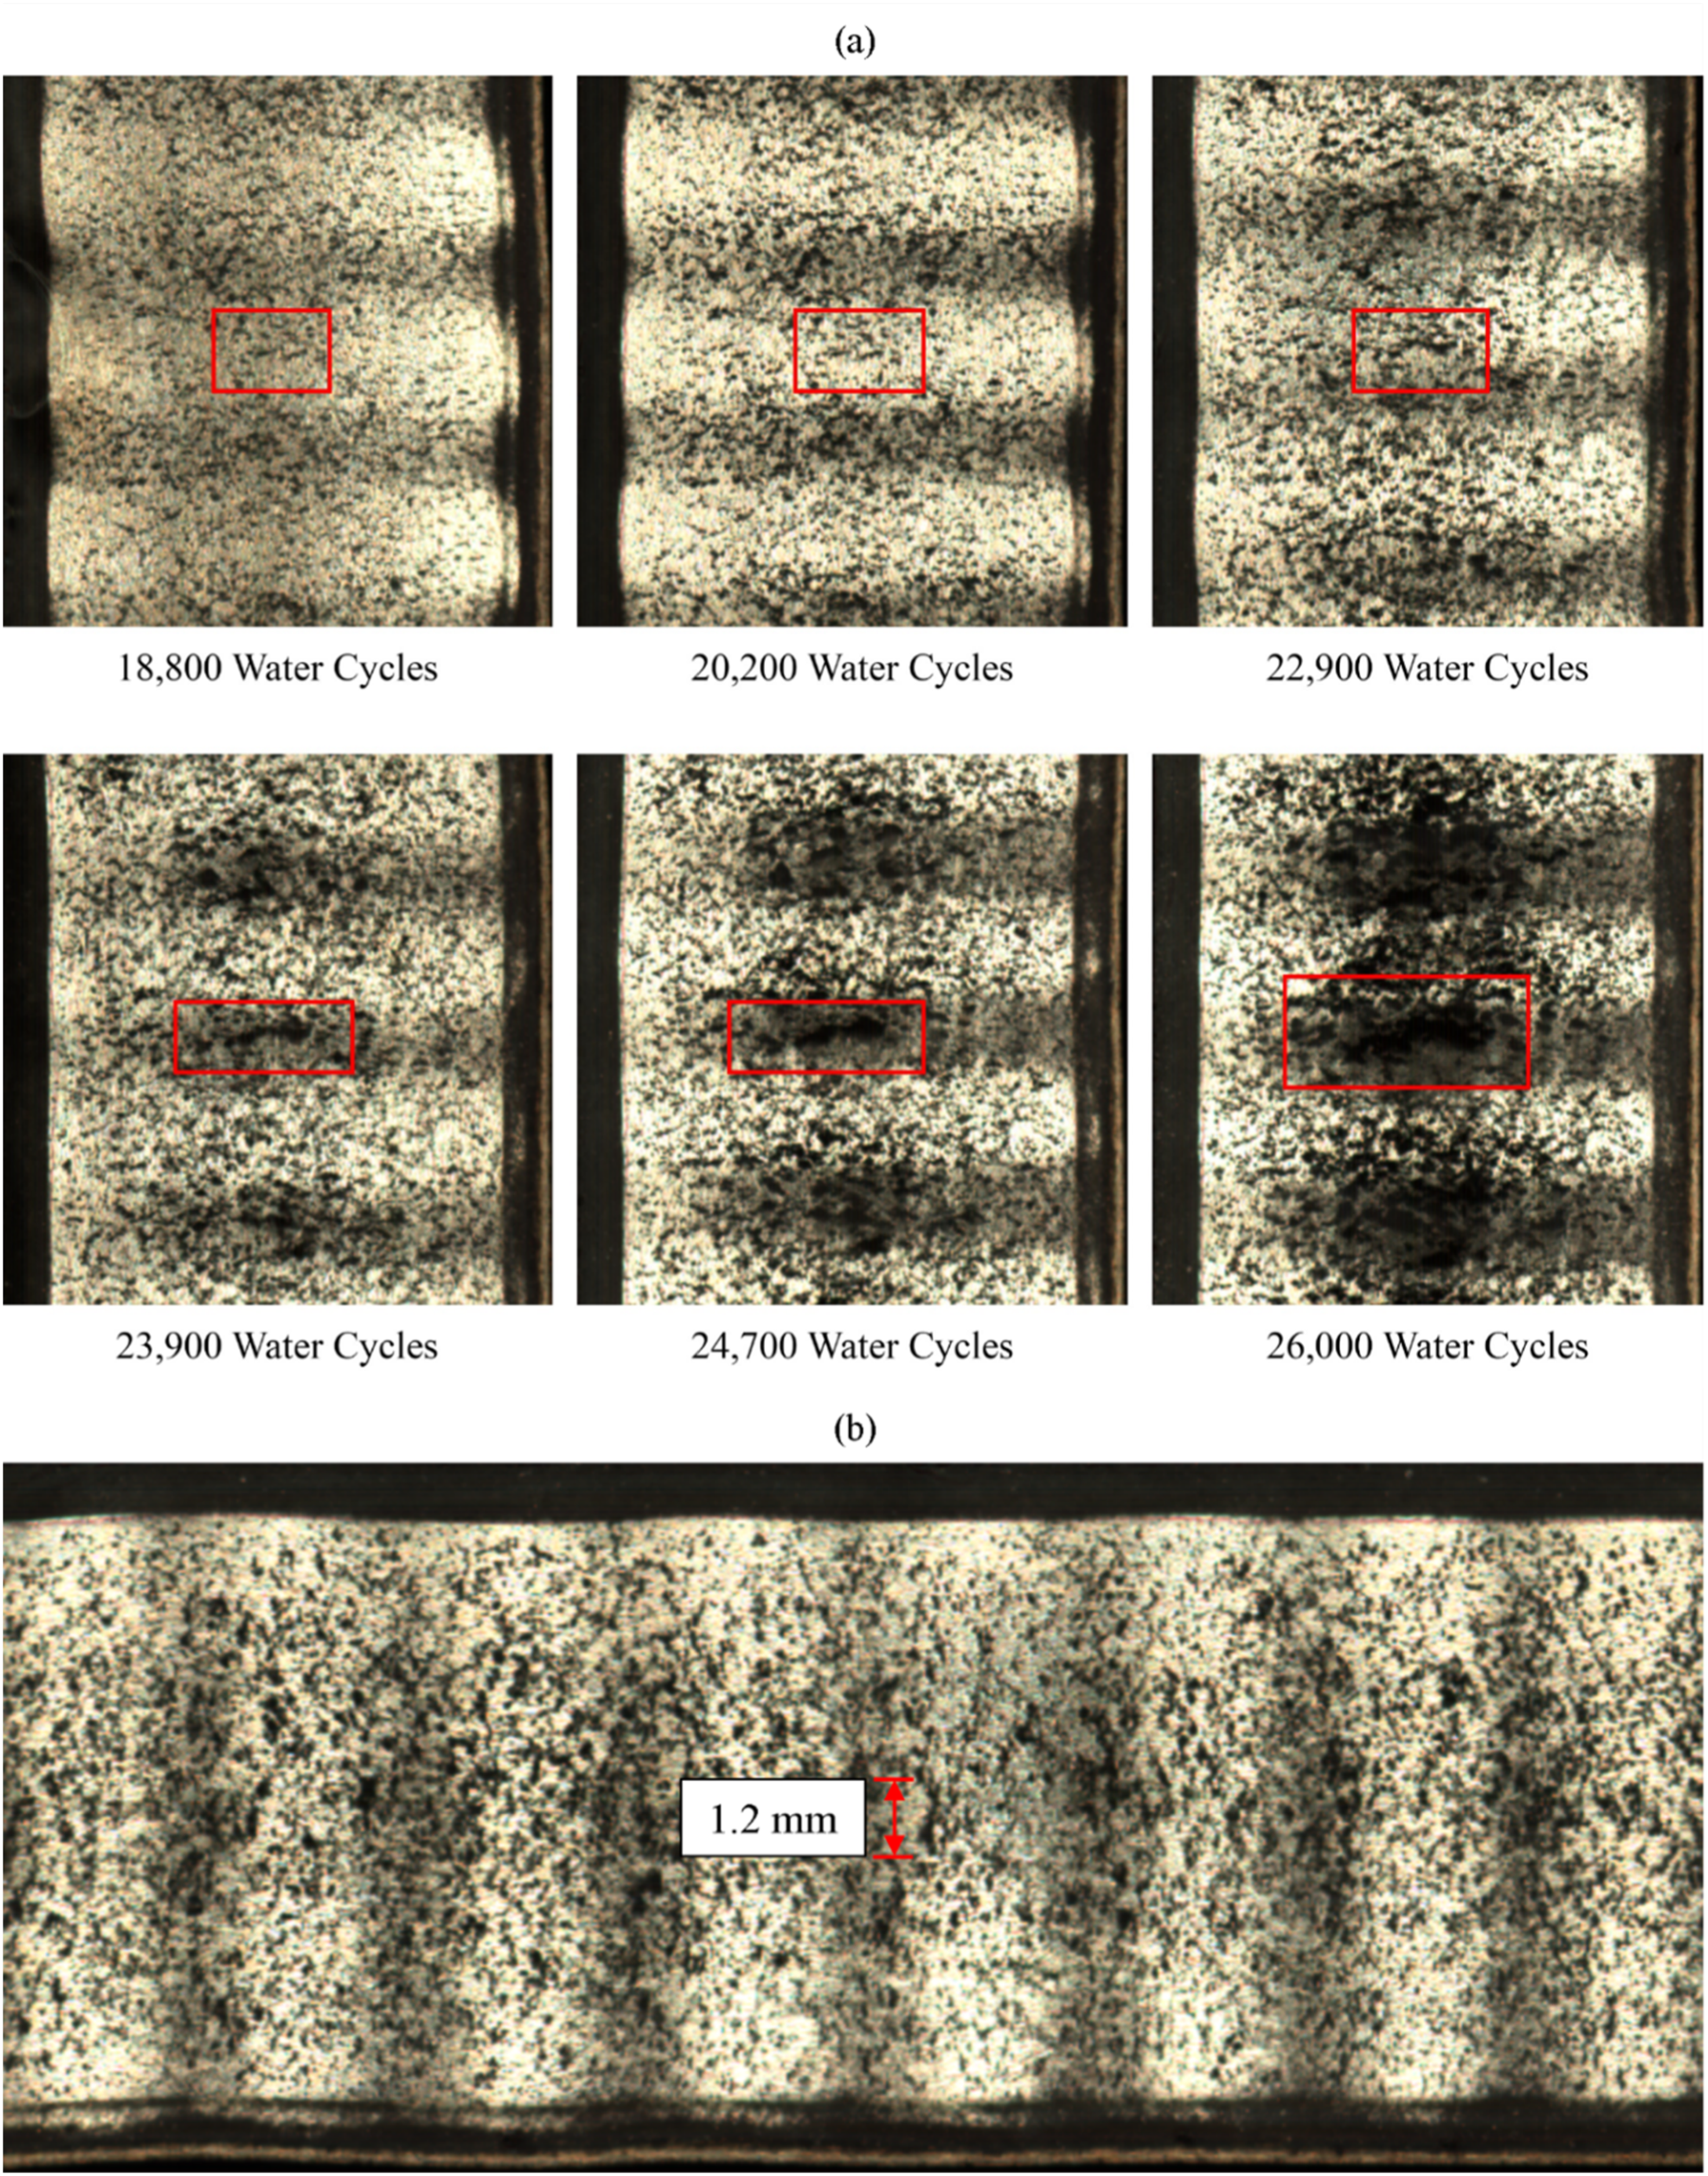
The data acquired during water lubricated testing shows the equipment supports identification of RCF crack initiation sites in a way not previously possible with techniques such as eddy current detection that only trigger for cracks in the 100s of microns size range. Improving image quality may be possible using deconvolution techniques similar to those used to remove atmospheric turbulence in images from ground-based telescopes, 37 and this will be explored in future work.
Wear flake image analysis
Image analysis using Matlab was conducted on the photographs obtained from the dry contact test (Section 3.1.2) to quantify the total wear flake shadow pixel count in each image over the test duration. The purpose of this post-processing was to understand whether wear flake shadows observed in the captured images could be correlated with the rail steel wear rate. To analyse the total wear flake shadow pixel count, the acquired images were converted to greyscale and cropped so that the area analysed was confined to just one revolution of the twin-disc sample running track identified from the location of the disc drive keyways. To define the local reference thresholding values for identifying the wear flake shadows, an average ‘local background intensity image’ was generated using the Matlab function imfilter by applying a motion blur filter with a 50 pixel length parallel to the sample running track. The wear flake shadows were then found by locating pixels of below 45% of the average local background intensity using the imcomplement function. An example of one of the processed images is shown in Figure 8. Example of (a) wear flake shadows identified from (b) the original image obtained of the twin-disc samples running track using the MATLAB image analysis script written.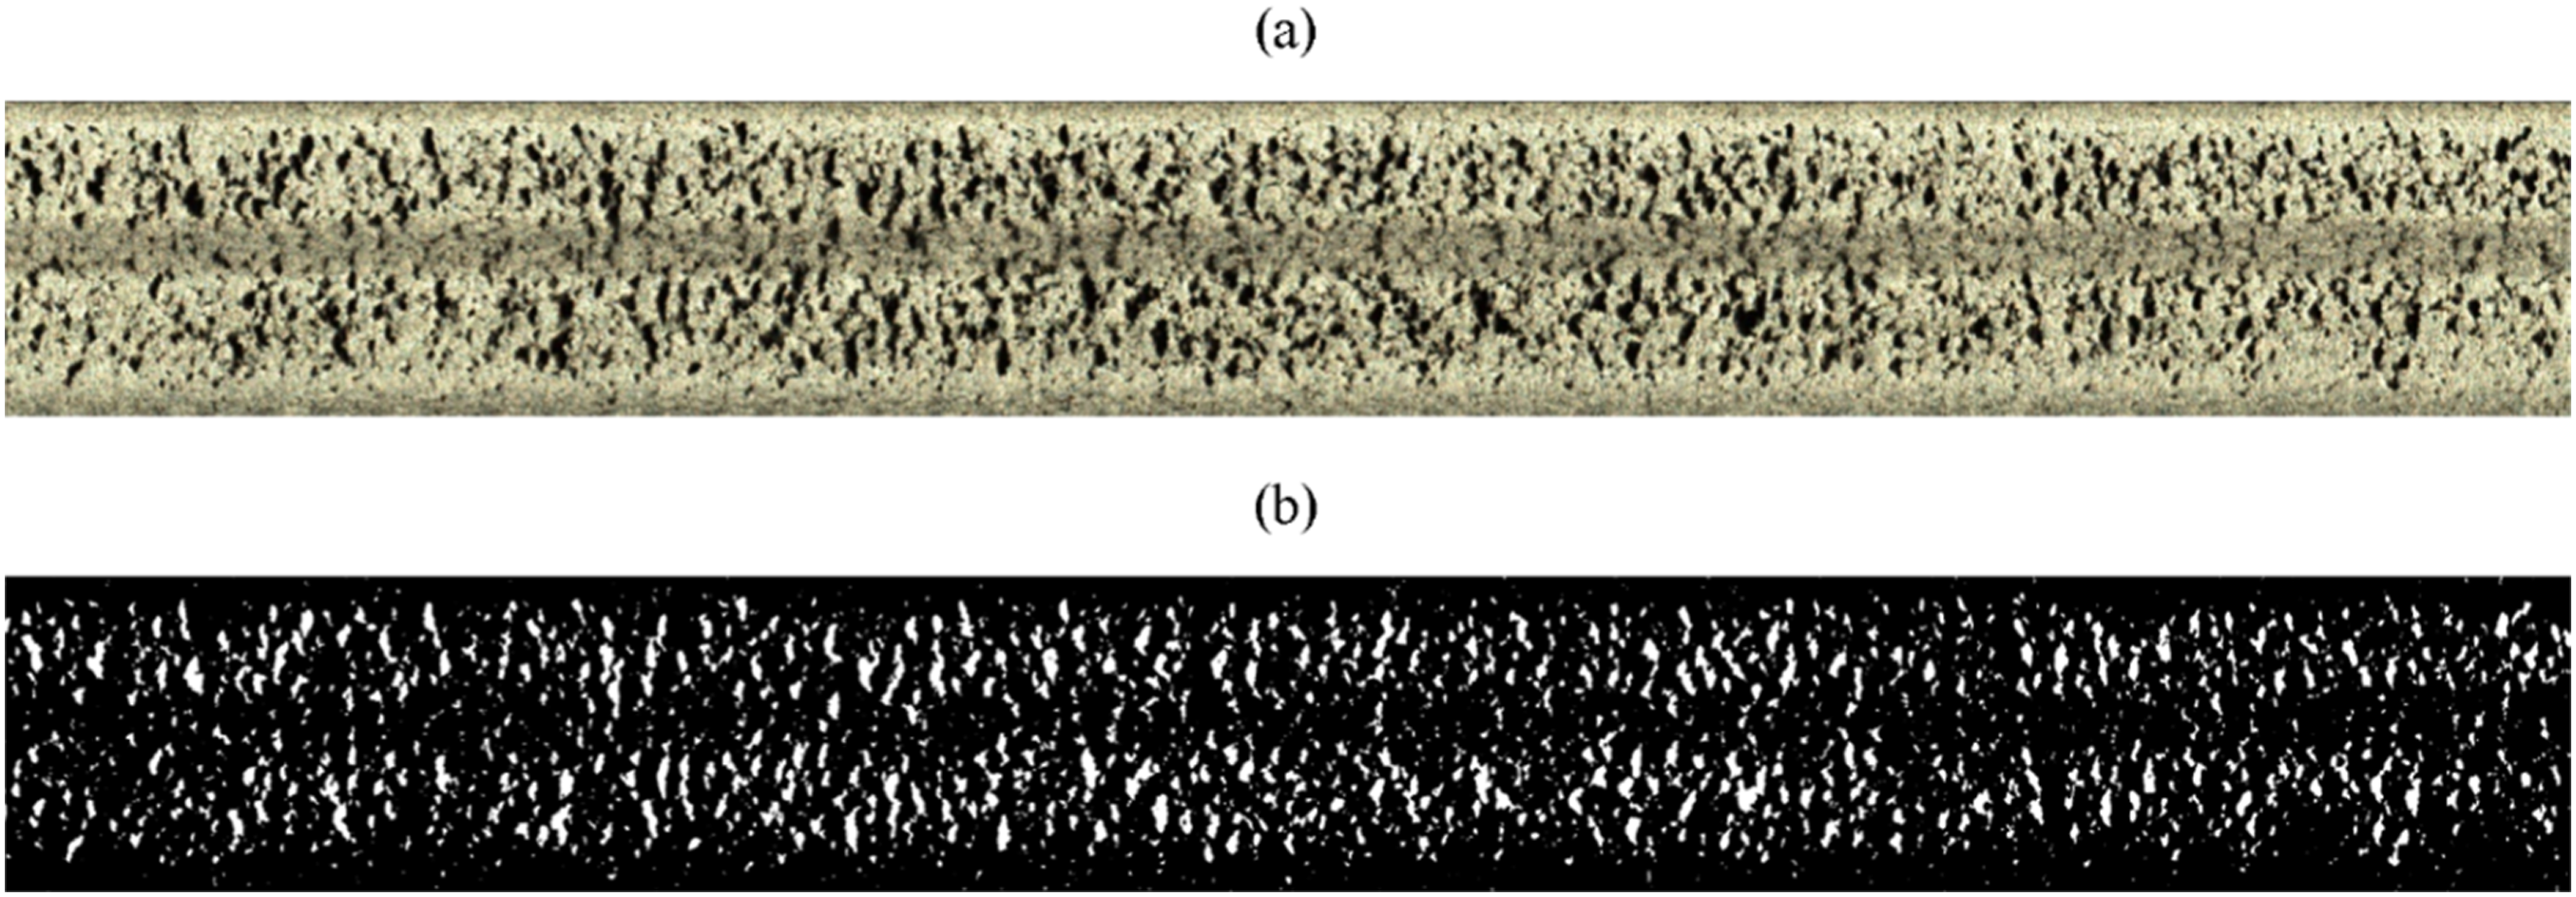
The total number of pixels identified as wear flake shadows were then counted for each image throughout the test. The image analysis data was then compared with wear test results
38
using the same material pairings and contact conditions to understand their correlation, giving the results in Figure 9. From the figure it is possible to identify three stages in the surface morphology development of wear flakes: (i) an initial period of no wear flakes, (ii) a steady rise in the wear flake shadow pixel count, and (iii) a plateauing of the total number of wear flake pixels that persists for the remainder of the experiment. There was variation observed in the total wear flake pixel count after the data plateaued, which coincided with the transient periodic appearance of dark banding on the running track. Fewer pixels were identified belonging to the wear flake shadows within these dark bands relative to in the lighter bands, as shown in Figure 8. The illumination was increased to compensate for progressive reduction in surface reflectivity throughout the experiment, as evident from the sample shoulder presented in Figure 5. However, this change was accounted for by recalculating the average local background intensity at each stage when identifying the wear flake shadows. Use of the average local background intensity image inherently corrects the results from the influence of the illumination changing. The cause of the periodically appearing dark bands is unknown, but they are commonly observed in twin disc testing. From the images it is now possible to collect a detailed record of surface change but it cannot yet be determined whether this observed reduction in the wear flake pixel count is due to the lower generation of wear flakes in these bands. An alternative explanation could be that fewer wear flake shadows were observed due to either being obscured by wear debris collecting or the wear flakes tending to be standing less prominently above the surface on the running track in those regions. Comparison of the total wear flake shadow pixel count against traditional mass loss wear data obtained for an R260 twin-disc sample tested with 1500 MPa, 1% slip, dry contact conditions.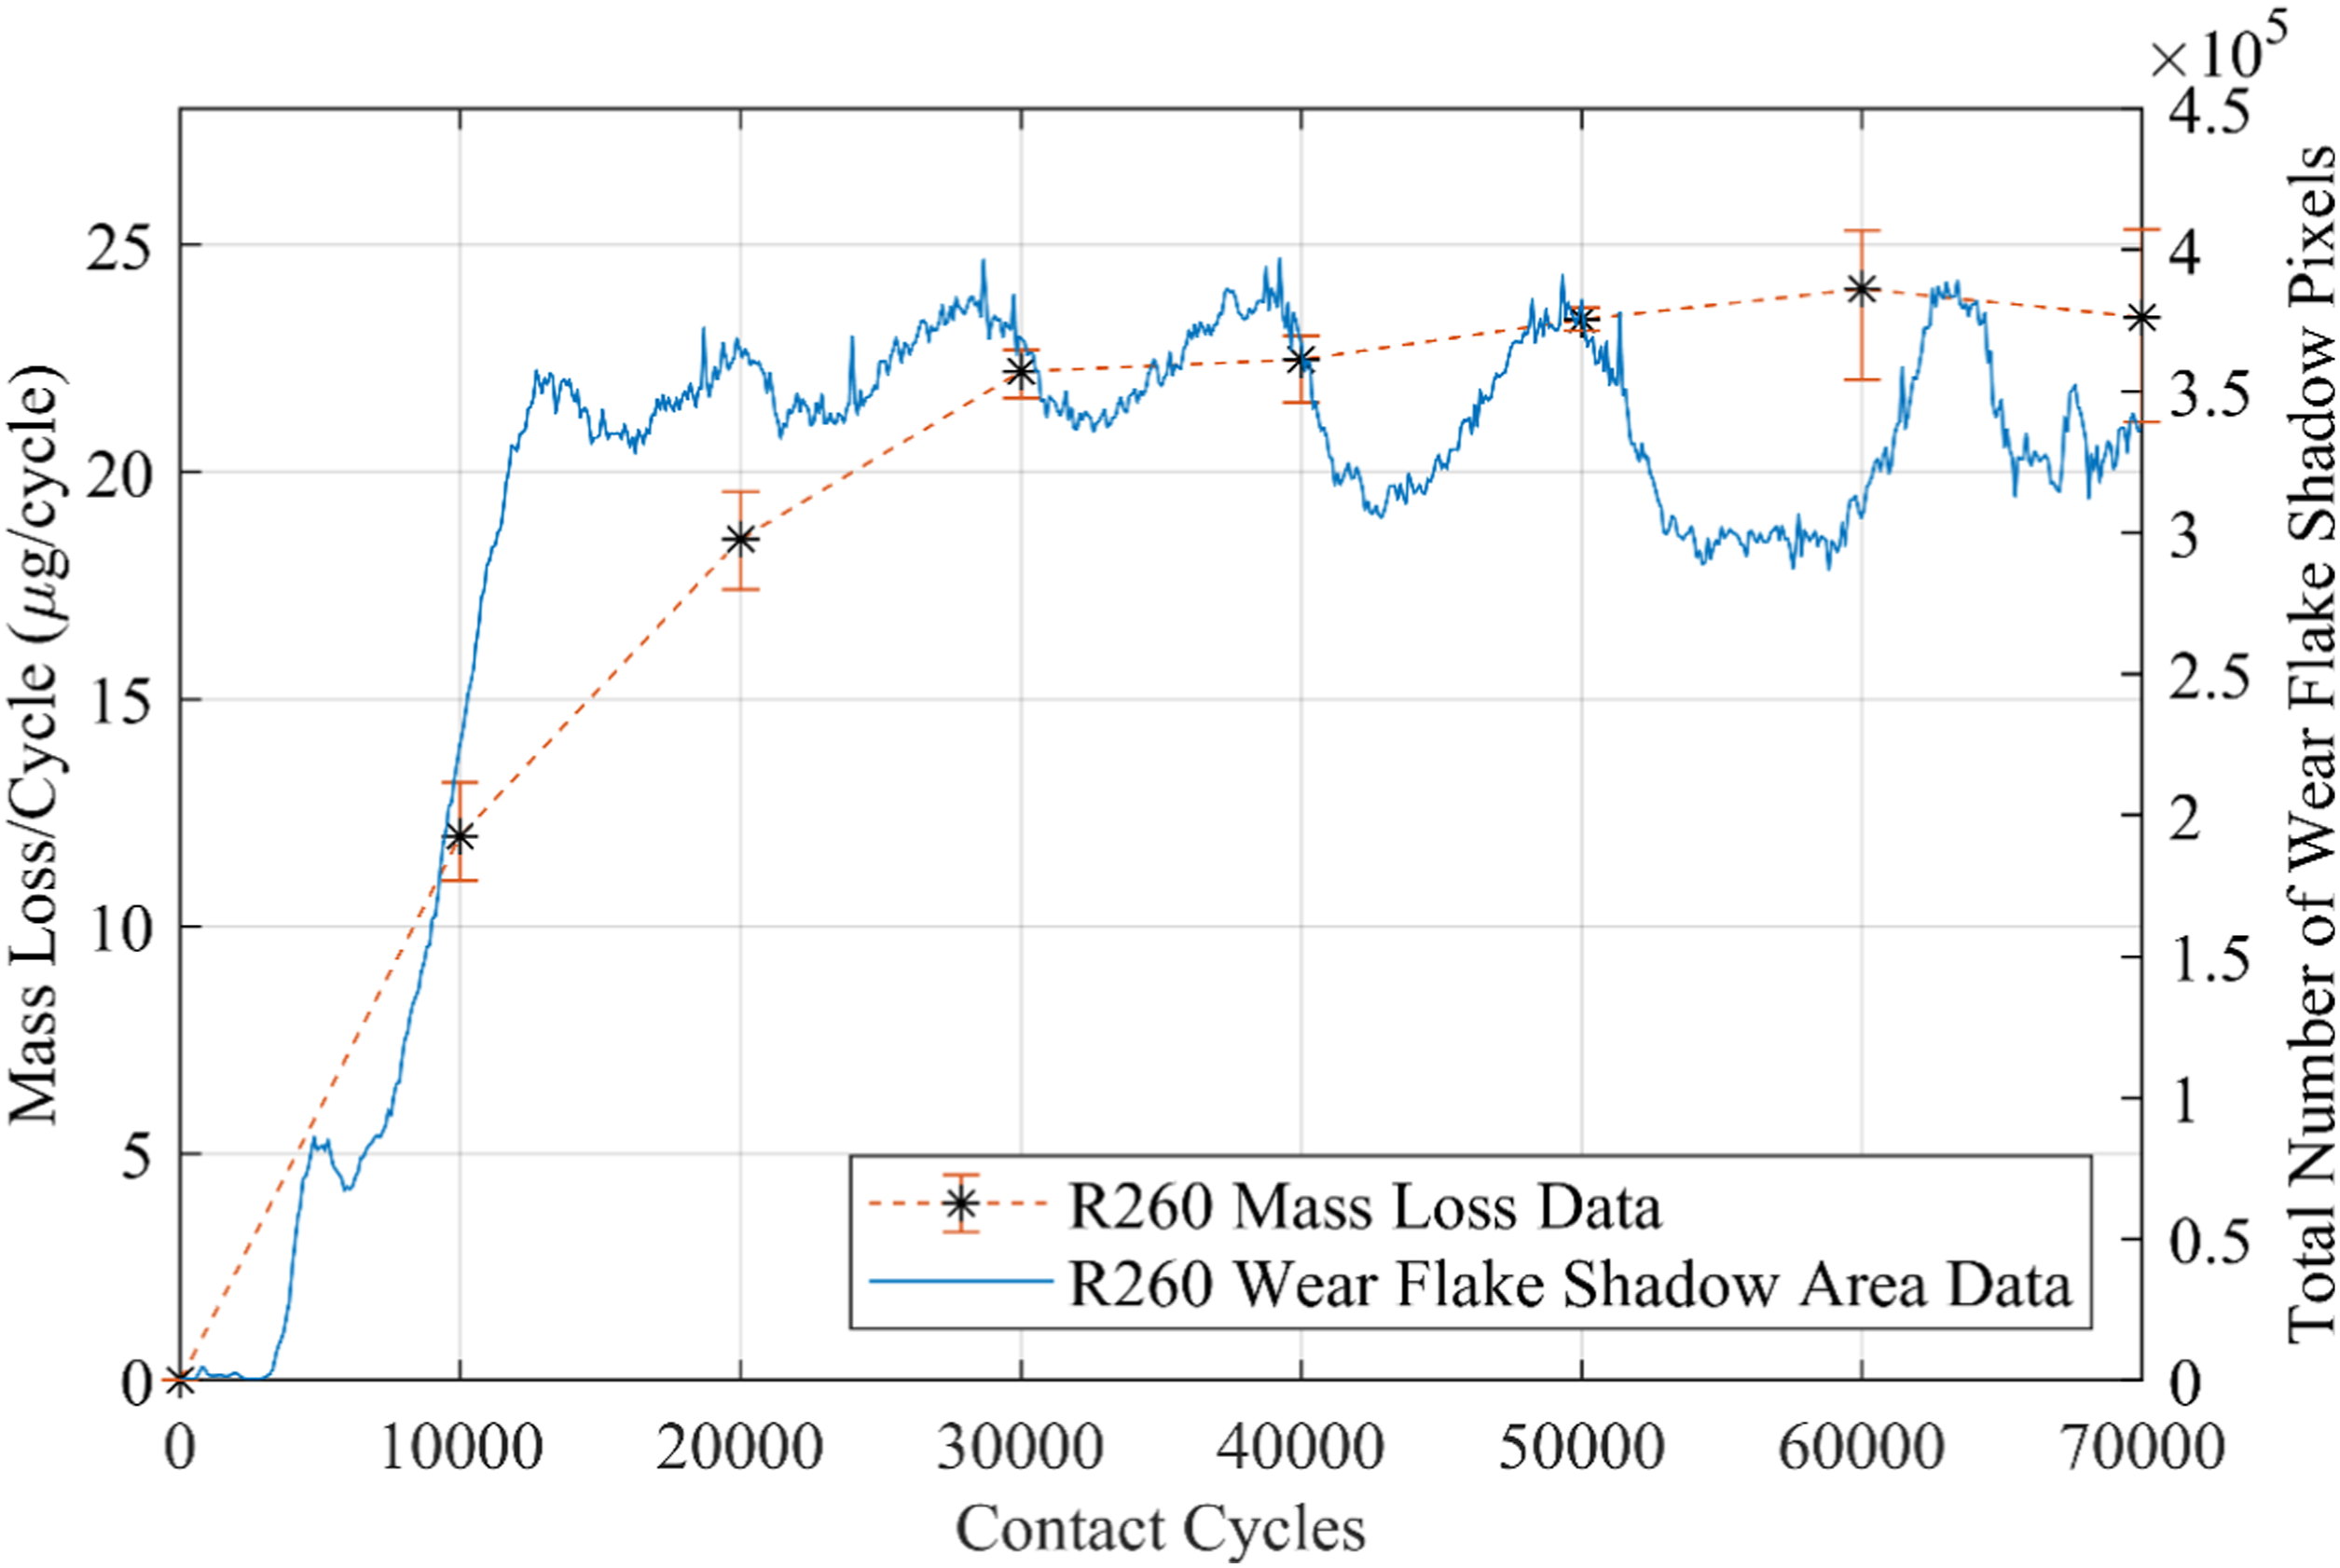
A comparison of the image analysis results with the mass loss wear data 38 shows that there is a good correlation. The total wear flake shadow pixel count plateaus at a similar stage of test as the mass loss wear data. This result indicates that the total wear flake shadow pixel count can provide insight into rail steel wear without needing to interrupt the twin-disc test. The correlation indicates that changes in wear rate can be identified directly. The optical method therefore holds the prospect of quantifying wear rates, although it’s expected this could only be by calibration against mass loss data for similar materials as visible flake development is likely to differ between materials. By tracking the development of individual wear flakes from their initiation to eventual detachment from the surface the optical system can provide evidence to help understand mechanisms of wear flake formation and removal. Observation of wear flake location relative to the external shoulders of the disc also serves as a marker to observe plastic strain in the running surface, a core aspect of ratchetting failure mechanism. 1
Conclusions
A new optical monitoring system has been developed to allow the running surface of a wear or RCF sample to be imaged without the need to interrupt the experiment. It has been demonstrated by application on the SUROS2 twin disc machine to observe rail wear and RCF crack initiation in-situ and in real time. The results obtained from dry contact tests showed the equipment can clearly record the development of wear flakes from a running sample surface. This enables the point at which wear flakes first visibly initiate and later stabilise in size to be observed. Analysis of the images obtained showed good correlation between the observed wear flakes and mass loss wear results, indicating the potential for this system to quantify wear behaviour without the need to interrupt the test.
Images acquired during a water-lubricated test showed the equipment was capable of imaging RCF cracks under a water film. The water on the specimen reduced image sharpness, and in future work the potential will be explored to improve these images using techniques developed for ground-based telescopes affected by atmospheric turbulence. After an RCF crack is identified it is possible to track its development throughout the test. The data acquired shows the potential for identifying RCF crack initiation sites at a much earlier stage than previously possible with techniques such as eddy current detection. Application of the optical system is not confined to rail-wheel material investigation and has potential use in a range of tribological testing. However, in its immediate future application it has potential to provide much greater insight than previously possible to the origin of rail surface damage (wear flakes, RCF cracks, plasticity) and the behaviour of products such as flange lubricants or top of rail friction modifiers.
Footnotes
Acknowledgements
The authors would like to acknowledge the EPSRC (Engineering and Physical Sciences Research Council) through the Advanced Metallic Systems CDT (EPSRC grant ref. EP/L016273/1) and British Steel Ltd for providing the funding for this research. The authors would also like to thank British Steel Ltd for providing the rail steel and Wabtec Rail Ltd for providing the wheel steel used to manufacture the twin-disc samples tested in this work. Dr Steve Maddock, Head of the Visual Computing research group at the University of Sheffield, is thanked for his discussion of potential future ways to improve the images from water lubricated tests. For the purpose of open access, the author has applied a Creative Commons Attribution (CC BY) license to any Author Accepted Manuscript version arising.
Declaration of conflicting interests
The author(s) declared no potential conflicts of interest with respect to the research, authorship, and/or publication of this article.
Funding
The author(s) disclosed receipt of the following financial support for the research, authorship, and/or publication of this article: This work was supported by the British Steel, Engineering and Physical Sciences Research Council; (EP/L016273/1).