
Abstract
A fast and accurate method is described for determining the surface movement of railway ballast during a full-scale lateral resistance test. The proposed method utilises commodity camera equipment and open-source Digital Image Correlation (DIC) algorithms, to track individual ballast particles. It does not require time intensive ballast preparation. Tests have been performed under ambient and floodlit conditions, using colour and greyscale processing routes. The results are compared against direct measurements from lateral resistance tests to assess the accuracy of the proposed method, with a range of absolute maximum error between 0.9% and 3.4% under different laboratory conditions. The study shows that this technique is a viable way to track and measure ballast and sleeper movement over wide areas in near real time, which will lead to an increased understanding of the way ballast interactions influence track behaviour.
Introduction
A key requirement of railway sleepers (or ties) is to provide lateral stability to the rails, enabling them to resist lateral movement under train load or due to rail thermal stress. To provide this lateral resistance, forces on the sleeper from the rails must be reacted at the interface of the sleeper with the ballast. The resistance available at this interface can be characterised by a force displacement curve generated using the method described by BS 500:2000, 1 and this forms an input to models of track lateral stability. 2 Testing conducted to characterise sleepers of differing design and the effect of ballast structure or consolidation provides the required force displacement data. A deeper understanding about the track system and the factors determining its performance can be obtained by monitoring the movement of the ballast itself, rather than just the sleeper.
This paper describes an easily deployed single camera Digital Image Correlation (DIC) process for analysing the movement of railway ballast as a sleeper is displaced toward the ballast shoulder, at full scale. DIC is a robust non-contact technique typically used for measuring material deformation. DIC uses a sequence of images captured at high frequency relative to the movement speed of the subject, thereby allowing features of interest to be tracked over time. The scale agnostic nature of DIC allows for the study of deformation at different magnitudes from meters to the nanoscale. 3 This work makes use of commodity camera hardware and open source DIC algorithms, known as ‘NCORR’ and created by Blaber et al., 3 applied for the first time to a full-scale sleeper lateral resistance test. The results are compared with those generated at reduced scale by Le Pen et al., 4 using a bespoke DIC approach, 5 and good agreement is found in observation of ballast movement.
Experimental apparatus
A ballast box of 5000 mm by 2500 mm, containing approximately 9 tonnes of ballast graded in accordance with NR/L2/TRK/8100
6
was built at British Steel Limited R&D Centre to test the lateral resistance of different types of railway sleepers at full-scale in accordance with BS 500:2000.
1
The lateral resistance test was accomplished by gradually pushing a single sleeper towards a shoulder of formed ballast using a Thomson 60 kN T13-B5010 M linear actuator, in the schematic and set-up shown in Figures 1 and 2 respectively. The horizontal (Figure 1, item 2) and vertical sleeper displacements (Figure 1, item 3) and 4) are monitored directly by Penny & Giles SLS130 and Caldaro S1SF linear variable differential transducers (LVDTs), whilst the resistance generated by the sleeper is measured by a VPG 50 kN load cell (Figure 1, item 1). The box has the capacity to test up to three sleepers at a time with a separation of at least 650 mm, although multi-sleeper tests are outside the scope of BS 500:2000. All force and position data is acquired at a frequency of 10 Hz. Schematic representation of the ballast box and camera rig showing ballast box; measurement equipment (items 1,2,3,4); DSLR (item 5); LED Light (item 6). The ballast box in situ at British Steel R&D, inset (a) DSLR and LED Light; (b) actuator, load cell and Uplift LVDT; (c) actuator and Uplift LVDT; (d) actuator and displacement LVDT.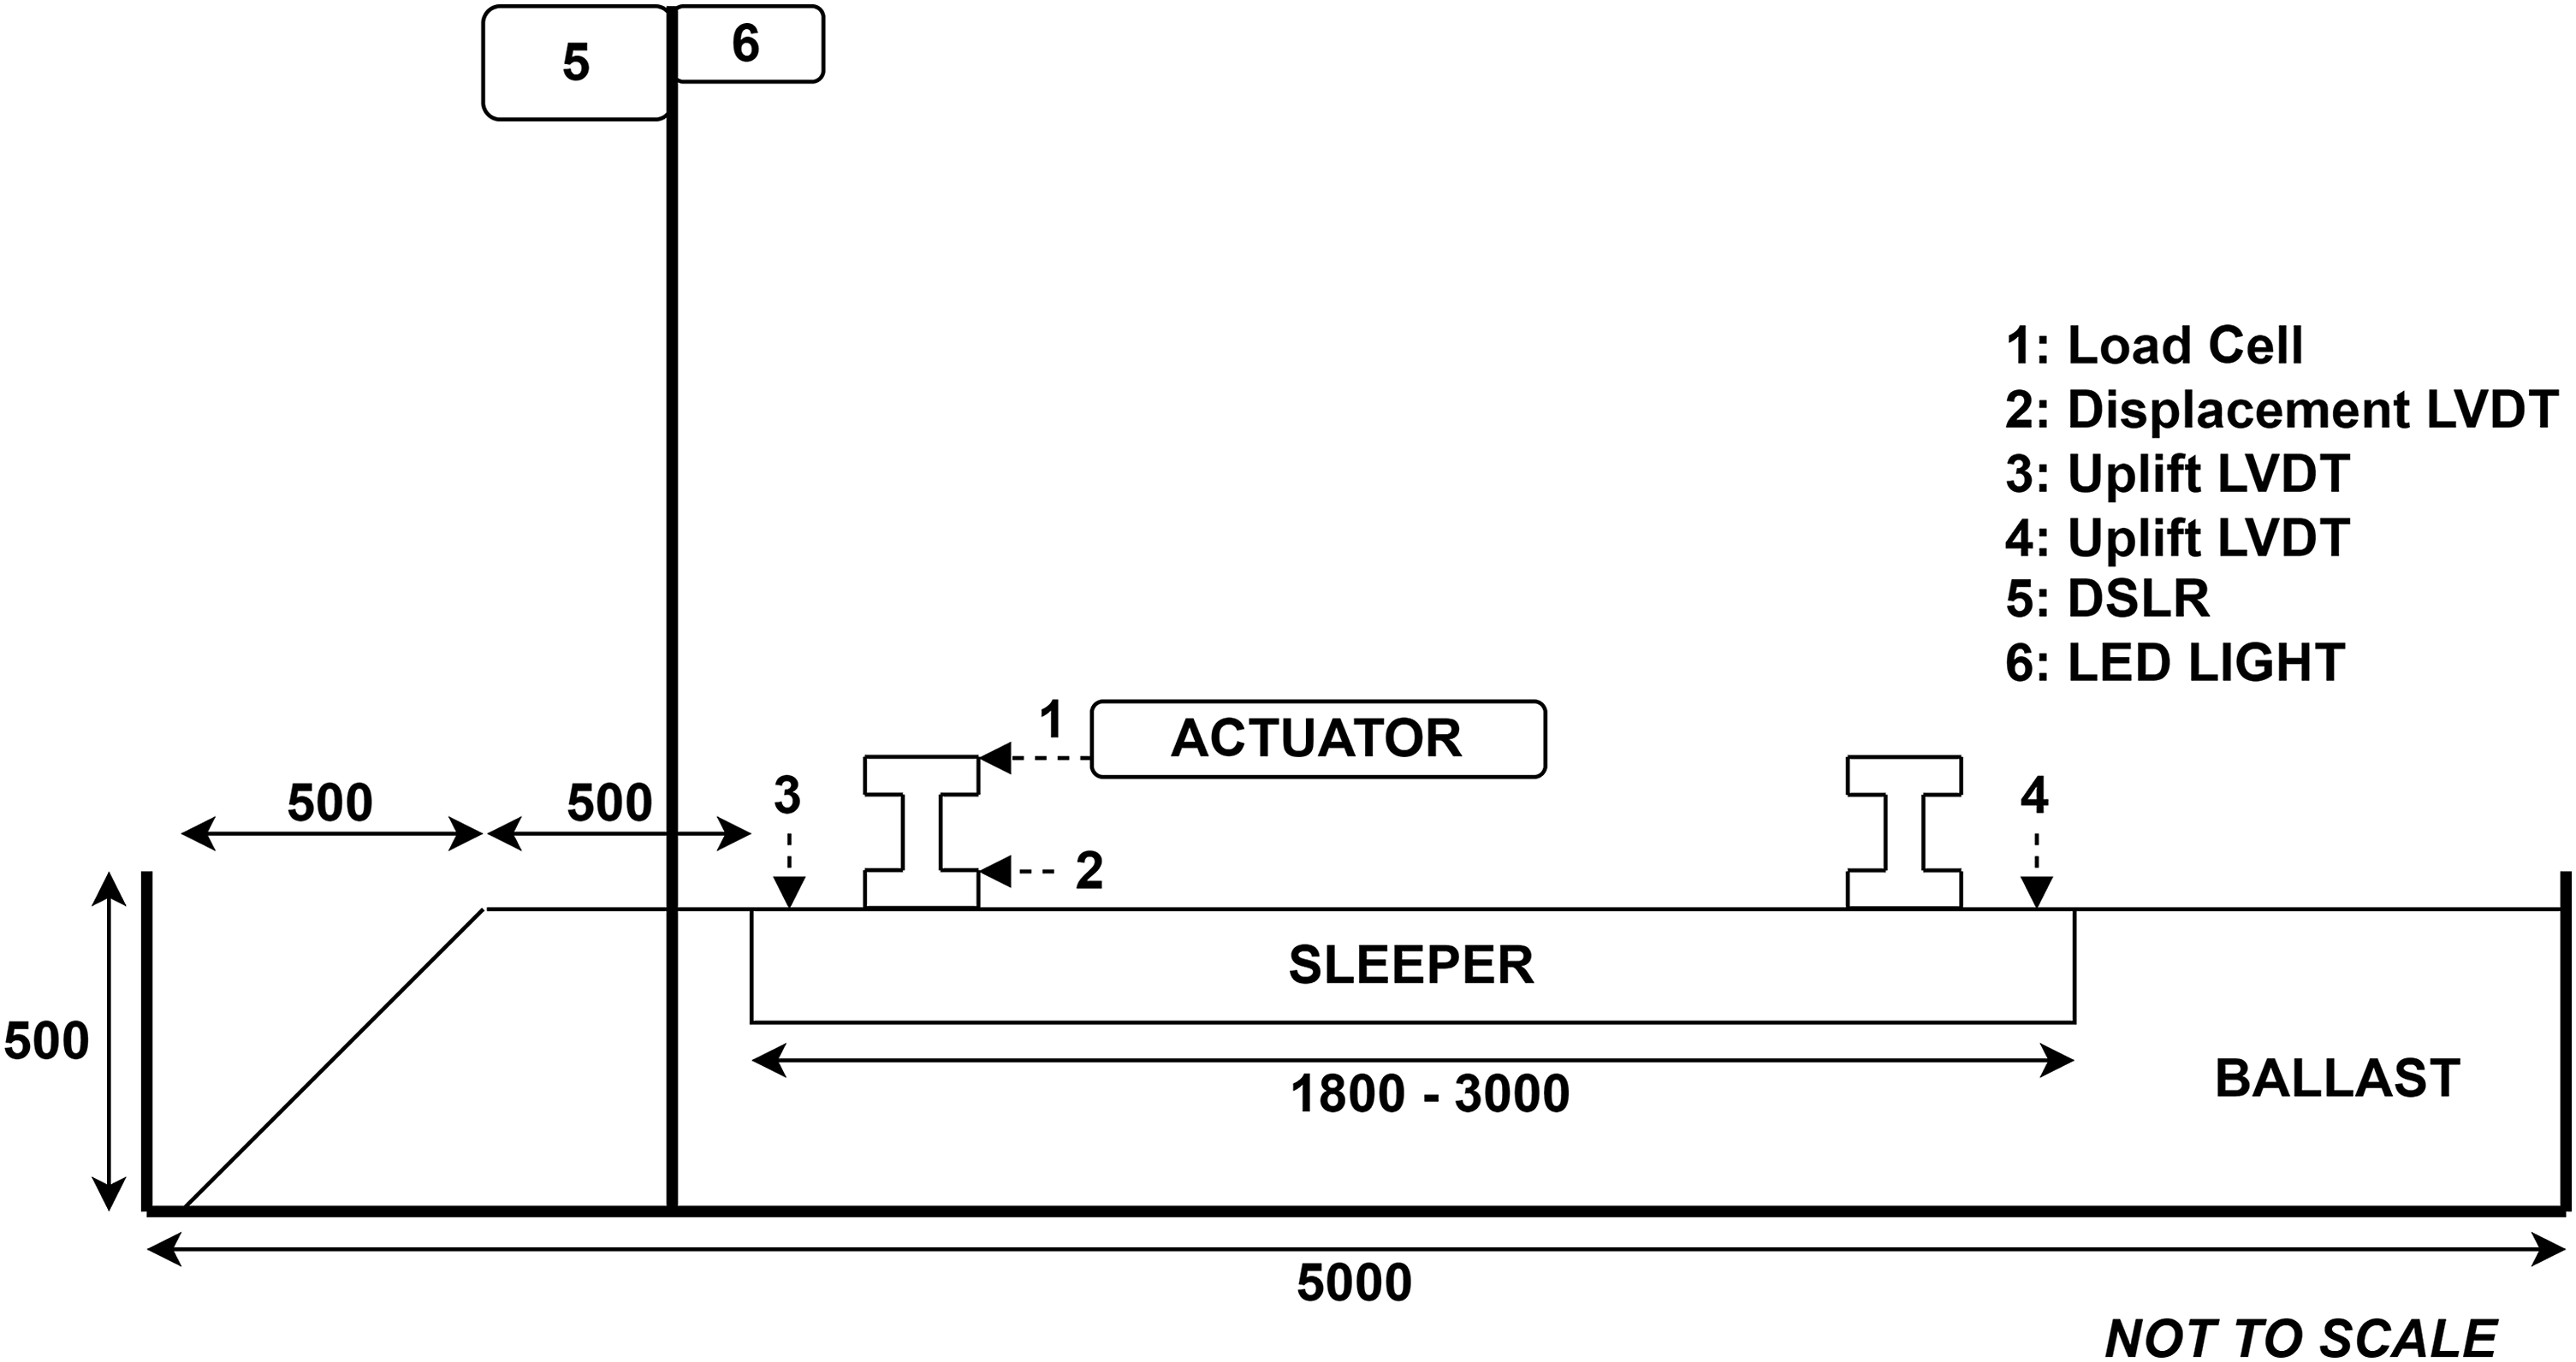
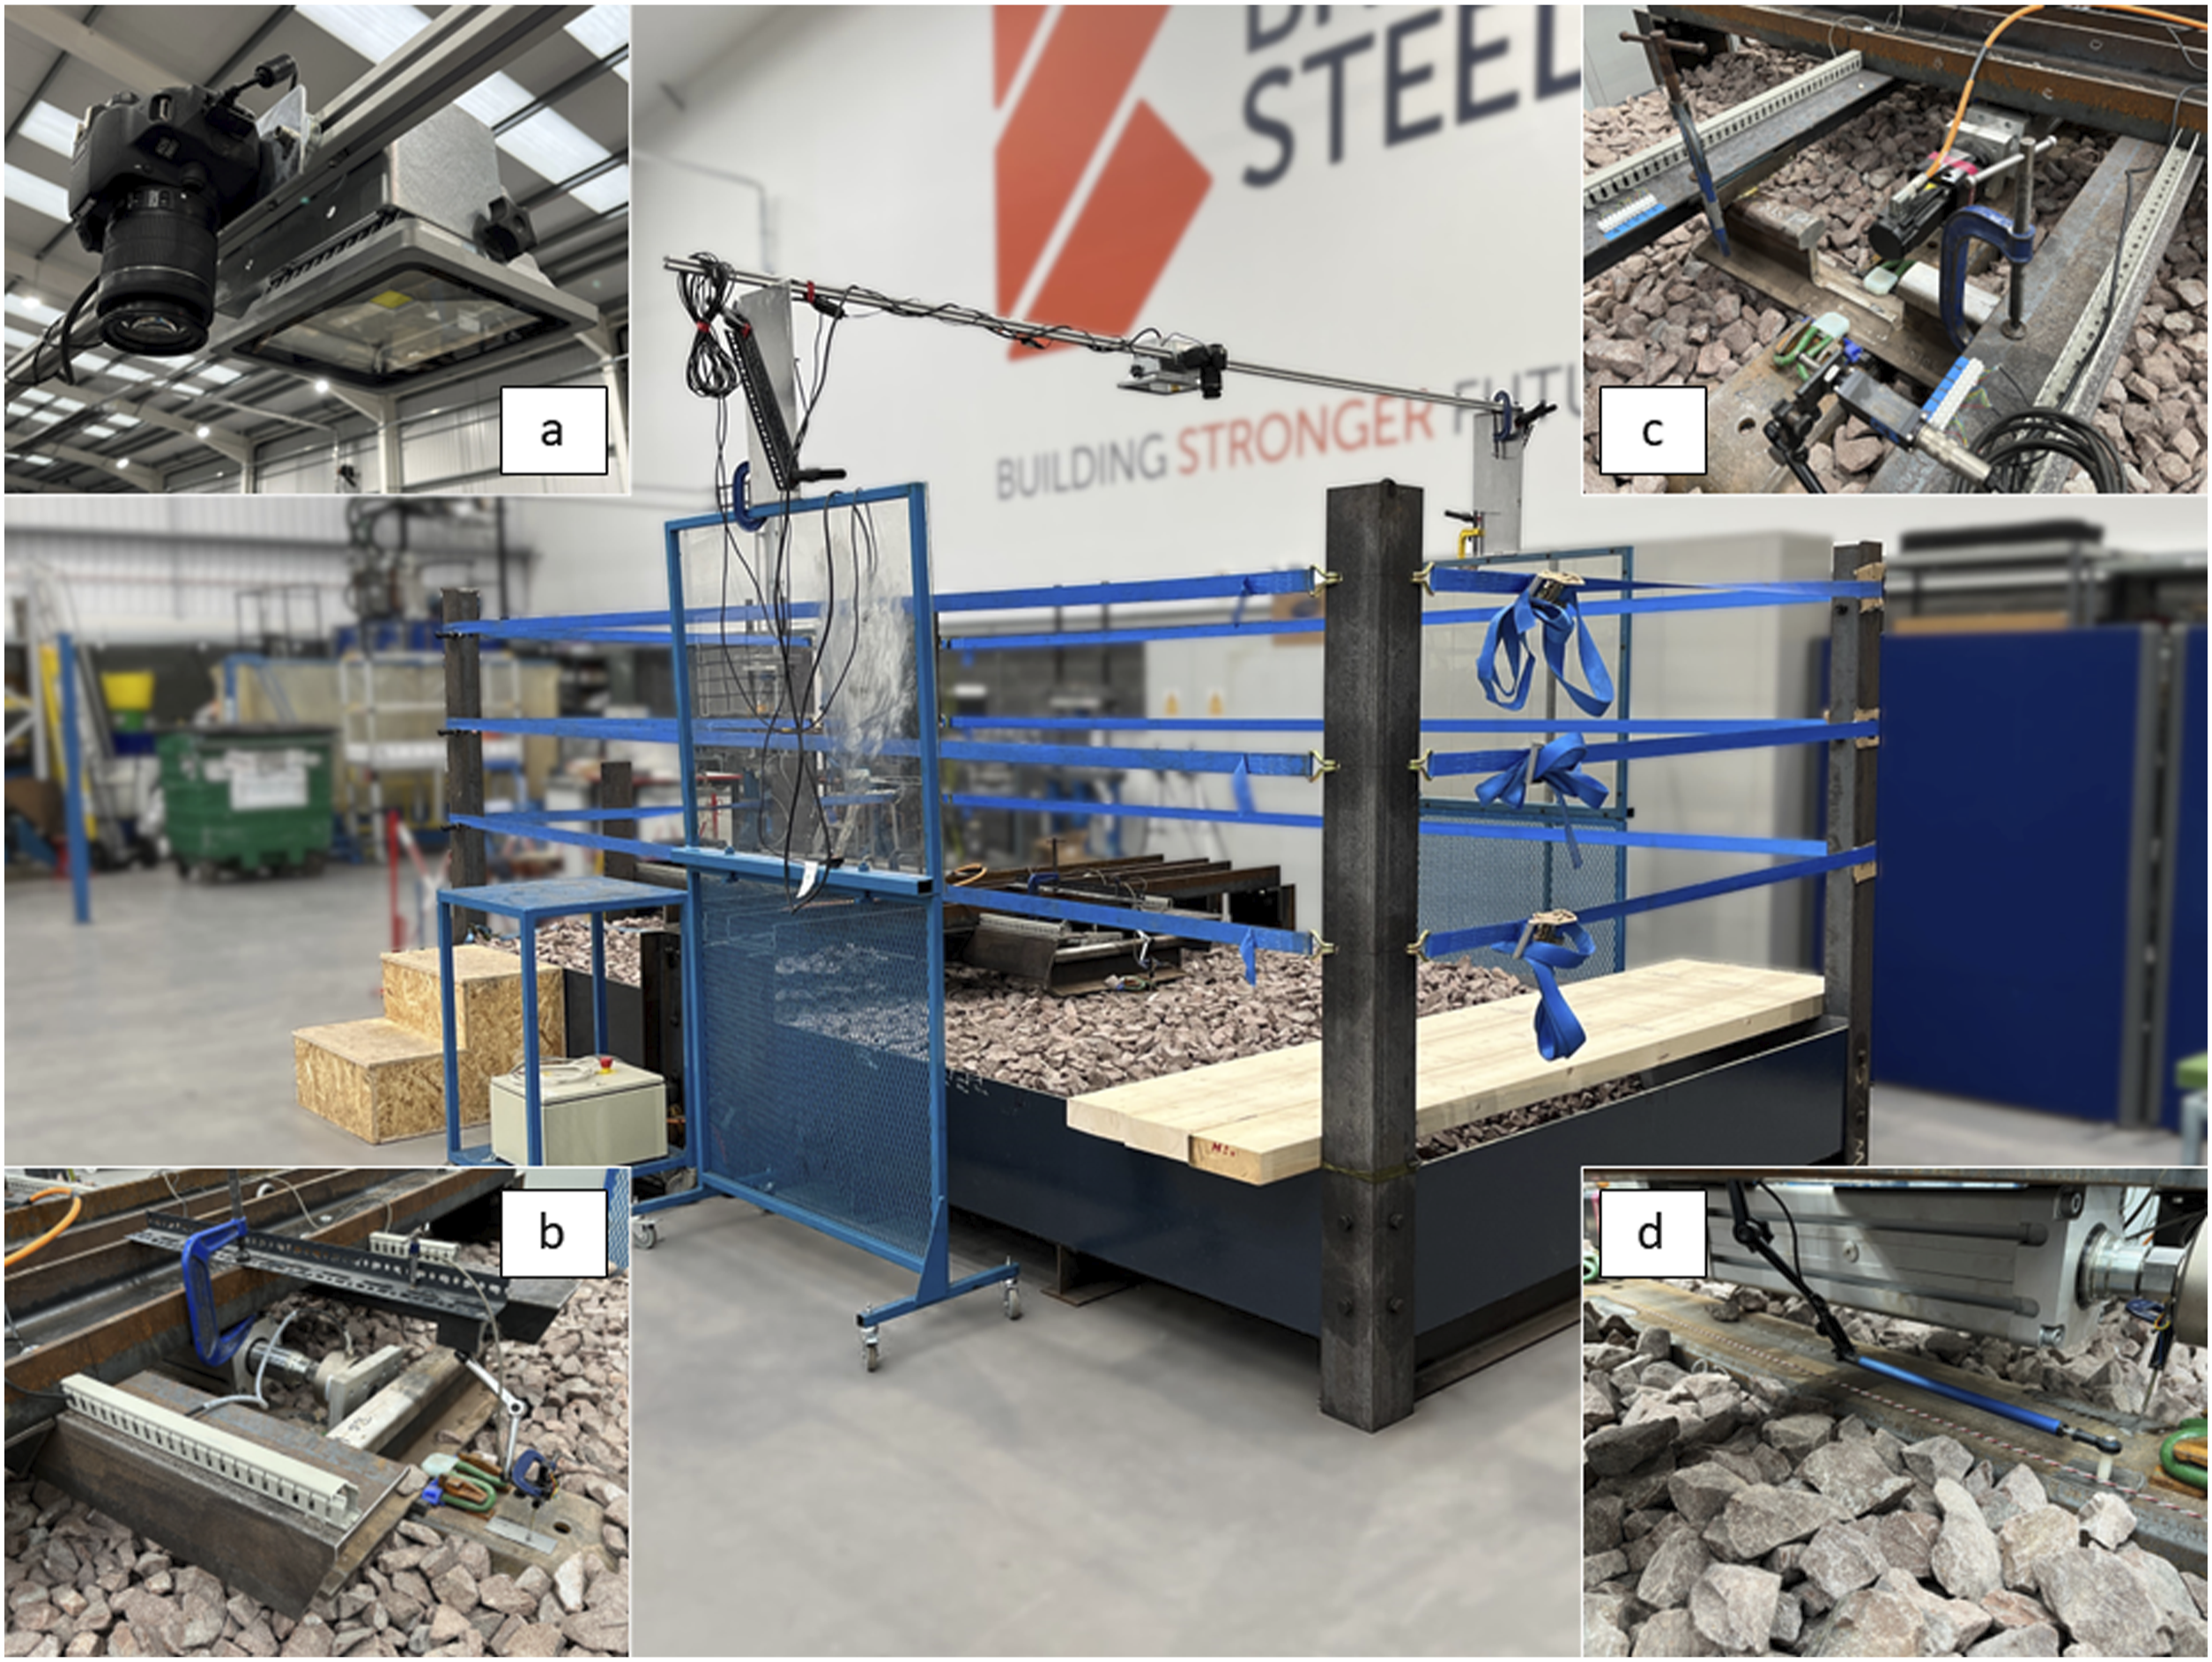
Image acquisition equipment
Continuous video footage of the sleeper and ballast was taken from directly above using a commercially available 20-megapixel Digital Single-Lens Reflex (DSLR) camera (Figure 1, item 5) using an autofocussing lens with a focal length of 18 mm. This results in a spatial resolution for the system of approximately 1.35 mm/pixel across the 2500 mm ballast box. To supplement the sky and ceiling lights, a 30W LED floodlight (Figure 1, item 6) was positioned above the region of interest; giving two possible lighting conditions at the ballast, ambient and floodlit. These lighting conditions were measured at an illuminance of 5100 Lux and 10,000 Lux respectively using a calibrated light meter.
Experimental methodology
Laboratory ballast box test results and conditions.
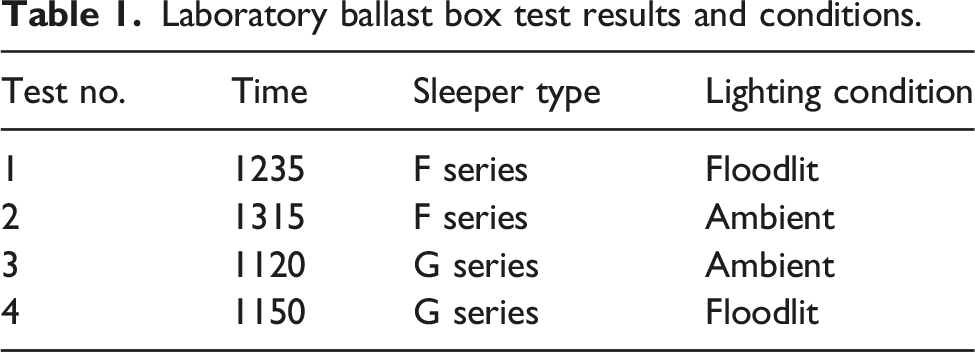
Image analysis methodology
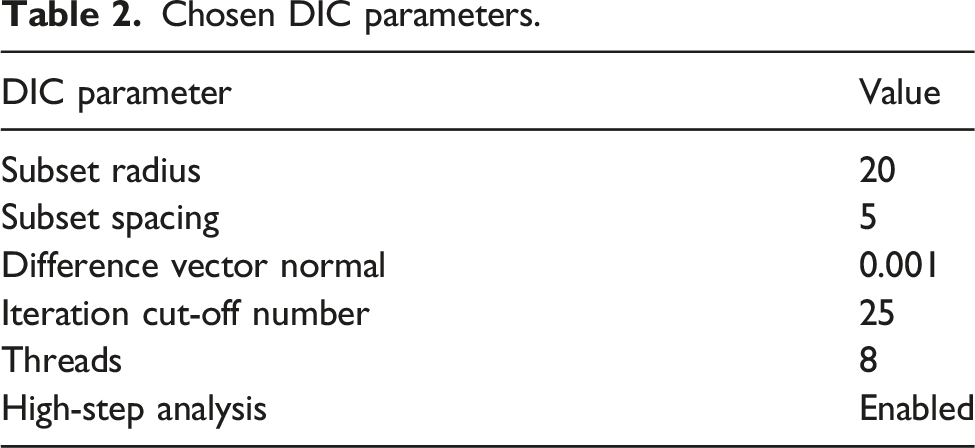
Chosen DIC parameters.
The primary focus of this technique is to measure the movement of the ballast particles. However, sleeper displacement can also be quantified and is used here as an accurate and convenient validation mechanism. The displacement distance calculated by this technique is the maximum caused by the movement of the sleeper.
Results
Each test generates a force displacement graph, an example of which is shown in Figure 3. The shape is indicative of the sleeper and ballast system tested. These show similar lateral resistance results to other studies, particularly in the early displacement region.10,11 Example force displacement plot (Test 3).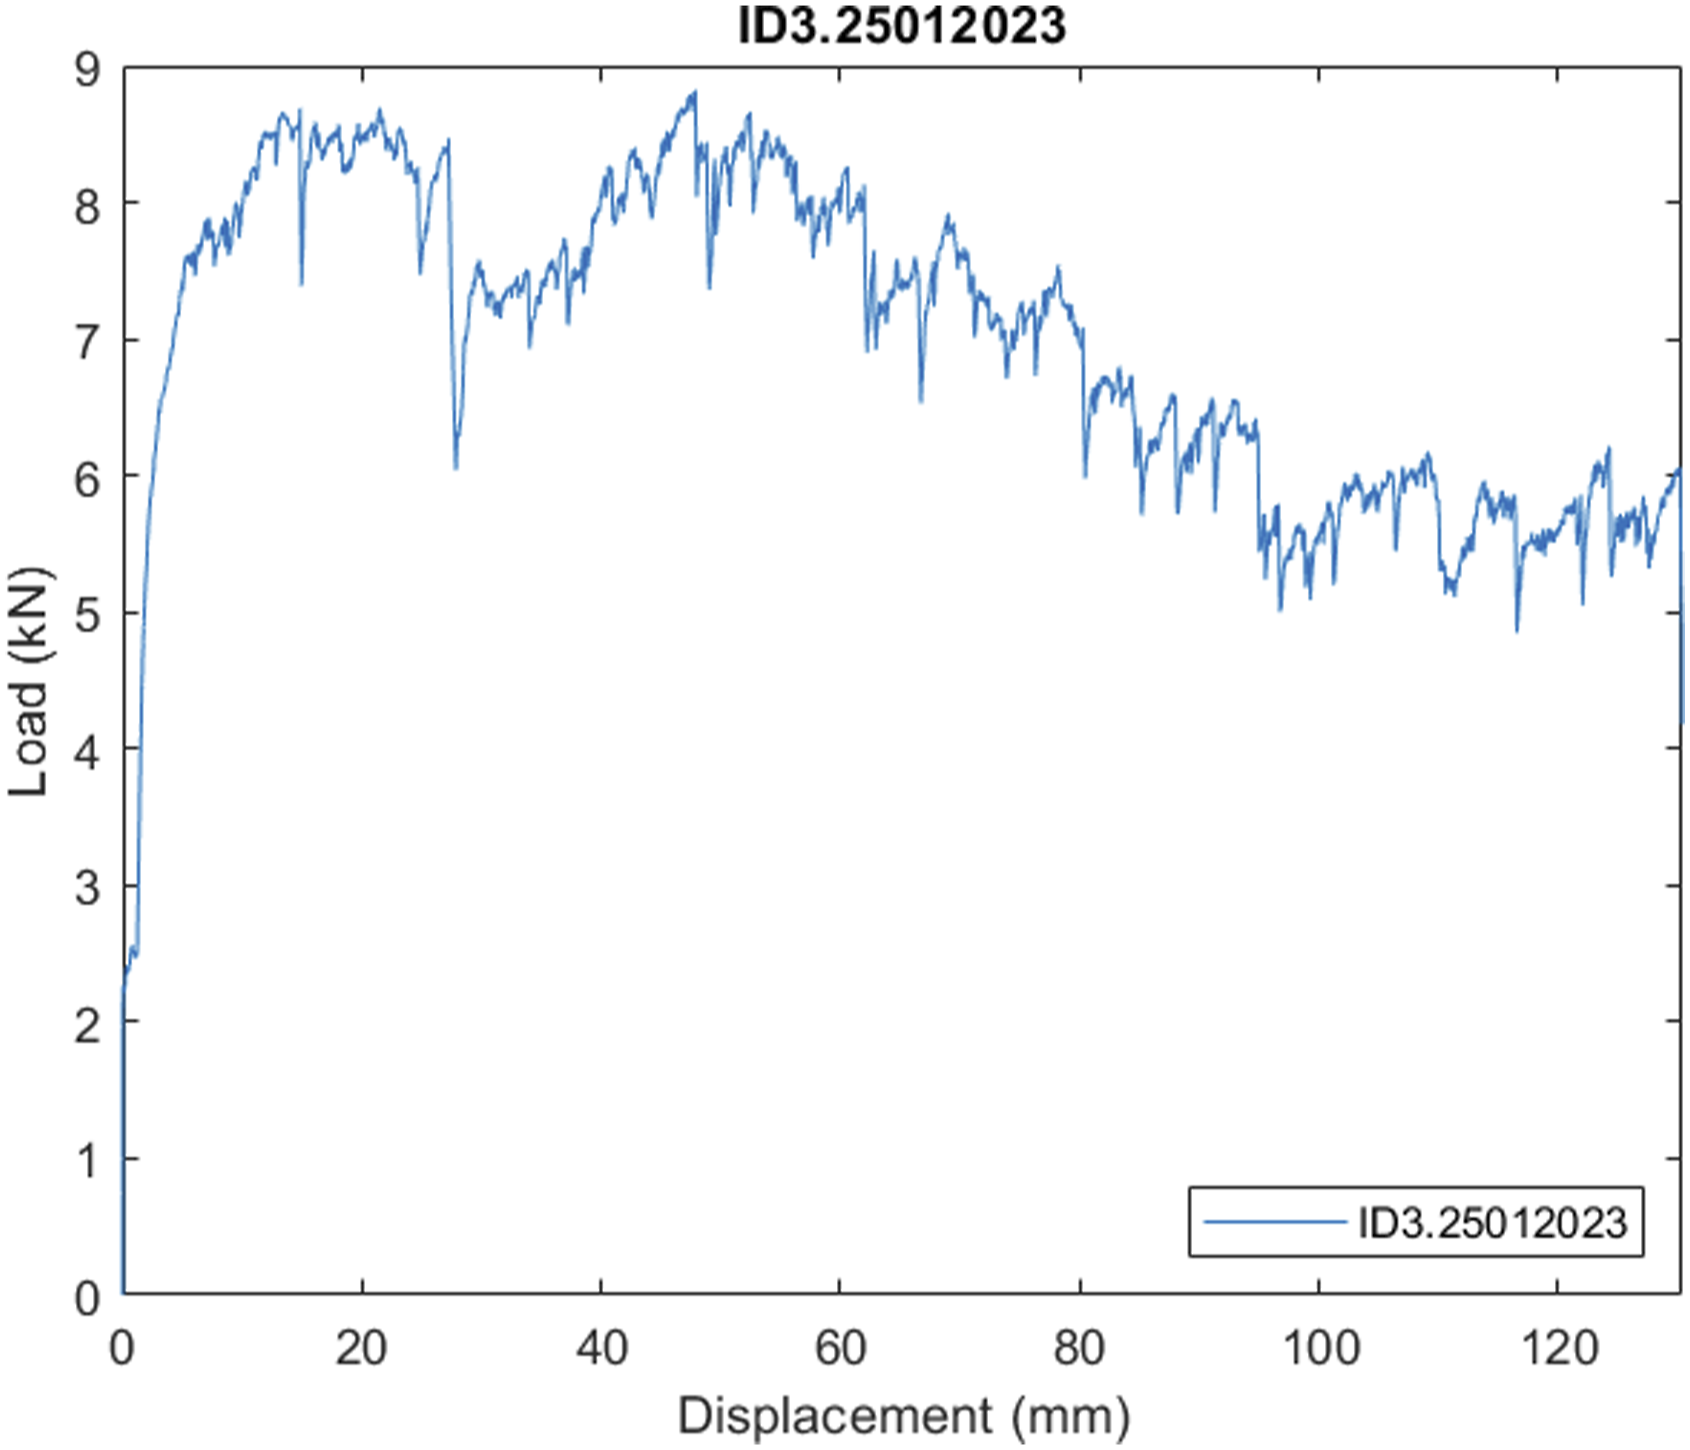
During a test the camera system generates raw footage, an example of which is shown in Figure 4, that captures the key objects of interest; the sleeper, shoulder, rail, and bed. Example camera image (Test 4).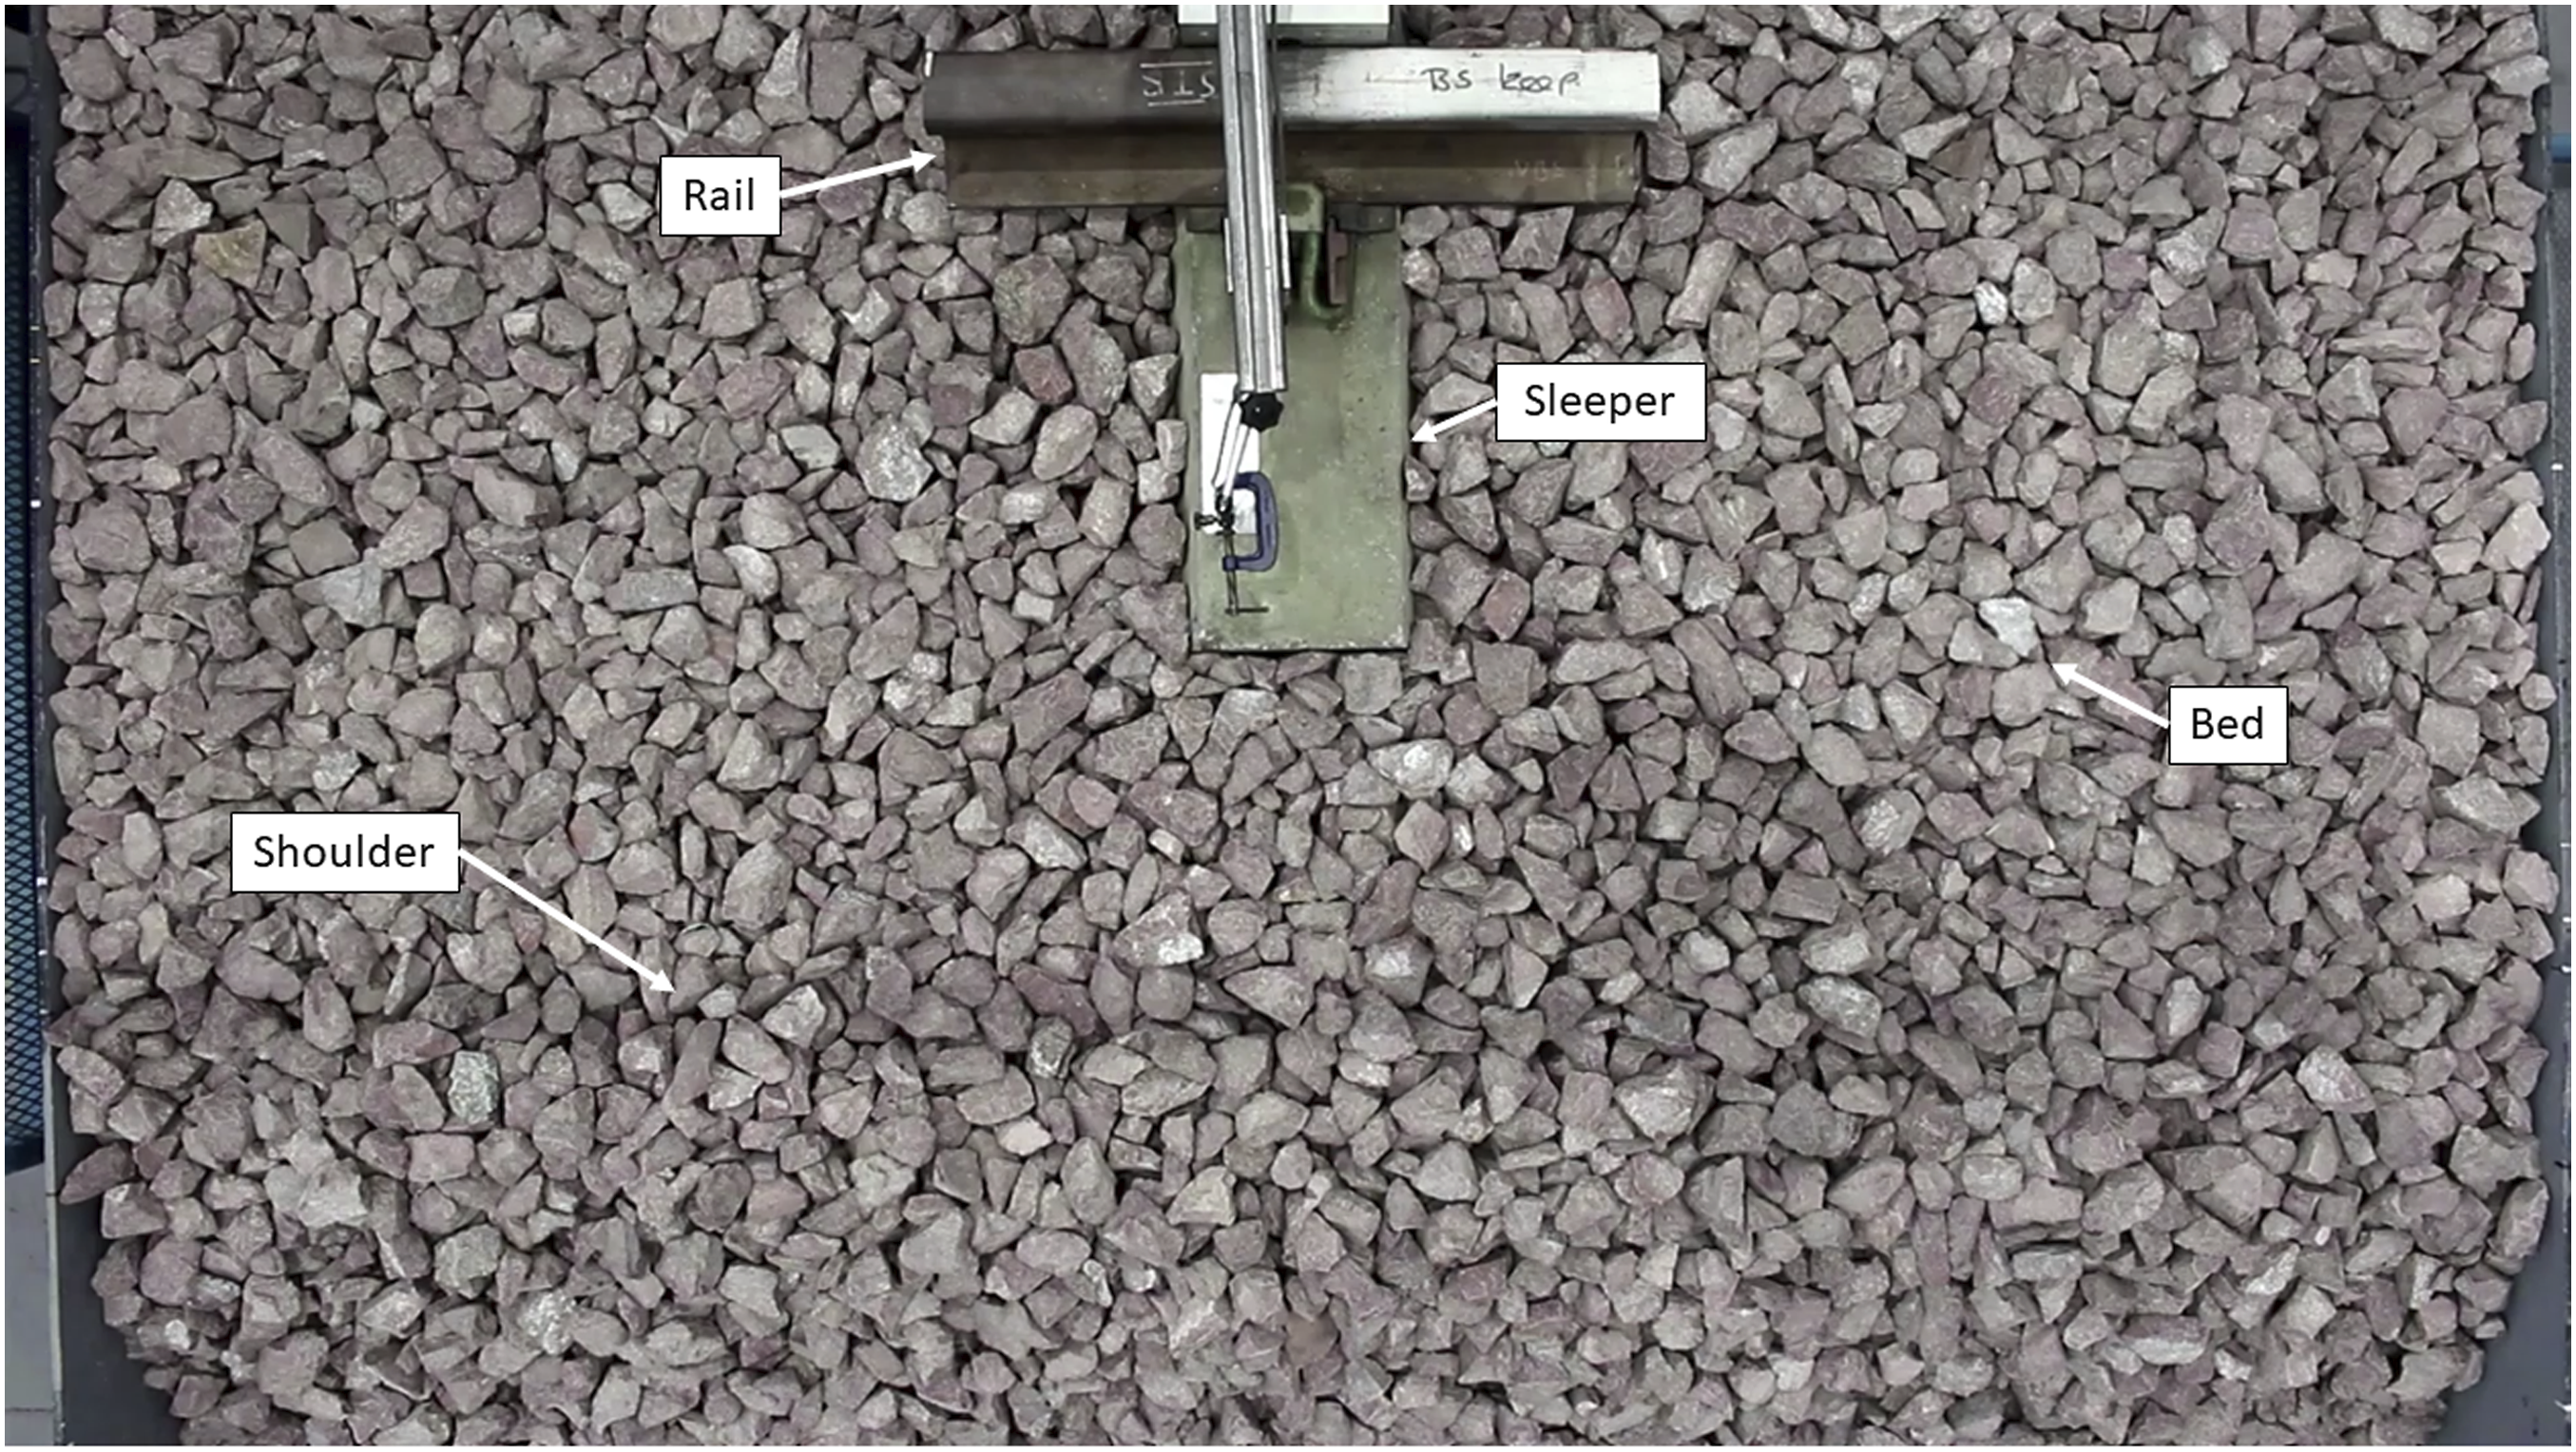
Measured displacement by LVDT, calculated displacement by DIC, and associated error.
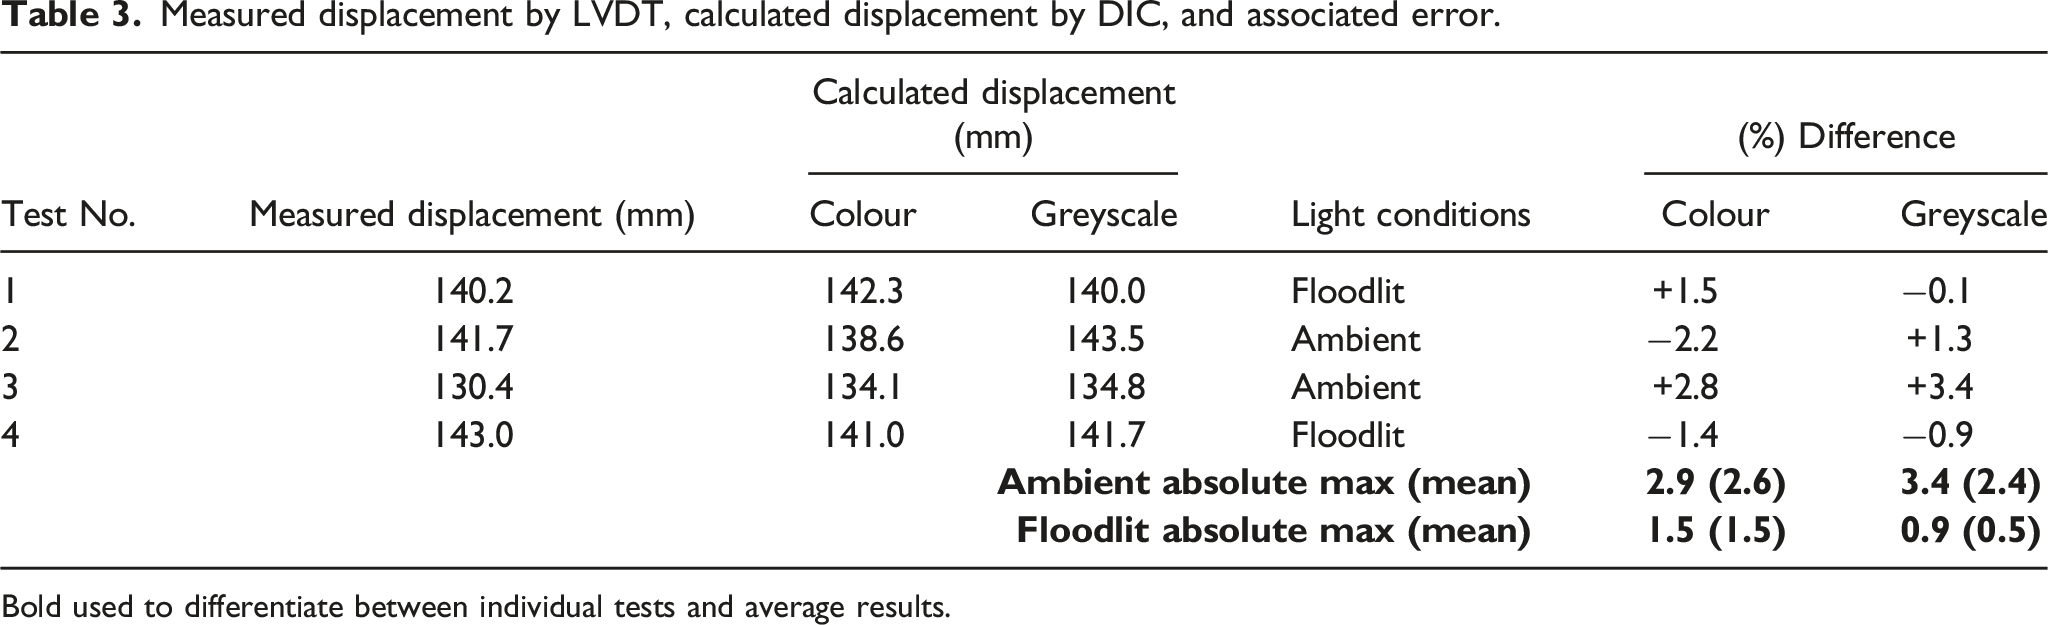
Bold used to differentiate between individual tests and average results.
Discussion
Figure 5 shows the final processed frames from Tests 3 and 4 as these are the most similar test conditions to those used by both Le Pen et al.
4
and Bian et al.
8
Due to the difference in displacement distance, ballast conditions and sleeper type, both tests have produced different ballast flows as expected. These ballast flows show good agreement to both studies on broad ballast behaviour despite those studies involving different sleeper types, sleeper geometries, reduced scale and using a more complicated and time intensive technique. Final processed frames from Test 3 and Test 4 showing the displacement in the Y axis for both colour (a) and greyscale (b) image processing routes.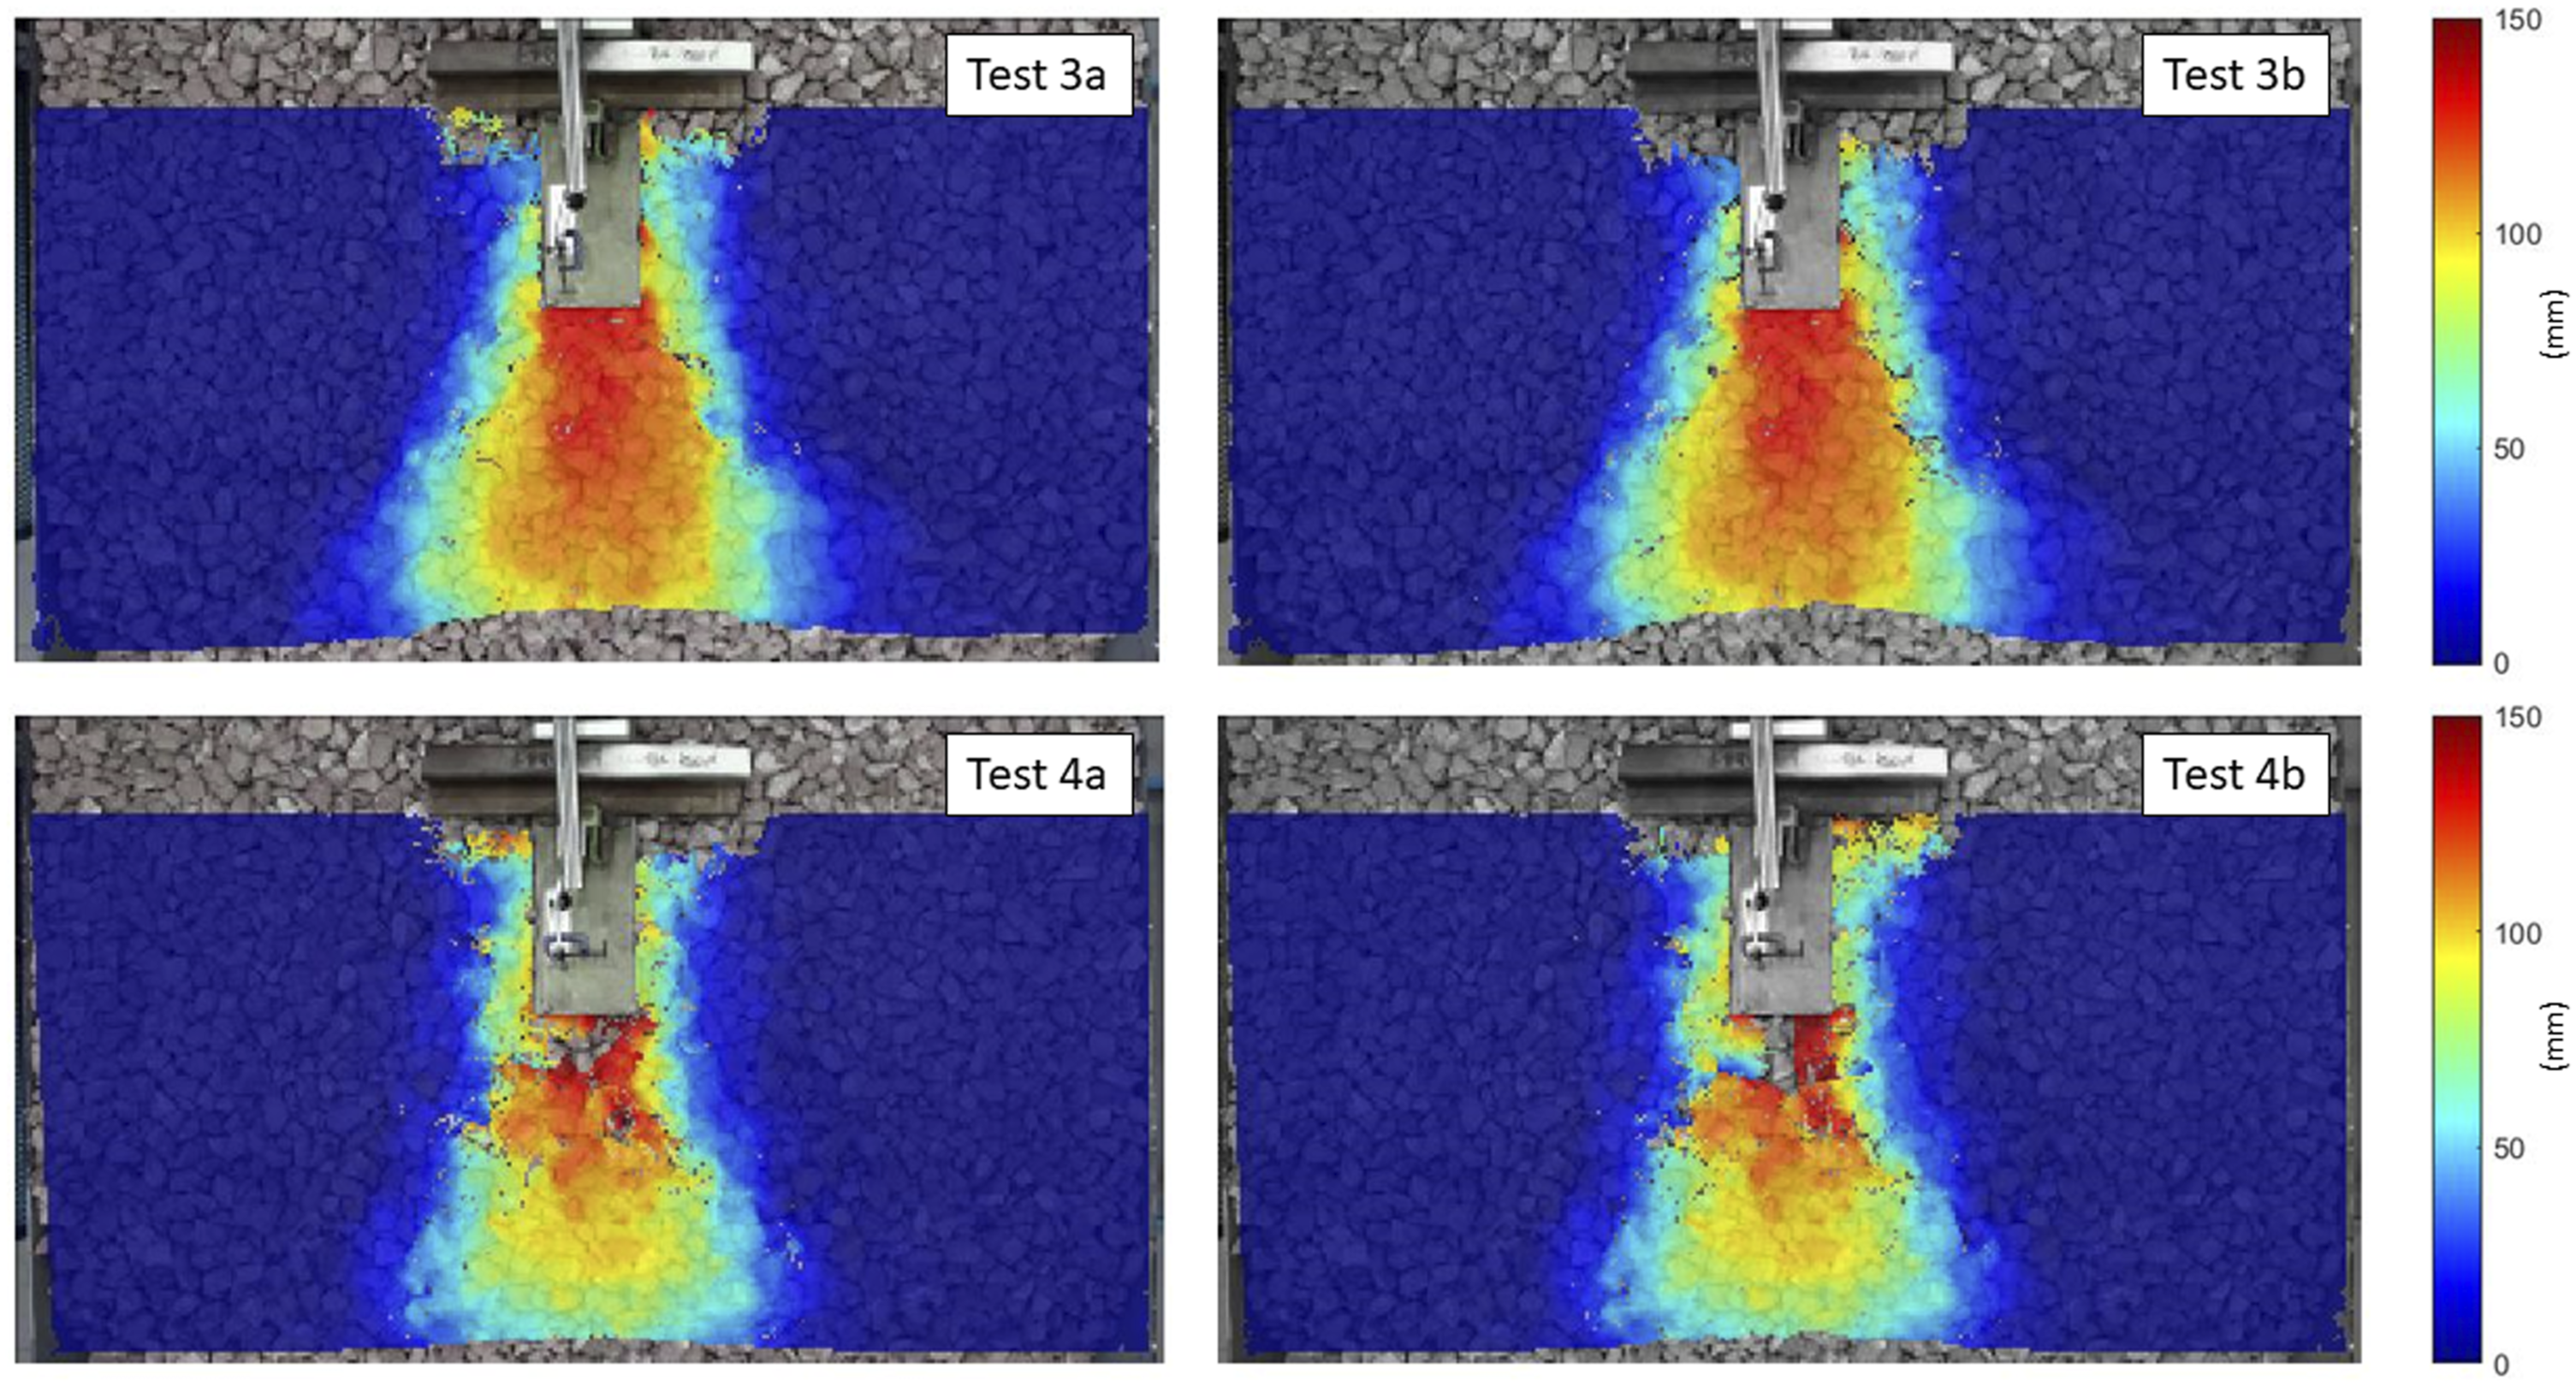
Test 4 has suffered from pixel tearing during image processing of both colour grades. Given that this has not been seen in Test 3, it is likely caused by surface ballast rotation and the limitations associated with this technique. Although this degrades the visual quality of the image, it does not detract from the ability to identify ballast behaviour and quantify ballast movement at the individual and bulk levels.
Table 3 gives the calculated displacement using both colour and greyscale images as well as under both possible lighting conditions. It is evident that both conditions have an error associated with the calculated displacement, ranging from −2.2% to +2.8% for colour and −0.9% to +3.4% for greyscale. When images are analysed in both greyscale and colour the addition of a floodlight reduces the error, increasing the accuracy of the calculated displacement. The greyscale route experienced the greatest reduction in error and for most cases examined was the most accurate method of image analysis. Inspection of the images collected indicated that using the floodlight generates more effective contrast lines within the ballast, thereby creating more distinguishable particles which ‘NCORR’ relies on to complete its analysis. However, all four tests showed very good levels of accuracy indicating that any of the conditions examined can generate acceptable results.
The results generated from this methodology were gathered in parallel with the existing test programme, without adding additional time or experimental complexity. This contrasts with alternatives which required significant pre-experiment preparation. 8 Similarly, the post-processing steps required to generate the final ballast movement results are greatly simplified through the capability, and adaptability of the open-source ‘NCORR’ software used.
Conclusion
The work presented in this paper has shown that open-source DIC programs can be used to quantify the movement of railway ballast during a full-scale lateral resistance test in a laboratory setting, taking advantage of open-source algorithms, widely available software, and commodity hardware. All results were within a range of absolute maximum error between 0.9% and 3.4% under the different laboratory conditions described. In tests utilising the best combination of conditions, the greyscale floodlit processing route, the maximum error between calculated and measured displacement is less than 1%. In its current configuration this design relies on both ambient and flood lighting; further work would seek to improve the techniques performance in lower lighting conditions as well as understand the technique’s suitability in scenarios where the bed and shoulder geometry are not co-planar. The comparability between measured and calculated values suggests that the proposed method is suitable for determining ballast movement during a lateral resistance test conducted in a ballast box at full scale. Future work will seek to convert this technique to perform to the same level of accuracy during a static, trackside test and ultimately in a dynamic, train borne configuration.
Footnotes
Acknowledgements
The Authors would like to thank Scott Dyball and Andy Trowsdale at British Steel Limited for their assistance in completing this work.
Author contributions
Declaration of conflicting interest
The author(s) declared no potential conflicts of interest with respect to the research, authorship, and/or publication of this article.
Funding
The author(s) disclosed receipt of the following financial support for the research, authorship, and/or publication of this article: This work was supported by the the Engineering and Physical Sciences Research Council (EPSRC) through the Advanced Metallic Systems Centre for Doctoral Training (EPSRC grant ref. EP/S022635/1) and British Steel Limited for providing the funding for this research.
Correction (April 2024):
This article has been updated with minor textual corrections in Table 3 since its original publication.
Author’s note
For the purpose of open access, the author has applied a Creative Commons Attribution (CC BY) licence to any Author Accepted Manuscript version arising from this submission.