
Abstract
The paper assesses the effect on the air flow regime underneath a simplified high-speed train of changing the ballast depth and the sleeper shape, with regard to its potential for causing ballast flight or pickup. The study was carried out numerically using the commercial Computational Fluid Dynamics (CFD) software AnSys Fluent. The flow profile beneath the underbody of the train was generated by means of a moving wall above the track. The Delayed Detached Eddy Simulation (DDES) with the SST
Introduction
Increased train speeds on ballasted railways have focused attention on the phenomenon of aerodynamically-induced ballast flight, which may damage trains, lineside structures and the track itself. Aerodynamically induced ballast flight causing extensive pitting of train under bodies in France (2004) and Belgium (2003) during ICE3 testing was reported by Kaltenbach (2008). 1 Similar incidents have occurred on the Madrid-Barcelona line (Spain) and Rome-Naples line (Italy). Aerodynamic effects are the main driver, but mechanical excitation of the track bed generated by the train may also be a factor at speeds up to 300 km/h. 2 Ballast flight may also be triggered by blocks of ice or impacted snow falling from trains; 1 although potentially at least as damaging, this is not the focus of the current paper.
Aerodynamic flow underneath high-speed trains has been studied extensively in full-scale and model tests,3,4 and numerically using Computational Fluid Dynamics (CFD). 5 Research focussing particularly on ballast flight includes wind tunnel studies, 6 CFD analysis7,8 and field studies6, 9 reported a full-scale wind tunnel study, simulating train underbody flow characteristics measured on an Italian high-speed railway, carried out to assess the effect on the likelihood of ballast lifting of the ballast bed upper surface level and shape. Lowering the ballast bed level and compacting the ballast were found to reduce the likelihood of ballast movement, while certain characteristics of individual ballast stones (e.g., flatness and low weight) were found to increase it.
Many previous CFD studies used static meshes with simplified track geometries, in which the sleeper shapes and ballast bed profiles were ignored. Paz et al (2019 7 , 2017 8 ) carried out CFD analyses with dynamic meshes to represent real movement of the high-speed train passing over a track section, giving a better representation of the underbody flow. Calculated mean flow profiles in Paz et al (2019) 7 were consistent with those measured in experimental studies in Premoli et al (2015). 6 The results in Paz et al (2017) 8 also suggest that the presence of sleepers causes strong peaks of vertical velocity, as well as affecting the performance of the train resulting in an approximately 15% increase in drag force. Later numerical studies 7 modelled the track section, having used three-dimensional (3D) scanning equipment to capture the roughness of the ballast bed and the sleeper shapes. Comparison of the results with those for train passage over a smooth ballast bed showed stronger turbulent flow for the rough profile, with the turbulence intensity increasing near the ballast surface.
Experimental studies in Somaschini et al (2020) 9 recorded the number of times ballast lifts off the track and hits the high-speed train underbody using on-board microphones during operation at train speeds up to 360 km/h. The results suggest that the occurrence of ballast flight increases exponentially at train speeds greater than 270 km/h.
The large number of factors potentially influencing ballast flight means that no one study has been able to address them all. Quantitative assessment is challenging, but methods have been proposed by Jacobini et al (2013) 10 and Saussine et al (2009) 11 which uses a stress-strength interference analysis to account for probabilistic nature of turbulent flow beneath the car body and of ballast particles becoming airborne.
Although ballast flight is not fully understood, various mitigation measures have been proposed. Infrastructure-based interventions generally fall into one of the following categories. 1. Ballast containment. Jacobini et al (2013)
10
proposed placing the ballast in porous bags (“ballast bagging”), preventing the ballast from moving during train passage while retaining the key ballast functions of drainage, vertical stress distribution into the subgrade and imparting lateral stability to the track. However, the bags would probably need to be replaced after track maintenance. Alternatively, metal grids or screens might be placed on the ballast surface between the rails, as by the East Japan Railway Company, to protect the ballast bed from falling ice.
12
Again, these would need to be removed during maintenance tamping. 2. Ballast gluing. Mechanical stability could be imparted by introducing adhesive, resin or foam into the voids between the ballast grains. However, this could impair drainage and would be unlikely to survive tamping. 3. Ballast lowering. Lowering the level of the ballast surface below the sleeper top would take the ballast further away from the region of turbulence created by the train underbody, hence reduce the risk of ballast flight. This has been attempted (by 20 mm to 30 mm) in France, Italy and Spain.
10
Lowering the upper surface of the ballast generated voids between the bottom of the rail and the ballast, allowing air to escape from between the train and the track. However, the required tamping frequency increased, possibly as a result of the reduction in lateral resistance.
10
Thus a deeper sleeper profile or the installation of side-bearing plates might be needed to preserve the lateral resistance of the track system. 4. Altering the sleeper shape. The sleeper might be deepened to enable the ballast bed surface to be lowered without reducing the lateral resistance of the track, or its profile might be modified to prevent ballast from coming to rest on top, e.g., the “Aerotravesia” curved top sleeper.
13
However, the latter could change the aerodynamic flow, thereby affecting the potential for ballast flight. 5. Thorough tidying up after maintenance. At speeds up to 300 km/h, ballast grains most prone to aerodynamically induced flight are generally small,
2
and may quite possibly be left on the upper surface of the sleeper following maintenance. In this case, simply brushing the upper surface of the sleepers before handing back the track after maintenance could prevent many instances of ballast flight. Arguably, the major benefit of the curved top sleeper is that it reduces the likelihood of an individual ballast grain coming to rest on its upper surface.
This paper investigates the effectiveness, in aerodynamic terms and both alone and in combination, of infrastructure-based interventions in Categories 3, 4 and 5 above, i.e., lowering the upper surface of the ballast, altering the sleeper shape, and preventing ballast grains from resting on the upper surface of a sleeper.
Previous numerical studies have been carried out using steady RANS simulation, García et al (2011),
5
Diedrichs et al (2007)
14
and Cheli et al (2010).
15
However, the flow underneath a high-speed train running on ballasted track is unsteady and complex owing to the multiple levels of roughness on both the underside of the train and the track bed (sleepers at intervals, unevenness of the ballast bed, and surface roughness of individual ballast grains). Relatively few studies have investigated the unsteady flow aerodynamics using unsteady turbulence models.
5
simplified the problem by modelling the track surface(s) as a flat plate of equivalent roughness, estimated on the basis of analytical solutions for turbulent Couette flow (i.e., flow between moving parallel plates). In this paper, a development of that approach was adopted. The sleeper blocks were modelled explicitly, while the roughness of the ballast bed was represented parametrically to resolve the boundary layer near the wall when using SST
This paper presents the results of CFD analyses of different track configurations, in terms of velocity and pressure profiles across the track section and forces on ballast grains modelled as individual particles at various locations within the flow domain. Initially, two-dimensional (2D) analyses were carried out on the track cross-section using steady RANS, enabling promising intervention geometries to be identified on the basis of changes in the calculated mass flow rate and flow separation. More complex studies were then carried out for certain track geometries, in which a section of the track was modelled using 3D DDES. The numerical techniques and procedures adopted are described below. The main results from the 2D and 3D analyses are presented and discussed, and finally the conclusions are summarised. All simulations were carried out on the University of Southampton supercomputing cluster Iridis5.
Despite the power of super-computers and modern CFD software packages, it is not feasible to model the track and the train in every detail. The rails and rail fastenings were not modelled explicitly, and train passage was simulated by a moving wall representing a relatively smooth car underbody. Underbody roughness resulting from underfloor equipment can cause significant variations in airspeed (in the order of 60% for an underbody roughness scale of 30 cm) just above the ballast surface, above a normalised height that reduces with ballast roughness (x/h ∼ 0.02 for a trackbed roughness of 24 mm; 40 mm was used in this study). 5 It is also known that the detail of the bogie and bogie cavity have a major influence on localised turbulence, 16 hence passage of the bogie might be expected to represent a more onerous condition in terms of promoting ballast flight than passage of the car underbody. However, real bogie and bogie cavity geometries vary widely, and in attempting to reproduce them or the underbody roughness for a particular train type the study would lose generality. In any case, the purpose of the study was not to determine absolute numbers for specific cases but to illustrate broad principles that can be adopted in the design of the track infrastructure in a way that is agnostic to train type.
Studies of ballast flight increasingly adopt a statistical approach.17–19 Stochastic variation in the wind parameters is calculated by the CFD analysis, and is reflected in the ranges of aerodynamic coefficients calculated and included in the presentation of the results. However, the aim of this study was to assess the effect of different sleeper shapes on the potential for solids of a regular and well-researched reference shape (cubes) to slide, roll or become airborne, and stochastic variation of the track or solid shape parameters was not a consideration.
Numerical models
Modelling ballast roughness
While the sleeper blocks (and hence the track roughness associated with them) were included explicitly, the ballast bed surface roughness and the roughness of the ballast grain surface were represented numerically in all analyses by applying appropriate values of roughness height
The roughness height
The sensitivity of the flow to plausible ranges of Velocity profiles for analyses with different ground roughness parameters using SST 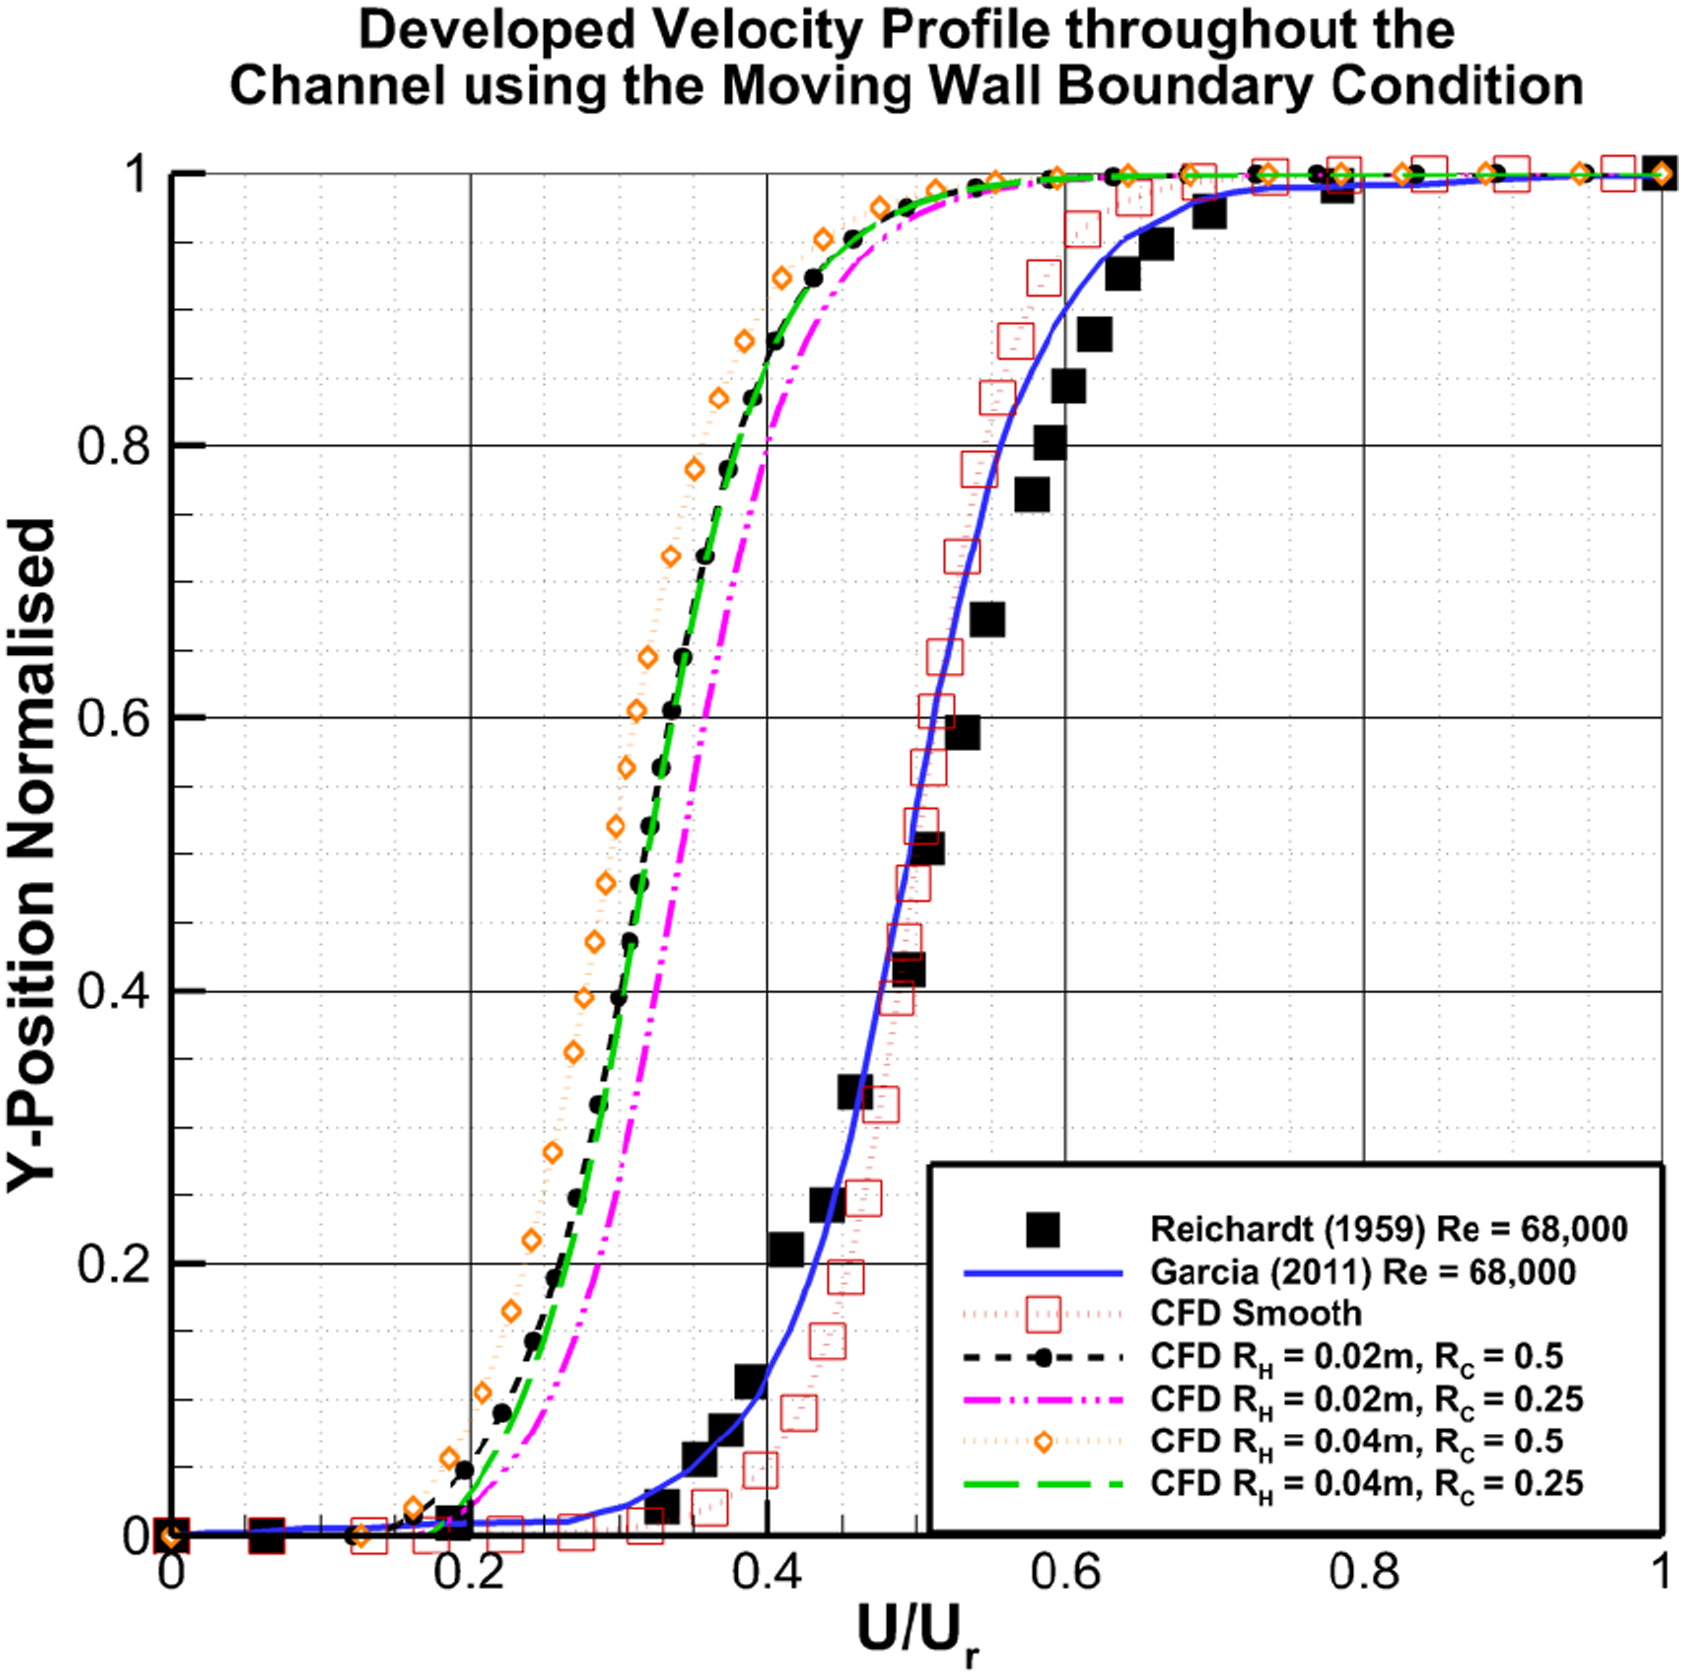
Figure 1 shows that applying ground roughness to the channel increases the dissipation rate in the flow near the ground, and decreases the streamwise velocity and the overall mass flow rate. The greater the roughness height and/or the roughness constant, the lower the mass flow rate. This implies that greater ballast surface roughness increases the boundary layer height; low speed vortices generated in the wake between the sleepers then reduce the local streamwise velocity at the ballast surface. Provided the ballast bed roughness is modelled, the exact value of
2D analyses
Analyses were carried out in 2D, representing a longitudinal section along the centreline of a portion of the track, to give an indication of how the sleeper shape and ballast depth influence the flow. A sleeper block was placed at the centre of the domain and the domain length was set to a multiple of the typical distance (600 mm) between adjacent sleepers. Track section lengths of between one and four sleepers were modelled, with periodic conditions in the streamwise direction, to assess any effect of the model length prior to 3D studies. The domain height varied between 440 mm and 500 mm, representing the distance between the ballast bed and the underbody of a typical Eurostar (Class 373) train. The top surface was modelled as a wall moving at a speed of 120 m/s (432 km/h). This is substantially in excess of common current operational train speeds, but was chosen to represent a likely absolute future maximum for conventional track. Three different sleeper cross sectional shapes were considered, with the surface of the ballast bed either at, 40 mm below, or 20 mm above a “reference level”, taken as 460 mm below the upper moving wall representing the underbody of the moving train.
The three sleeper shapes with are: 1. A standard G44 reinforced concrete mono-block sleeper manufactured by Tarmac, whose actual dimensions were measured directly and modelled using CAD software. 2. An “Aerotravesia” sleeper block,
13
whose shape was simplified owing to its complexity and the limited geometrical data available while retaining the curved upper surface and main dimensions. 3. A new sleeper shape, formed by replacing the curved top surface of the Aerotravesia sleeper with an isosceles triangle of the same height and width.
The “reference level” was taken as the upper surface of the conventional G44 mono-block sleeper, and would be the intended or “design level” of ballast for that sleeper type. The intended or “design level” of ballast for the curved and triangular top sleepers would actually be the lowest level investigated, i.e., 40 mm below the “reference level” based on the G44. A schematic of a composite flow domain, illustrating the three different sleeper cross sections and the range of ballast bed surface levels considered, is shown in Figure 2. To keep the amount of data presented to a reasonable level, only selected results, generally focusing on the extreme ballast levels of 40 mm below and 20 mm above the G44 reference level, are presented. Schematic of a typical flow domain used in the 2D analyses.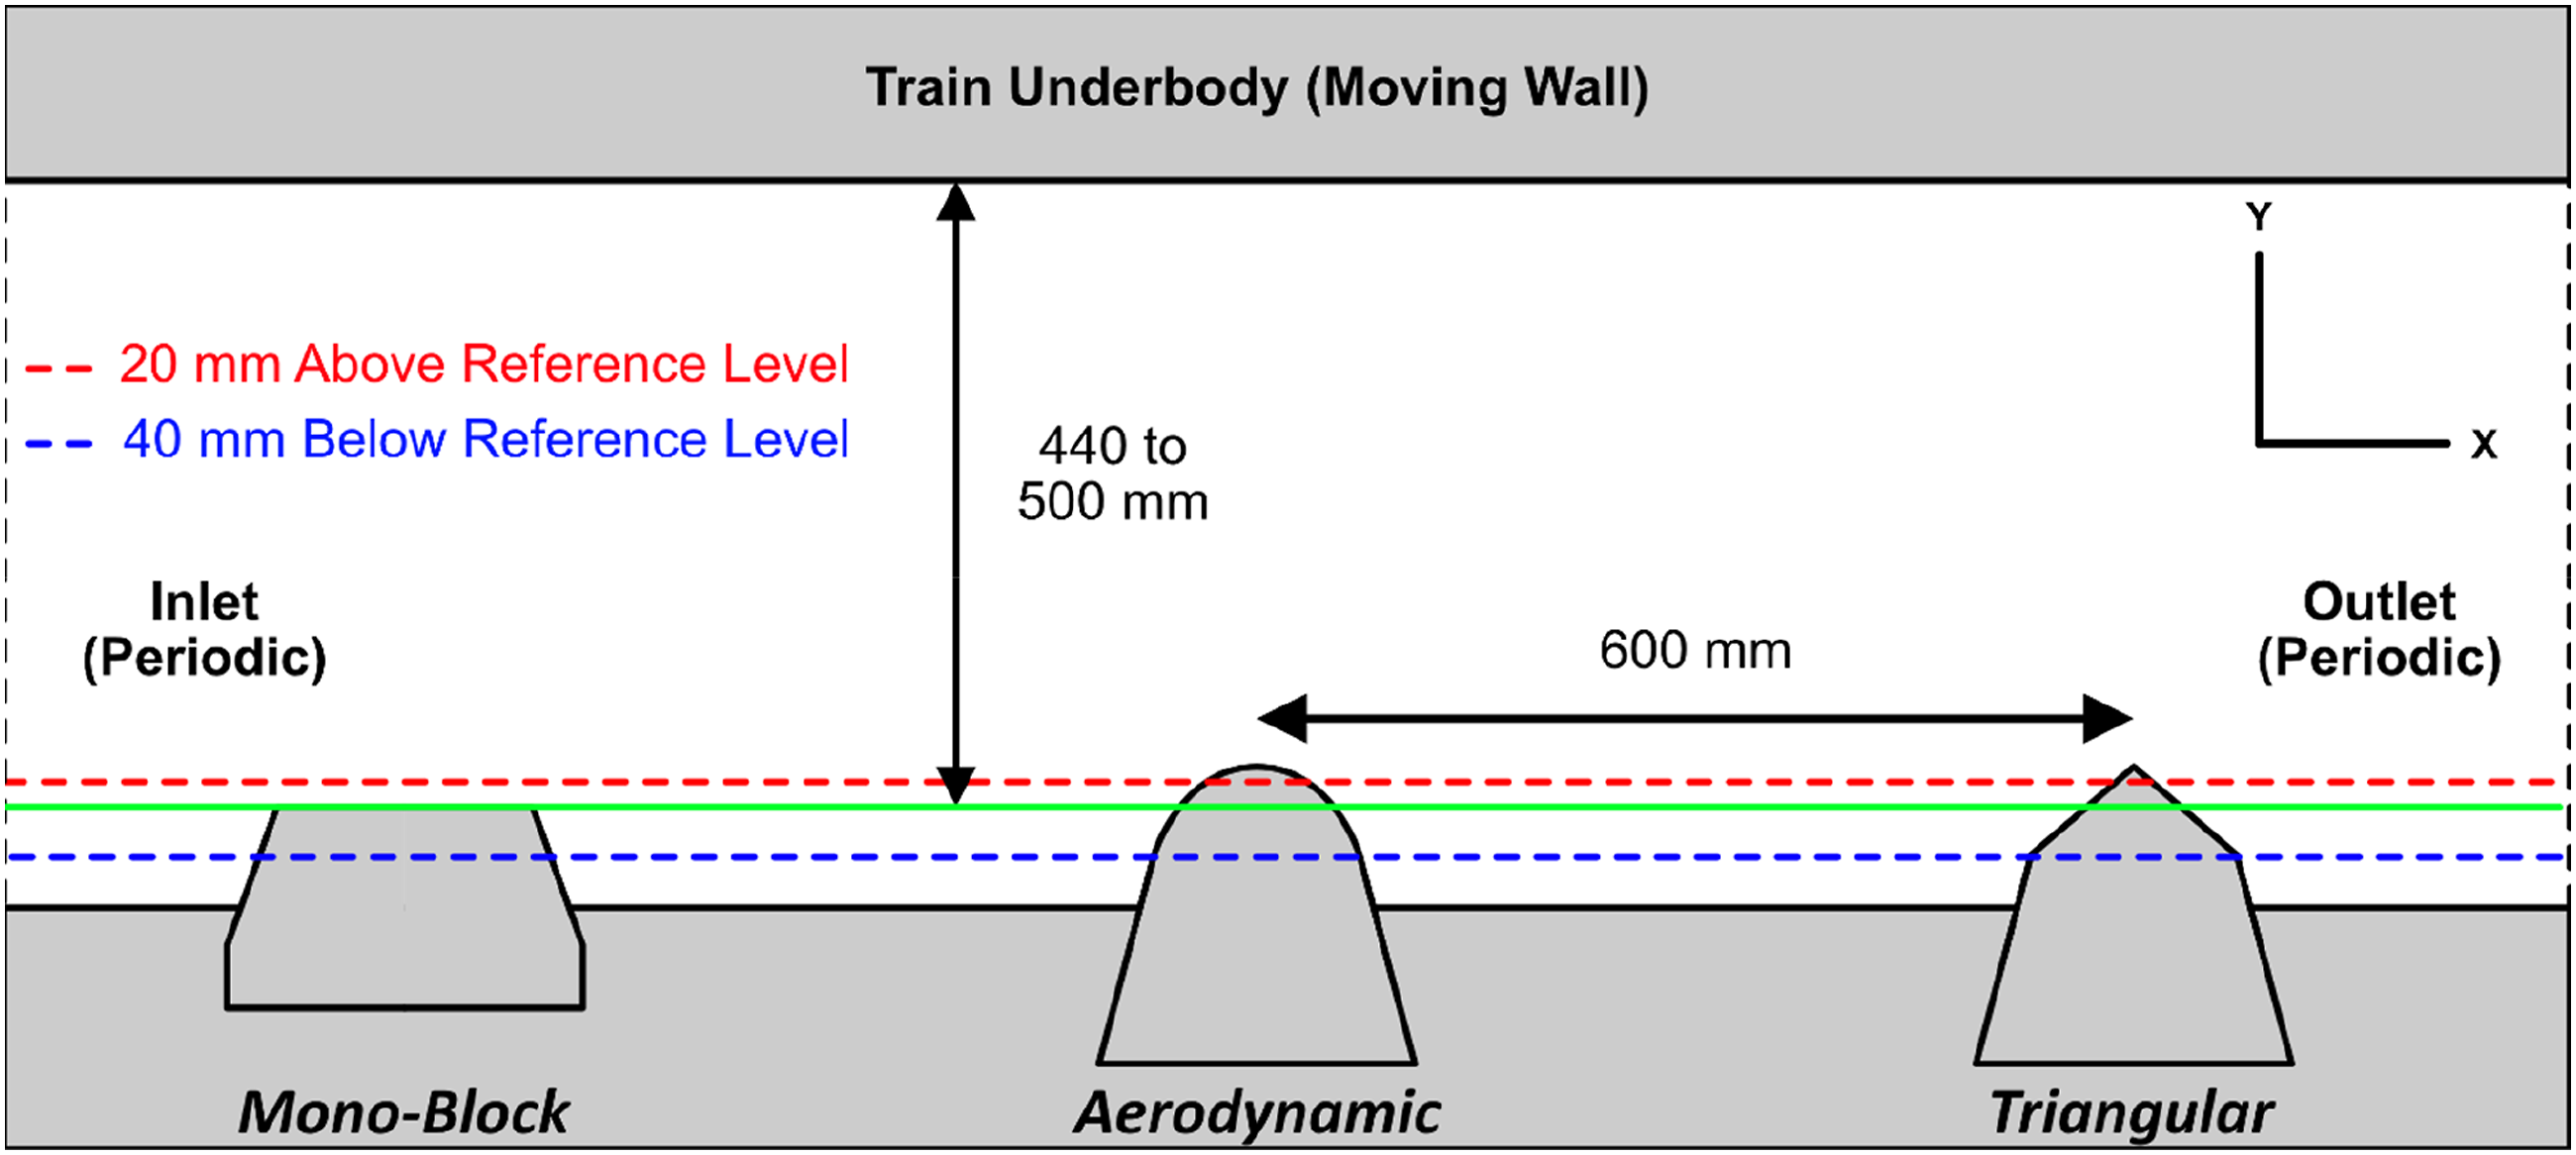
For the 2D analyses, the domain was designed and meshed using Pointwise to generate a structured mesh with approximately 200,000 hexahedral cells giving 2D mesh of the fluid flow domains over (a) the mono-block sleeper and (b) the curved top sleeper, with a ballast depth 40 mm below reference level.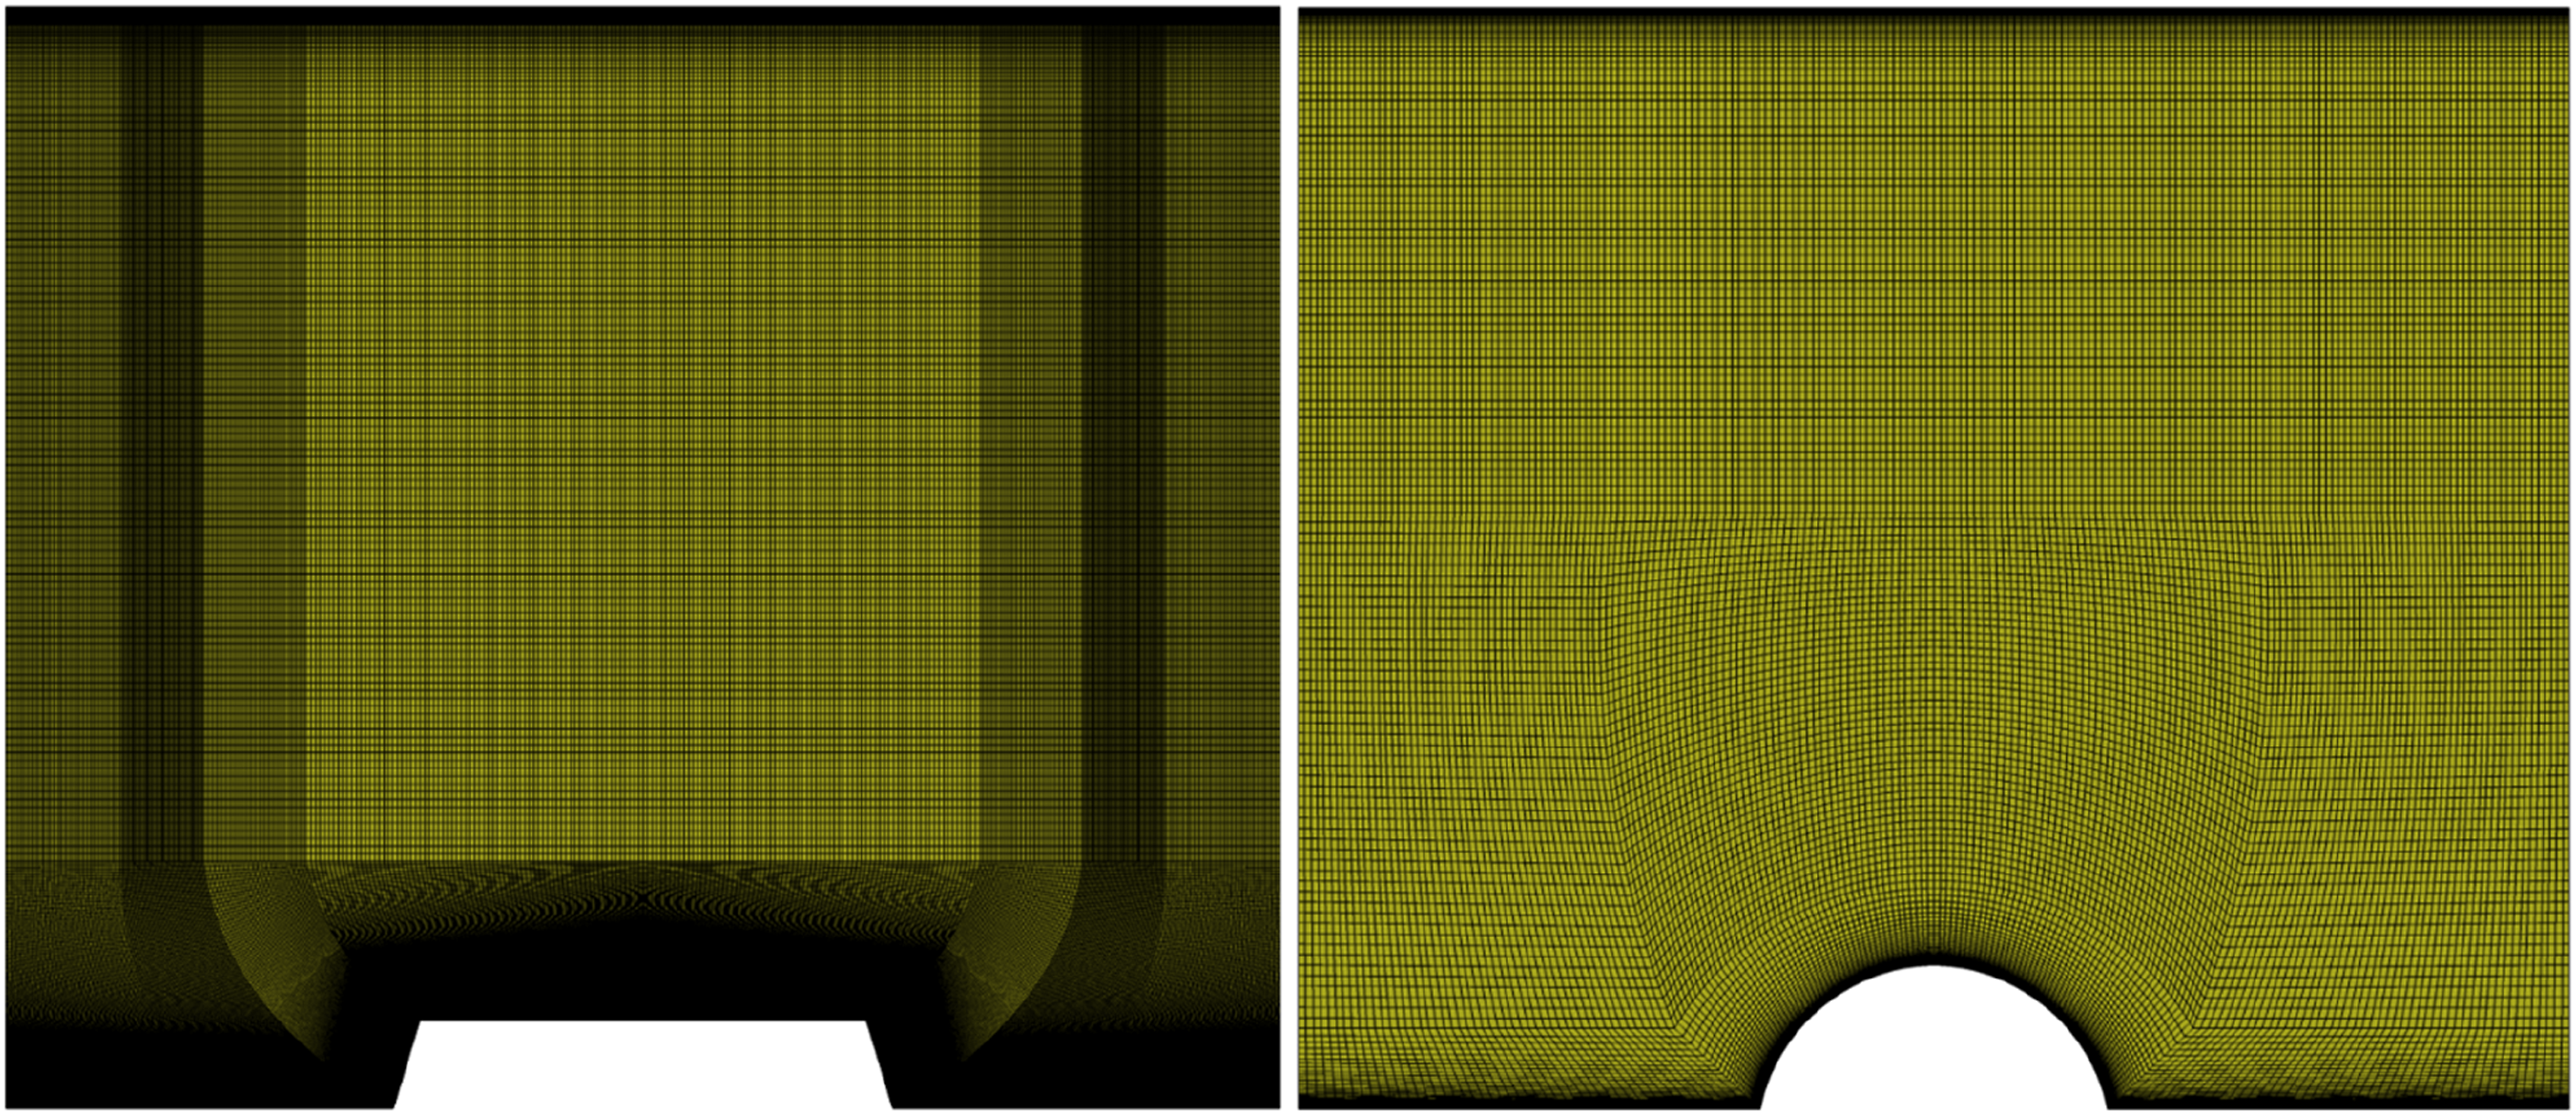
In the 2D studies, the flow is calculated within a plane along the centreline of the track, which does not truly represent turbulent behaviour. Hence for the 2D studies, only steady RANS turbulence models (Realisable
3D analyses
Grid independence study
Grid independence study for flow over a cube.
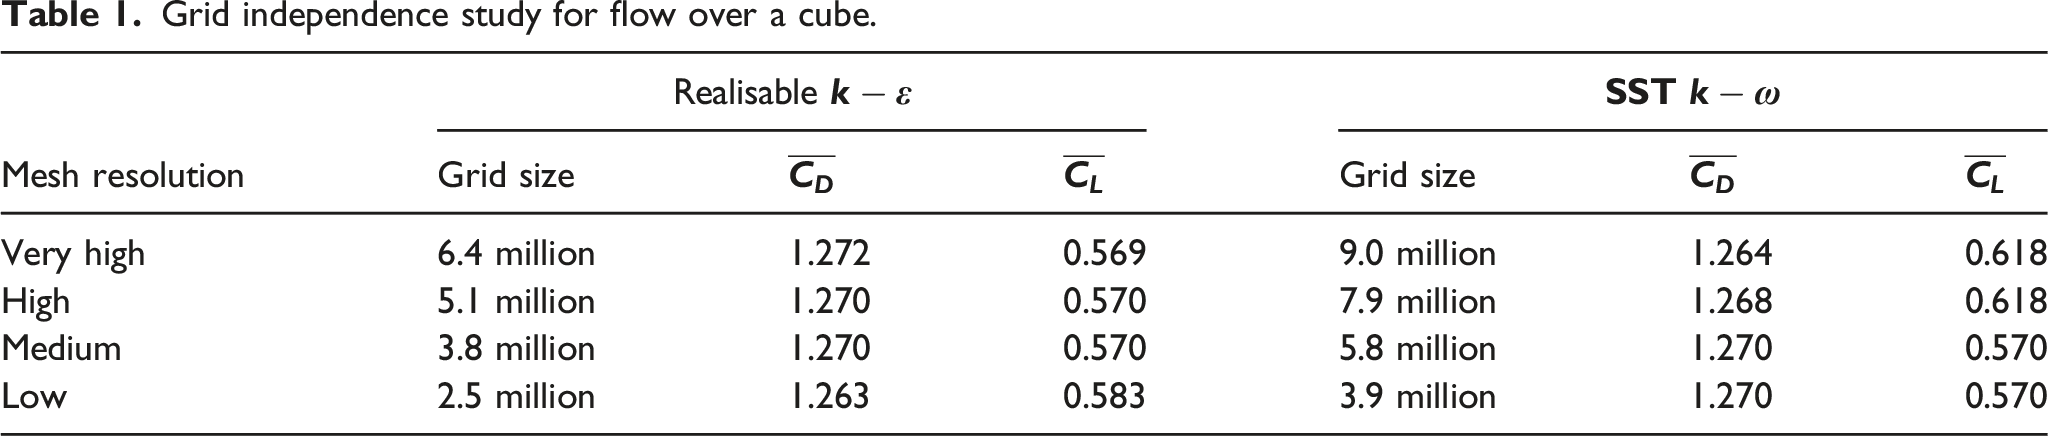
The force coefficients given in Table 1 show a trend of convergence as the grid is refined. Both turbulence models are in general agreement with the DES results of Wang et al.
22
( Surface pressure coefficient 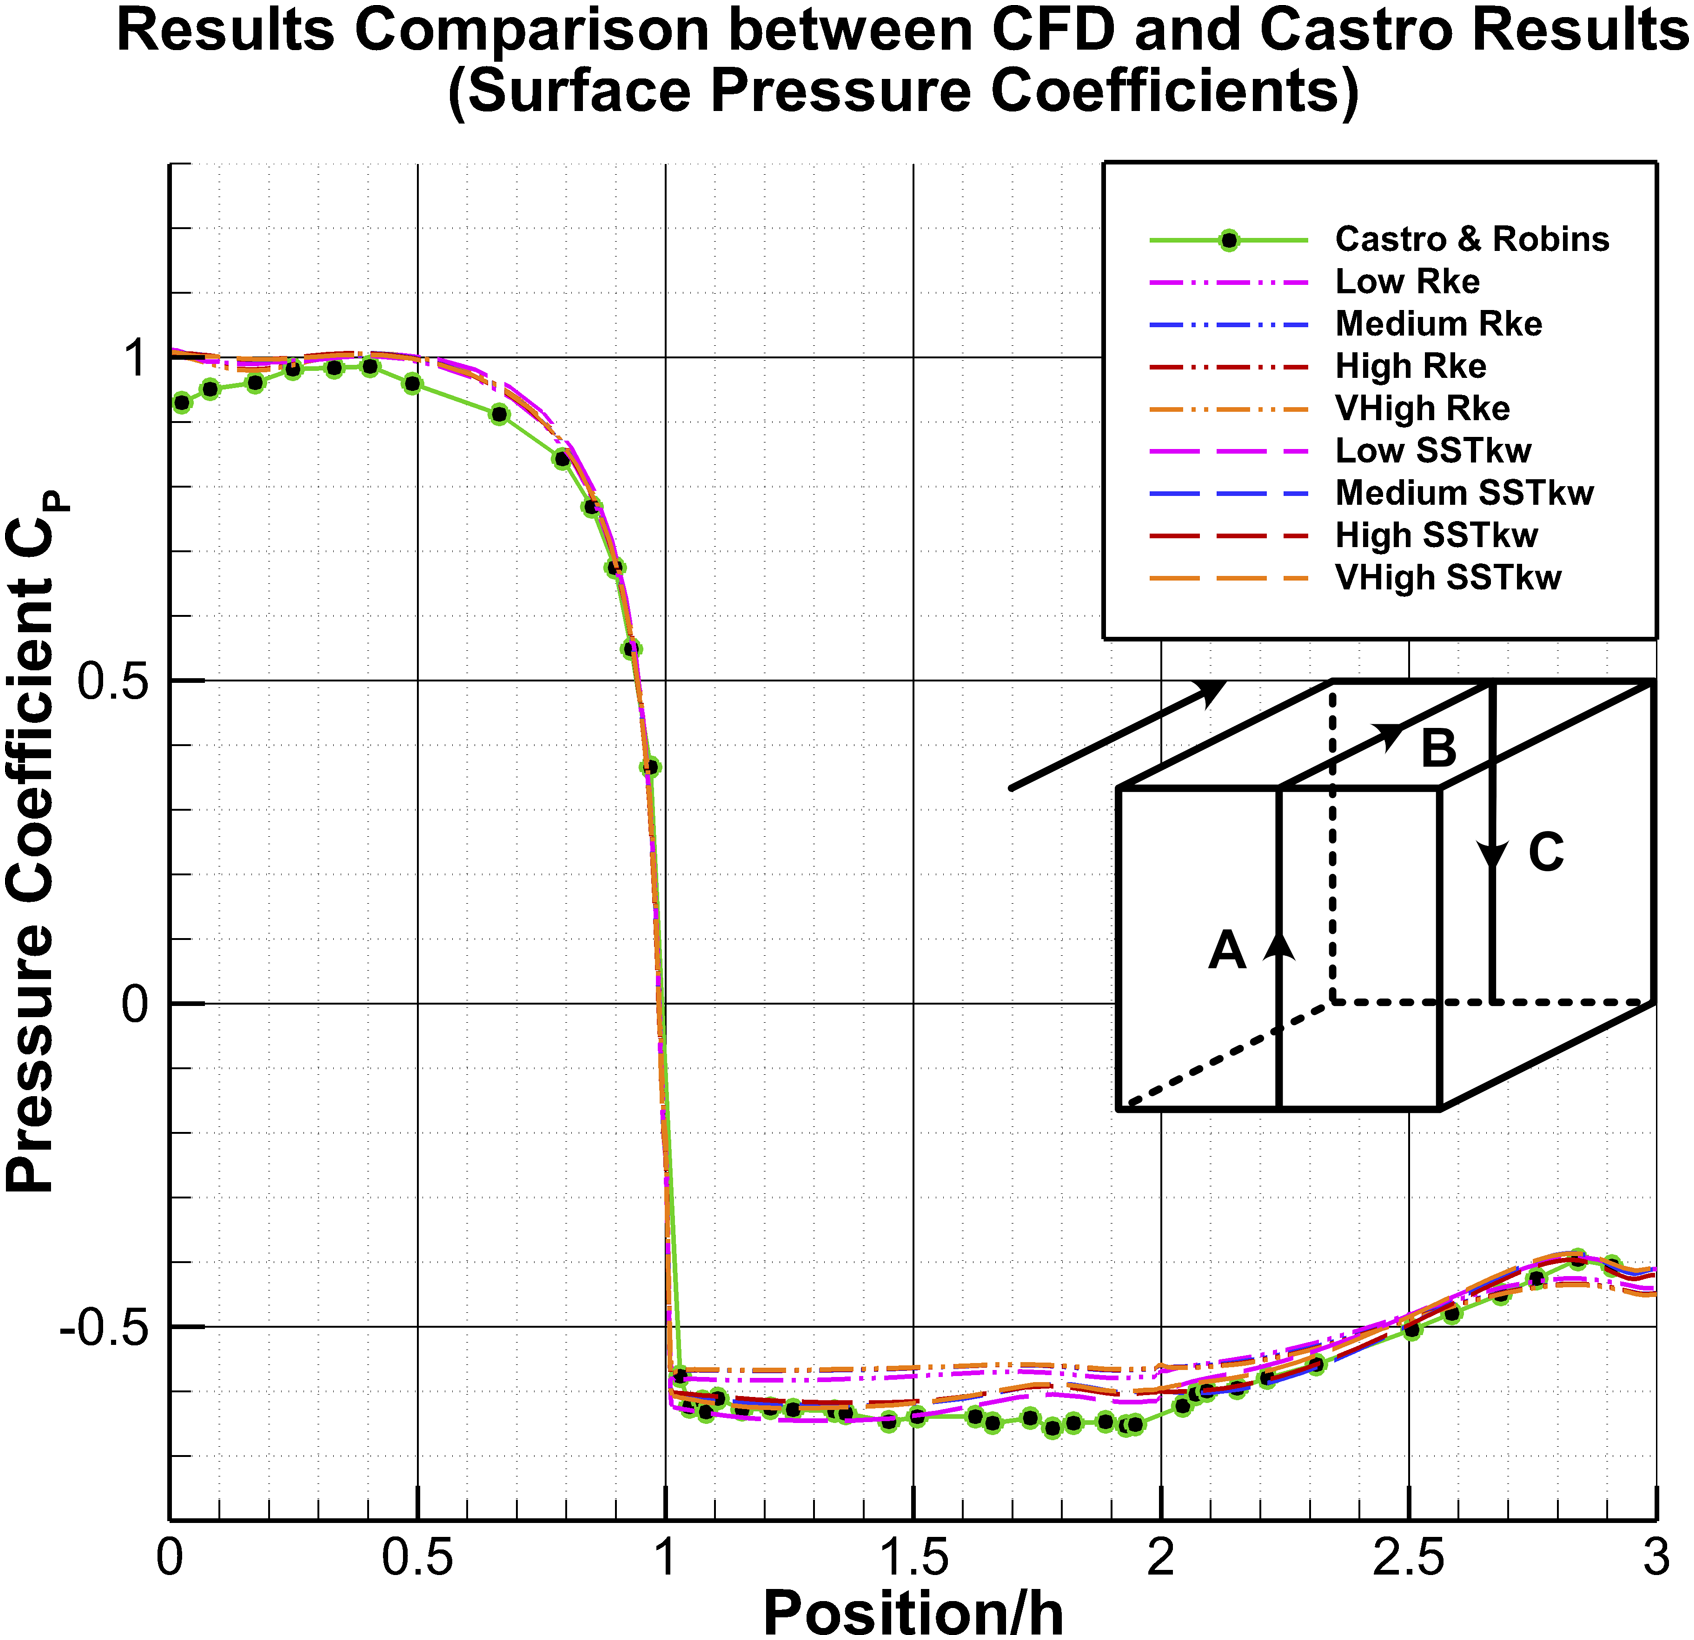
Track section analysis
In each of the 3D analyses, the flow domain modelled two sleeper blocks of a given type with a ballast shoulder extending horizontally from the sleeper ends for a distance of 525 mm before sloping downward at 1V:2H. 23 Isolated single cubes of height h = 60 mm were placed on top of either the sleeper or the ballast bed between sleeper blocks, representing a loose ballast grain. For reasons of computational time and degree of resolution, only a short section of track was modelled, with periodic boundary conditions applied in the train running direction. (The results of the 2D analyses, reported later, showed no significant difference between the results of analyses modelling a run of two, three or four sleepers). To prevent computational times from becoming excessive, the detail of the rails and clips etc. was not modelled; they are in any case unlikely to affect the flow pattern at the middle section of the track, which was the focus of the study.
In the 3D analyses, the boundary conditions on the sides of the domain were symmetrical. Again, the top surface was modelled as a wall moving at the representative train speed of 120 m/s. Other surfaces, including the sleeper blocks, cubes and ballast beds, remained static. Ballast roughness, where applied, was simulated by means of a roughness height
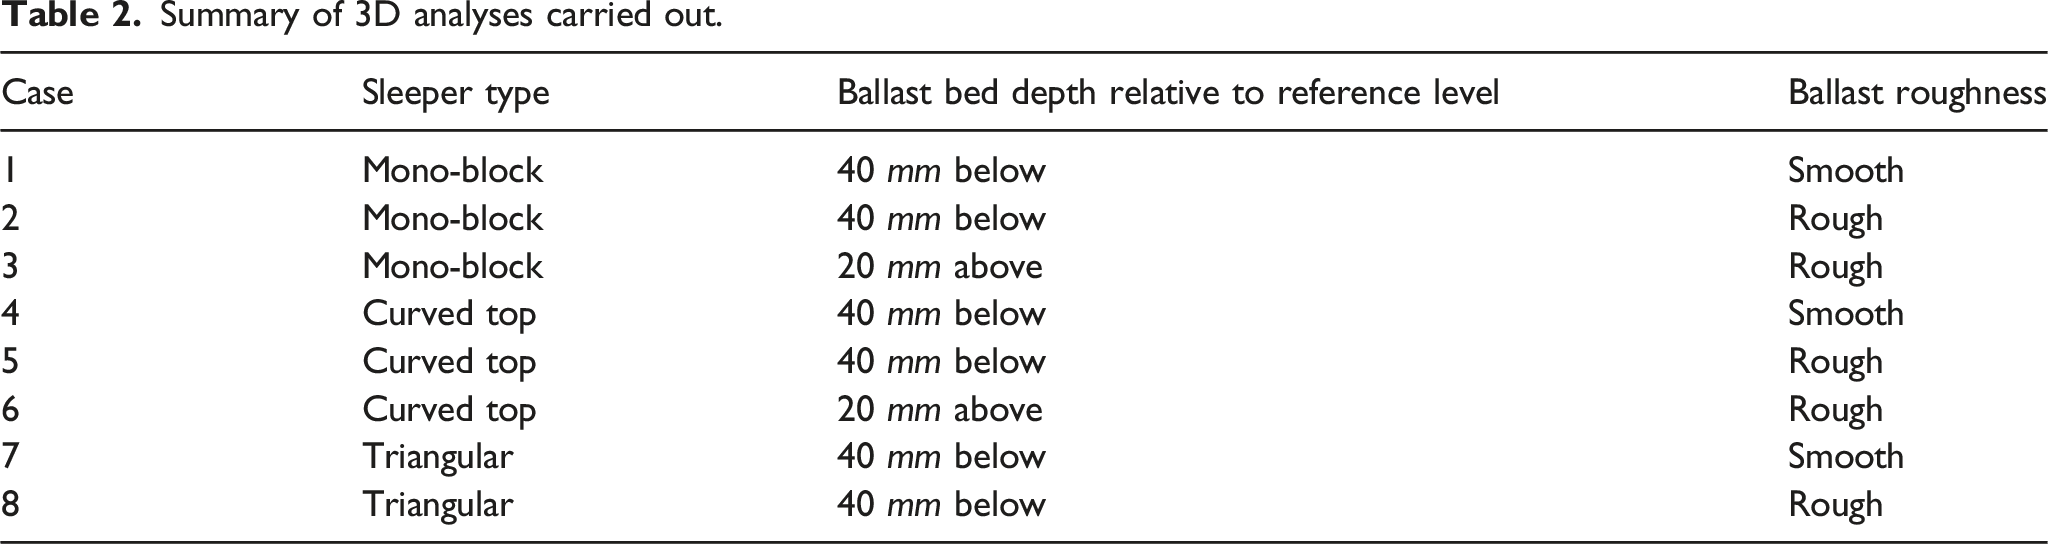
Two ballast depths were considered (with the ballast surface either 40 mm below or 20 mm above the reference level for the sleeper type indicated in Figure 2), and up to two different ballast bed surface roughnesses, applied numerically as already discussed. The various analyses enabled comparison of the effects of a change in sleeper shape, ballast depth, ballast roughness, and the position of an isolated ballast grain (cube). The general flow characteristics and the aerodynamic forces acting on each cube were assessed to determine track configurations more or less likely to facilitate ballast flight. 3D renders of each sleeper shape, with 60 mm cubes placed on top of or between sleepers, are shown in Figure 5. The eight cases modelled in 3D analyses are summarised in Table 2. A 3D simulation of the G44 sleeper with the ballast surface at the reference level (i.e., at the upper surface of the sleeper) was not carried out, as the results of the 2D analysis are sufficient for comparative purposes in this case. 3D renders showing mesh and geometrical layout of (a) mono-block; (b) curved top; and (c) triangular sleepers, with three cubes placed on each track section. Ballast depth 40 mm below reference level in all cases. Summary of 3D analyses carried out.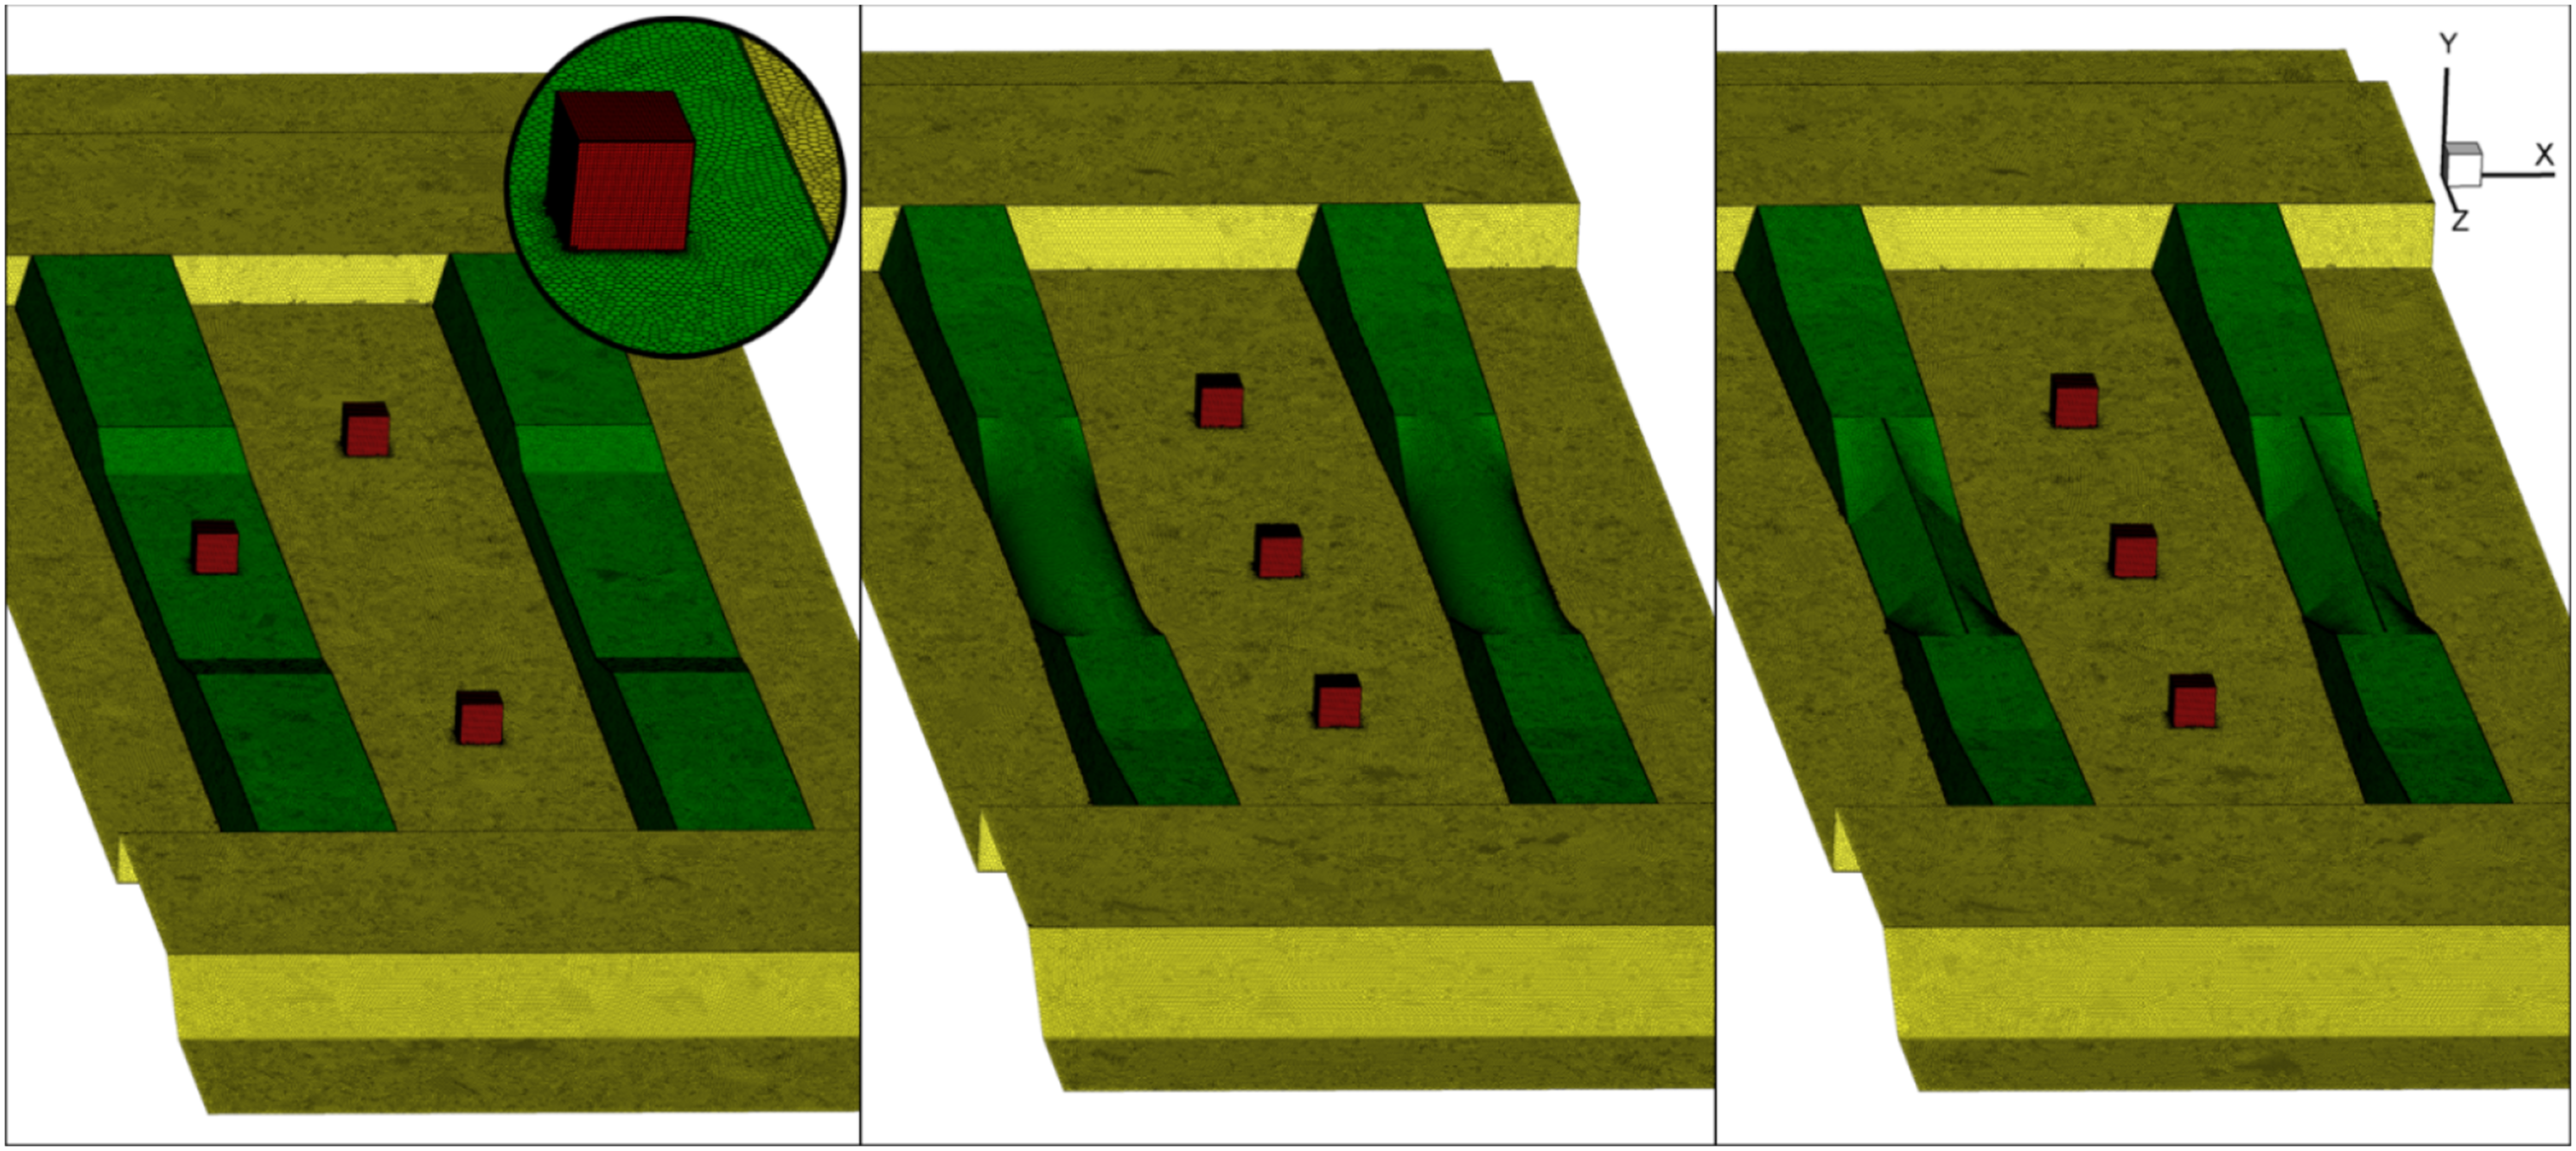
In the 3D analyses, the fluid domain was meshed using an unstructured grid configuration of up to 12 million polyhedral cells using AnSys Meshing 2018 software and AnSys Fluent. The mesh originally comprised a mixture of unstructured tetrahedral cells and structured hexahedral cells on the surfaces of the cubes. The inlet and outlet surfaces were matched to allow periodic conditions to be applied. Refinement volume regions were placed near the track section, where large changes in flow were expected. Near the wall surfaces, a structured boundary layer mesh with up to 40 layers was applied to achieve the desired
For the 3D studies, an unsteady turbulence model was needed to capture instantaneous flow and to produce reliable results by resolving the mixing process in the flow field. RANS and URANS were not considered because smaller eddies in the flow would need to be resolved around complex shapes using transient analysis; this left Large Eddie Simulation (LES) and Detached Eddy Simulation (DES) as possible options. DES is a hybrid turbulence model that utilises RANS near the walls in the attached boundary layer and LES elsewhere. This makes DES computationally cheaper than LES. Delayed Detached Eddy Simulation (DDES; a form of DES with additional parameters to facilitate switching from RANS to LES outside near the boundary layer), was chosen, with the SST
In unsteady analysis, the mesh must be sufficiently refined to resolve smaller eddies. The time step 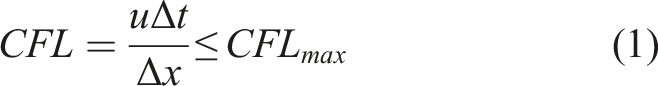
An explicit time-marching solver was used with
In the streamwise direction, periodic boundary conditions were applied to the inlet and outlet of the domain allowing the flow generated by the moving top wall modelled as fully-developed. Sufficient time and flow passage was allowed for the flow to fully develop, confirmed by the forces varying over a steady range of values (as indicated later, in Figure 10).
Aerodynamic lift, drag and side force coefficients as defined in equation (2) were determined for the isolated cube as: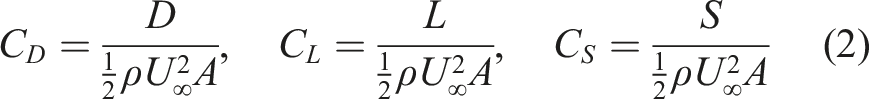
The residual value for CFD convergence, which quantifies the error in the numerical solution, was set to
Results
2D analyses
2D analyses with one, two and four sleeper blocks showed that the number of sleeper blocks modelled had no significant influence on the velocity profile at entry, exit or the centres of the crib and a sleeper. Example velocity profiles illustrating this for the conventional mono-block sleeper with the two extreme ballast depths (i.e., 40 mm below and 20 mm above the sleeper top) are shown in Figure 6. Data for the mono-block sleeper with the ballast surface at the reference level have been taken from the 2D channel flow analyses with ballast roughness applied. Normalised velocity profiles at key sections along the track for analyses with one and two mono-block sleepers with periodic inlet and outlet boundary conditions. The surface of the ballast bed is (a) 20 mm above (left) and (b) 40 mm below the sleeper top (right). Calculated velocity profiles are shown for analyses with one (single) and two sleepers, at the flow domain inlet and the centre of a sleeper. The origin of 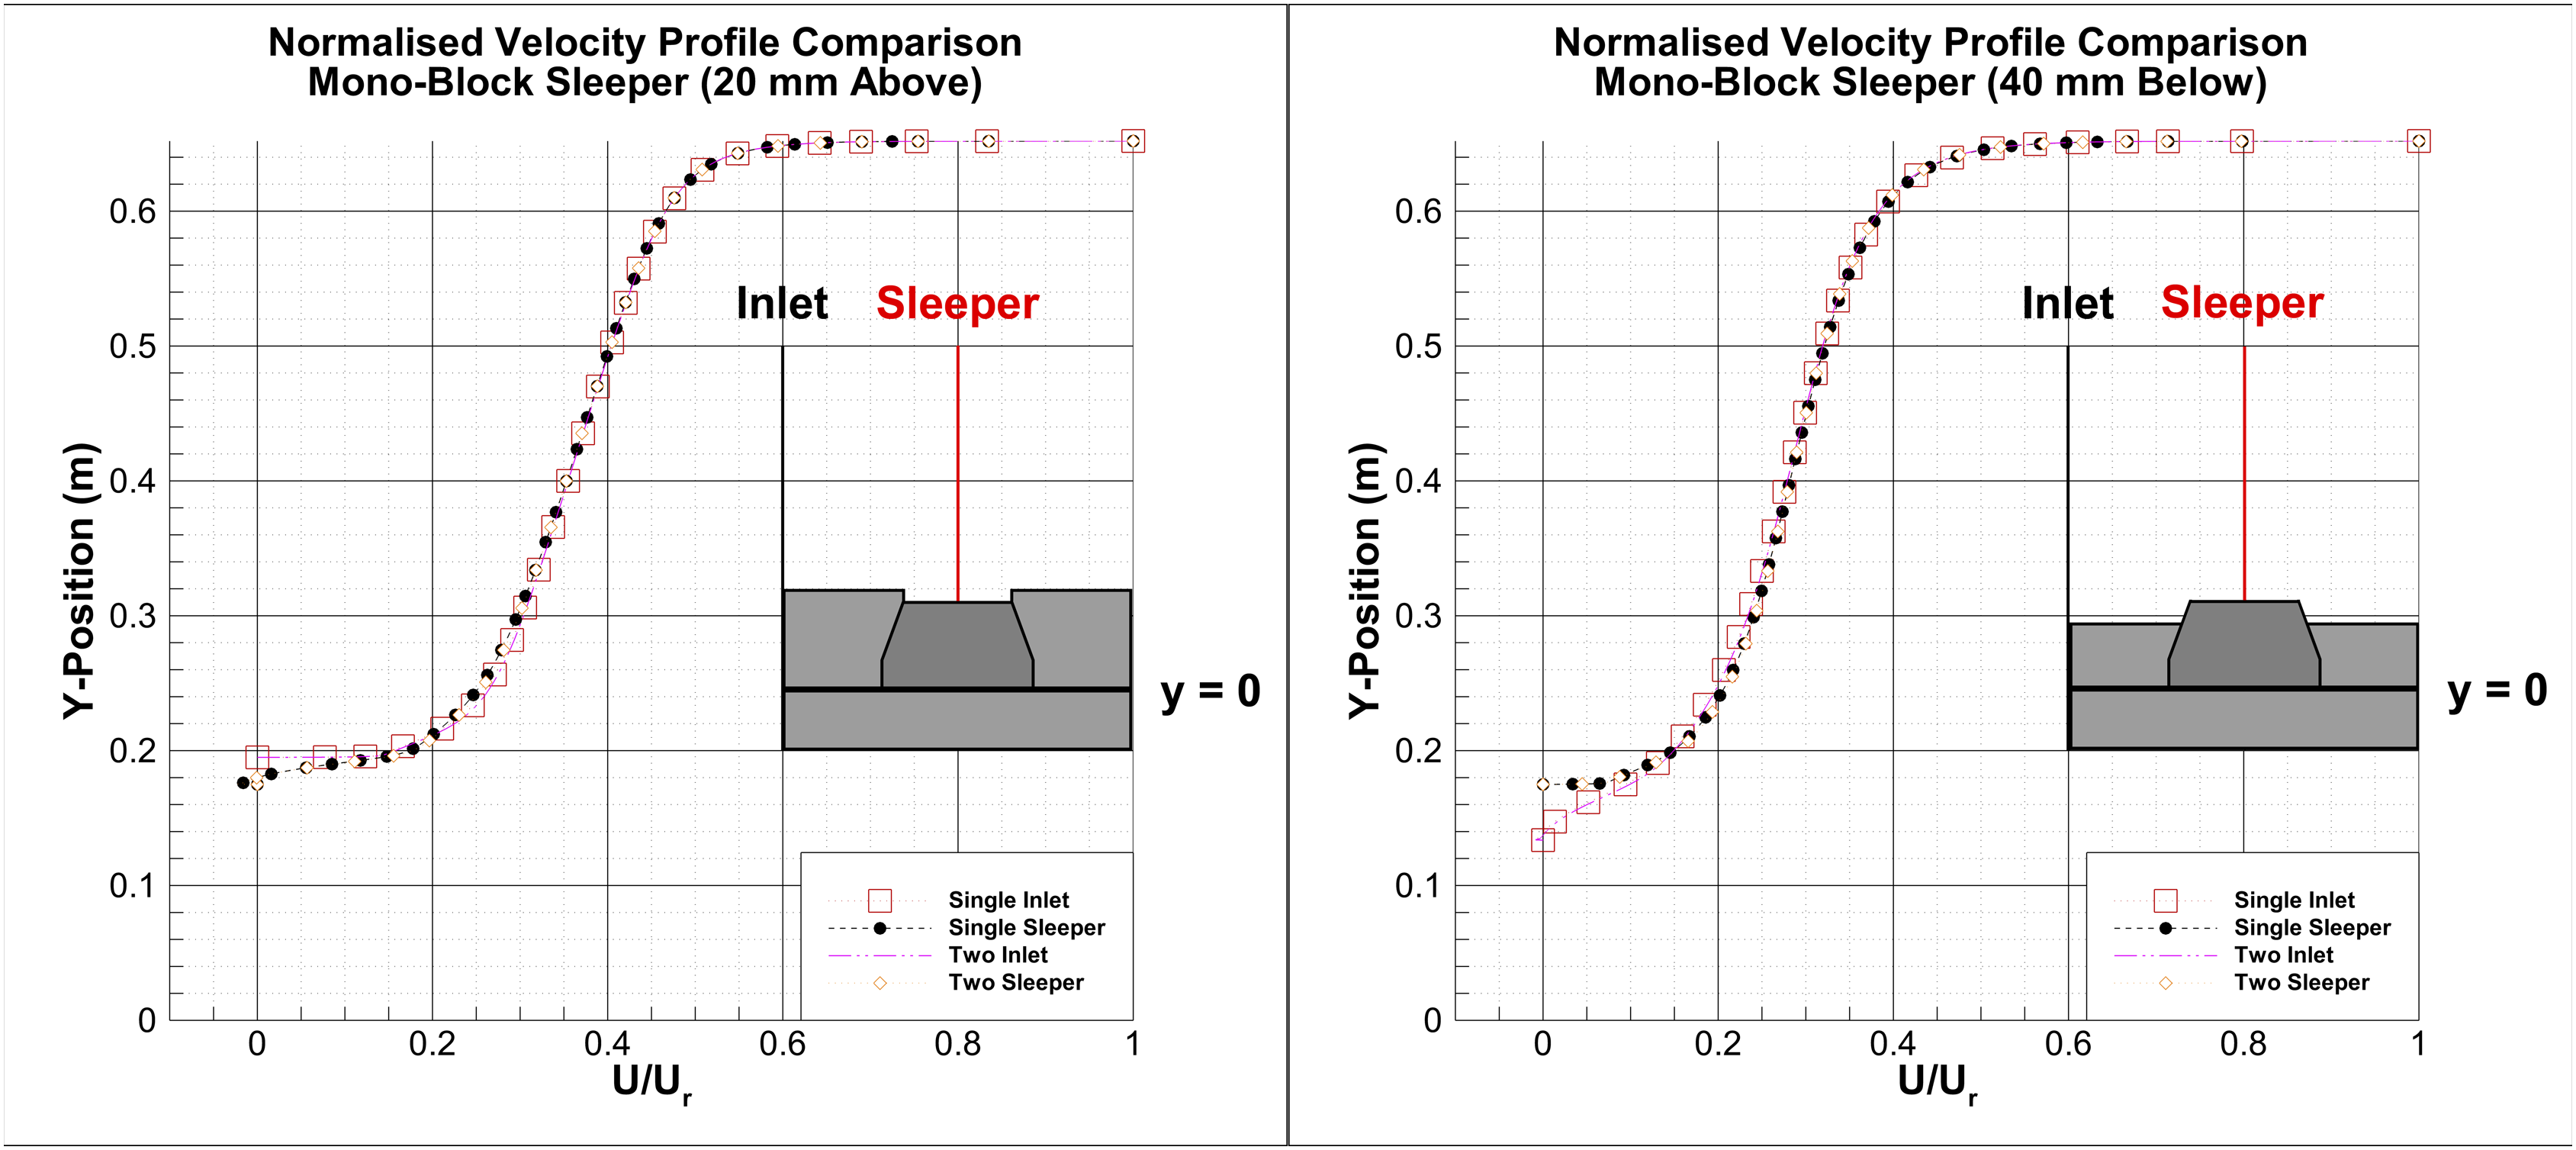
The calculated velocities near the ballast bed shown in Figure 6 are significantly less than the speed of the moving train. This is especially so when the ballast is lowered (Figure 6(b)) owing to the flow separation that then occurs at the exposed sleeper corner, which generates low speed vortices (
Contours of absolute vorticity in the region of the upper moving wall (train underbody) and each of the three sleeper shapes with two different ballast levels are shown in Figure 7(a). In between these regions, the flow is essentially parallel and is therefore not shown. The mass flow rate associated with a given speed of train or moving wall decreases when the surface of the ballast bed is lowered, as a result of the reduction in speed near the ballast bed (Figure 7(b)). Contours of absolute vorticity (top) and streamwise velocity (bottom) near the upper moving wall (train underbody) and above the three different sleeper shapes, with the ballast bed (a) 20 mm above and (b) 40 mm below the reference level.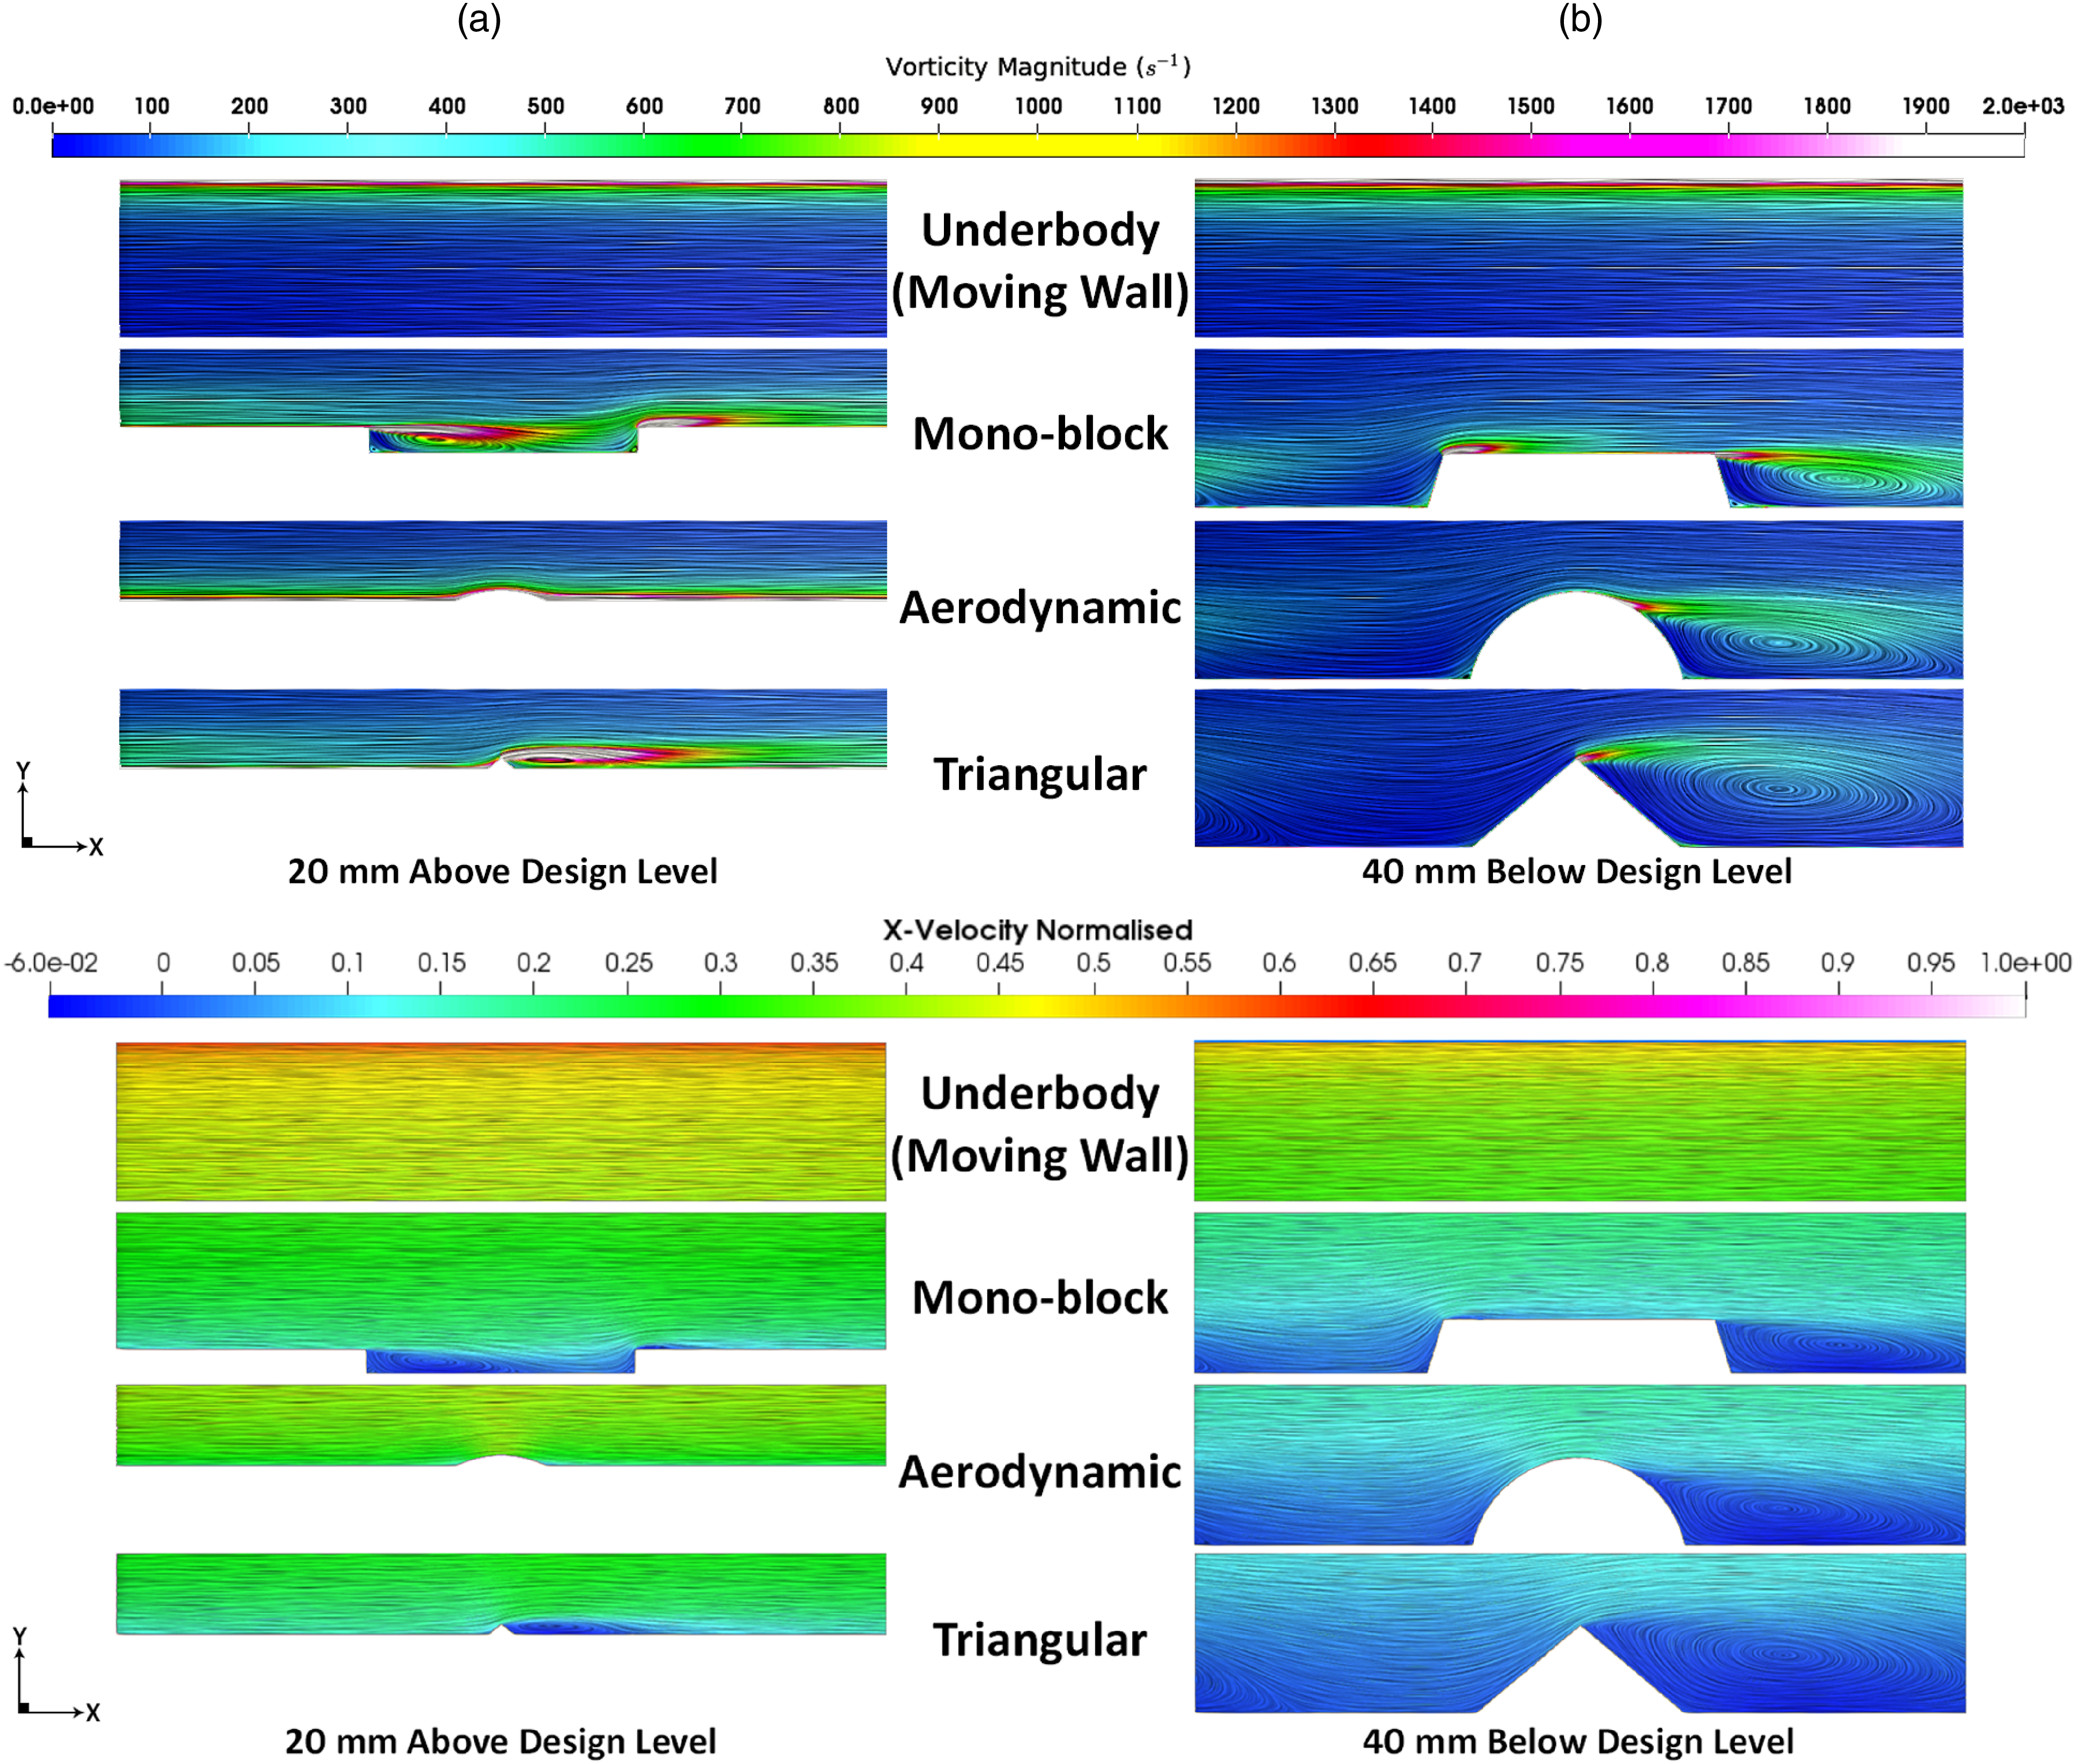
Whatever the sleeper shape, lowering the ballast surface (to 40 mm below the reference level) is beneficial in that flow separation and vortex shedding from the exposed sleeper top shields the ballast in the crib from high velocity flow. The effect is perhaps most marked for the triangular top sleeper, with the curved top sleeper showing little additional benefit compared with the conventional G44. If the crib is over-filled so that the ballast surface is 20 mm above the reference level, the benefits of flow separation are substantially reduced, lost or even reversed. In the case of the triangular top sleeper, the exposed apex still promotes some potentially useful flow separation. Little separation is associated with the curved top sleeper and the velocity profile corresponds essentially to Couette flow. In the case of the conventional sleeper, the raised surface of the crib ballast is subjected to increased air velocities that could contribute to ballast flight.
The 2D analyses suggest that a sleeper whose cross section causes flow separation and vortex shedding at a reasonable height above the crib ballast may be beneficial in reducing the potential for ballast movement. The results presented in Figure 7 suggest that effectiveness of the curved top sleeper seems to rely on the level of the crib ballast level being sufficiently low. As long as the slope is steep enough to prevent ballast from settling, the triangular cross section might be a better alternative.
3D analyses
The 3D analyses modelled a number of sleeper blocks surrounded by ballast, with isolated cubic particles in specific locations to investigate where ballast movement may occur and what track configurations might prevent it. To maintain a reasonable computational time the rails, fastenings and train bogies were not included; nonetheless, the 3D modelling accounts for out of plane flow and the changes in the cross section of the sleeper along its span.
To capture turbulent flows potentially leading to ballast flight, the 3D simulations used a DDES (SST
Flow structures
Flow structures can be visualised using surfaces on which values of the Q-Criterion (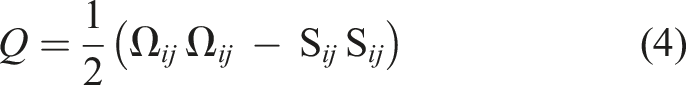
A positive value of
Figure 8 shows iso-surfaces of the Q-Criterion ( Iso-surface plot of the Q-Criterion (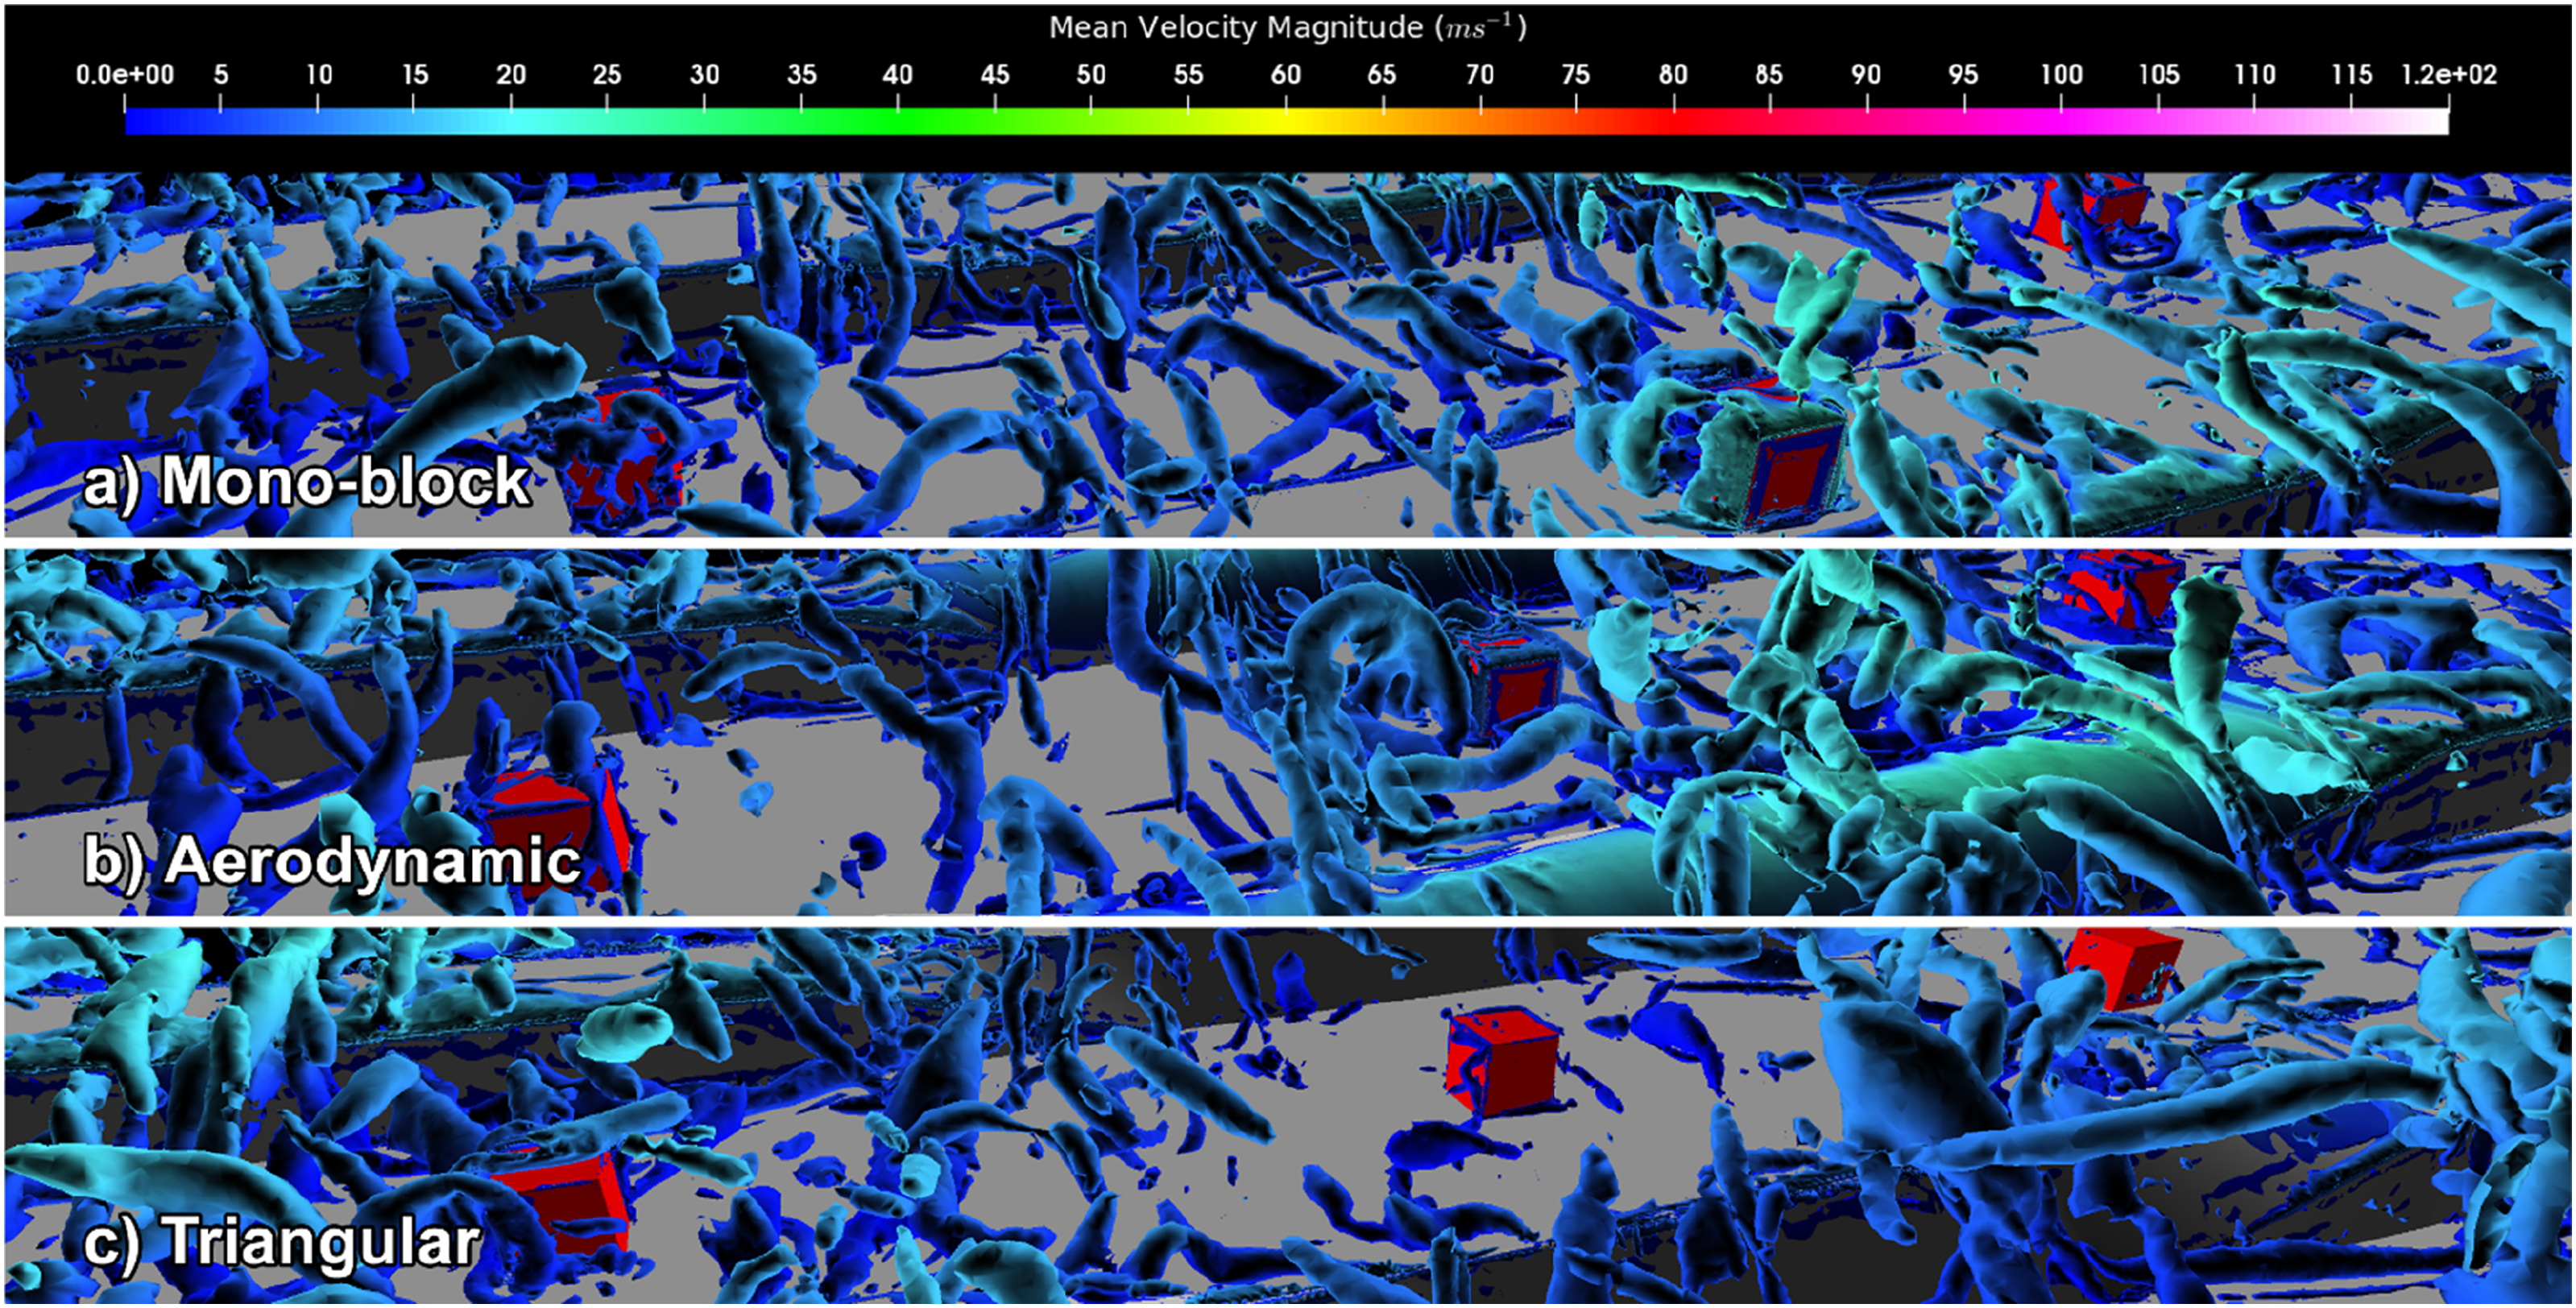
The analysis of the mono-block sleeper (Figure 8(a)) shows the flow separating from the sleeper, then colliding with the cube resting on top of the sleeper. The vortices around this centre cube are larger than around the cubes resting on the ballast bed on either side of the track centreline, implying that the lift and drag forces on the centre cube would also be greater. Thus a ballast grain resting on the sleeper top would be more prone to disturbance than a ballast grain in the ballast bed. The vortex structures for the curved top sleeper (Figure 8(b)) are similar except in the middle, where turbulent layers showing less separation are formed across the front half of the cylindrical surface. For the triangular sleeper (Figure 8(c)), the flow separates but the vortices also diverge in the spanwise direction owing to the trapezoidal shape of the middle section of the sleeper.
At
As in the 2D analyses, raising the ballast level removes the benefits of flow separation at the sleeper blocks as well as potentially defeating the purpose of the curved top sleeper in preventing ballast from settling on its upper surface; making all three cubes more prone to movement. In reality, the level of the ballast surface would need to be high enough to provide sufficient lateral resistance to keep the track in place, but low enough to ensure consistent flow separation so as to produce low speed vortices between the sleeper.
Aerodynamic forces and surface pressure across the track
Figure 9 shows the effects of ballast surface depth and roughness on the mean, 10th and 90th percentiles of the force coefficients (lift, longitudinal and sideways drag) for the 1.0s over which the flow had become reasonably fully developed (1.0 to 2.0s), for the (a) conventional mono-block, (b) curved top and (c) triangular top sleepers respectively. Force coefficients for cubes (a) on the ballast surface in the crib between (left and right cubes) or on the sleeper surface of (middle cube) mono-block sleepers; (b) on the ballast in the crib between curved top sleepers (40 mm below and 20 mm above reference level in each case); and (c) on the ballast in the crib between triangular top sleepers, showing the effect of ballast depth (40 mm below reference level only). The centre points indicate the mean and the range bars the 10th and 90th percentile values.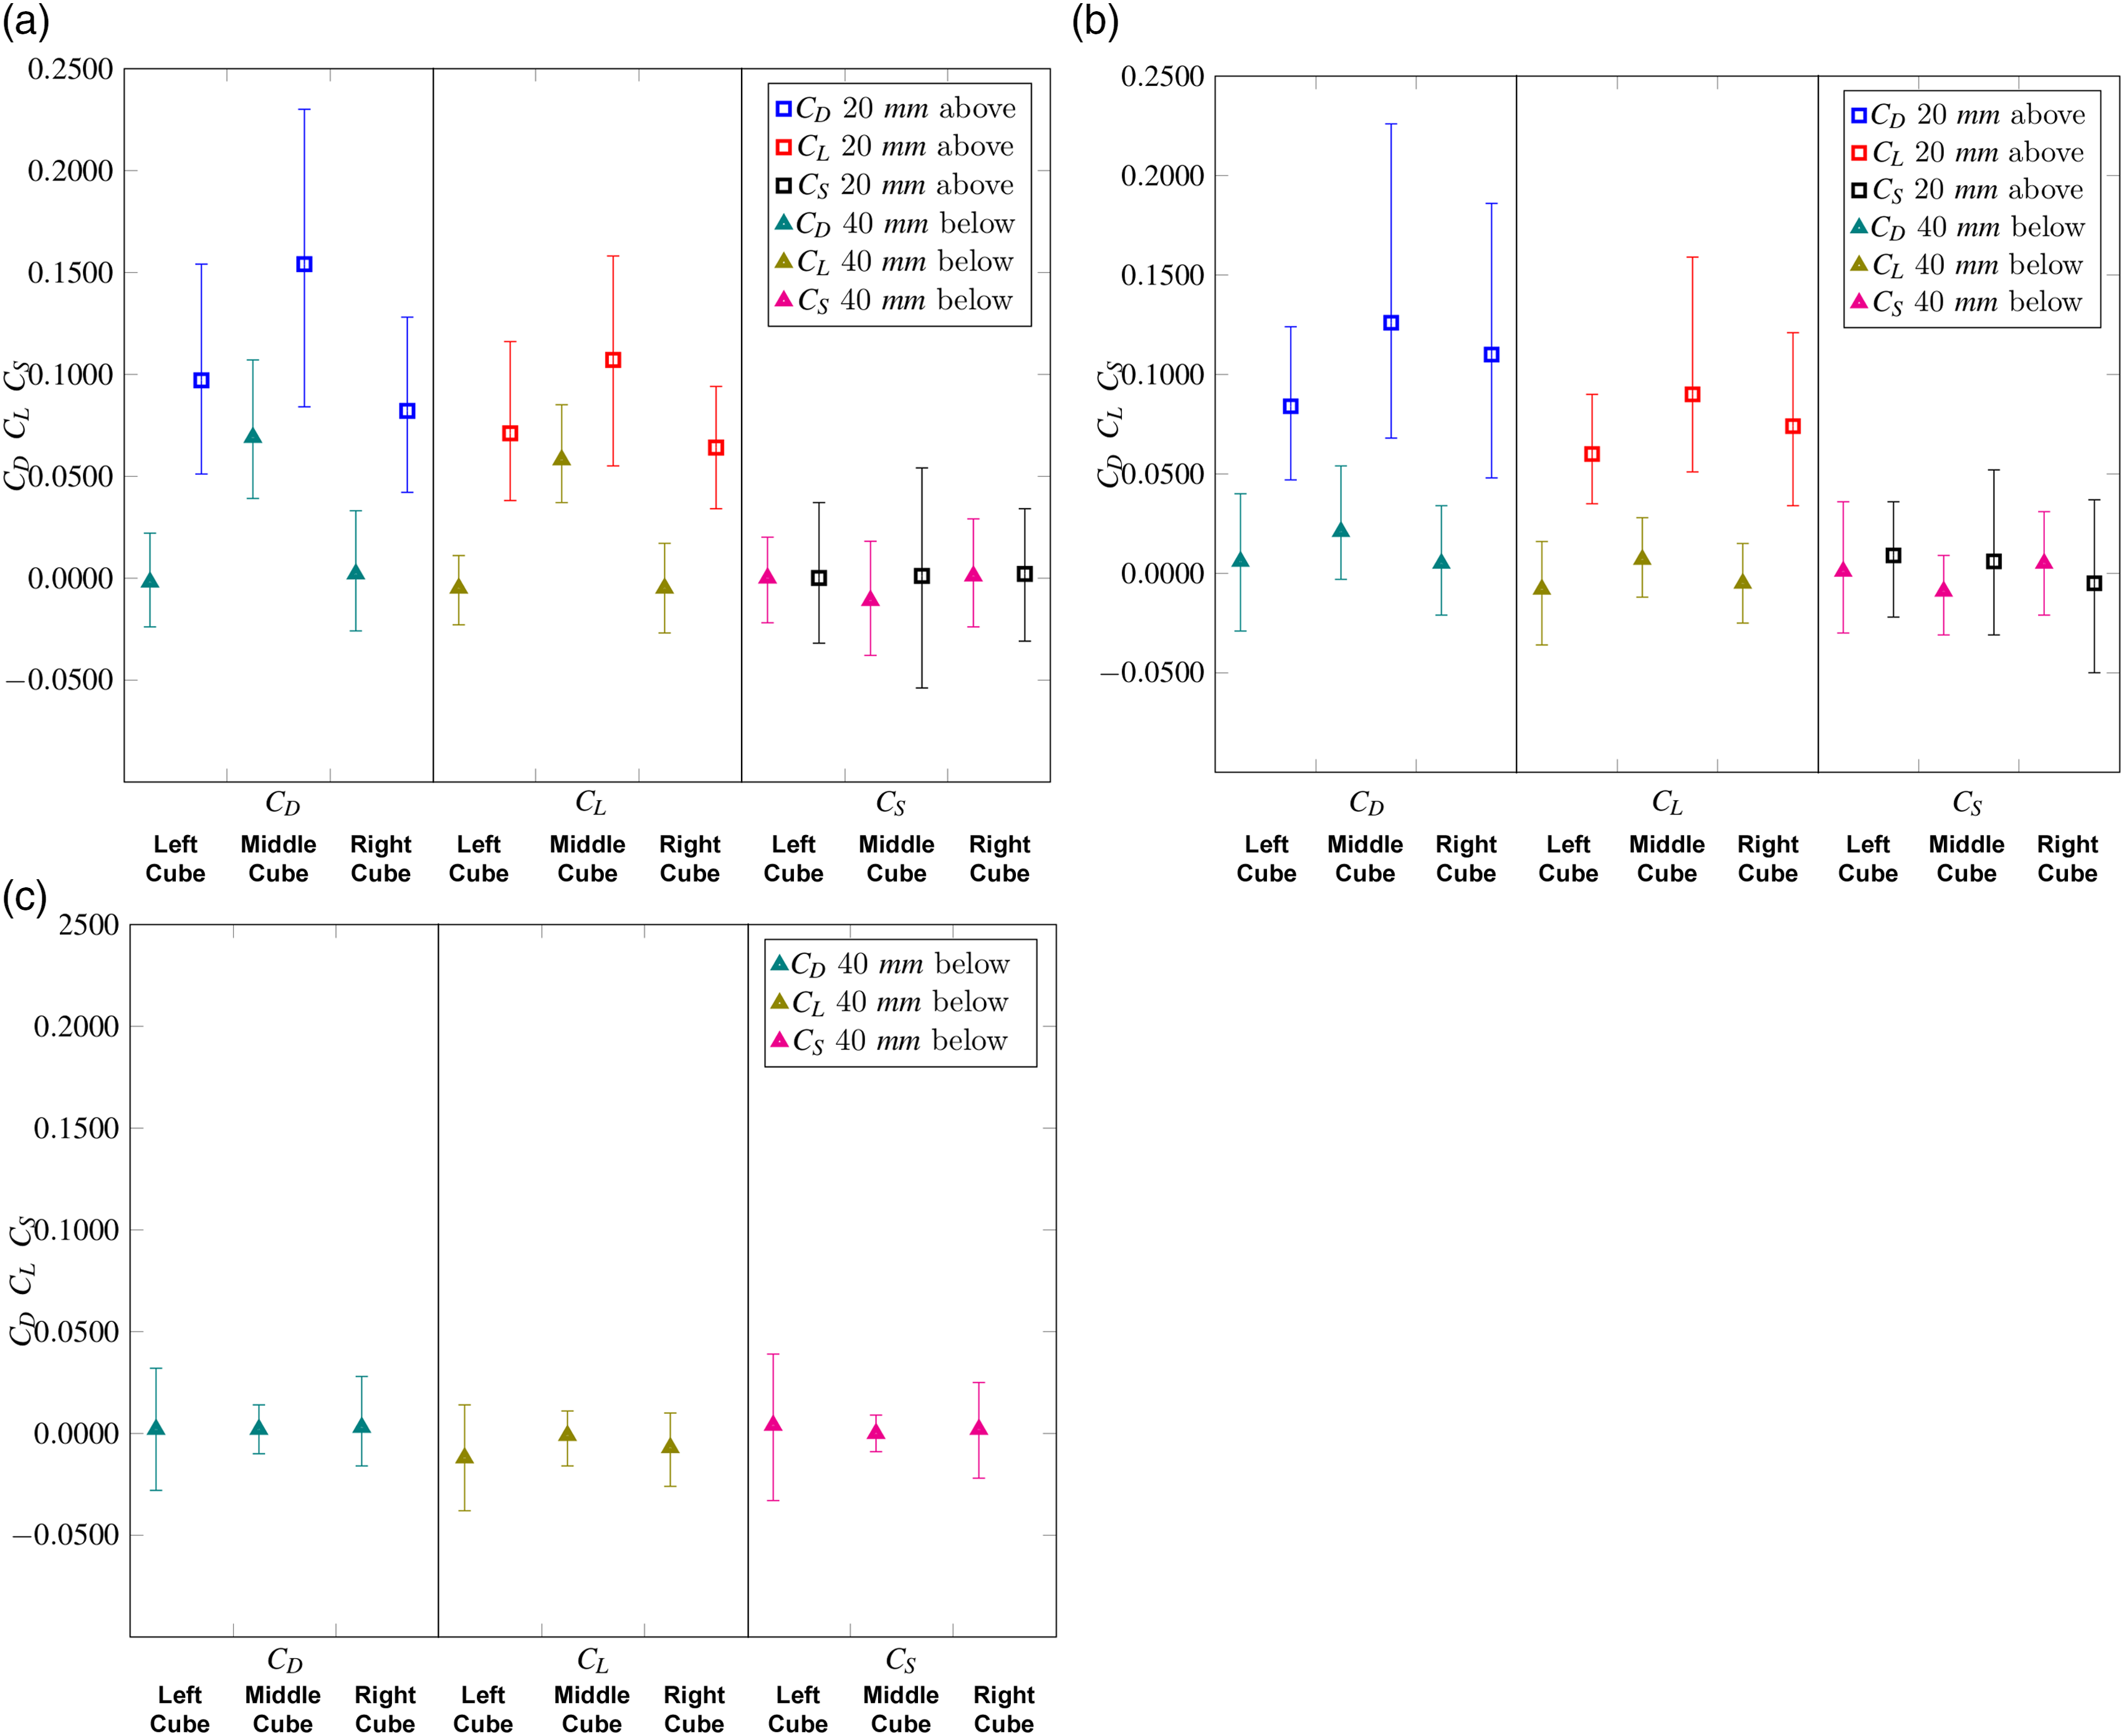
In the first two cases, lowering the crib ballast reduces the average values and generally reduces the ranges of
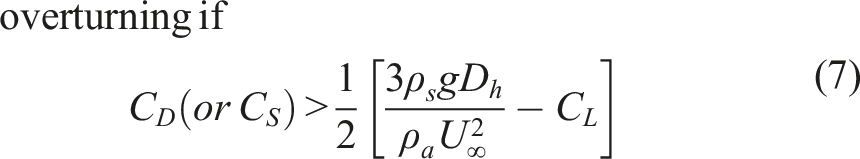
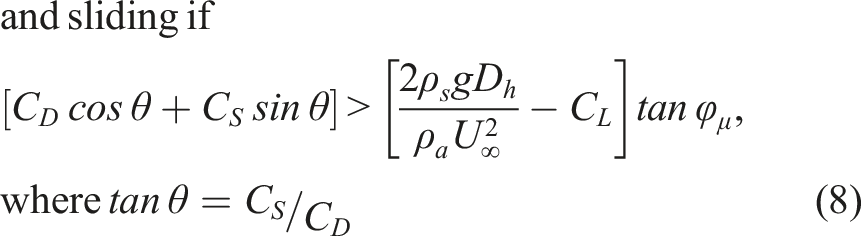
A simple equilibrium analysis would suggest that a cube could become airborne if the lift force exceeds the cube weight; slide if the drag force exceeds the frictional resistance to sliding; or overturn (roll) if the moment of the drag force about the leeward edge exceeds the moment of the weight minus the moment of the lift force. For a cube of side 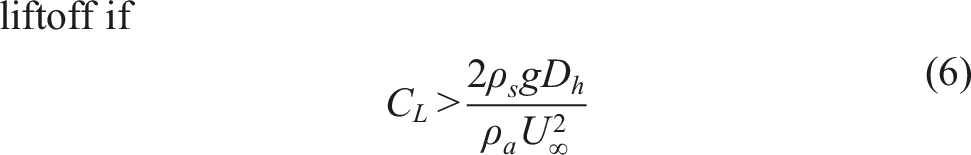
Typically for granite,
Taking Simulated instantaneous lift force for a 10 mm cube placed centrally on the conventional mono-block sleeper, with the ballast surface 40 mm below reference level, compared with the cube weight. (The lift force was calculated from the CFD results for a 60 mm cube in the same location, assuming the same value of 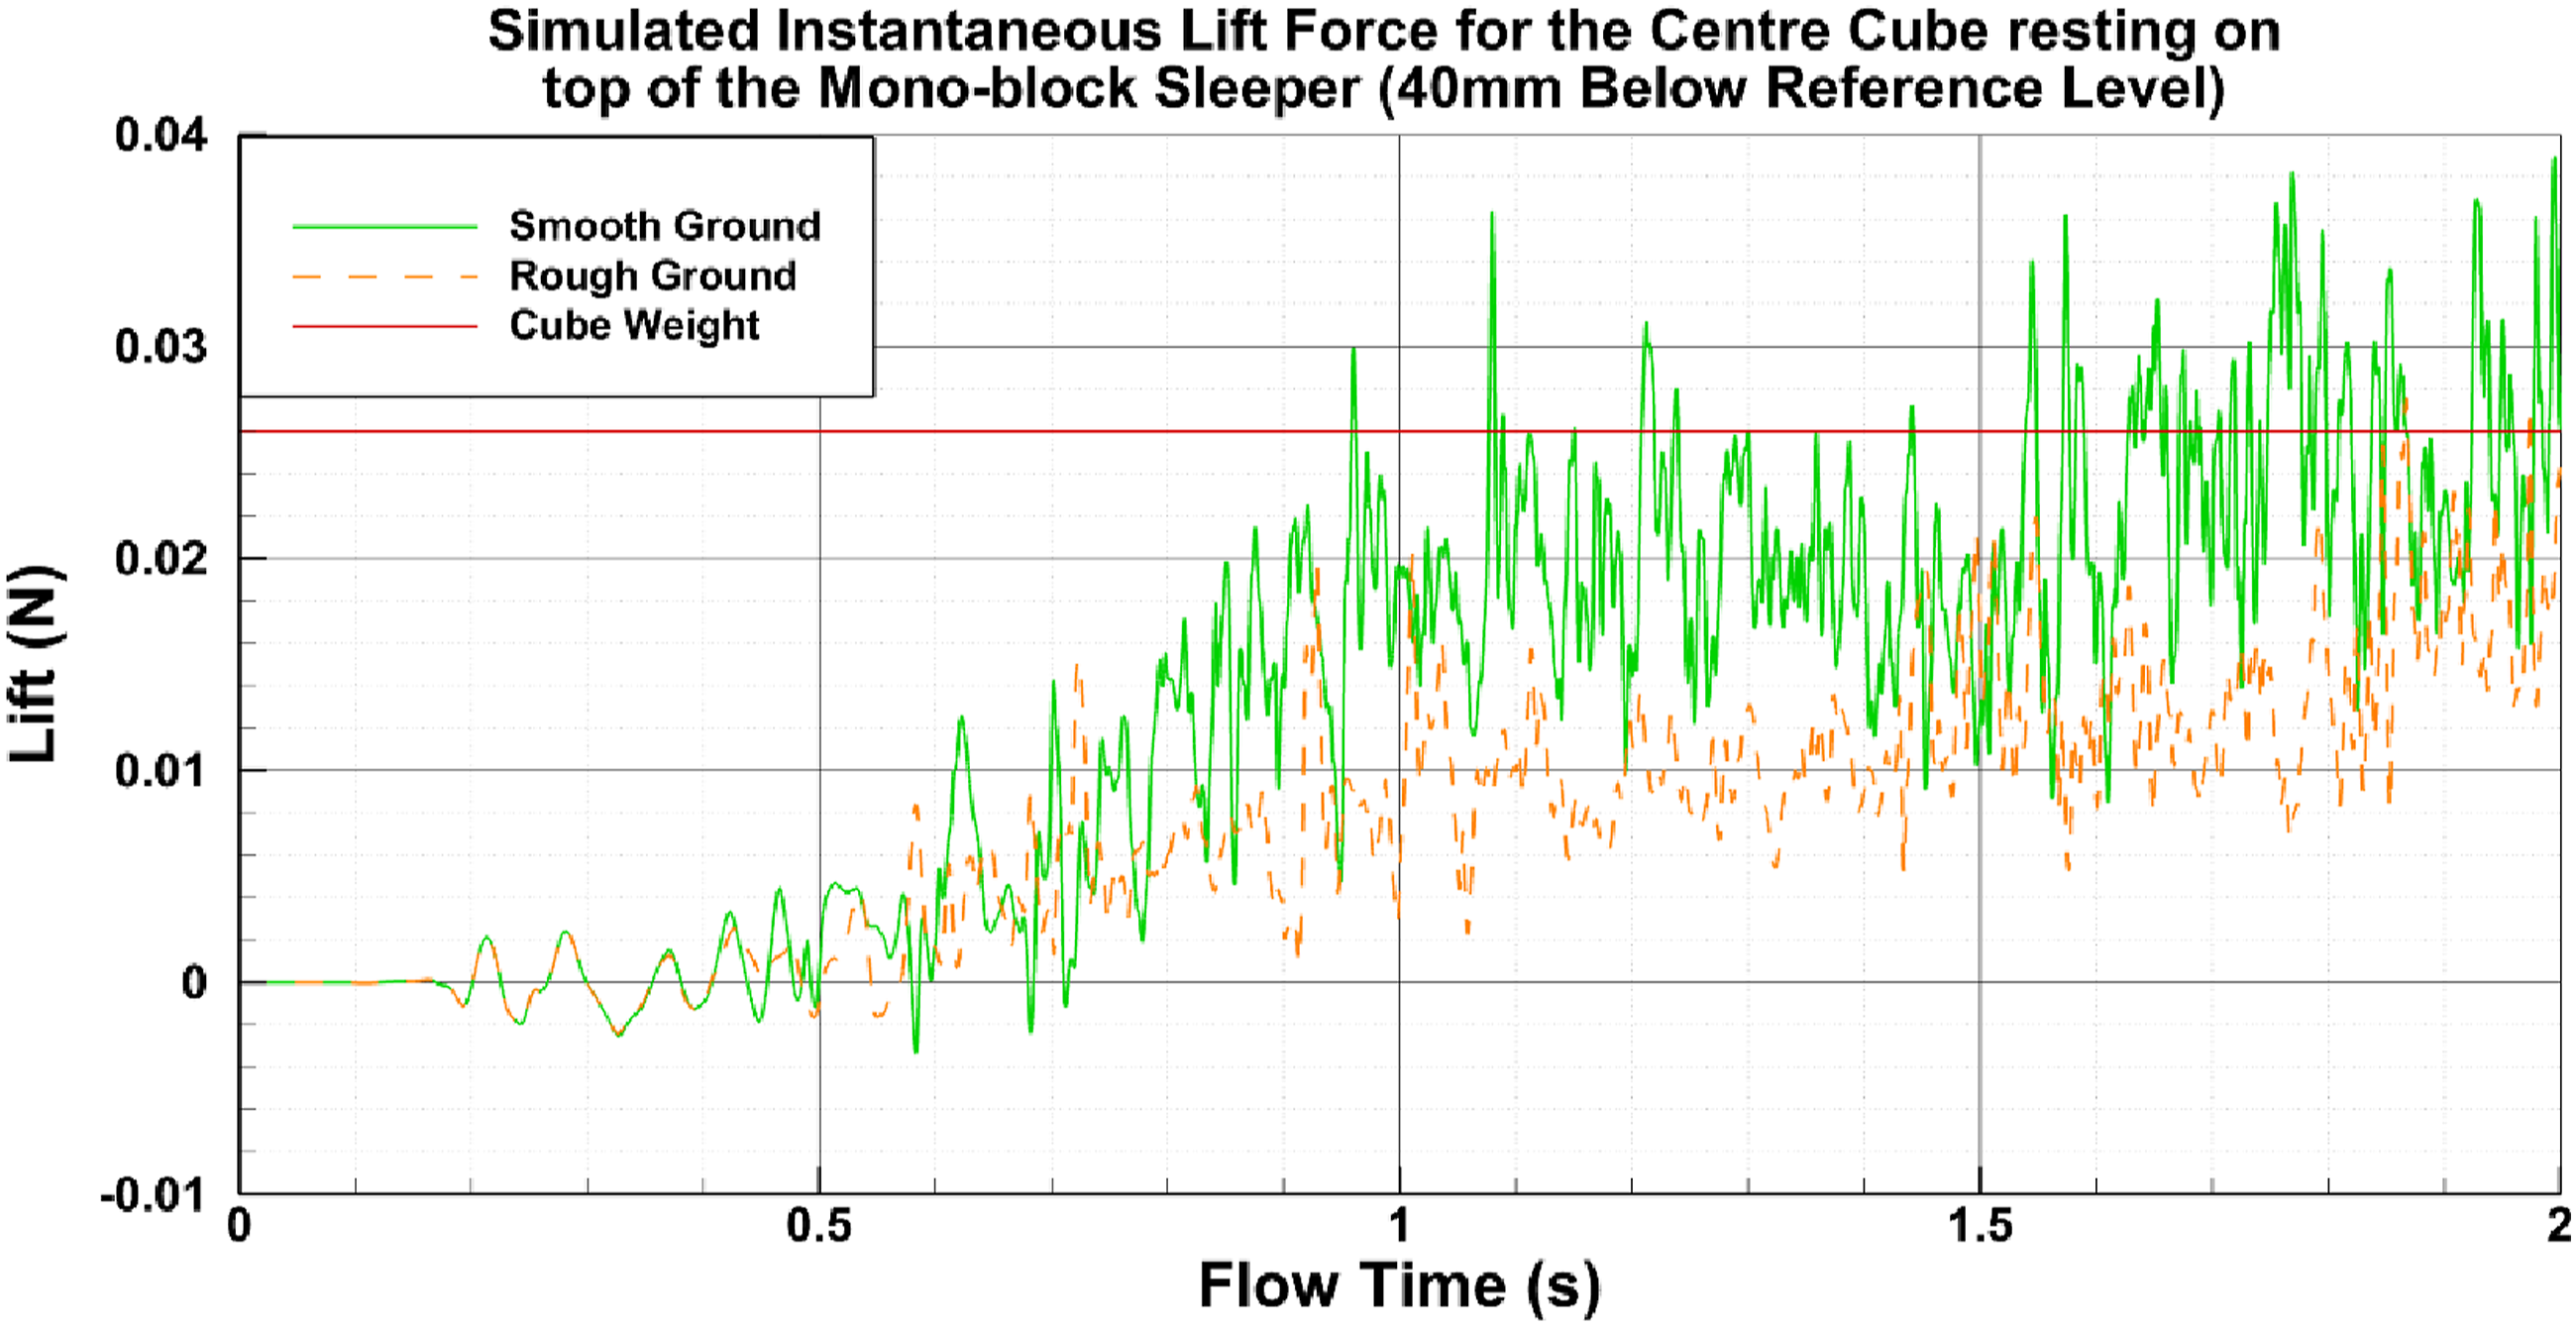
This idealised analysis shows that small (< about 20 mm) ballast grains have the potential to become airborne from, and that even quite large grains (< 60 mm) are likely to be blown off, the top of a conventional sleeper at a train speed of 120 m/s (432 km/h). This demonstrates the imperative of keeping the ballast surface between the rails below the level of the sleeper top, and the sleeper tops clear of ballast.
This is broadly compatible with the analysis presented by Quinn et al (2010), 2 who considered the conditions needed for the projection of spherical ballast grains of diameter 10 mm and mass density 2,000 kg/m 3 onto the rail head, at a train speed of 75 m/s. For such a grain initially 0.6 m from the centreline of the track, with an initial velocity (imparted by ground vibration due to train passage) of 0.02 m/s, to reach the rail head would require a vertical air velocity of 14 m/s. This was considered, on the basis of field measurements, to be an extreme but statistically possible occurrence.
Strictly, ballast flight relates to a grain becoming airborne due to excessive lift, rather than sliding or rolling. However, tests carried out by the Spanish rail infrastructure operator ADIF revealed a mode of movement that involved a grain initially sliding along the top of a sleeper, then becoming airborne across the crib. 24 This could be caused by the grain rotating during the initial slide to an orientation more prone to uplift; the dependence of aerodynamic forces on orientation for realistic ballast grain shapes has been demonstrated using CFD by Pardoe (2018). 25
Figure 11 shows the distributions of mean pressure given as mean pressure coefficient Time-averaged static pressure distributions (plotted as mean pressure coefficient, 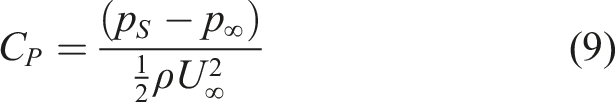
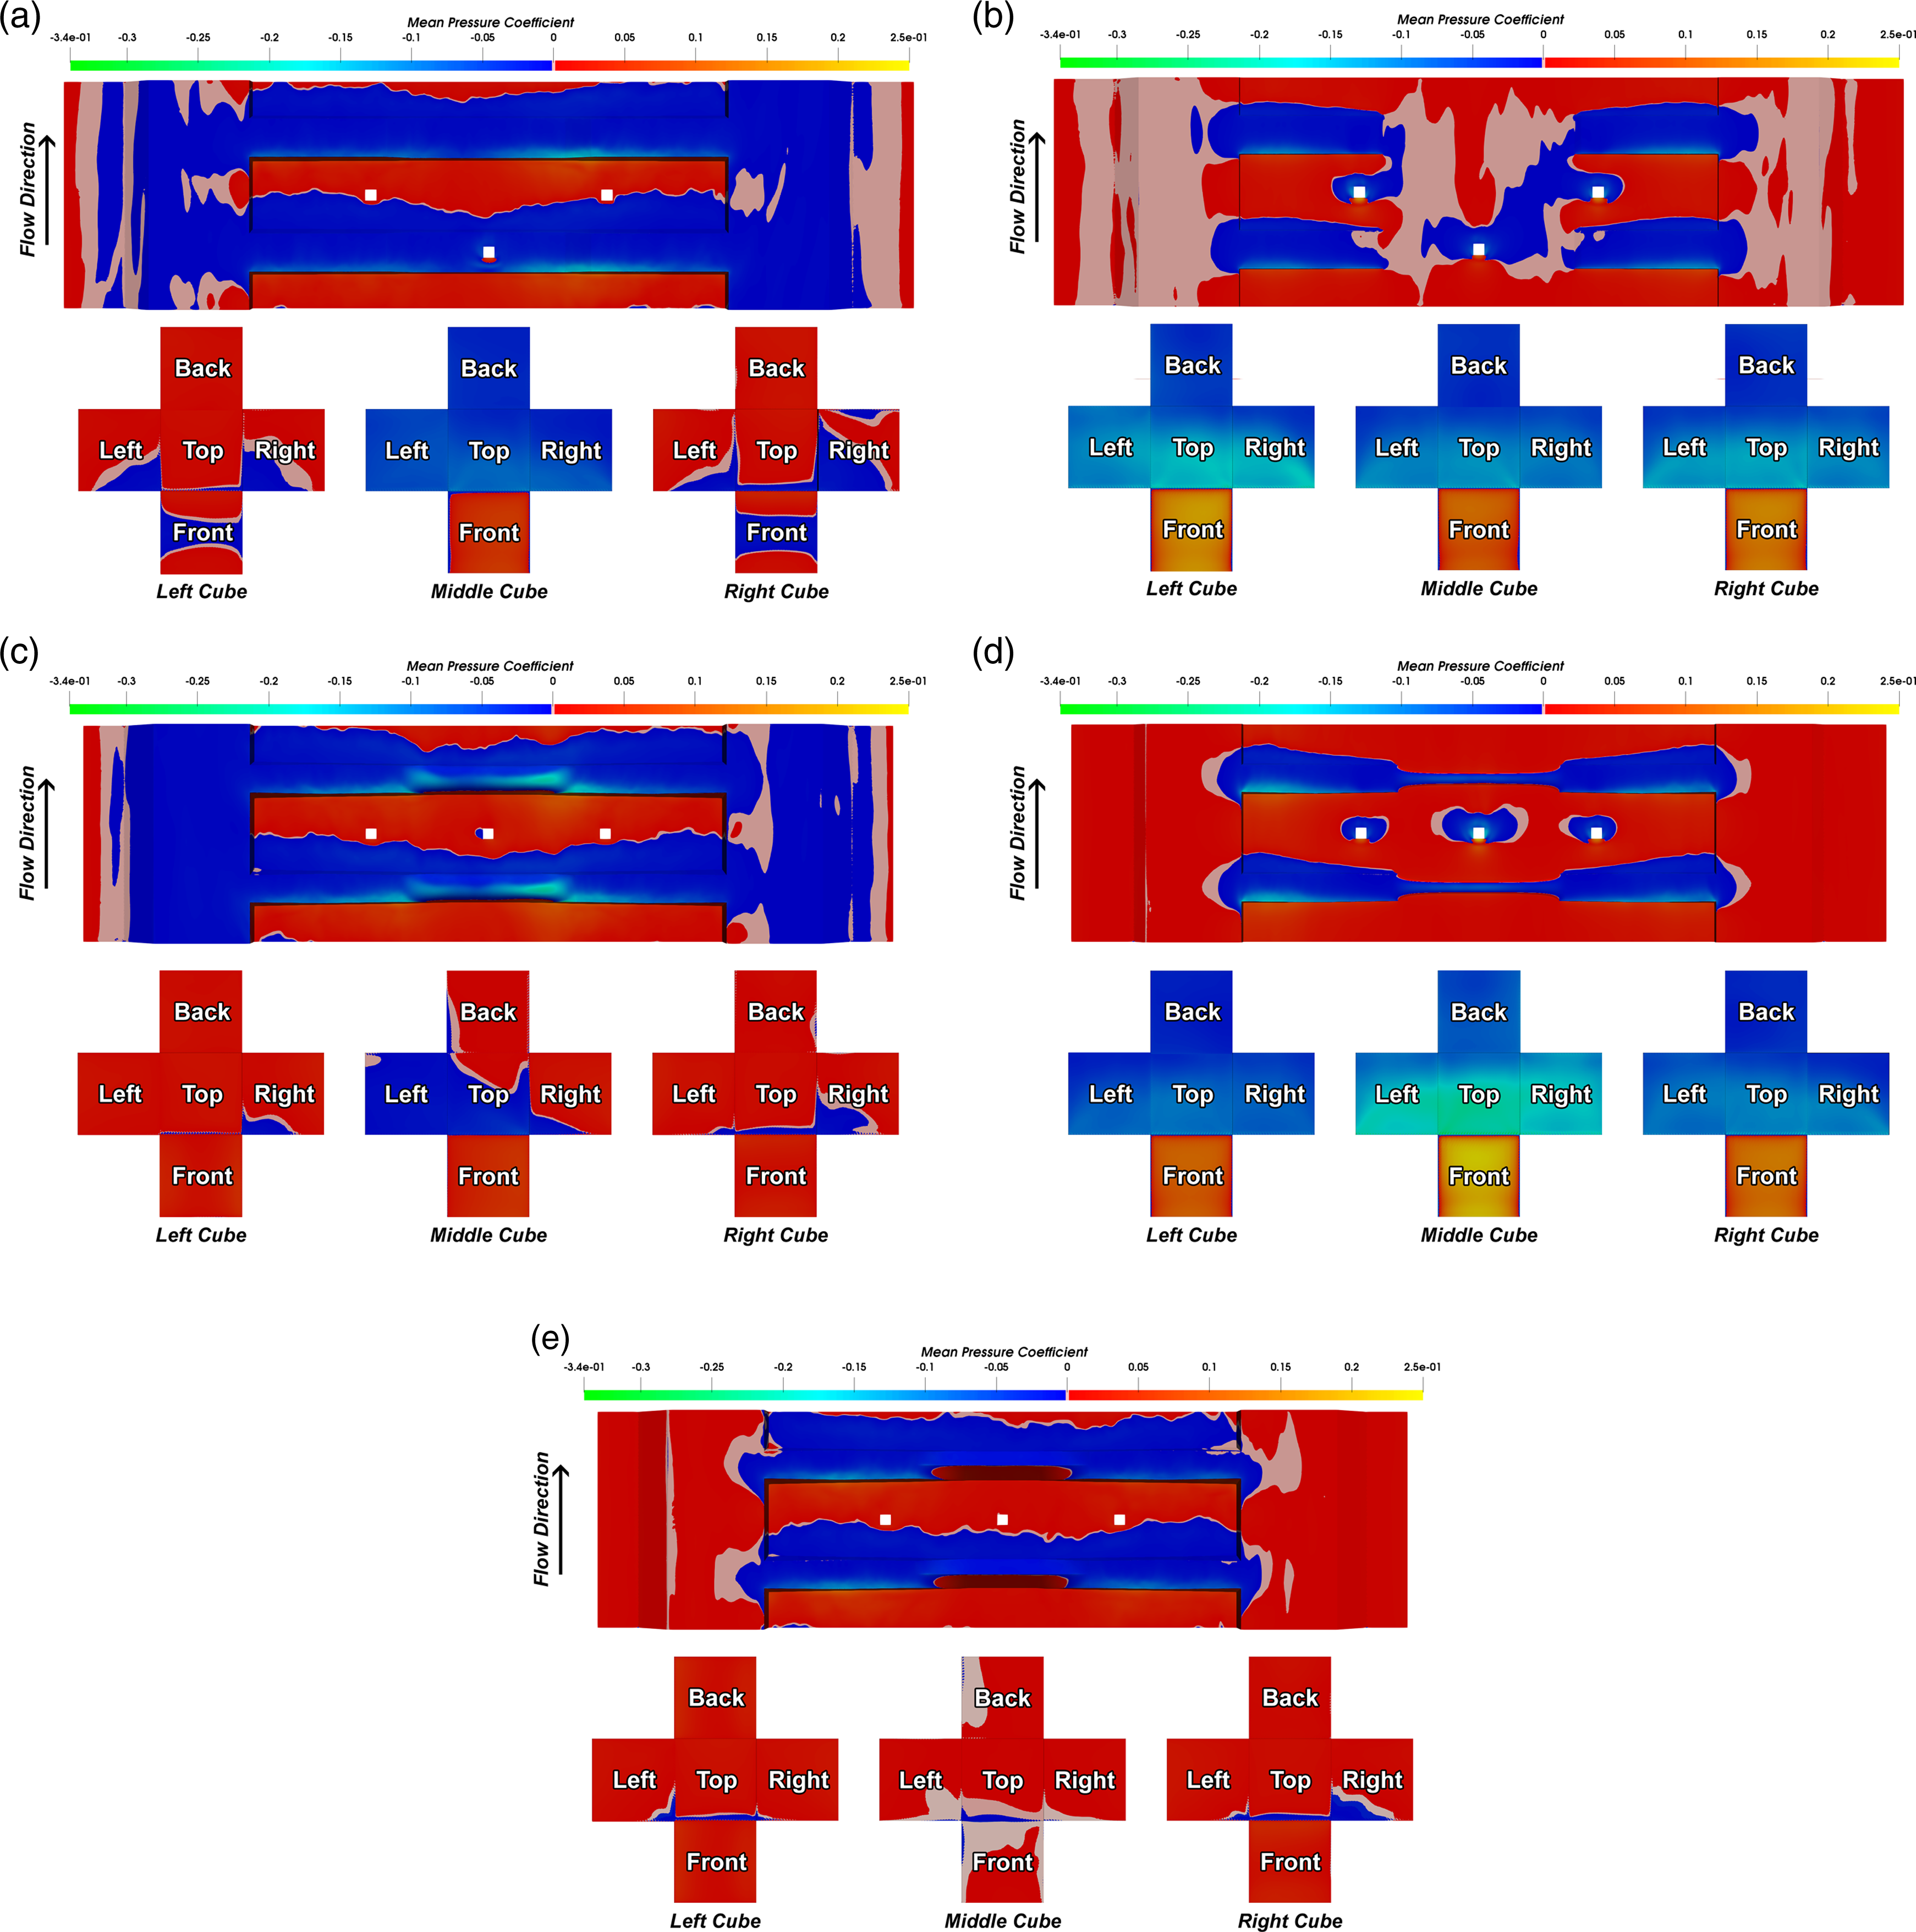
Associated with each of the three sleeper shapes, with ballast roughness applied and the ballast surface 40 mm below or 20 mm above reference level.
The mean averaged static pressure distributions shown in Figure 11 show that: • With the ballast surface 40 mm below reference level, the cubes between the conventional sleepers experience much less pressure on their front surfaces than the cube on top of a sleeper, owing to flow separation between the sleepers (Figure 11(a)). Hence it is important that a ballast grain does not come to rest on the upper surface of a conventional sleeper, where it will be more likely to suffer movement owing not only to the increased wind pressure but also to the reduced friction on the smooth concrete surface compared with the rough ballast bed. • Raising the ballast bed to 20 mm above reference level considerably increases the wind pressures on cubes resting on the sleeper upper surface (Figure 11(b)). Hence it is important not to over-fill the crib. The corollary is that the susceptibility to flight of ballast grains within the crib can be reduced by lowering the ballast surface, although it would need to be confirmed that the remaining buried depth of the sleeper would provide sufficient lateral restraint to the track. • For the curved top sleeper, the pressures on the left and right hand cubes (in the crib) in Figure 11(c) are essentially the same as those for the conventional sleeper with the lower ballast level shown in Figure 11(a). Hence the main benefit of a curved top sleeper is probably that it does not allow a ballast grain to come to rest on its upper surface. • Raising the ballast bed between curved top sleepers (Figure 11(d)) makes the cubes more prone to movement, as with conventional sleepers. For the left and right hand cubes, the effect is similar but the centre cube encounters greater unsteady forces owing to the smaller profile of the sleeper cross-section above the ballast bed, which causes less flow separation. Therefore, it is especially important not to over-fill the cribs between curved-top sleepers. • The triangular top sleeper would be at least as effective as the curved top sleeper both in preventing ballast grains from coming to rest on its upper surface and in causing flow separation, hence reducing the aerodynamic forces on cubes representing ballast grains within the crib (Figure 11(e)).
The triangular top sleeper has considerable potential benefit, and would be worth exploring further. It is also worth noting that, while not the main aim, the study has shown the apparent benefit of a rough ballast surface (which might be associated with a larger ballast grain size) in reducing turbulence and hence the potential for ballast flight. The disbenefit is that this would increase train underbody drag, increasing the energy needed to maintain a given train velocity. Hence artificially roughening the ballast bed surface to reduce the propensity for ballast flight was not considered further.
Summary and conclusions
Two- and three-dimensional CFD analyses have been carried out to investigate the effect of ballast roughness, surface level and sleeper shape on the potential for ballast flight below a simplified high speed train, modelled as a moving flat plate. To enable the simulations to run within a reasonable computational time, a number of simplifications had to be made; specifically, the rails, rail fasteners, moving train wheels, bogies and underbody could not be reproduced in detail, and the ballast roughness was applied numerically by means of a roughness height 1. Ballast roughness increases the dissipation rate in the flow near the ground, and decreases the streamwise velocity and the mass flow rate. The greater the roughness height and/or the roughness constant, the lower the mass flow rate. However, provided the ballast bed roughness is modelled, the exact value of 2. For the two-dimensional studies using steady turbulence models, it was sufficient to model a single sleeper block with periodic boundaries: increasing the number of sleepers modelled to two or four made no significant difference to the results in terms of flowrate and normalised velocity profile.
In terms of implications for practice, the results have shown that: 3. Increasing the track bed roughness reduces the aerodynamic loads on individual cubes or ballast grains as it makes the flow more turbulent. The largest sources of surface roughness are the ballast grains and the sleeper blocks, if these are raised above the ballast surface. However, increased underbody turbulence would increase the energy needed to maintain a given train speed, hence artificial roughening of the ballast surface as a useful way of reducing the potential for ballast flight was not considered further. 4. Lowering the ballast bed in the crib between sleepers reduces the forces on cubes or grains on the crib ballast surface, as a result of flow separation initiated at the sleeper corner (in the case of the mono-block sleeper) or top (in the case of a profiled sleeper). 5. Preventing individual ballast grains from coming to rest on the top of the sleeper block is crucially important. The calculated aerodynamic forces were greater on cubes placed here than on cubes placed on the surface of the crib ballast, especially when the crib ballast surface was below the sleeper top. Furthermore, the resistance to sliding is likely to be greater on the crib ballast surface than on the relatively smooth sleeper surface. An idealised analysis has shown that small (< about 20 mm) ballast grains have the potential to become airborne from, and that even quite large grains (< 60 mm) are likely to be blown off, the top of a conventional sleeper at a train speed of 432 km/h. 6. The main benefits of a curved top sleeper are that its profile prevents individual ballast grains from coming to rest on its surface, and that it is intended to be placed proud of the ballast surface. Otherwise, sleepers with sharper edges (“corners”) are more effective than a curved top sleeper in initiating flow separation and reducing aerodynamic loads on cubes or individual grains on the surface of the crib ballast. 7. Placement of the crib ballast at a depth of 40 mm below the top of a conventional sleeper is aerodynamically advantageous, although it must be checked that the sleeper embedment still provides sufficient resistance to lateral movement of the track. 8. A triangular top sleeper would prevent ballast grains from coming to rest on its upper surface, and appears to be at least as if not slightly more effective than a curved top sleeper in reducing aerodynamic loads on individual cubes or grains on the surface of the crib ballast.
Footnotes
Acknowledgements
The authors are grateful to Professor Chris Baker for his helpful comments on an earlier draft of the paper.
Declaration of conflicting interests
The author(s) declared no potential conflicts of interest with respect to the research, authorship, and/or publication of this article.
Funding
The author(s) disclosed receipt of the following financial support for the research, authorship, and/or publication of this article: This research was funded by the Engineering and Physical Sciences Research Council (ESPRC) through grants [EP/G036896] Doctoral Training Centre in Transport and the Environment and [EP/K03765X] Track systems for high speed railways, and High Speed 2 Ltd (HS2).