
Abstract
Currently, the modelling of the railway catenaries for straight tracks is well understood and demonstrated via an accepted number of applications and an international benchmark. However, in the presence of a general track geometry, including curved tracks, challenges still remain. The fundamental difficulty is how to address the catenary layout in the presence of curves for a long railway track in which a large number of catenary sections are defined. To support the catenary design, e.g. in new electrification projects, it is fundamental to identify the track geometry, which is not always accessible to the overhead line engineers. This work purposes a novel approach for track geometry reconstruction using aerial views. The reconstruction methodology is based on the general geometry rules for track design. The track geometry obtained is then used as the reference to define the layout of the catenary. The Network Rail Series 1 overhead equipment is used here and the 3D finite element model of the catenary is built on the curved track geometry. The results of this work demonstrate, not only the advances proposed to study more realistically the pantograph-catenary interaction, but also the need to consider general curved tracks in acceptance and interoperability studies.
Keywords
Introduction
New rail electrification projects raise several challenges to Overhead Contact Line (OCL) engineers as the catenary layout has to accommodate the track singularities, such as level crossings, bridges and tunnels, but also has to deal with the geometry of the track. In general, the nominal track geometry consists of straight and circular segments interconnected by transition curves that ensure the continuity of the first and second derivatives of the track in the transition points. This assemblage guarantees curvature continuity, making the ride smoother for the passengers.1,2 In a curve, the outer rail is raised to tilt the vehicles in order to minimize the lateral accelerations perceived by the passangers and balance the loads on inner and ourter wheels of the train. The difference of heights between the two rails in a horizontal banked curve is called cant. The tracks can also go up and down, e.g., in a mountain3–5 and therefore, have also a vertical grade.6,7 Therefore, the geometry of the track is defined by its curvature, cant and grade. 8
In reality, the geometry of the track is not perfect. Several irregularities9,10 arise on the track layout resulting from: (a) construction imperfections; (b) usage in service; (c) temperature rise, originating the so-called sun kink, and; (d) changes on the track substructure11–13 resulting from, e.g., environmental effects or soil motion. The track irregularities influence the wheel-rail interaction14–16 and are especially important when studying problems associated to the passengers’ ride comfort,17,18 fatigue of the vehicle structural elements and the deterioration of the railway infrastructure. 19 Previous works 20 have demonstrated that the track irregularities have a negligible effect on pantograph-catenary interaction and, therefore, the track imperfections will not be considered in the present work.
The development and application of computational methods capable of simulating the pantograph-catenary interaction is a very active field of research. The pantograph-catenary benchmark21,22 shows how existing, state-of-the-art, numerical tools deal with pantograph-catenary dynamics in straight tracks. However, real railway tracks are not strictly straight, displaying curves with varying radius and, as such, these tools may not be capable of fully represent catenaries that sit on realistic track geometries.
The European standard EN50318:2018 23 specifies functional requirements for the validation of pantograph-OCL tools and simulation methods to ensure compliance with its results. Until recently, this standard only required dynamic analysis to be run on straight catenaries. However, the 2018 release of EN50318 improves on the previous version of the standard, by including an AC stitched catenary installed on a curved track of constant radius. Computational tools wishing to be validated against AC stitched overhead equipment must successfully model and analyze catenaries in curved tracks.
The aim of this work is to propose an advanced methodology to reconstruct realistic railway track geometries using aerial images and design rules available in the literature. This approach is able to identify the curvature and cant characteristics of the track, as well as the necessary OCL parameters needed to correctly build catenary models in curved track, such as the stagger. Once the realistic track geometry is defined, then the 3D catenary model is built using the track layout as reference and the other OCL parameters identified on the aerial images. To demonstrate the methodology proposed here, an application example is presented consisting of a complete catenary model, with a number of sections, that is built on the top of a realistic track.
Overview of the computational tool PantoCat
One of the tools presented in the pantograph-OCL benchmark21,22 is PantoCat, 24 which is the pantograph-catenary dynamic interaction analysis program used here to build the 3D catenary models that sit on tracks with realistic geometries. PantoCat is able to analyse, in realistic operation conditions, models of complete overhead energy collecting systems that include all mechanical details of the pantograph components and the complete topology and structural elements of the catenary.24–27 The development of a pantograph-catenary dynamic analysis tool is a multidisciplinary exercise and PantoCat uses the Finite Element (FE) methodology 28 to study the catenary 29 and the multibody formulation 30 to represent the pantograph.31–34 These methodologies are integrated via an efficient co-simulation procedure,35–37 where a contact model based on a penalty formulation is used to represent the pantograph-catenary interaction.24,38 PantoCat is extensively used in research and consultancy projects for the rail industry, being certified by a notified body to the EN50318:2018 23 for all catenary types and validated against field data in several countries.
PantoCat is a fully 3D tool, enabling to model rigid and flexible catenaries with multiple sections, their overlaps 39 and gradients, the operation of multiple pantographs40–42 and consider complex loads on the components, including aerodynamic effects.20,43 A bespoke geometry pre-processor is able the spatially define the position of all FE nodes and elements of the catenary model according to track data, such as curvature, cant and grade, and also includes the OCL geometric data. This feature enables to perform the dynamic studies in tangent or curved tracks 44 with or without irregularities and perturbations. 45
Catenary modelling on straight tracks
In their simplest form, catenaries are composed by two cables, the messenger and contact wires, tensioned at the supports in the beginning and end of each section, also known as wire runs. These wires are periodically mounted on poles, and supported at each one by cantilevers. The distance between two poles is called a span. The contact wire is supported from above, via a steady arm, to ensure that there is enough clearance for the pantograph to pass safely, but also to provide the necessary stagger. In between poles, the contact wire is supported by the messenger wire via dropper cables, which allow to control the sagging and elasticity of the contact wire. 46 Due to technical limitations, such as weight, costs and ease of maintenance, sections have a finite length, usually no longer than 1500 m. To ensure contact continuity, some of the terminal spans of a section and initial spans of the following section are placed alongside each other, in what is commonly referred to as an overlapping zone.
The messenger and contact wire deflect between poles, as a consequence of their weight. They are tensioned at the beginning and end of a section to ensure the correct geometry of the catenary and proper operating conditions. One particularity of pantograph-catenary interaction is the elastic wave, which is the propagation of an upwards deflection of the contact wire position, caused by the pantograph running on it. When train speeds approach the wave propagation speed of the contact wire, also called critical velocity, the amplitude of catenary oscillations increases and contact quality is greatly reduced. Applying high axial forces (tension) on the wires, allows for higher wave propagation speeds. To ensure proper contact quality, trains speeds should not exceed 70% of the critical velocity. 47
To avoid excessive friction, heat and grooving of the pantograph contact strip, the contact wire is laterally displaced so that it sweeps a larger area of its contact strip and distributes wear. This lateral offset is commonly known as stagger. Stagger is imposed by a steady arm, at each pole, and its design takes into consideration the contact strip useable length, track geometry, operational requirements and weather-specific tolerances, imposed not only by infrastructure managers, but also by the applicable standards. Generally, stagger design is done in such a way that it allows for the longest span length possible, thus reducing the number of poles and, consequently, the catenary construction costs.
The catenary is represented here via a linear FE model, which is well suited for the small rotations and deformations characteristic of the dynamic behaviour of these overhead systems. In order to build the OCL model accurately, the following parameters must be known: • Number of spans and their length; • Dropper length and spacing for all spans; • Contact and messenger wires height and stagger at each support; • Material properties for all wires and steady arms, namely cross section, linear mass, Young’s modulus, tension (if applicable); • Mass of all wire clamps; • Stiffness and damping characteristics of all catenary elements.
22
Catenary modelling on curved tracks
Modelling catenaries on curved tracks requires: (i) all the data detailed before for straight tracks; (ii) the information about the track geometry, and; (iii) the wire stagger arrangement in the curves. The track geometry, in nominal conditions, is fully characterized by three parameters, which are defined as function of the track length, namely: curvature, cant and grade. Based on this information, it is possible to build the spatial layout of the track and, using the correct design rules, to realistically define the 3D model of the catenary. However, the track geometric parameters are not always accessible to the overhead line engineers. In the following, a methodology to obtain, via geometric reconstruction, the track layout is presented. Then, the realistic catenary model can be built based on that track geometry.
Track geometry reconstruction
The track geometry is property of the infrastructure managers who reserve the right of its release, and is usually unavailable to the public. Therefore, a geometric reconstruction process based on available aerial images is envisaged here to define the track layout. The limitation is that the track grade profile cannot be obtained from the aerial images and, therefore, the catenary model is built on a planar track. Nevertheless, as the contact wire heights are measured as nominal values from the top of the rails, the effect of this limitation on the accuracy of the pantograph-catenary dynamics should be negligible.
The reconstruction process of the track geometry developed here follows some basic steps: • Identify on aerial images, obtained via Google Maps or equivalent, the area of interest; • Identify, in the image, the • Scale the track discretized geometry from screen coordinates • Fit the discretized geometry with straights, constant radius curves and transition curves to define the track curvature versus track length information; • Based on the train service speed, compute the cant of the track along its length.
Aerial identification of railway tracks
A section of track between Bristol Parkway and Old Sodbury in the Great Western Mainline (GWML), UK, is used to demonstrate the methodology developed in this work. This section includes several curves, bridges and overpasses, and it is known by the infrastructure manager as being one of the stretches that has more demanding design requirements. The track section has approximately 6 km long and the aerial images are obtained using Google Maps.
Based on the image data, which has a dimension of approximately 20,000 x 4600 pixels, points along the track centreline are selected, with a separation of approximately 100 pixels, being their coordinates recorded. The aerial images with the identified points superimposed are depicted in Figure 1. The position of the points along the track centreline, depicted in Figure 1, is expressed in screen (pixel) coordinates. The coordinates must be scaled to global Aerial images for selected track with superimposed selected points.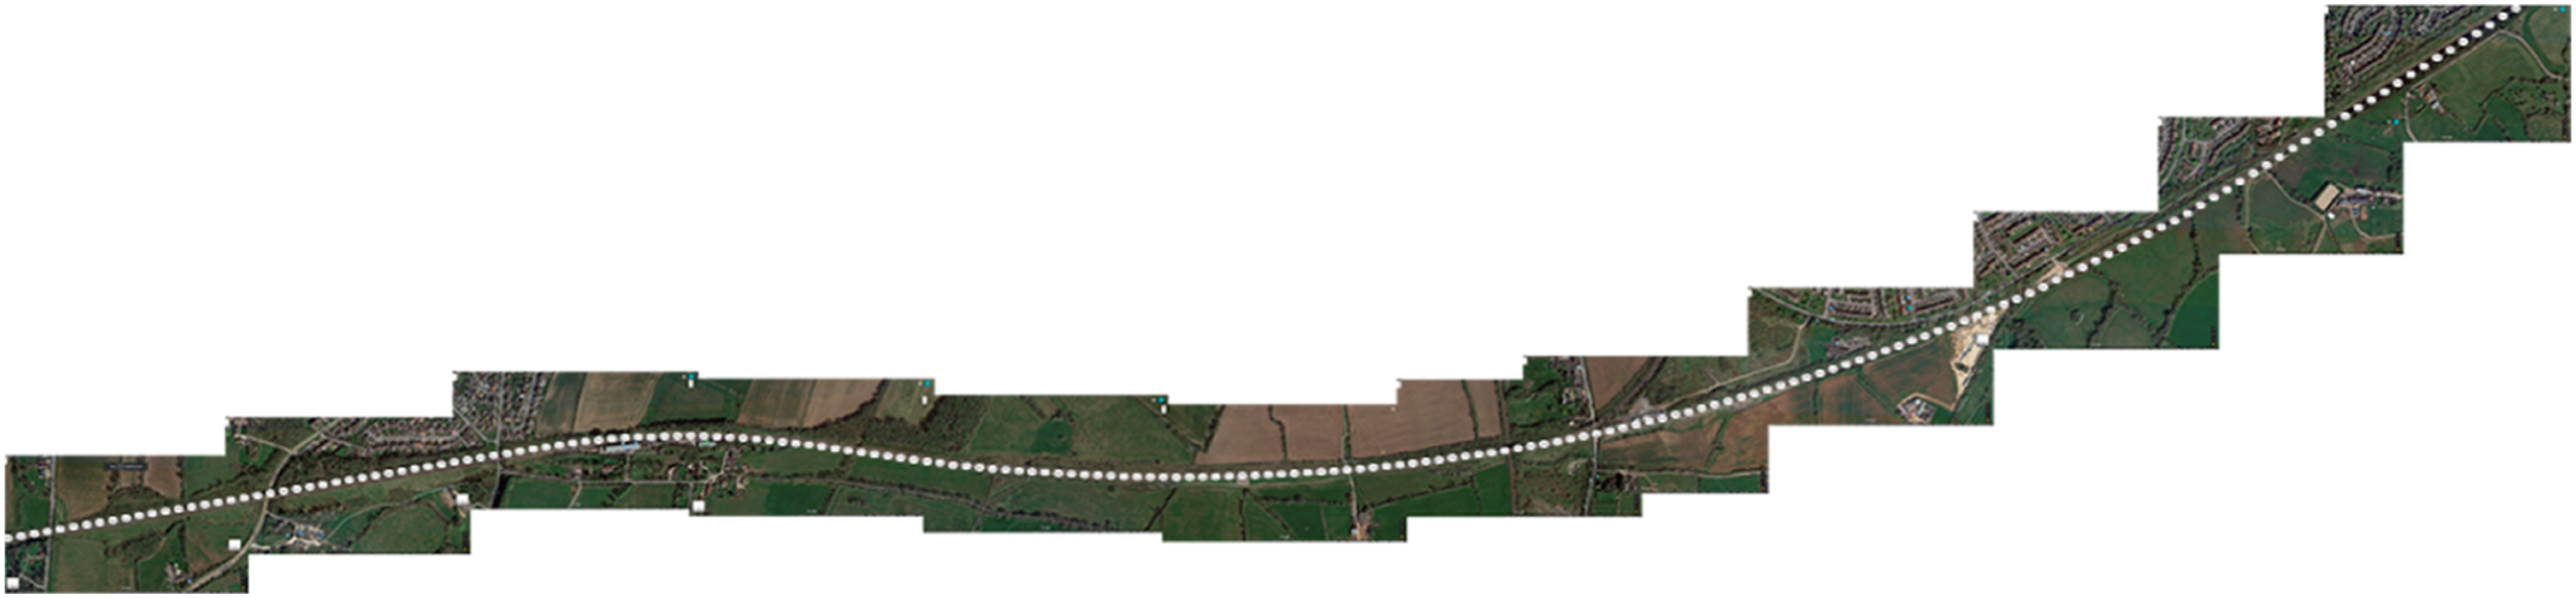
Definition of track geometry along the track length
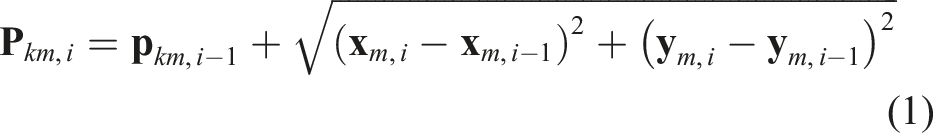
The track geometry is, in general, defined by the curvature, cant and grade as function of the track length, generally referred to as kilometric point. It represents the linear distance between the track starting point and a given point along the rails, using the coordinates obtained previously. The track length up to any point is the sum of the travel length until the previous point, plus the distance between the previous point and the current one. Therefore, the kilometric distance of point
Track geometries can be divided in three zones: straights, curves with constant radius, also known as circular curves, and transition curves. Transition curves are zones between a straight and a circular curve, where the track curvature and cant increase linearly to allow for a smooth transition between the curves and straights. These transition zones are curves of increasing or decreasing radius, also known as clothoides, and can be approximated as cubic parabolas.
Reconstructing the track geometry requires information about which parts of the track are straight, circular curves and transitions. To find out the straight zones, a linear regression is applied to the coordinates of the points selected. The coefficient of determination of this regression,
Through an iterative process, the coefficient of regression is computed for an increasing number of selected points. If the points lead to a regression coefficient
Between two straights, there is a circular curve and two transition curves of equal length. The total length of the curved zone is known, by imposition of the limits of the straight zones. However, the radius of the circular curves and the length of the transition curves is not known. The complete curved zone is approximated to a single circular curve and, using methods of circle fitting,
48
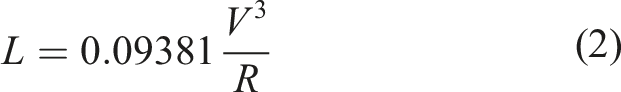
an estimation for the radius of the entire curved zone is found. The estimated radius is then used to compute the length of transition curves required to meet the design rules. The transition length is defined in the track design handbook
49
as
Verification of the track geometry reconstruction
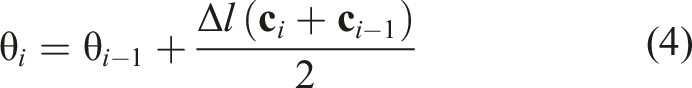
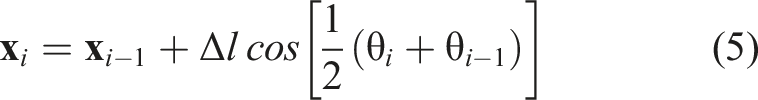
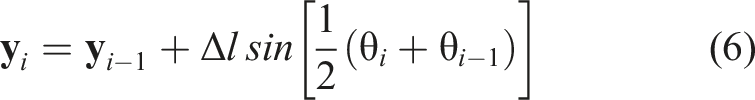
To ensure that the curvature profile is computed correctly and that it accurately represents the coordinates of the points taken from the aerial images, the track, in terms of XY coordinates, is reconstructed from the estimated curvature profile. A method for this reconstruction is described in the literature.
50
The reconstructed
Reconstruction of track cant
The track cant in curves is defined by four main parameters: • Theoretical cant • Applied cant • Cant deficiency • Rate of change of cant
The cant geometry design rules state that, under desirable conditions of
Summary of the track geometry reconstruction
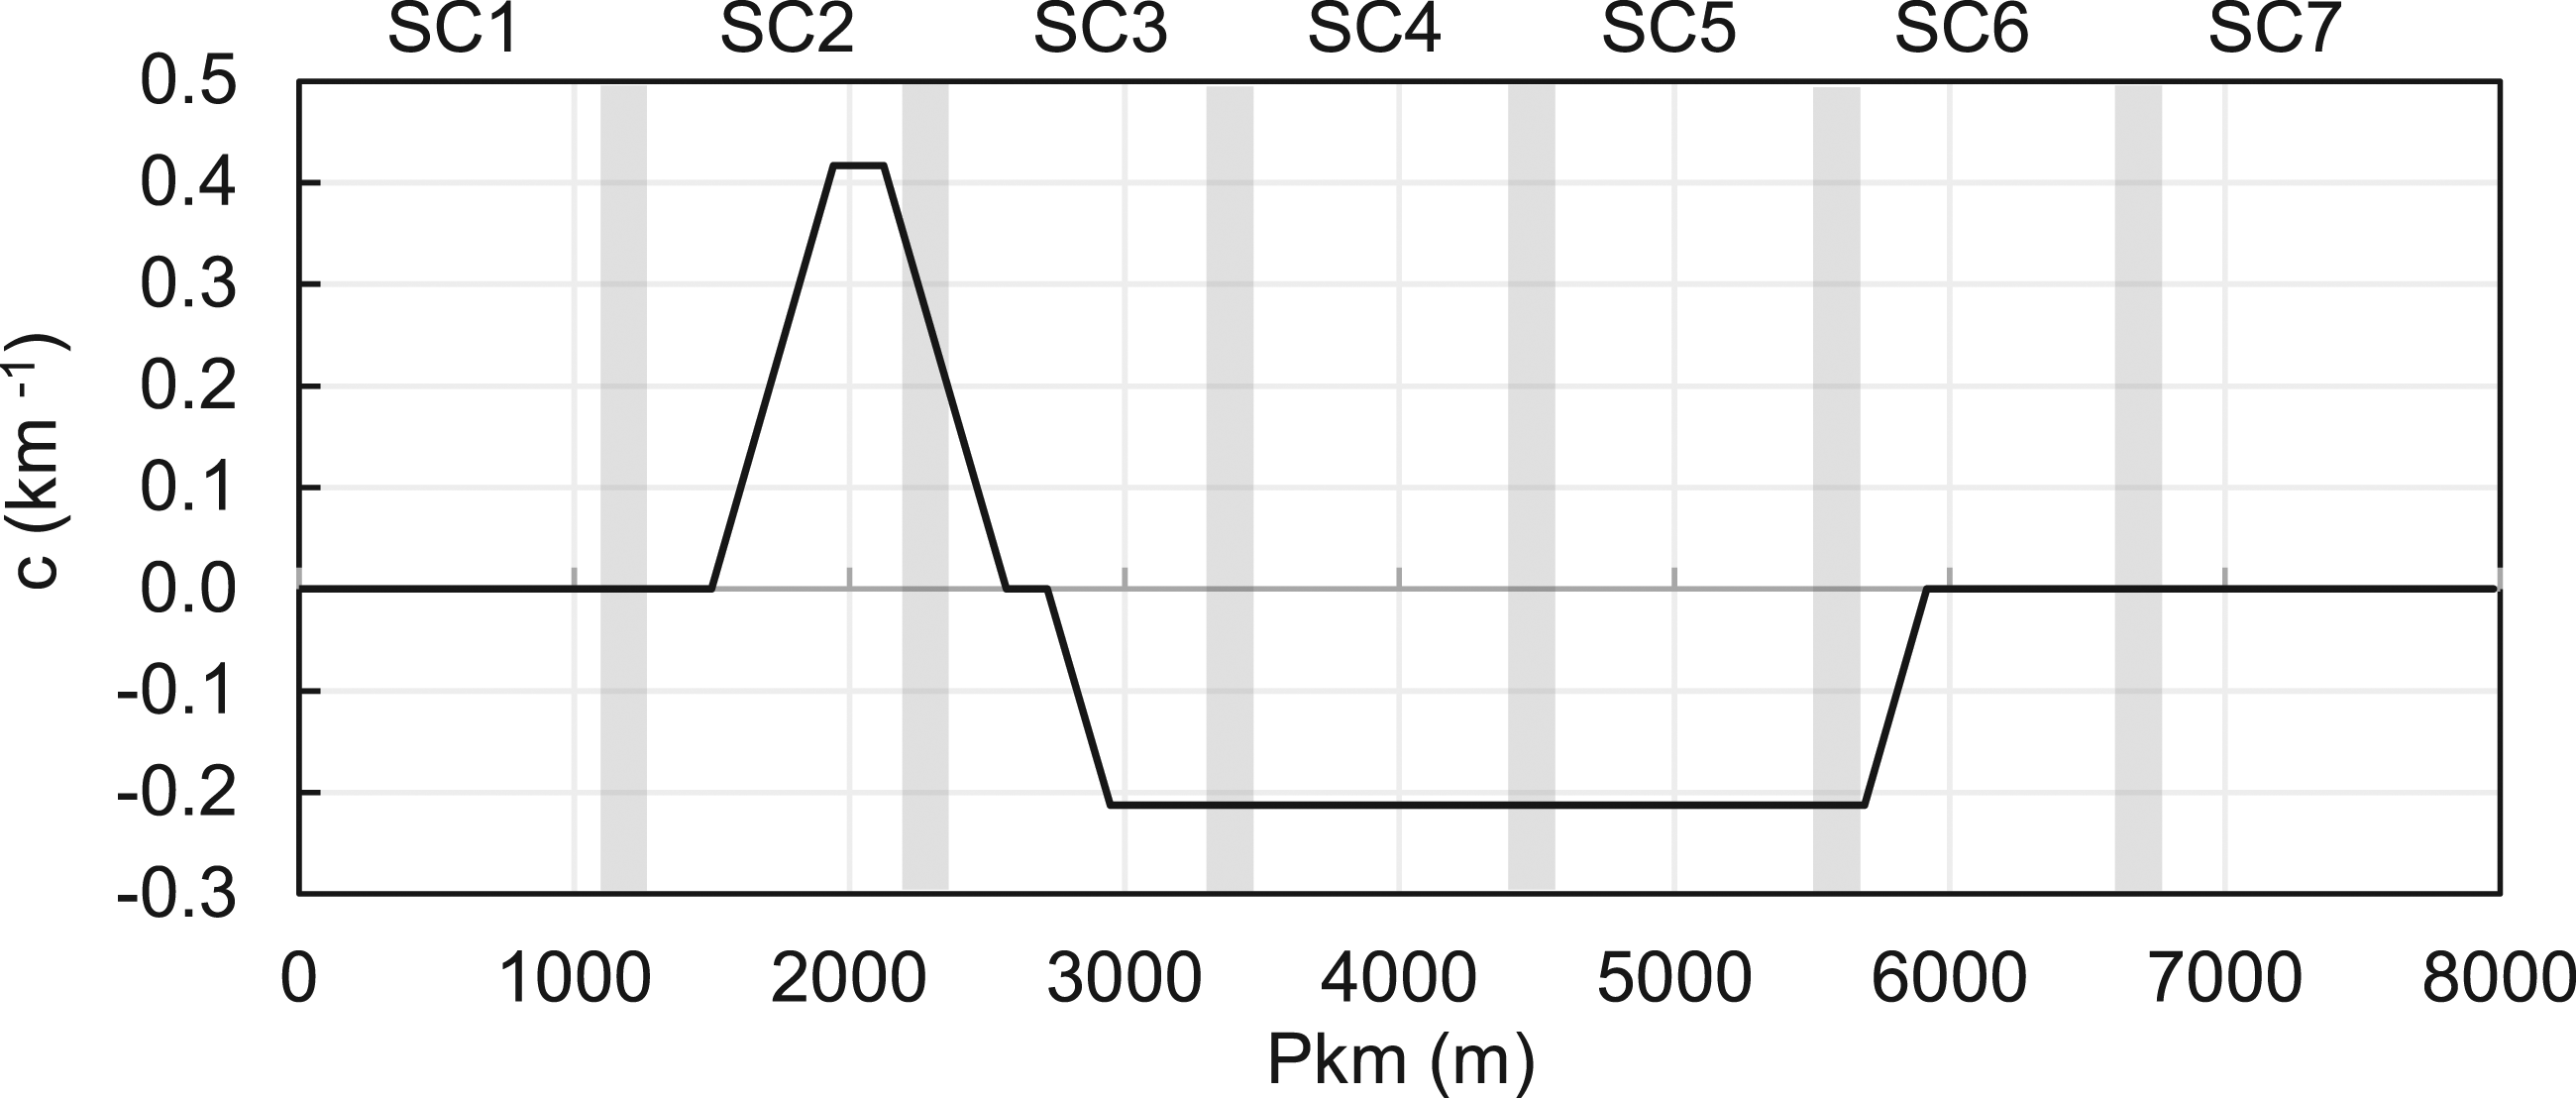
The objective of this work is to reconstruct a realistic track geometry and build a catenary model based on representative track geometry. In order to provide a complete model for the dynamic analyses, a section of straight track is added before and after the realistic geometry obtained. The full track geometry and the track length covered by each catenary section are depicted in Figure 2, where the greyed areas represent the OCL overlapping zones. The catenary sections are defined as follows: • Section 1 (SC1), straight track; • Sections 2 and 3, curvature changes; • Sections 4 and 5, circular curve; • Section 6, curvature changes; • Section 7, straight track. Reconstructed track geometry and overall section arrangement.
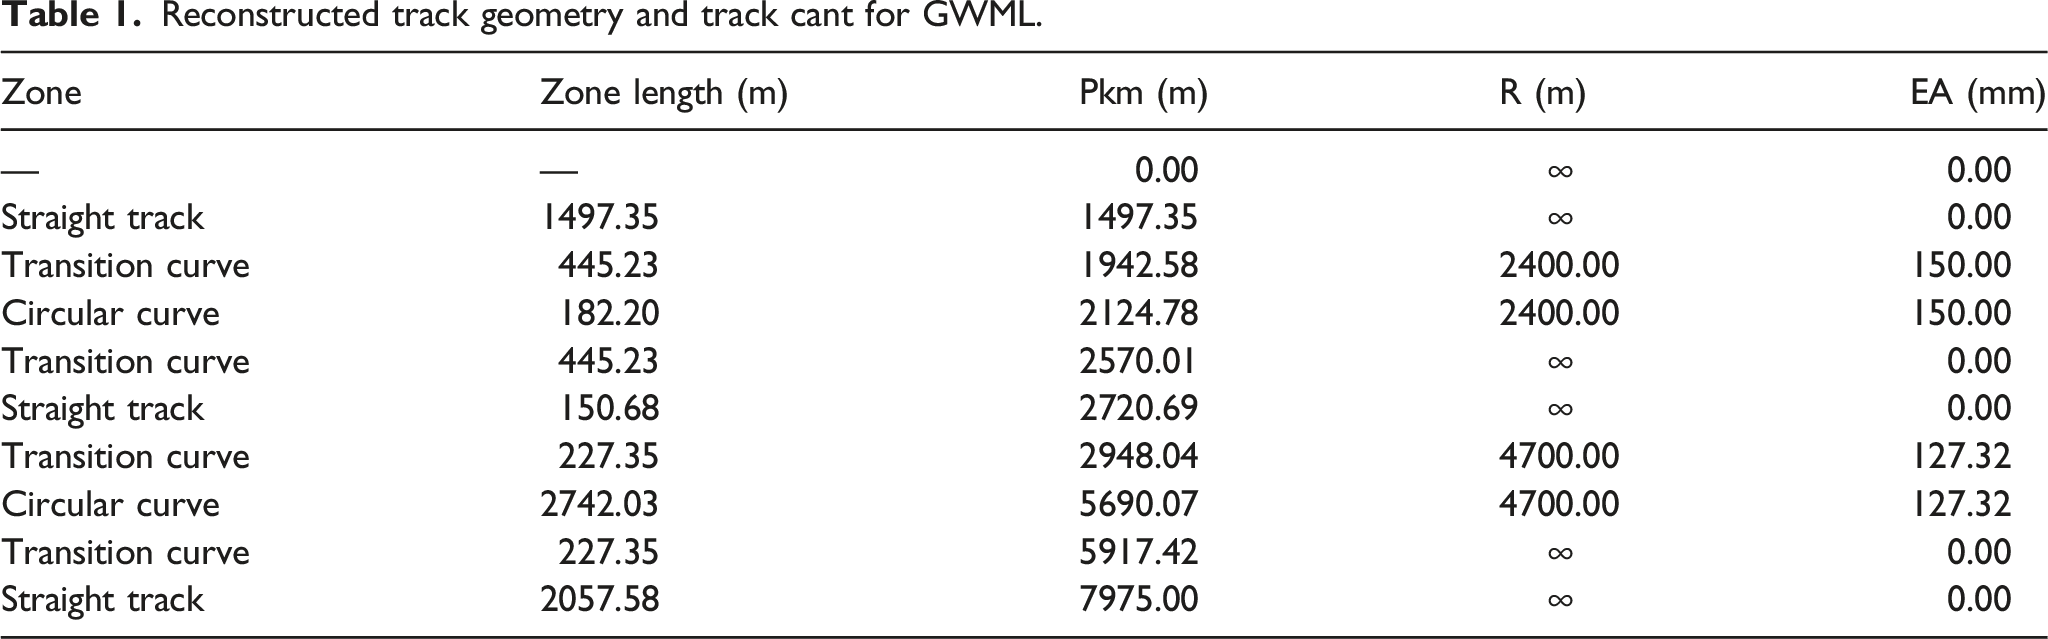
Reconstructed track geometry and track cant for GWML.
Stagger in curves
The stagger in the contact wire is designed, among other reasons, to ensure wear is distributed through the entire pantograph contact strip and avoid grooving. In a straight track the stagger usually takes the form of Contact wire stagger: (a) straight track; (b) large radius curves; (c) low radius curves.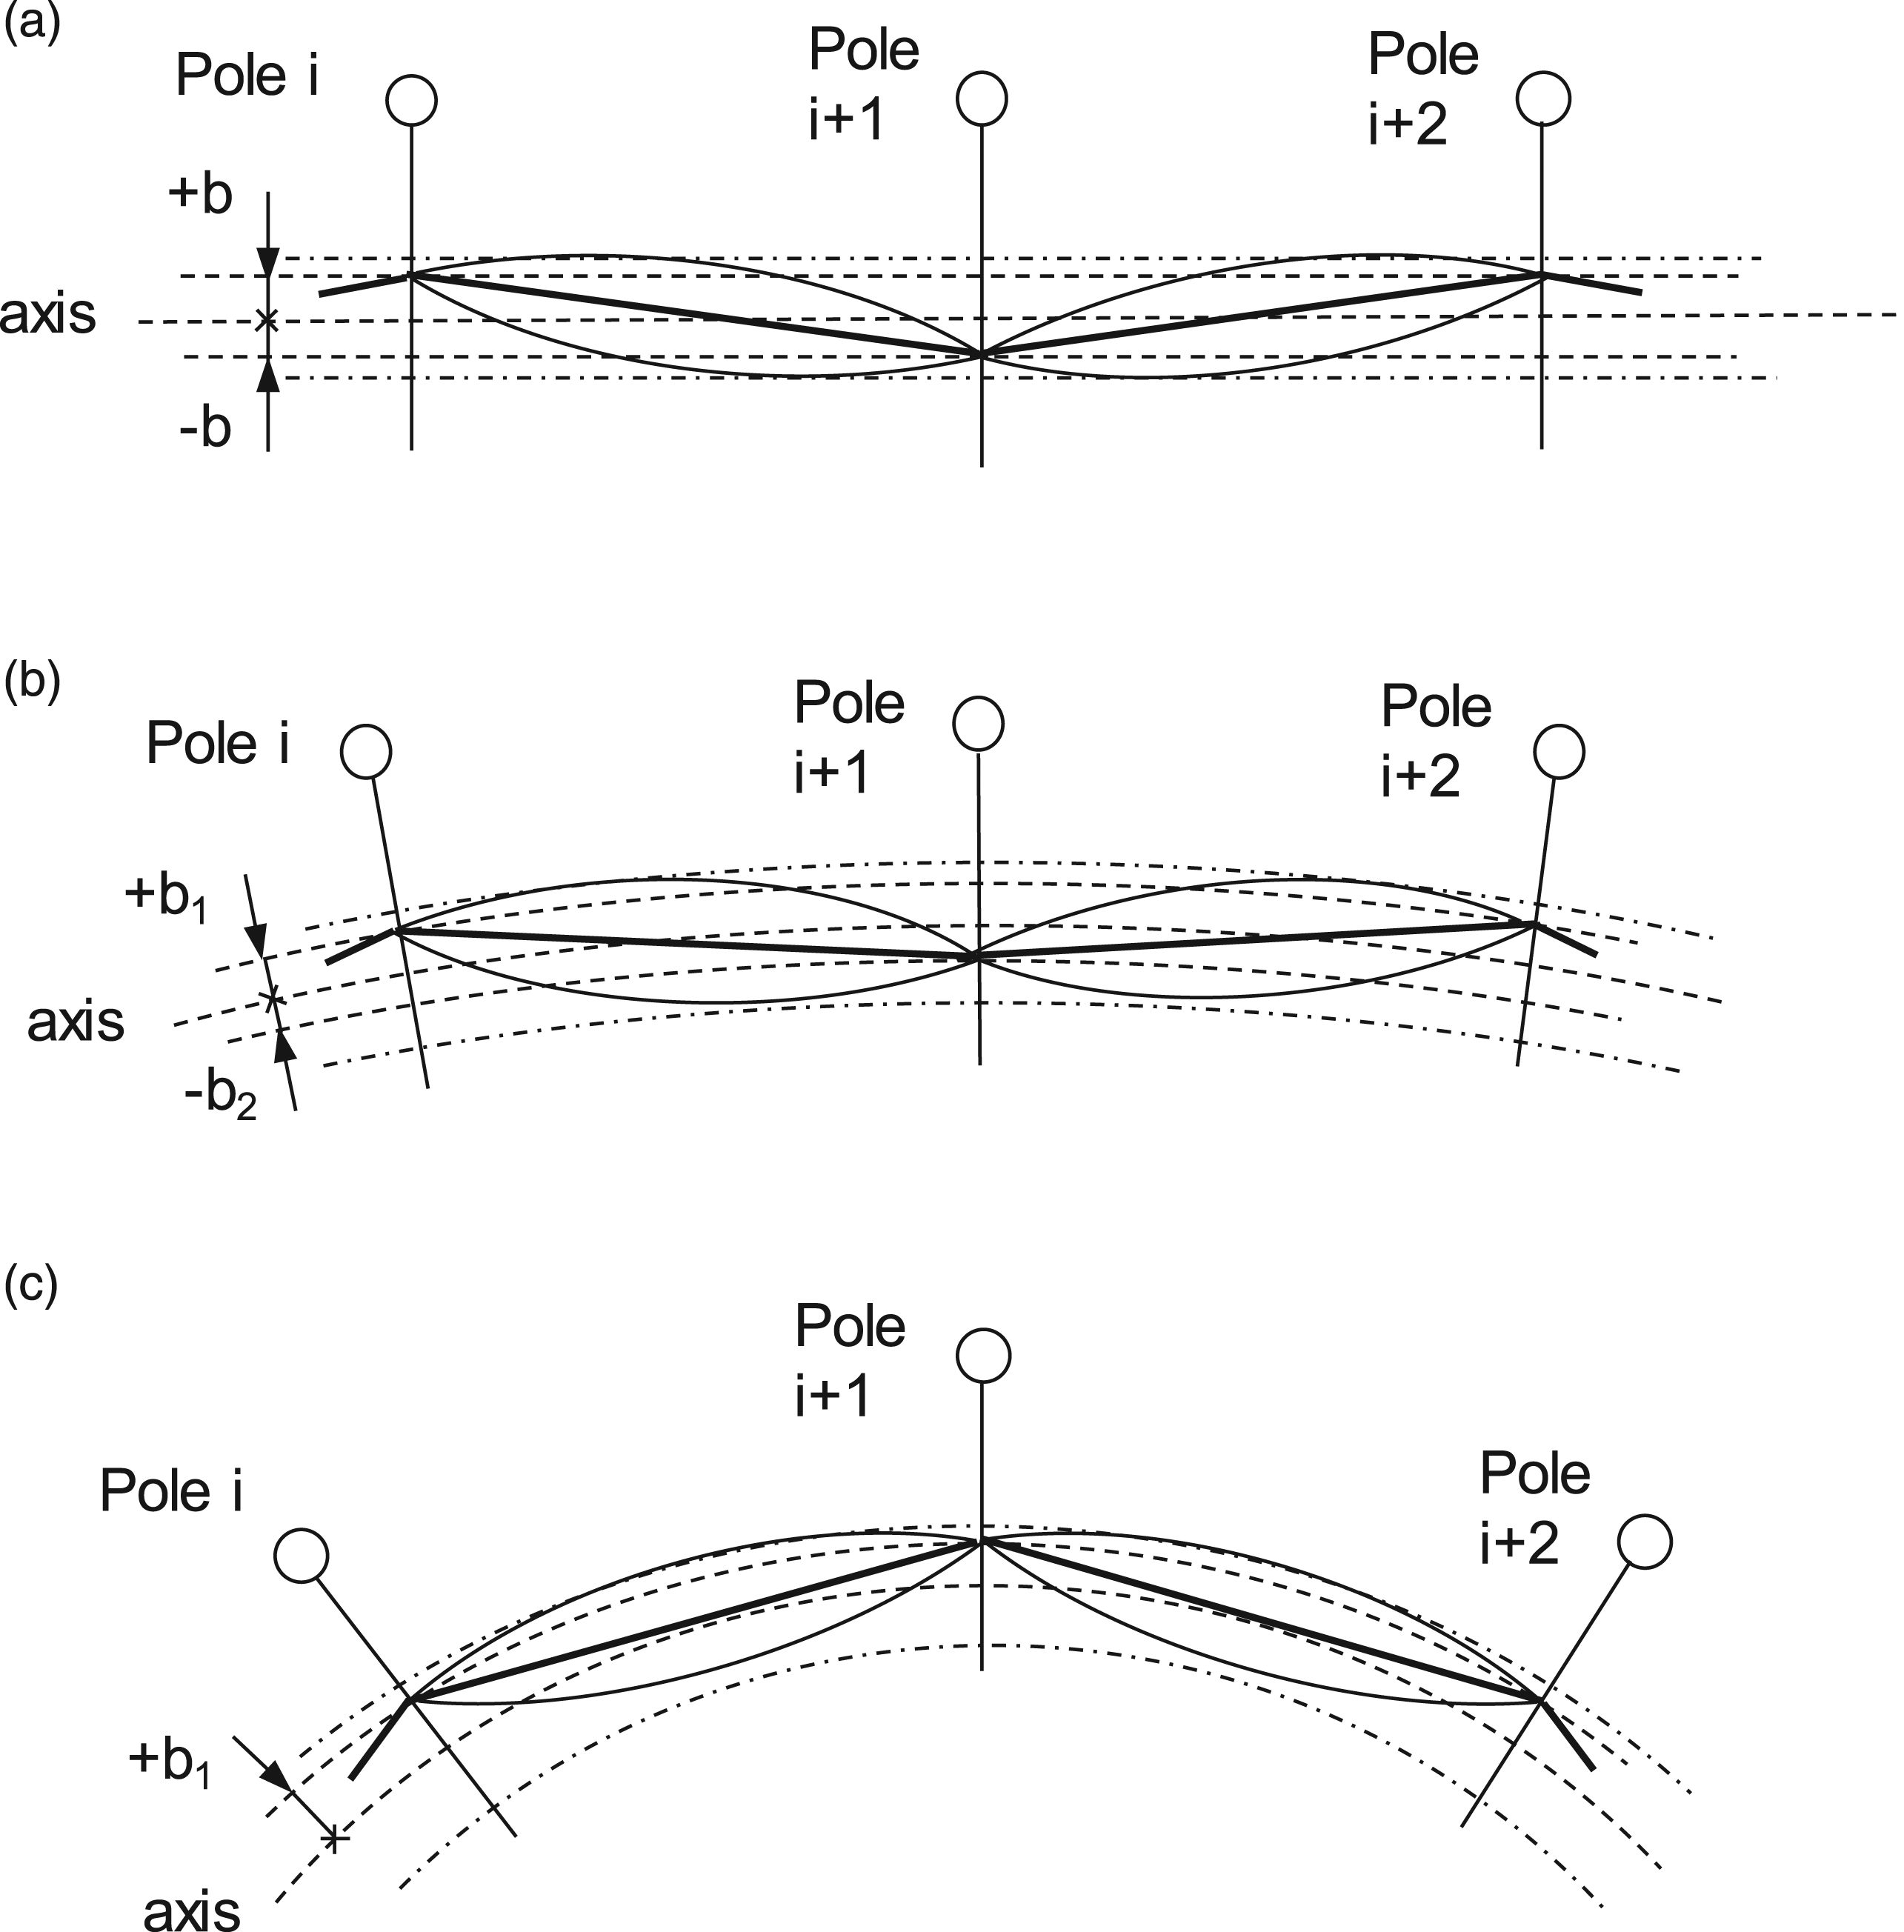
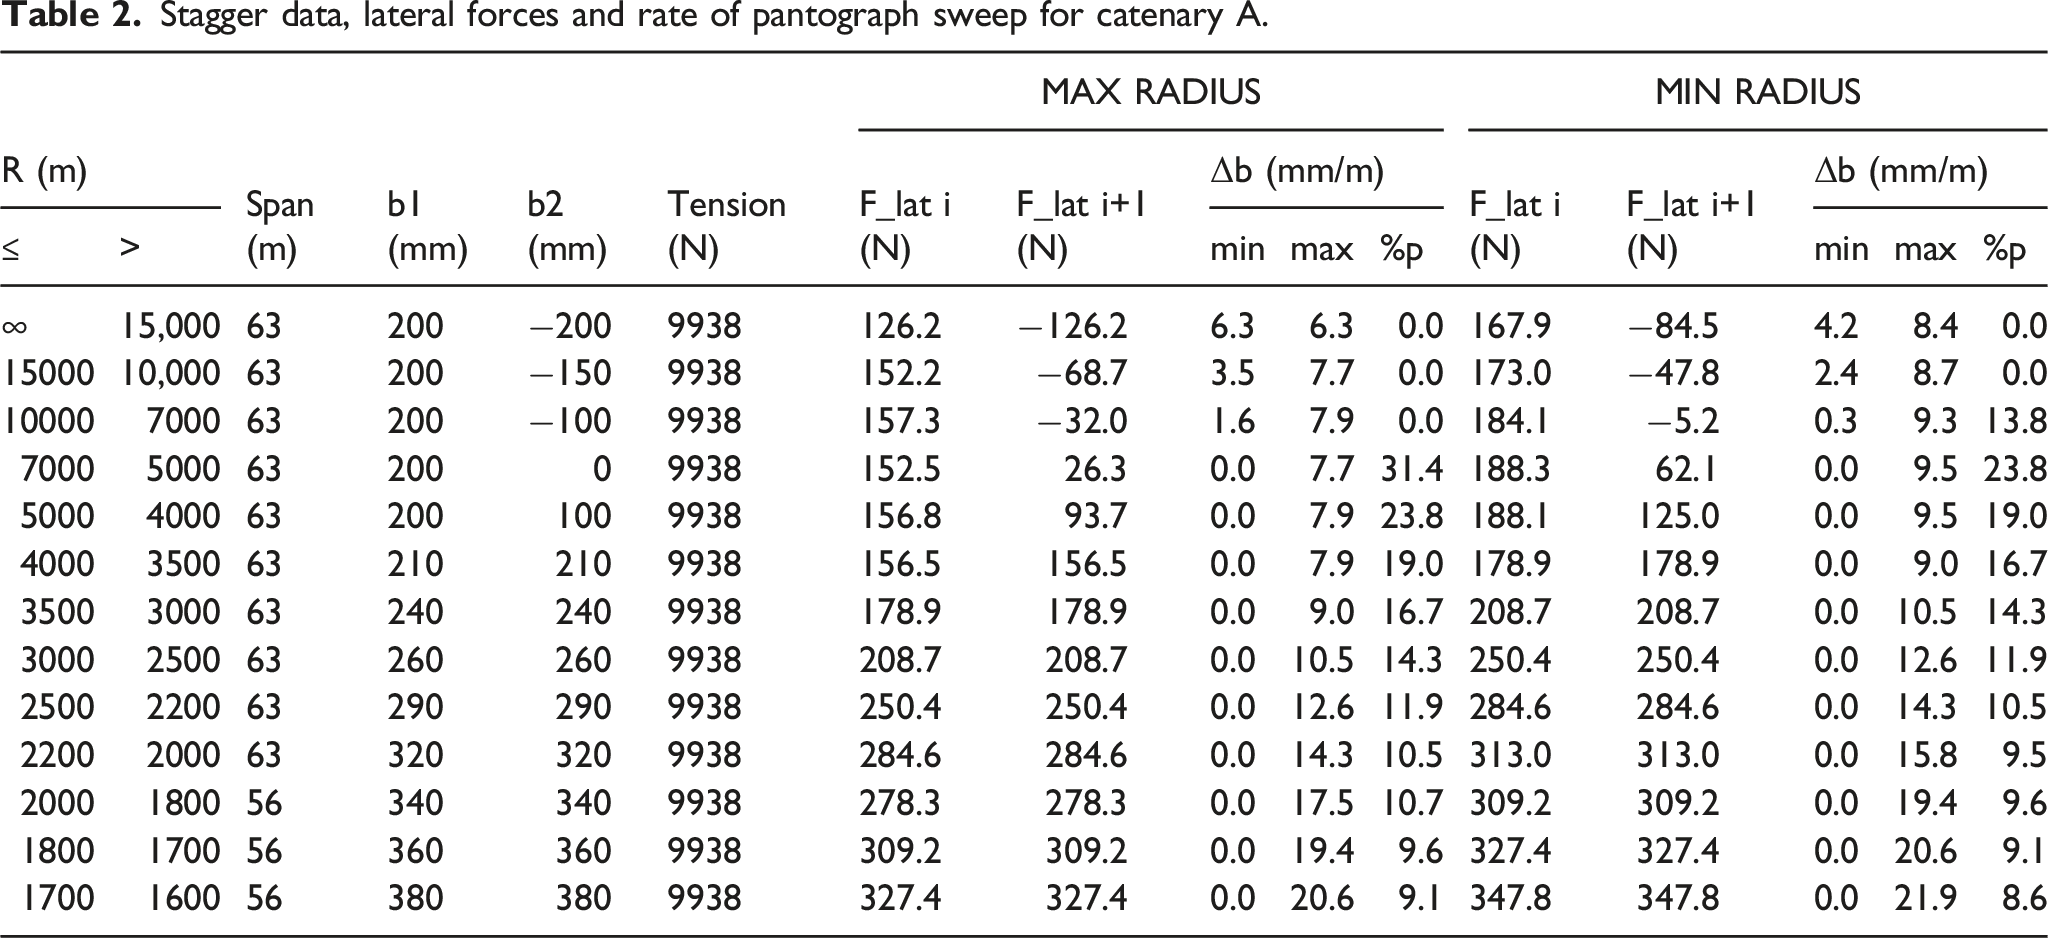
Stagger data for catenaries is usually expressed in the form of stagger tables, defined as a function of the curve radius.
52
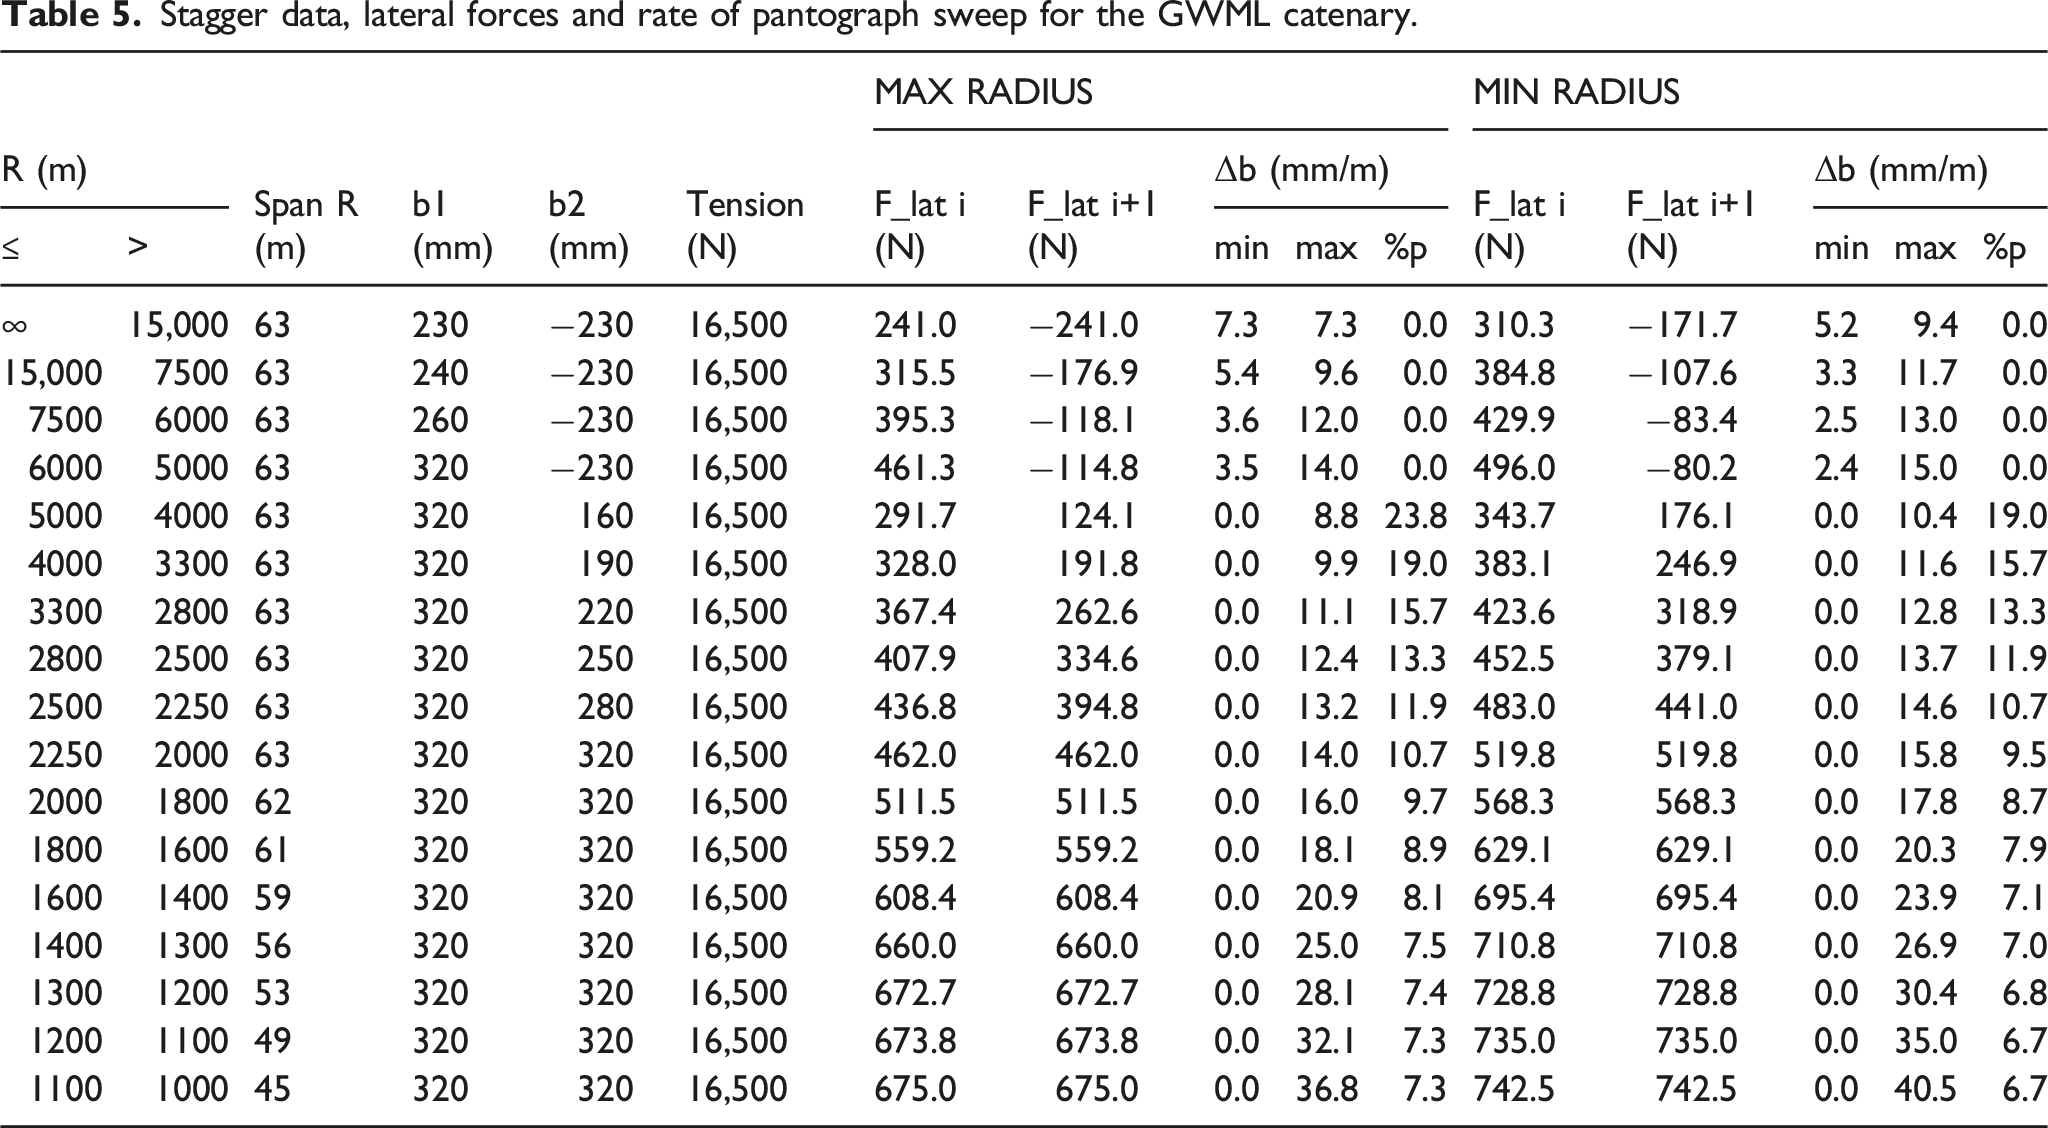
The stagger data for curved track for the GWML catenary is not known and, therefore, the design rules available and the best engineering judgment is used to build a stagger table for this catenary. When designing overhead contact lines, the rules for the stagger • Span length as long as possible; • Contact wire sweep • Contact wire sweep • Lateral (radial) force at the supports 80 N < • Difference of lateral forces at adjacent supports as low as possible.
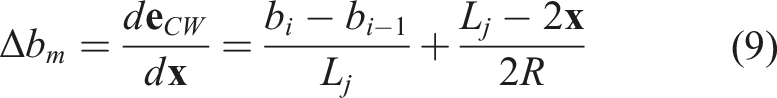
The contact wire sweep of the pantograph, due to the lateral movement of the contact wire, can be defined as the derivative of contact wire position in relation to the track centreline. The contact wire position in mm, for span 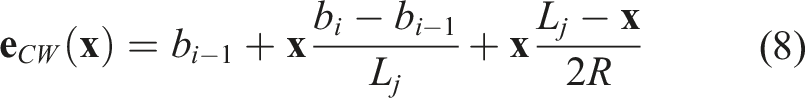
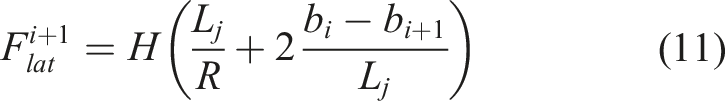
The lateral forces in the steady arm at poles 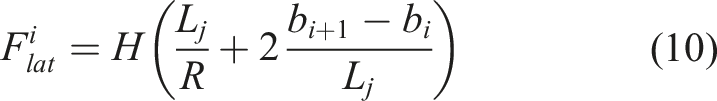
The sweep, • The absolute value of lateral forces increases with curvature. For R ≥1000 m, the maximum force does not exceed three times the lateral force under straight track conditions; • For • Stagger • As curvature increases, stagger • Span length is reduced only when • Problematic span lengths (where Stagger data, lateral forces and rate of pantograph sweep for catenary A. Stagger data, lateral forces and rate of pantograph sweep for catenary B. Stagger data, lateral forces and rate of pantograph sweep for catenary C.
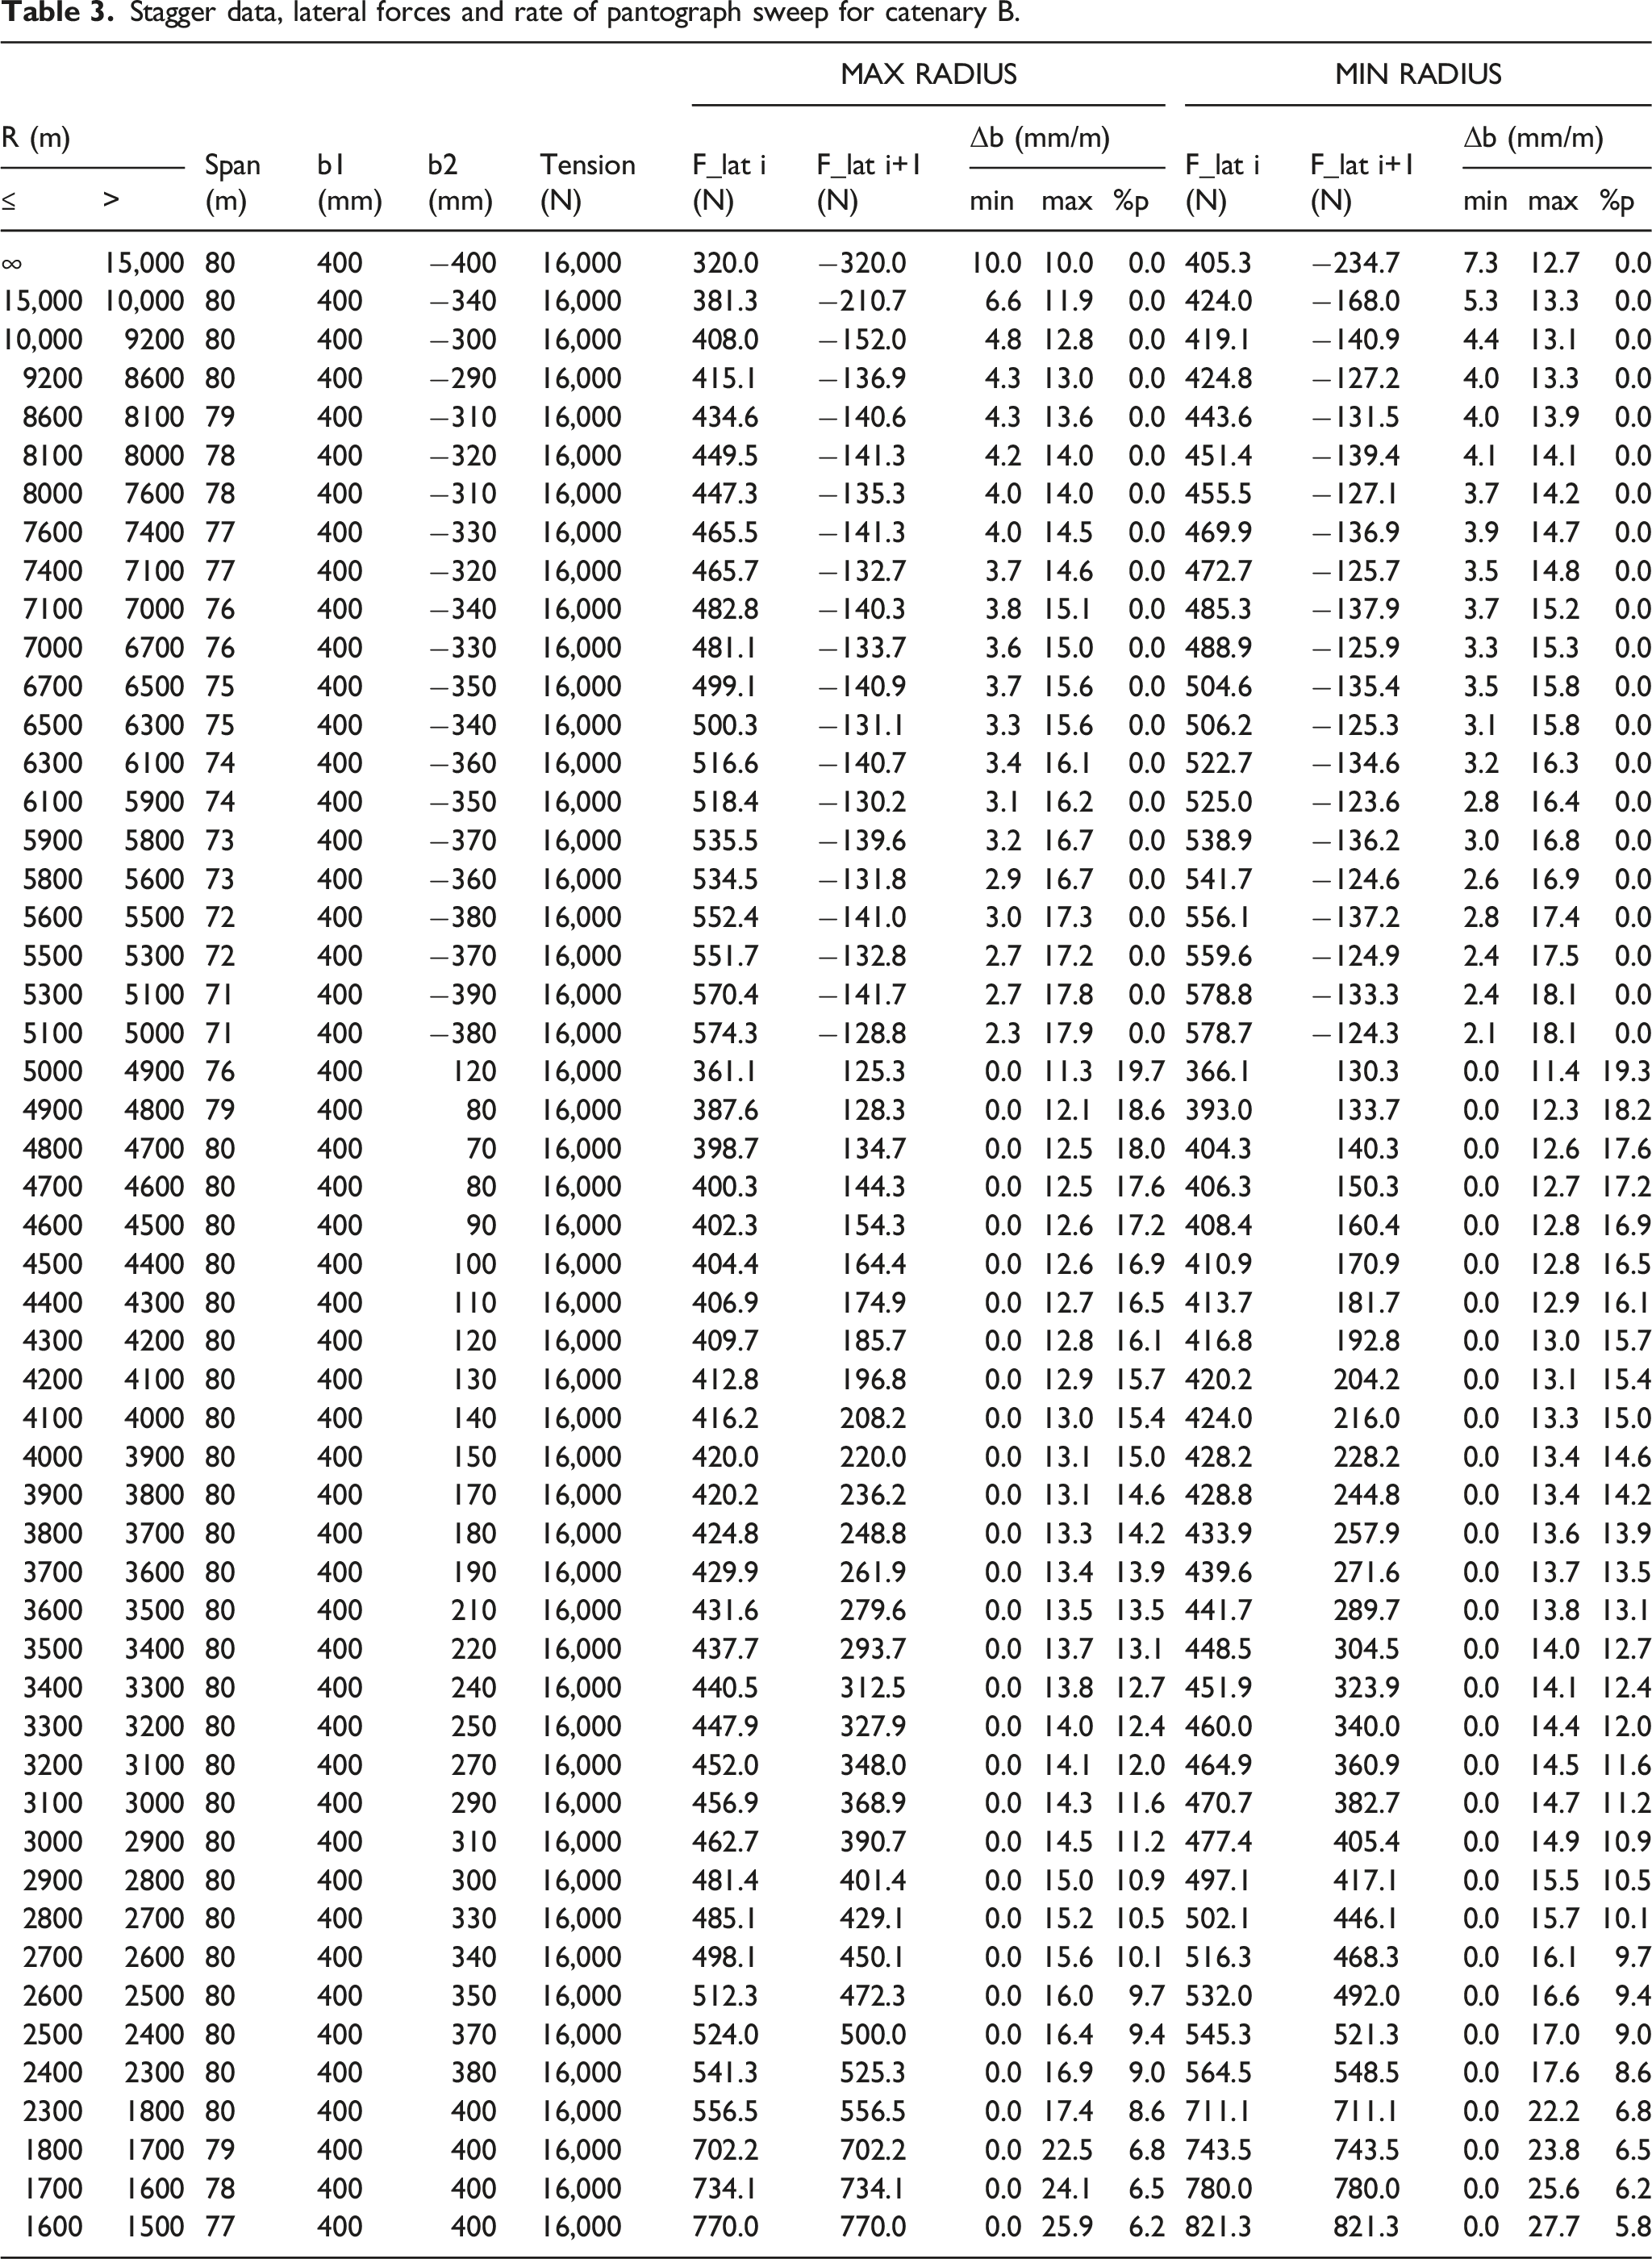
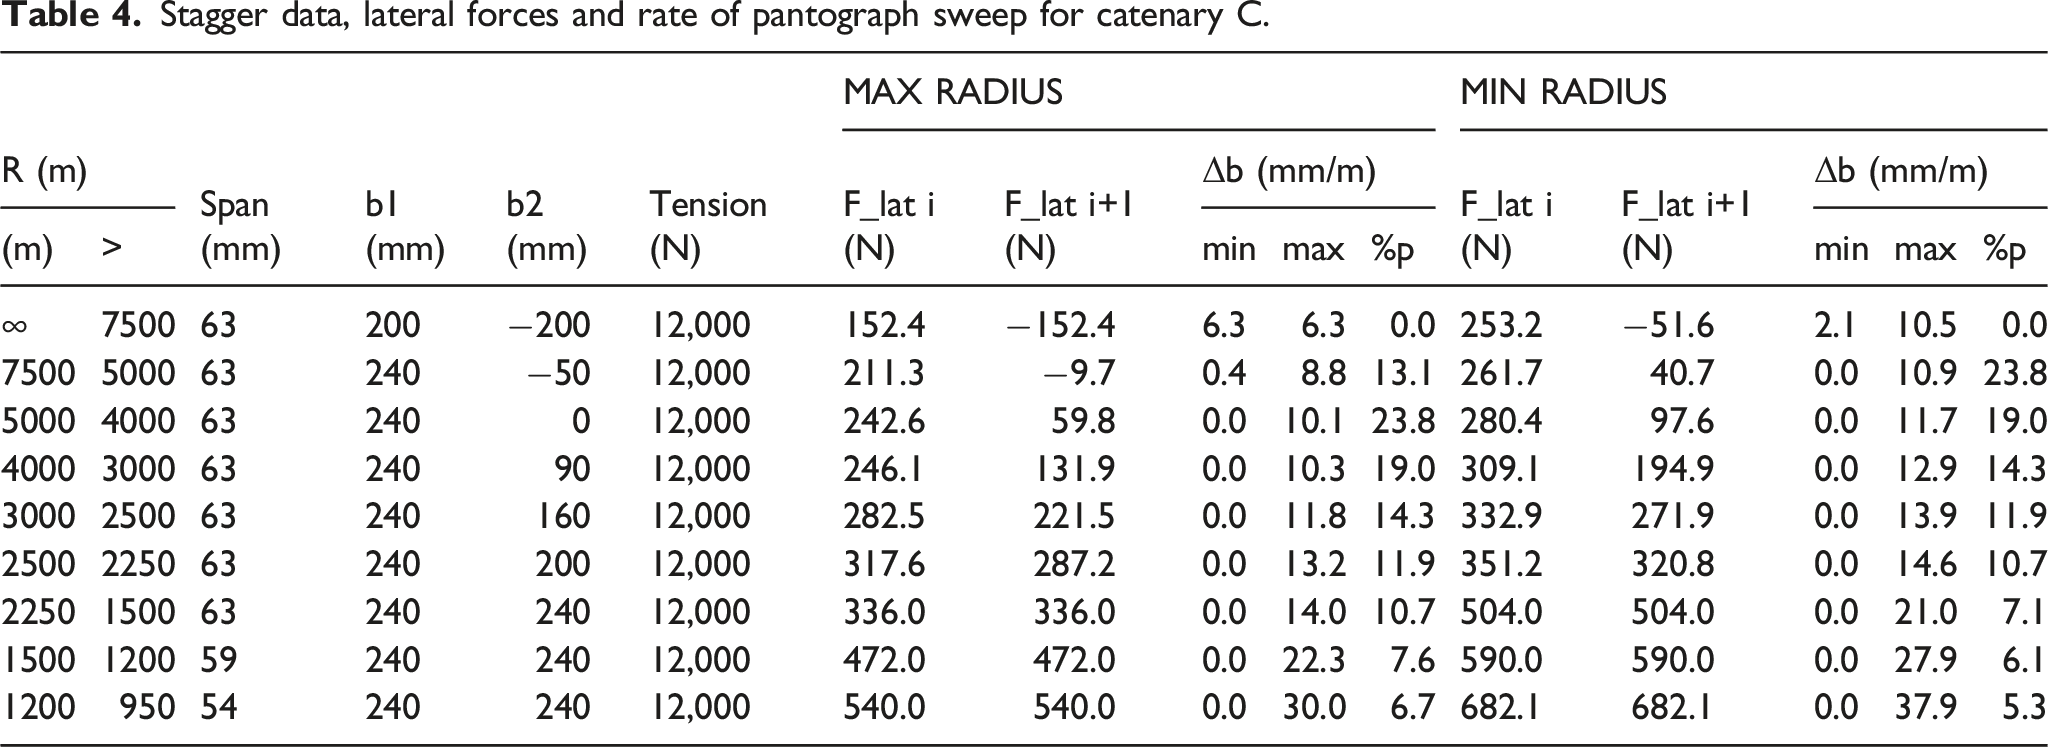
Stagger data, lateral forces and rate of pantograph sweep for the GWML catenary.
Finite element model of the catenary on curved track
The Series 1 overhead system data and the reconstructed GWML geometry, summarized in Table 1 and Table 5, are used to create the necessary input files to generate the catenary model in the computational tool PantoCat. The finite element mesh for the 3D catenary model is depicted in Figures 4 and 5 from different perspective views. Catenary FE mesh, isometric view. Catenary FE mesh, side view of overlap.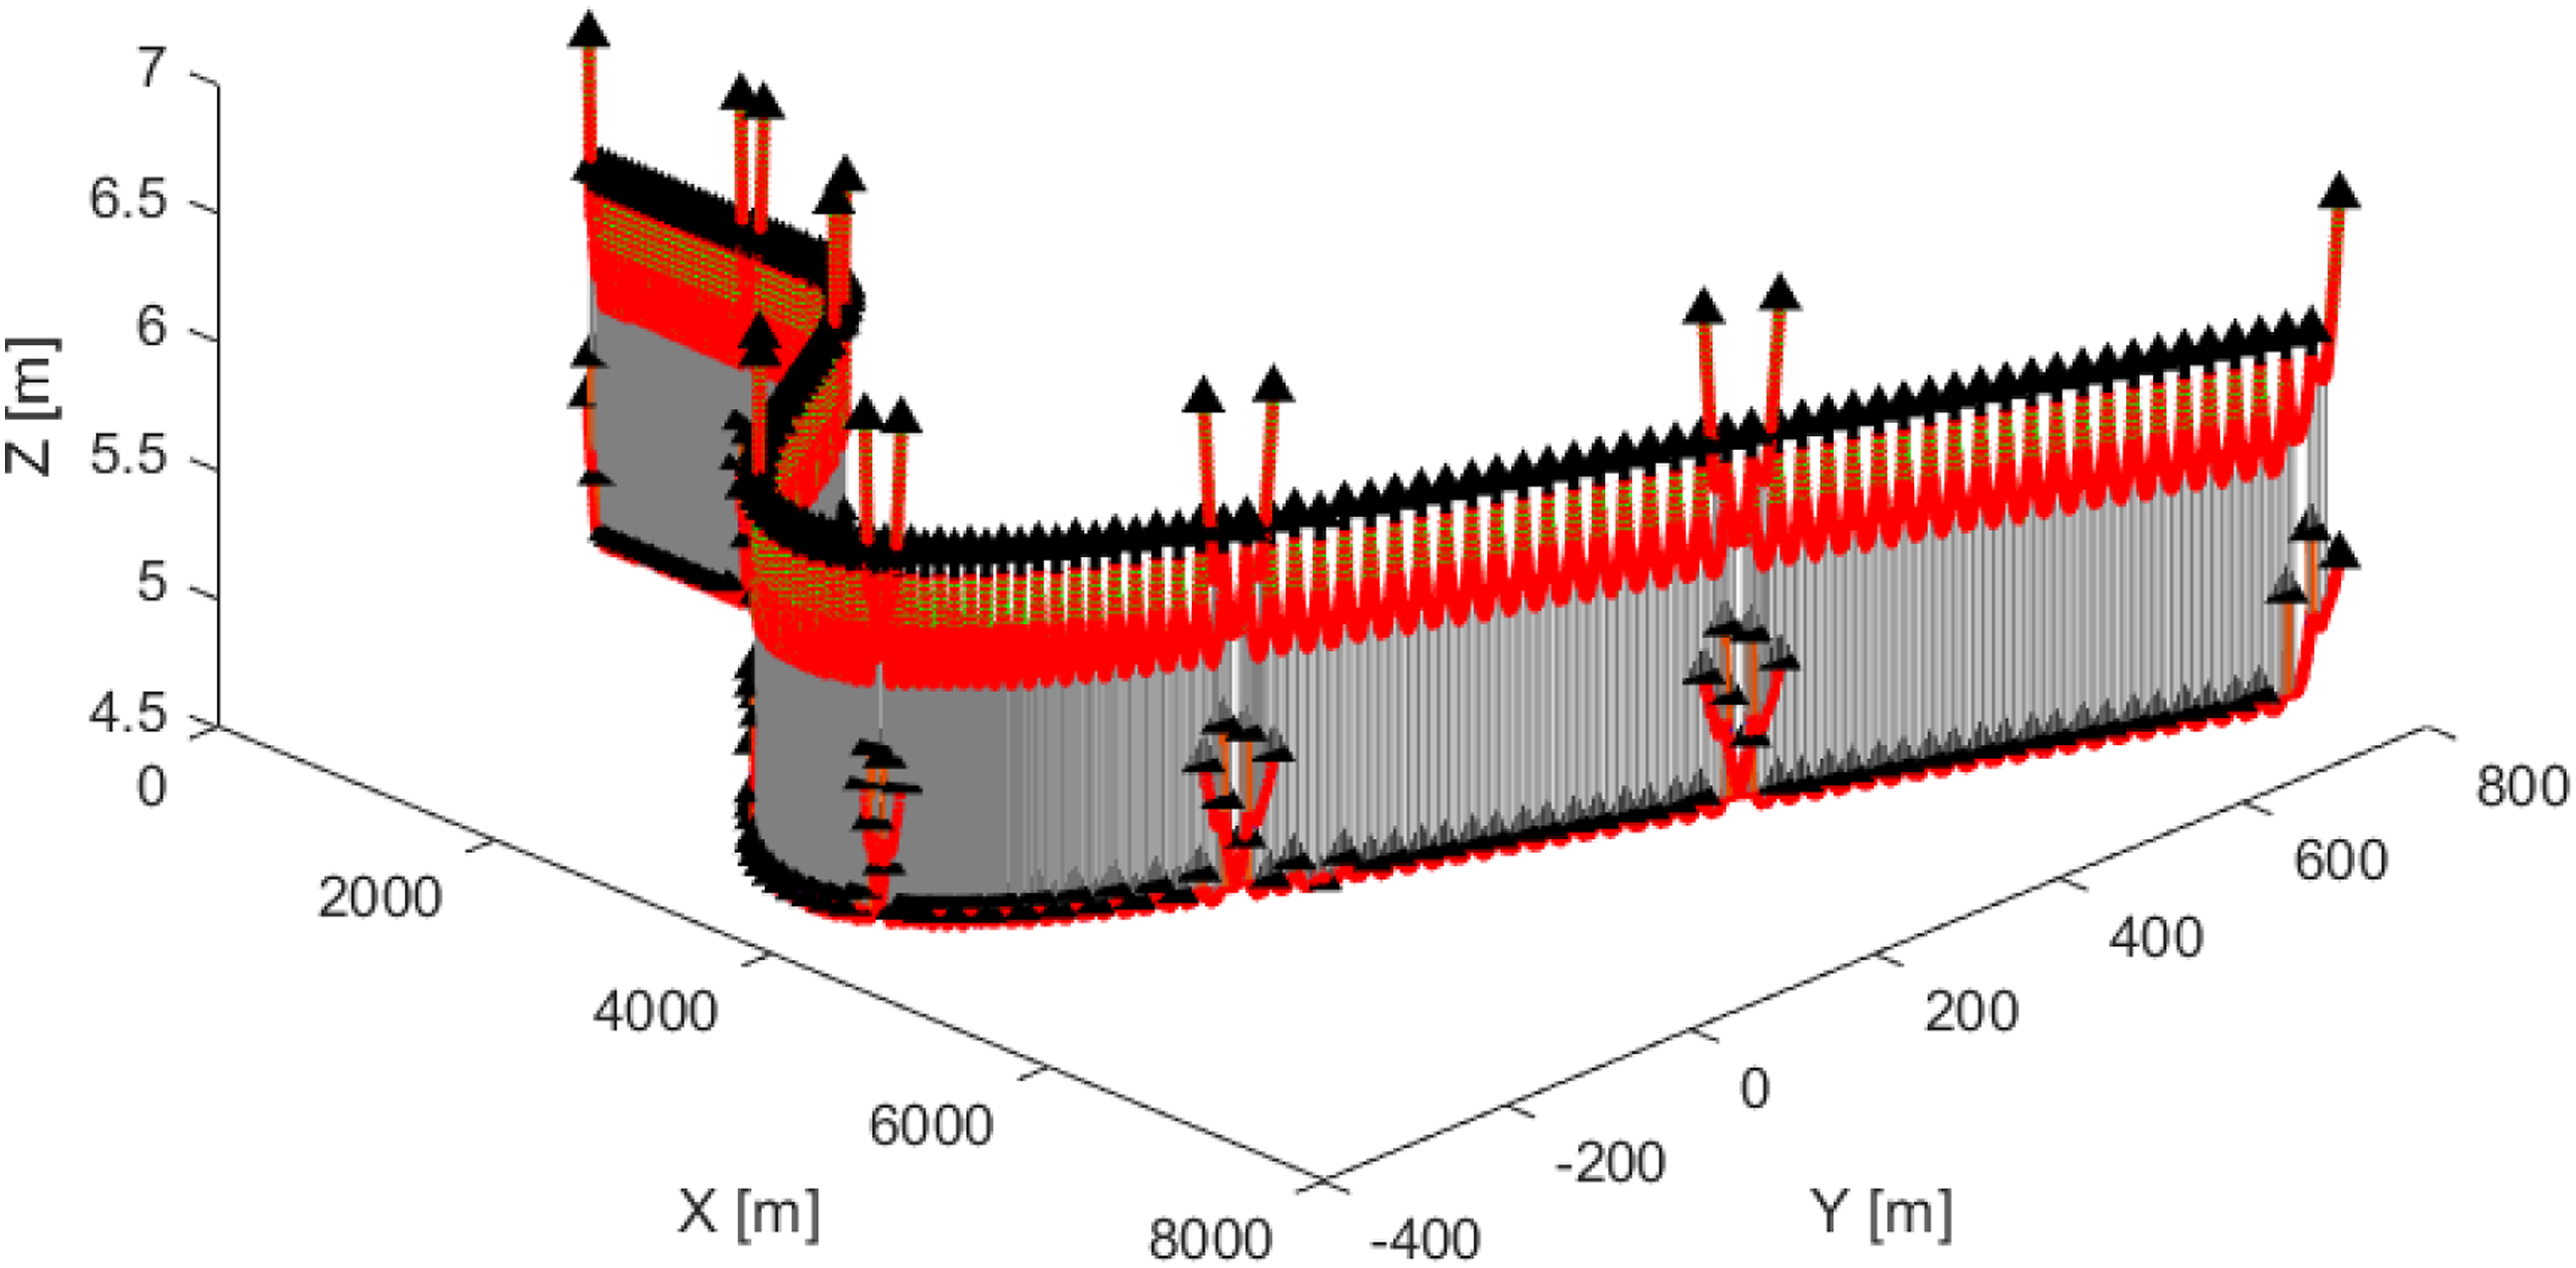
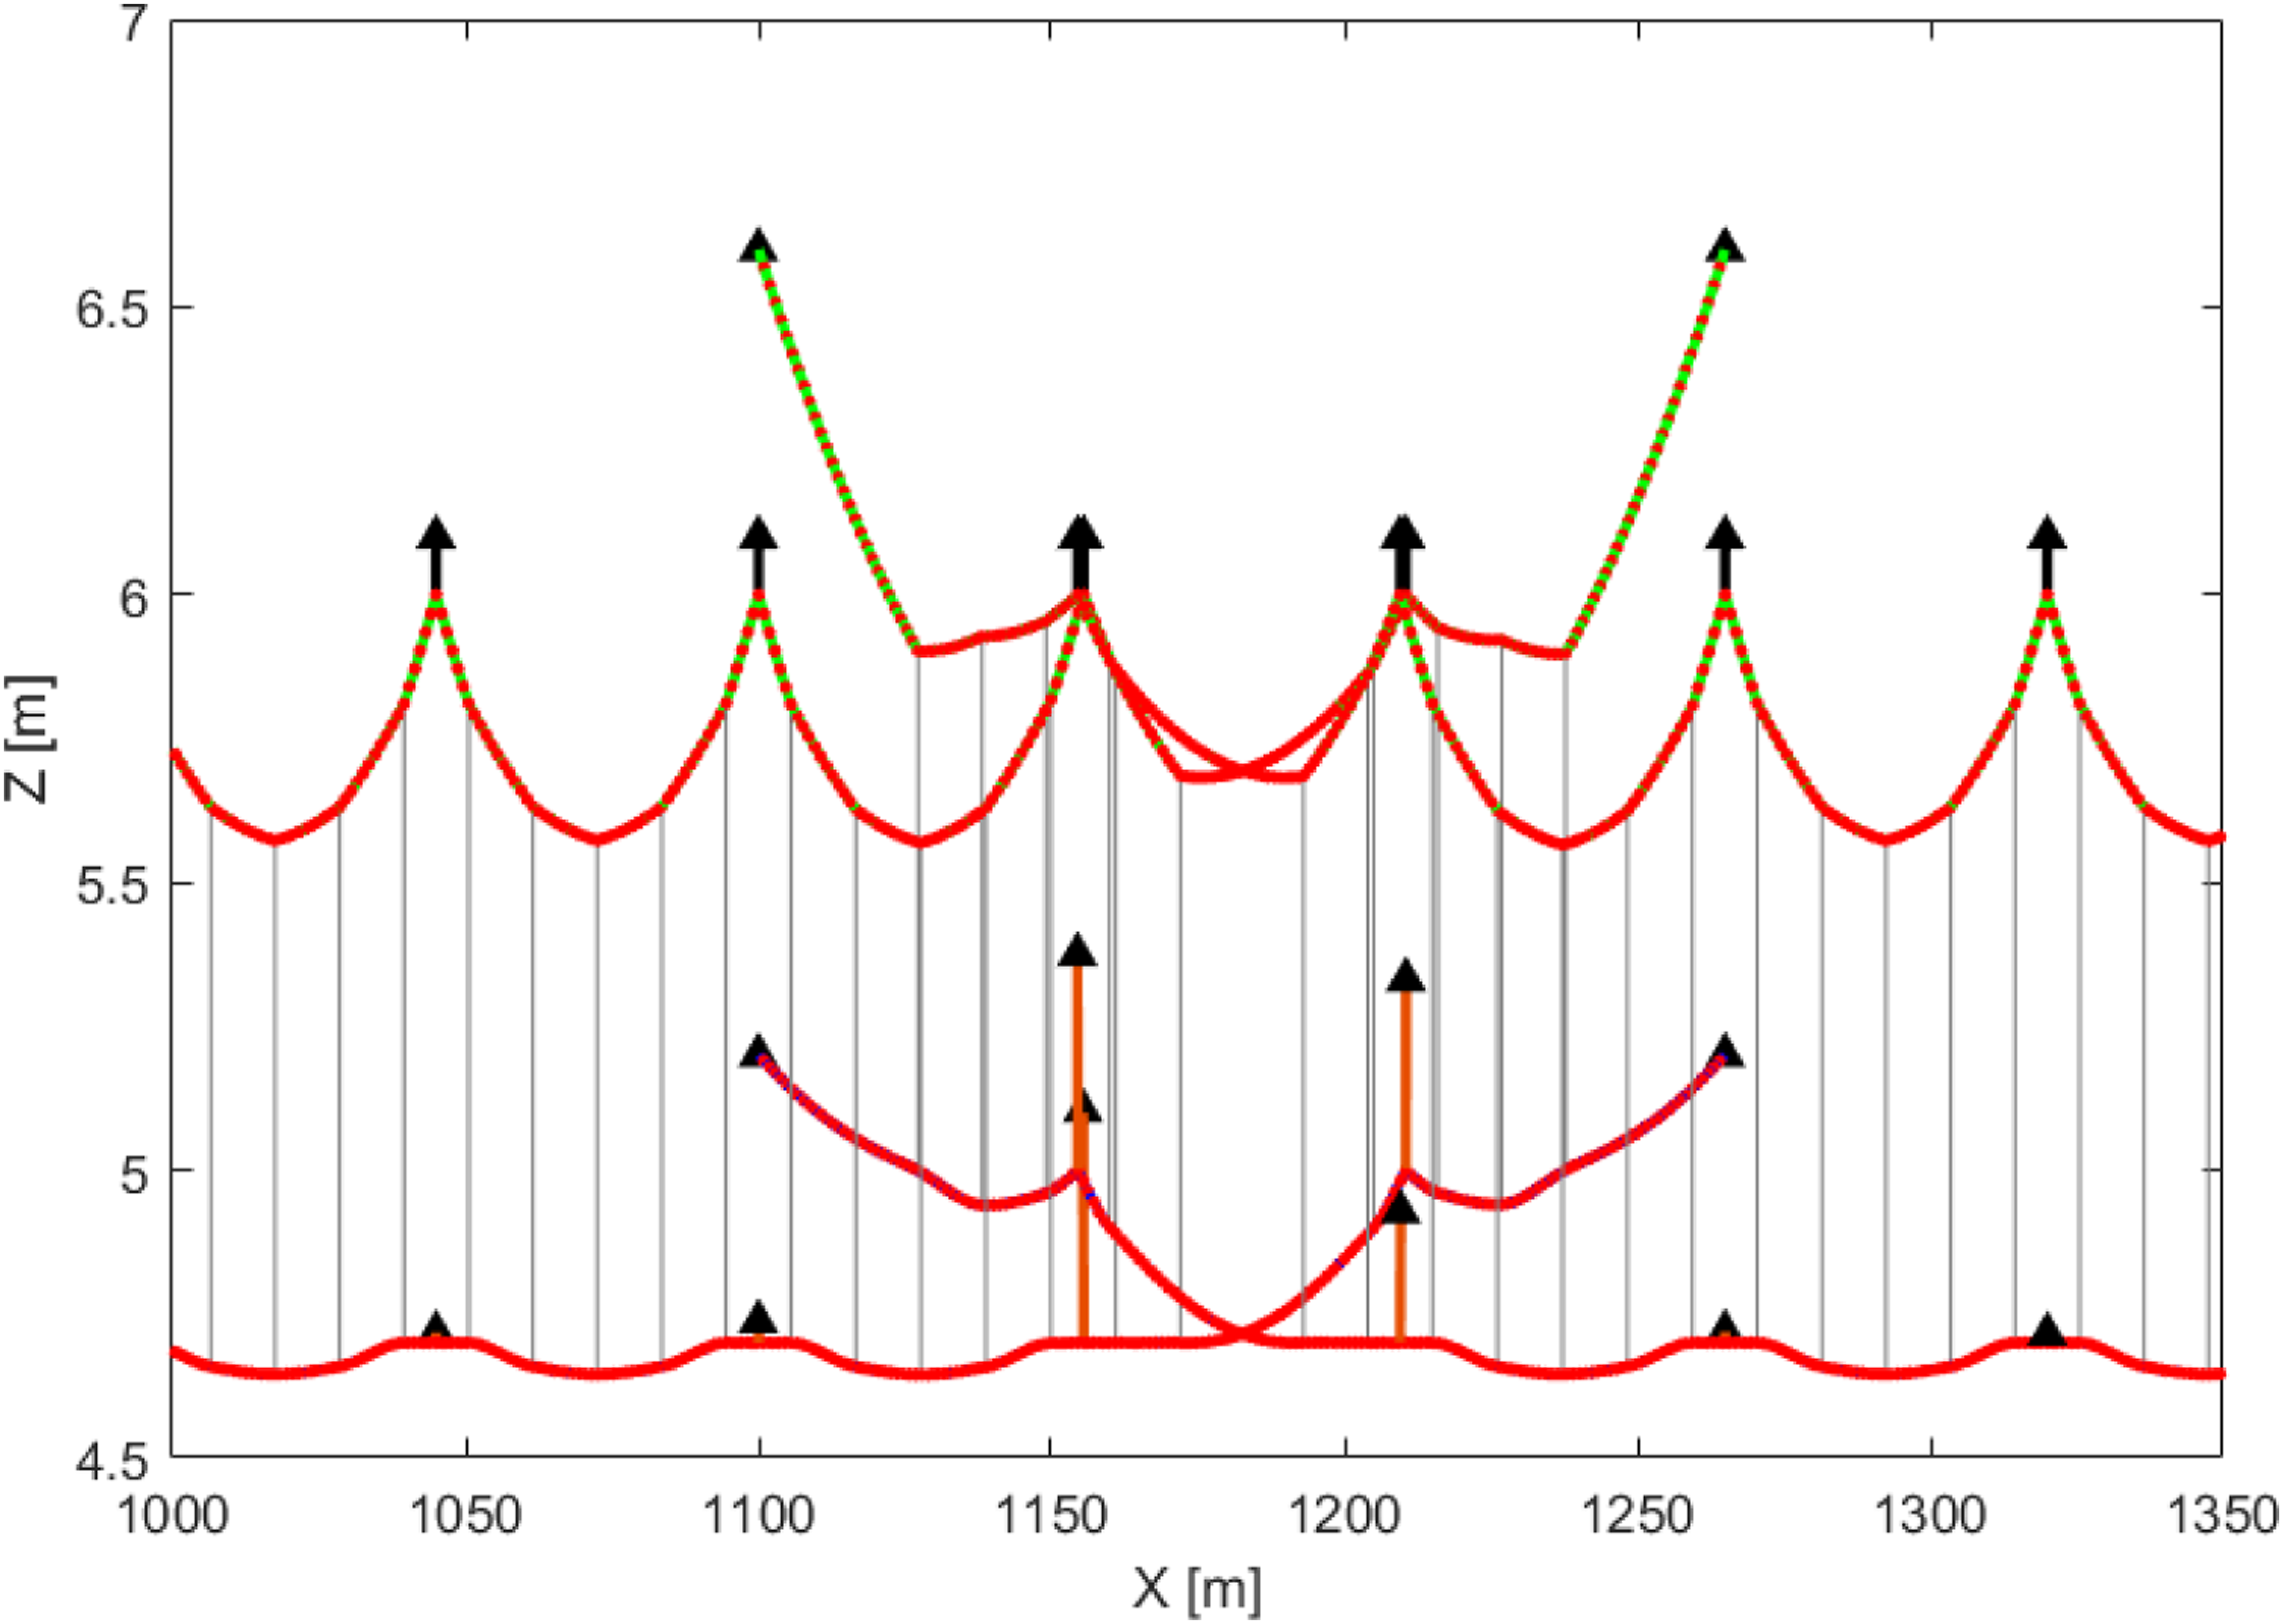
The catenary is represented by a linear FE model, which is well suited for the small rotations and deformations characteristic of the dynamic behaviour of these overhead systems. All catenary wires and structural components are modelled, in the FE formulation, as a 2 node, 6 degree of freedom, Euler-Bernoulli beam elements. 24 The clamps that hold the various structures of the catenary together are modelled as lumped masses, and the messenger wire cantilevers are modelled as equivalent 3D spring-damper elements. Both the messenger and contact wires are constrained by fixed points at the supports at the beginning and end of the wire runs. 26
Conclusions
In this work, an innovative methodology to reconstruct railway track geometries from aerial images is presented. The objective is to use this realistic geometry, which is not always accessible to the overhead line engineers, to build reliable 3D catenary models. These models will be fundamental to perform pantograph-catenary dynamic studies and access with accuracy the current collection performance of different configurations, enabling to optimize the catenary design and support new rail electrification projects or OCL renewals.
The methodology proposed here is demonstrated in a 8 km track section of the Great Western Mainline in the UK. The area of interest is identified in Google Maps, discretised by the identification of a set of key points along the track centreline, and described in spatial coordinates using the position of those points. The track is subdivided into straights, transition curves and circular curves using the methods presented above. The reconstructed geometry is verified against that identified in the aerial images to ensure proper geometric correlation. The cant and stagger information are reconstructed based on the design rules and good industry practices available in the literature and shared by the infrastructure manager.
The Network Rail Series 1 overhead equipment is considered here. All construction rules of this catenary, such as wire tensions, span arrangements and material properties of components, are known and used by the computational tool PantoCat to build the 3D finite element catenary model that sits on the realistic curved track. This work demonstrates the advances proposed to study more realistically the pantograph-catenary interaction and the need to consider general curved tracks in acceptance and interoperability studies.
Footnotes
Declaration of Conflicting Interests
The author(s) declared no potential conflicts of interest with respect to the research, authorship, and/or publication of this article.
Funding
The author(s) disclosed receipt of the following financial support for the research, authorship, and/or publication of this article: This work was supported by the FCT, through IDMEC, under LAETA, project UIDB/50022/2020.