
Abstract
Continuous information on the current location of a vehicle in its infrastructure is essential for automated driving. However, industrial railways and shunting operations may entail boundary conditions which are not suitable for widespread satellite-based positioning. Hence, this paper presents a positioning system, based on radio-frequency identification (RFID) and odometer, which was developed and tested on an automated road-rail vehicle for shunting at low velocities. The achieved accuracy for discrete positioning with RFID was estimated at 0.22 m. In quasi-continuous positioning between consecutive RFID tags, the odometer exhibited an error of −2.2% to 0.7% of travelled distance depending on the investigated stationary driving states and sensor data evaluation. Apart from enhancement potentials for the RFID system, the results also indicated the odometer to be prone to the shunting vehicle dynamics when the rotation of its rail wheels is measured. Furthermore, the shunting vehicle appears to run constantly with a notable lateral displacement even on straight tracks due to the property of its running gear, causing a systematic underestimation of the travelled distance.
Introduction
Knowing a rail vehicle’s position within the track network is essential for safe operation as well as for logistics and disposition. Enhancements of operational capacity and efficiency often go hand in hand with optimizing or adapting vehicle positioning systems. 1 Especially in the era of digital transformation, real-time positioning of vehicles appears to receive even greater attention.
The overarching objective of this undertaking was to develop an automated shunting system for small flat yards and industrial railways. Our approach is based on a compact, battery-powered road-rail vehicle that is equipped with sensors and an automatic coupling.
2
It is remote-controlled from a stationary control centre and operates at low velocities (<8 km/h) even though the German regulations for sidings and industrial railways generally allow a maximum velocity of 25 km/h. According to an internal feasibility study, such a low velocity did not result in a substantial decrease of shunting capacity when single wagons or wagon groups were moved. Even if there was any cutback, it could be easily overcompensated by higher availability through automation. Moreover, low velocities would significantly improve the operational safety.
3
Therefore, the positioning system for our automated shunting vehicle was required to: (i) Be sufficiently accurate (<0.5 m) when necessary; (ii) Function reliably in the shunting/industrial environment; (iii) Be independent from external services; (iv) Facilitate positioning also in roofed and indoor sections; (v) Be inexpensive and made of off-the-shelf components.
Conventional track-vacancy detection is part of train protection systems (TPC) and utilizes trackside equipment such as axle counters and track circuits. It implicitly reveals the rail vehicle’s position and can achieve a positioning accuracy of several hundred meters.4–6 A comparably recent approach to determine the train’s position and velocity among others uses fibre optic sensors (FOS). Therefore, fibre optic cables mounted along the track are required. Yet, most of the time they are already installed for signalling and telecommunication purposes.7–9 However, for many regional branch lines or low-density traffic lines (LDTLs), such trackside equipment may not be affordable. Hence, these lines operate with radio-based direct traffic control (DTC).10–12 Similarly, small yards and industrial railways are mostly unsignalled territories where shunting locomotives are driven on sight at lower velocities. 13
Stand-alone, global navigation satellite system (GNSS)-based vehicle positioning for LDTLs has been proposed as a substitute for trackside equipment when used with another train integrity monitoring system or as a safety-increasing additional overlay to the existing train control.11,12 In terms of the European Train Control System (ETCS) Level 3 that aims to further increase transport capacity on existing track networks, much research has been dedicated to vehicle-borne positioning systems which may be beneficial for both industrial railways and LDTLs. 14 In general, GNSS is probably the most frequently applied method of position acquisition not only for trains but also for vehicles of all traffic modes and other mobile robots. Global navigation satellite system has obvious advantages, yet it also entails limitations regarding availability and susceptibility depending on the receiver’s operational environment and therefore being prone to shadowing and multipath distortion. These limitations are further exacerbated by possibly unfavourable boundary conditions hailing from the railway application, such as tunnels, hilly regions, urban canyons, large metal surfaces from trains or, to a smaller extent, even overhead catenaries.15–17 Whereas Bazant and Taufer, 18 for example, propose setting up pseudolites in track-network areas with a suspected poor satellite signal, most studies focus on a multisensory system whose data are fused by state estimation algorithms (e.g., Kalman-filter) and matched with a pre-existing digital map.19–21
On the one hand, GNSS and balises or other trackside transponders provide discrete position information, the error of which usually remains constant for successive measurements. On the other hand, vehicle-borne odometers, Doppler radar (DR), eddy current sensors (ECS) and accelerometers, often being semiconductor-based inertial measurement units (IMU), are used to continuously determine the relative position by time-integrating their measurand, leading to drift errors and an increasing confidence interval over time. The diversity of sensor types with individual sampling rates, noise characteristics, susceptibilities to error in deployed environment, etc. has great impact on the accuracy and reliability when the measured data is used directly. Hence, intelligent data evaluation is often required to optimize the position and speed estimation by leveraging the strengths of each sensor type.22–24
Selection of GNSS-based positioning systems in railway application.
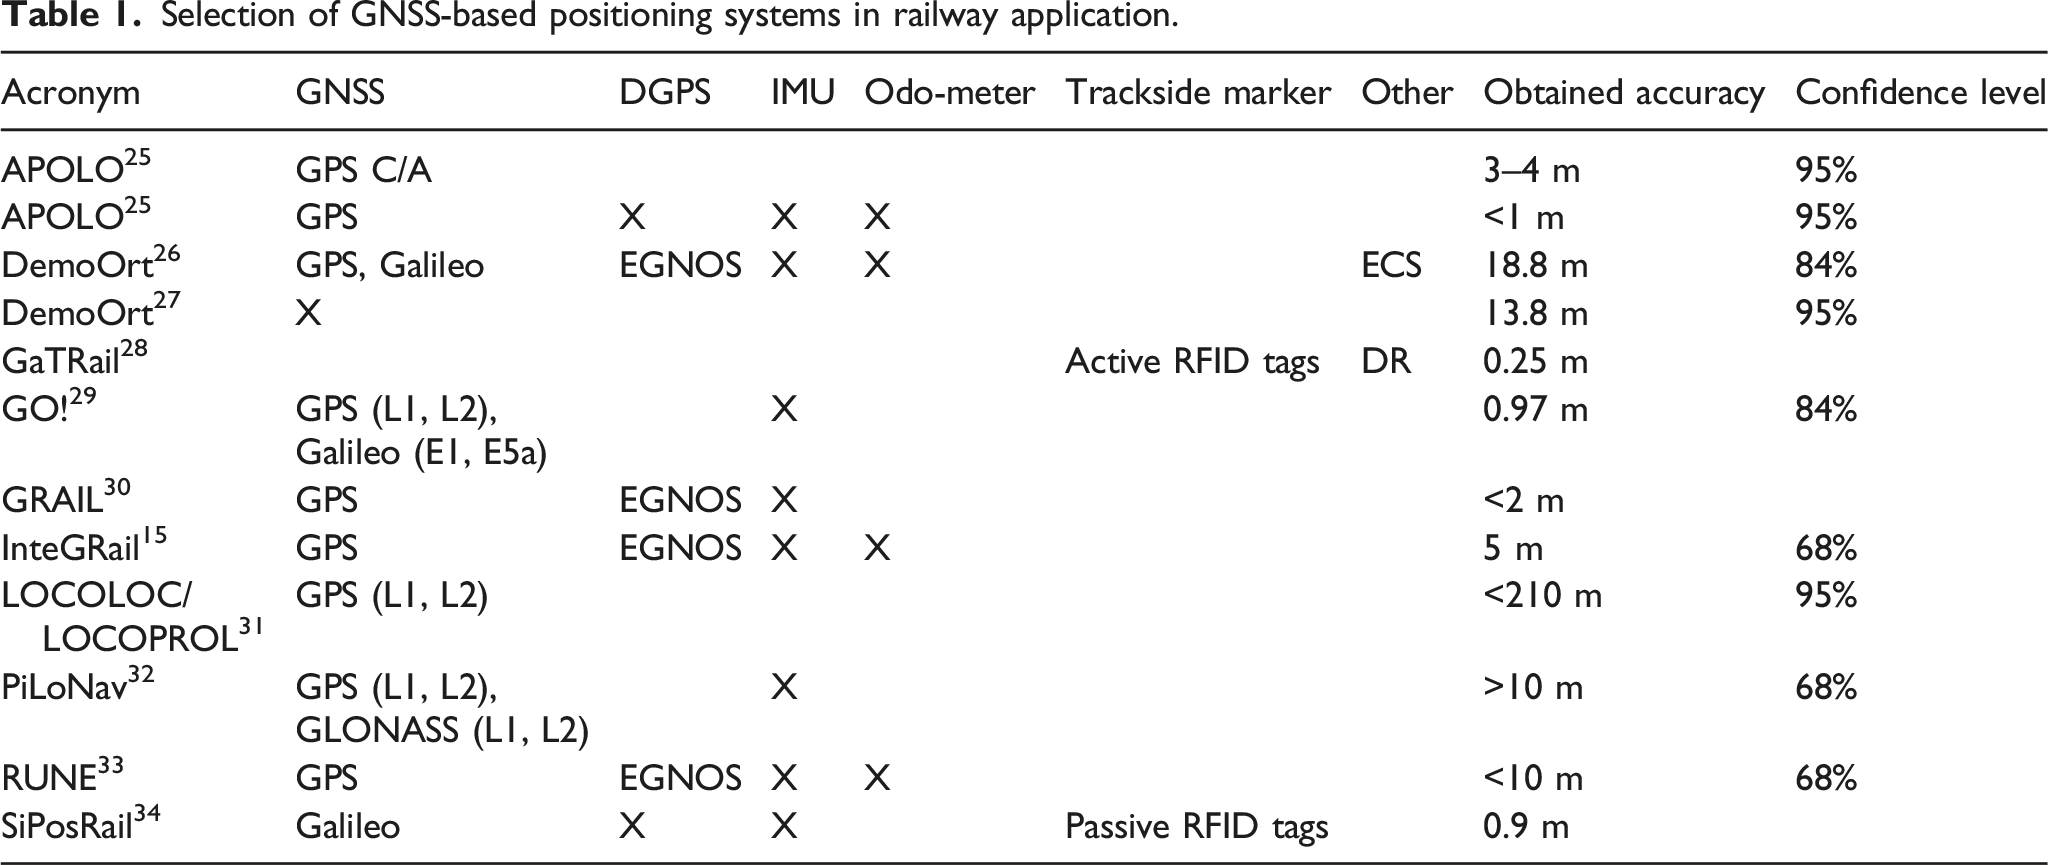
Trackside active radio-frequency identification (RFID) tags have been used, for example, in the reference system GaTRail to evaluate the GNSS-based positioning system DemoOrt.26–28 To identify and localize trains, Lee and Tsang 37 applied vehicle-borne RFID tags and trackside readers at the stations of light rail transit. The same method has been deployed widely for mainline traffic as well. Yet, further challenges and limitations arise when this system is implemented on high-speed trains. 38
Another alternative to GNSS is the received signal strength (RSS)-based positioning. Even though it is applicable to established wireless technologies (e.g. WiFi, RFID, cellular networks), its infrastructure already being available in many cases, a positioning system solely based on it is uncommon in view of a generally lower achieved accuracy compared to GNSS, and similar susceptibility to shadowing and multipath propagation.39,40
Proposed positioning system
Considering the aforementioned requirements and the concerns about GNSS-based methods for our application, a combination of RFID and odometer was chosen to be investigated as an alternative solution for non-safety-critical positioning of our automated shunting vehicle.
Concept
The principle of the introduced positioning system is the same as the one used in conventional railway applications with balises and odometry. As shown in Figure 1, this system consists of an onboard RFID antenna, an odometer based on two wheel speed sensors, a sensor box and trackside RFID tags (passive transponders). Concept of the introduced RFID-odometer-based positioning system.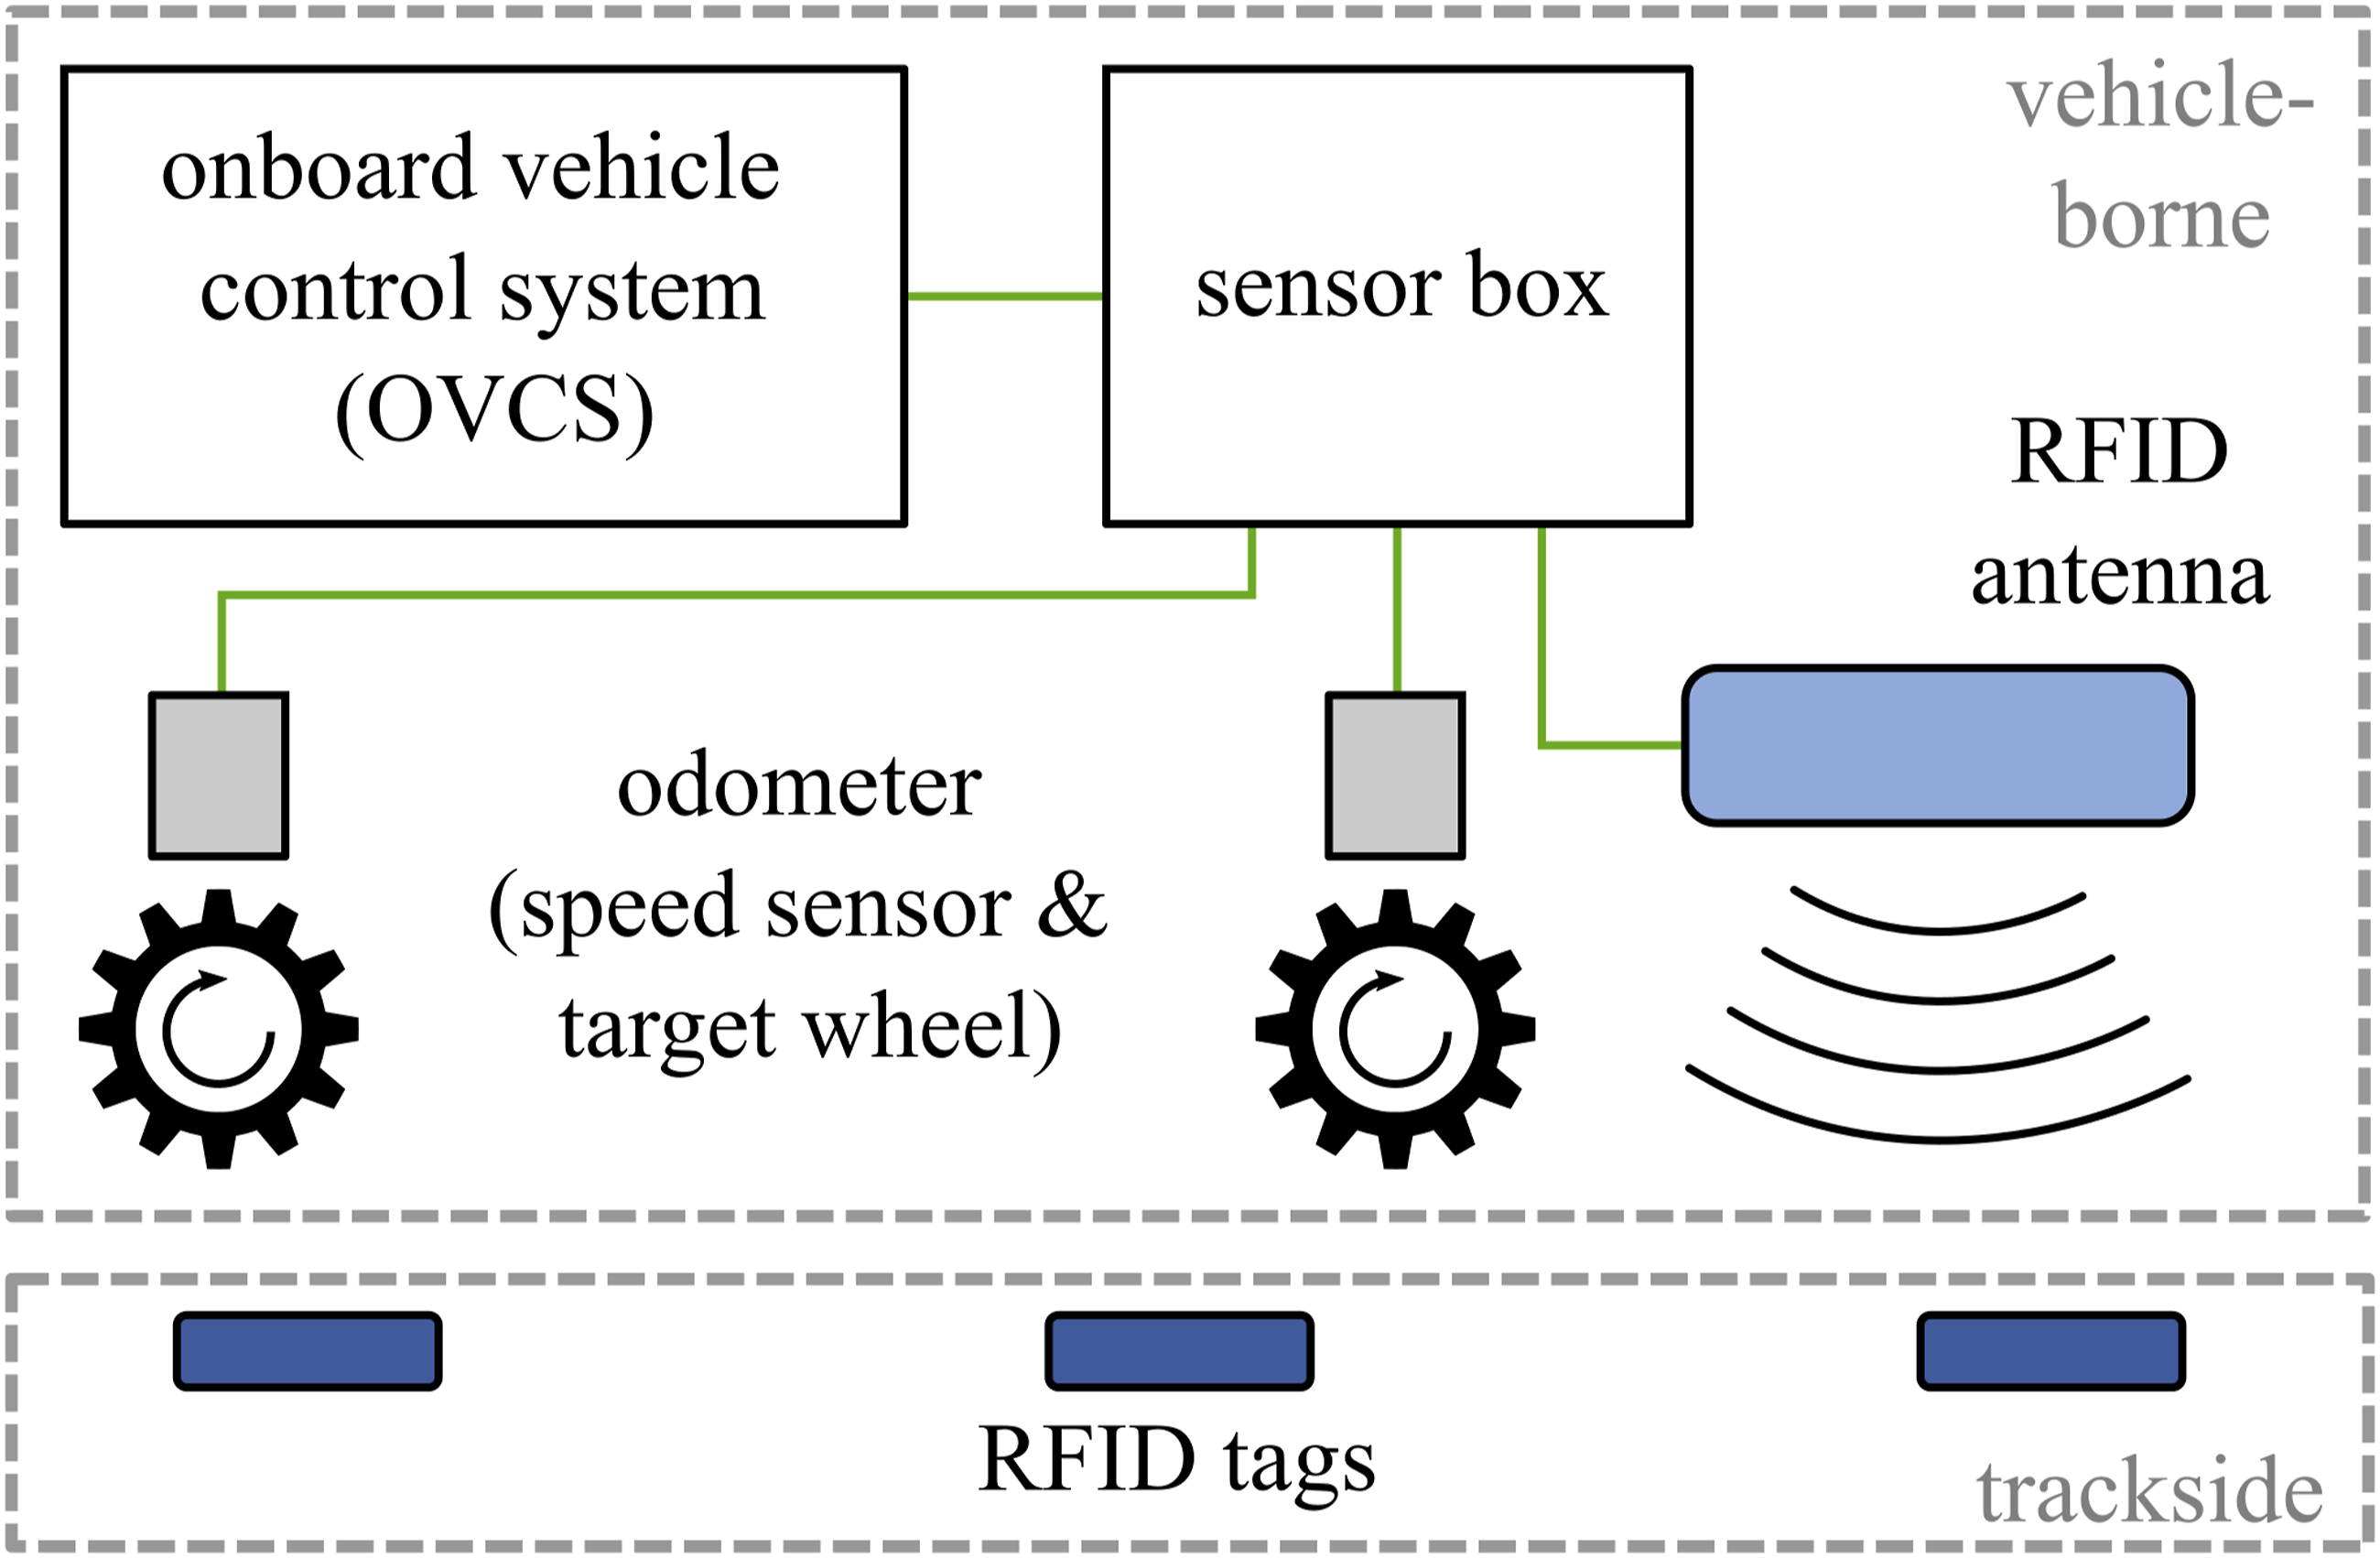
All sensor signals are amplified and transduced in the sensor box and sent to the onboard vehicle control system (OVCS), which performs the sensor fusion and reports the vehicle’s position wirelessly to the stationary control centre. The tags are placed on the sleepers at regular intervals and act as trackside balises. Their positions are measured, either in absolute coordinates or as relative milestones, and saved in a database (digital map). Whenever the vehicle-borne antenna detects an RFID tag on the journey, the vehicle’s position is correlated with its counterpart in the digital map. For the vehicle position estimation between tags, the accumulated and averaged distance to the last known tag position is obtained by the odometer. It consists of one speed sensor on each side of the vehicle which detects the rotation of the sensor’s target wheel.
Technical implementation
A standard ferromagnetic spur gear by Mädler GmbH, Stuttgart, Germany, with 120 mm outer diameter, module 2 and 58 teeth serves as target wheel. A two-channel inductive proximity sensor Type GEL 2475 by Lenord + Bauer GmbH, Oberhausen, Germany, serves as speed sensor. The RFID system operates within the ultra-high frequency (UHF) band using EPC Class 1 Gen 2 protocol. It consists of numerous IT67 Enterprise LTC Tags by Intermec, Everett (WA), USA, a UHF reader Dwarf G2-XR and a UHF antenna Echo-3, both by metraTec GmbH, Magdeburg, Germany.
The OVCS provides a RS-232 interface and four digital inputs for the data exchange with the positioning system. Both speed sensors and the antenna are connected to the sensor box, which contains an isolated DC/DC converter, the RFID module and a circuit board, Figure 2. Latter transduces the current signal from the speed sensors into a voltage signal, and then converts it into a digital output using a Schmitt trigger. Furthermore, the circuit board converts the TTL-UART from the RFID module to RS-232 signals. Signals and forwards them together with the digital signal of the speed sensors to the OVCS. The cable between the sensor box and OVCS includes wires for the power supply as well. Sensor box for powering the sensors and processing their signals.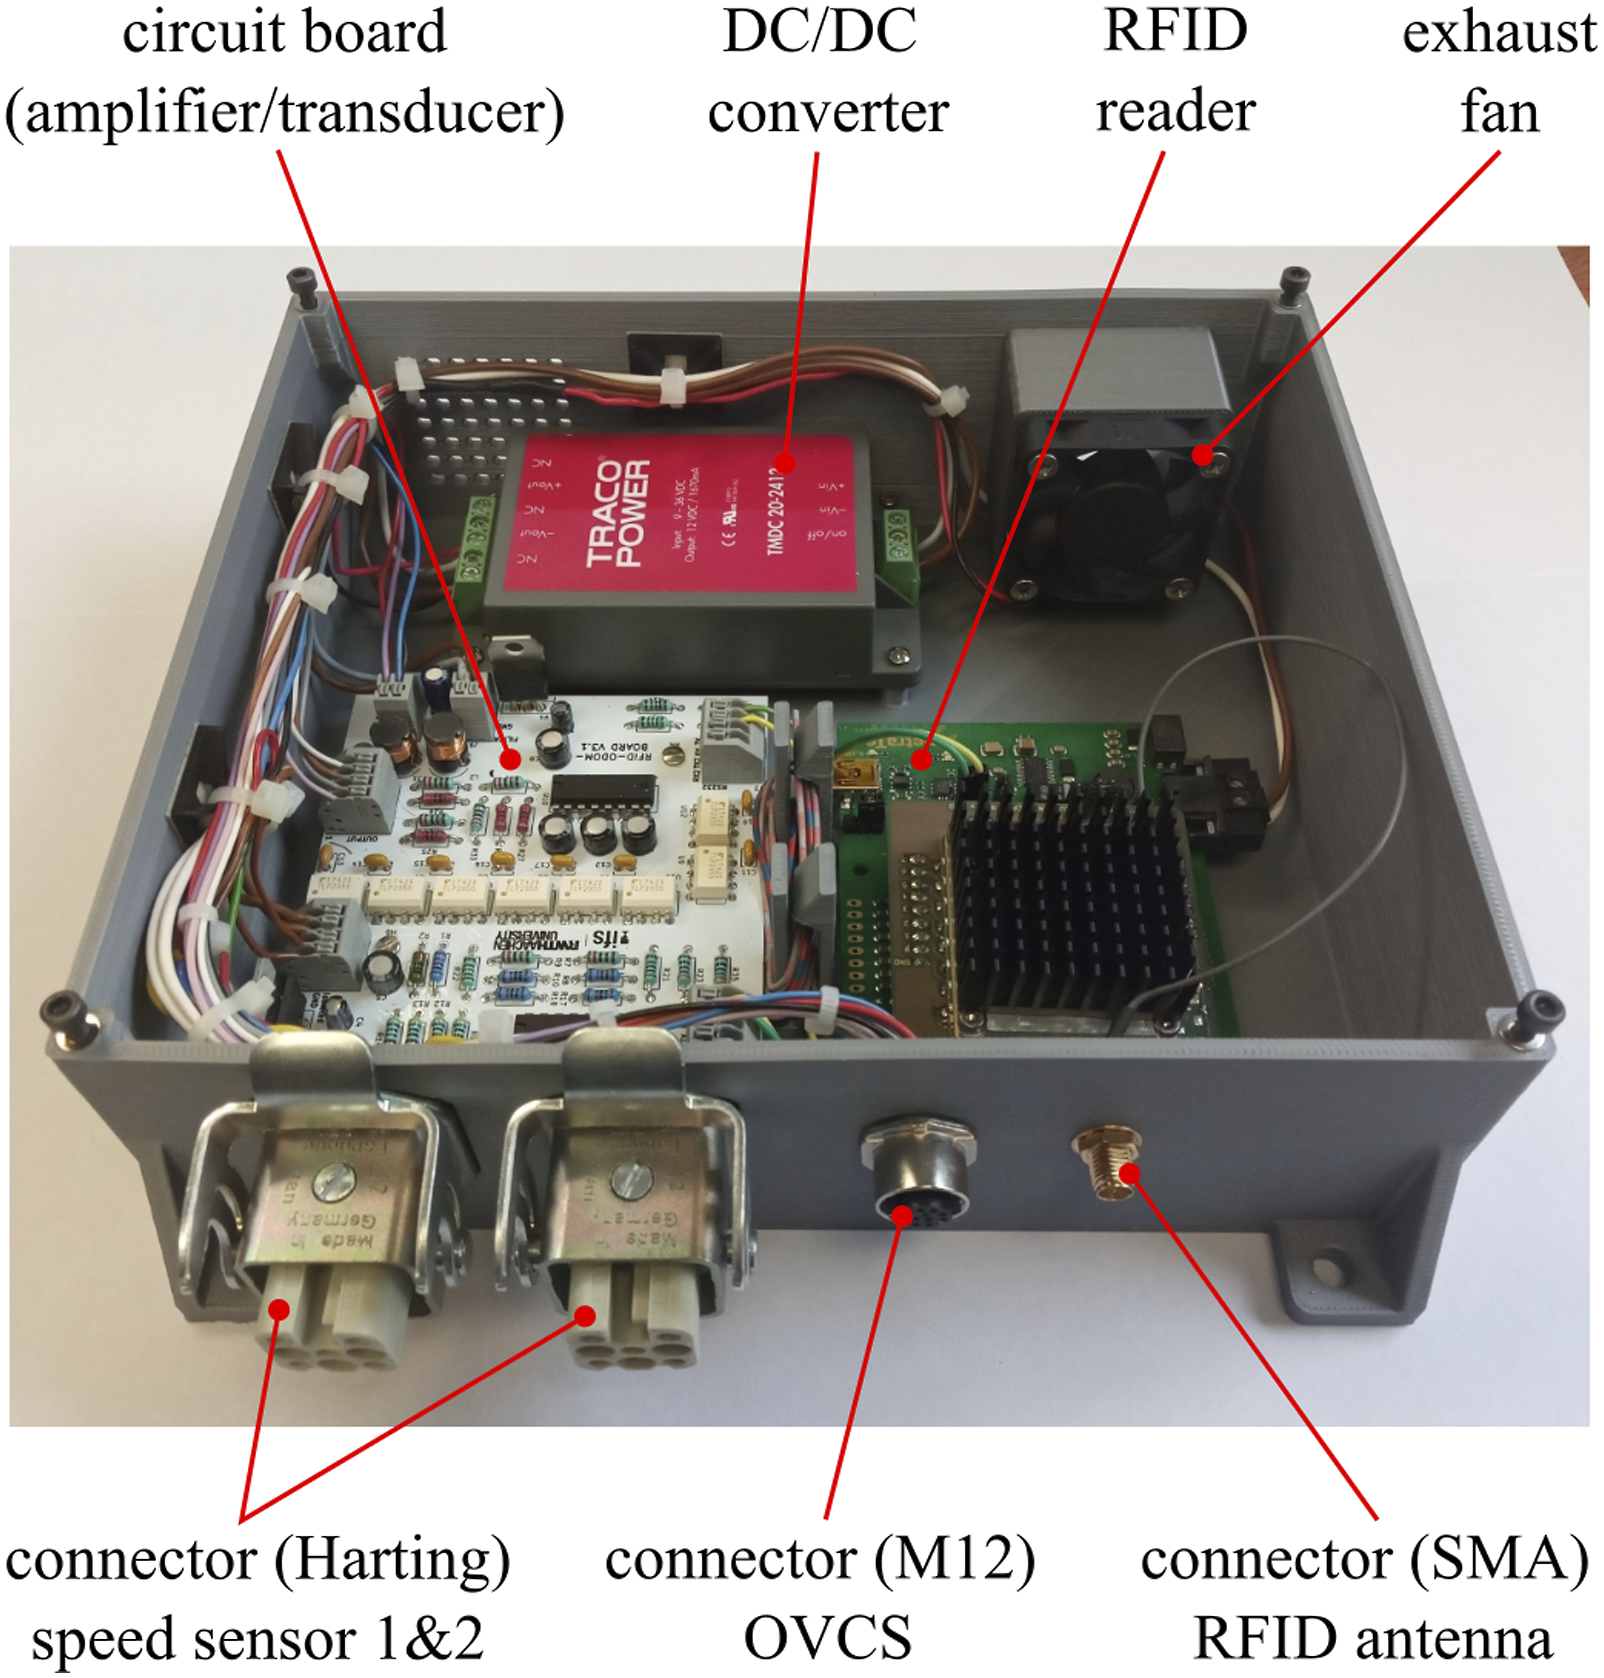
Experiments
The development of the RFID-odometer-based positioning system contained a two-staged experimental verification. In the first stage, the sensor system design was examined for basic functionality and compatibility with the pre-existing OVCS. After the successful preliminary test, the positioning system was integrated into the shunting vehicle and tested on a large scale to provide statistical results as far as possible.
Preliminary test
During the preliminary test of the positioning system on a manually movable rail trolley (Figure 3(a)), a replica of the OVCS with identical interfaces initialized and logged the sensor data. The replica consists of a single-board computer Raspberry Pi 3 B+ on the programmable logic controller (PLC)-extension board PiXtend V2 -L- by Kontron Electronics GmbH, Großbettlingen, Germany. A car battery (12 V DC, 90 Ah) was used for power supply and the antenna was fixed on various heights above the sleeper. According to the German regulations for sidings and industrial railways, a minimum vertical clearance of 55 mm from rail crown to any part of the vehicle bottom is required in the track centre. Taking this as well as the height of rail, tie plate and tolerances into account, the lowest permissible antenna position was determined to 25 cm above the sleeper. The target wheel and the speed sensors were installed on a laboratory mount, which was used beforehand for the odometer calibration, and thus not attached to the trolley’s rail wheel. Finally, 20 RFID tags were laid out on a 30-m-straight section of the institute-owned tracks. Because the RFID antenna was linearly polarized, the tags including their dipole inlay antenna had to be aligned parallelly with the radiation plane. The sleepers are wooden, yet steel sheets were placed under three tags in order to also verify their readability on metal surfaces as stated by the producer. (a) Setup of the sensor system on a rail trolley for preliminary tests, (b) RSSI-time-graph over five consecutive tags at 0.7 m/s and different antenna height in preliminary tests.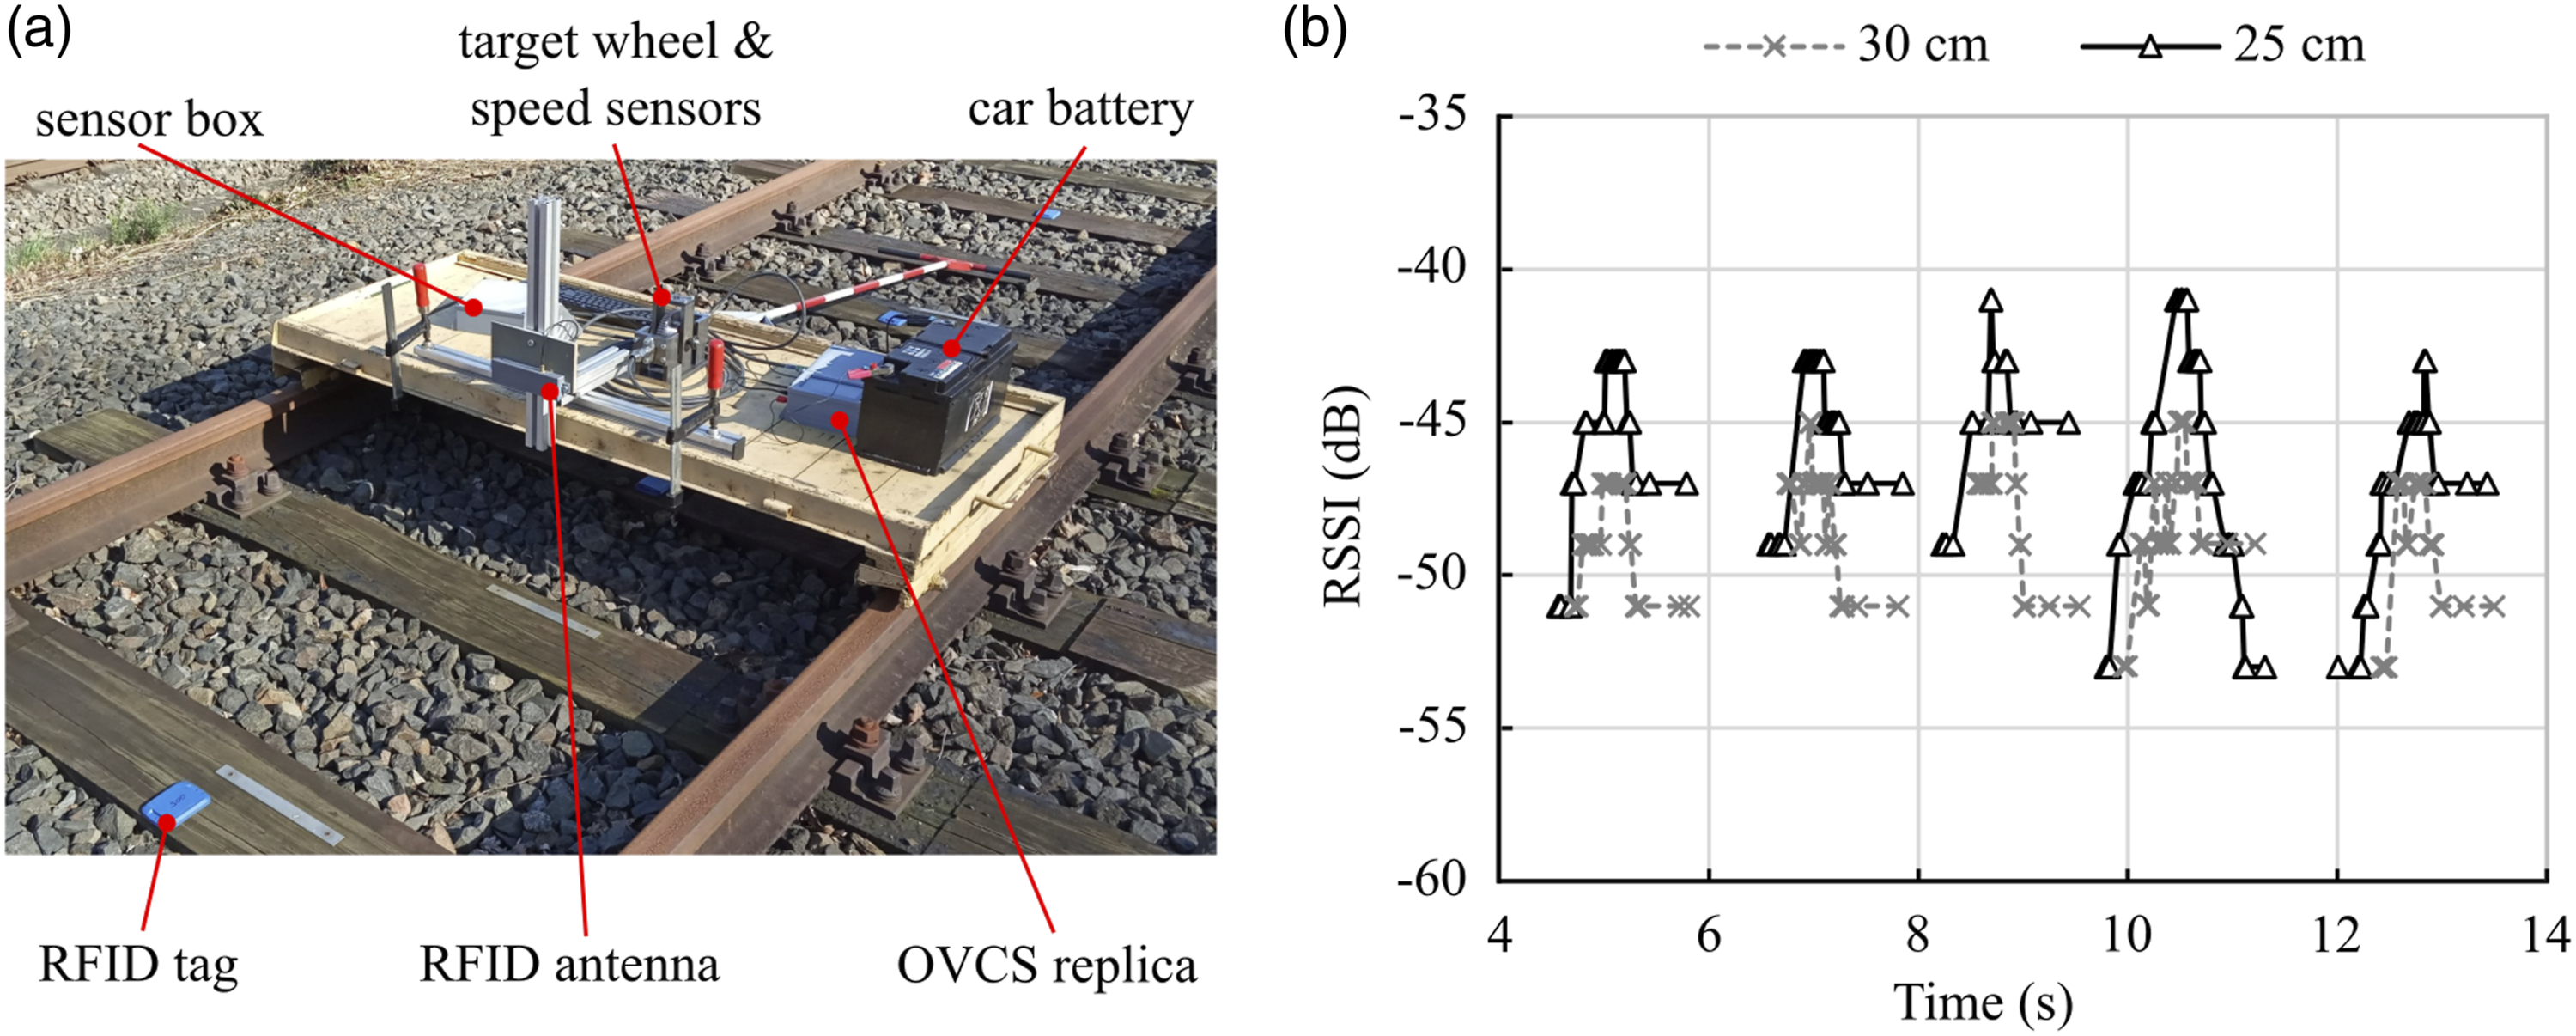
Figure 3(b) shows an overlaid extraction of two received signal strength indication (RSSI) measurements over six consecutive tags at different antenna positions. Higher RSSI values and a higher count of identification events per tag (multiple values) were registered at 25 cm height of the antenna above the sleepers compared to 30 cm. At 35 cm height, no signal was detected any more. Otherwise, metal sheets under as well as rainwater puddles on the tags did not show any notable impact on the detection rate nor the RSSI values.
Field test
The basic vehicle is a compact, electric road-rail vehicle ROTRAC E2 by G. Zwiehoff GmbH, Rosenheim, Germany (Figure 4). It has four solid rubber tires for traction, each individually driven by an electric motor with 1.4 kW nominal and 26.5 kW peak performance. The shunting vehicle has a towing capacity of 250 t on a horizontal plane at a maximum speed of 8 km/h. Another four trailing rail wheels, each two of them attached to a vertically lowerable square tube parallel to the vehicle’s lateral axis in the front and rear respectively (equivalent to two single wheel-single axle running gears), enable the track guidance. The main energy source is a rechargeable lead-acid battery (48 V DC, 620 Ah) which also powers the upgraded sensors and computing modules. Test setup of the RFID-odometer-based positioning system on ROTRAC E2.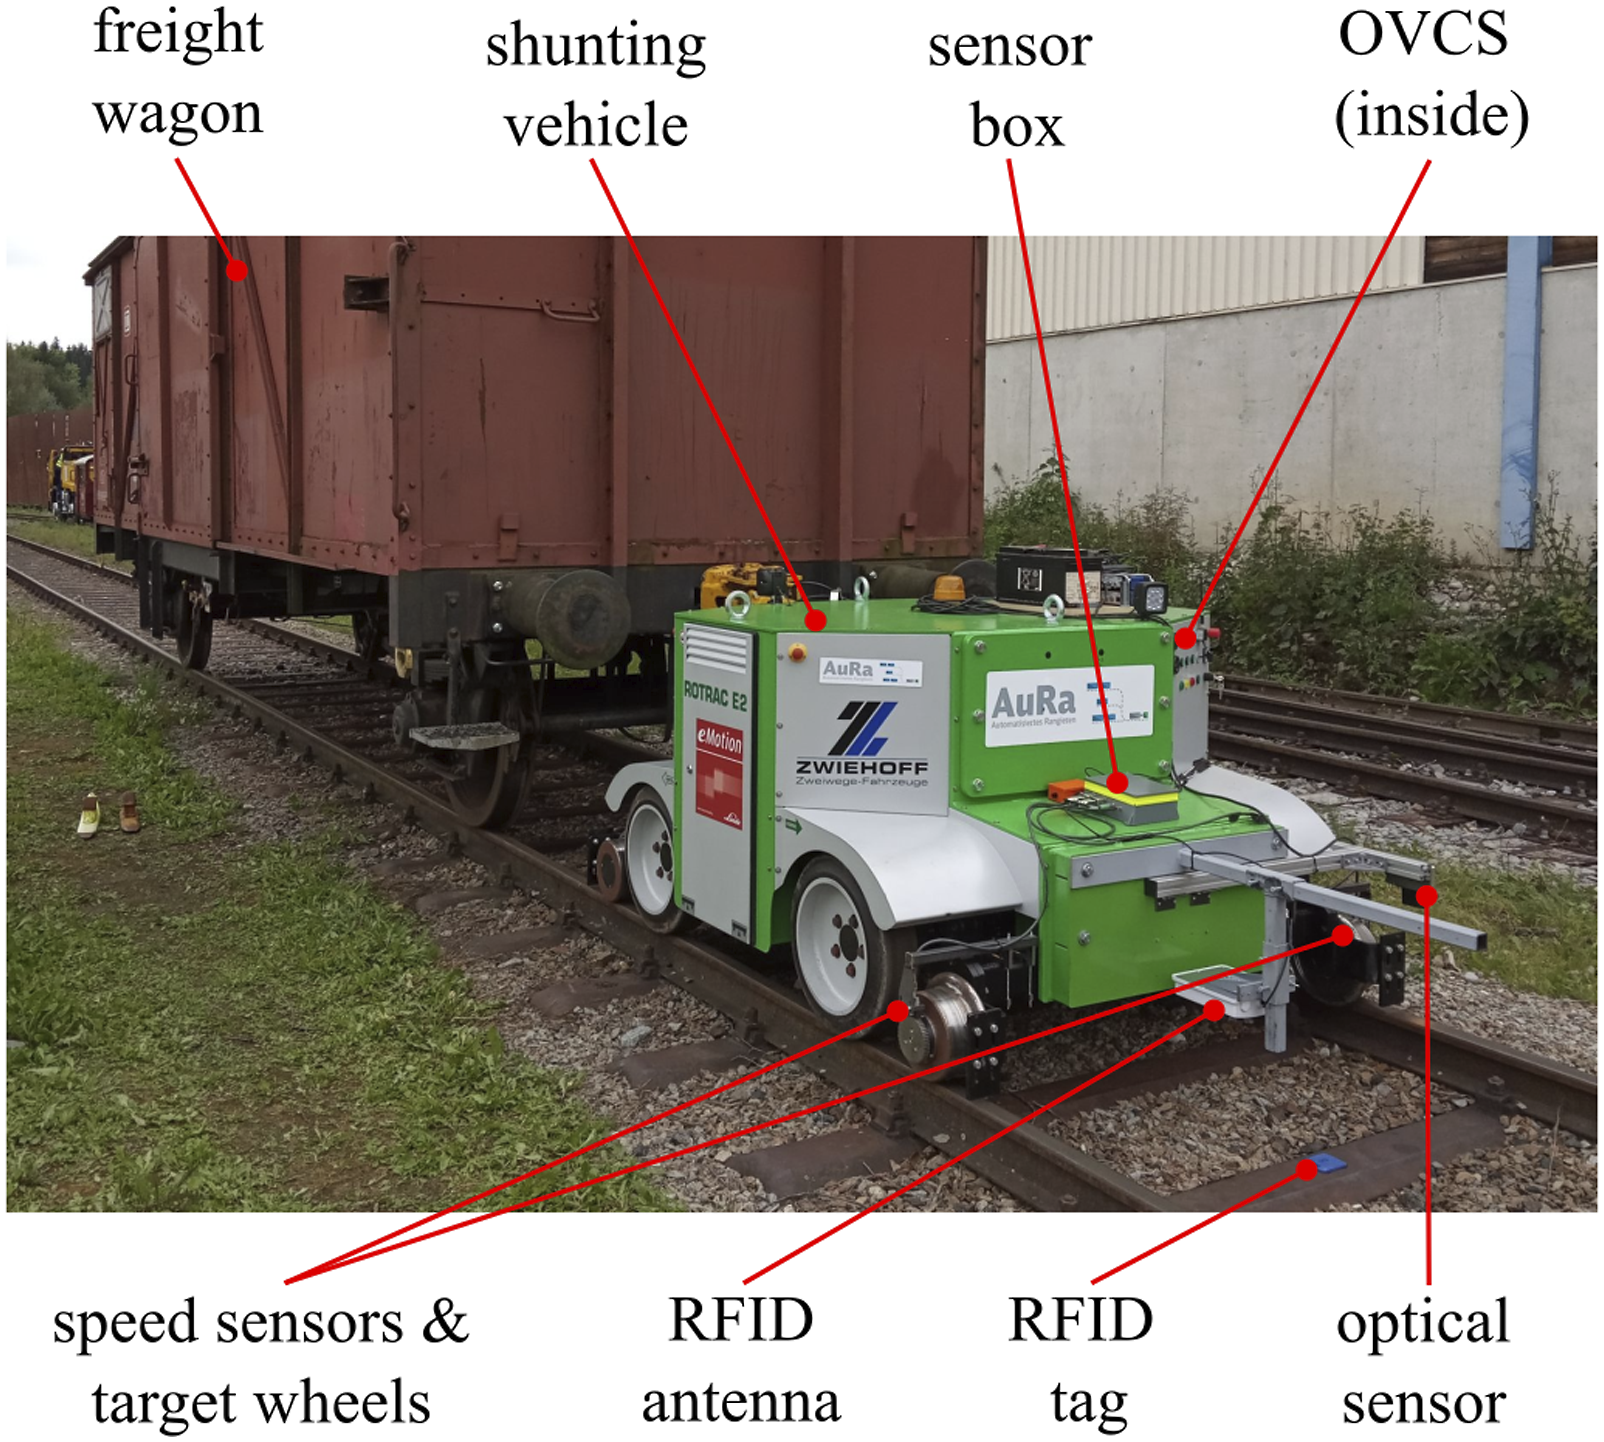
The aforementioned target wheel was concentrically bolted on the ROTRAC’s rail wheel which has a tape circle diameter of 222 mm. This would result in a distance resolution of 12.0 mm per pulse at nominal rolling radius. The accumulated counts of each side’s wheel are averaged for the travelled distance estimation. The speed sensor is fixed to the ROTRAC’s front square tube with a mounting bracket and aimed at the target wheel. The antenna was mounted in front of the shunting vehicle at a vertical distance of 30 cm above the sleepers. Unfortunately, the Echo-3 antenna had become effective prior to the field tests so that it had to be replaced by another instantly available UHF antenna WRL-14131 by SparkFun Electronics, Niwot (CO), USA. Both original and replacement antenna were linearly polarized and operated with 0.5 W effective radiated power (ERP). In order to compare the speed measurements, an optical sensor Type CL-350A by Kistler Instrumente AG, Winterthur, Switzerland, was mounted facing down towards the rail head. Additionally, a real-time kinematic (RTK) positioning system was set up with the fixed base station being next to the last switch before the curved track section in Figure 5(a) and the rover on the shunting vehicle. (a) Map view of the test site in Obing, Germany, original by OpenStreetMap (2021), (b) train setup and travel directions of a test round.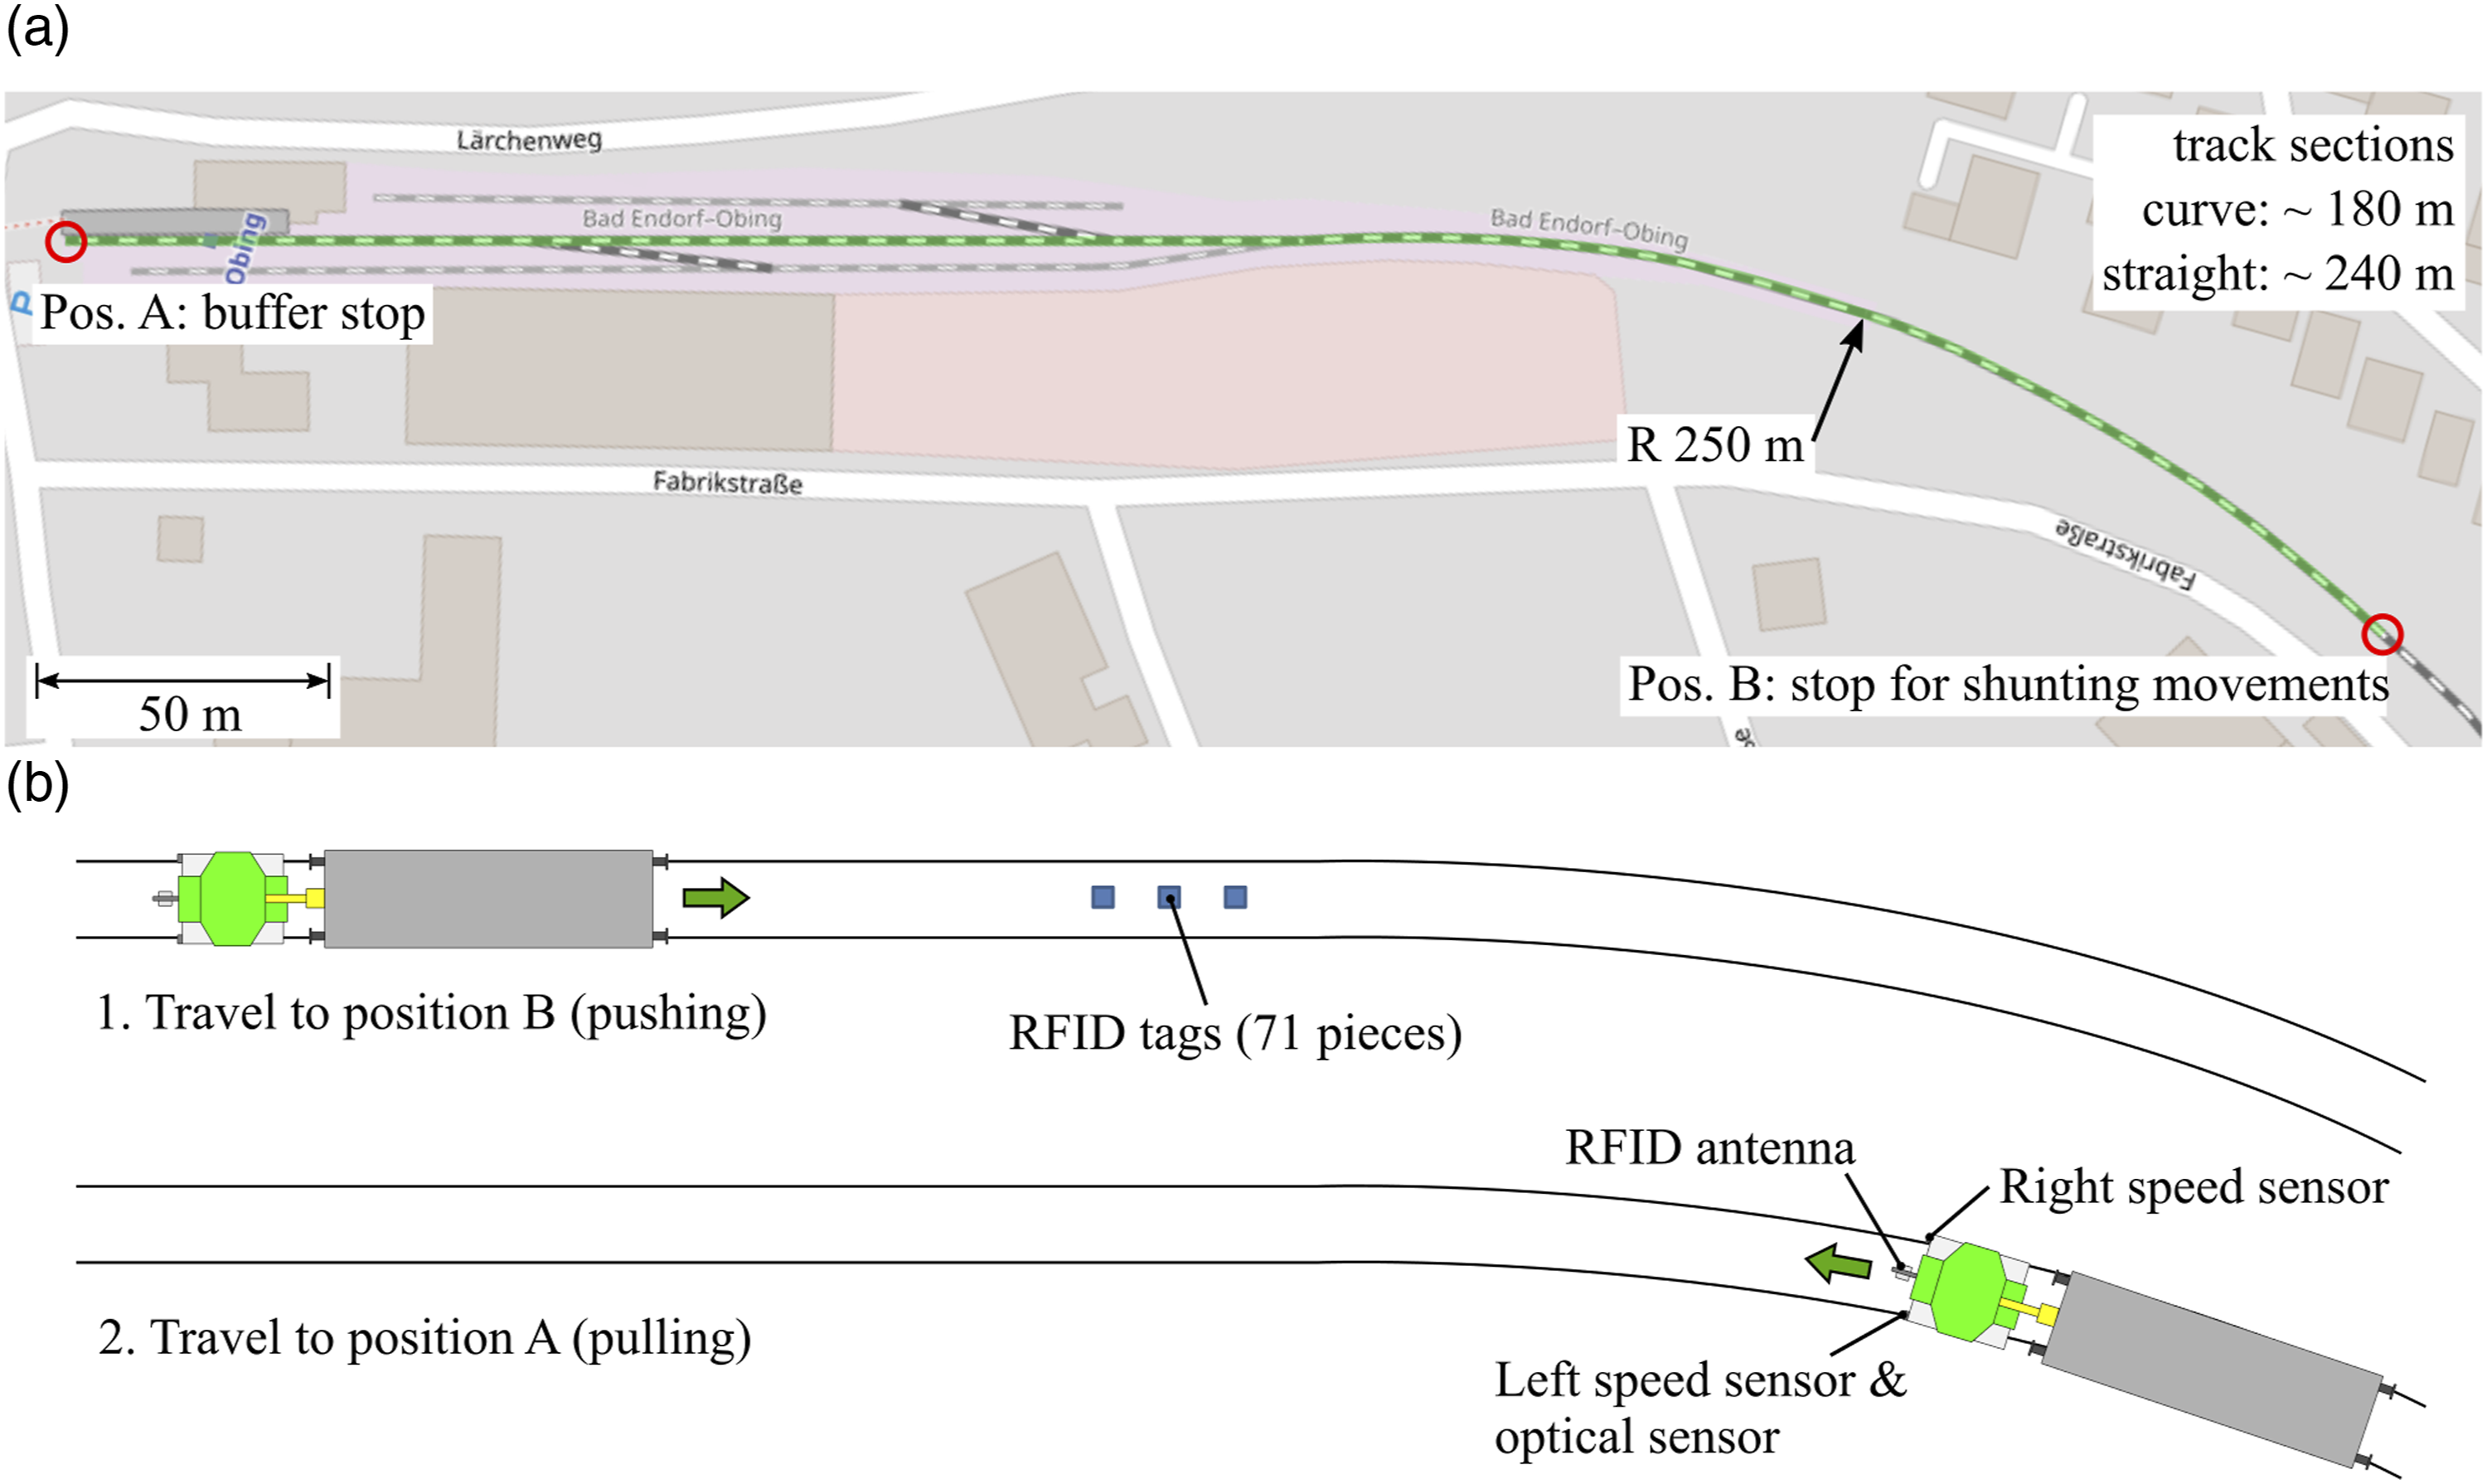
The field test was conducted on an approximately 420-m-long section of the train station tracks in Obing, Germany (green path between position A and B in Figure 5(a)). The test track consists of a straight and a curved part with roughly 250-m radius. The sleepers are steel, except for the wooden ones at the switches. In the centre of every free eighth sleeper, 71 RFID tags were placed along the test track, see Figure 5(b). Occupied sleepers either with closure rail of the switch or at the level crossing, were left out. Hence, the distance between two consecutive tags was approximately 5 m or, if skipped, an integral multiple of it.
A 50-m measuring tape was used to determine the distances from the initial tag at position A to the remaining tags. Furthermore, a two-axle, covered goods wagon was coupled to the shunting vehicle (see Figure 4), so that the latter faced the buffer stop at position A. When travelling to position B, it pushed the wagon and had the sensors at the rear, see Figure 5(b). On its journey back to position A, it pulled the wagon and had the sensors at the front. The train moved back and forth between positions A and B five times with different target velocities (1.0, 1.5 and 2.0 m/s). Weather conditions were mostly clear with occasional light rain. The sensor data were logged and post-processed.
Results and discussion
Radio-frequency identification performance
The detection (error) rate of the RFID tags with the described setup and testing parameters is depicted in Figure 6. When the shunting vehicle pushed the wagon with 1.0 m/s target speed, 2.4% of the RFID tags were not detected (5.2% at 1.5 m/s; 7.3% at 2.0 m/s). When pulled with 1.0 m/s target speed, the reader missed 3.3% of the tags (7.0% at 1.5 m/s; 9.1% at 2.0 m/s). In 29.4% of all antenna “flyovers” during pull-mode at 2.0 m/s target speed, the RFID reader registered each tag only once (single value). “Multiple values” refer to at least two successful identification events (and RSSI values) in the log when passing a tag, see also Figure 3(b). In conclusion, the successful tag detection rate is 97.6% when pushing the wagon with 1.0 m/s target speed and decreases to 92.7% at 2.0 m/s. When the antenna is headed towards travel direction, the detection rate is slightly lower. Detection (error) rate of RFID tags.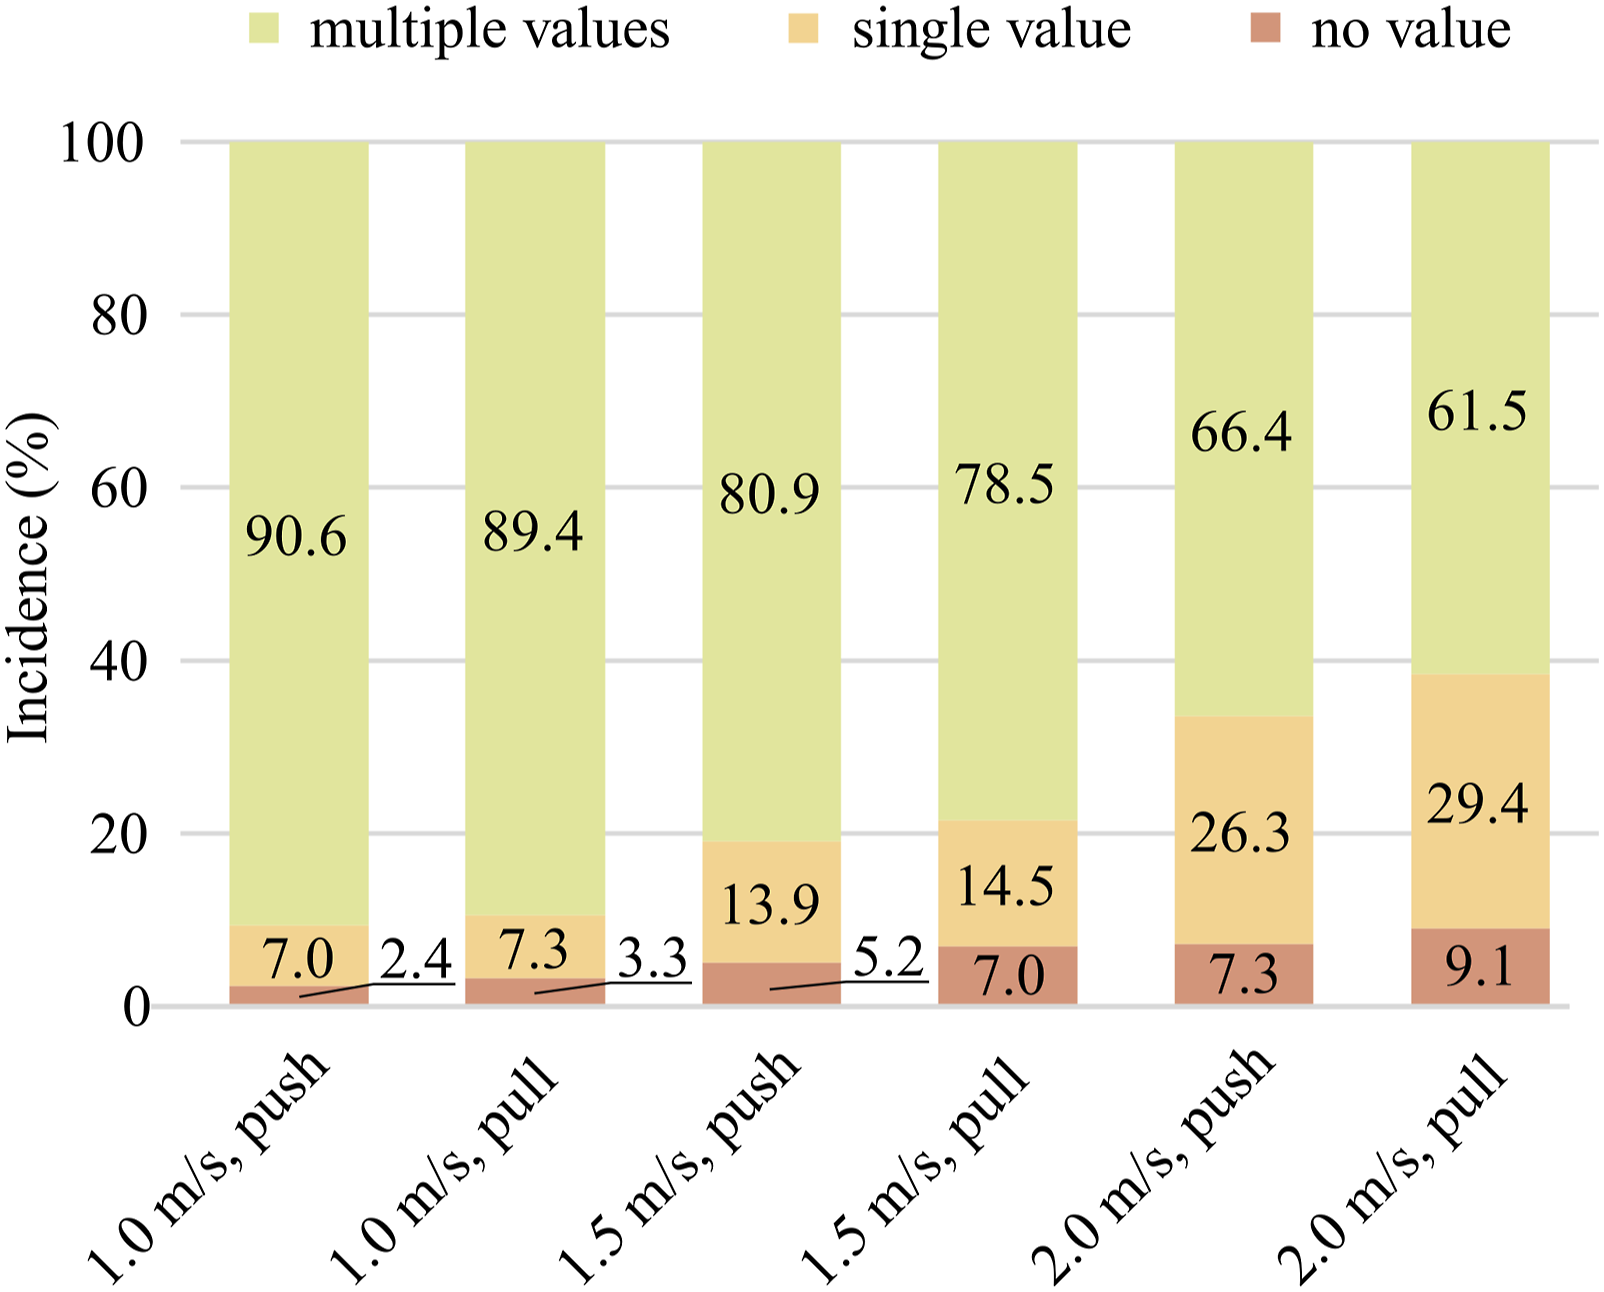
Contact duration is the difference between timestamps of the last and the first identification event for a single tag. Therefore, only detected tags with multiple values are taken into consideration. At 1 m/s for instance, the average contact duration is 0.45 s and declines to 0.20 s at 2 m/s, Figure 7(a). Contact range is the distance resulting from contact duration multiplied by velocity. The contact range is 0.45 m at 1 m/s and, evidently, remains nearly unchanged over velocity. (a) Duration and range of RFID contact, (b) precision of detection time and positioning, (c) odometer error based on averaged and (d) selective speed sensor data.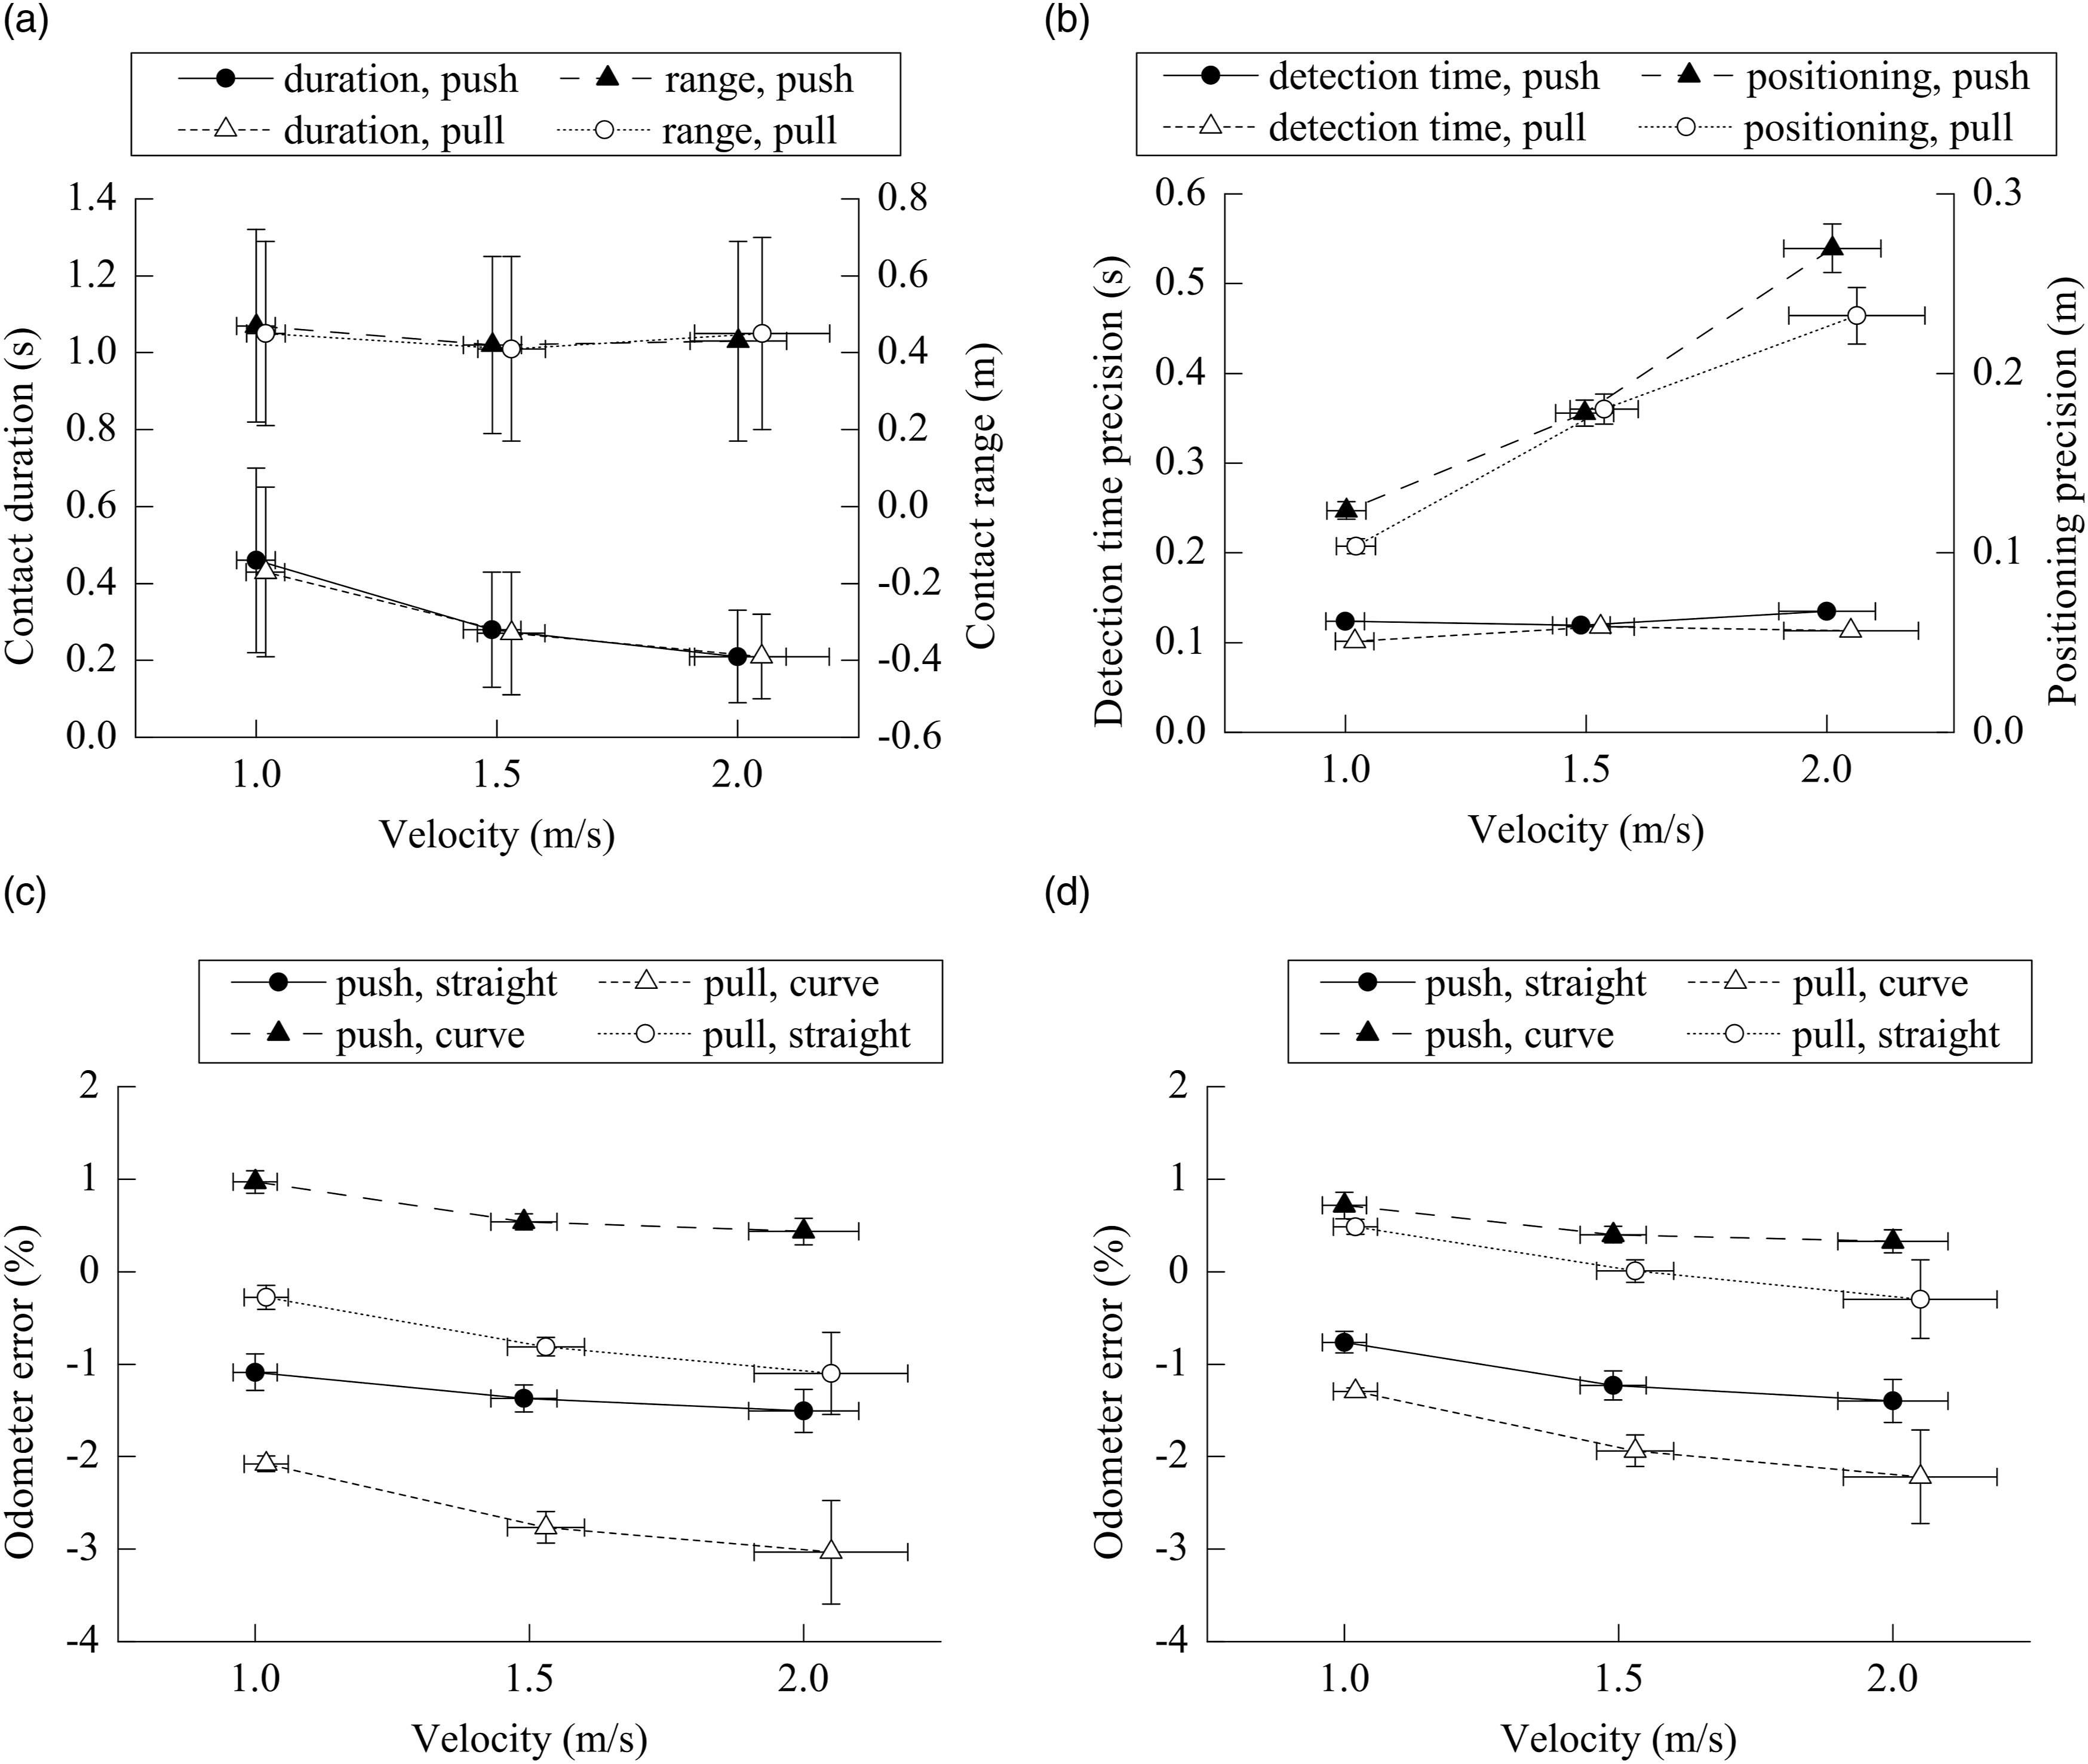
Detection time precision is the standard deviation of relative timestamps when an RFID tag is first detected. As Figure 7(b) indicates, the RFID tags were detected at expected timestamps with an approximately 0.1 s standard deviation which is nearly independent from speed. Multiplying this standard deviation with the given velocity gives a measure for the precision of discrete positioning which, when the wagon is pulled, amounts to 10 cm at 1 m/s and increases to 23 cm at 2 m/s. In push mode, the positioning precision appears to be slightly lower with 12 cm at 1 m/s and 27 cm at 2 m/s.
Overall, the RFID system performed satisfactorily with regard to the intended application, yet slightly worse within the framework of preliminary tests. Replacing the original RFID antenna by another model prior to the field tests might be one of the reasons as well as possibly different radiation pattern of the new antenna. Further parameters such as the distance between tag and antenna, the ambient background noise particularly in metal-mounted configurations, and the orientation of the tag toward the antenna, can affect the performance as well. 41 Whereas the orientation of the tags remained the same, the majority of sleepers at Obing station are steel, unlike at IFS. This could favour interference with the RFID system (865–868 MHz) due to reflections of signals from other possible transmitters e.g., LTE 800 MHz frequency band, wireless microphones (863–865 MHz) or social alarm systems (868–870 MHz). Also, a marginal difference in RFID performance was observed between push and pull mode. In the first case, both successful detection rate and number of responses per second were higher. When the shunting vehicle pushes, the antenna is located at the rear and detects the tag for the first time while it is still under the vehicle. It seems that charging the tag for the first time and consecutive times requires different amounts of energy. Since the sleepers and the vehicle’s underside are both made of steel, multiple reflections between them are conceivable which can accelerate the initial response. As the relative tag position is the reference system, no other sensor had been used to assess the absolute accuracy of the RFID based discrete positioning. Under the assumption of symmetric radiation pattern with respect to the antenna’s beam axis, the accuracy of the discrete positioning or the distance ahead of the antenna where it initially detects a tag can be estimated to approximately 22 cm (half of the measured contact range, Figure 7(a)). In our setup, the RFID performance will mainly depend on the antenna’s radiation power and vertical position. Due to the inverse-square law, we consider lowering the antenna position, as far as the minimum clearance outline allows, promising for better performance. For better precision, important positions/tags should be approached with lower velocity. The antenna’s gain was too low to detect any tag on the adjacent track and therefore it clearly facilitates a track-selective positioning of the vehicle.
Odometer performance
The odometer error was assessed by comparing the averaged accumulated distance to the RFID tag distance when it was first detected. Figure 7(c) shows the odometer error obtained from the stationary driving states which means the (de)acceleration phases and the transition between curved and straight track are excluded from evaluation. Overestimation leads to positive error values and negative values correspond to underestimation of the distance. As shown in Figure 5(b), it should be noted that when pushed or pulled, the odometer is at the rear or front of the train, respectively. The results show not only the difference in drift error between push and pull but also an almost constant error offset when transitioning from straight to curved track and vice versa. When the shunting vehicle pulled the wagon within the curved track, the odometer underestimated the distance by 2% at 1 m/s and by 3% at 2 m/s. Once it reached the straight section, the odometer error was −0.3% at 1 m/s and −1.1% at 2 m/s. An overestimation of the travelled distance only occurred when the wagon was pushed through the curved section. Overall, the odometer error ranges from −3% to 1% depending on the stationary driving state.
Not only does a common odometer on powered/braked wheels produce errors due to variable slip during acceleration/braking42,43 but also will the rubber wheels of the shunting vehicle (cylindrical ring) deform distinctly, resulting in a larger odometer error. Given the better accessibility and considering the aforementioned reasons, the target wheels of the odometer had been mounted on the trailing steel rail wheels. The profile geometry of rail wheels, however, also leads to variable rolling radii depending on the lateral displacement and angle of attack. The results confirm the largest odometer error on the outer front wheel in the curve of the test section due to flange contact (right target wheel during pull mode). Once the vehicle reaches the straight section, the error decreases significantly, yet it remains.
Usually, a single wheel-double axle running gear will asymptotically reduce its lateral displacement until the geometric lateral wheel forces on right and left cancel each other out, which means their contact points lie on the same tread inclination but not necessarily on the same rolling radius. Hence, this type of running gear can travel straight with a constant lateral displacement and different rotation speed between the right and left wheels. 44 As the ROTRAC E2 has an equivalent configuration of rail wheels, we consequently conjecture similar dynamics which can lead to discrepancy between the odometer speed of both sides even on straight track. Assuming a standard gauge of 1435 mm with 1:40 rail inclination for the track and considering the nominal geometries of the ROTRAC’s wheel configuration and its profile, the theoretical gauge clearance is about 21 mm. At maximum lateral displacement, where the wheel contact point on one side of the vehicle would reach the flange face for the first time, the rolling radius is 9.0% larger than nominal value. Thus, the rotation of that wheel will be slower and the associated odometer would underestimate the distance. In the meantime, the rail wheel with tread contact on the other side of the vehicle is subjected to a negligible change of rolling radius (−0.1%). Therefore, the averaged odometer error depending on the lateral displacement alone can theoretically reach −4.5% (underestimation of travelled distance). Furthermore, the significant increase of rolling radius due to lateral displacement causes the outer wheel to rotate slower in curves, particularly when preceding, even though it covers a larger distance compared to the inner wheel which seems contradictory at first glance. With an estimated curve radius of 250 m and the standard gauge, the outer wheel is supposed to run 0.6% faster than the inner wheel, yet the −9.0% increase of rolling radius due to lateral displacement outweighs. This error is probably lower in practice as, normally, the vehicle would not operate at its derailing limit and the elastic gear frame would allow for a small radial adjustment of the wheels in curves. Consequently, we suggest to use the higher speed value among the two odometer sensors instead of the average. As expected, this results in a reduction of the odometer error ranging from −2.2% to 0.7% as shown in Figure 7(d). However, the odometer error in curves due to differential speed between right and left is not cancelled out here. In addition, we suspect that the rubber wheels of the shunting vehicle resist lateral or centring forces to a certain degree owing to elastic deformation. It should be pointed out that the technical standard for road-rail vehicles of “category 9 C”, as is the case with ROTRAC E2, requires the rail wheels to support around 25% of the vehicle’s mass and the rubber wheels the remaining 75%. 45
The previously mentioned constant lateral displacement might have been further caused by a systematic error, which in turn, would reveal an offset of all values in Figure 7(c) and (d), or perhaps by a marginally unbalanced distribution of the drive torques of the allegedly synchronized motors. Latter could also possibly explain why the error becomes more significant at higher speeds should increasing power enhance this unbalance. Following factors, that may also contribute to the odometer error, have been neglected in the evaluation: (i) Change of wheel diameter due to wear; correct diameter was manually confirmed prior and after the field test. (ii) Deviation of the distance between two consecutive RFID tags (chord) from actual travelling distance (arc length) in curve; for 250 m curve radius, the arc is 0.002% longer than a 5 m chord. (iii) Longitudinal slip due to friction in rail wheel bearing. (iv) Reduction of the wheel’s longitudinal velocity when it runs obliquely. (v) Radial adjustment of the wheels due to elastic gear frame. (vi) Effect of coupled freight wagon on the vehicle dynamics.
Factors (iii) and (iv) are assumed to be negligible, yet (v) and (vi) should be investigated in future works to determine their individual contribution to the overall odometer error.
Nevertheless, the odometer appears to deliver more reliable velocity data compared to our RTK setup and optical sensor. Figure 8 shows the velocity-time diagram of a test round on the straight track section measured by the three different sensors. In general, the optical sensor underestimated the velocity. It yielded an averaged error of −5.4% ( Velocity measurements by odometer, RTK and optical sensor on straight track section.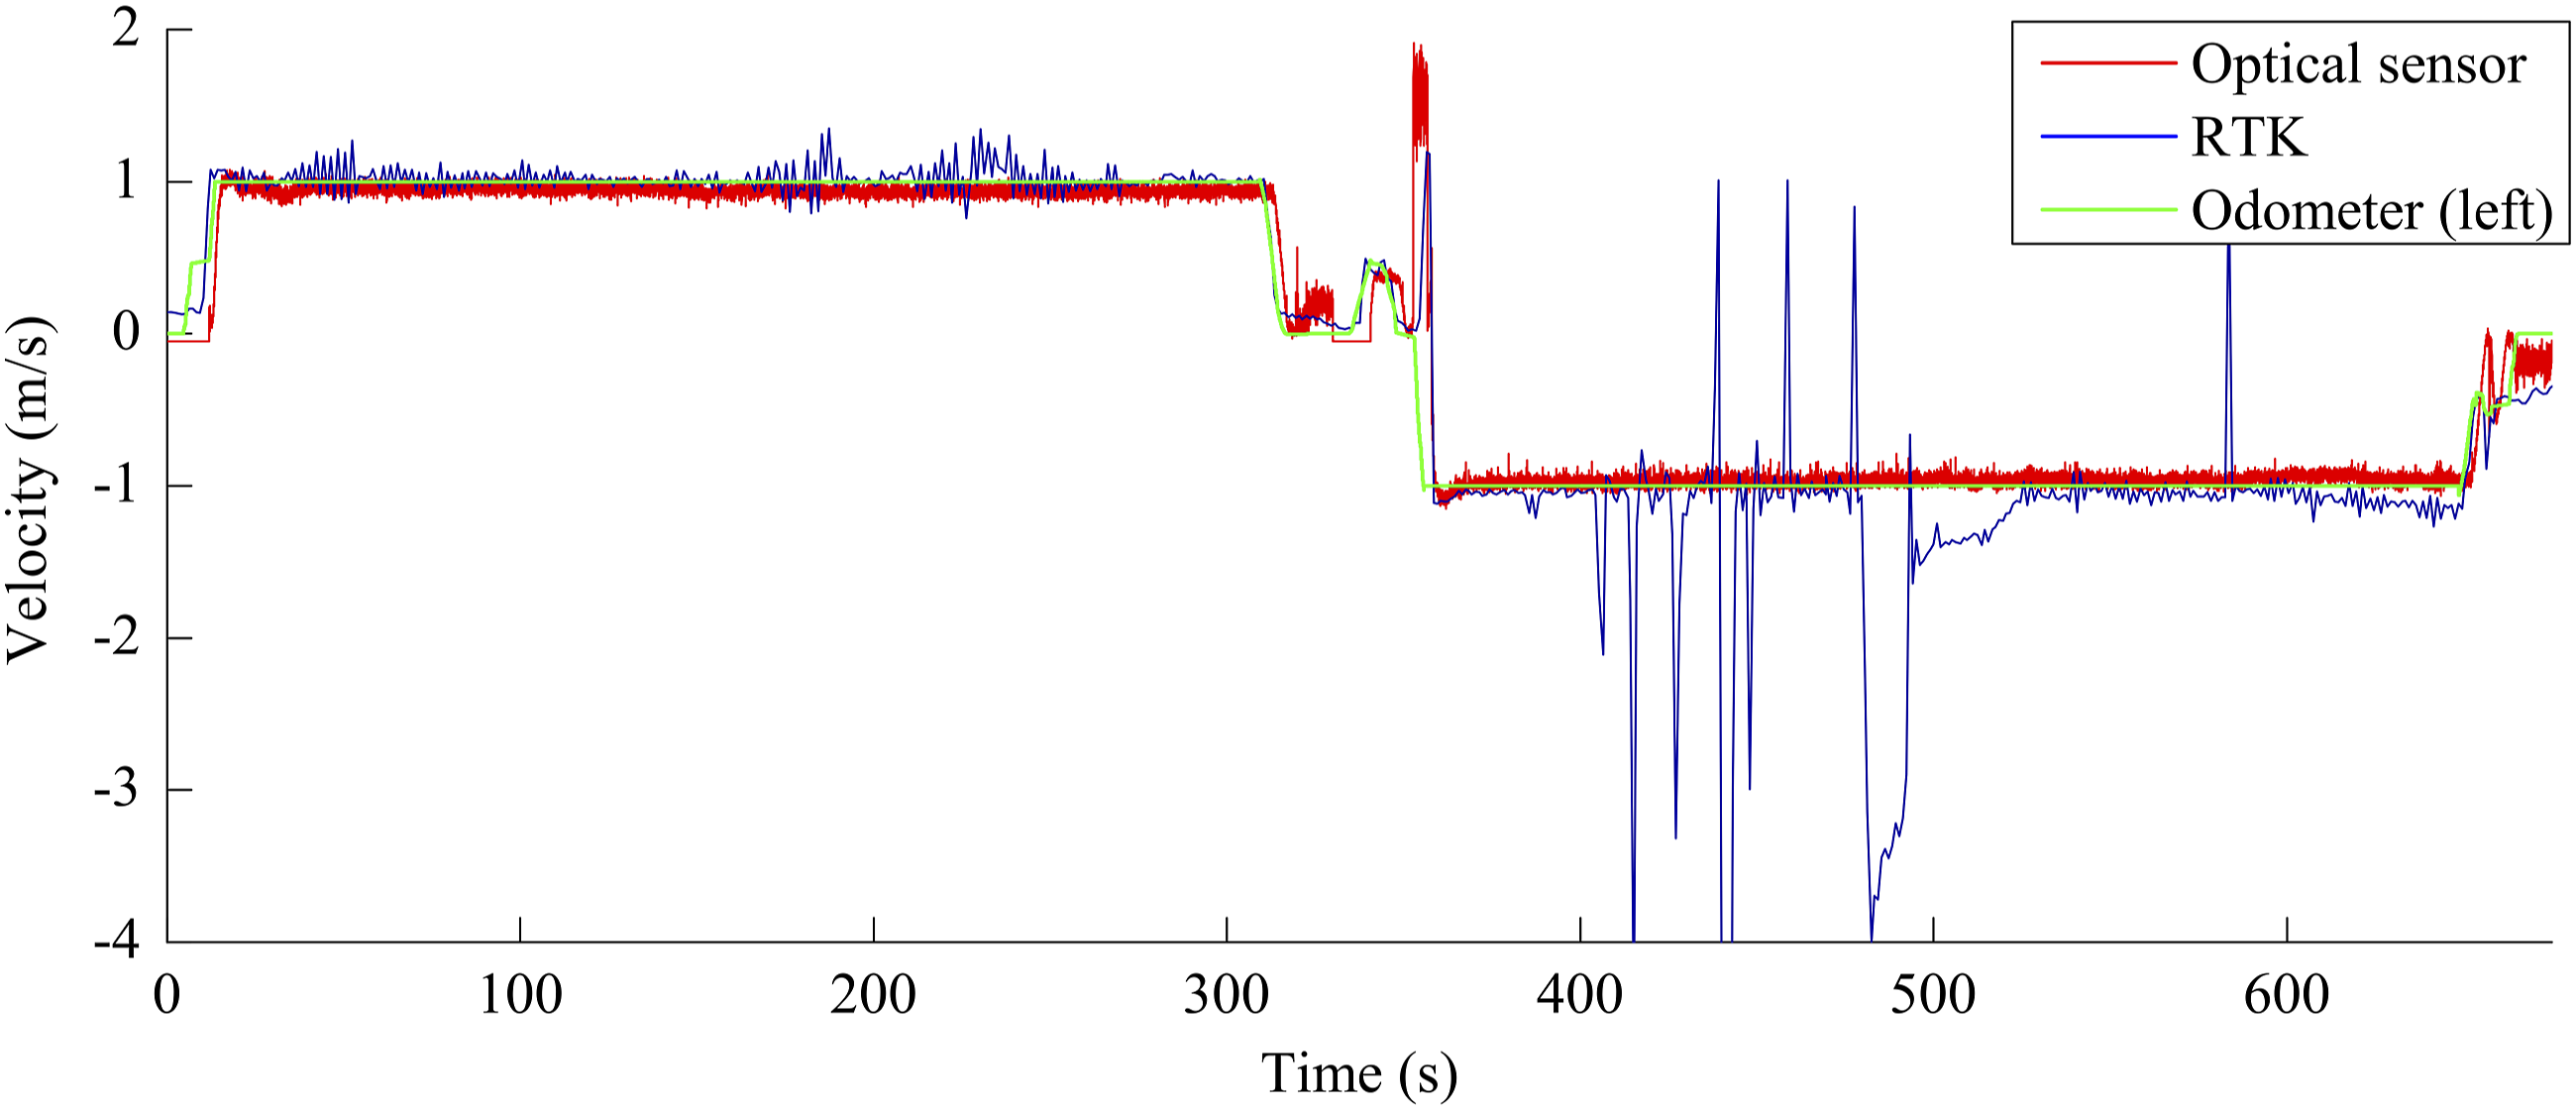
Combined positioning error and cost estimation
Figure 9 shows a qualitative positioning-error-time-graph for a stationary driving state, e.g., constant velocity Qualitative positioning-error-time-graph in a stationary driving state in case of 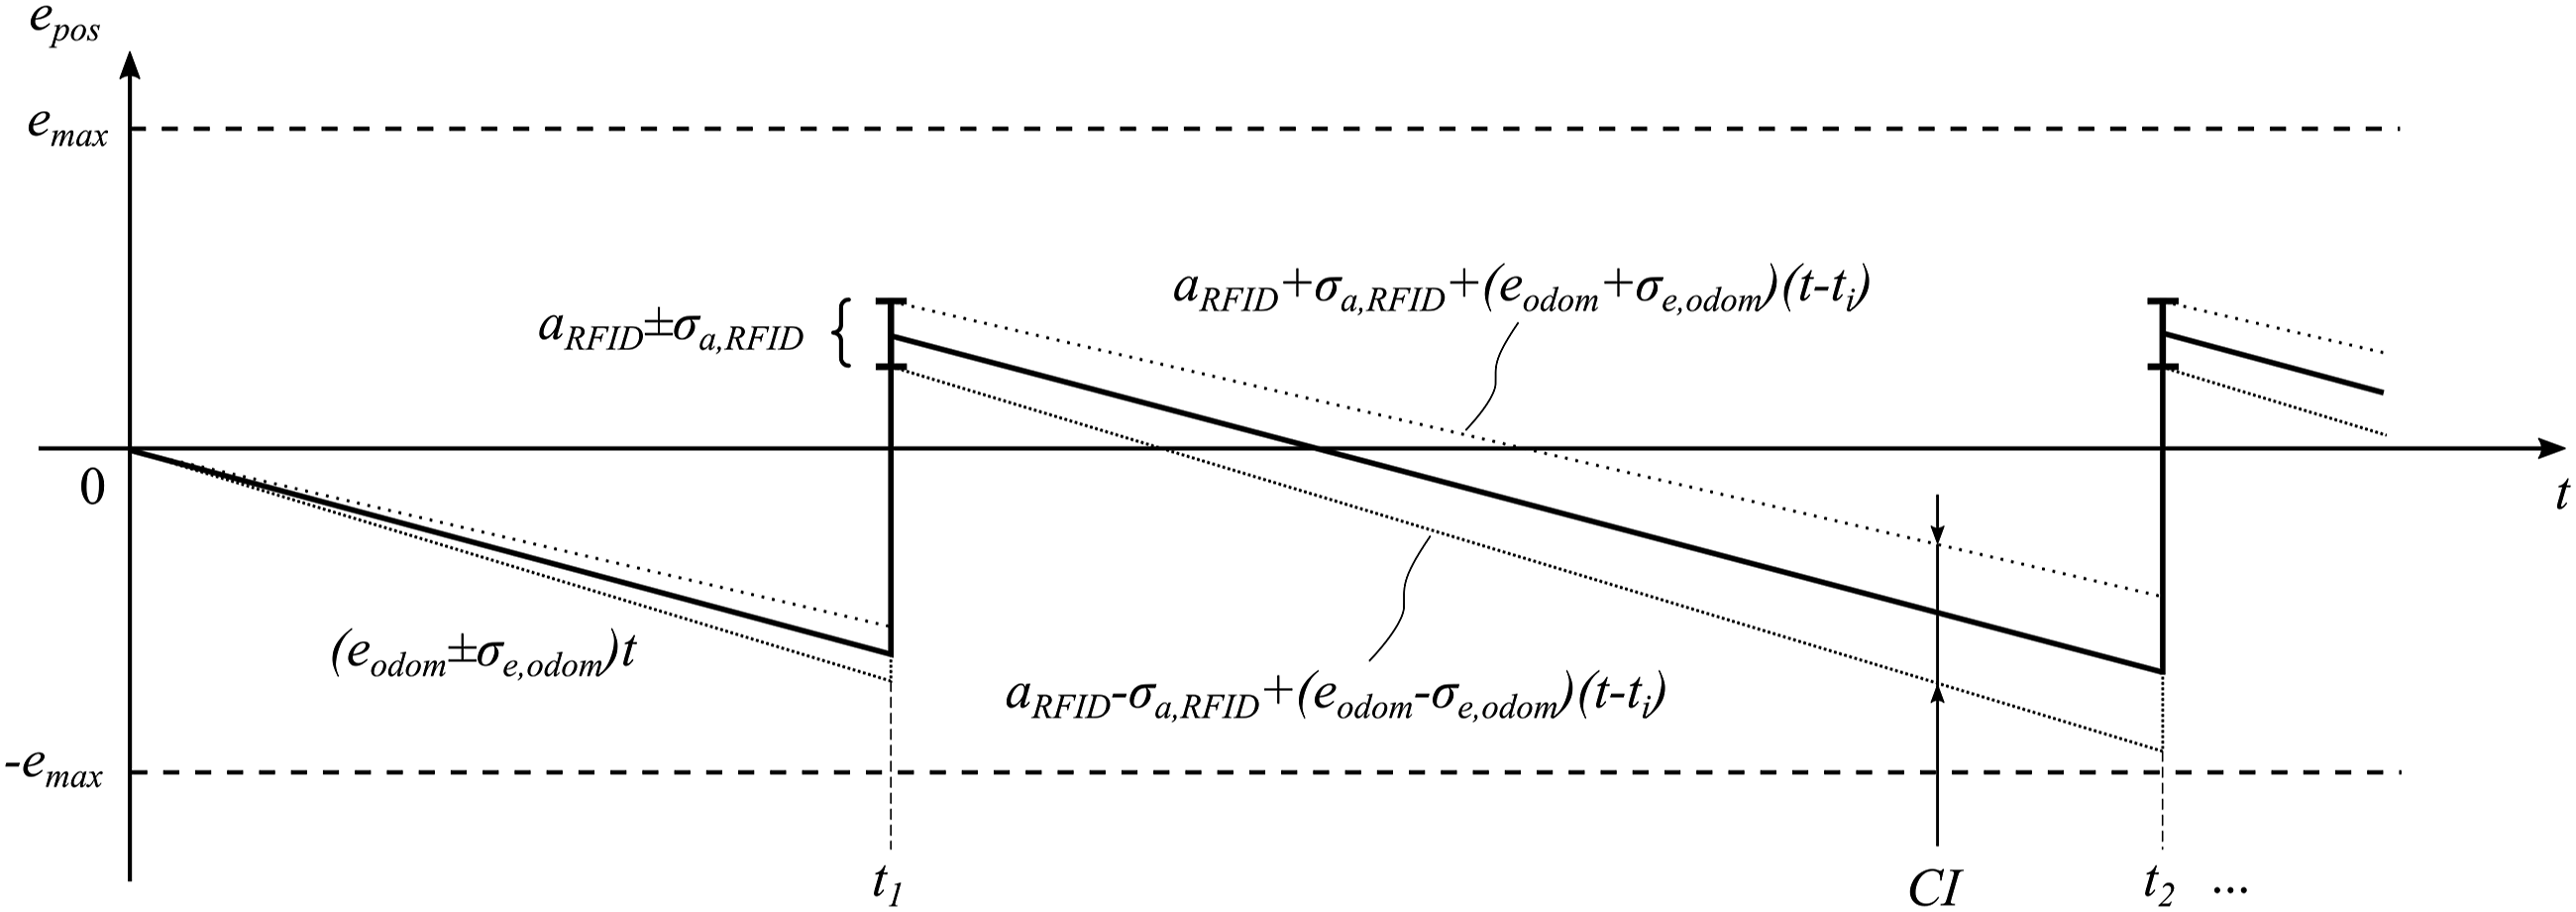
The material cost of our sensor setup totalled approximately EUR 2000 which represents the basic cost for our positioning system per shunting vehicle. In addition, the variable cost of the RFID tags amounts to EUR 40 per kilometre of railway track for the parameters given in this section.
Conclusion and outlook
A vehicle positioning system solely based on GNSS and its derivatives may not work reliably in a shunting environment. In order to resolve their disadvantages in our application, an alternative positioning system based on RFID and odometer was proposed in this paper. This system met our requirements successfully and ranks among the best in Table 1, even though most of them were meant to be used at higher velocities and admittedly, one has to take into account that applications in the fields of indoor logistics were not object of our research.
Aside from the achieved performance results, the RFID-odometer-based positioning system still has potential for improvements. On the one hand, using an RFID antenna with optimized radiation pattern or even an antenna array could yield a higher discrete positioning accuracy. On the other hand, for further increase of odometer accuracy, especially in curves, it is recommended firstly to obtain the rotation speed from the rear axle, and secondly to exclude the slower target wheel among right and left for incremental speed calculation. As mentioned above, as long as the other (faster) wheel has tread contact, its rolling radius does not deviate observably from the nominal tape circle radius. Alternatively, a cylindrical wheel solely for odometer could be implemented. An intelligent data fusion approach will be appropriate in either case. Finally, the influence of the freight wagon on the shunting vehicle dynamics, and the possible radial adjustment of the wheels due to elastic gear frame, should be investigated if the odometer data is further on obtained from rail wheels.
Footnotes
Acknowledgements
This work was carried out in cooperation with G. Zwiehoff GmbH, Rosenheim, Germany, as part of the funded joint research project “Automatisiertes Rangieren – AuRa”.
Declaration of conflicting interests
The author(s) declared no potential conflicts of interests with respect to the research, authorship, and/or publication of this article.
Funding
The author(s) disclosed receipt of the following financial support for the research, authorship, and/or publication of this article: The authors gratefully acknowledge the financial support (grant no. 01IS18014) from German Federal Ministry of Education and Research (BMBF), in compliance with a resolution of the German Bundestag.