
Abstract
This work aims at investigating how variations in measured stresses are affected by track conditions and, if possible, extract information on track conditions from onboard measurements. Axle bending strains measured in extensive field tests are employed to evaluate axle stress spectra. Correlation between stress spectra and parameters describing track design and condition for three sections of the Swedish mainline “Västra stambanan” have been investigated. The study shows how switches and other discontinuities in the track running surface increase the scatter of the stress spectra and increase the number of overloads. Circular and transition curves mainly increase stress amplitudes with magnitudes close to quasistatic conditions load. A decrease in track quality leads to both a shift of stress spectra towards higher values and a higher number of overloads. The influence of bridges/tunnels and decreased track stiffness were found to be difficult to distinguish from effects of curves, switches and crossings and track quality. If effects exist, they are likely to be small. Results from the study aids future track condition monitoring, maintenance planning of track and running gear, and the estimation of stress spectra for track stretches with known characteristics.
Introduction
Running gear maintenance is traditionally planned based on regular time intervals or depending on the mileage covered by the vehicle. However, such a scheduling approach lacks in flexibility as it does rarely account for the status of the rolling stock or for the operational conditions that the vehicle has been subjected to. To avoid the downsides entailed in current inspection practices, train operators are currently aiming at optimising their maintenance intervals according to the observed conditions of their assets. This strategy, which is referred to as condition-based maintenance, 1 allows to postpone maintenance if parameters used to quantify the deterioration of a certain asset fall within a “safe” range. This range can be prescribed by railway authorities or company practices, or be based on operational experience.
One assessment approach consists in interpreting data from railway vehicle on-board health monitoring systems. Li et al. 2 have reviewed some of these monitoring systems as well as some of the possible methods to interpret sensor data. A review of the on-board systems and techniques used for condition monitoring of freight railway vehicles was produced by Bernal et al. 3 The development of wireless sensor networks, broadband communication technologies and cloud computing is now generating new opportunities for applying Internet of Things (IoT) techniques in the railway industry. 4 Development is on-going regarding the design of new low-cost health monitoring systems and on possible algorithms to integrate measured data into predictive maintenance of assets. In particular, more research is needed on methods to extrapolate on-board measurements to obtain additional information on asset health status.
It should be noted that on-board measurements do not only give indications on the status of the vehicle, but can (perhaps even more efficiently) be used to monitor the status of the track. The correlation between track properties and response of on-board sensors has been studied in previous works. For example, dynamic wheel–rail contact forces have been measured using high-speed wheelsets equipped with strain gauges on the wheel discs. 5 These forces could then be correlated with measured rail corrugation. It was shown that dynamic excitations within the frequency range 100–1250 Hz can generate contact forces which contribute to the development of subsurface initiated rolling contact fatigue on wheels. Similar force measurements have been used to develop a track condition analyser (TCA). 6 This TCA is based on a machine learning algorithm which uses measured vertical and lateral wheel–rail contact forces to recognise some types of track irregularities and rail surface defects. The TCA can thus help in assessing track quality and the need for rail maintenance.
In other studies,7,8,9 acceleration signals measured from axle-boxes were correlated to the quality (in terms of vertical irregularities) of the track section on which the train was travelling. It was concluded that axle-box acceleration data provide a complementary assessment technique to track geometry inspections. In addition, axle-box accelerations can also be used to estimate the residual useful life of railway crossings. 10
As the above discussion works suggest, the advantage of using train on-board measurement lies in the possibility to simultaneously monitor health status of vehicle and track. Moreover, the use of sensors installed on commercial vehicles operating at nominal speed allows to cover large sections of the railway network in a relatively short time without disturbing scheduled train operations. The use of Instrumented Revenue Vehicles (IRVs) has been suggested as an alternative to track geometry measurement cars and/or wayside monitoring devices. 11 IRVs are characterised by measurement platforms which can be embedded on in-service standard revenue vehicles and are equipped with measuring systems and different types of sensors providing feedback on train operations. Spinola Barbosa 12 has suggested a method to complement traditional track geometric measurement methods with on-board vehicle dynamics measurements performed using inertial devices.
Many of the studies presented up to date are based on acceleration measurements. Accelerometers are relatively cheap and easy to install, but other measurement devices and methods are also available. One of these is instrumented wheelsets. Some examples of studies where instrumented wheelsets have been used to estimate track conditions have already been presented.5,6 In those studies, the instrumentation was used to estimate vertical and lateral wheel–rail contact forces. The measured forces can then be used to obtain service stress spectra.13,14
Work with connecting axle stress spectra to different track stretches was started 14 in order to optimise non-destructive test (NDT) intervals for railway axles. In Grubisic et al., 15 the operational loading of wheelset axles has been represented by cumulative frequency distributions (spectra) of service stresses obtained by summing up contributions from the service stresses measured for trains running over stretches of straight track, curved tracks and through switches and crossings. Measured axle bending stress spectra have been employed to assess the effects of wheel out-of-roundness (OOR) and rail roughness on axle stress magnitudes 16 and the effect of track conditions on axle fatigue life. 17
In the present work, the question related to the effects of variations in operational conditions on axle stress spectra is analysed more in depth. The different contributions to the spectra given by operational parameters such as number of curves, switches and crossings, track condition etc. Are investigated. One aim is to investigate how variations in measured stresses are affected by track conditions. A second aim is to enhance the interpretation of measured stress spectra in order to extract information on track conditions.
In this work, data in terms of axle bending strains have been gathered using an instrumented telemetry system. 16 Axle bending stress spectra derived from strains measured on different track sections have been used to estimate statistical distributions of axle stresses using the method presented in Maglio et al. 17 The obtained statistical distributions of axle stresses have been correlated to information on the corresponding track section obtained from the Swedish Transport Administration database BIS. 18 The same procedure has been applied also for conditions generating peak stress levels. The identified correlation between stresses measured in service and track characteristics can be used to predict stresses that (non-instrumented) wheelset experience during service on stretches where track characteristics are known. At the same time, variations in measured spectra can be used to discriminate between different track sections and to identify and quantify track deterioration before more traditional measurements of track geometry etc. Are performed. This can help both train operators and track owners in the transition to a condition-based maintenance approach.
Field test
The telemetry system
The telemetry system SmartSet®14,16 developed by Lucchini RS was used in the field test to monitor stresses at a specified section of an axle. This telemetry system consists of strain gauges and a telemetry module installed on the axle body, as well as of a data acquisition computer mounted on the vehicle body. In the present installation, two telemetry modules (each consisting of two full strain gauge bridges capable of measuring strains due to axle bending) are placed on the axle of a powered leading wheelset at a distance of 80 mm from the wheel seat. In this position the effect of the stress concentration at the wheel seat is negligible.
The telemetry module acquires data from the strain gauges and processes the signals using a rainflow count algorithm to identify strain cycles. For each strain cycle identified by the algorithm, strain mean values and amplitudes are stored. Measured strains can then be easily converted into stresses. A GSM antenna transfers strain values to a remote server when the train is at specific GPS locations. This allows to relate measured data to traffic on specific sections of the network. Stress spectra have been collected by the telemetry on-board PC unit between February 2019 and February 2022. Since March 2021, the telemetry system algorithm is also capable of identifying bending strains that exceed a threshold level (which can be fixed or adapted to measured strain levels). The corresponding strain (and, when transformed, stress) values are named “overloads”. Each time an overload is identified, a five-second strain history centred at the instant of the overload is saved. It is thus possible to analyse the axle stress history 2.5 s before and after the overload, which increases the possibility to understand the cause of the overload. Each time an overload or time history is stored, the corresponding date, time and GPS location are saved.
The instrumented train is an electric multiple unit (EMU) of type Coradia Duplex produced by Alstom and operated by the Swedish passenger train operator SJ. It consists of two or three double-decker coaches, and can operate in both running directions at a maximum speed of 200 km/h. The axle load acting on the instrumented wheelset is around 18.25 tonnes. The telemetry system has been installed on a powered wheelset located at one end of a regional train. The train operates both on high-speed main railway lines and on single-track regional railways in Sweden.
Overloads and stress time histories
In this work, bending stress values equal or higher than 75 MPa have been classified as overloads. A stress concentration factor kt = 1.26 was estimated for the axle T-notch. 17 This implies that a stress about 25% higher than the measured overload is induced in the most loaded section of the axle. By analysing the GPS locations of the overloads, it is possible to obtain information on the track sections which are most demanding for the running gear.
The analyses performed in this work focus on measurements from “Västra Stambanan” (the Western Main Line), a mixed traffic railway line connecting Gothenburg and Stockholm in Sweden. This railway line has a gauge of 1435 mm, a rail inclination of 1:30 and features continuously welded UIC60 rails and concrete sleepers resting on ballast. Rails are most frequently connected to the sleepers using Pandrol fastenings and rubber pads.
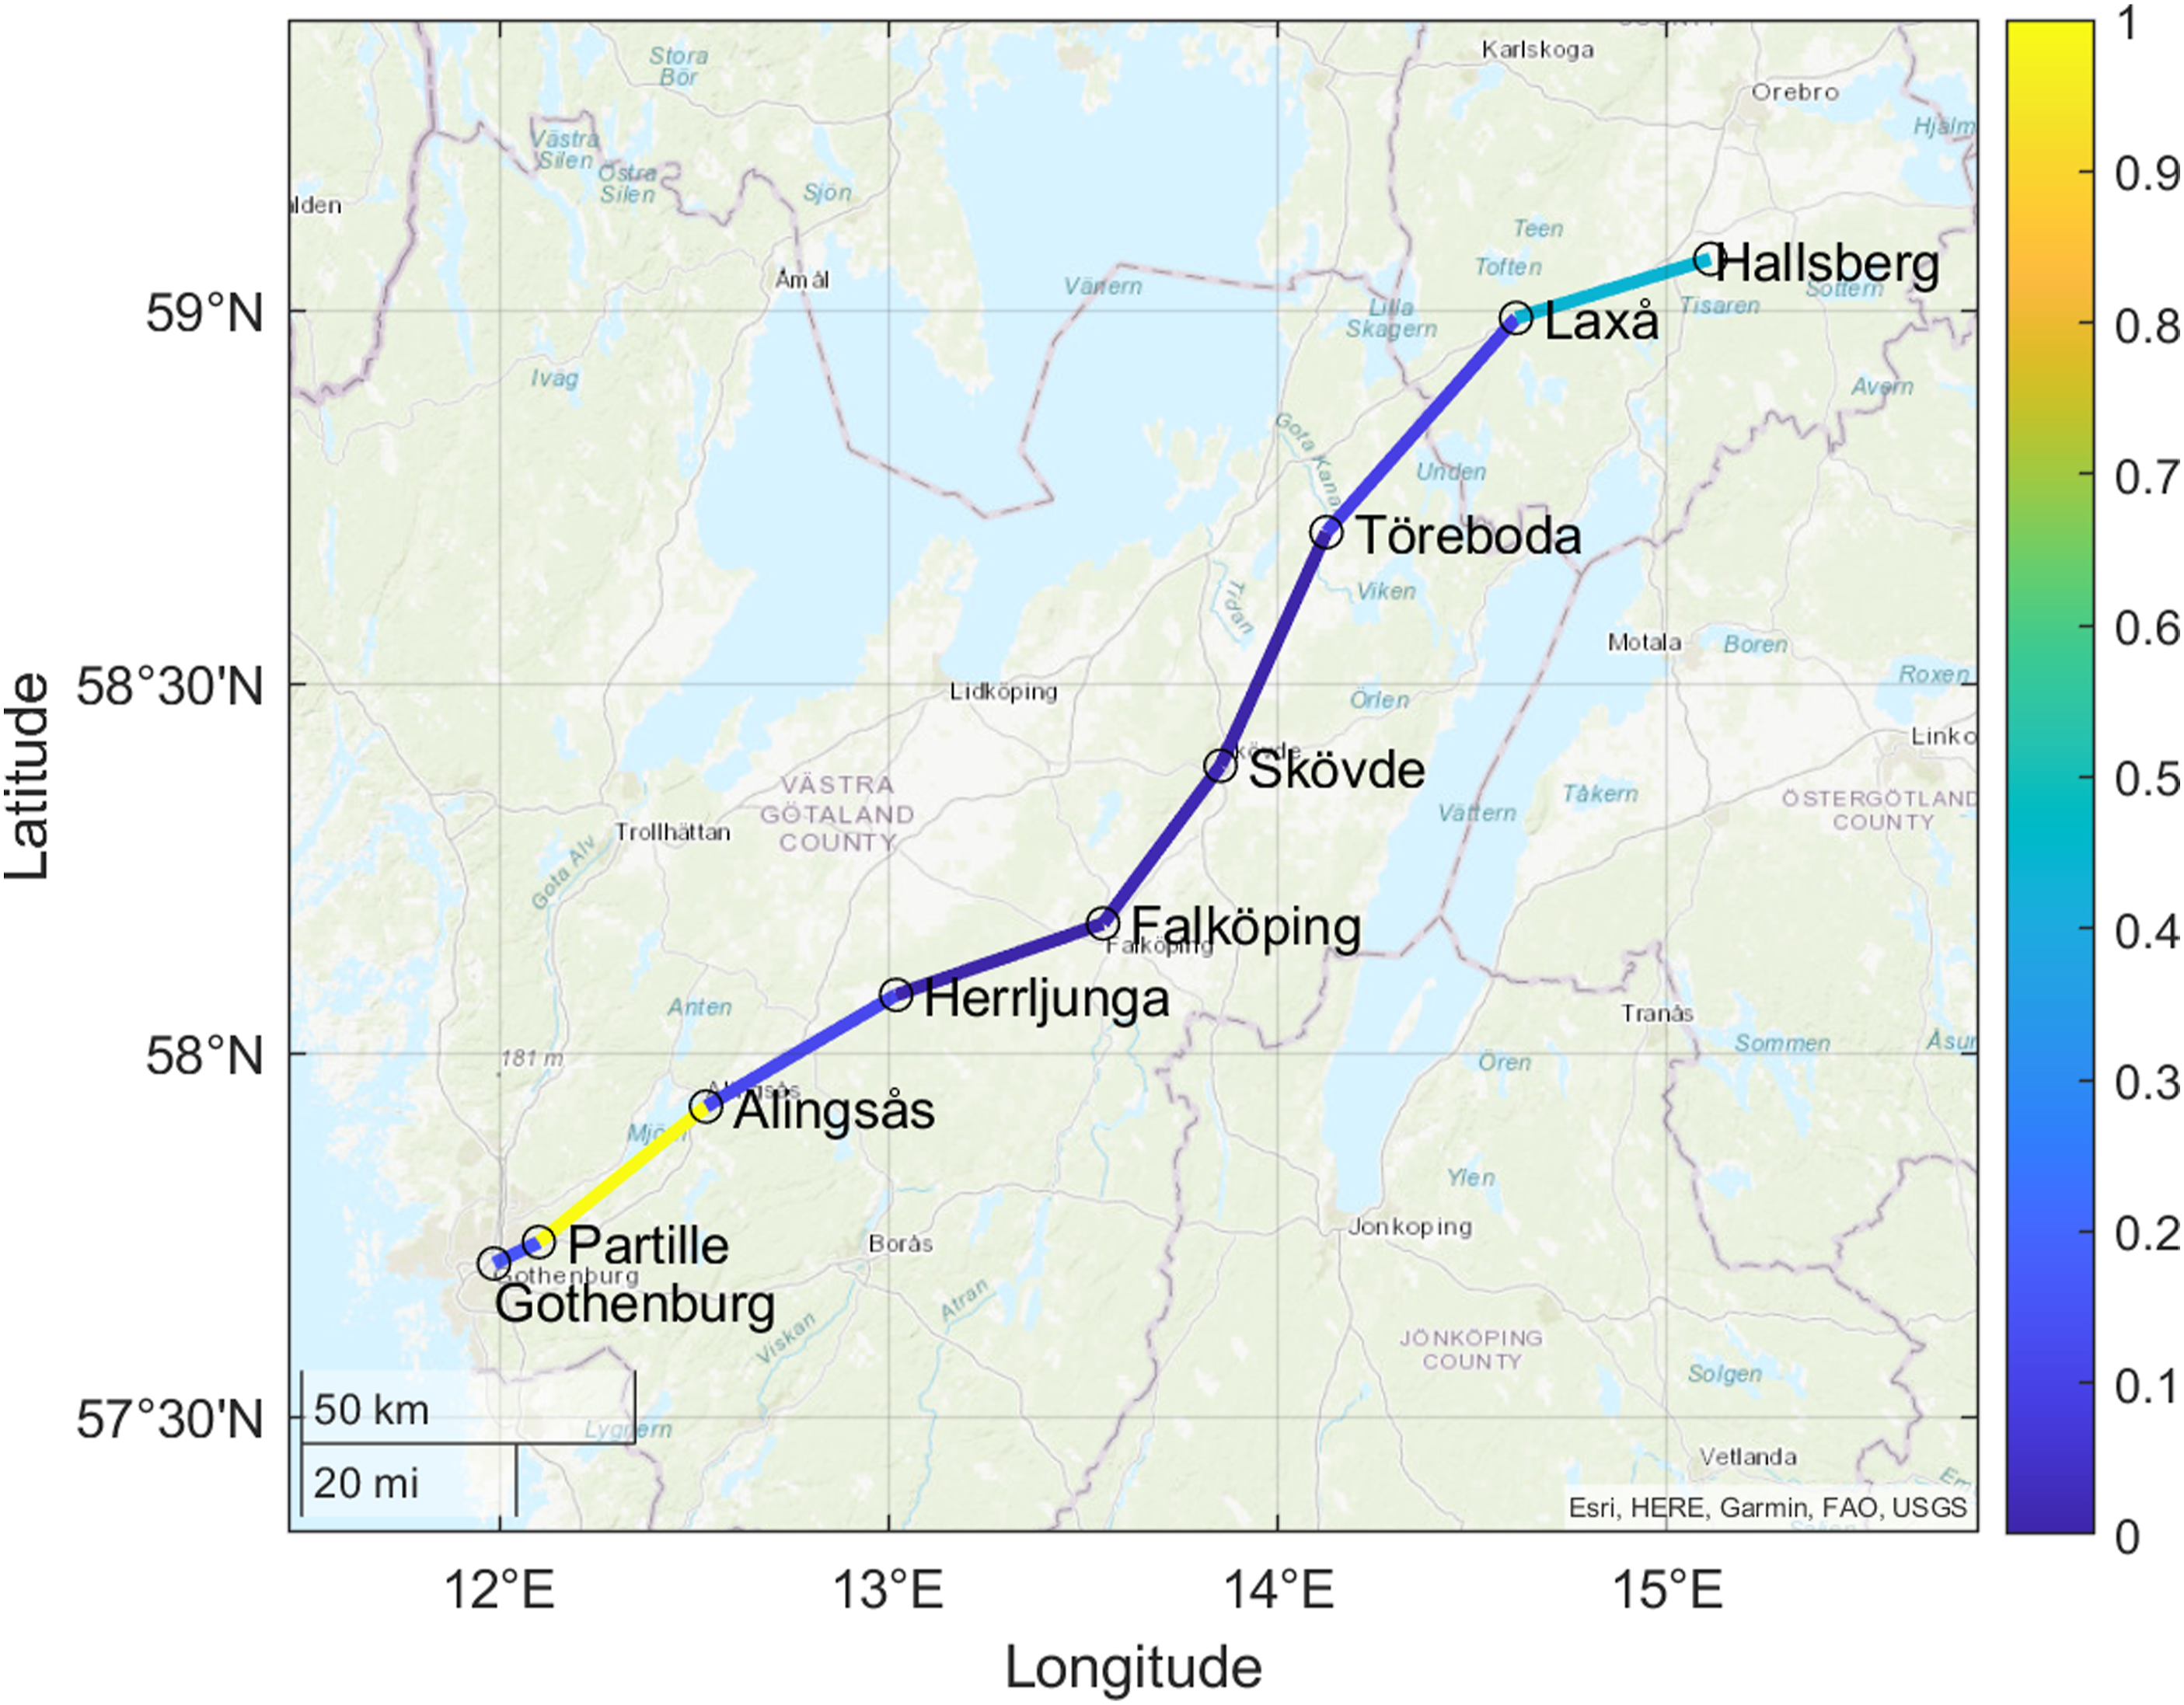
The instrumented train travels on this line between Gothenburg and Hallsberg. Information on overloads (nominal axle stresses >75 MPa) has been collected from March 2021 to February 2022 and the occurrence of overloads per kilometre for some sections of this line is plotted in Figure 1. The results, which have been normalised with respect to the section where most overloads per kilometre occur, show that the stretch between Gothenburg, Partille and Alingsås tends to be the most critical. This section is characterised by a higher frequency of narrow curves, transition curves and switches and crossings. Track characteristics will be more thoroughly linked with measured overloads in Chapter 3. Occurrence of overloads (nominal axle stresses >75 MPa) per kilometre for some stretches of Västra Stambanan. Data are normalised with respect to the stretch Partille–Alingsås, where most overloads per kilometre are registered. Picture produced using MATLAB mapping toolbox.
19
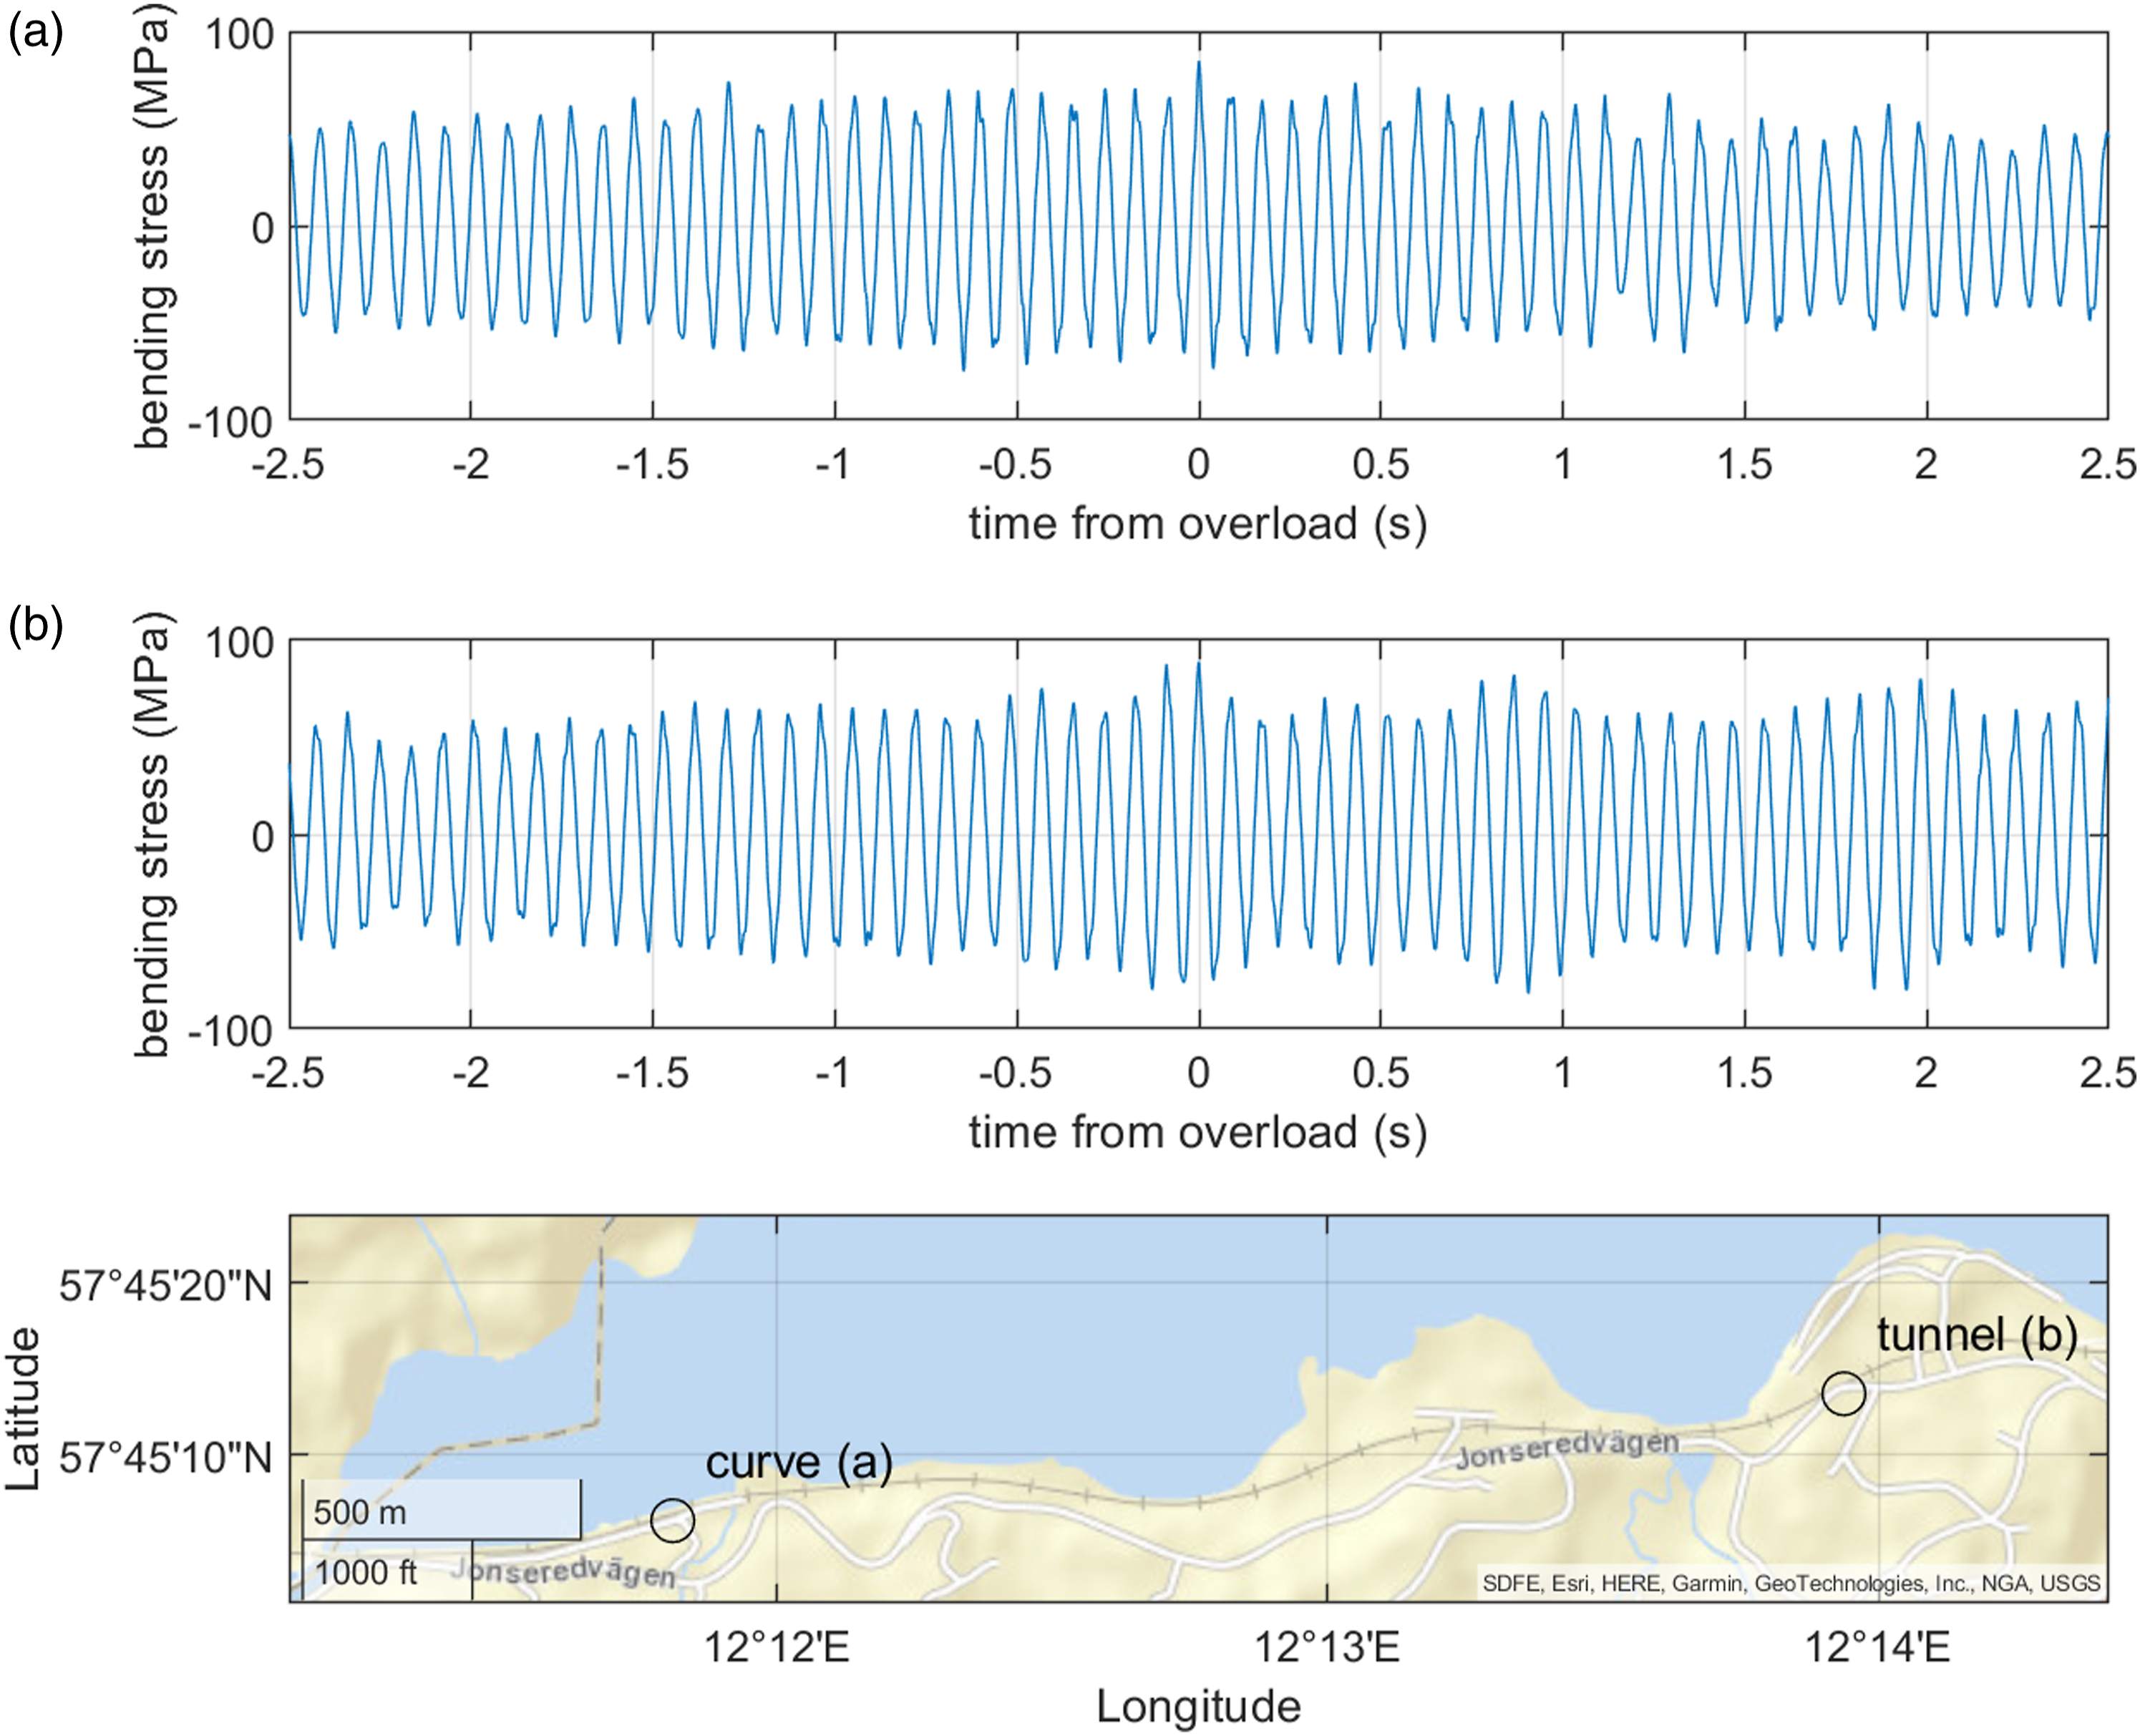
For the Partille–Alingsås stretch, many overloads are registered by lake Aspen close to Lerum, where the train has to negotiate narrow curves. A map of that stretch and two stress time histories are shown in Figure 2. Figure 2(a) shows the stresses registered by the telemetry when the train is negotiating a circular curve with a radius of 581 m while Figure 2(b) shows stresses measured when the train is travelling in a tunnel while negotiating a transition curve connecting two circular curves with radii respectively of 585 m and 583 m with opposite curvatures. The train speed for the whole track section is 135 km/h. The locations where overloads for the circular curve and the tunnel have been registered are indicated on the map in Figure 2. It is seen that, when the train is negotiating the circular curve, axle stress amplitudes increase regularly over time and then decrease after the stress peak. In contrast, when the train is negotiating the transition curve in the tunnel, more oscillations over time in the stress amplitude values are generated. It should be noticed that stress time histories in Figures 2(a) and (b) result in similar stress amplitude spectra, which indicates that the tunnel does not seem to induce any additional increase in stress magnitudes in addition to the effect of the (transition) curve, see Section 3.4. Measured time histories of axle bending stresses for a train ride over (a) a circular curve (R = 581 m) and (b) a transition curve (R = 585 m–583 m) in a tunnel. The locations where peak loads have been registered for the two cases are marked in the map produced using MATLAB mapping toolbox.
19
Stress spectra
Stresses have been plotted in terms of relative frequency of occurrence to facilitate the comparison between stretches of different lengths. This “relative frequency” has been obtained by dividing the number of cycles falling within a stress amplitude bin with the total number of stress cycles measured during a given train ride. Cycles with measured stress amplitudes below 20 MPa have been removed from the plots as these may be the result of spurious oscillations in the voltage of the telemetry system.
As the train can travel in both directions and as the instrumented axle is located at one end of the train, the instrumented wheelset is either the very first or the very last wheelset to negotiate curves and switches. Since the first wheelset in the train suffers from higher wheel–rail contact forces, 20 larger stress amplitudes are registered when the instrumented wheelset is in a leading position. 17 This affects the measured stress magnitudes. As higher stresses can have much more detrimental effects from a fatigue life perspective, the spectra presented in this paper will be based on measurements obtained when the instrumented wheelset is in the leading position.
To properly account for the effect of mean stresses, equivalent amplitudes according to the Smith-Watson-Topper (SWT) criterion 21 are used in the analyses. As the telemetry measurements are dominated by bending stresses, mean stress values are relatively low and stress spectra consisting of SWT amplitudes are only shifted some 1–2 MPa towards higher values compared to spectra consisting of pure stress amplitudes. 17
Stress spectra obtained from measurements performed between March 2021 and February 2022 for three different sections of Västra Stambanan (Gothenburg–Alingsås, Herrljunga–Skövde and Laxå–Hallsberg) are plotted using thick dashed red lines in Figure 3. Being part of the same line, the two sections are expected to undergo similar maintenance. Among the track sections shown in Figure 1, these sections have been selected as Gothenburg–Alingsås is the stretch where most overloads per kilometre are registered, Herrljunga–Skövde is characterised by a low number of overloads and Laxå–Hallsberg represents an intermediate case. Relative occurrence of measured SWT equivalent stress amplitudes, the probability distributions P1, P2 and Pmid and the resulting statistical model of the stress spectra obtained for the railway lines (a) Gothenburg–Alingsås, (b) Herrljunga–Skövde, and (c) Laxå–Hallsberg. The black vertical dashed lines and the black vertical dotted lines indicate the stress intervals in which P1 and P2 are respectively used to determine the statistical model of stress spectra.
19
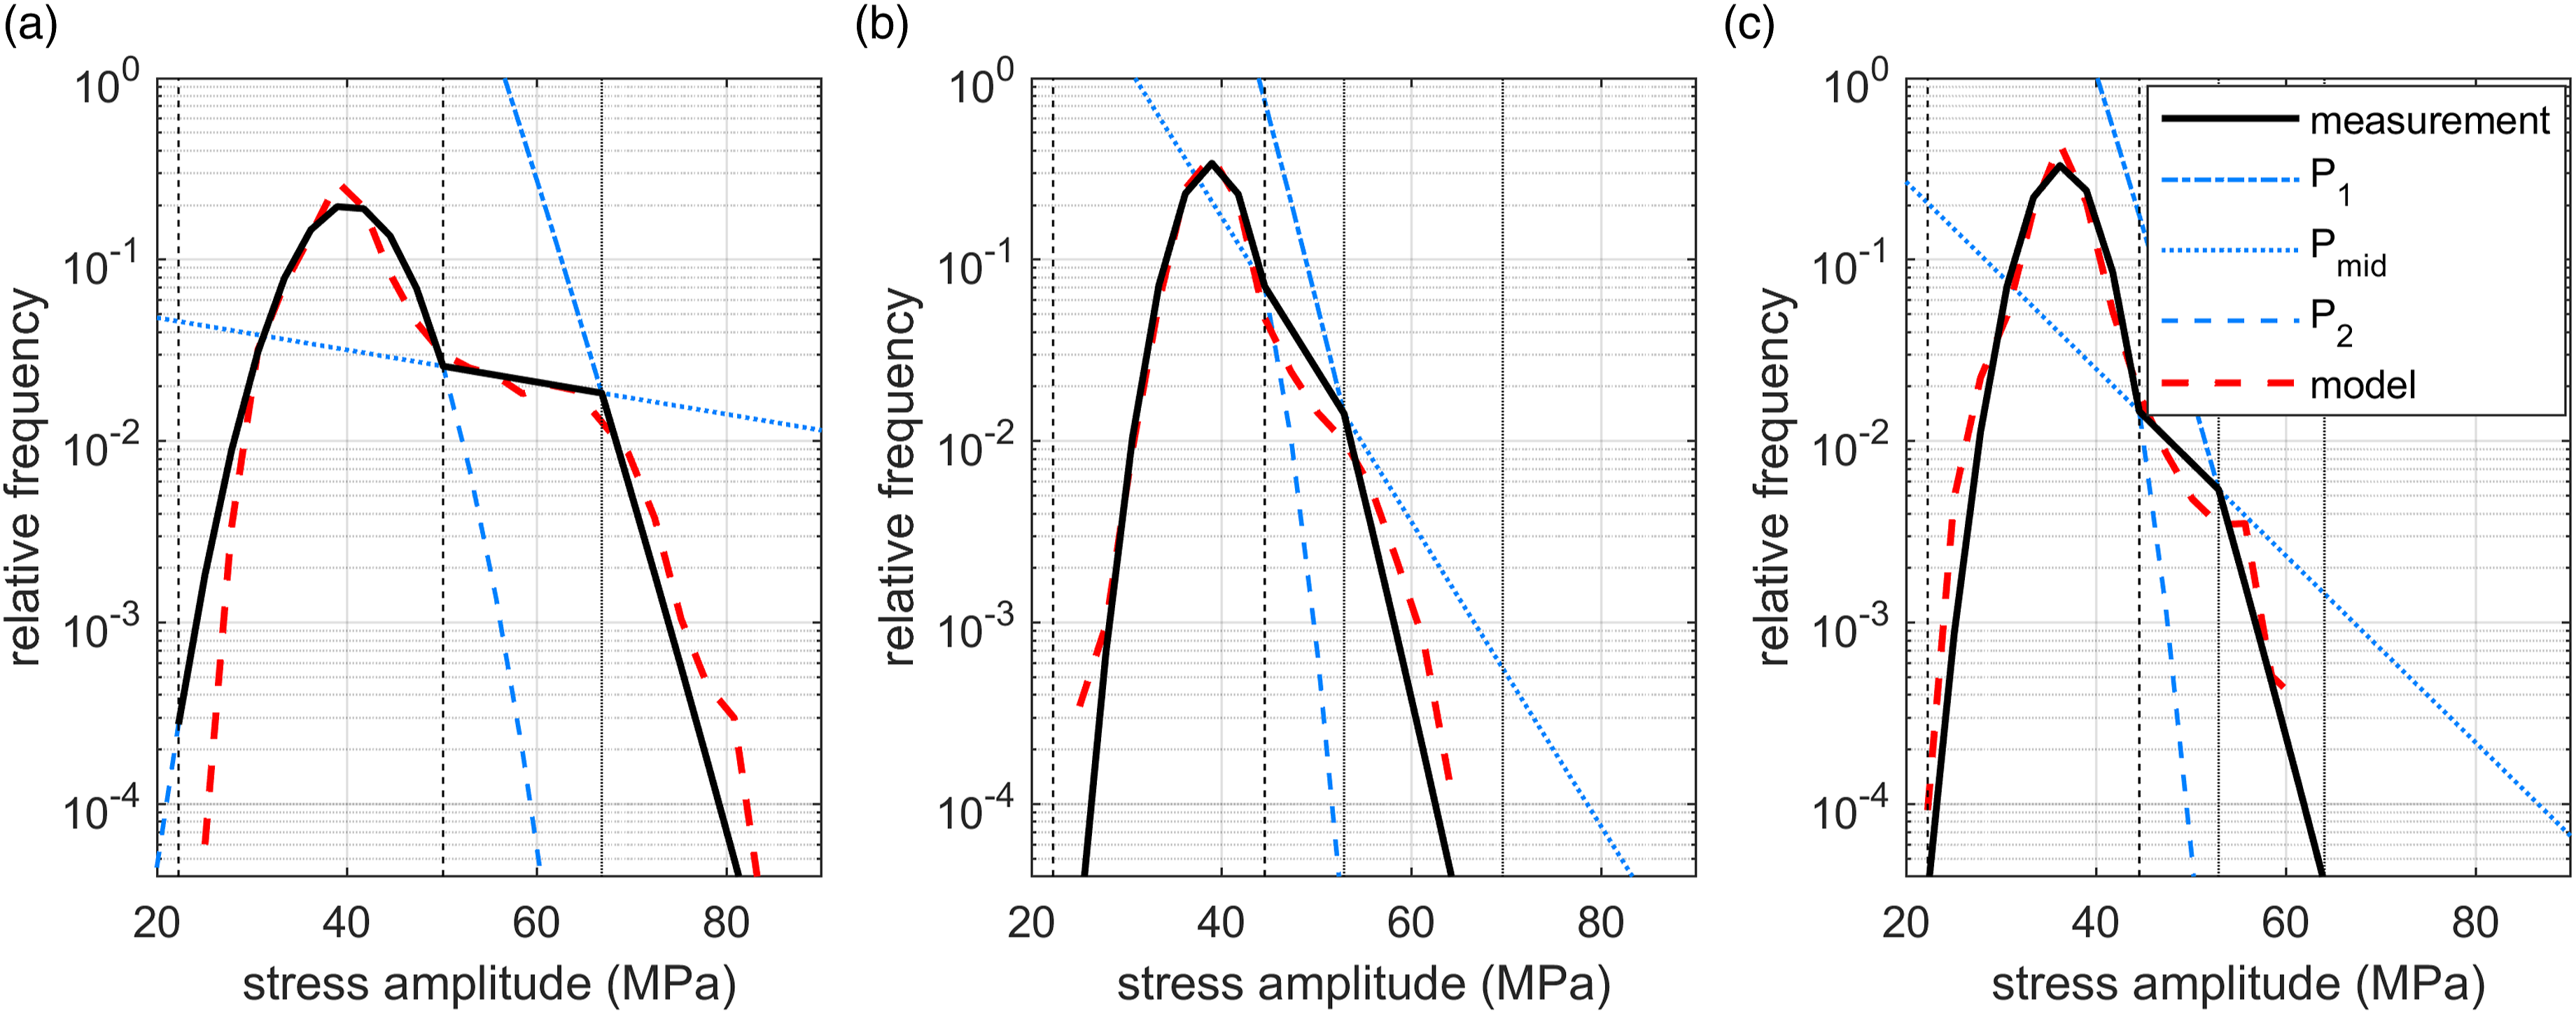
The method presented in Maglio et al. 17 has been used also in this work to fit two truncated normal distributions, named P1 and P2, respectively to the first and last parts of each stress spectrum. The part of the stress spectrum located between the two truncated distributions has been modelled by a straight line in the semilogarithmic diagrams resulting in the distribution Pmid, see Figure 3. In this work, the parameters describing the statistical distributions P1 and P2 will be correlated to track characteristics.
From Figure 3 it can be noticed that equivalent stress amplitudes mainly fall between 35 MPa and 40 MPa, regardless of the travelling route. This is expected as most of the equivalent stress amplitudes are only influenced by the (quasi-)static load acting on the axle, which depends on the weight of the train and not on the specific route. However, the rapid decrease of the relative frequency of occurrence of the equivalent stress amplitudes starts at different amplitude levels depending on the track section. These variations can be linked to differences in track properties as will be studied more in detail in Chapter 3.
Correlation with track properties
Information on track properties (amount of switches, length and radii of circular and transition curves, rail surface quality, presence of bridges and tunnels) has been obtained for “Västra stambanan” from the Swedish Transport Administration systems BIS 18 and Optram. 22 In this chapter, these properties have been correlated with measurement data registered by the instrumented wheelset.
Presence of switches
The number of switches per kilometre for the three studied stretches has been compared to the mean values and standard deviations of the distributions P1 and P2 that were fitted to the stress spectra of Figure 3. No correlation was found between the number of switches and the mean values of distributions P1 and P2, but a matching trend was found for the standard deviations, see Figures 4(a) and (b). This indicates that a large number of switches increases the dispersion of stress amplitudes in the measured spectra. In particular, Figure 4(b) shows that a very good fit can be observed between the standard deviation of distribution P2 and the amount of switches. In contrast, Figure 4(a) indicates that there needs to be a very large number of switches to influence the standard deviation of P1. This indicates that switches (not surprisingly) generate high stress levels that generally affects the “peak load distribution” P2. With the number of switches per kilometre is sufficiently high, the influence of the “low contributing switches” will make this effect spill over also to the “nominal load distribution” P1. Correlation between number of switches per kilometre and statistical parameters for the three track sections studied in this paper: (1) Gothenburg–Alingsås, (2) Herrljunga–Skövde, and (3) Laxå–Hallsberg. The subfigures show (a) standard deviation of distribution P1, (b) standard deviation of P2, and (c) stress levels at which P1 and P2 are truncated.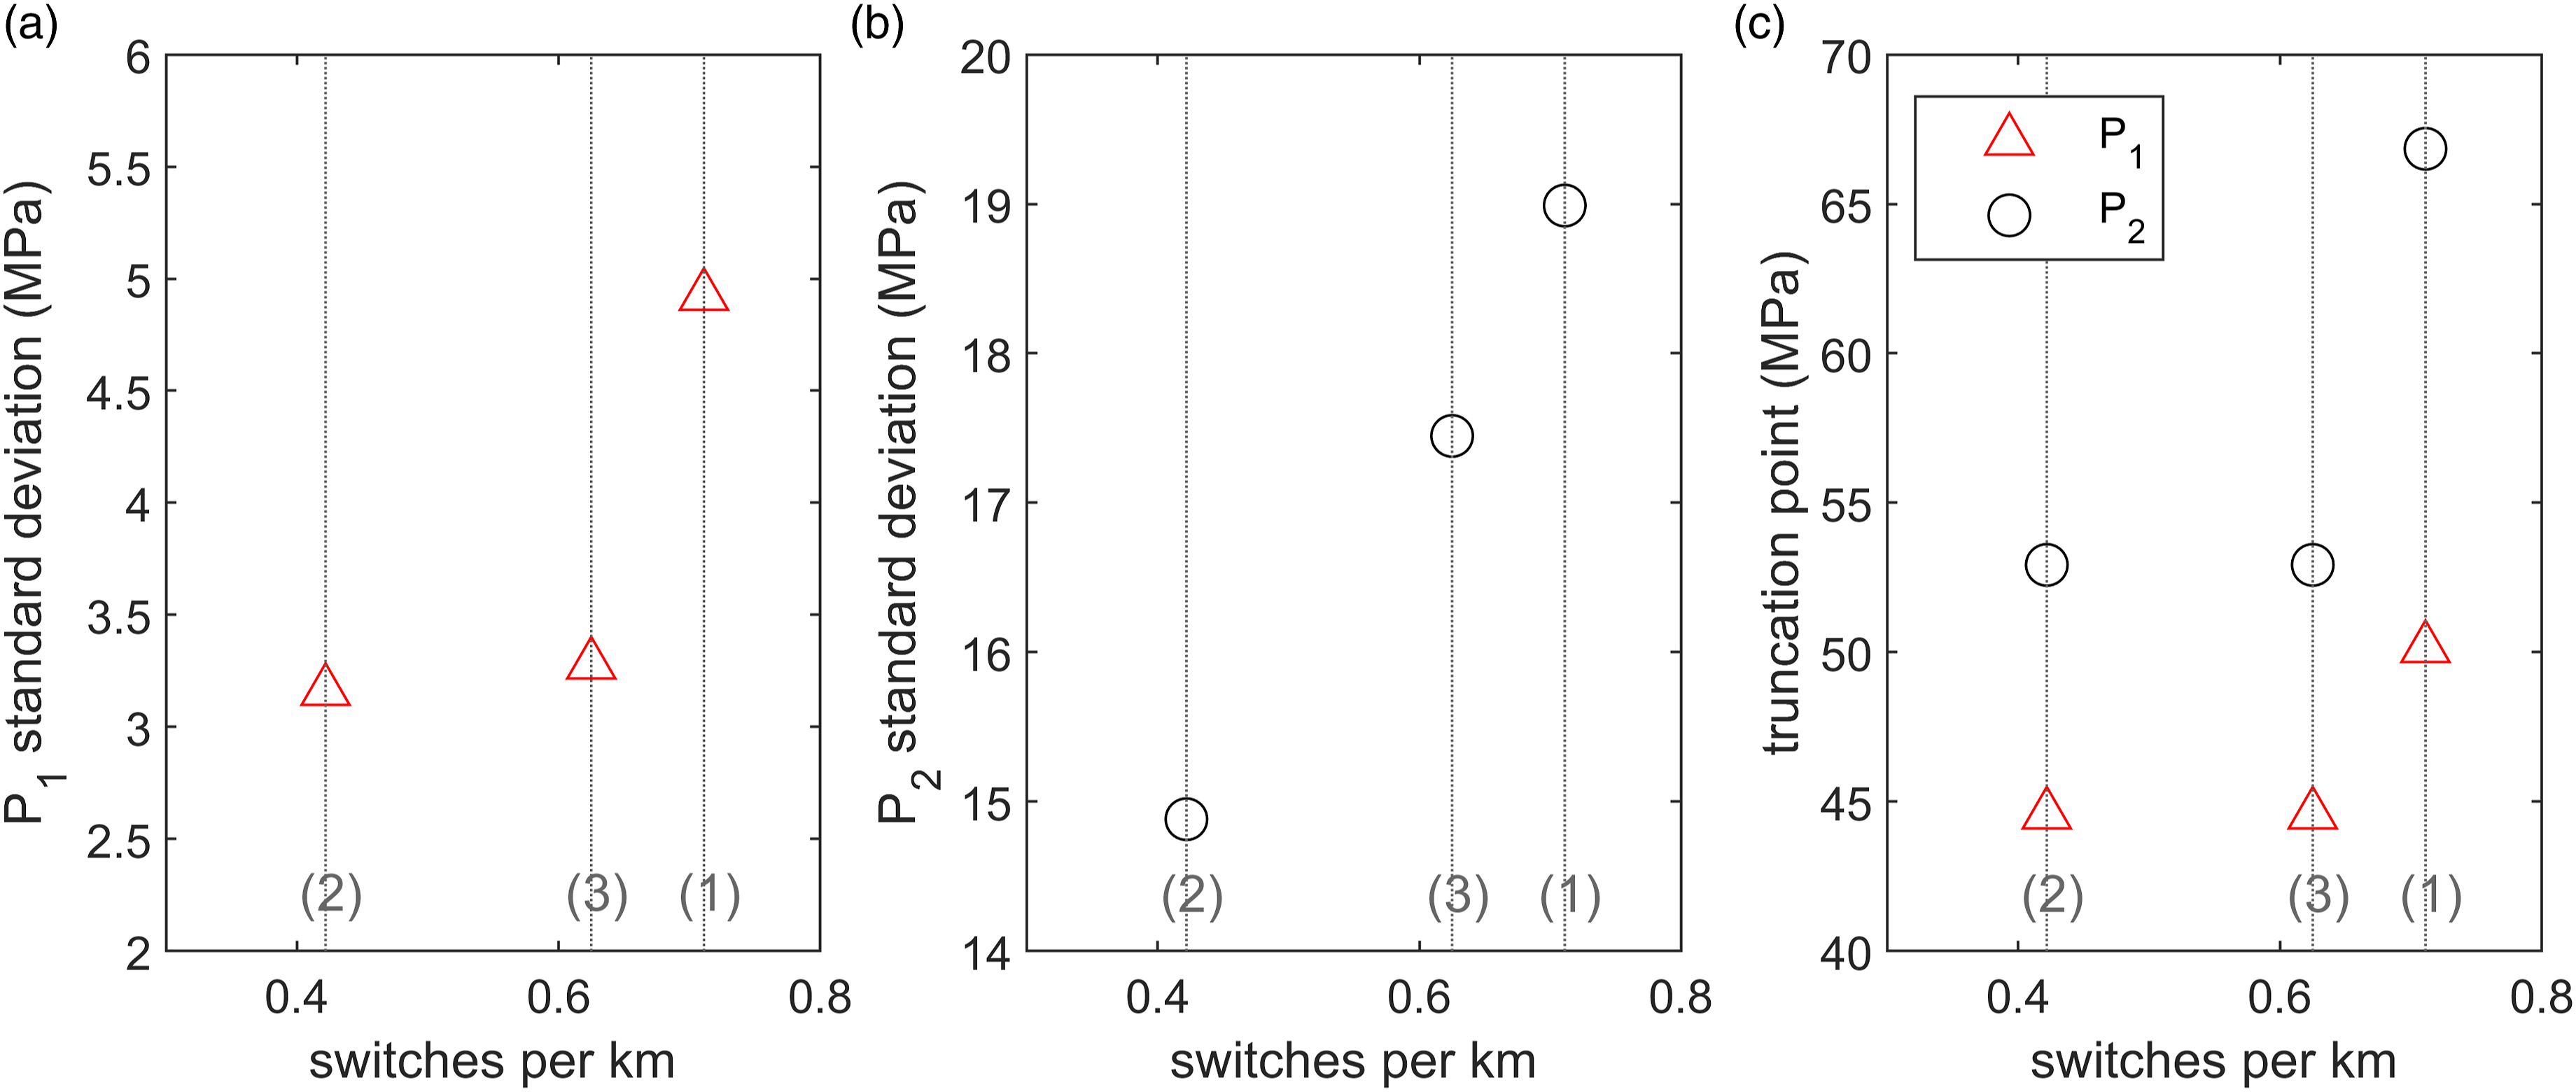
This also explains why a correlation can be found between the stress levels at which distributions have been truncated and the number of switches per kilometre, see Figure 4(c). The conclusions have been further confirmed when the amount of switches has been compared to the overloads registered by the telemetry on the three stretches. Overload occurrences have been divided in four different levels (for peak stresses respectively higher than 75, 80, 85 and 90 MPa). Figure 5 shows that the number of registered overloads clearly increases as the amount of switches increase. This is valid for all the studied stress levels up to 90 MPa, above which very few overloads are registered. Correlation between number of switches per kilometre and the number of overloads for the three track sections: (1) Gothenburg–Alingsås, (2) Herrljunga–Skövde, and (3) Laxå–Hallsberg.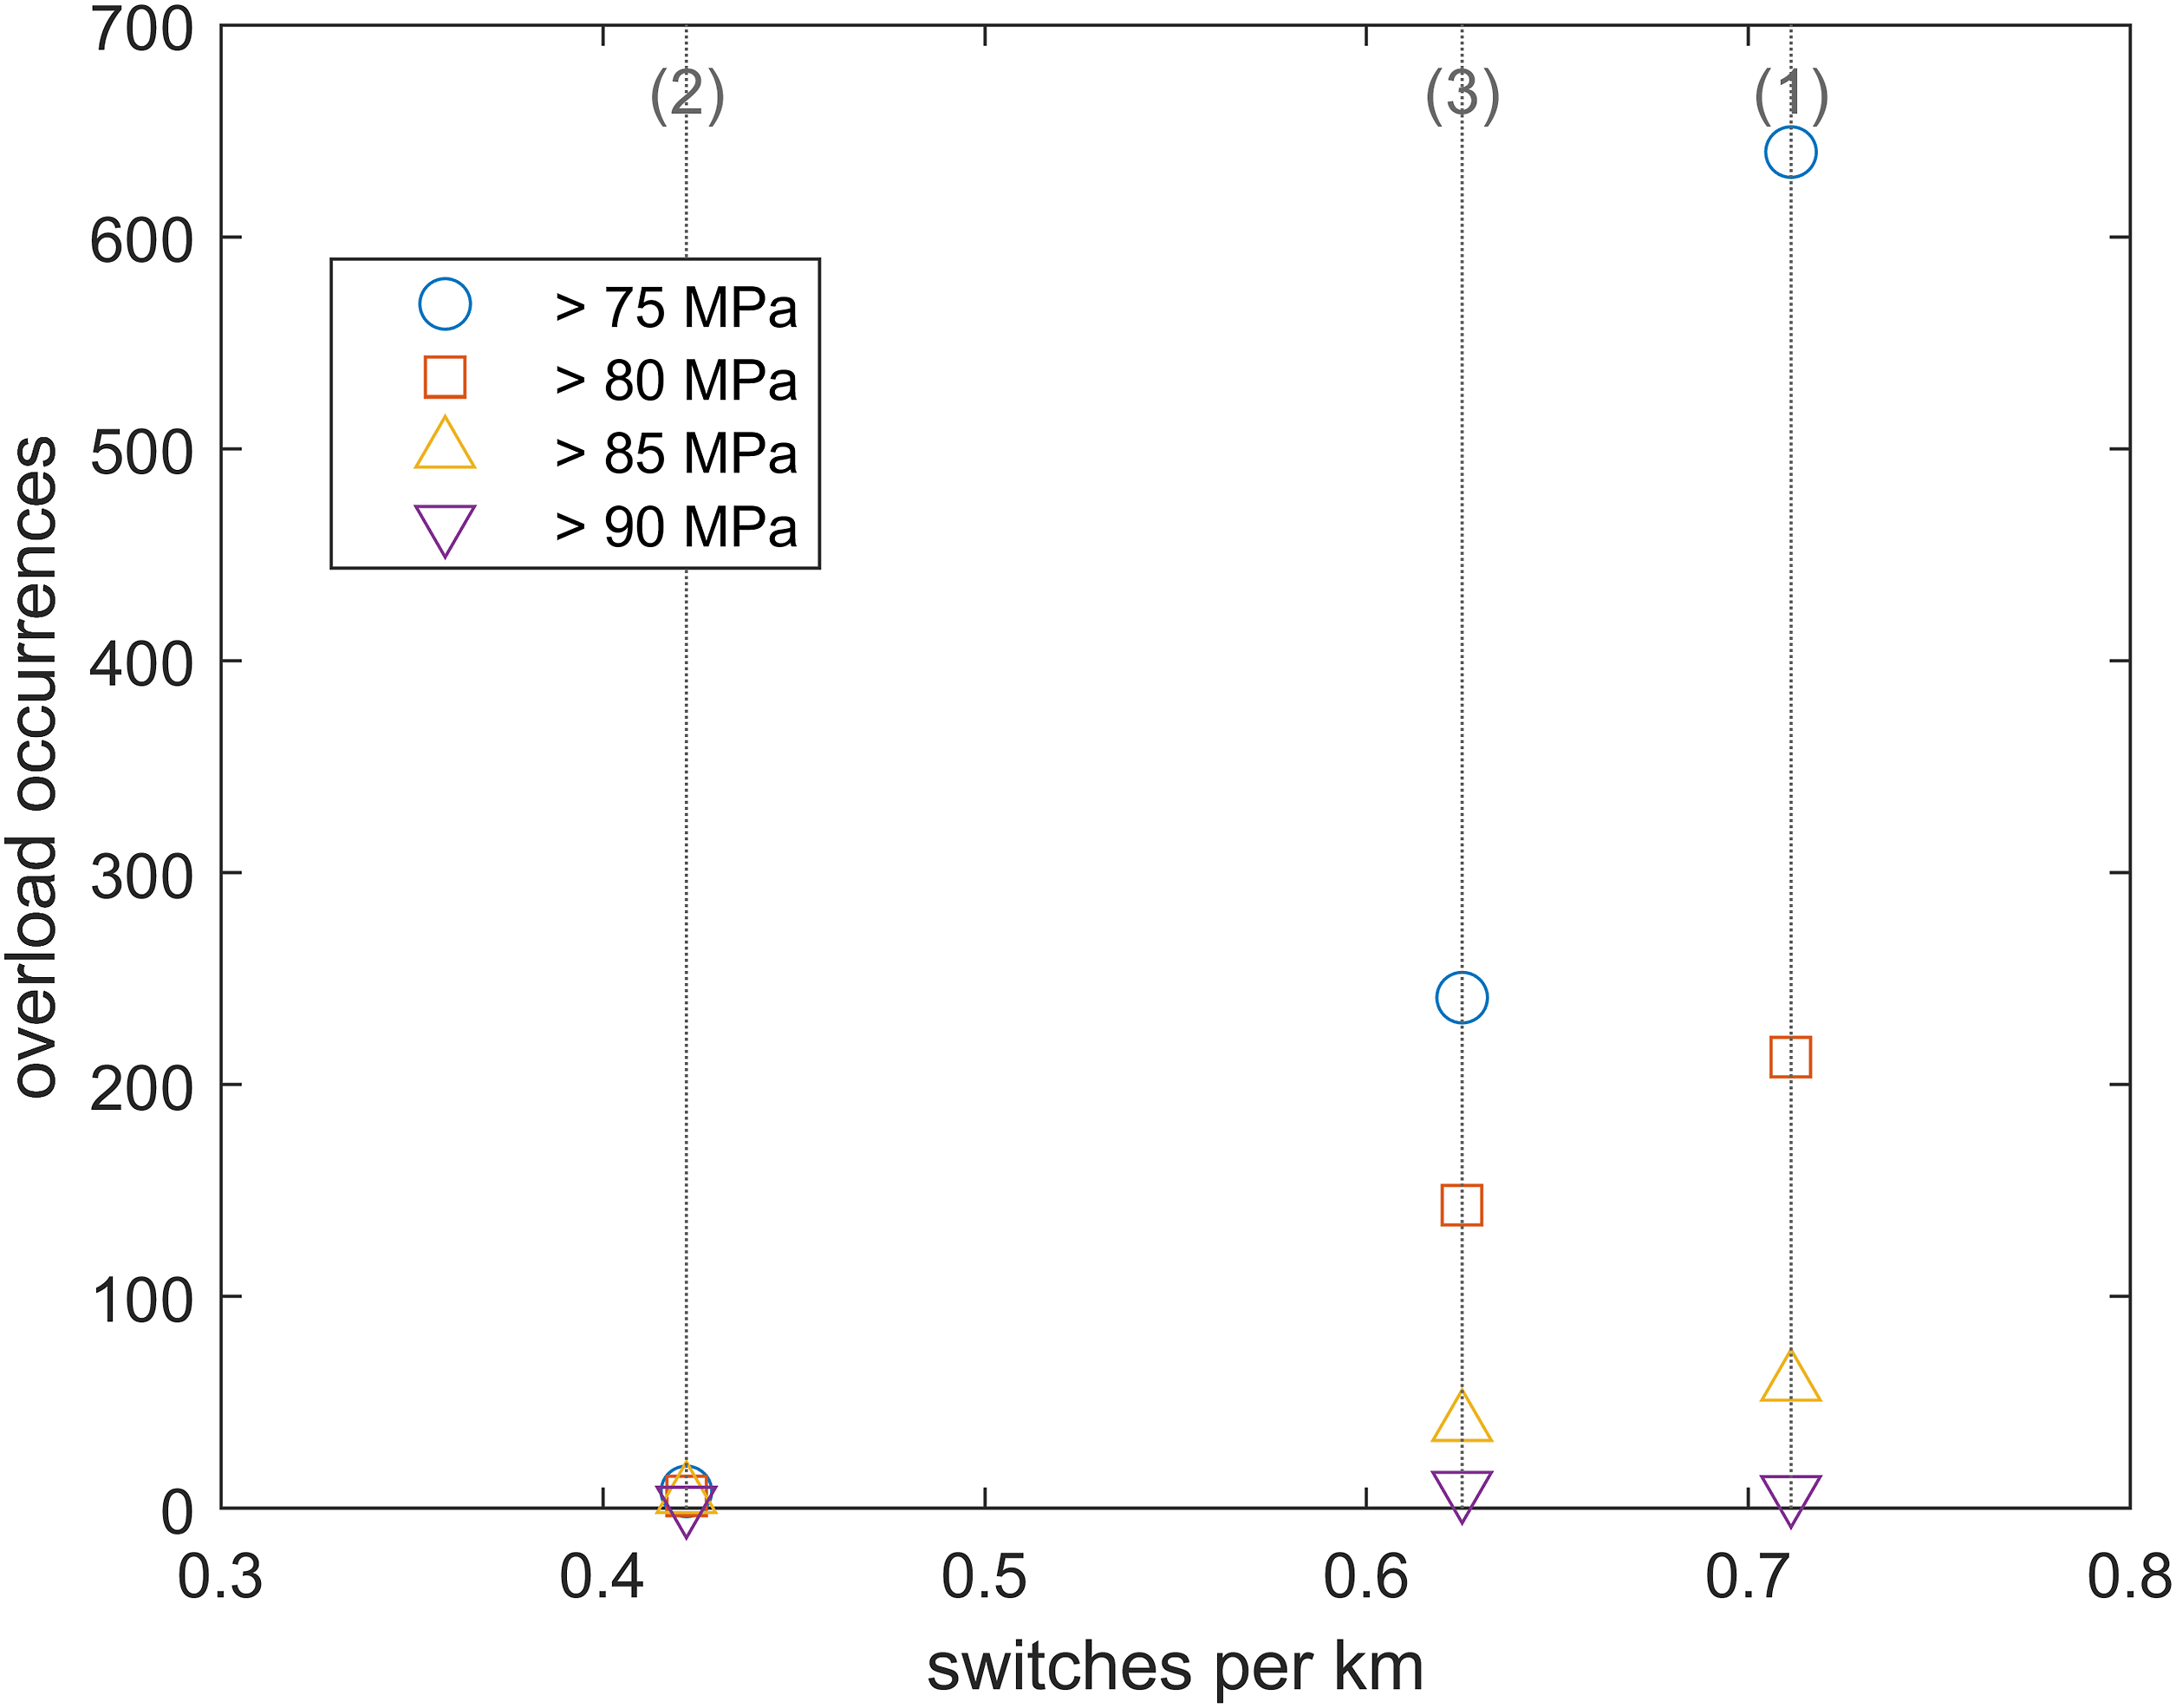
Circular and transition curves
The influence of circular curves and transition curves was investigated in a similar study as in Section 3.1. Key parameters assessed to describe the curves were their radius and length, this study was again performed by accounting for the number of curves and the total length of curves per km of track, as well as their radius distribution. Circular curves and transition curves were considered separately. No significant differences were noticed between employing the amount or the total length of curves. Also, no significant differences were found between studying circular and transition curves separately or together. Consequently, to keep the approach as simple as possible, the number of circular and transition curves per kilometre of track is used as the key parameter in this Section.
The number of curves per km has in Figure 6 been divided into four different cases with minimum radii lower than 500, 1000, 1500 and 2500 m. Figure 6(a) indicates that the mean value of distribution P1 increases as the amount of circular and transition curves increase. The standard deviation of distribution P1 seems to be fairly unaffected unless the number of curves is very large (i.e. for track section 1), see Figure 6(b). Larger standard deviation and mean values for distribution P1 suggest that circular and transition curves cause a moderate increase of bending stress amplitudes. No correlation was found with the parameters describing distribution P2, which indicates that curves do not generate very large bending stress amplitudes. This is likely due to the fact that most curves do not lead to abrupt variations and related high load magnitudes in wheel–rail contact forces, but induce elevated lateral contact force magnitudes, see Chapter 4. Correlation between the number of circular and transition curves per kilometre (in radii intervals) and parameters of the stress spectra for the three track sections: (1) Gothenburg–Alingsås, (2) Herrljunga–Skövde, and (3) Laxå–Hallsberg. The subfigures show (a) the mean value and (b) the standard deviation of the P1 distribution and the stress levels at which distributions (c) P1 and (d) P2 have been truncated.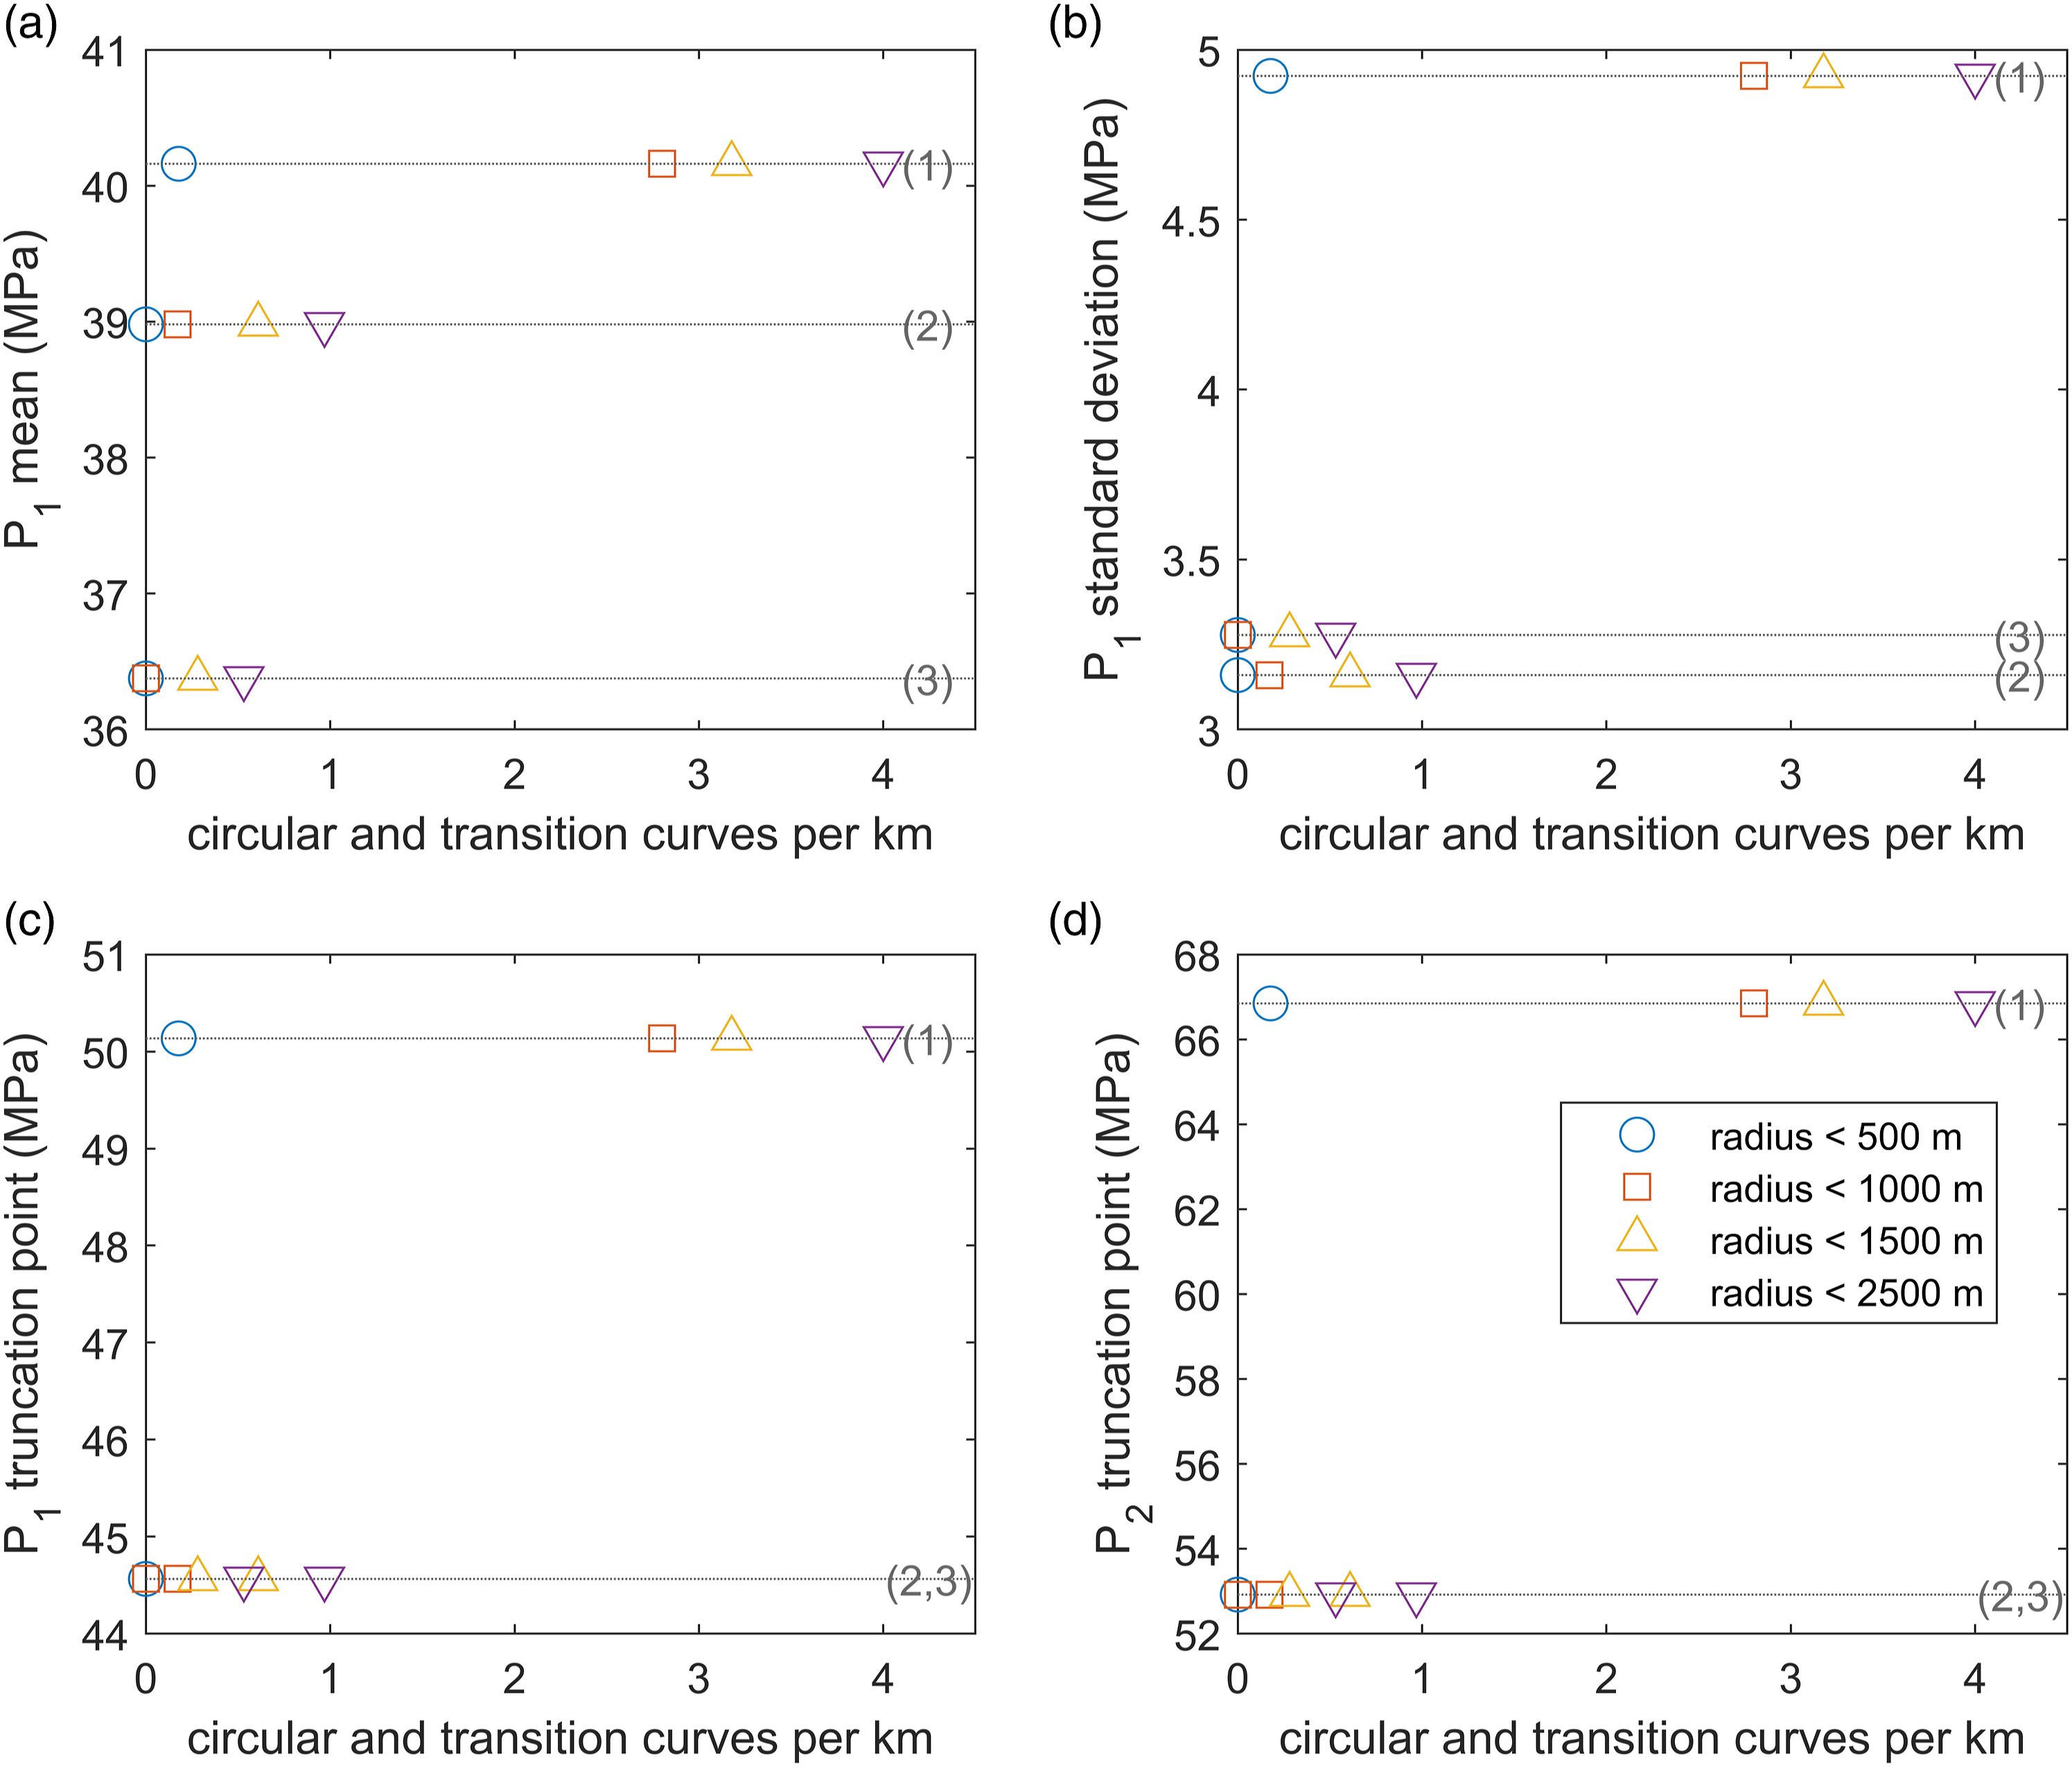
Figures 6(c) and (d) suggest that the stress amplitude levels at which distributions P1 and P2 are truncated are not affected by a slight increase in the amount of small radii circular and transition curves (i.e. track sections 2 and 3), However, when the number of curves is very high (i.e. case 1) the truncation levels increase significantly.
No correlation was found between the number of registered overloads and the amount of circular and transition curves, regardless of selected peak stress value or of curve radii considered. This confirms that curves do not generate high impact loads that cause bending stress overloads in the axle.
Track quality
The Swedish Transport Administration (Trafikverket) regularly monitors the geometry of Swedish tracks. Measurement results are stored and are post-processed to obtain parameters which can describe the track condition. One of them is the QS-ratio (Quality ratio for Standard deviation). According to Trafikverket documentation,
23
the QS-ratio is intended to provide a general picture of the track quality for longer stretches and should not be used to judge whether a track section is in need of maintenance. The ratio, QS, is computed as
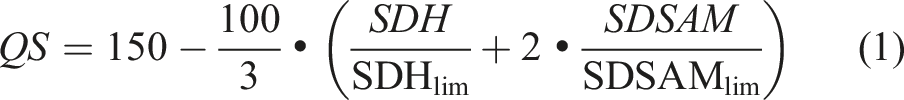
Where SDH is the standard deviation of the difference in vertical position of the rail from a nominal level and SDSAM is the standard deviation of the sum of the rail cant and the difference in lateral position of the outer rail from a nominal level. SDHlim and SDSAMlim are fixed comfort limits for SDH and SDSAM. The higher the QS-ratio, the less the deviation of the track from its nominal geometry.
The QS-ratio measured during the first half of 2021 for the three studied track stretches has been compared to the mean value and standard deviations of the distributions P1 and P2, see Figures 7(a) and (b). It can be noticed that the standard deviations (especially of P2) increase when the train is travelling over stretches characterised by lower QS. No correlation was found between QS and mean values of distributions P1 and P2. This indicates (not surprisingly) that a low QS causes a scatter in contact loads and hence a larger variation in axle stress amplitudes. Correlation between the QS-ratio and (a) standard deviation of P1, (b) standard deviation of P2, and (c) stress levels at which distributions P1 and P2 are truncated. The grey vertical dotted lines indicate the number of switches per kilometre for the stretches (1) Gothenburg–Alingsås, (2) Herrljunga–Skövde, and (3) Laxå–Hallsberg.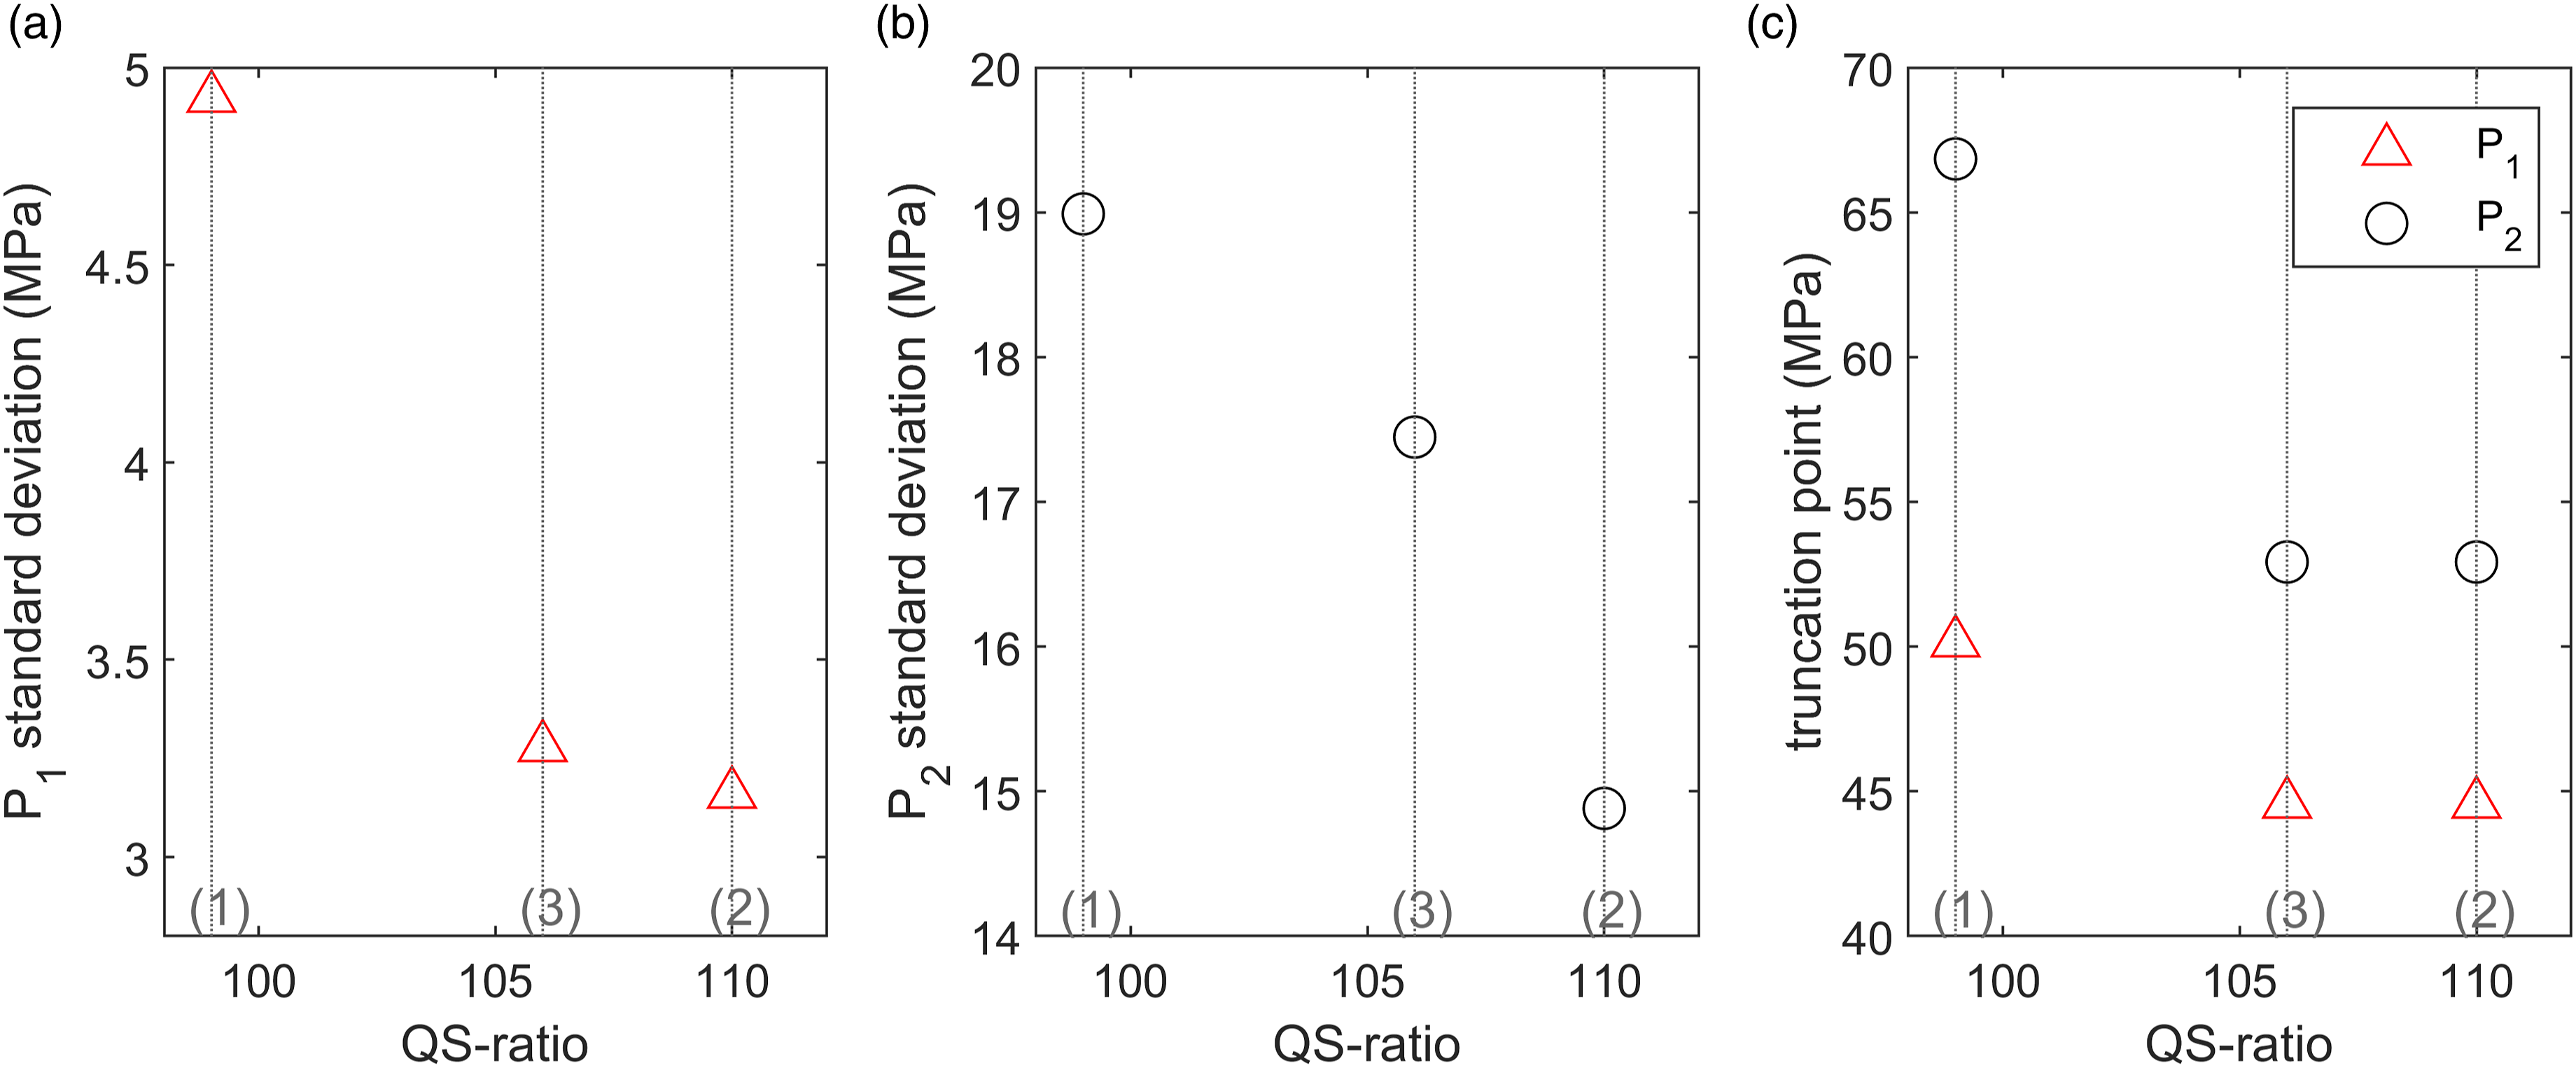
Some correlation also seems to be present between the QS-ratio and the stress levels at which distributions have been truncated, see Figure 7(c). This is consistent with the increase in the standard deviation of the two distributions that will shift the truncation level. The QS-ratio shows a very good correlation to the number of registered overloads for all the studied stress levels, see Figure 8. This can partially be explained by the effect of track irregularities on wheel–rail contact forces, however it might also be influenced by other characteristics such as a large number of switches, see section 3.1. Correlation between QS-ratio and number of registered overloads divided into four levels. The grey vertical dotted lines indicate number of switches per kilometre for the stretches (1) Gothenburg–Alingsås, (2) Herrljunga–Skövde, and (3) Laxå–Hallsberg.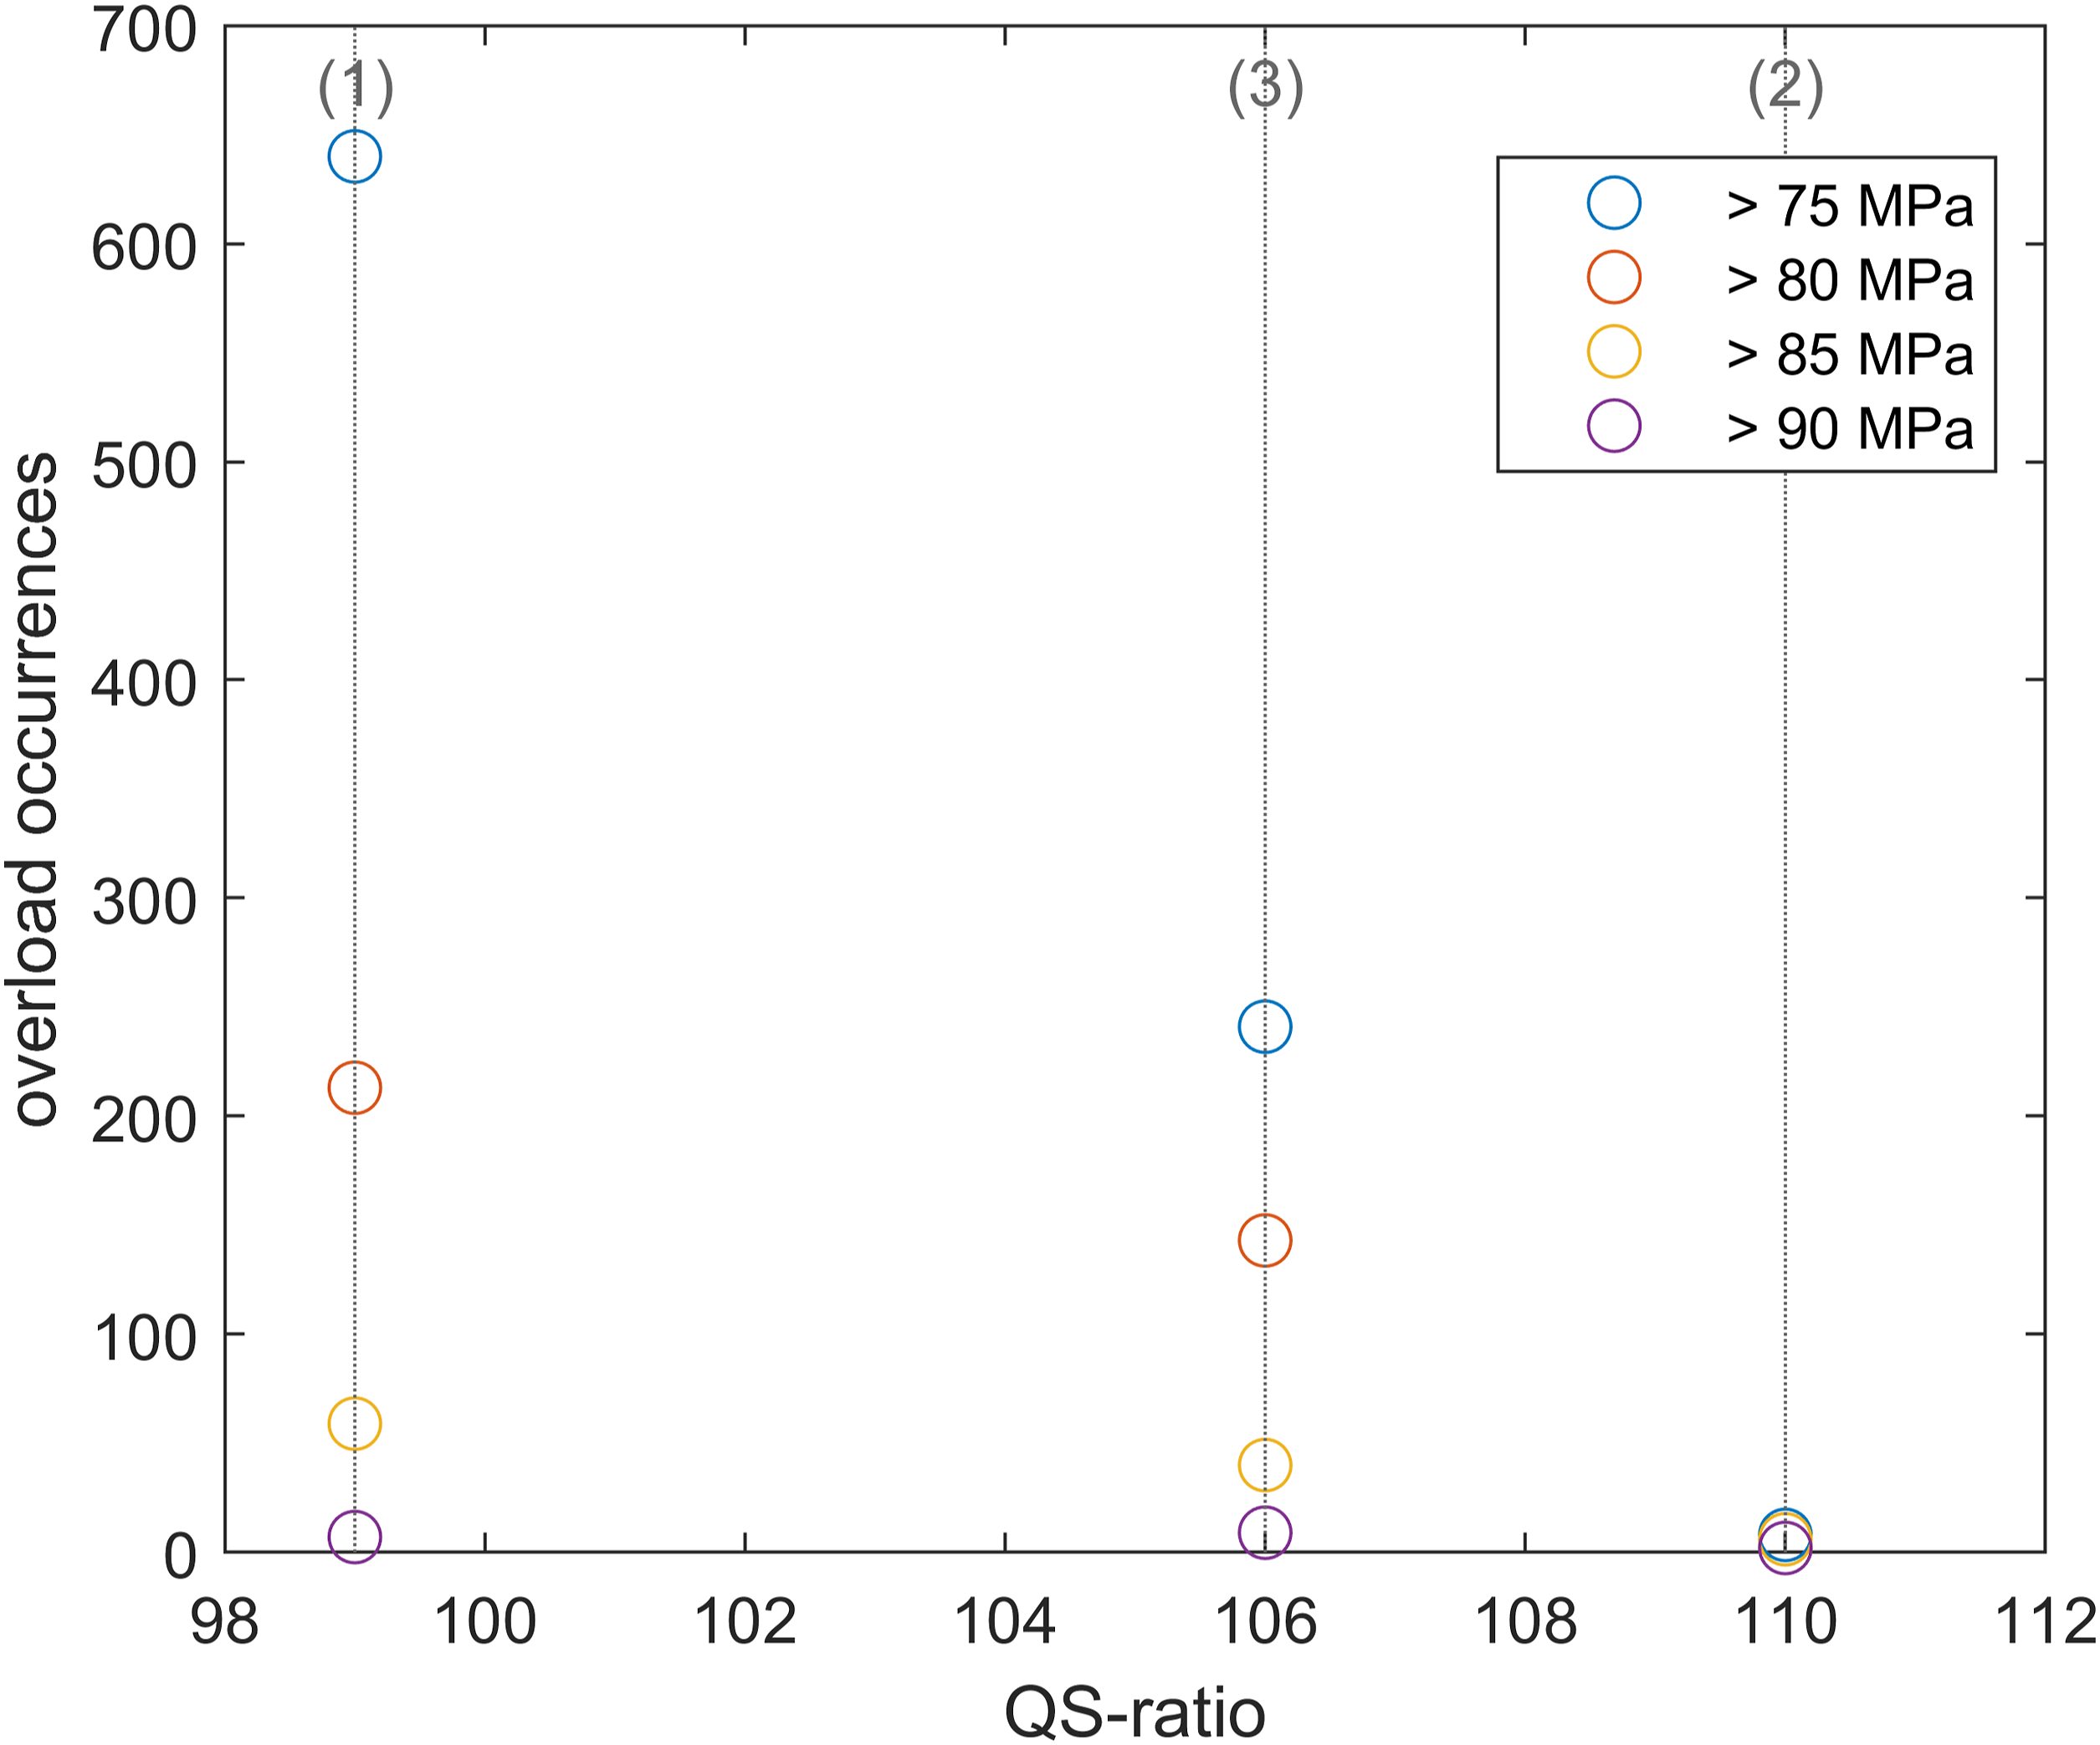
Bridges and tunnels
The last track property to be investigated was the amount of bridges and tunnels on the three studied stretches. It was noticed that the mean value and (when the number of bridges and tunnels is very high) the standard deviation of distribution P1 increase as the amount of bridges and tunnels per kilometre increase. No link was found with the mean value and standard deviation of distribution P2 nor with the occurrence of overloads at any stress level. Note that the relative amount of bridges and tunnels per kilometre among the three analysed stretches is very similar to the relative amount of curves on the same stretches, therefore it is not possible to discriminate between the effect of curves and bridges or tunnels. However, the comparison of stress spectra in Figure 2 indicates that the correlation is caused by the curves.
Track stiffness
The track stiffness for the stretch Partille–Alingsås (which roughly corresponds to the previously analysed stretch Gothenburg–Alingsås) was monitored in October 2020 using an instrumented car which measures the vertical rail deflection. 24 A smaller deflection is associated with a higher track stiffness.
In Figure 9, the number of registered overloads with peak stress above 75 MPa for some kilometres of the stretch Alingsås–Partille is plotted together with the average vertical deflection of the rail for that kilometre of track (data for kilometres of the stretch where no overloads were registered are not plotted). As smaller magnitudes of rail displacements are associated with higher track stiffness values, data obtained at stiffer track sections are at the right-hand side of Figure 9. The linear regression indicated in Figure 9 suggests that a lower track stiffness might tend to lead to more overloads. However, the trend is not clear. Note that the results are influenced by the relatively large amount of switches, and a low QS-ratio on the analysed stretch. These are expected to have a more significant influence on overloads rather than the track stiffness itself. Occurrence of overloads with stresses higher than 75 MPa and average rail vertical displacement of some kilometres of the stretch Alingsås–Partille. The red line is derived from linear regressions of the data.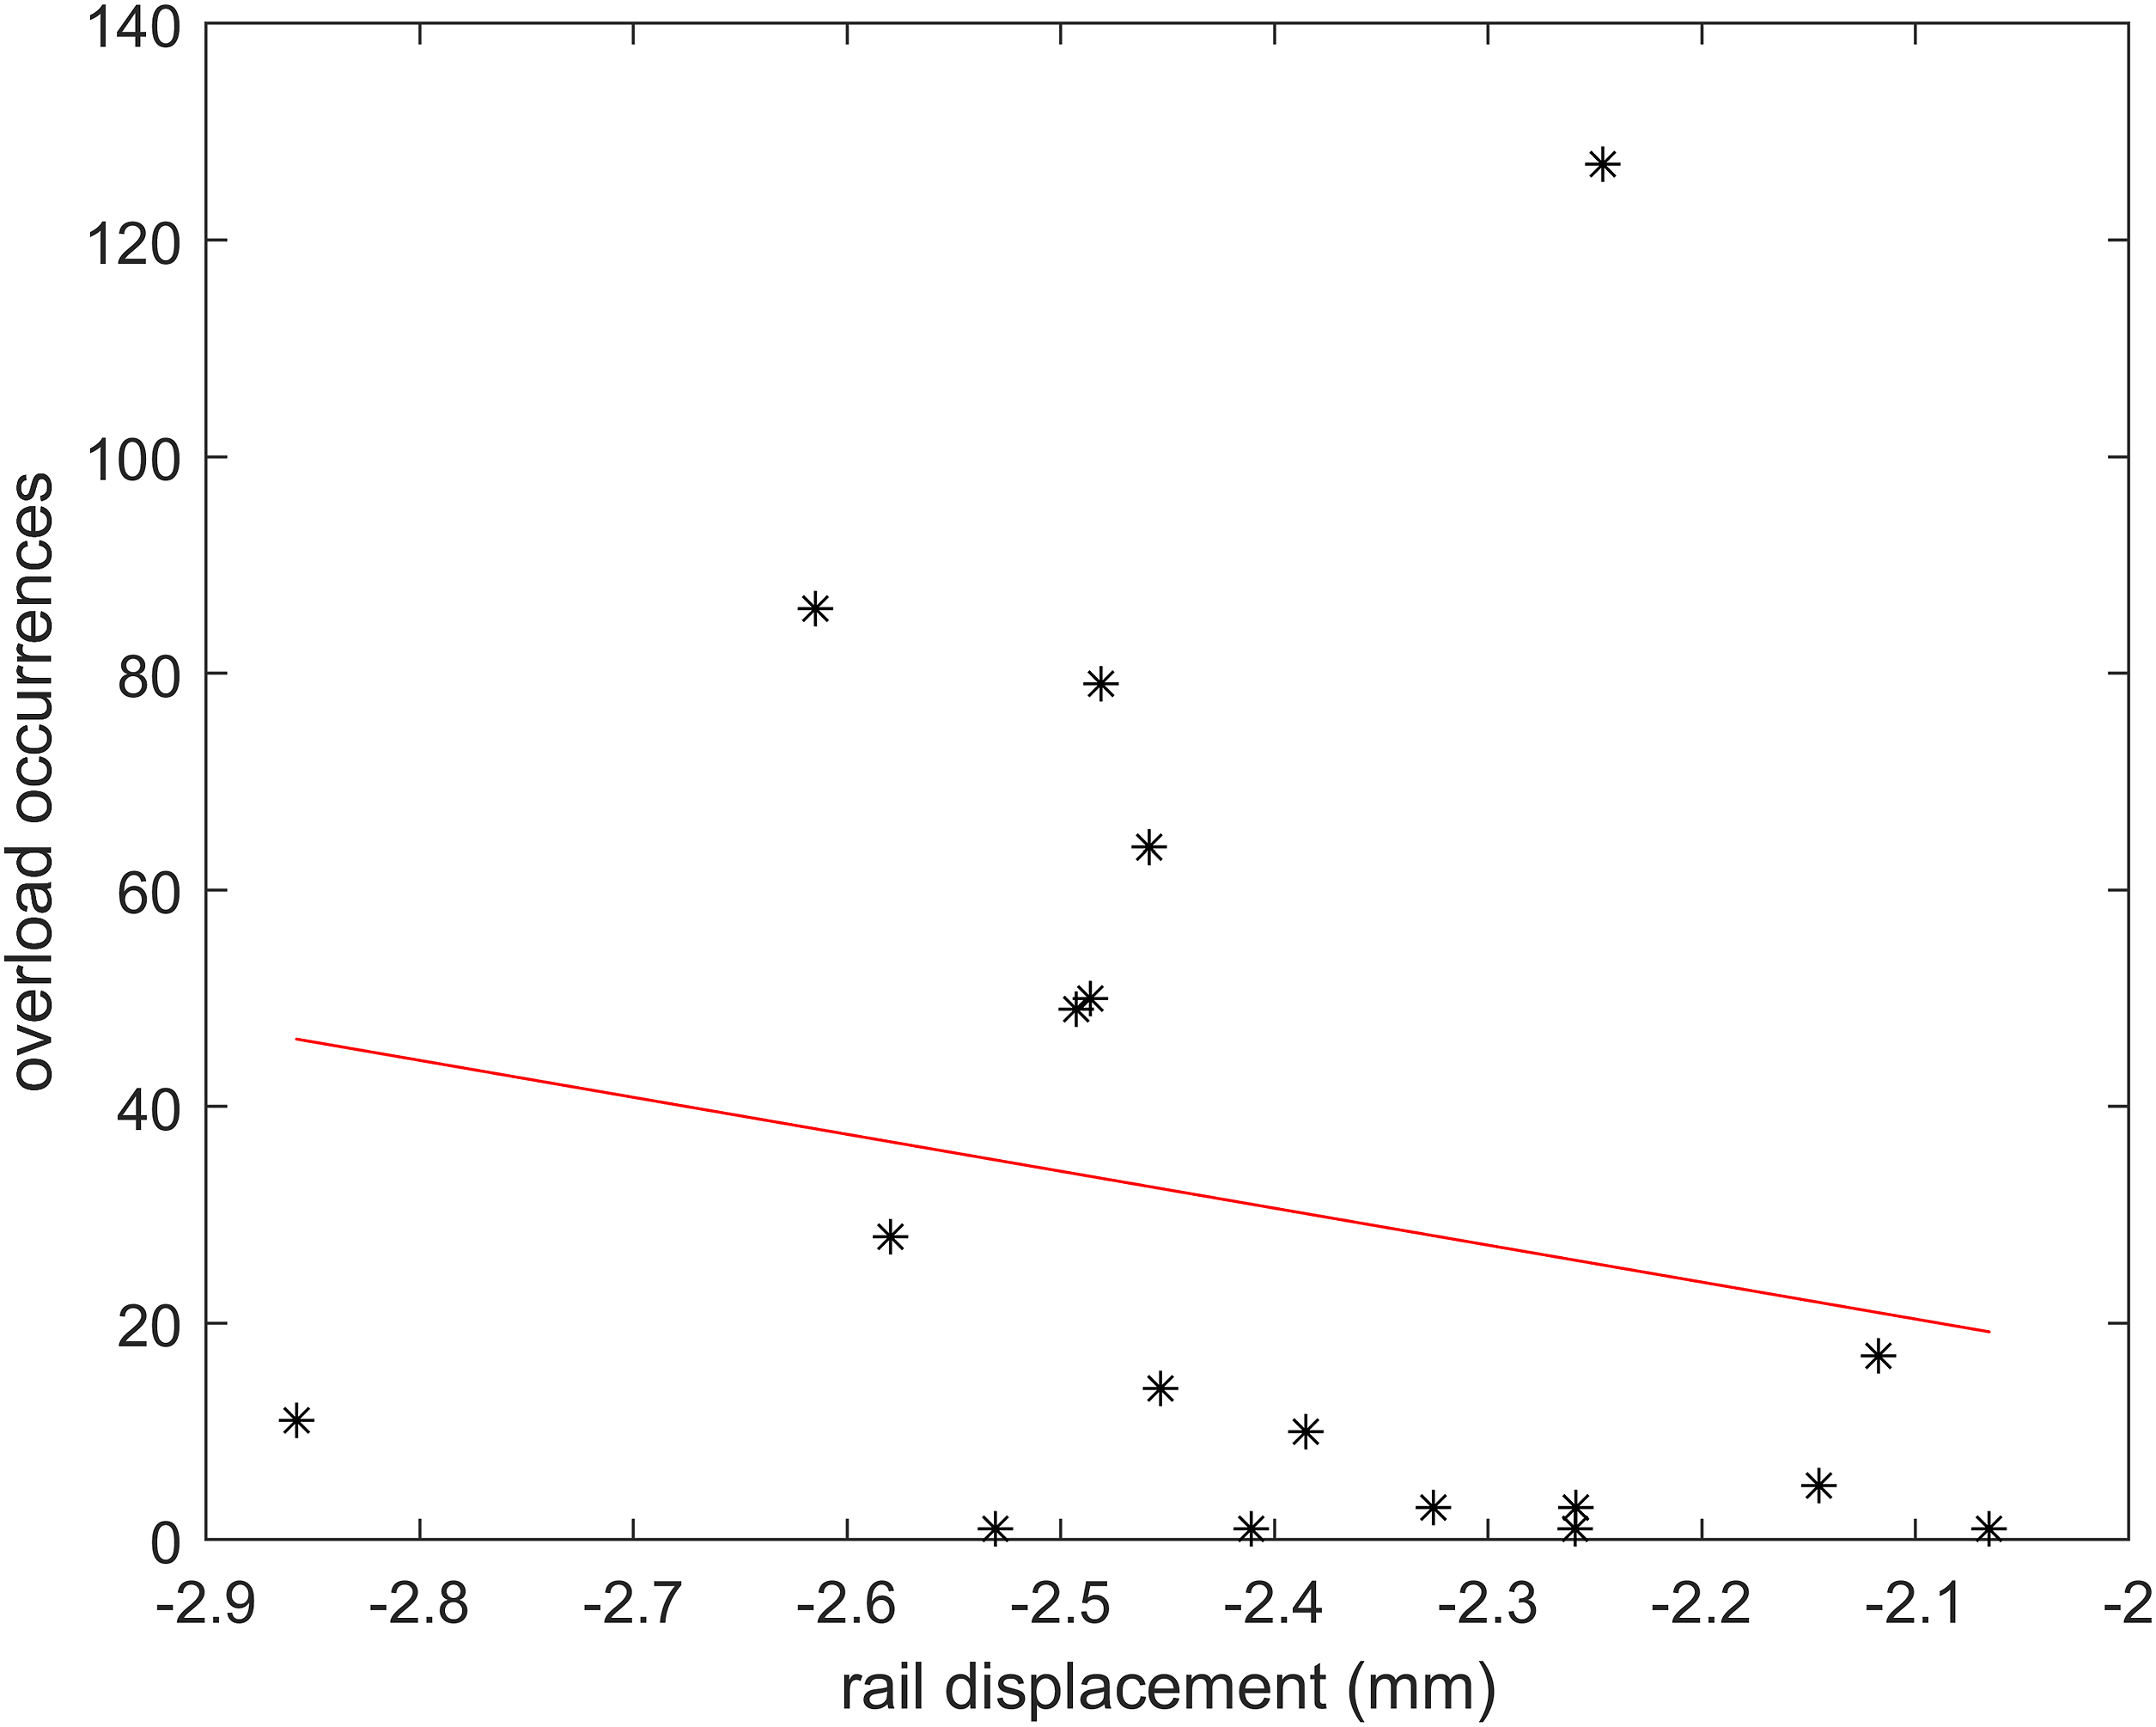
Effect of lateral forces
As discussed in the previous chapter, the negotiation of circular and transition curves can lead to a significant increase of lateral wheel–rail contact forces acting on the leading wheelset. These forces generate additional stresses which are captured by the telemetry system. However, bending strains due to the vertical and lateral components of wheel–rail contact forces sum up and cannot be discriminated by the telemetry system in its current installation. To estimate the magnitude of stresses due to curving, some simplified simulations were performed in the multibody simulation software Simpack 2022. 25
As limited information was available on the train design, a simplified model based on the Manchester benchmark model for a passenger train 26 was used. This model was generated by starting from vehicle, bogie and wheelset parameters from the Manchester benchmark. Some of these parameters were then updated based on information available for the instrumented Coradia Duplex train (mainly vehicle, bogie and wheelset dimensions, weights, inertias, and centres of gravity). A simulation procedure based on the work performed in Ansin et al. 27 was adopted. As several assumptions and simplifications were used in this analysis, the results are meant solely as an indication on the increase in stress magnitudes due to curving.
Numerically evaluated vertical and lateral wheel–rail contact forces and resulting bending stresses at the cross-section of strain measurements. Simulations are performed at a vehicle speed of 140 km/h for circular curves with five different radii.
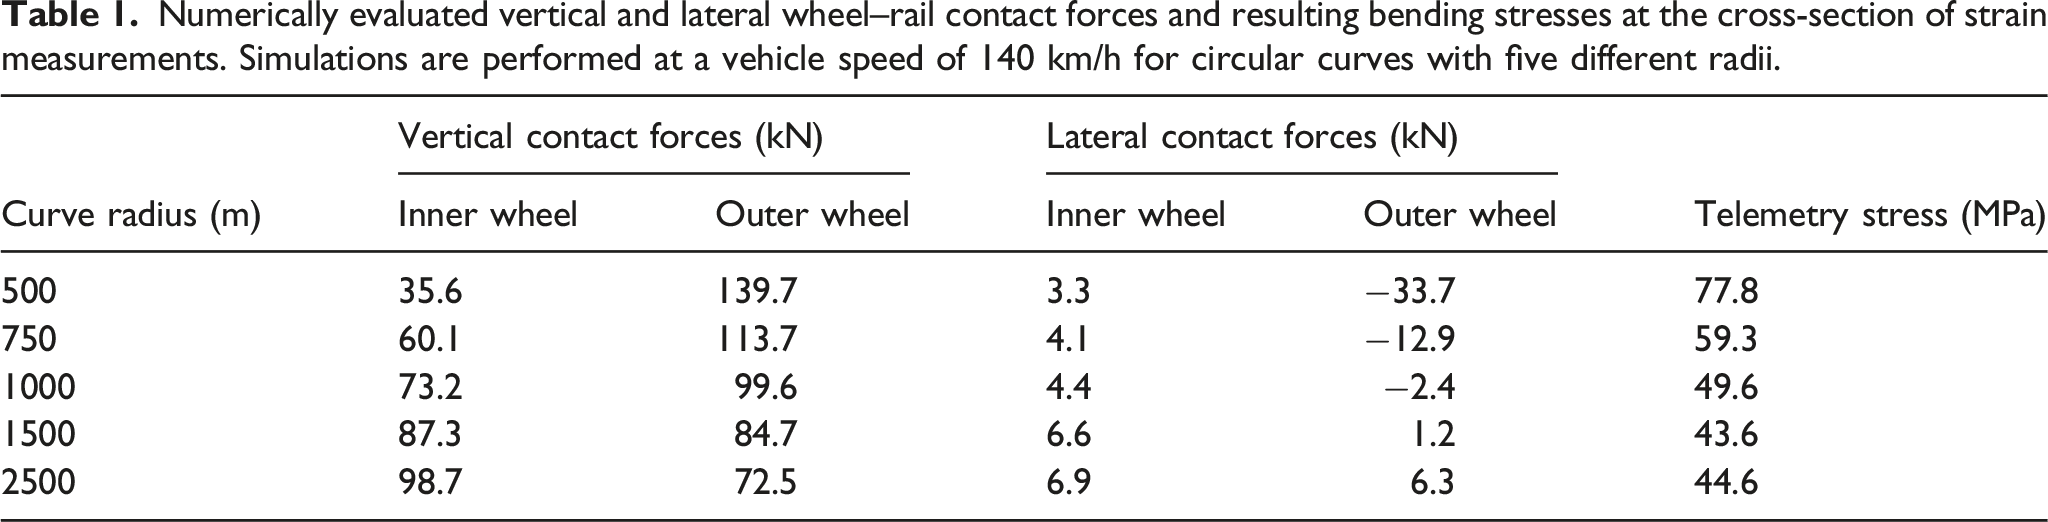
From Table 1 it noticed that as the curve radius increases the load tends to shift from the outer wheel to the inner wheel, thus (with the employed constant track superelevation) indicating a shift from a cant deficiency to cant excess. To transfer the load increase to axle stresses, static finite element (FE) simulations have been performed in the commercial software Abaqus 2019 28 using a 3D model for the leading powered wheelset of the instrumented train 29 with primary suspension stiffness and damping parameters according to values in the Manchester benchmark. 26 To always account for the highest stress that the telemetry can measure, the outer wheel was assumed to be closest to the strain gauges (the wheel furthest away from the gearbox) 29 for curve radii up to 1500 m, while for curve radius 2500 m the inner wheel was assumed to be closest to the strain gauges.
The resulting stresses are indicated in Table 1. It can be noticed that for simulations with curve radii of 500 and 750 m, the measured stress can be respectively around 100% and 50% higher than the bending stress due to the static weight acting on the axle (which can vary in between 35 and 40 MPa). The obtained stress magnitudes for these curve radii are in line with the measurement results shown in Figure 2. As the curve radius increases, the measured stress gets closer to its static value, and then slightly increases for the case with cant excess (i.e. curve radius 2500 m). Overall, the results from these idealised analyses confirm that curves – in particular those with radii below 1000 m – significantly increase stress amplitudes and the resulting stress spectra. This effect is still present, but limited, for curves with larger radii, see Figure 6.
Concluding remarks
Bending stress spectra of railway axles have been derived from field tests. A previously described method 17 to obtain statistical descriptions of these spectra using truncated normal distributions has been employed to characterise the loading at different stretches of track. By comparison to characteristics on three stretches of track, the influences of switches and crossings, curves, track quality, and bridges and tunnels on the stress spectra have been assessed.
It is found that the numbers of switches and crossings, and curves are a suitable quantification of these objects. Switches and crossings were found to mainly increase the standard deviation of the “peak load distribution” P2. With a very high number of switches per kilometre, there will also be an increase in the standard deviation of the “nominal load distribution” P1. Curves (and transition curves) increase the mean value of the “nominal load distribution” P1. If the number of curves is very large, also the standard deviation of P1 increases. These conclusions have been further established by confirming that an increased number of switches and crossings increase the number of detected overloads, and by confirming that measured increases in quasistatic stress levels in curving match predictions from numerical simulations. More bridges and tunnels were found to increase the mean value of P1, however this is likely not an effect of the bridges and tunnels themselves but caused by the fact that the differences in bridge/tunnel density and curve density are similar for the investigated track sections.
A decreased track quality (measured by the QS-ratio) will increase the standard deviations especially of P2. Further, a matching tendency between track stiffness and the number of registered overloads has been identified.
It should be noted that the influencing factors are interacting, which of course makes it difficult to draw clear-cut conclusions. This issue can be partially compensated by investigating measured stress time histories at specific locations, but more studies are needed in how to discriminate between the effects of different parameters. Still, the identified trends together with the supporting studies presented in the current work provides a sufficient basis for a first quantification of how the track characteristics will influence the stress spectra of an axle. This knowledge can be employed to evaluate consequences on the resulting fatigue life. 17
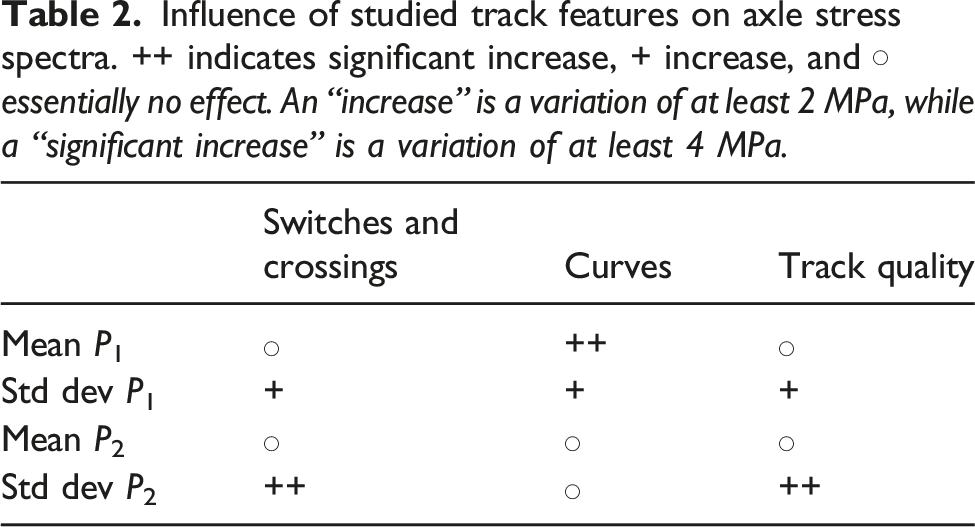
Influence of studied track features on axle stress spectra. ++ indicates significant increase, + increase, and ○ essentially no effect. An “increase” is a variation of at least 2 MPa, while a “significant increase” is a variation of at least 4 MPa.
The current study on the load (stress) spectrum is applicable to the fatigue life assessment of axles, bearings as well as other wheelset and suspension, and track components. In particular, it will allow for real-time post-processing of data which can contribute to the adoption of data-driven condition-based maintenance procedures for both the vehicles and track.
Footnotes
Acknowledgements
The current work is part of the activities within the Centre of Excellence CHARMEC (CHAlmers Railway MEChanics, ![]() ). Parts of the study have been funded from the European Union’s Horizon 2020 research and innovation programme in the project In2Track3 under grant agreement No. 101012456. Dr Daniele Regazzi, and Mr Steven Cervello from Lucchini RS are acknowledged for sharing field test data and for discussing possible interpretations.
). Parts of the study have been funded from the European Union’s Horizon 2020 research and innovation programme in the project In2Track3 under grant agreement No. 101012456. Dr Daniele Regazzi, and Mr Steven Cervello from Lucchini RS are acknowledged for sharing field test data and for discussing possible interpretations.
Declaration of conflicting interests
The author(s) declared no potential conflicts of interest with respect to the research, authorship, and/or publication of this article.
Funding
The author(s) disclosed receipt of the following financial support for the research, authorship, and/or publication of this article: This work was supported by the In2Track3 under grant agreement No. 101012456.