
Abstract
The dynamic behaviour of a complete crossing panel under a transient moving load is considered using finite element method (FEM). A 3D model is developed in ANSYS software and validated using recent field measurements data from the UK. Four assumptions of trackbed stiffness distribution are tested. The best matching assumption to the field measurements is suggested and taken forward in the current study. Vibration modes are classified by comparing the modal and transient analysis results in frequency domain based on physical interpretation of the modes. A comparison is made between the so-called ‘P2’ dynamic force value in the current study and that calculated by Jenkin’s formula as specified in the UK Network Rail standard NR/L2/TRK/012 relating to crossing fatigue calculation. It is shown that this standard over-estimates the P2 dynamic force. The crossing stress results are presented and the most critical point on the foot, where the stress is considered to be in the elastic domain is introduced, in relation to the various support conditions. It is concluded that approximating the dynamics load with an equivalent P2 force envelope is sufficient to capture peak stresses for foot fatigue analyses. Finally, two scenarios for modelling hanging bearer effects are analysed in terms of foot stresses. Considering 5 mm initial gap at three consecutive bearers leads to a significant 40% increase in stress value.
Keywords
Introduction
Railway transportation is one of the fastest, safest, and environmentally friendliest compared to other modes of transportation.1–3 Due to growing demands placed on railways to ascertain its role as a primary mover of people in growing economies, maintaining the efficiency, reliability and safety of this type of transportation is both crucial and challenging. Studying the fundamental behaviour of the railway vehicle/track system and its components, where expensive faults are known to occur, is an essential step to achieve this goal. Railway organisations, due to their complexity, have a tendency to overlook this and spend a large proportion of their budget in reactive maintenance instead. Switches and crossings (S&Cs) are a particular type of asset where like-for-like replacement of components is the norm when failures occur, often missing the opportunity to fully understand and improve the system and its components for the long term.
S&Cs provide rail networks with the necessary operational flexibility. Along with this benefit, some unwanted outcomes arise due to their complex geometry and number of moving parts. Creation of severe dynamic loads that occur during train passage in crossing panels is one of these outcomes, which lead to many problems. Plastic deformation, lipping, spalling, excessive wear and fatigue are common failure modes in S&Cs, 4 which demand intensive and expensive maintenance action. Furthermore, impact loads can lead to localized trackbed settlement, which causes deviations from the original design position and further decrease the performance of the asset. A notable portion of the railway maintenance budget is allocated to S&Cs renewal and maintenance 5 and specifically crossing failures as acknowledged by Network Rail Challenge statement 6 stating that over a 7 month period (Apr. 2016 to Nov. 2016) a total of 560 crossings were ordered, of which more than 75% were related to cracks identified in crossings. Studying the S&Cs behaviour using computer simulation,7,8 performing laboratory or field tests 9 and optimization of their design10–14 or maintenance schedule is a serious proposition to help reducing these costs.
The problem of beams subjected to moving loads has been studied and solved by many researches.15–18 Fryba 19 applied the method of integral transformations to this problem and extended them to all possible cases of speed and damping. Zhu and Law 20 generalized the method of moving load identification 21 for a continuous multi-span beam with general boundary conditions.
Understanding how support conditions and its variability affects the track behaviour is crucial for increasing the track life. Grossoni et al.22,23 studied the influence of support conditions on track behaviour using a vehicle/track interaction (VTI) model. A sophisticated understanding of track stiffness is necessary and a comprehensive review on available theoretical foundation models for railway tracks has been carried out by Younesian et al. 24 Understanding how track non-linearity influences load distribution is also a benefit. For example Bezin et al. 25 introduces hanging sleepers using a flexible track system model (FTSM) within conventional multi-body dynamic method. However, most of these modelling approaches, whilst capturing the dynamics loads amplification locally, tend to be limited in understanding stress in track elements.26–30 They generally use Euler-Bernoulli or Timoshenko beam elements for modelling rails. Local effects such as stress concentration cannot be detected with these element types and they are not appropriate for studying damage. Instead, 3D finite element (FE) analysis has been used by a number of researchers31–35 for simulating vehicle/track behaviour. The ability of FE for detecting local stresses and its versatile modelling capabilities, makes it a powerful tool for detailed stress and fatigue analysis.
In this paper, a 3D FE model is presented to analyse a complete crossing panel under a transient travelling wheel load. The crossing angle is 1 in 13 and the model is made using detailed drawings of a CEN56 weldable manganese cast centre block (CCB) crossing commonly used in the UK and previously studied by the authors.14,36 The input loading history is taken from the work performed by Grossoni et al. 36 For the stress analysis, the focus is on the foot of the crossing where the material behaviour is expected to be elastic, and where several failures have been reported. 37 The model is compared and validated against site measurements in the UK 38 in 2016 and 2019, measured on the down line of a double railway track crossover equipped with under sleeper pads (USPs). Adequacy of mesh refinement is investigated. The results from different analyses such as modal, quasi-static, and transient dynamic, and from different assumptions for trackbed stiffness distribution along the length of the bearers, are examined for gaining an insight into its influence and determining the best model approach for crossing panel investigations. Vibrational modes are classified into six categories. A comparison is made between the P2 dynamic load values calculated by Jenkins’ formula 39 in NR/L2/TRK/012 standard 40 and that used in the current study. Finally, two different scenarios are defined for considering the effect on foot stresses of non-fully supported (or so called ’hanging’) bearers.
Finite element model
This section describes different aspects of finite element modelling of the crossing panel. The contact load history is taken from Grossoni et al. 36 model which captures the dynamic interaction between the travelling unsprung wheelset mass and the flexible track. This contact force is then applied directly to the FE model, thus gaining simplicity and time of execution. In both models, rail pads and trackbed are modelled using linear spring-damper elements. In 36 the crossing is modelled as a Timoshenko beam and the bearers as discretely supported masses, while in this FEM both crossing and bearers are captured as a full 3D solid elements.
The history of the wheel moving load when travelling over the consecutive supporting bearers, later shown in 3(a), contains two impact loads. The first one, ”P1” with a peak of 149 kN, is in a high frequency range (i.e. 200–800 Hz) corresponding to the wheel first contact against the crossing mass at the nose and the local material stiffness reaction and the second one, “P2” with a peak of 101 kN, is in a lower frequency range (i.e. 30–200 Hz) corresponding to the reaction of the coupled wheel unsprung mass and the crossing/bearer onto the track support stiffness. 39 A low pass Butterworth filter with a cut off frequency of 200 Hz has been applied to the load spectra to eliminate the effect of the high frequencies as the main focus of this work is on the lower frequency load transmitted from the crossing casting to the support structure below. The applied load is thus characterized by a rapid unloading on the approach to the crossing Intersection Point (IP) between bearer 44 and 45, a high dynamic component while the wheel load transfers onto the crossing nose just passed bearer 45, and ensuing medium frequency oscillation
Figure 1(a) illustrates the finite element model of the crossing panel developed in ANSYS software. The CCB crossing, that is modelled using 3D SOLID elements, is a hollow solid block with certain wall thicknesses and local reinforcement above bearers. The crossing and bearers are modelled using SOLID185 elements. BEAM4 elements were used for the other rails and COMBIN14 for the rail pad and trackbed. The crossing panel includes two parallel tracks transversally, and is compose of nine consecutive bearers, therefore captures the crossing length until the casting separates into two plain line rails. We deem this model length sufficient in length to capture the foot stress in the foot under the impulse of the P2 force, as evidence by later results and comparison with site measurement. Nine different stiffness values (KiLi) are employed for specifying the trackbed stiffness distribution along the bearer length. Ki, [kN/m/m], is the stiffness per length and Li, [m], is the length of ith portion of the bearer. In order for the rail pads and trackbed elements to be seen, the bearers are represented as shell elements in Figure 1(a) while the final model is depicted in Figure 1(b) showing solid bearer elements and zoomed areas of interest, i.e. the foot flanges above the bearer nearest to the load transfer onto the nose. This model consists of 189,744 nodes, 180,521 elements and 559,660 degrees of freedom. Finite element model of the crossing panel, (a) description and (b) Final FE model of the crossing panel. The white star shows the point for acceleration measurement and the black star is just for clarifying the position of the white star (in mirror) which is hidden behind the solid casting. Dashed line shows that the two star points are at the same level.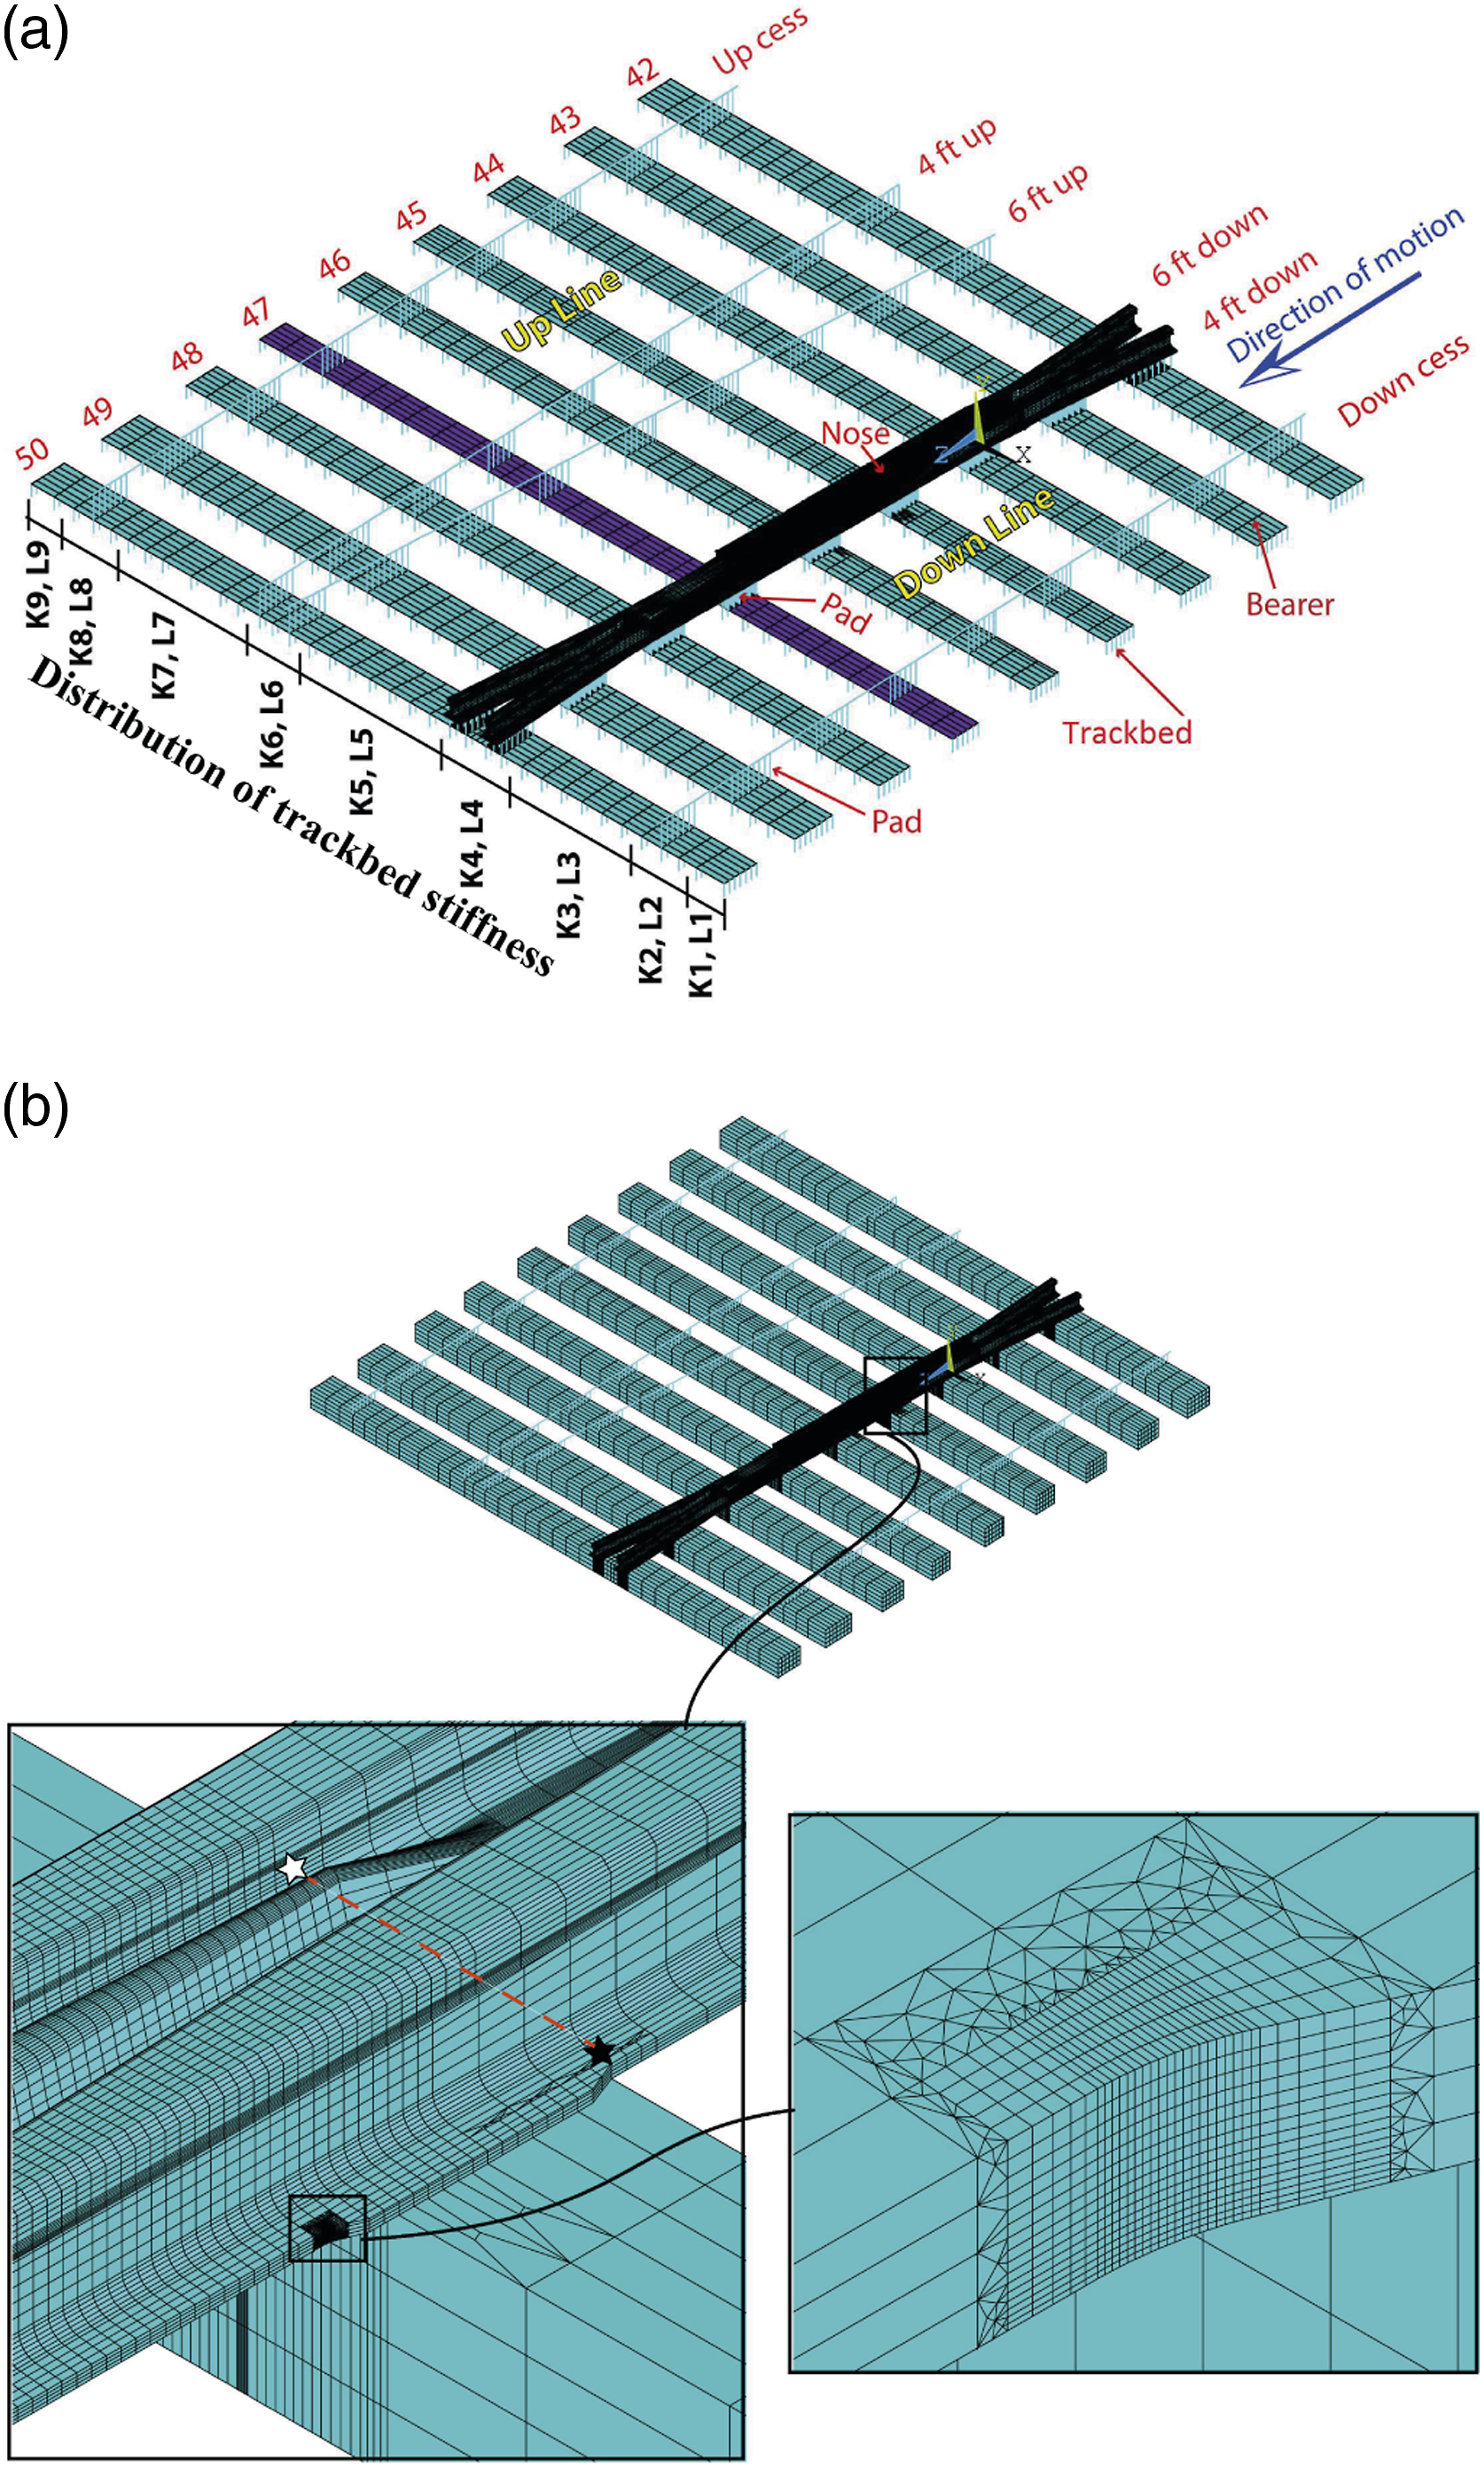
The lower ends of the trackbed spring elements are constrained in three directions as boundary conditions. The rails which are modelled using beam elements are constrained laterally in all nodes and longitudinally and rotationally just in one end nodes. The bearers are constrained in both lateral and longitudinal directions. The crossing and wing rails are constrained laterally at rail seats locations and longitudinally at the lower edge at one end. These constraints prevent any rigid body motions.
Assumptions and input data
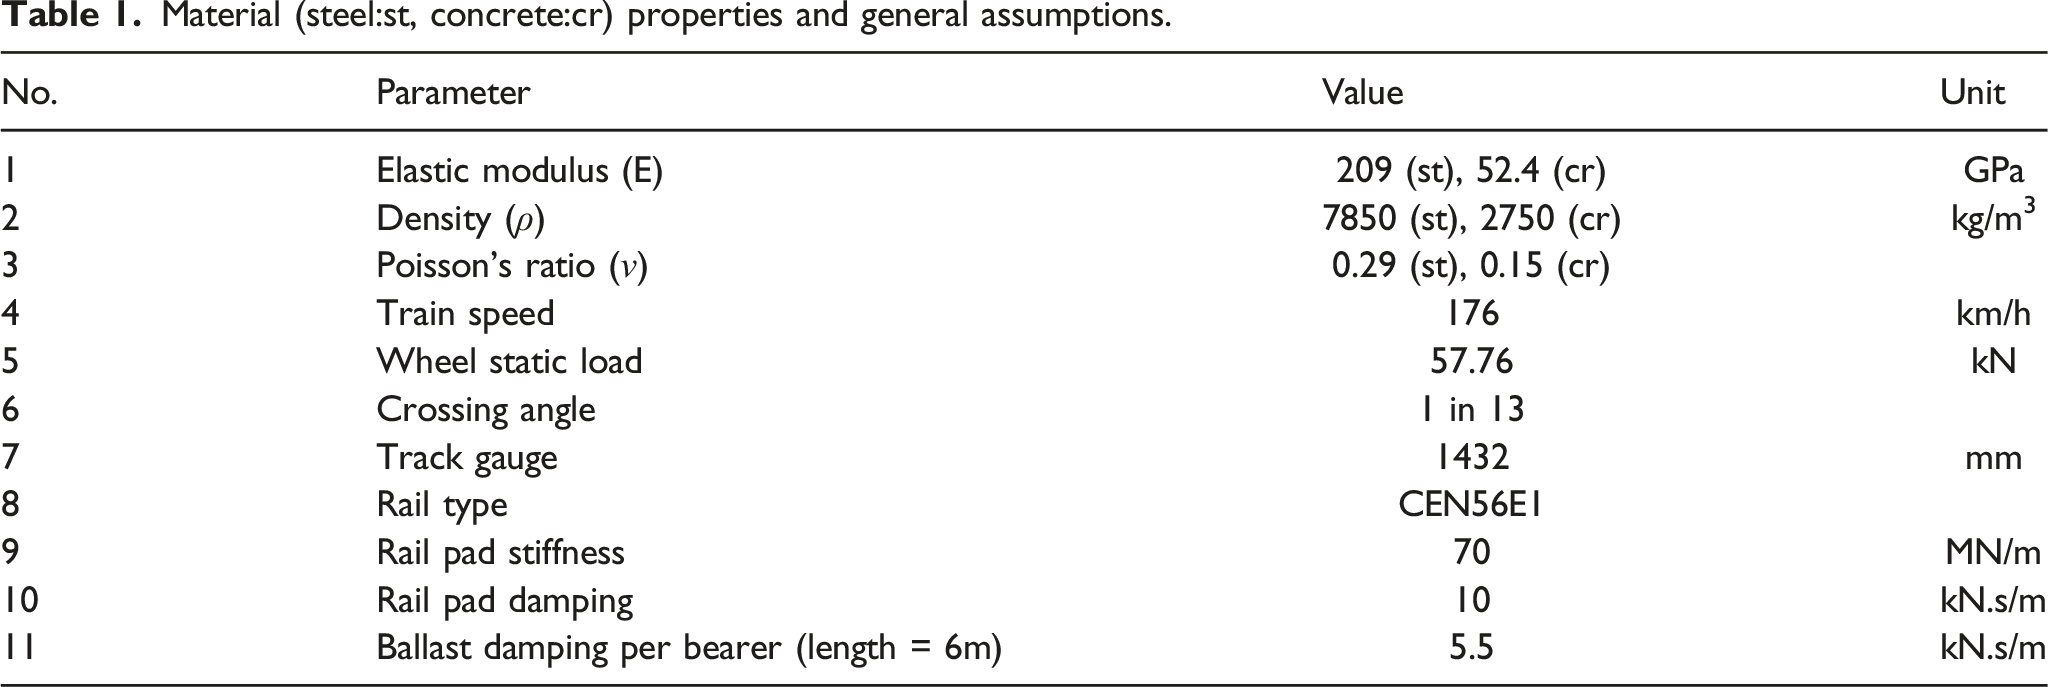
Material (steel:st, concrete:cr) properties and general assumptions.
There are different assumptions that are considered for the trackbed stiffness distribution along the length of the bearers.
36
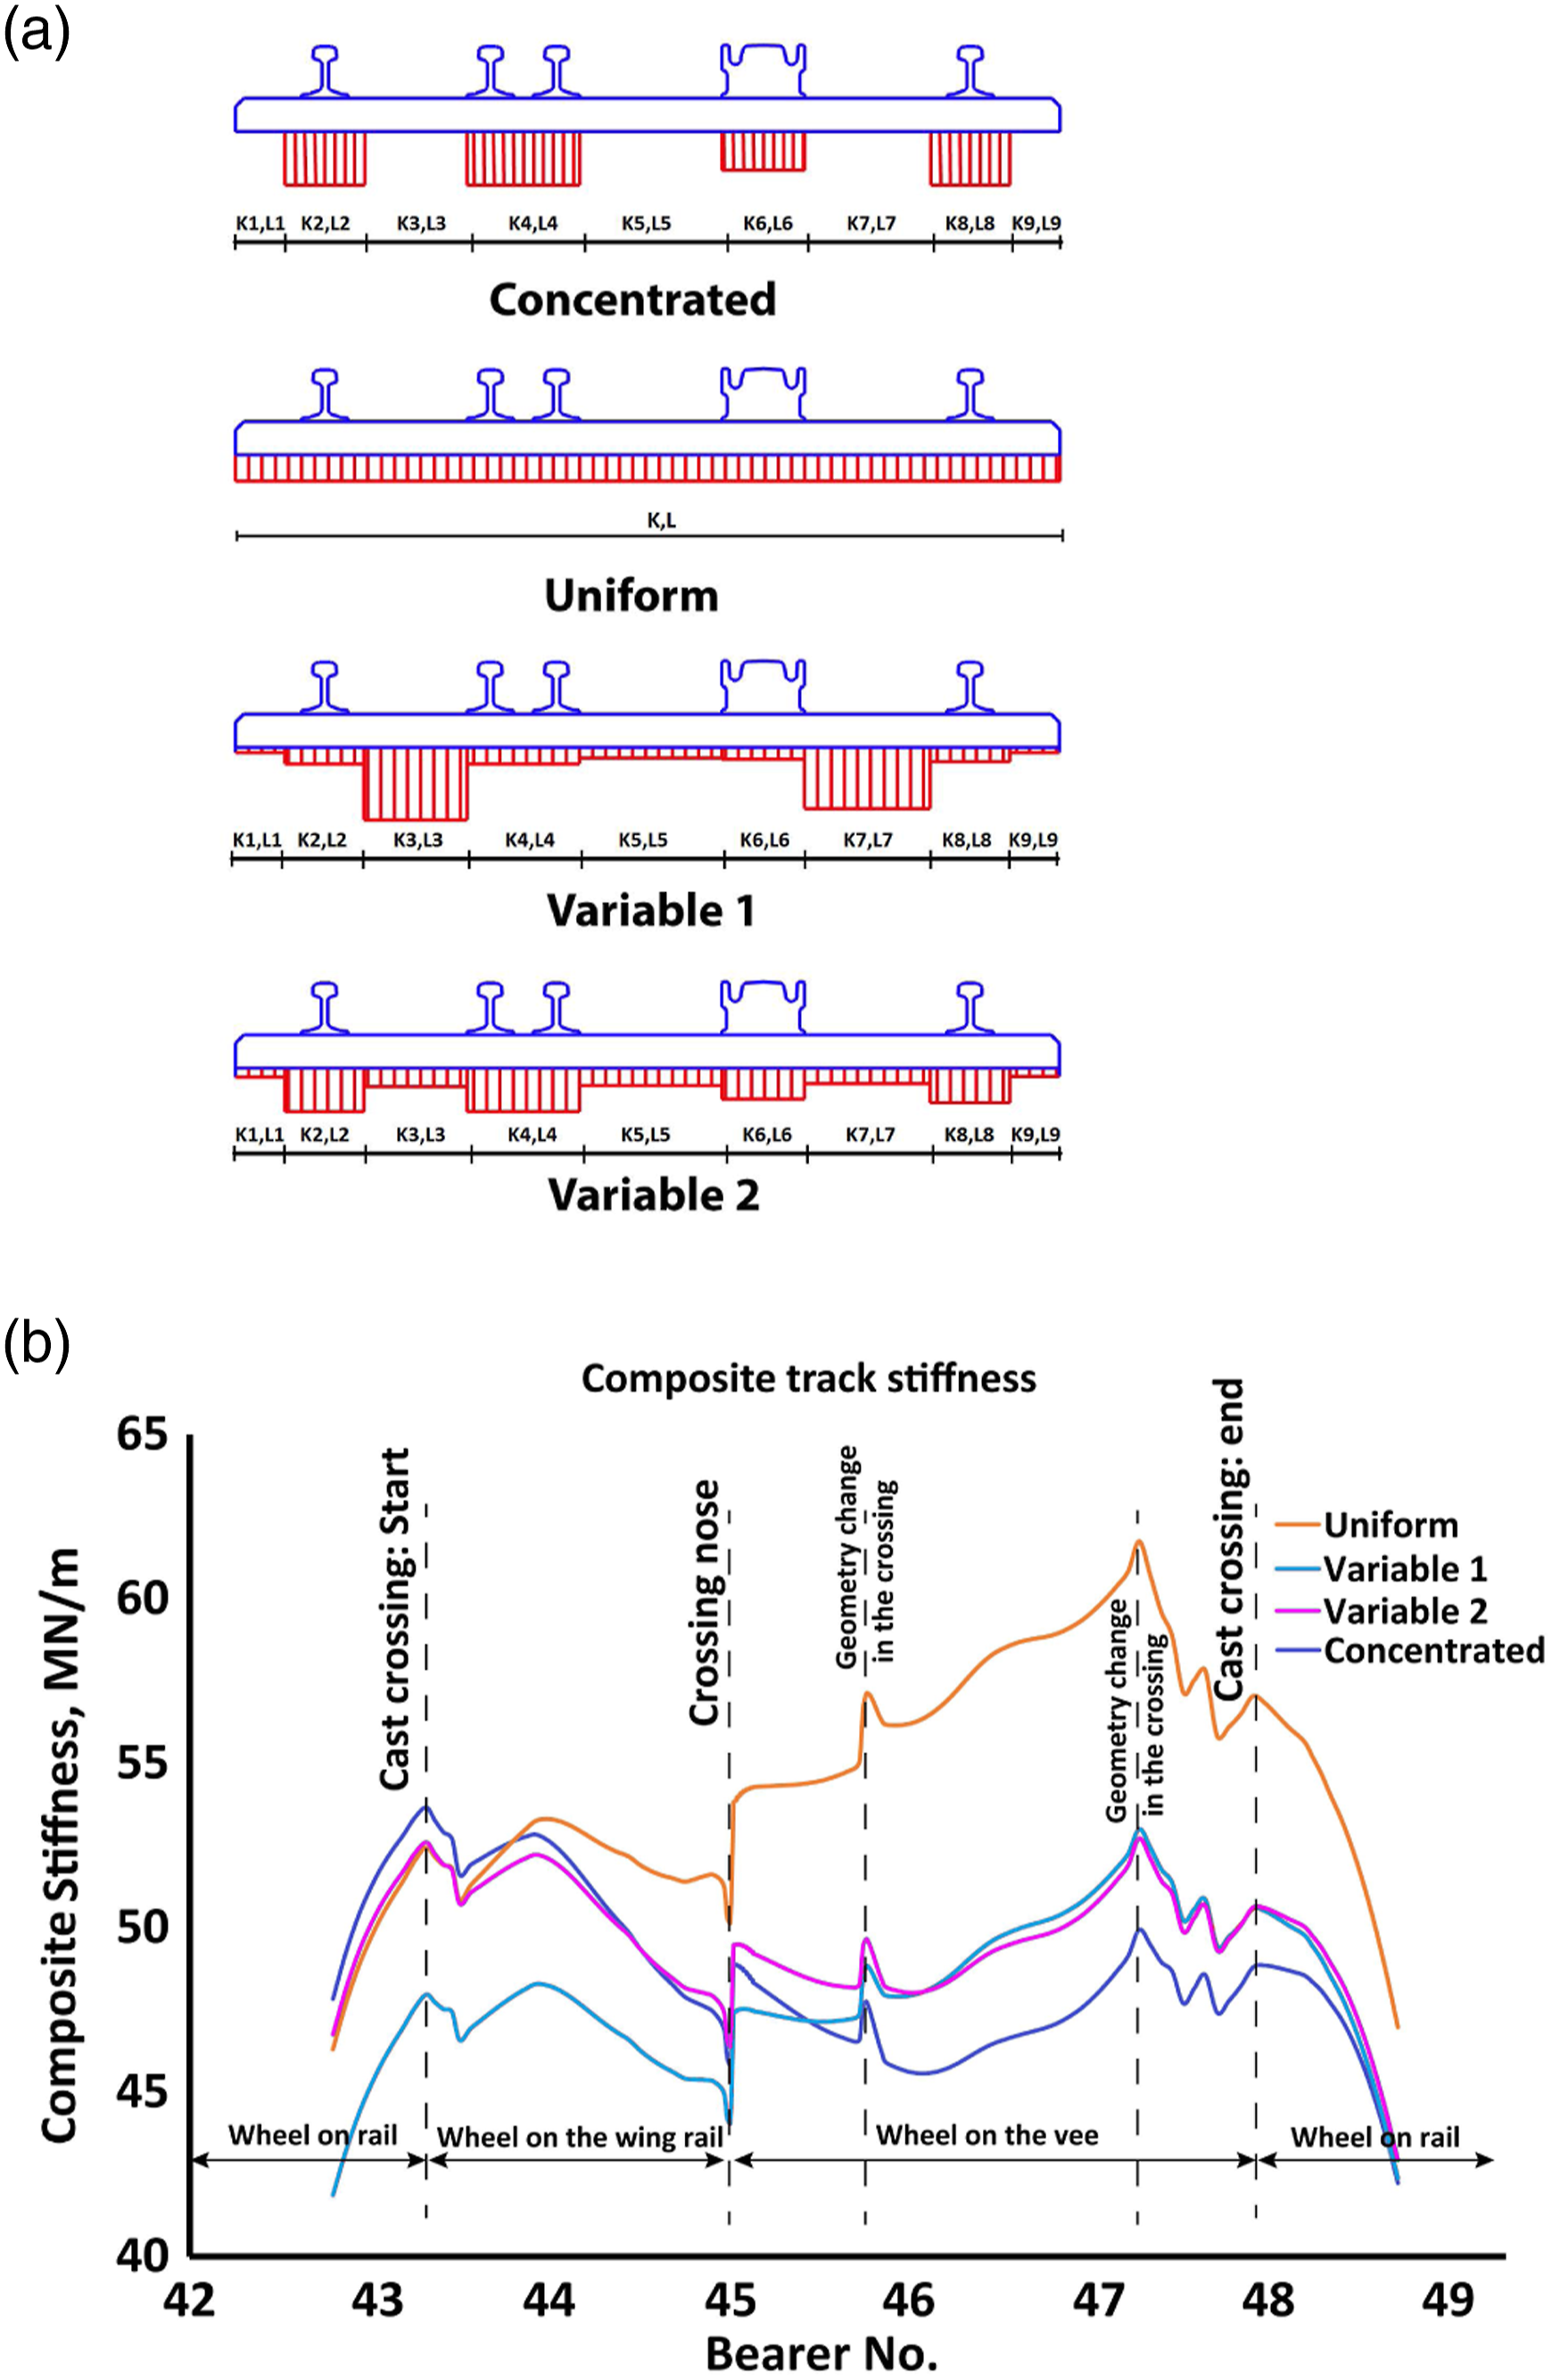
Figure 2(a) illustrates these assumptions reflecting different generic trackbed distribution possibilities: • Variable 1 ‘centrebound’ distribution, is generally used for representing degraded tracks where ballast tends to migrate away from under the rails and finally confined underneath the track centreline in between the two running rails.
42
This is more likely to apply to mainlines with independent sleepers on the two adjacent tracks and possibly not the best representation of the trackbed state under long bearers in a crossing panel. • Variable 2 distribution is used for representing newly maintained tracks where compaction initially occurs just below the rails. • Concentrated is another representation of Variable 2 where all support is assumed to be just below each rail. This is done so that it can more directly compare to other track modelling representation used in
36
with localised spring-dashpot trackbed representation. • Uniform assumes idealised uniform distribution of the trackbed stiffness. Four assumptions for the crossing panel’s stiffness distribution. (a) along the bearers and (b) composite track stiffness of the crossing panel along the crossing.
Trackbed stiffness values (MN/m) in concentrated, uniform, Variable 1, and Variable 2 distributions.
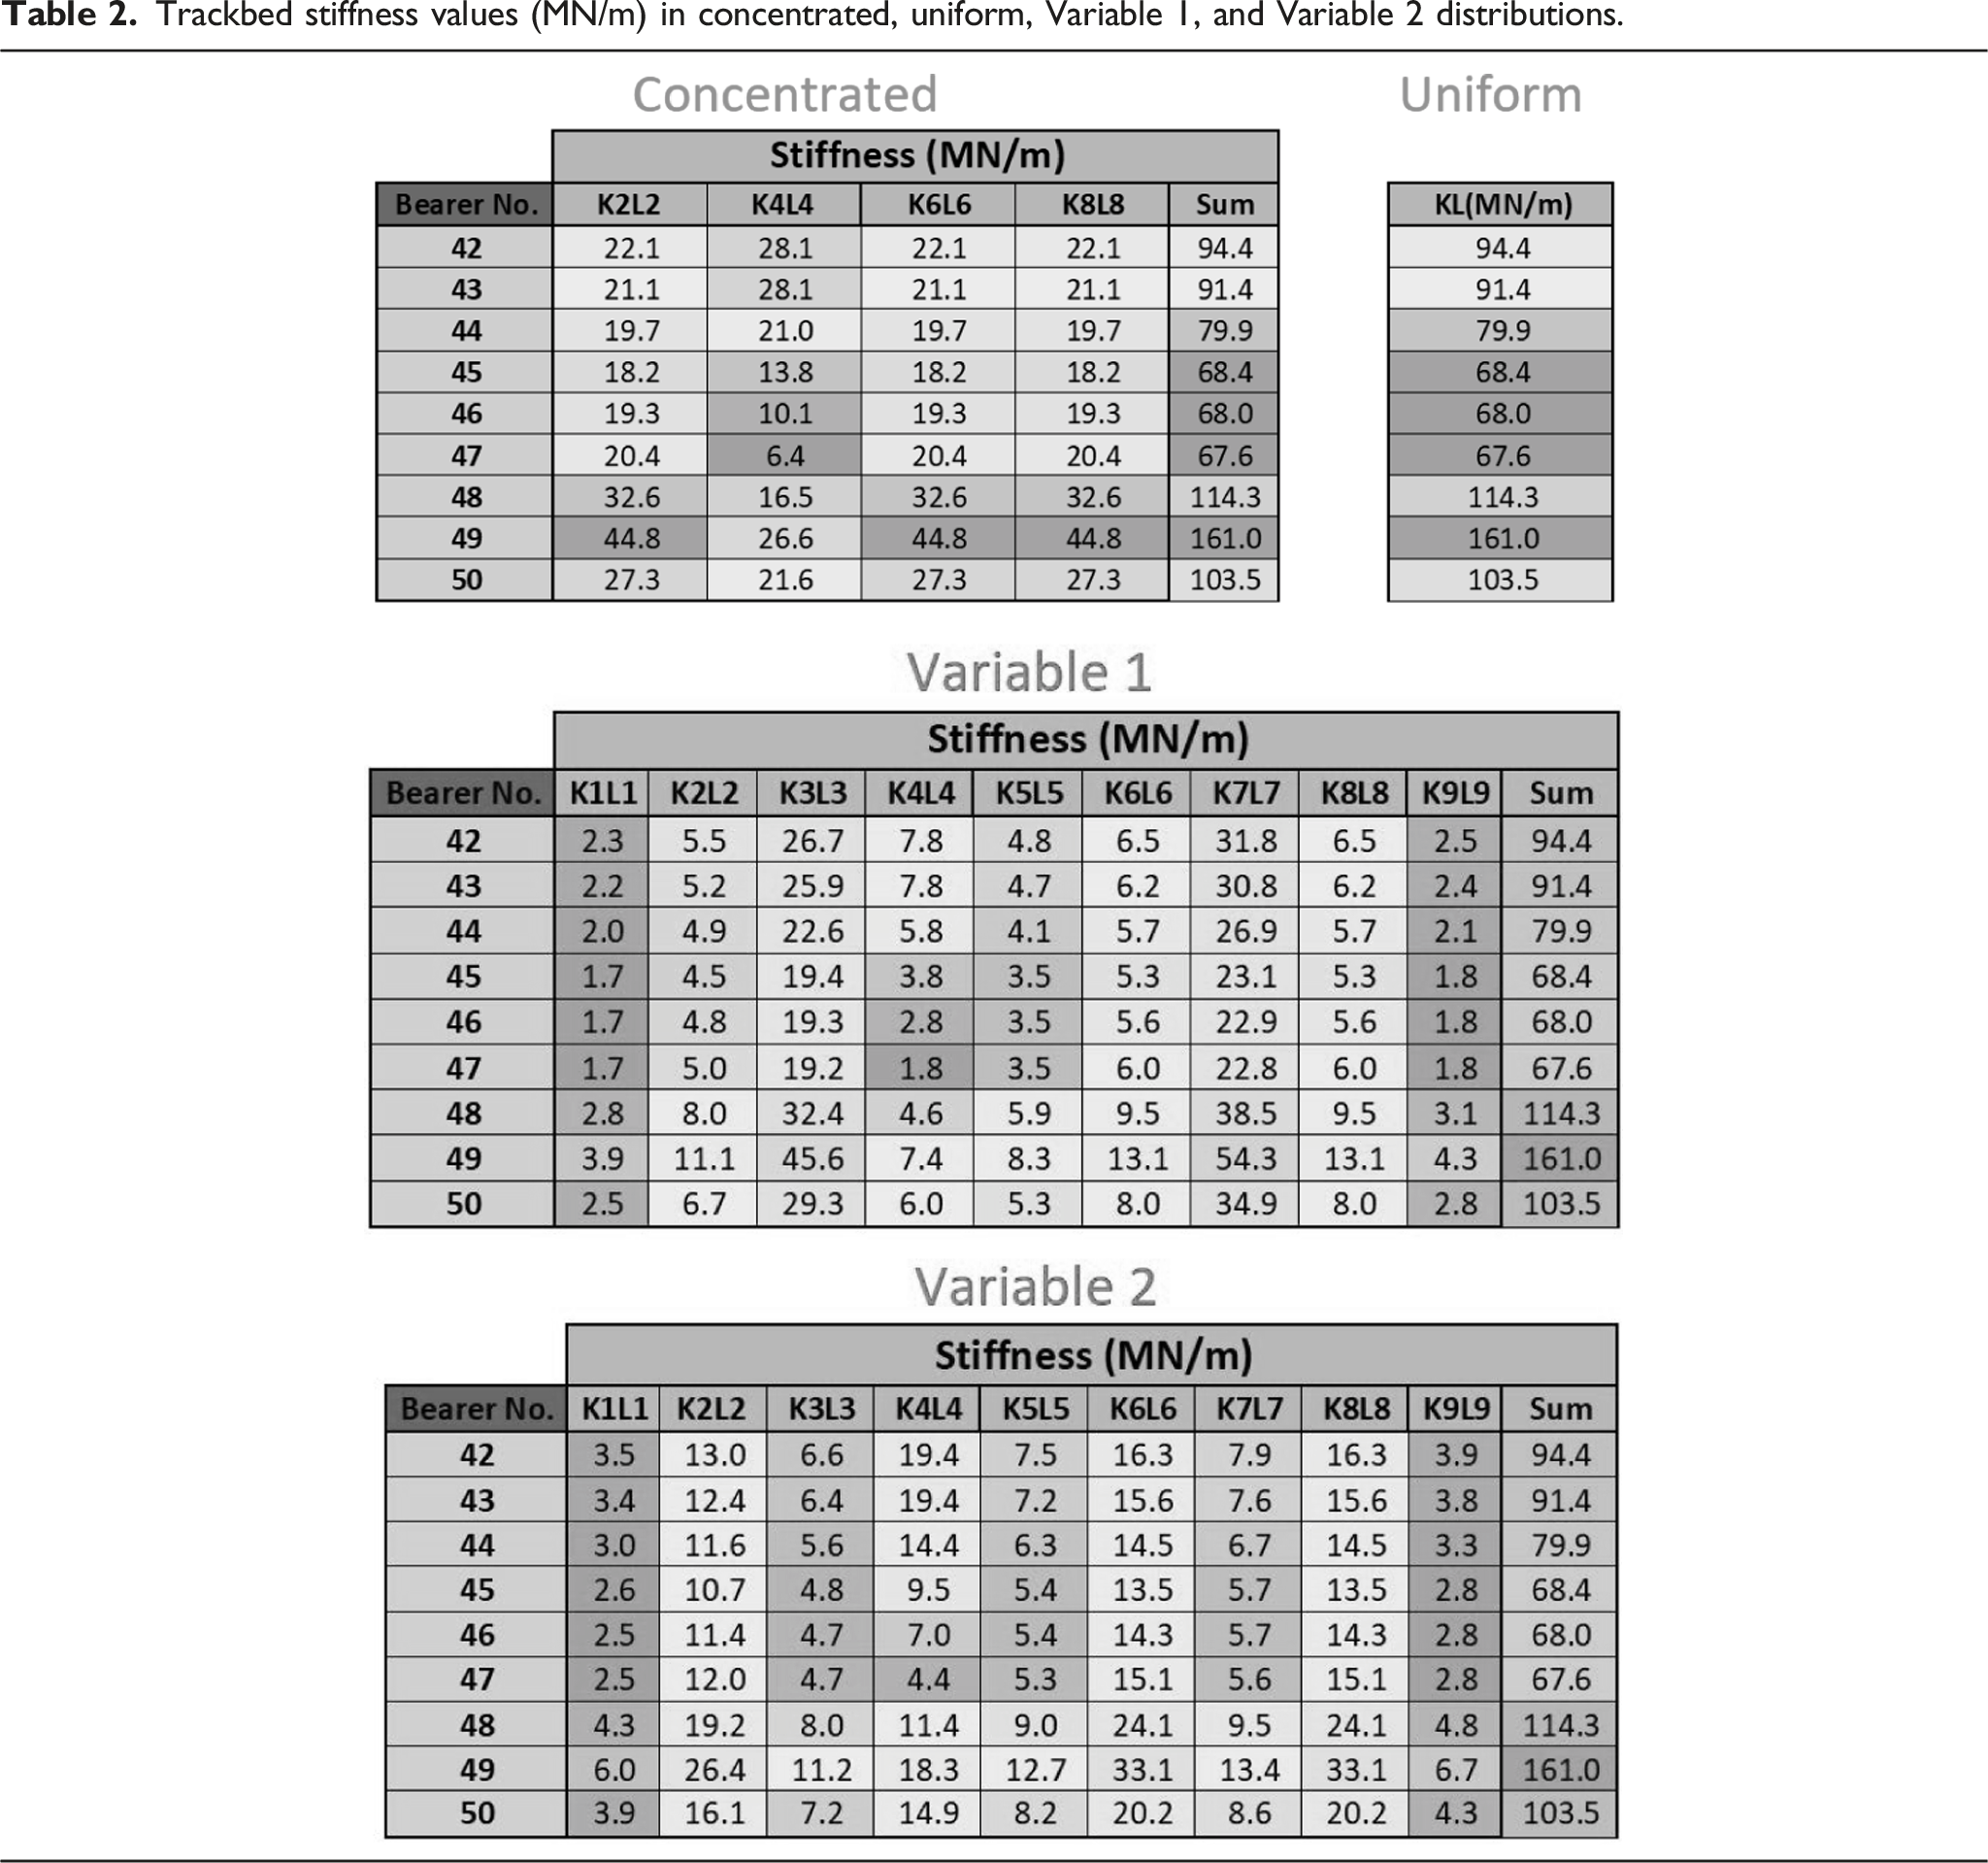
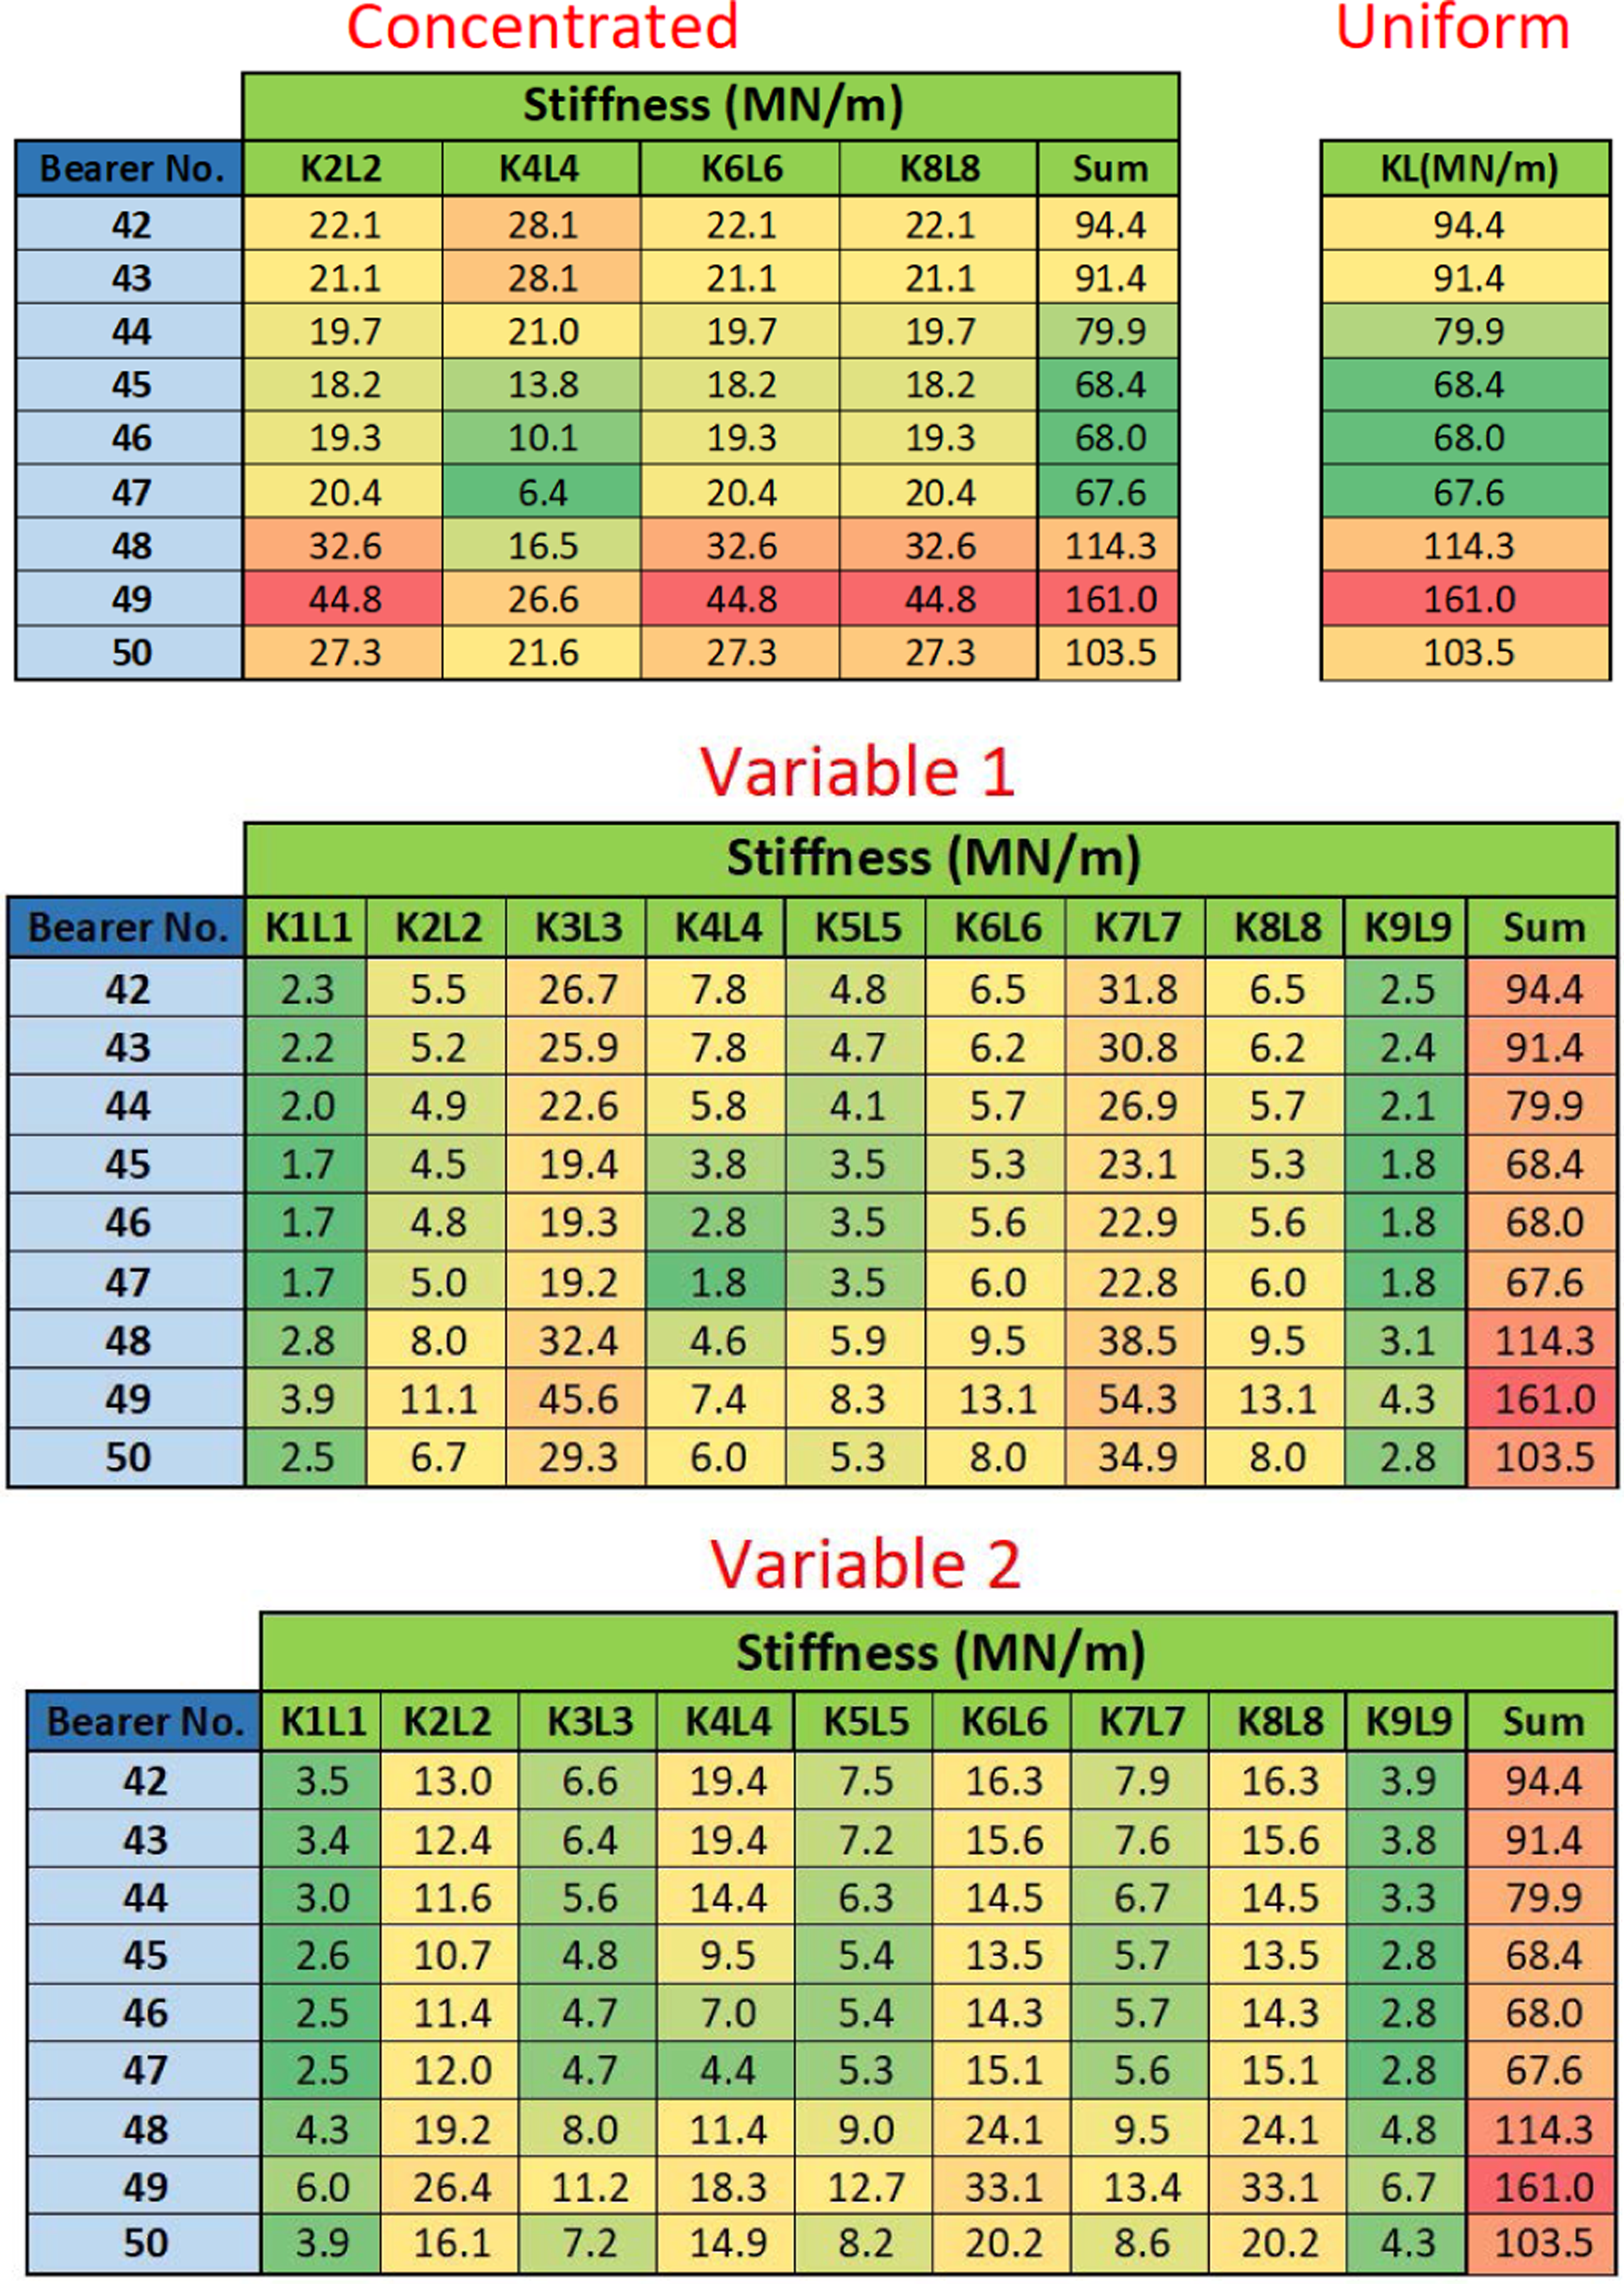
Figure 2(b) shows the composite track stiffness in the crossing panel as seen by a traveling wheel on the crossing for the different assumptions for trackbed stiffness distribution given in Table 2. An initial stiffness increase is observed between sleeper 42 and 43. There are several reasons for this. Firstly, the cast crossing is naturally much stiffer than the nominal rails and beyond bearer 43 the two nominal rails join and are welded to the casting (leg end). Secondly, there is also a local effect due to the FEM boundary: the cast crossing and rails bottom surfaces are resiliently attached to the bearers via the rail pad but rails end sections are hinged. There is then a slowly decreasing composite stiffness between bearer 43 and 45 as the wheel contacts on the outer field side of the wing rail, accelerating downward as the wing rail diverges and load moves further away from the casting plane of symmetry. The sudden stiffness jump above bearer 45 (crossing nose) is due to the wheel load changing from the wing rail to the crossing nose. At this point, the added flexibility from the roll rotation due to the offset loading on the diverging wing rail is removed and placed back more centrally on the crossing casting, leading to this effective higher stiffness. The two peaks just before the bearer 46 and after bearer 47 are due to local changes in the crossing’s geometry, i.e. internal features, and therefore the equivalent bending stiffness. Gradually increasing overall stiffness values from bearer 46 to bearer 47 is due to the increase in the trackbed stiffness values as well as the vee increasing in size and therefore increasing EI. The wheel relocates to the nominal rail at bearer 48 and the composite stiffness reduces again thereafter.
In relation to the variation in support conditions, some observations can be made. The Uniform support condition leads to much higher overall composite stiffness especially past the nose along the vee. The centrebound Variable 1 condition shows a lower composite stiffness on the approach to the nose because it allows more rotation of the casting as the load follows an offset path along the wing rail. Along the casting vee Variable 1 and 2 conditions present the same overall composite stiffness.
A range of boundary conditions (clamped, simply support, and free) along the rail were applied to the rails ends but the response at the crossing nose remained unchanged. Note that the rail is supported in the vertical direction by the bearers. This confirms that the point at which the acceleration has been measured is far enough from the boundaries on either sides and the response is mostly affected by the supports over the bearers rather than the BCs at the ends.
Validation of the model
The validation of the model was performed by comparing the results with those from field measurements by Le Pen et al. 38 This is the same data used for validating a vehicle track interaction (VTI) model and a VI-Rail multi-body system model in Grossoni et al. 36
More recently, in 2019, another field test has been conducted by the University of Southampton (UoS) and the University of Huddersfield (UoH) on the same site, which contains the acceleration time history at different points on the crossing foot. These results are also used for comparison purpose.
Figure 3(a) presents a comparison between the vertical deflection values calculated by FEM and measured in the 2016 field test. The results from both dynamic and quasi-static analyses are presented. The dynamic analysis is performed by applying the time history of the travelling wheel loading (described in section “Finite Element Model”) on the crossing along the wheel path in consecutive load steps. The quasi-static analysis is implemented in the same manner while the transient effects are off. Generally, dynamic analysis results agree with the field test measurements better than quasi-static ones, highlighting the importance of dynamics effect on the system response at such speeds. In reality, because of the train speed, the crossing panel does not have the time to fully deflect at each loading step. The same is happening during a dynamic analysis while in a quasi-static analysis, the model has enough time to reach a stable fully deflected state at each loading step. (a) Bearers’ vertical deflection below the 6 ft crossing rail when the wheel travels over bearers, also showing input load and (b) a comparison between the deviation percentage of FEM and measured data resulted.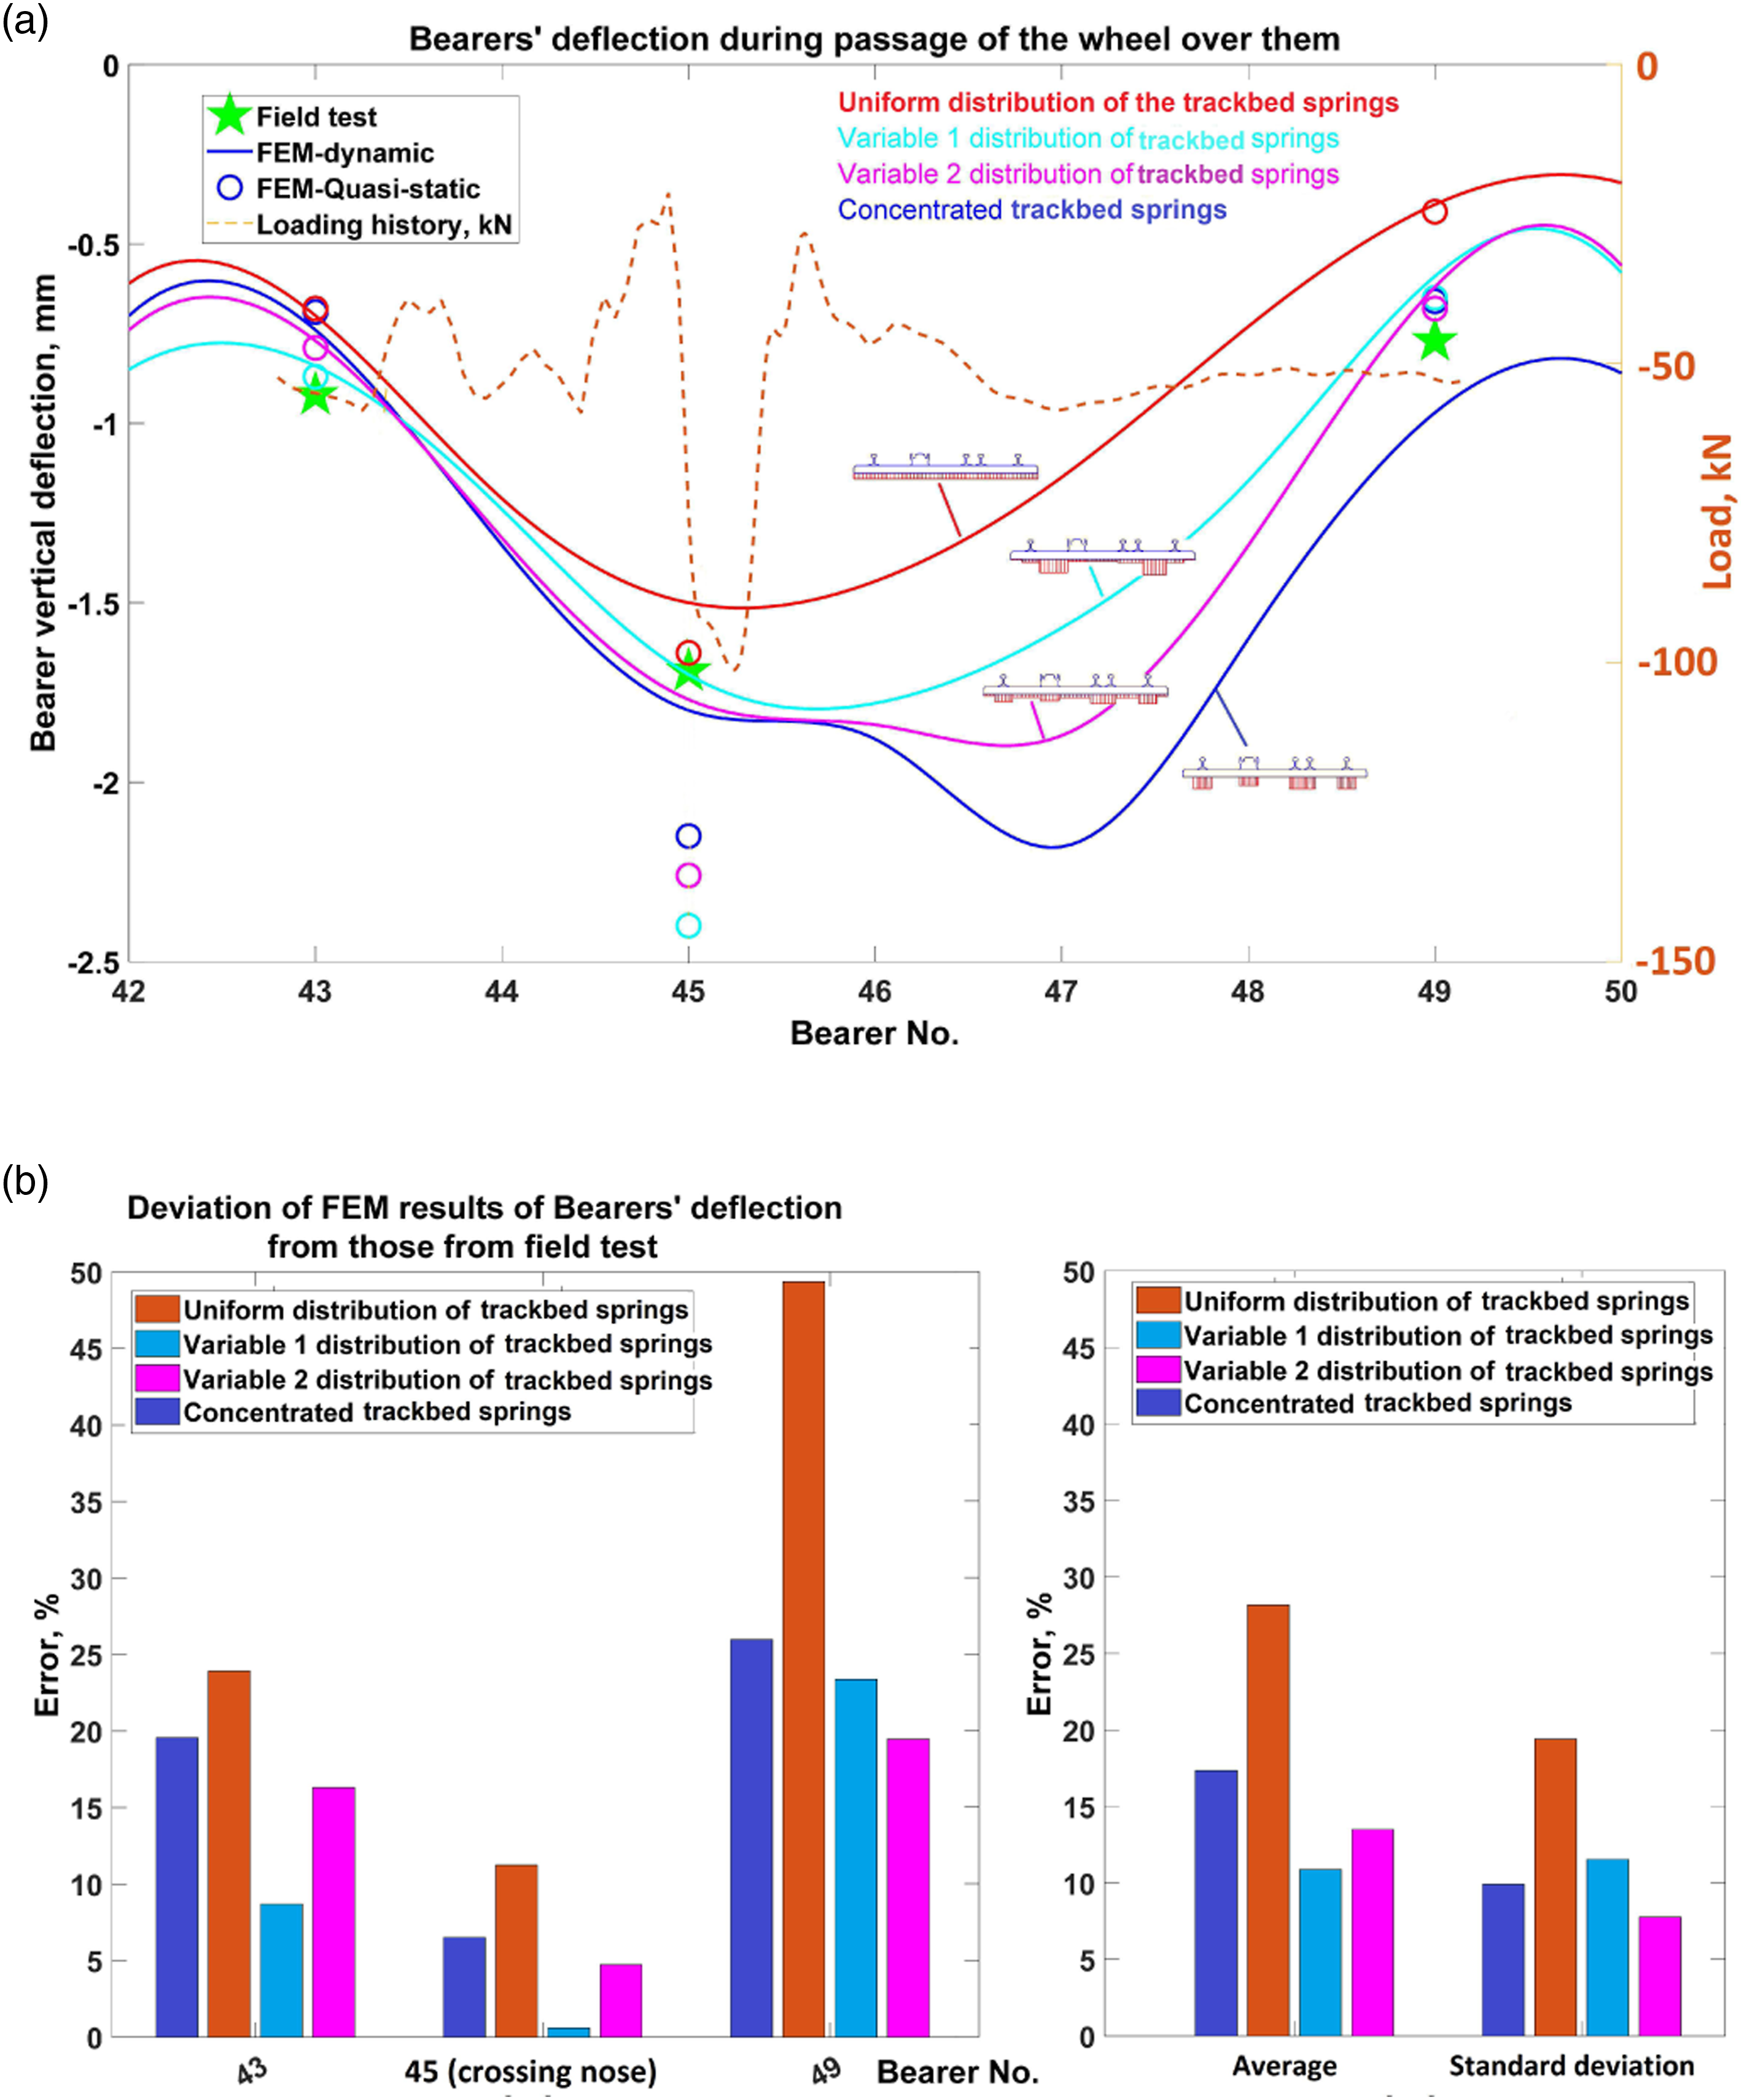
As can be seen in Figure 3(a), Variable 1 and Variable 2 assumptions give the most consistent results with the field measurements, whilst the uniform distribution leads to lesser deflection and the concentrated distribution to greater deflection. Figure 3(b) shows the percentage difference between the FEM results and the measurement for peak deflection values at specific bearers for the four different support assumptions. Variable 1 and 2 give the best results overall. Variable 1 shows the lowest deviation at bearer 45 (crossing nose) as well as the minimum average deviation. Its standard deviation is comparable to that from Variable 2. The results presented onward in this study are based on Variable 2 assumption. The results achieved in terms of deflection and therefore bending of the cast crossing are satisfactory, so that the analysis of foot stresses can be pursued.
For the purpose of this paper, simulation of a typical (not a specific) crossing panel is proposed. Figure 4 shows the vertical acceleration results at a location on the crossing foot flange in the nose region obtained by FEM and compared to the field test conducted by UoS in 2019. The point of measurement is shown by a white star in Figure 1(b). Unfiltered loading is used in the numerical analysis, to ensure sufficient energy input to the model to observe as much as possible in the frequency domain. The trackbed stiffness distribution is based on Variable 2. The displacement in frequency domain is calculated using a double integration technique in Matlab to convert the acceleration signal into a displacement. For doing this, an integrator filter with transfer function H(Z) = 1/(1 − Z−1) has been used. A low-pass Infinite Impulse Response (IIR) filter with a pass band frequency of 2.5 kHz is then applied. A comparison between the vertical acceleration at a point on the crossing foot in nose region, shown by a hidden star in Figure 1(b), obtained by FEM and from a field test conducted by the University of Southampton (UoS) in 2019: (a) acceleration time domain, (b) acceleration in frequency domain, and (c) displacement in frequency domain.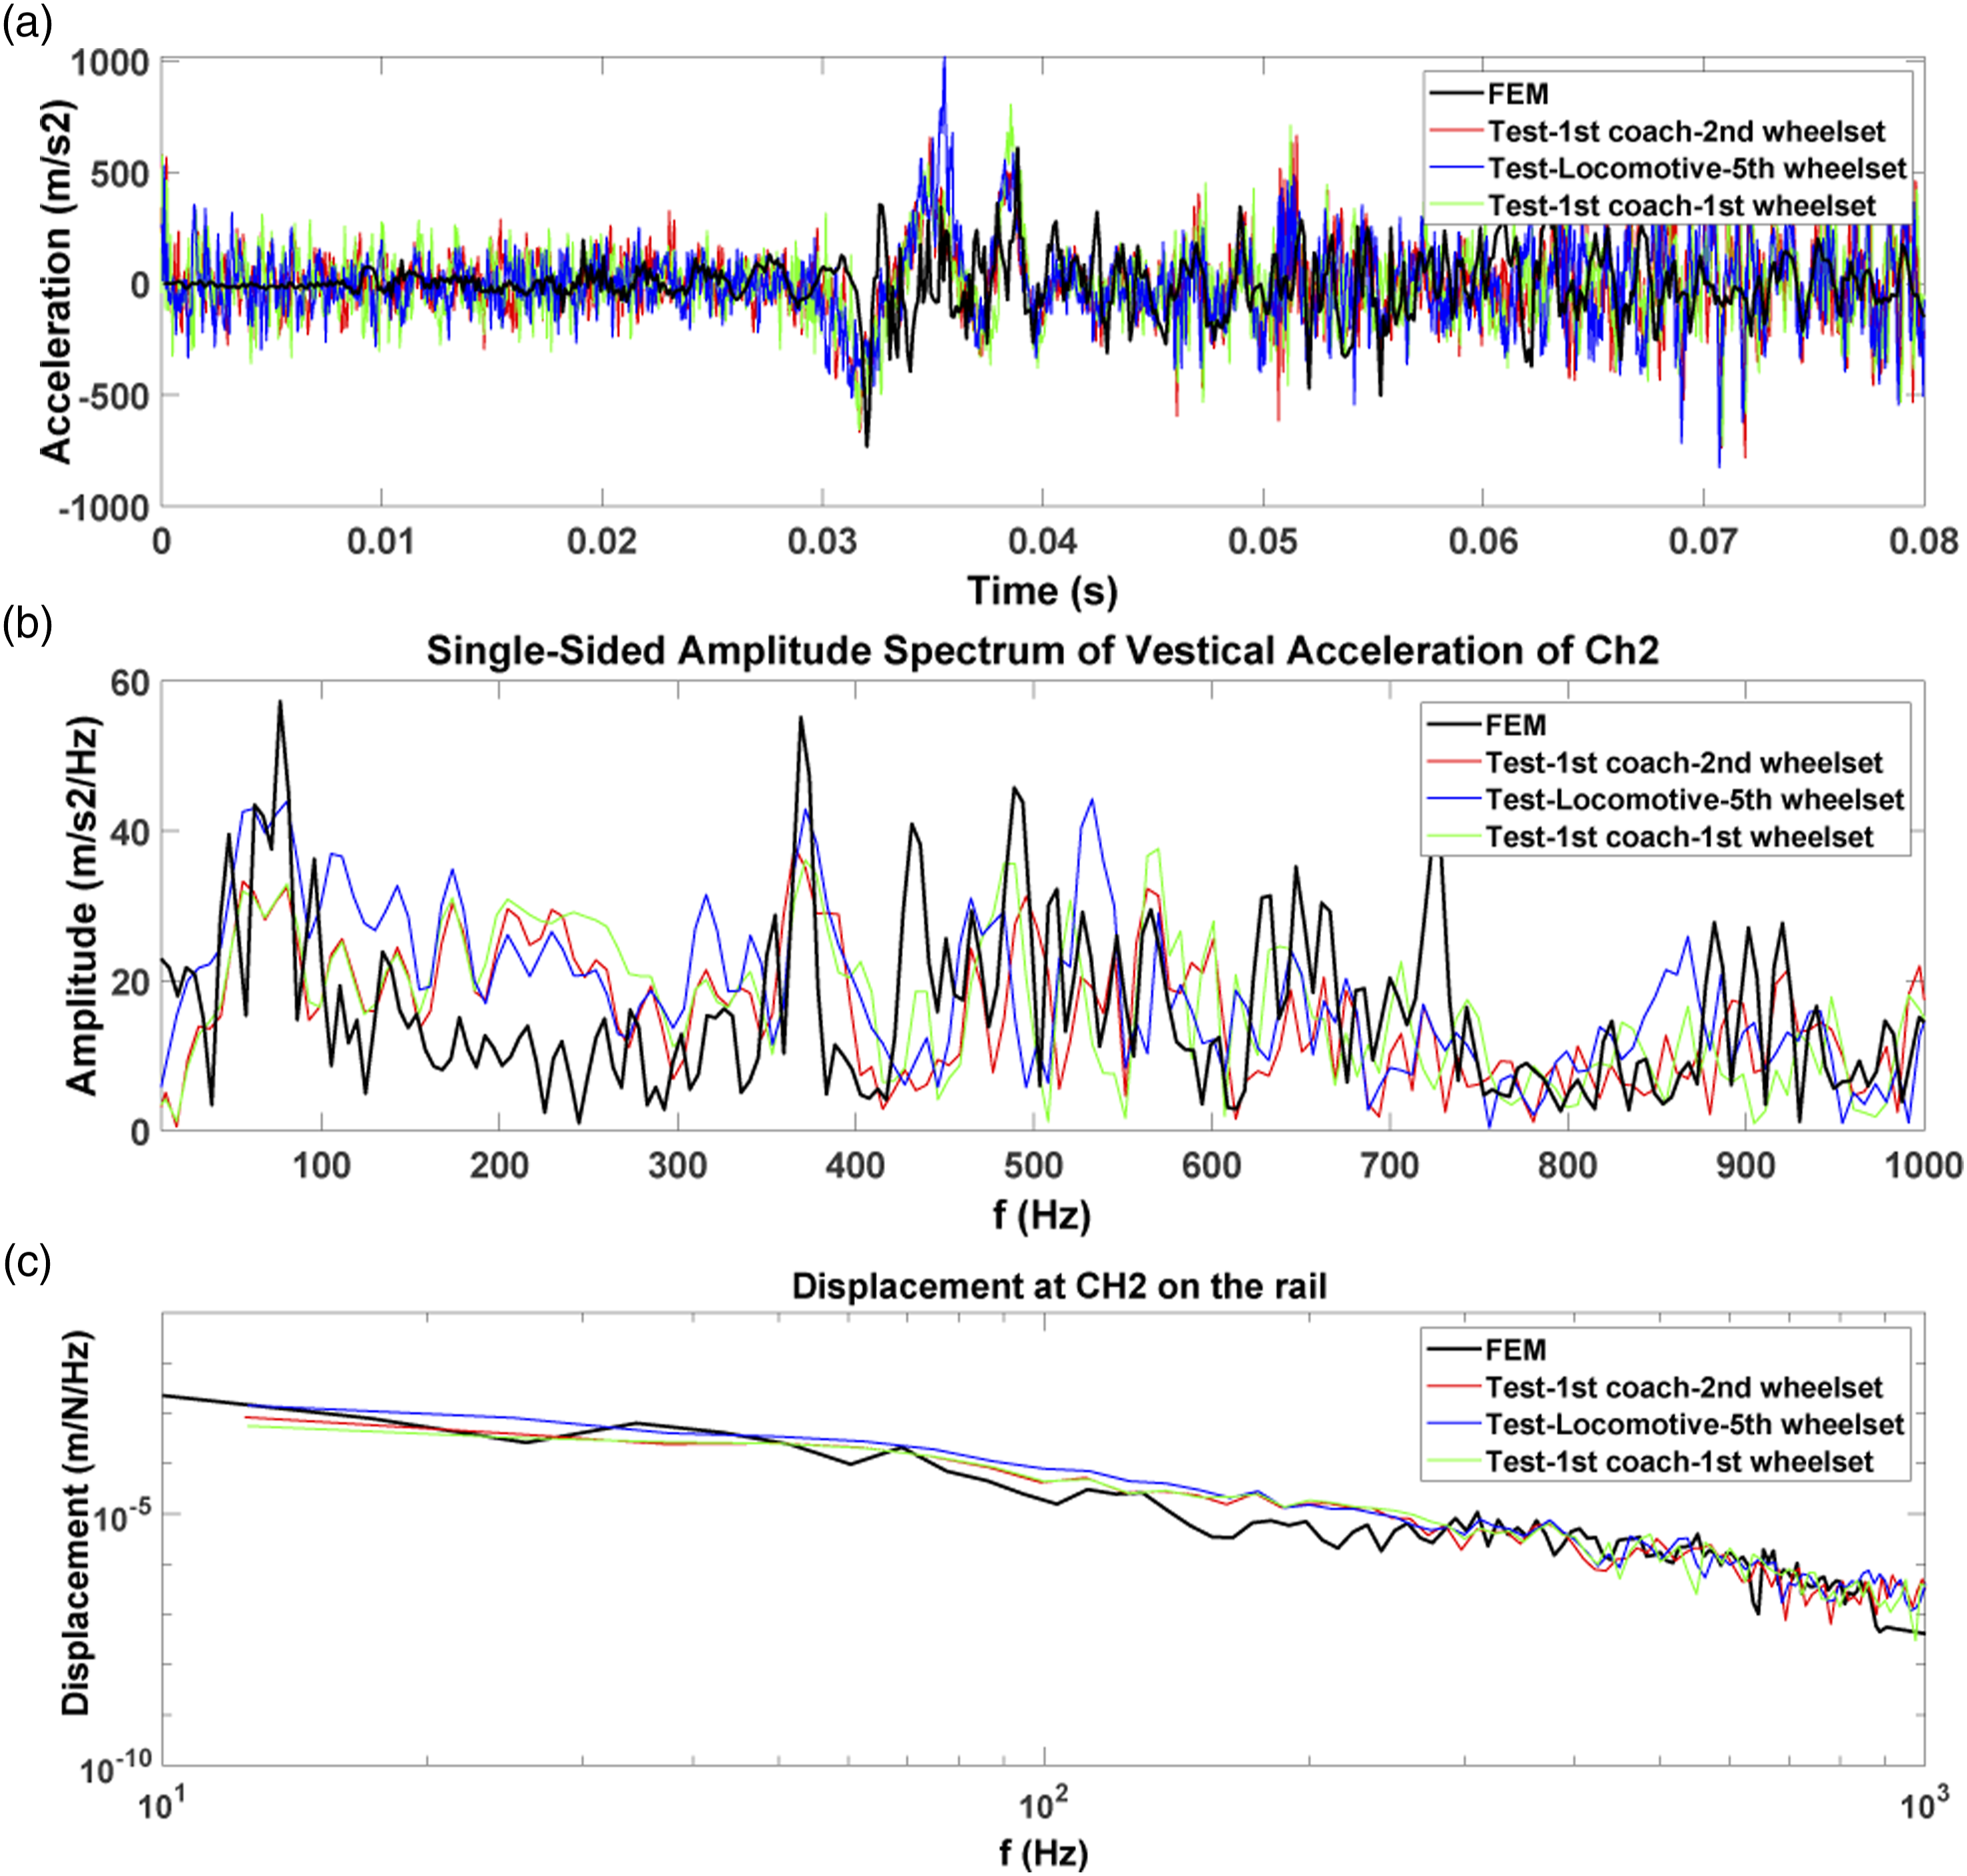
The dynamic properties of the track were initially assumed to be the same as those reported in Table 1 from the field test in 2016 36 and the calibrated trackbed stiffness distribution based on Variable 2. Because the calibration of the support stiffness is a complicated process, 36 it was decided to update the rail pad properties instead. The best result was achieved by increasing the rail pad stiffness to 840 MN/m, to obtain a reasonably good match with rail accelerations, as shown in Figure 4. This complies with a medium pad property as reported in 14 and is a plausible assumption, although it is a significant change from the previous modelling assumption. While recalibration of the model trackbed support stiffness would be required (this is an ongoing PhD work), the proposed approach also shows that on the one hand, the rail pad property considered initially might be on the low side (static rather than dynamics properties), and on the other hand that installed rail pad properties were at the beginning higher or that they have significantly changed (increased) since installation due to stiffening of the pad material.
Figure 4 depicts the time and frequency responses measured in passage of three different wheels in the test and calculated with FEM at the point shown in Figure 1(b). As can be seen in Figure 4, generally a reasonably good agreement is seen in both time and frequency domains in terms of qualitative shape and peak to peak values which is enough for simulation of a typical crossing panel. At 0.032 s, the transition from wing rail to crossing nose occurs. A good matching is observed both in values and trend around this time. At the beginning, the FE analysis starts with a quasi-static analysis in which the acceleration is zero whereas, in the field measurement, there is an initial vibration due to the passage of previous wheels. After 0.07 s, the FEM acceleration reduce again while the measurement keep to a sustain level most probably because of the approaching subsequent wheel and the general vibration from the entire train passage. Repetition of the peaks in FFT’s calculated from different wheels passages confirms that those frequencies are properties of the crossing panel. This has clearly happened in all frequencies lower than 200 Hz.
For proving the adequacy of the mesh refinement for stress analysis at the critical region of the flange corner at the foot of the bearer, two element sizes are generated, as shown in Figure 5. The perfect agreement between the stress results shown in this figure proves in the adequacy of the coarser mesh for stress analysis. von-Mises stress calculated using two degrees of mesh refinement at crossing foot critical region: coarse mesh (0.5 × 1 × 1 mm) and fine mesh (0.2 × 0.2 × 0.4 mm).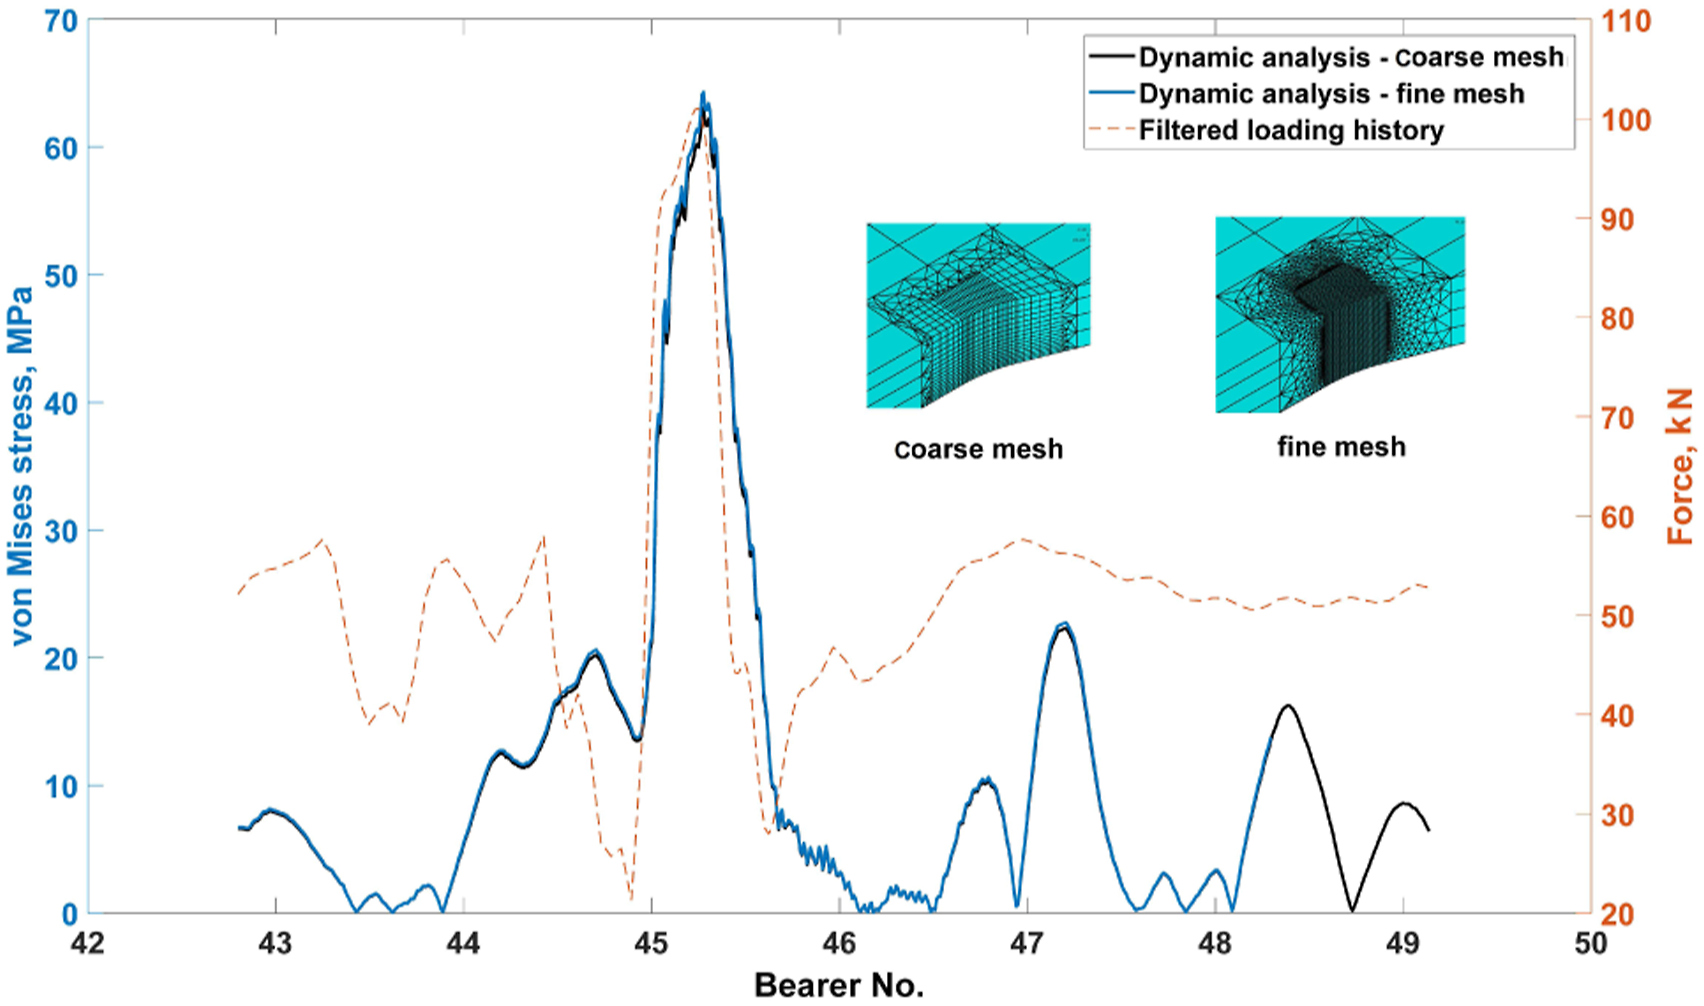
Results
Figure 6 illustrates six vibrational modes of the crossing panel as obtained from the FE model. The modal analysis has been performed in forced condition with P2 at the nose to reflect the loaded condition of the crossing. The focus is on describing the lower frequencies shown in compared against measurement in Figure 4 as well as a distinctive the crossing torsional mode appearing at the higher frequency of 369 Hz. • At 43.8, 61.7, 76.5, 96.8, and 133.7 Hz, the cast crossing mainly vibrates in the vertical bending direction, together with the bearers and the adjacent rails (Figures 6(a) to (e)) with increasing harmonics (1st bending, 2nd bending etc…) of the crossing and then of the bearers. The theoretical P2 loading occurs in this range of frequency and is expected to be triggering all these modal responses in the track. • At 369 Hz, the crossing vibrates in torsion as depicted in Figure 6(f), which is being captured by measurement on the foot of the rail. This mode is important in and observed in both the model and the measurement (Figure 4(b)), as it captures the effect of the wheel load transitioning from the wing rail to the crossing nose and vice versa. Vibrational modes of the crossing panel: (a)-(e) overall bending mode and (f) crossing torsional mode.
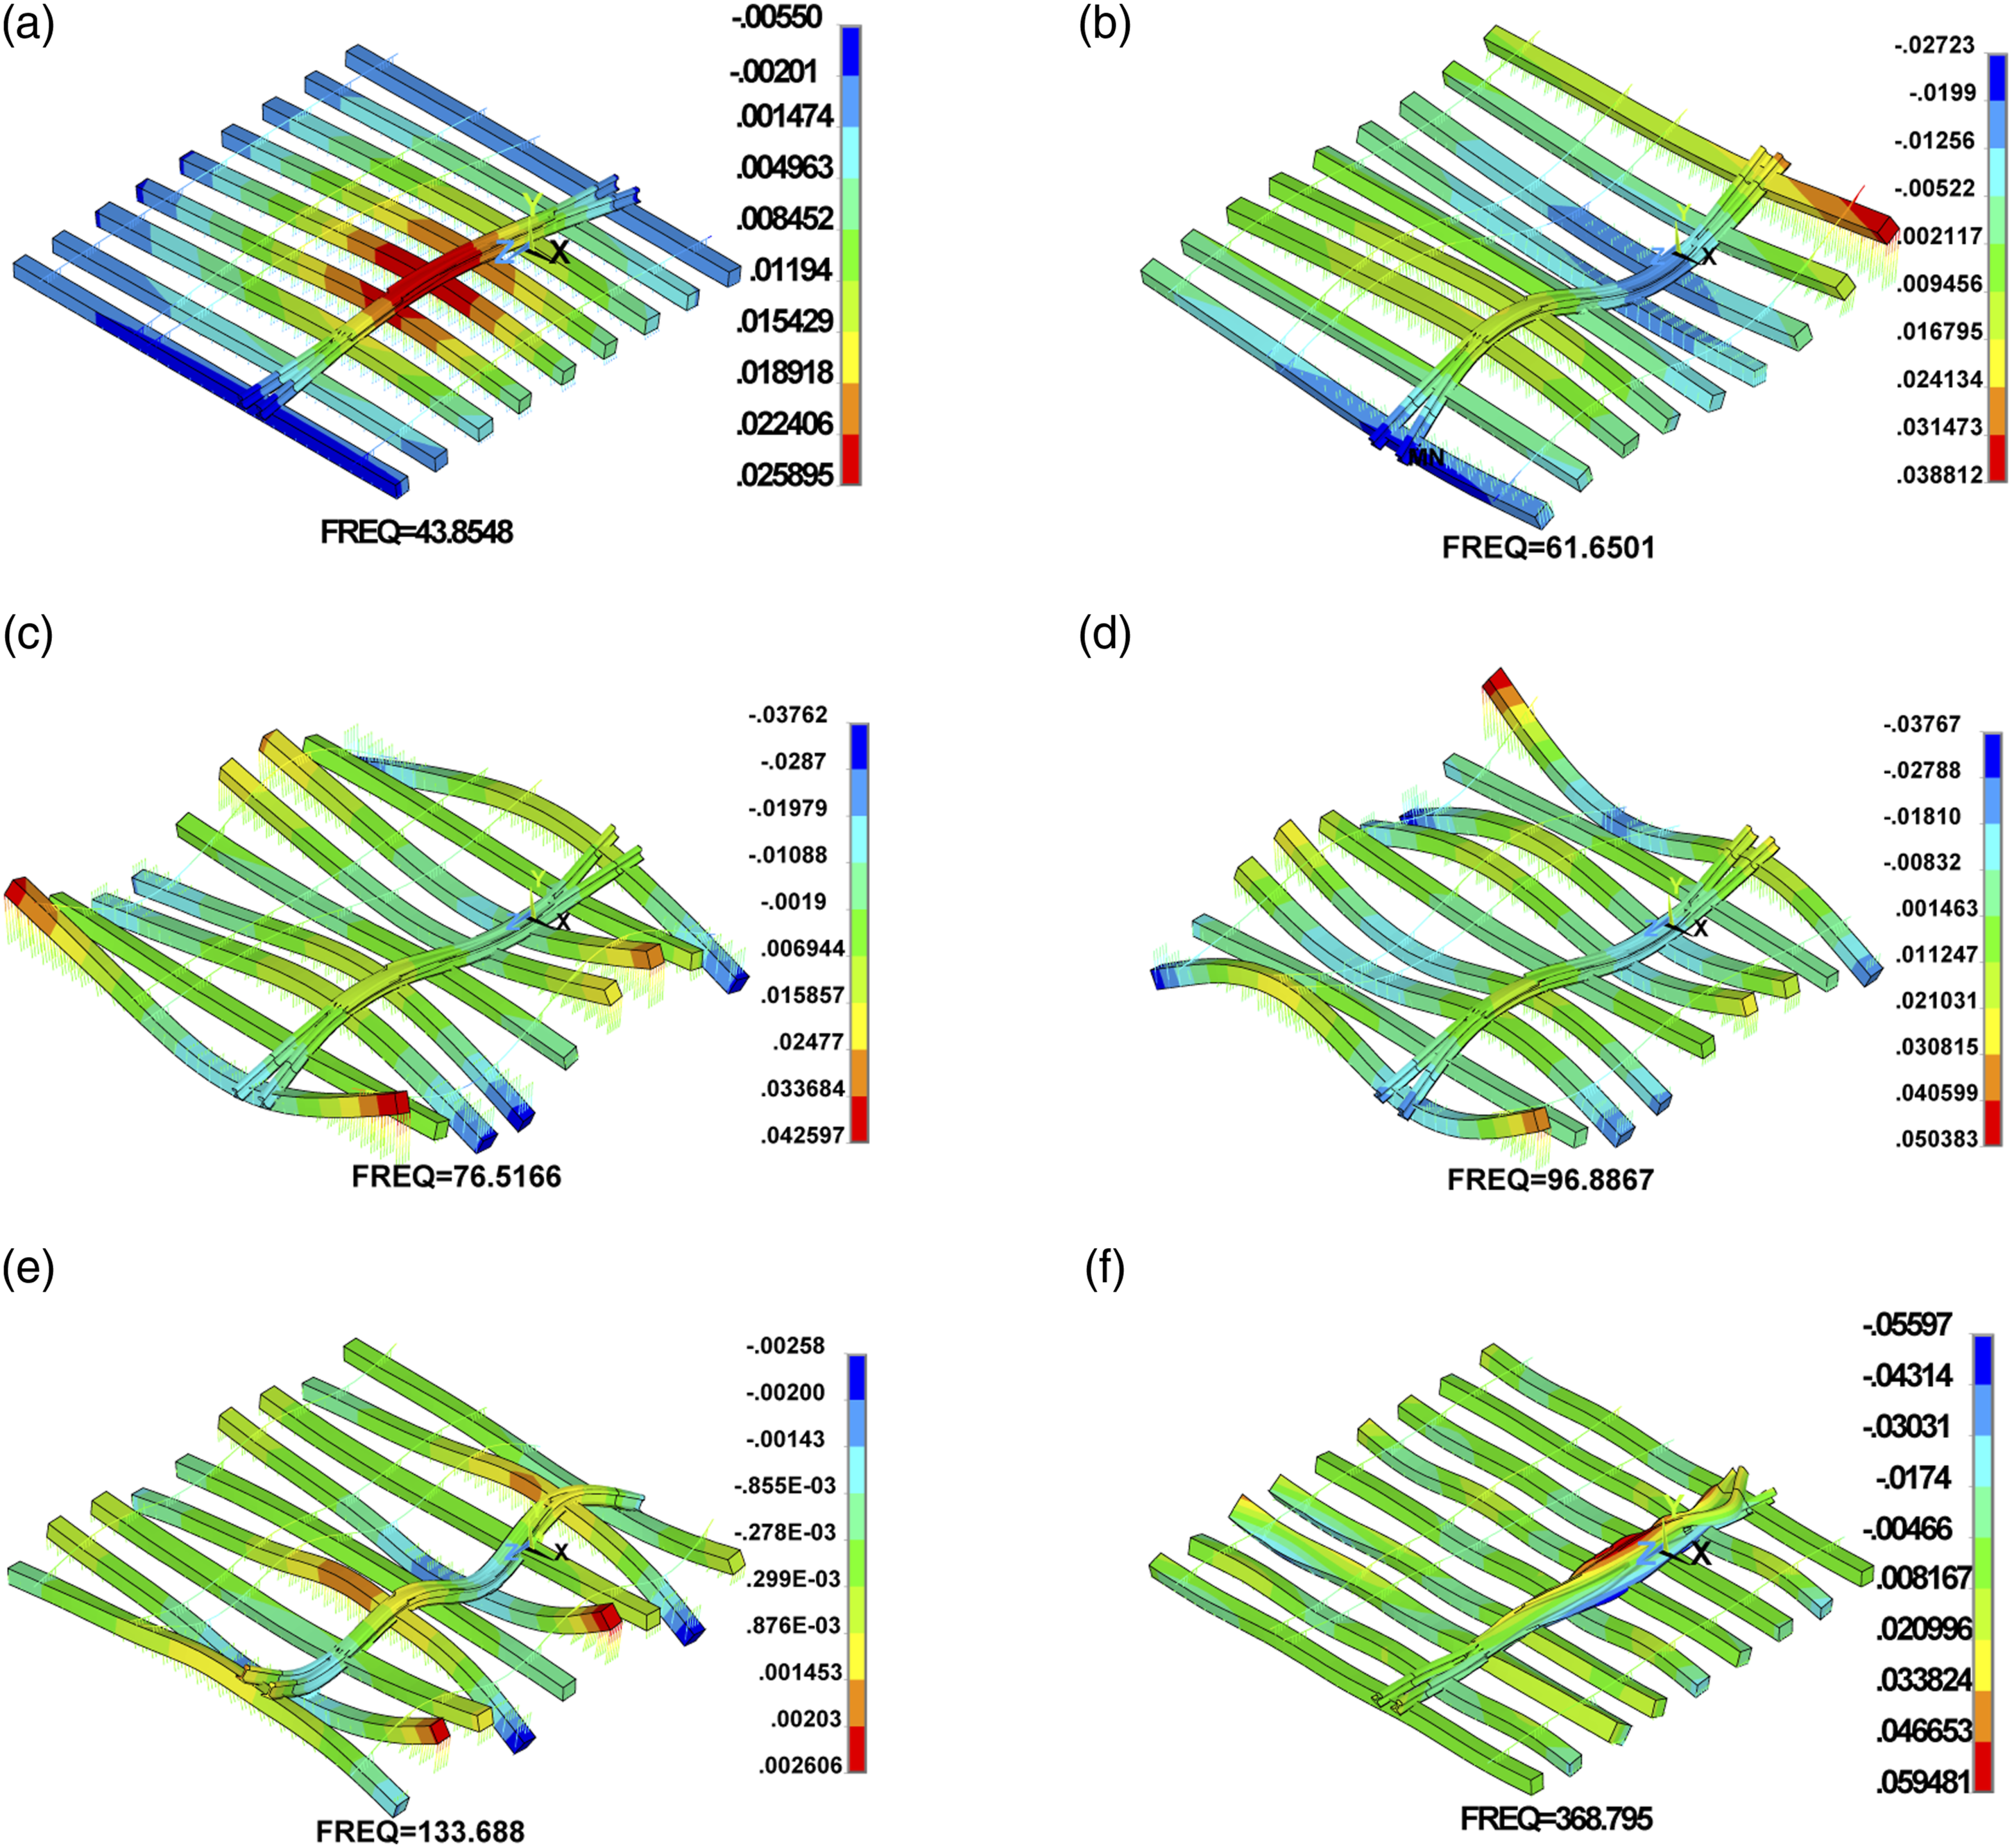
During the train passage over the crossing nose, successive wheels apply repeated impact loads that can be destructive for the track and its components. Furthermore, a number of crossing panel bending vibration modes (combined crossing, rails and bearers) appear in the low frequency range expected to be excited by the P2 force input. These bending modes, in particular of the bearers can be anticipated to lead to increased acceleration of the ballast, potential displacement or migration of ballast stones away from the application load, and therefore local settlement and formation of hanging bearers as observed on the site reported here and many others.
Although the modal analysis presented above does not account for the wheelset unsprung mass, because modal analysis requires the system to be in a fixed state, i.e. not a moving mass; in order to understand the local effect of the unsprung mass at the location of load transfer, another modal analysis was performed considering the wheel mass at the crossing nose as well as at the corresponding location on the opposite rail (500 kg per wheel on each side). The result showed reduction in the first bending frequency (Figure 6(a)) from 43.8 Hz to 35.7 Hz, the second mode (Figure 6(b)) from 61.7 Hz to 59.7 Hz and the third mode (Figure 6(c)) from 77.2 Hz to 76.5 Hz.
For the stress analysis at crossing foot, the loading history is filtered to remove the high frequency content, as the rail inertia prevents the high-frequency P1 loading to transfer to the track components beneath the rail. Figure 7(a) illustrates the vertical deflection of the crossing nose when the wheel travels along the crossing, also showing the filtered loading. The results are based on the following three input scenarios: • full dynamic analysis using previously calculated dynamic load history
36
as a moving load (blue line), • quasi-static analysis using the same previously calculated dynamics load history,
36
reaching a steady state solution at every location (black line), and • quasi-static analysis (steady state solution at every position) using a constant travelling load equal to the P2 peak force of 101 kN (green line). Deflection results: (a) Vertical deflection of the crossing nose when the wheel travels through the crossing. The loading history is low-pass filtered to eliminate P1 impact, (b) vertical deflection of the crossing panel at the moment of impact on the crossing nose.
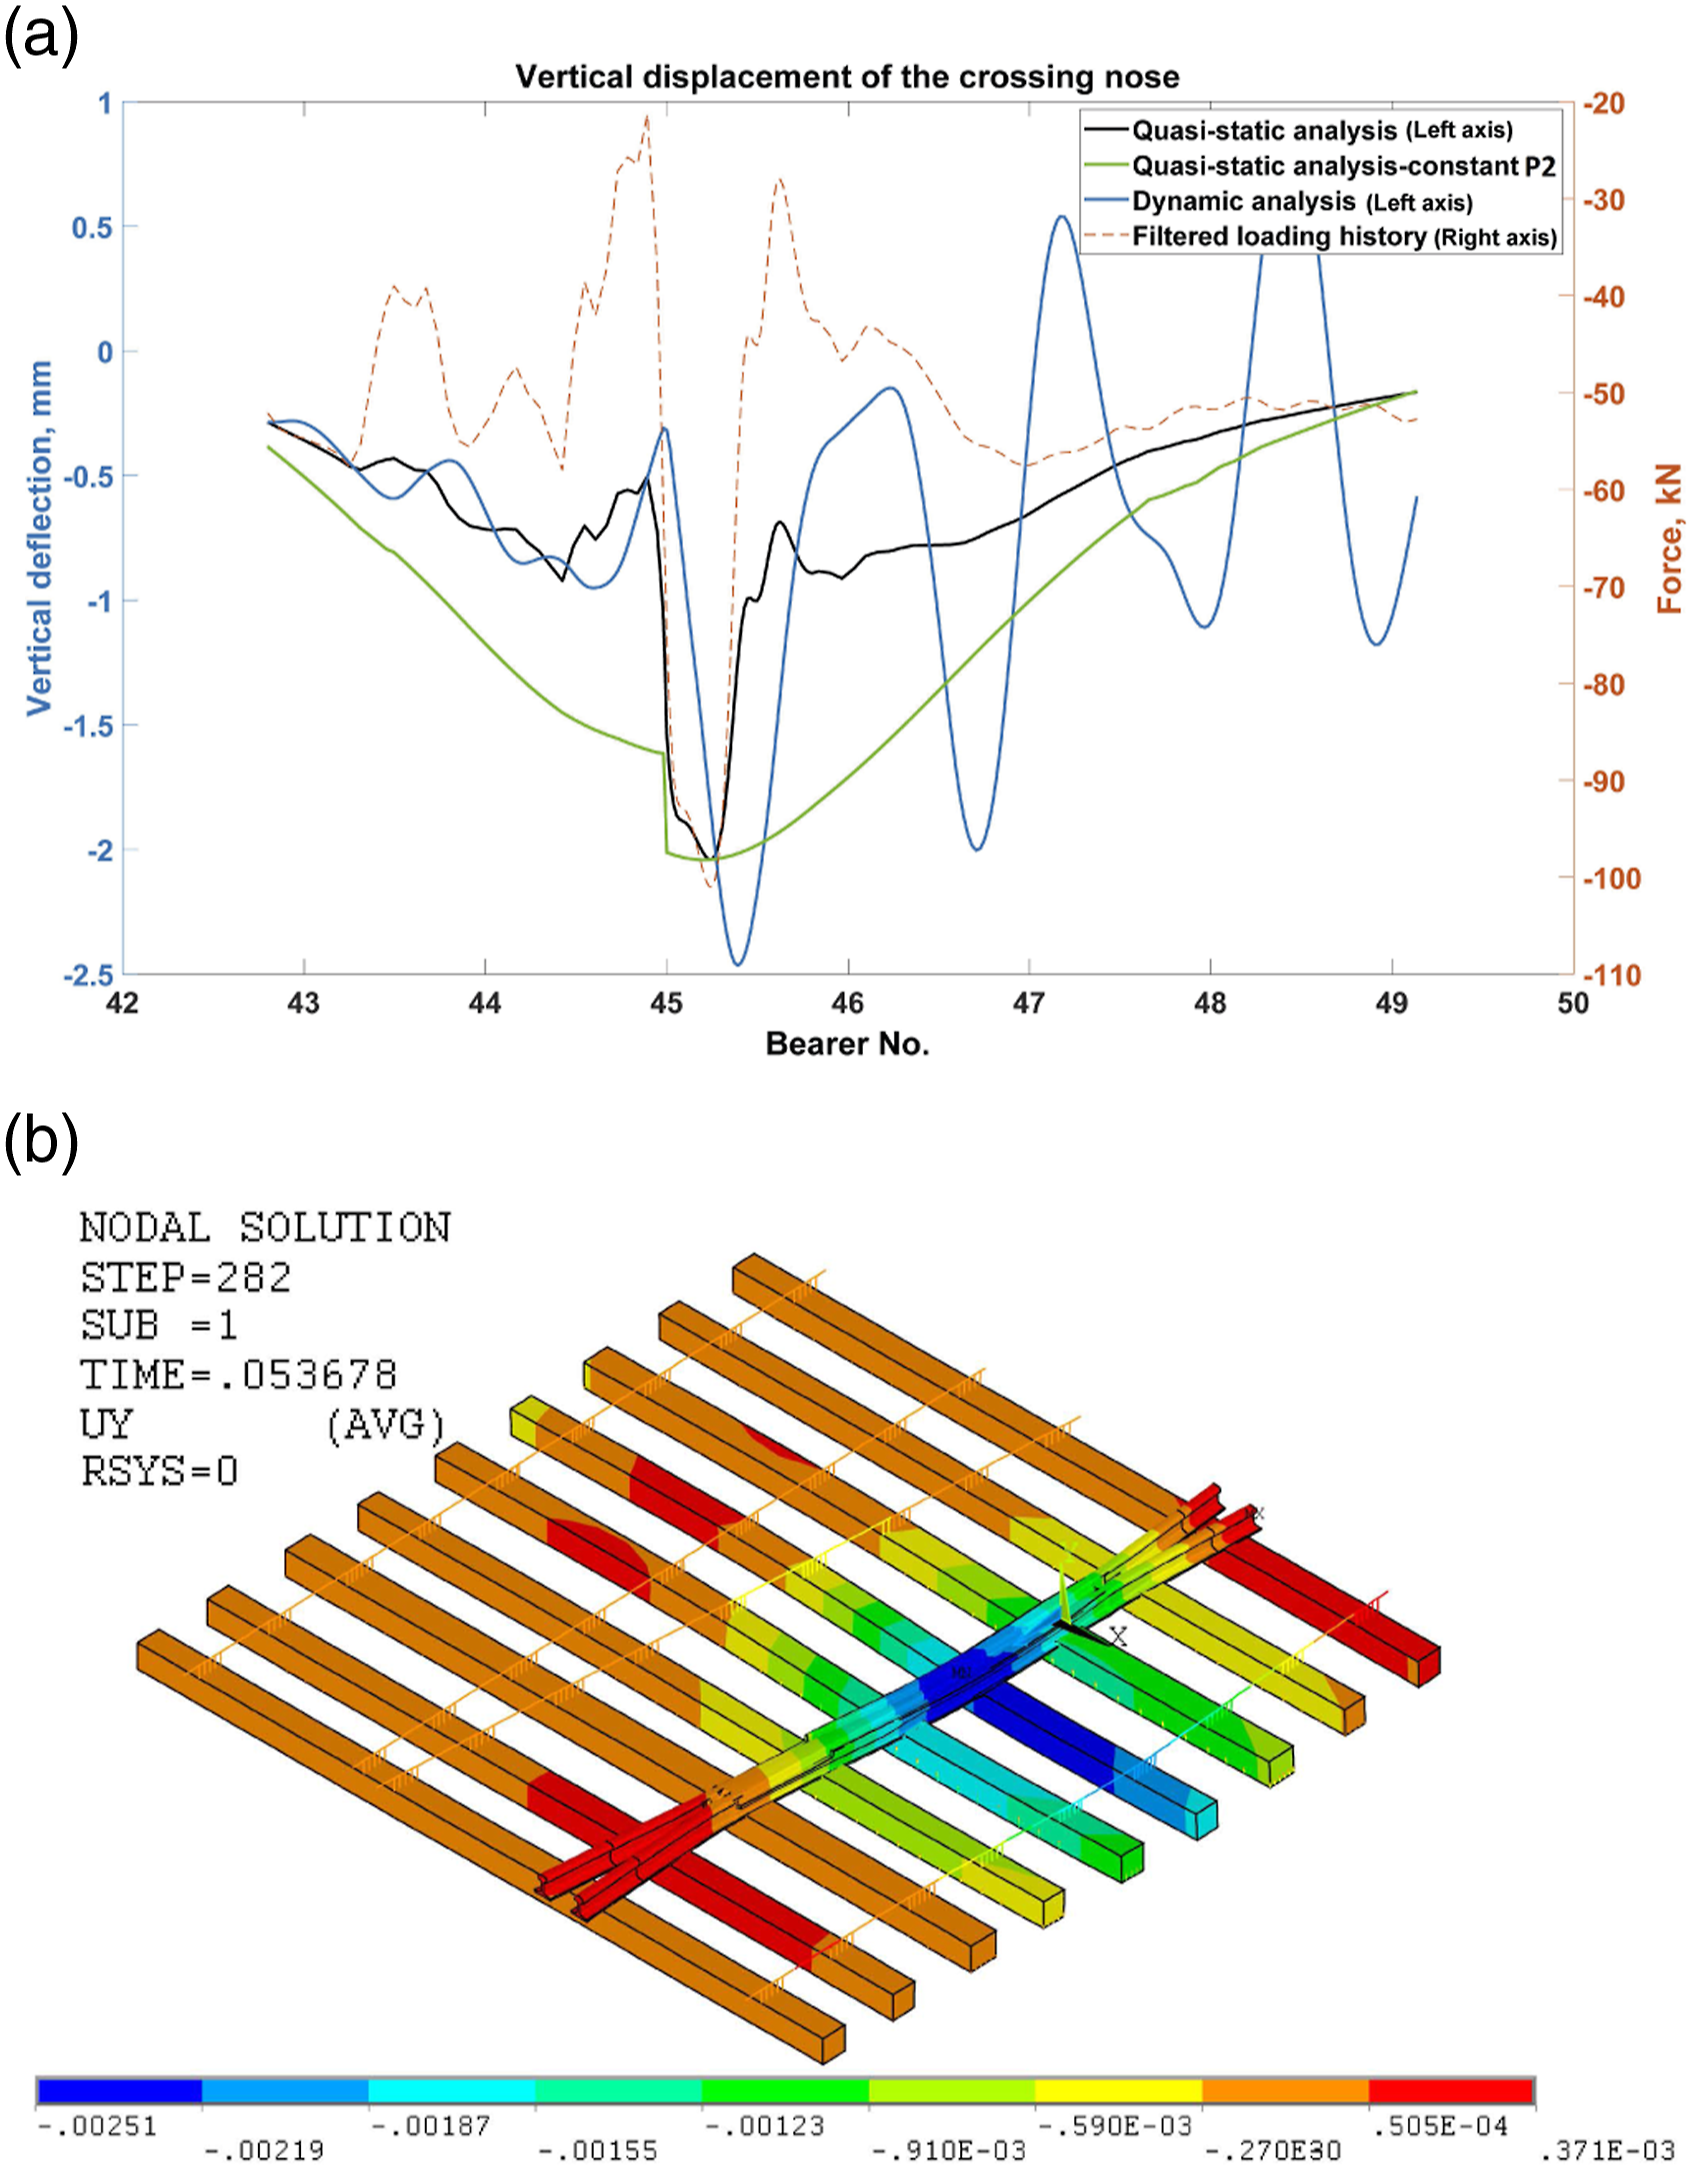
The reasons for the three scenarios above, was to understand the incremental effect of considering just a constant peak load equivalent to the P2 value along the entire load transfer area (scenario 3) as define in TKR012 standard, 40 versus considering a quasi-static load where the P2 magnitude is only occurring in a narrow location of the load transfer (scenario 2), versus considering the actual full dynamic response (scenario 1).
The discontinuity of the deflection line at the crossing nose (Bearer No.45) in the constant P2 loading is due to transferring the wheel load from the wing rail to the crossing nose. It is shown that for the quasi-static analyses based on the varying input load, the deflection follows the changes in the loading while in the dynamic analysis it is not entirely the case. In effect, after the impact load at the crossing nose, in the dynamic analysis, the crossing vibrates with frequency of 40–45 Hz around the quasi-static response and the peak deflection increases by about 20–25% compared to the quasi-static and constant P2 cases. This frequency is in the range of the first natural bending mode of the crossing panel depicted in Figure 6(a). The panel is oscillating after the impact loading at the crossing nose as the damping values reported in Table 1 are in the lower bounds of values in the literature. Figure 7(b) illustrates the vertical deflection distribution of the crossing panel when impact loading occurs at the nose.
Jenkins et al.
39
presented a formula as an approximation of P2 impact load:
Calcuation of P2 with different Jenkin’s parameters value.
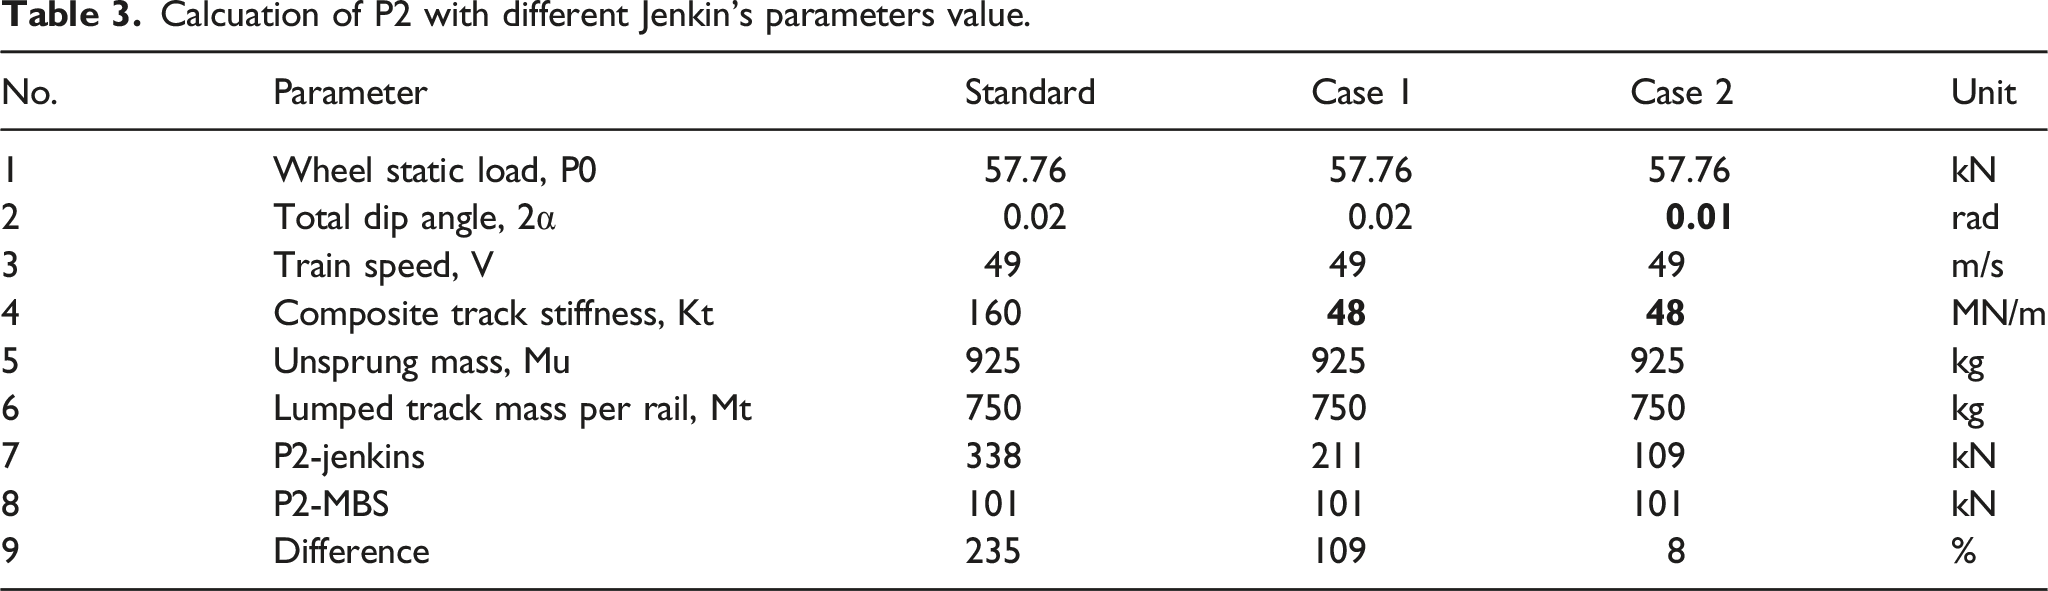
Figure 8(a) illustrates the critical von Mises stress history at the crossing foot when the wheel travels over the crossing. The highest stress values resulted from different analyses are relatively similar, approximately 80 MPa, except for the standard Jenkins calculated P
2
= 338 kN as stated in Table 3. In this case, the load history for P
2
= 101 kN (dashed line in 8a) has been scaled to 338/101 in the P
2
peak region (dotted line in 8a). As can be seen, the standard Jenkins calculated stress for P
2
= 338 kN suggests much higher peak stress value circa 170 MPa. Introducing such a higher design stress suggests a much higher safety factor and an overestimated loading affects the whole crossing design against fatigue. Special design consideration such as geometry modifications should be made at local weak points on the crossing foot. Nonetheless, the dynamic considerations lead to a few repeated low level stresses after the wheel passage, and this work shows that approximating the dynamics load with an equivalent P
2
force envelope is sufficient to capture peak stresses for foot fatigue analyses in the region of the load transfer. Stress results: (a) Critical von Mises stress history at crossing foot when the wheel travels through the crossing and (b) stress contour of the crossing panel at the moment of impact on the crossing nose resulted from dynamic analysis. The focus is on the critical stress at the foot crossing.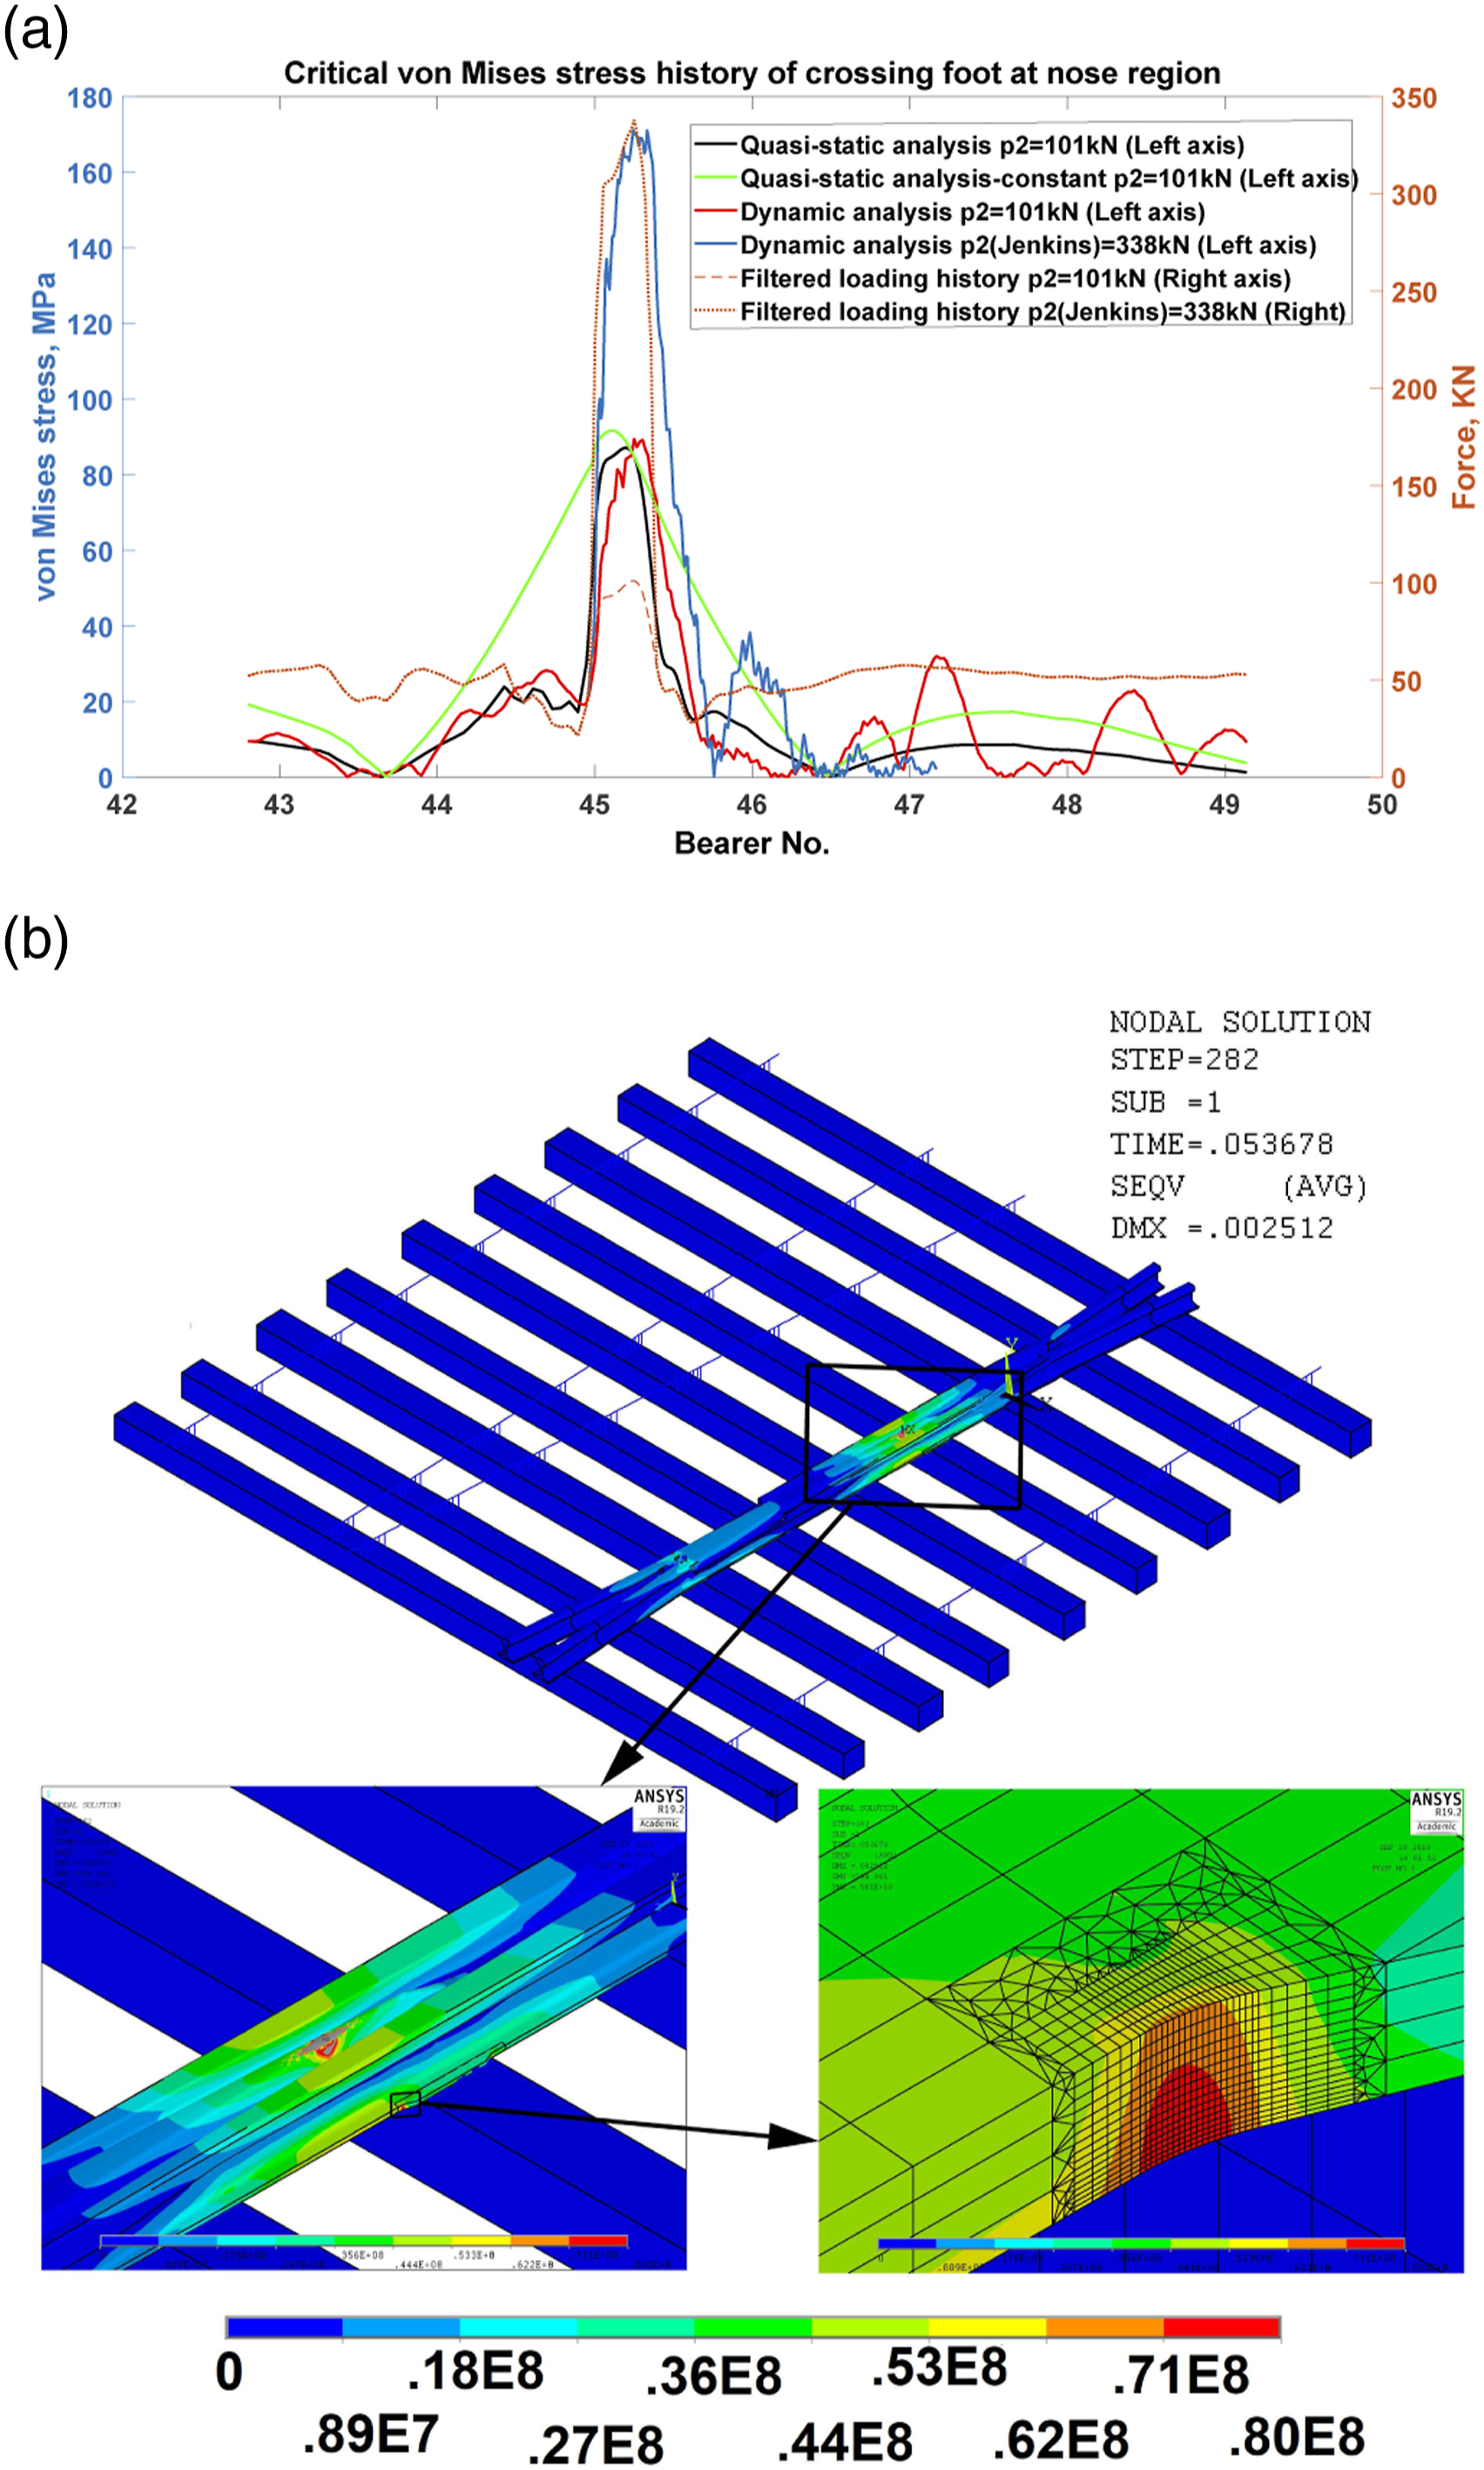
The stress contour in the crossing panel after impact loading at the nose is depicted in Figure 8(b). For better resolution, the stress contour values are limited to 80 MPa because, the focus is on the stress in the crossing foot. The figure shows the critical region in red at the foot flange radius. As stated in Table 1, the static wheel load in this study is 57.76 kN while it can be increased up to 120 kN or more depending on the track regulations. Furthermore, fluctuating loading, degradation of the trackbed, surface finishing effects, corrosion, and pre-existing cracks or voids in the material can increase the risk of the fatigue failure. In addition, as stated before, using the standard recommended parameters values of Jenkins’s formula for design purposes, implies considering P 2 dynamic load value up to 2.5 times the value used in this study.
Often, not fully supported or hanging bearers are seen in railway tracks, especially where impact loads occur. This can lead to excessive stress values in the track. Figure 9(a) shows two methods for simulating not fully supported bearers below the crossing nose. The first method assumes that the trackbed stiffness reduces around the crossing nose. The other method assumes that there is an initial gap beyond which the trackbed supports the bearers loading. Hanging bearer effect: (a) two assumptions for simulation: reduced stiffness values and initial gap and (b) von Mises stress results at crossing foot based on these two assumptions.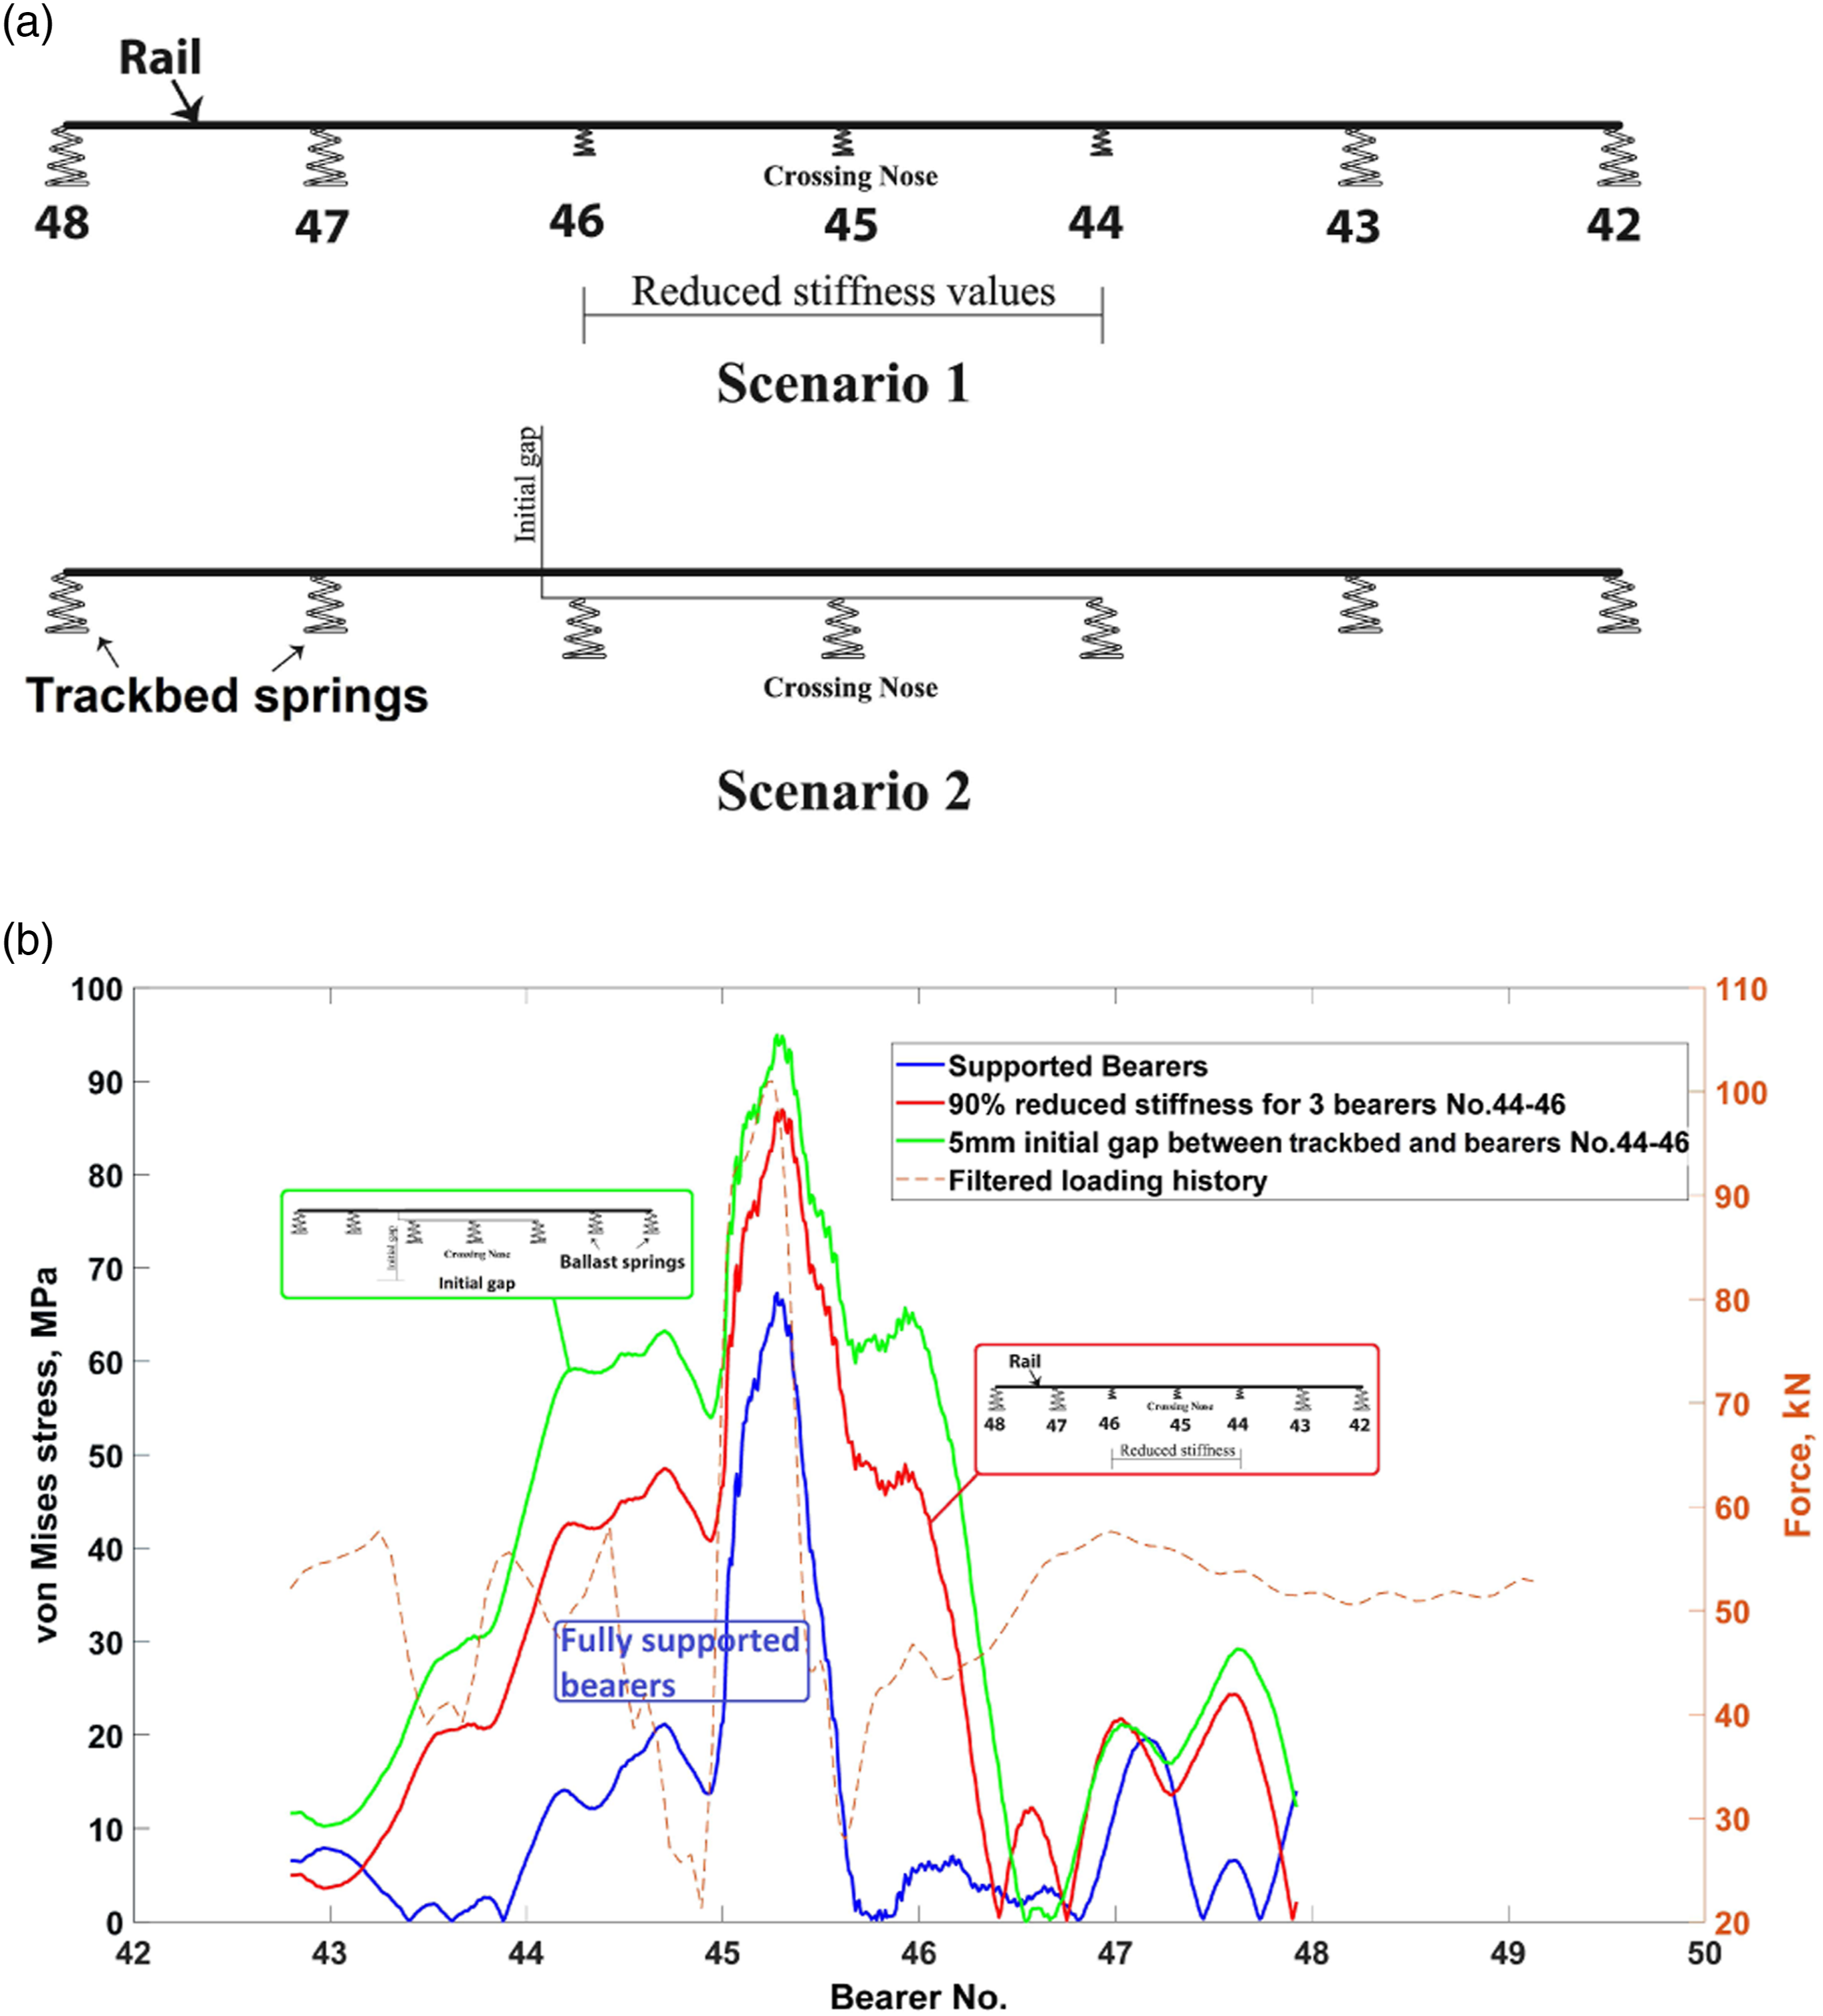
Figure 9(b) presents a comparison between von Mises stress values at crossing foot calculated for supported and not fully supported bearers. 90% reduction in trackbed stiffness and 5 mm initial gap at 3 bearers underneath the crossing nose were two assumptions for simulating what could be considered as significant hanging bearers. As can be seen, 5 mm initial gap leads to a significant 40% increase in stress value with respect to that from normal case with fully supported bearers.
Conclusions
The effect of a moving wheel load on a 1 in 13 crossing is analysed using a finite element model of a crossing panel. Qualitative validation of the model is performed by comparing it with field measurements and a mesh convergence analysis is applied to ensure that the model can be used to predict foot stresses accurately. Modal, quasi-static, and dynamic analyses of the crossing panel are performed and the results comparison is presented in the context of the UK requirement for crossing fatigue analysis of Network Rail standard NR/L2/TRK/012. Finally, two scenarios for simulating the effect of hanging bearers on foot stresses are presented. The following conclusions were drawn: 1. Two variable assumptions for the trackbed stiffness distribution depicted in Figure 2(a) (Variable 1 and 2) give acceptable representation for the trackbed stiffness distribution of the crossing panel and are a significant improvement on considering either concentrated support under rail seat or continuously supported bearer. Uniform support distribution is not a good representation (over estimation of stiffness). Concentrated spring support might lead to underestimation of support stiffness and local roll reaction torque needs to be accounted in the bearer deflection modelling. 2. Under the influence of the P2 dynamic force, the panel’s bending modes of the bearers combined with the cast crossing, can be anticipated to lead to increased acceleration of the ballast, potentially displacement and rearrangement/migration of ballast stones away from the application load. This observation from both the model and the measurement matches with the site observations (this site and others) that local settlement and formation of hanging bearers occur along the crossing panel and transversally under the bearers. 3. Jenkins’s equation with the recommended parameters values for track stiffness and dip angle in standard NR/TRK/012 can increase P2 load value up to 2.5 times compared to these validated FE results, potentially resulting in over-estimated designs. However recent experience with crossing failure by foot fatigue shows that there are other factors in the field that might affect the loads adversely, such as poor wheel-rail interaction potentially in combination with poor support. It is recommended that the current FE approach to fatigue assessment be reviewed given more case studies to update both the support stiffness considered as well as the representative equivalent dip angle. 4. Despite the mismatch behaviour of vertical deflection history of the model resulted from quasi-static and dynamic analyses, the critical von-Mises stress values at crossing foot show a good match implying that simplified analysis using an approximated constant peak P2 value might be sufficient for fatigue predictions. 5. Regarding the simulation of the hanging bearers, considering a 5 mm initial gap under three bearers around the crossing nose can increase the stress by up to 40% with respect to that from the nominal case with fully supported bearers. This surely needs further research to gather information on the propensity for this to happen and to be reflected in the current calculation for crossing life calculation. 6. Considering greater axle loads, higher speeds, fluctuation of the load, degradation of the trackbed, surface finishing effects, corrosion, and pre-existing cracks or voids in the material increase the risk of fatigue failure. Furthermore, recommendations of the UK standard NR/TRK/012 for using specific values for the parameters in Jenkins equation, which are shown to lead to higher P2 load, motivates the necessity to investigate and refine the recommended fatigue calculation approach.
Future work
This paper and the provided FEM can be considered as a primary step for performing fatigue analysis of the crossing foot under realistic and validated support conditions. Also, by adding the railway wheel to this model, stress analysis of the wheel-crossing contact region can be performed, alongside rolling contact fatigue (RCF), and formation of defects like plastic deformation at the crossing nose, can be taken into account as future works.
Footnotes
Declaration of conflicting interests
The author(s) declared no potential conflicts of interest with respect to the research, authorship, and/or publication of this article.
Funding
The author(s) disclosed receipt of the following financial support for the research, authorship, and/or publication of this article: This work has been funded by the UK EPSRC project Track to the Future (grant agreement no. EP/M025276/1). The support from project partner, University of Southampton, regarding the provision of field measurement data is greatly acknowledged.