
Abstract
This paper investigates whether it is possible to develop a wheel profile design that will extend wheelset life compared to an existing commonly used Great Britain passenger wheel profile, the P8. The P8 wheel profile was originally developed in the late 1960s as an alternative to a 1:20 coned wheel profile (the P1). The P1 often required frequent turning as the conicity could increase quickly over time as the wheel wore in service. The P8 was designed based on an average worn shape of a P1 wheel. The P8 was found to stay closer to its original shape as it wore in service. However, new P8 wheels or newly profiled P8 wheels tend to experience a high initial flange wear rate in the first 20,000–30,000 miles, until the worn wheel shape reaches ‘dimensional stability’; after this, the flange width typically remains relatively constant. A ‘Reduced Flange Wear’ (RFW) wheel profile has been developed, based on the P8 profile but with a modified flange root geometry. The Wheel Profile Damage Model has been used to calculate how the proposed RFW wheel profile could reduce wear rates and therefore increase wheelset life. This paper presents results for a typical electric multiple unit train (EMU1) running on rural and suburban routes and a higher speed variant (EMU2) running on an inter-city route. The effect of the proposed RFW profile on rail rolling contact fatigue (RCF) has also been evaluated using the Whole Life Rail Model, for the same routes. The results suggest that the proposed RFW profile does reduce flange wear compared to a P8, with larger reductions achieved on routes that are more curvaceous. For wheel turning based purely on restoring wheel profile geometry, the RFW profile could half the amount of material removed at each turning (based on turning wheels at 250,000 miles). Furthermore, the results show that the RFW profile experiences slightly less wheel RCF damage than the P8. When new, the RFW profile appears to cause slightly higher rail RCF than a new P8 (For radii 700 m < R < 1300 m); however, the results suggest that worn RFW profiles cause very similar rail RCF to that caused by worn P8 wheels.
Background
The maintenance and periodic replacement of railway wheelsets represent a significant cost faced by Train Operating Companies. Wheels require regular re-profiling by machining on a wheel-lathe, mainly due to flange and tread wear and rolling contact fatigue (RCF) damages. 1
The new wheel diameters can vary based on vehicle type, the typical new wheel diameter for a Great Britain (GB) passenger train is 840 mm. As a train operates the wheel diameter reduces gradually, due to wear and periodic re-profiling until it reaches the scrapped diameter, for example 790 mm. 2
GB Railway Group Standard GM/RT2466
3
mandates requirements for the design, manufacture and maintenance of wheelsets and their components. It includes limits on the allowable wear defined in terms of the maximum flange height and minimum flange thickness.
3
The flange height (Sh) denotes the vertical distance from the flange top to the tread datum position (70 mm from the flange back), as shown in Figure 1. Whilst the flange thickness (Sd) denotes the lateral distance between the flange back and point P1 on the flange face (defined at 13 mm above the wheel tread). Flange height increases as the tread wears whilst the flange width may either reduce as the flange face wears due to the contact with the rail gauge face during curving or increase if tread wear is dominant. Definition of flange height (Sh) and flange thickness (Sd).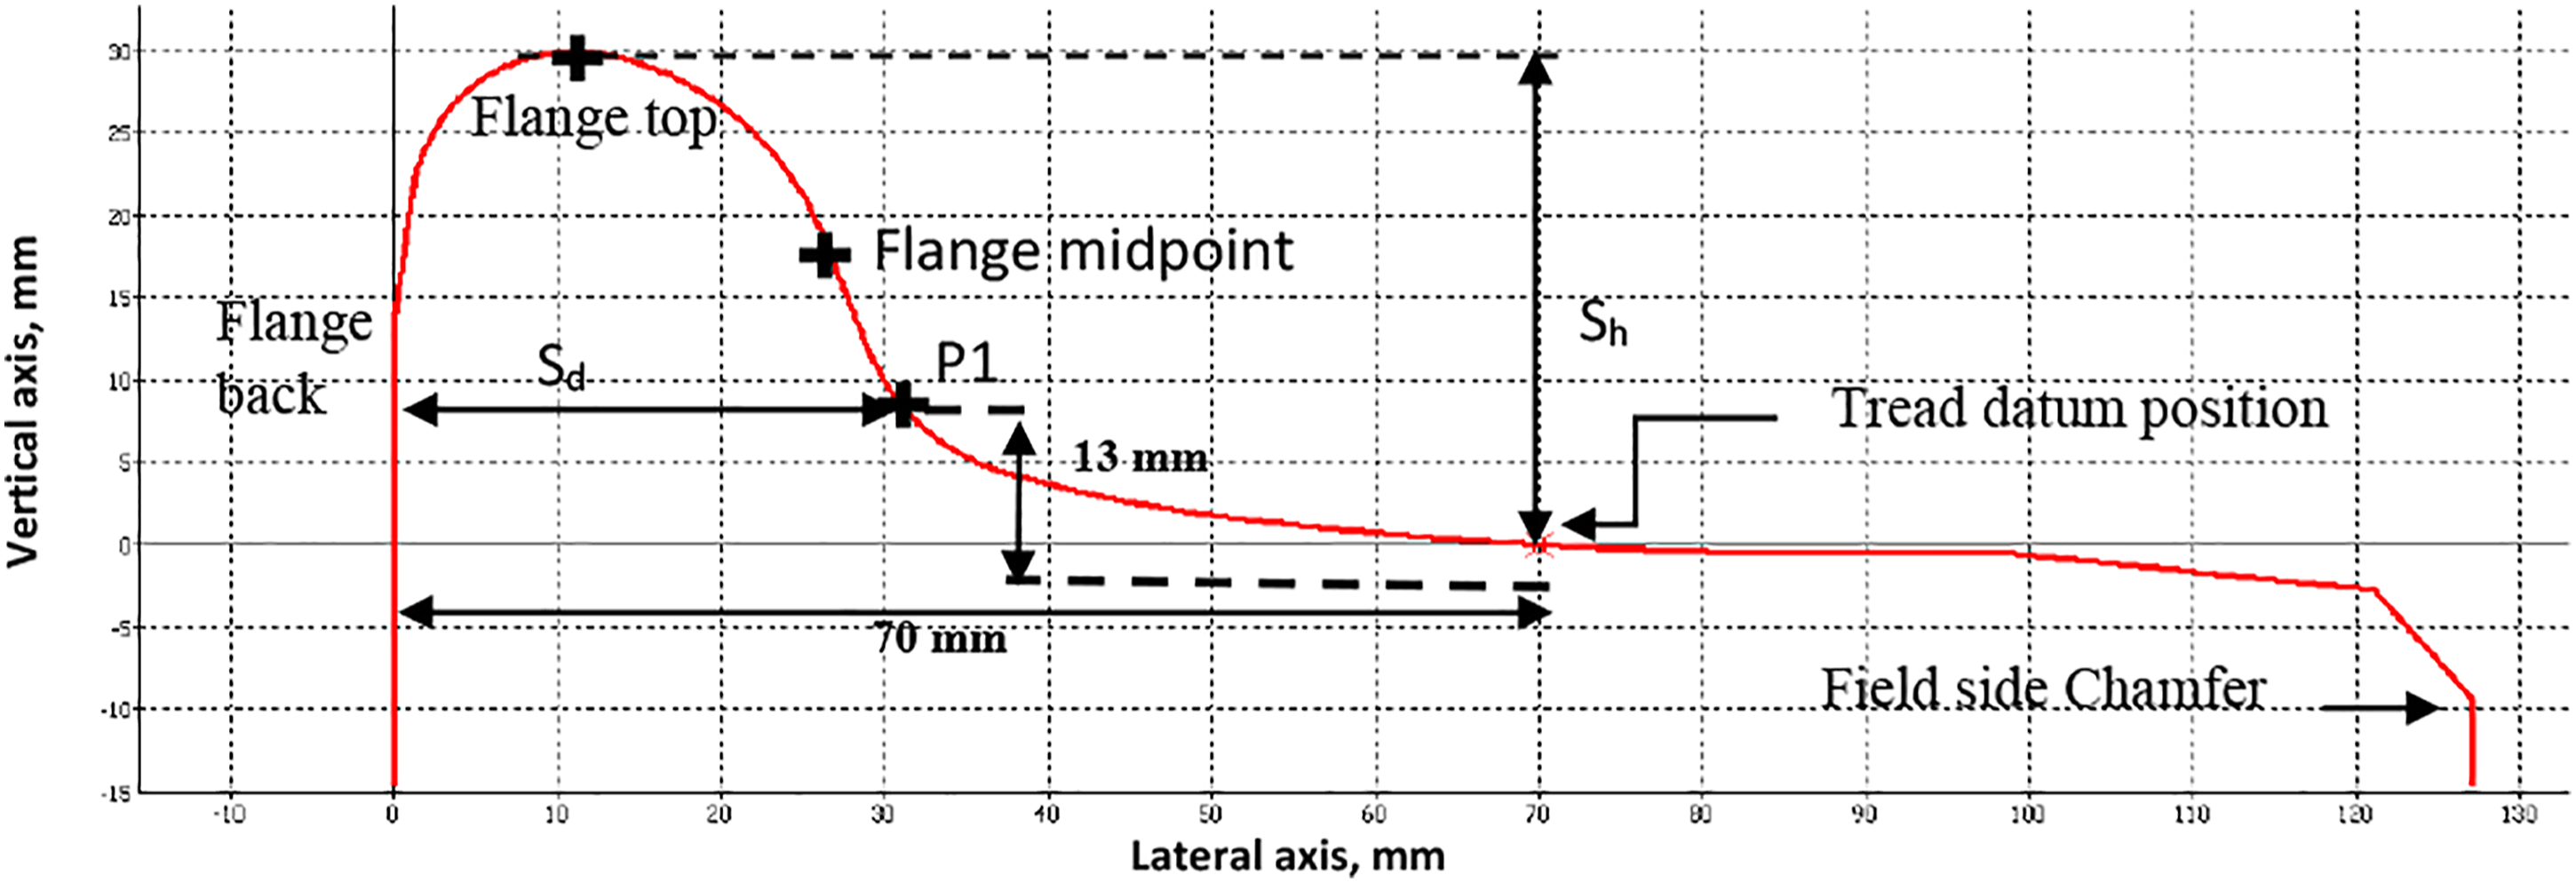
Based on the defined limits in GM/RT2466, wheel profile geometry is monitored during a wheel’s life, and wheels are re-profiled back to the design profile shape (typically once a year or at a pre-determined mileage) using wheel-lathes. 4
In each re-profiling process, the degraded wheel profile needs restoration to its original cross sectional (or profile) shape; it can be necessary to cut off a significant amount of material to achieve this, especially when there has been a large amount of flange wear. Previous studies show that, in order to re-profile a worn wheel with a flange thickness of 26 mm back to the original profile shape, with a flange thickness of 28.5 mm, 7.5 mm must be removed from the wheel radius (15 mm from the diameter). 1 Therefore, reducing flange wear rates could help to reduce the amount of material removed during re-profiling and hence extend the life of the wheelset.
Optimisation of the wheel-rail interface by studying the shapes of wheel and rail profiles could be one of the options in order to reduce flange wear.5–9
This investigation focuses on creating a new wheel profile for passenger vehicles, based on the P8 wheel profile, but using a different flange root shape in order to reduce flange wear rates. The P8 profile is the most widely used wheel profile for passenger vehicles in GB.
The P8 wheel profile was introduced in the late 1960s. It was developed as an alternative to a 1:20 coned wheel profile (the P1).10,11 The P1 profile required frequent re-profiling as the conicity could increase quickly over time as the wheel wore in service. The P8 was designed based on an average worn shape of a P1 wheel. The P8 was found to stay closer to its original shape as it wore in service. King 11 suggested that P8 should be revised in the future if contact conditions changed and the new P8 was no longer representative of the typical worn shape.
As different rail profiles, different vehicles and different maintenance practices are used today (compared to when the P8 was introduced) it has been suggested that as a P8 wears it does not maintain its shape so closely to the design P8. For example, it is common to find that P8 profiles on modern multiple unit trains have a high initial flange wear rate after re-profiling. Figure 2 shows flange width against mileage for P8 wheels on a modern Electrical Multiple Unit ‘EMU1’ operating mainly on suburban routes. It can be seen that there is a high initial flange wear rate (0.3 mm/10,000 miles), which reduced significantly from 20,000 to 30,000 miles. Flange width tends to stabilise between 40,000 and 70,000 miles. Measured flange thickness-electric multiple unit 1 operating on suburban route, P8.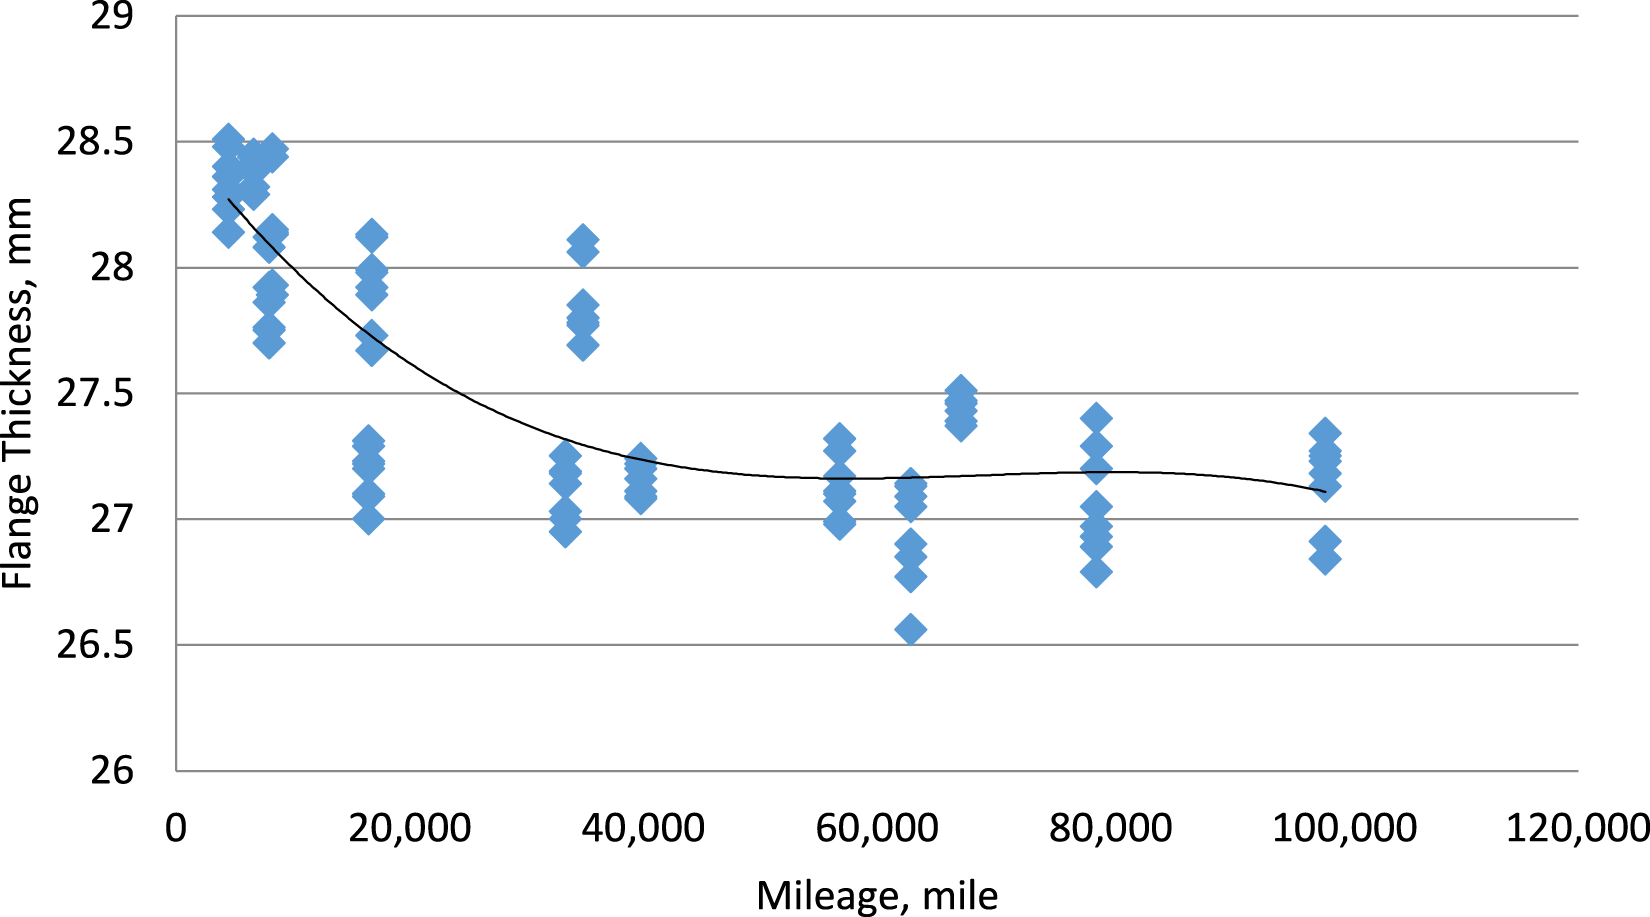
It is hypothesised that if a new wheel profile was developed based on the shape of a typical worn P8, it would more closely match the rail shapes it encounters, and the high initial flange wear rate could be reduced. This would allow wheelsets to run higher mileages before wheel re-profiling is required and potentially require less material to be removed when re-profiling is undertaken.
Design methodology for reduced wear wheel profile
As shown in Figure 2, P8 wheels tend to have an initial high flange wear rate, until the worn profiles shape reaches ‘dimensional stability’. Therefore, the proposed approach is to identify a worn P8 wheel shape that has already reached ‘dimensional stability’ and use that shape as a base for new proposed wheel. In order to identify a ‘typical worn shape’ 600 measured worn P8 wheel profiles were considered, taken from a range of fleets (eight fleets in total, electrical and diesel multiple units, motor and trailer vehicles) with varying mileages since re-profiling.
Experience suggests that the generation of flange wear and rail RCF damage is related to contact around the gauge corner and flange root. The mid-point of the flange in Figure 3(a) represents the transition point between the flange root and flange toe. T775 report published by RSSB
12
showed that a typical flange root radius started within the range of 25–50 mm in the lateral axis. Typical example worn wheel profile (a) and profile gradient (b).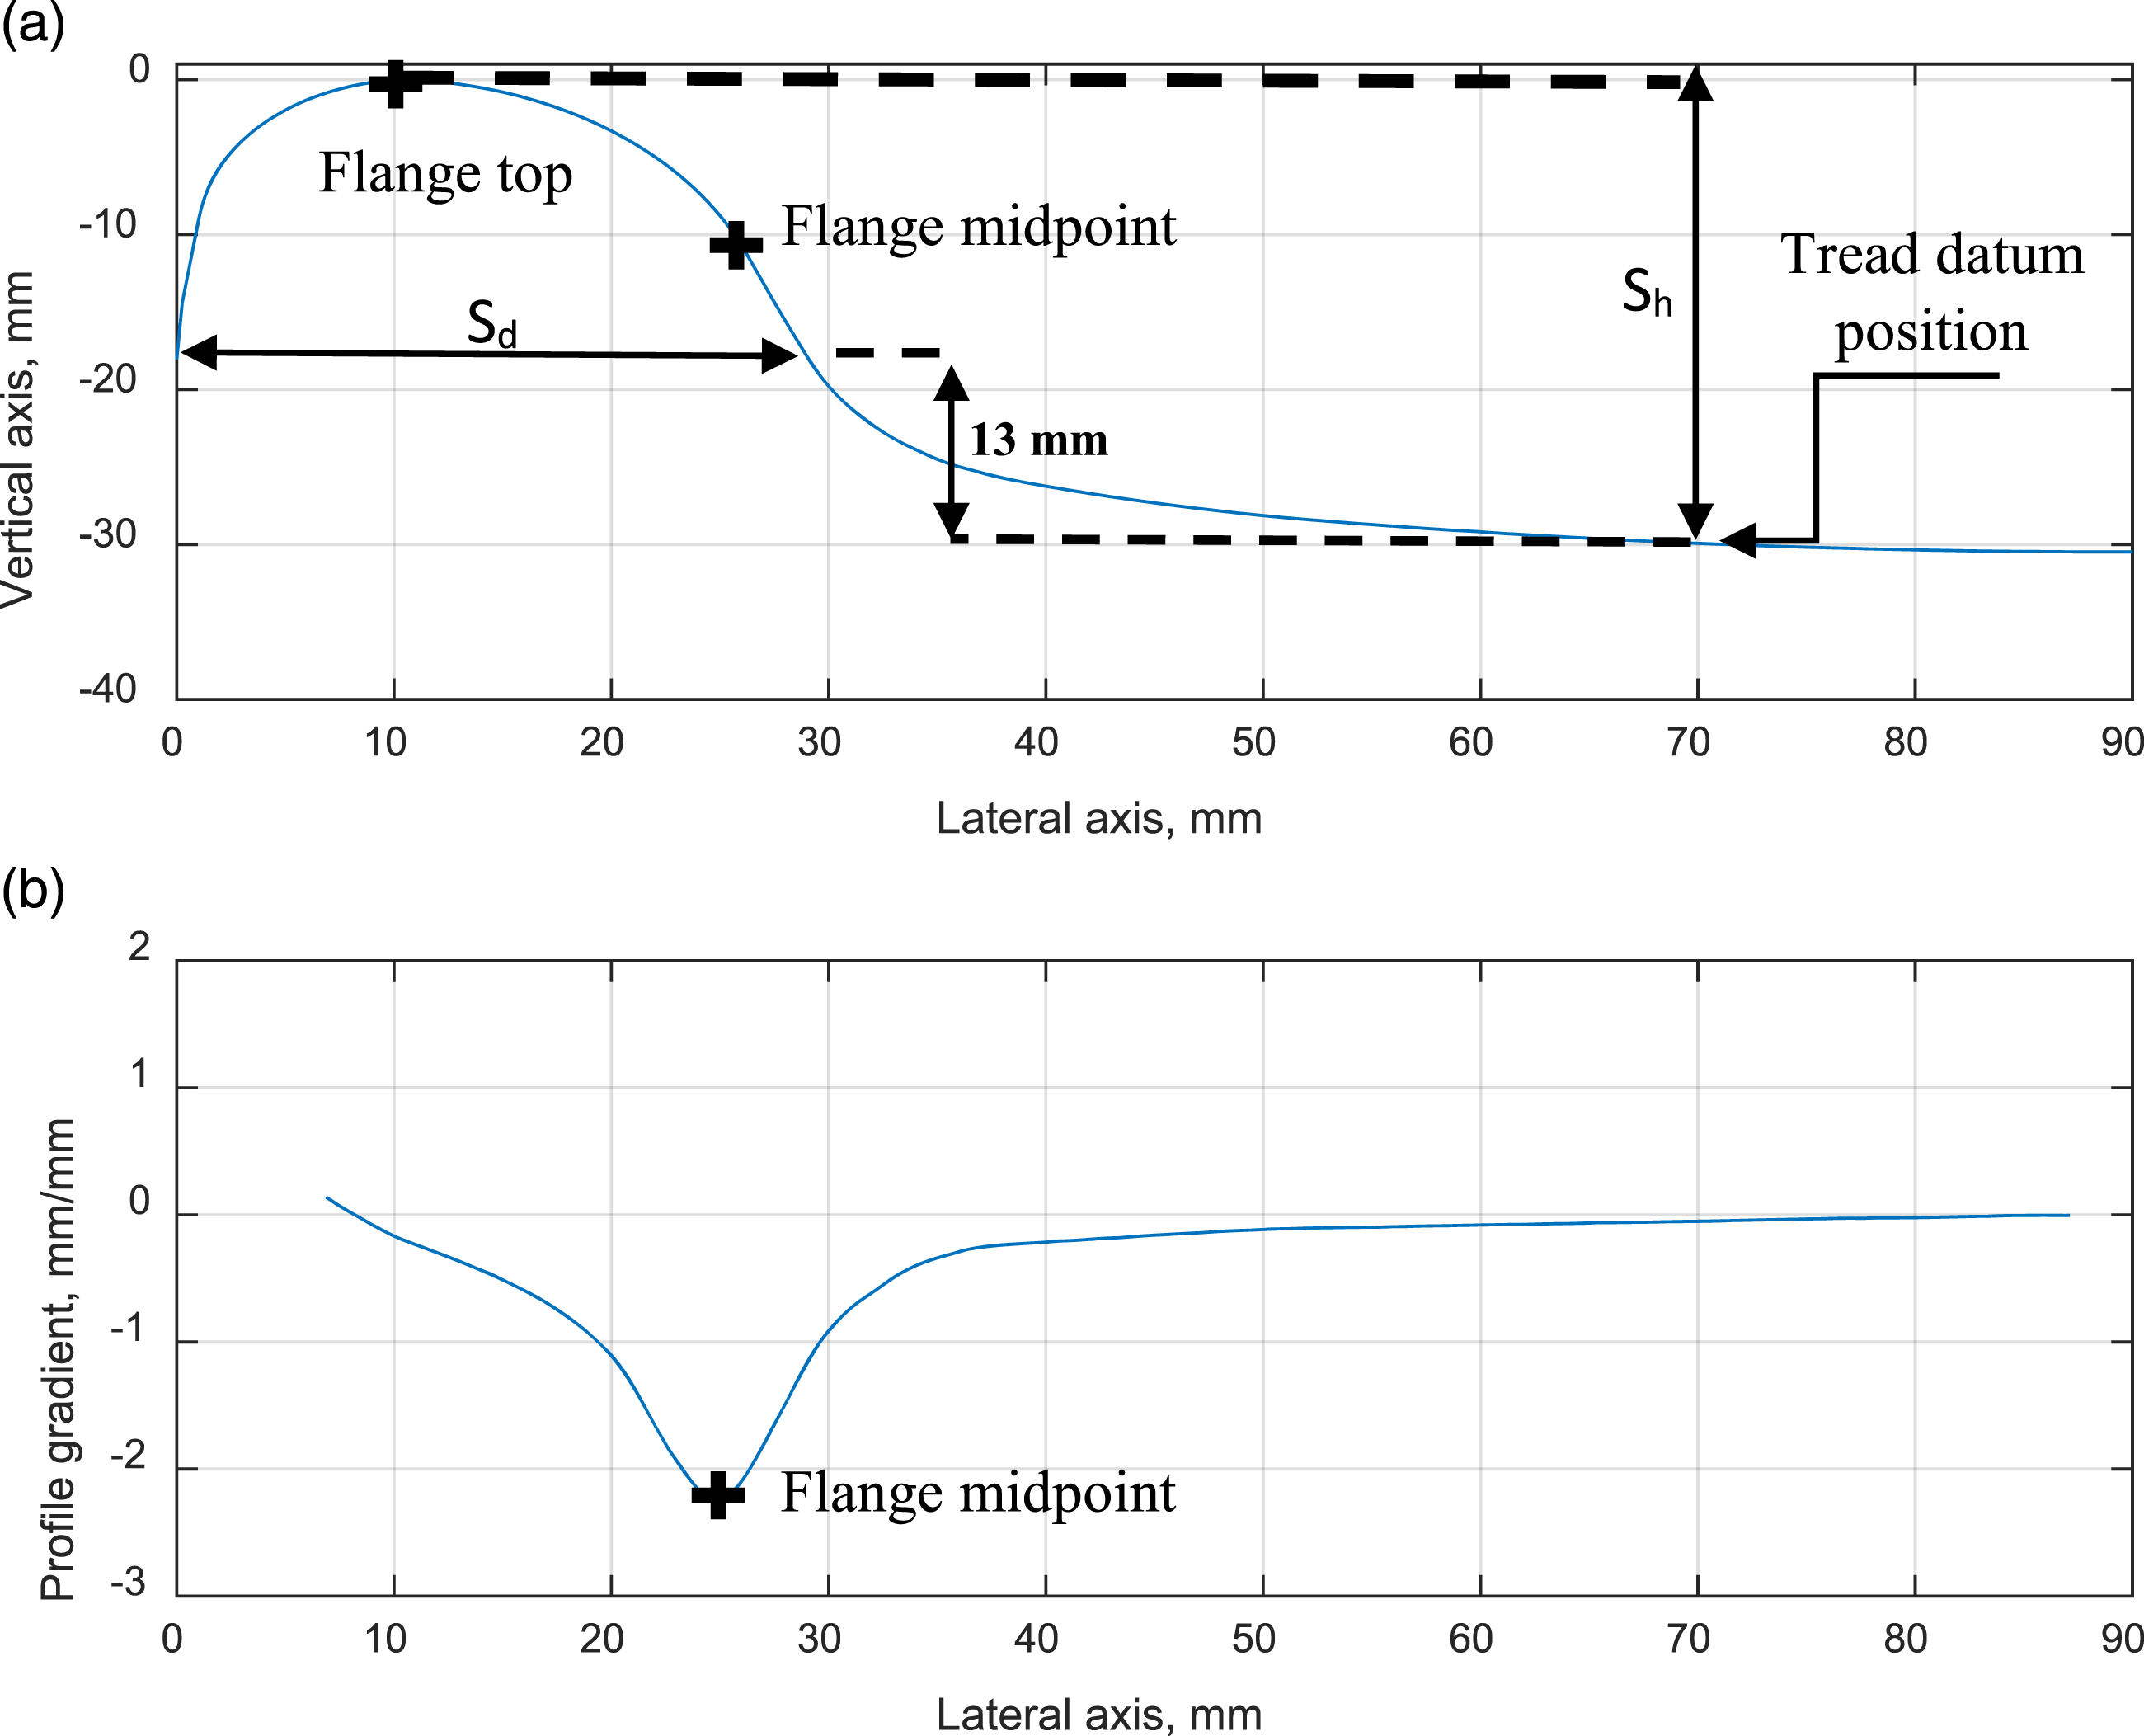
As the worn profiles had a range of flange thickness, to compare the worn shape of the flange mid-point to tread datum it was necessary to align the measured wheel profiles; the flange mid-point was used as a reference to align the measured profiles. In order to identify the flange mid-point and also to characterise the worn profile shapes, the gradient of the profile across the profile shape was calculated.
The shape of the flange root from the worn profiles has been investigated for this study. As the worn profiles can have a range of flange widths, it is first necessary to process the profile shapes to identify where the ‘flange root’ starts and end.
The sample of worn wheel profile shapes was characterised based on the gradient of the profile shape; Figure 3(b) shows the typical gradient for a chosen profile. The steepest negative gradient shows the midpoint of the wheel flange, for the purpose of this study this is considered to be the start of the ‘flange root’.
Figure 4(a) shows the gradients for the worn wheel profiles (600 profiles in total) and the design P8 profile for the area of interest (i.e., the flange root). As shown in the figure the worn profiles tend to have a distinctly different shape to the new P8, where the flange gradient of the worn profiles is typically steeper compared to the design P8 wheel profile. Additionally, the analysis shows that the part of flange root between 33 and 50 mm has a very similar shape for the all worn profiles as can be seen from the overall spread of gradients and the boundaries of the +/− 1 standard deviation, refer to Figure 4(b). Calculated gradient and gradient standard deviation for the selected worn and design P8 profiles – in the vicinity of the flange root (a) The calculated gradient for the selected worn and design P8 profiles (b) Gradient standard deviation-worn wheels-flange root.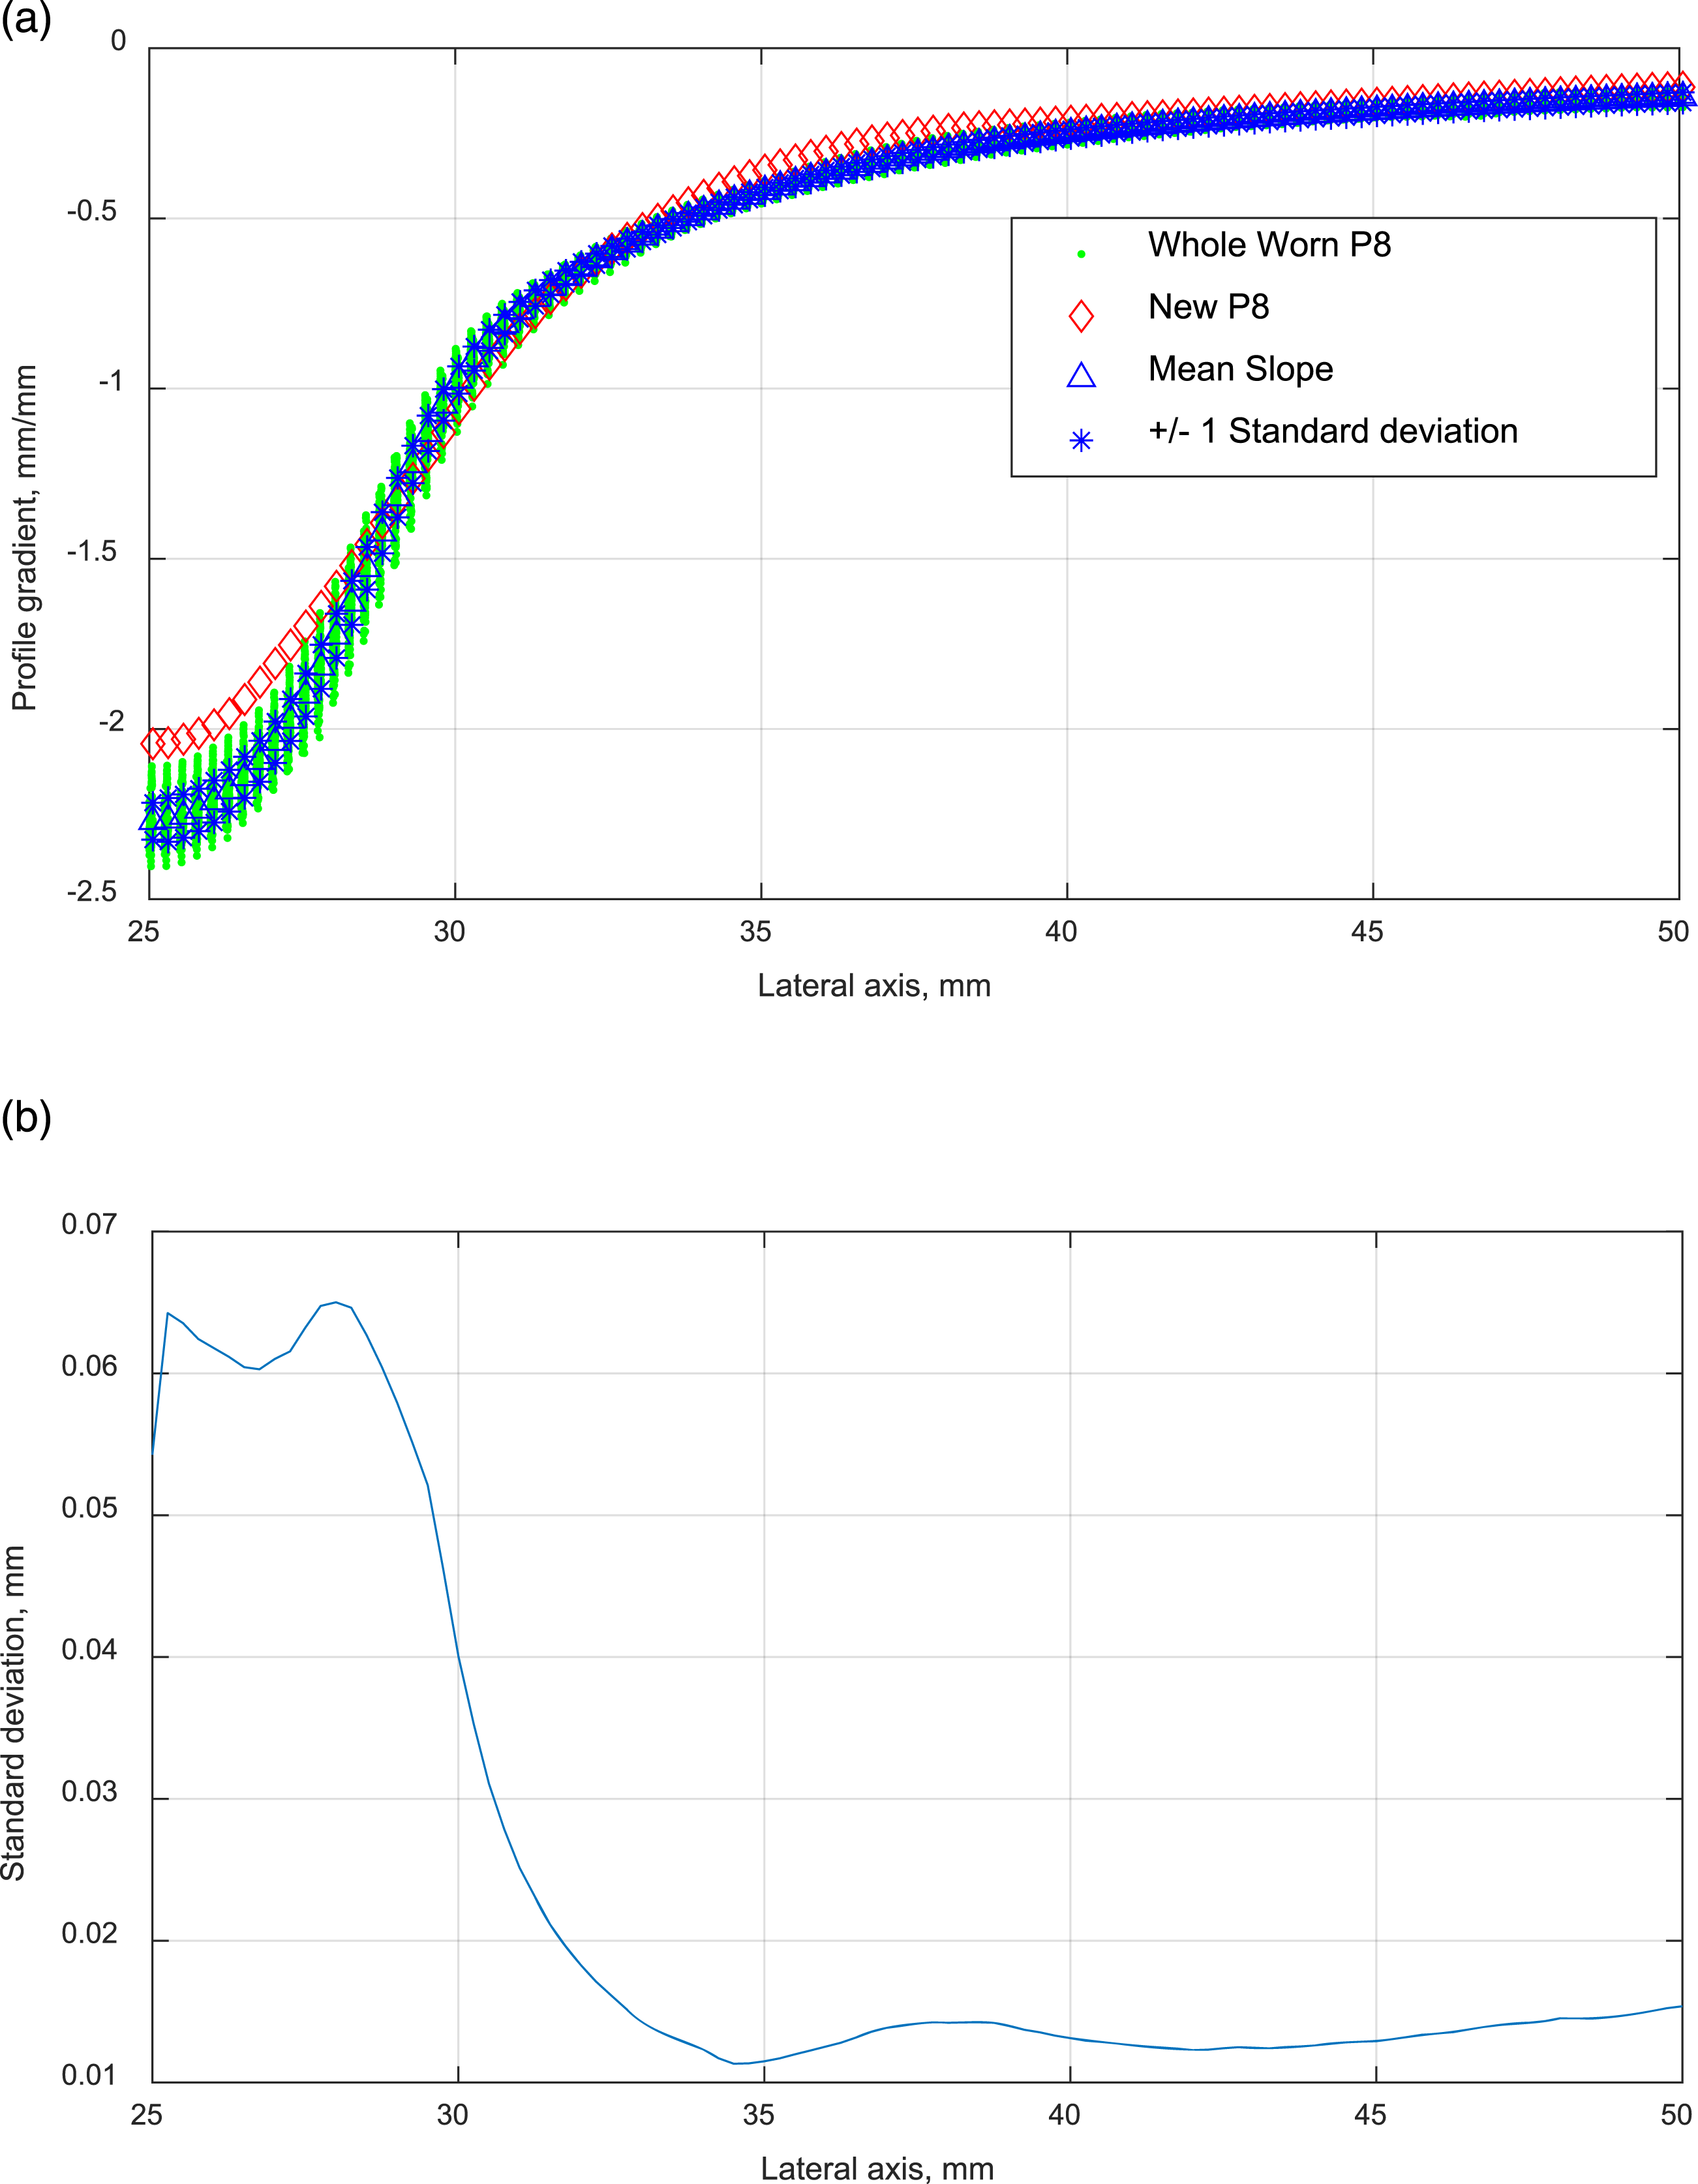
Figure 4(b) shows the standard deviation values of the gradients for the worn P8 profiles in the vicinity of the flange root. These indicate that, for the measured worn profiles, there is a range of differences in flange angles, yet in the flange root region of the wheel, the gradients/shape match more closely.
Proposed reduced flange wear profile shape
This investigation considers P8 (widely used wheel profiles for passenger vehicles in GB) and several versions of developed wheel profiles. However, this paper will cover only the final version of the Reduced Flange Wear (RFW) profile, referred to as RFW4.
The median worn profile shape from the sample of 600 worn P8 wheels was selected as a base shape for the future proposed RFW profile. The median worn profile shape came from a wheel that had run 70,000 miles since turning; the flange thickness and flange height were 27.7 mm and 30.4 mm respectively (compared to 28.5 and 30 mm respectively for a new P8 wheel).
In order to create the first version of the reduced flange wear profile, referred to as RFW2, the median worn profile shape has been shifted to the right to restore the standard new P8 flange thickness (i.e., 28.5 mm). This was done by translating the worn profiles laterally from the flange top to the tread datum.
The remaining parts of the profile from the flange back to the flange top and from the tread datum to the field side chamfer were the same as P8. Later the connections between the three parts of the profile from the flange back to the flange top, flange top to the tread datum, and from the tread datum to the field side chamfer were smoothed using weighted linear least squares line and a first-degree polynomial model. For the RFW2 profile, the flange angle was different from the nominal P8 profile (i.e., it has steeper flange angle than the design P8), as shown in Figure 5(a). Flange root for P8, P12 and reduced flange wear wheel profiles (a) Full flange wheel profiles-flange top to tread datum (b) Flange root.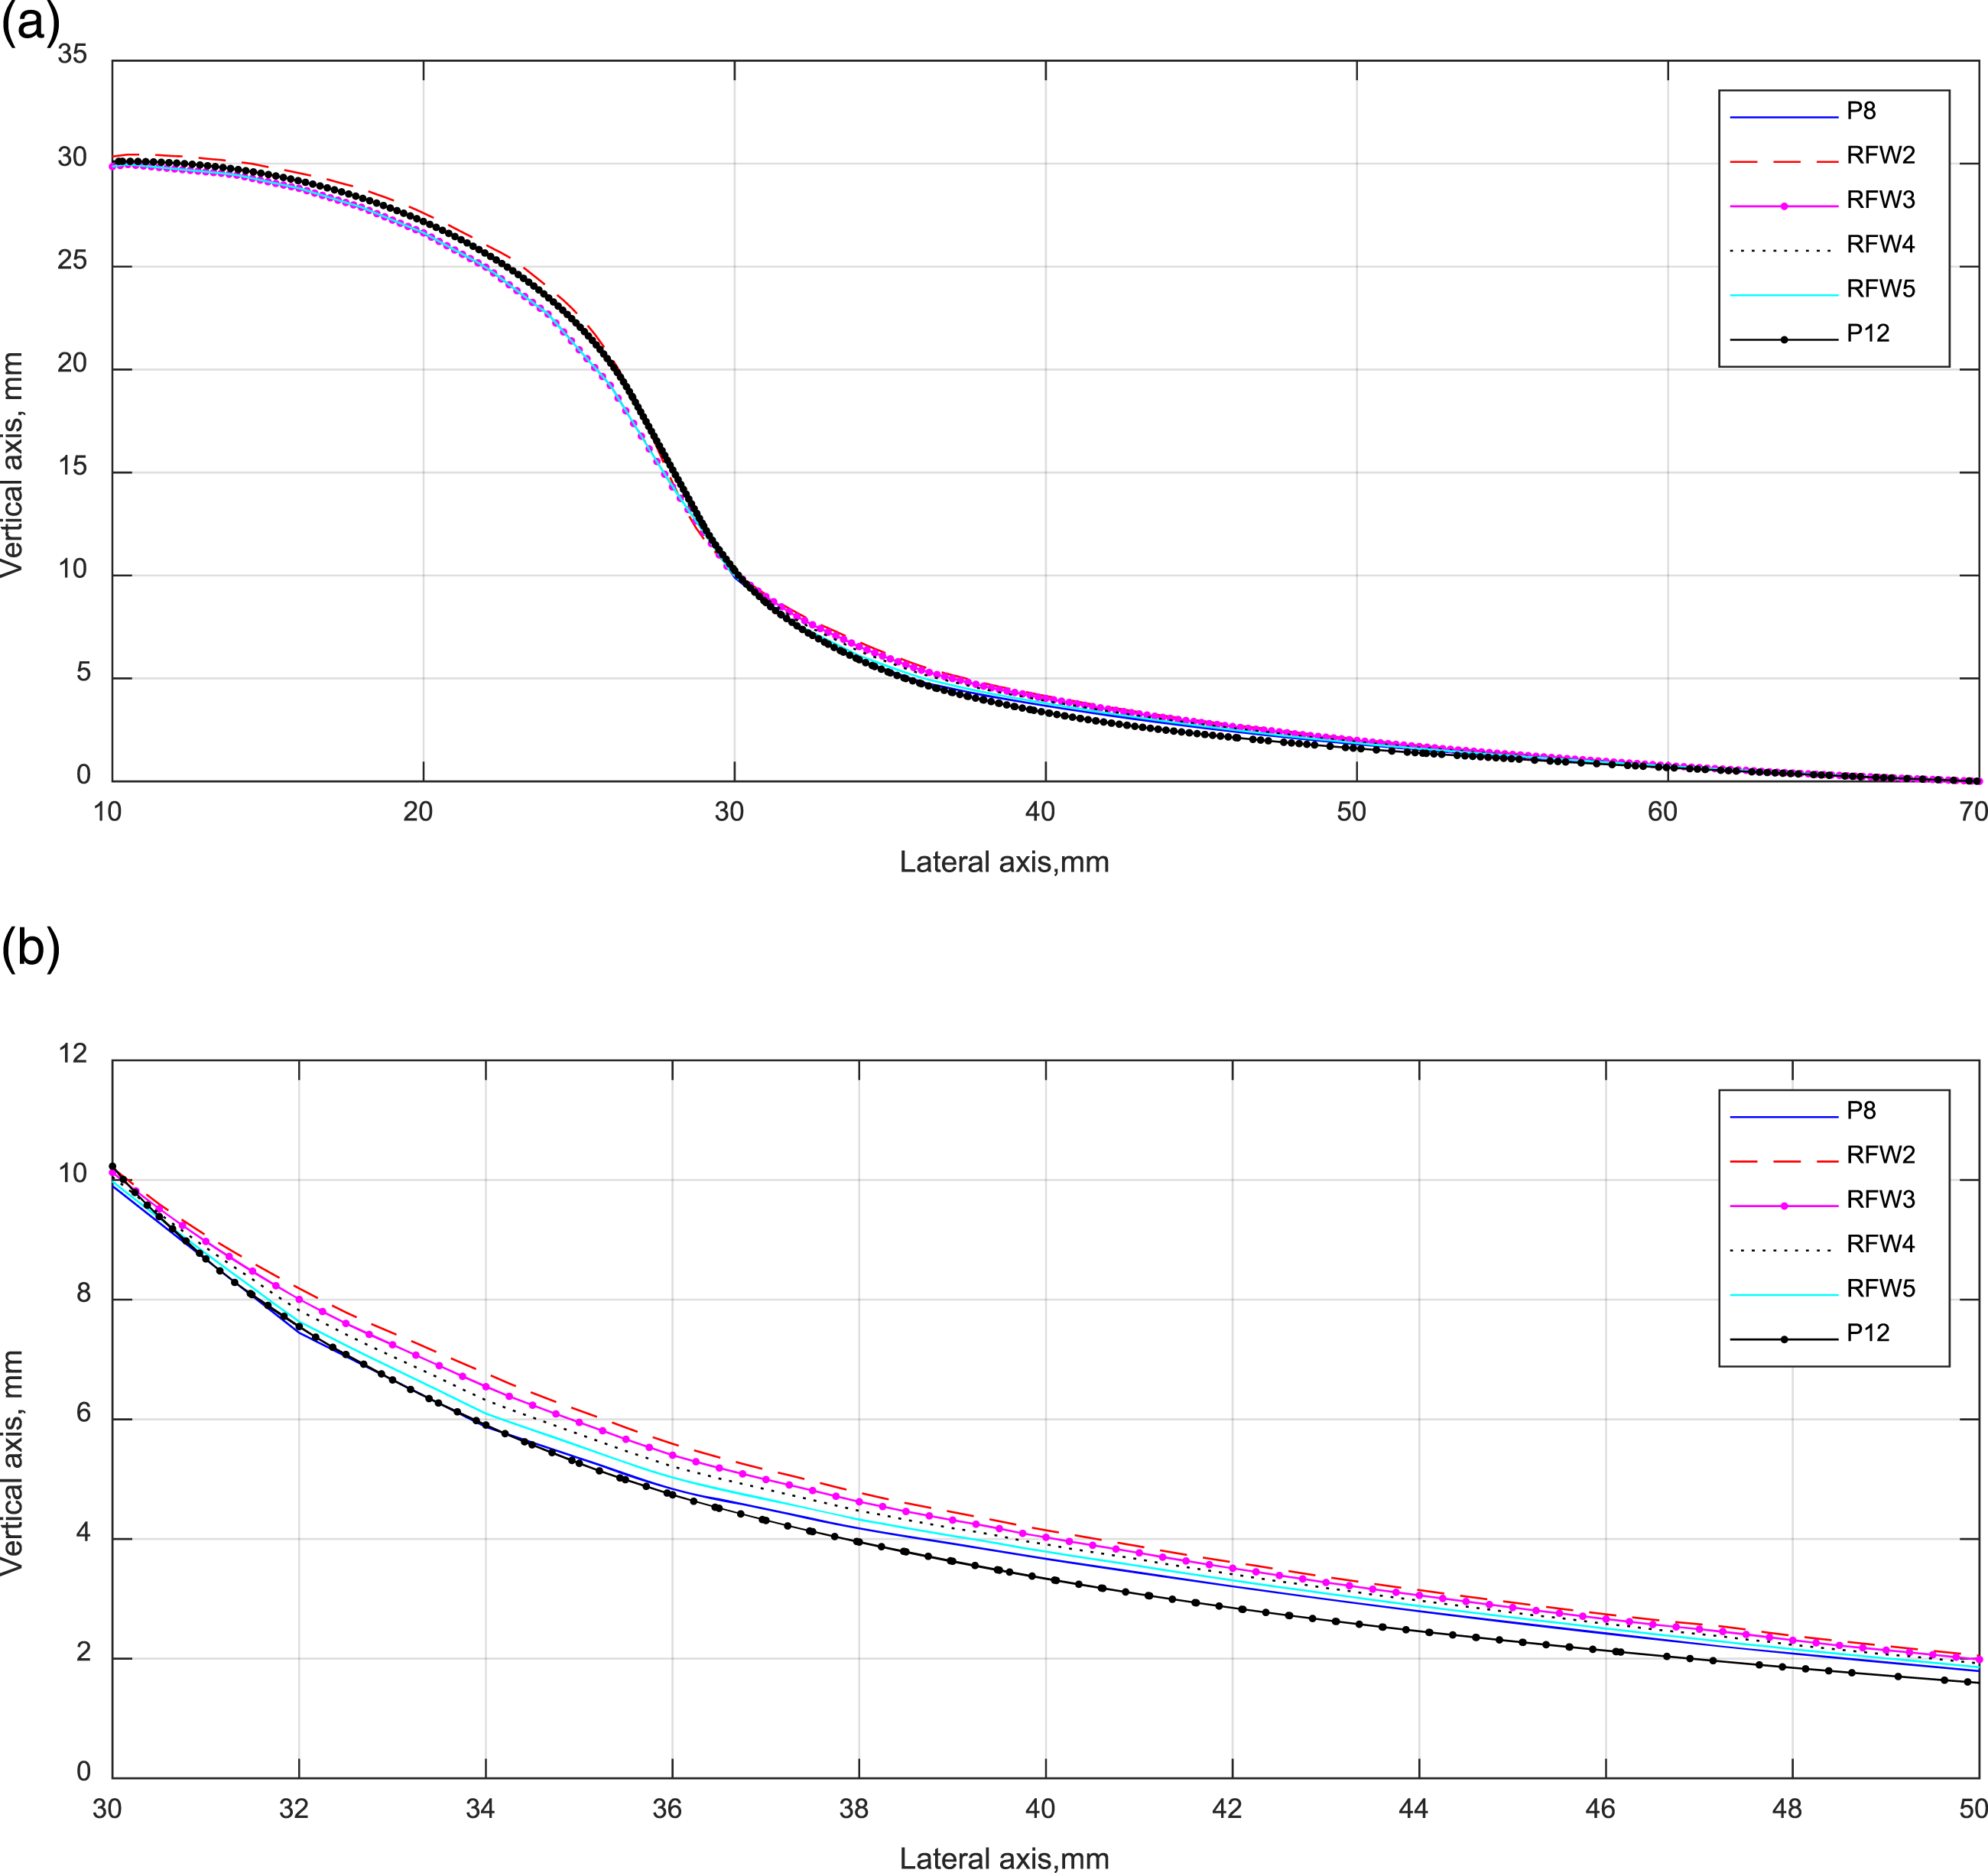
The initial results suggested that RFW2 has relatively low flange wear. However, it could increase the rail RCF due to the conformal shape with the rail in the flange root area of the wheel. Therefore, alternative RFW profiles (shown in Figure 5) were developed and inspected during this study. 13
Figure 5(a) compares RFW profiles to P8 and P12 wheel profiles. 9 The P12 profile (the profile developed was named WRISA2) 9 is similar to the P8 profile but with two significant changes, an ‘anti-RCF relief’ in the flange root area and it has a lower initial conicity. In general, the P12 profile has higher flange wear rates compared to the P8 profile in routes that are more curvaceous. 14 The RFW profiles have a lower flange root radius when compared to design P8, as shown in Figure 5(b).
Among the RFW profiles, the RFW4 profile demonstrated comparable results to design P8 in terms of RCF rail damage and to RFW2 in terms of flange wear. The full investigation results for the effect of RFW profiles on flange wear and rail RCF are shown in Ref. 13.
The RFW4 profile has a flange face shape based on the design P8 with an average flange root radius between the standard new P8 and the RFW2, as shown in Figure 5. The following sections focus on the effect of using the RFW4 profile in terms of flange wear and rail RCF.
Wheel-rail contact conditions
Figure 6 shows the rolling radius difference (RRD), depending on lateral movement of the wheelsets, for standard P8 and RFW4 profiles when combined with CEN56E1 and CEN60E2 rails inclined at 1:20.
15
Rolling radius difference, P8 and RFW4 wheel profiles combined with CEN56E1 rail and CEN60E2 rail (a) RRD plot: wheel profiles combined with CEN56E1 (b) RRD plot: wheel profiles combined with CEN60E2 rail. RFW: reduced flange wear; RRD: rolling radius difference.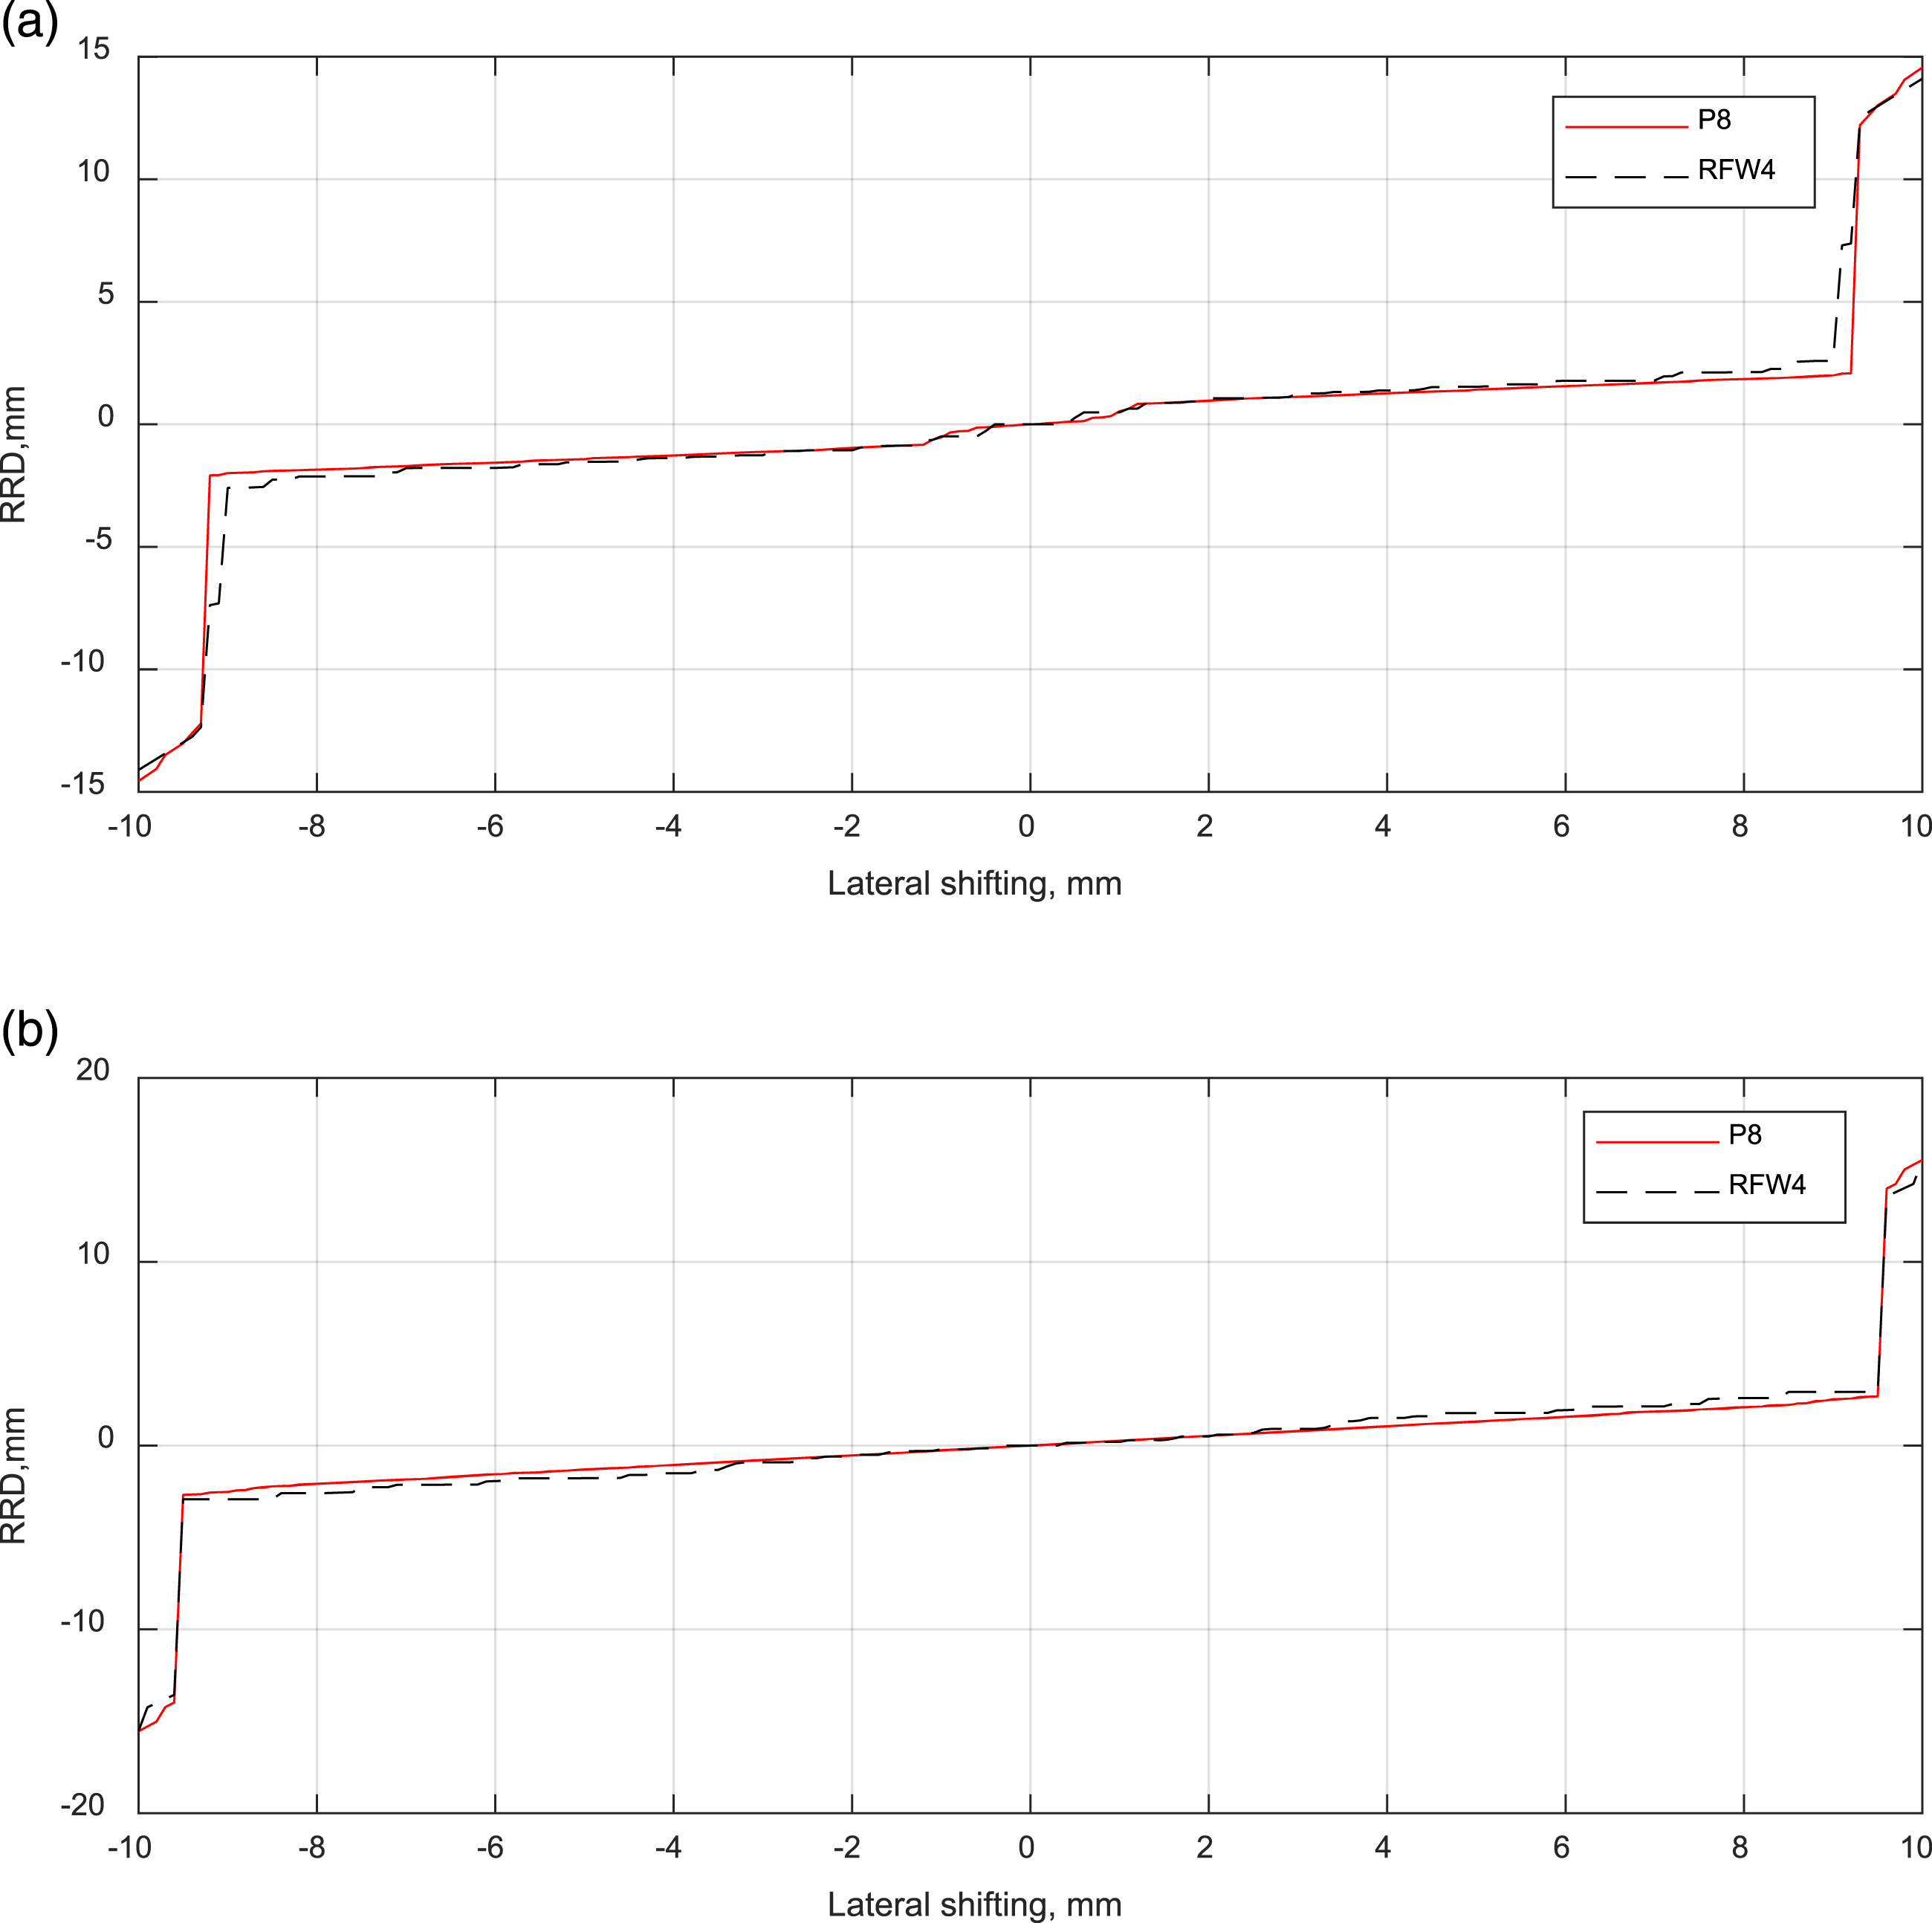
As shown in Figure 6(a), when combined with CEN56E1 rail, for lateral movements up to 8 mm, the RFW4 profile shows a similar RRD behaviour to the P8 (i.e., similar wheel conicity and similar steering behaviour). However, at 9 mm lateral movement, the RFW4 profile shows a step change in the rolling radius difference. This step change may result in slightly higher rail RCF damage at certain curve radii.
In the case of CEN60E2 rail (Figure 6(b)), the result shows that the RFW4 wheel profile has higher RRD than the P8 for lateral movement between 2 mm and 9.5 mm.
Figure 7 shows an example wheel-rail contact position plot for a range of wheel-rail profile combinations, including P8 and RFW4 wheel profiles and CEN56E1 and CEN60E2 rail profiles (inclined at 1:20). In these plots, the black lines drawn between the wheel and rail profiles indicate the points that are in contact for a given lateral displacement of the wheelset (±20 mm) with respect to the track. Contact position plot for a range of wheel-rail profile combinations.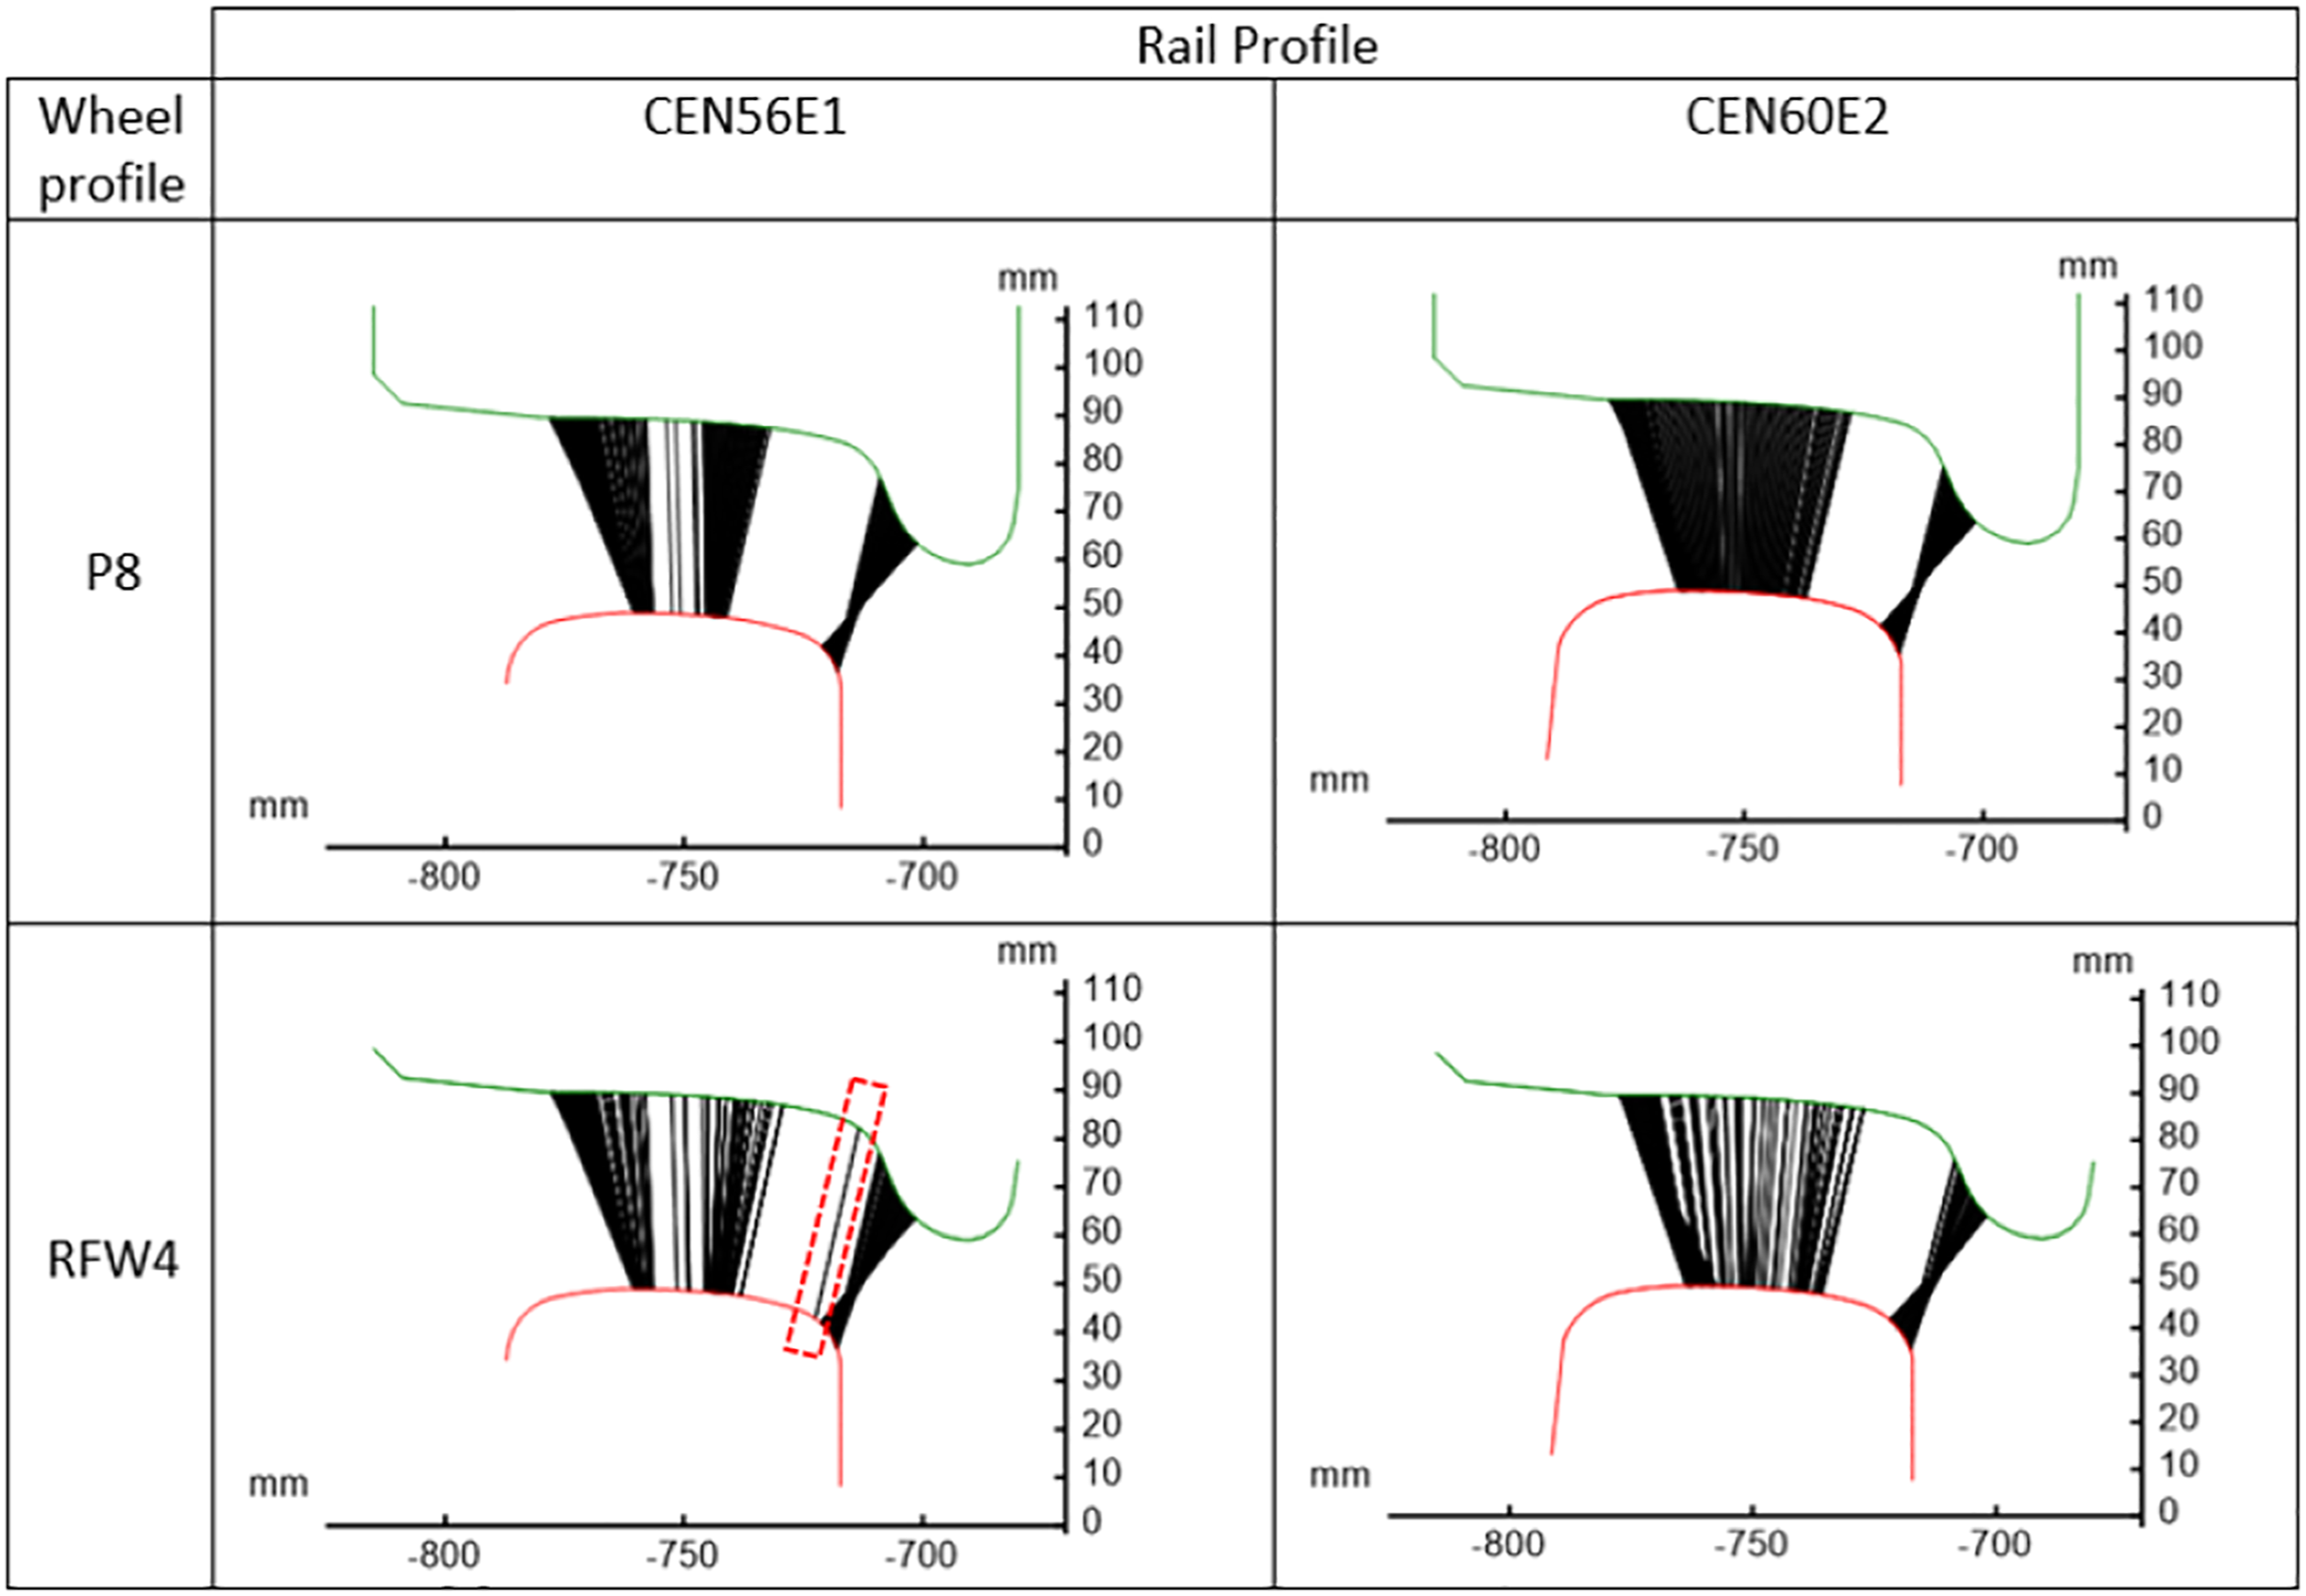
For P8 wheel profile, all the profile combinations generate non-conformal two-point contact, with no contact between the gauge corner and crown of the rail. Non-conformal initial contact conditions in the P8 condition can cause high contact stresses, resulting in high initial wheel and rail profile wear. However, for in RFW4 condition, there will be slight contact between the wheel flange root and the gauge corner of the CEN56E1 rail, as highlighted by the red rectangle.
CEN60E2 rail profile is now becoming the standard rail section used on GB mainline railways as it offers protection against RCF through relief of the RCF prone contact regions around the rail gauge corner and shoulder. This relief around the rail shoulder can be seen in Figure 7 to be similar for P8 and RFW4 wheel profiles.
Figure 8 shows the contact area results for the left wheel, depending on lateral movement of the wheelsets, for standard P8 and RFW4 profiles when combined with CEN56E1 and CEN60E2 rails. Contact area plot for left wheel, P8 and RFW4 wheel profiles combined with CEN56E1 rail and CEN60E2 rail (a) contact area plot: when profiles combined with CEN56E1 rail (b) contact area plot: when profiles combined with CEN60E2 rail (c) contact area plot for left wheel, P8 and RFW4 wheel profiles combined with CEN56E1 and CEN60E1. RFW: reduced flange wear.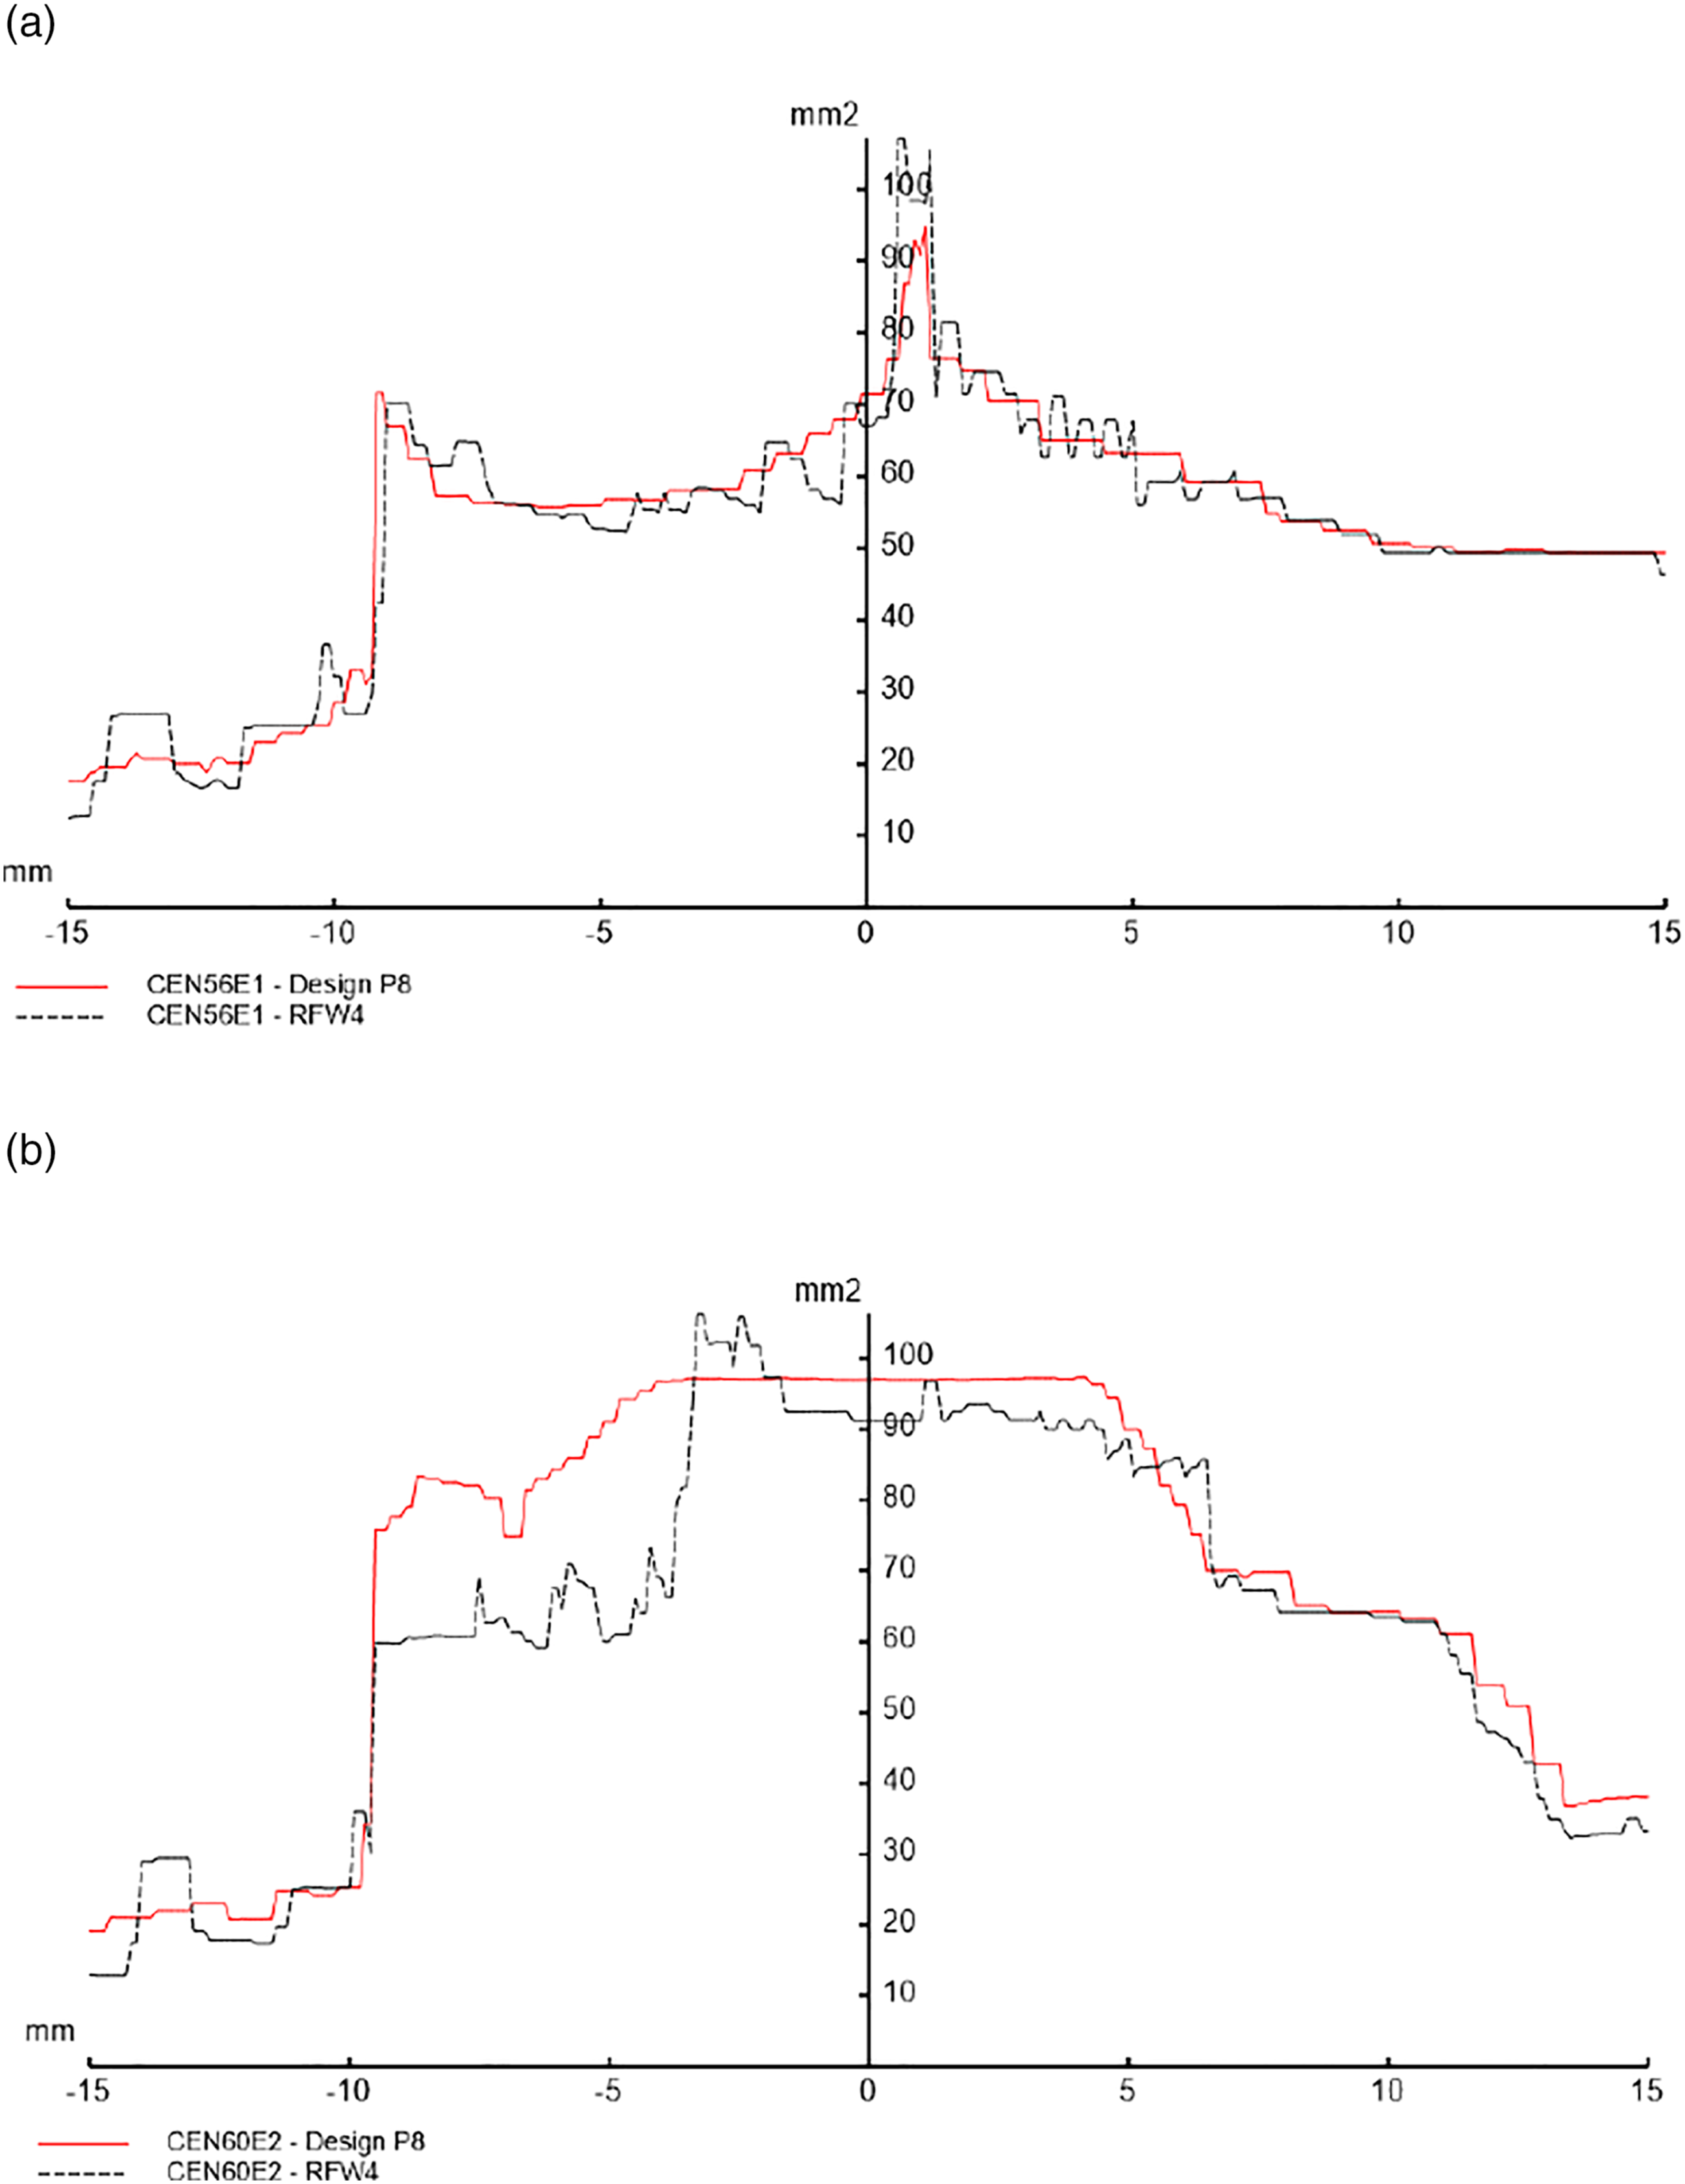
In the case of CEN56E1 rail (Figure 8(a)), the results show that the RFW4 wheel profile generates a similar contact area as design P8, and hence most likely to have similar contact pressures.
However, when combined with the CEN60E2 rail, the RFW4 wheel profile generates a smaller contact area than the P8 profile, as shown in Figure 8(b). This might increase the contact stress between the wheel and the rail and hence might increase the likelihood of RCF initiation. The RCF damage prediction for RFW4 is explained in more detail in the further section “Rail RCF Damage.”
Wear modelling
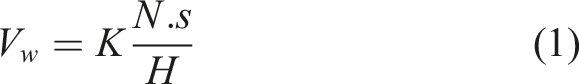
The Wheel Profile Damage Model (WPDM) 16 has been used to predict wheel wear rates and worn shape for the wheel profiles under investigation.
The WPDM was developed to predict the worn shape and wear rate for each wheelset type of a vehicle fleet. It uses a fleet’s route diagram to characterise the duty cycle of the vehicle in terms of curve radius, cant deficiency and traction/braking performance.16,17 In the WPDM rail library, representative new and worn rail profiles for use in the vehicle dynamics simulations are selected based on the curvature distribution of each route section. These have been selected to represent the average contact conditions that a wheel profile will observe during its life.1,16,17
Wear coefficients.
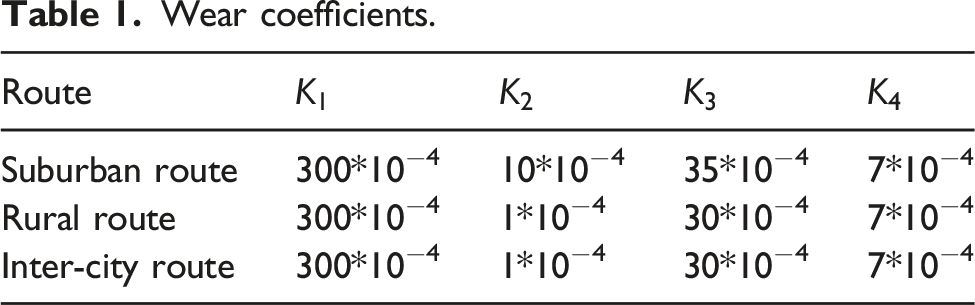
Figure 9 shows the wheel wear prediction methodology in the WPDM. An automated tool launches the VAMPIRE vehicle dynamics simulation and then uses the outputs to calculate the wear.15,16 Wheel profile damage model wheel wear prediction methodology.
16
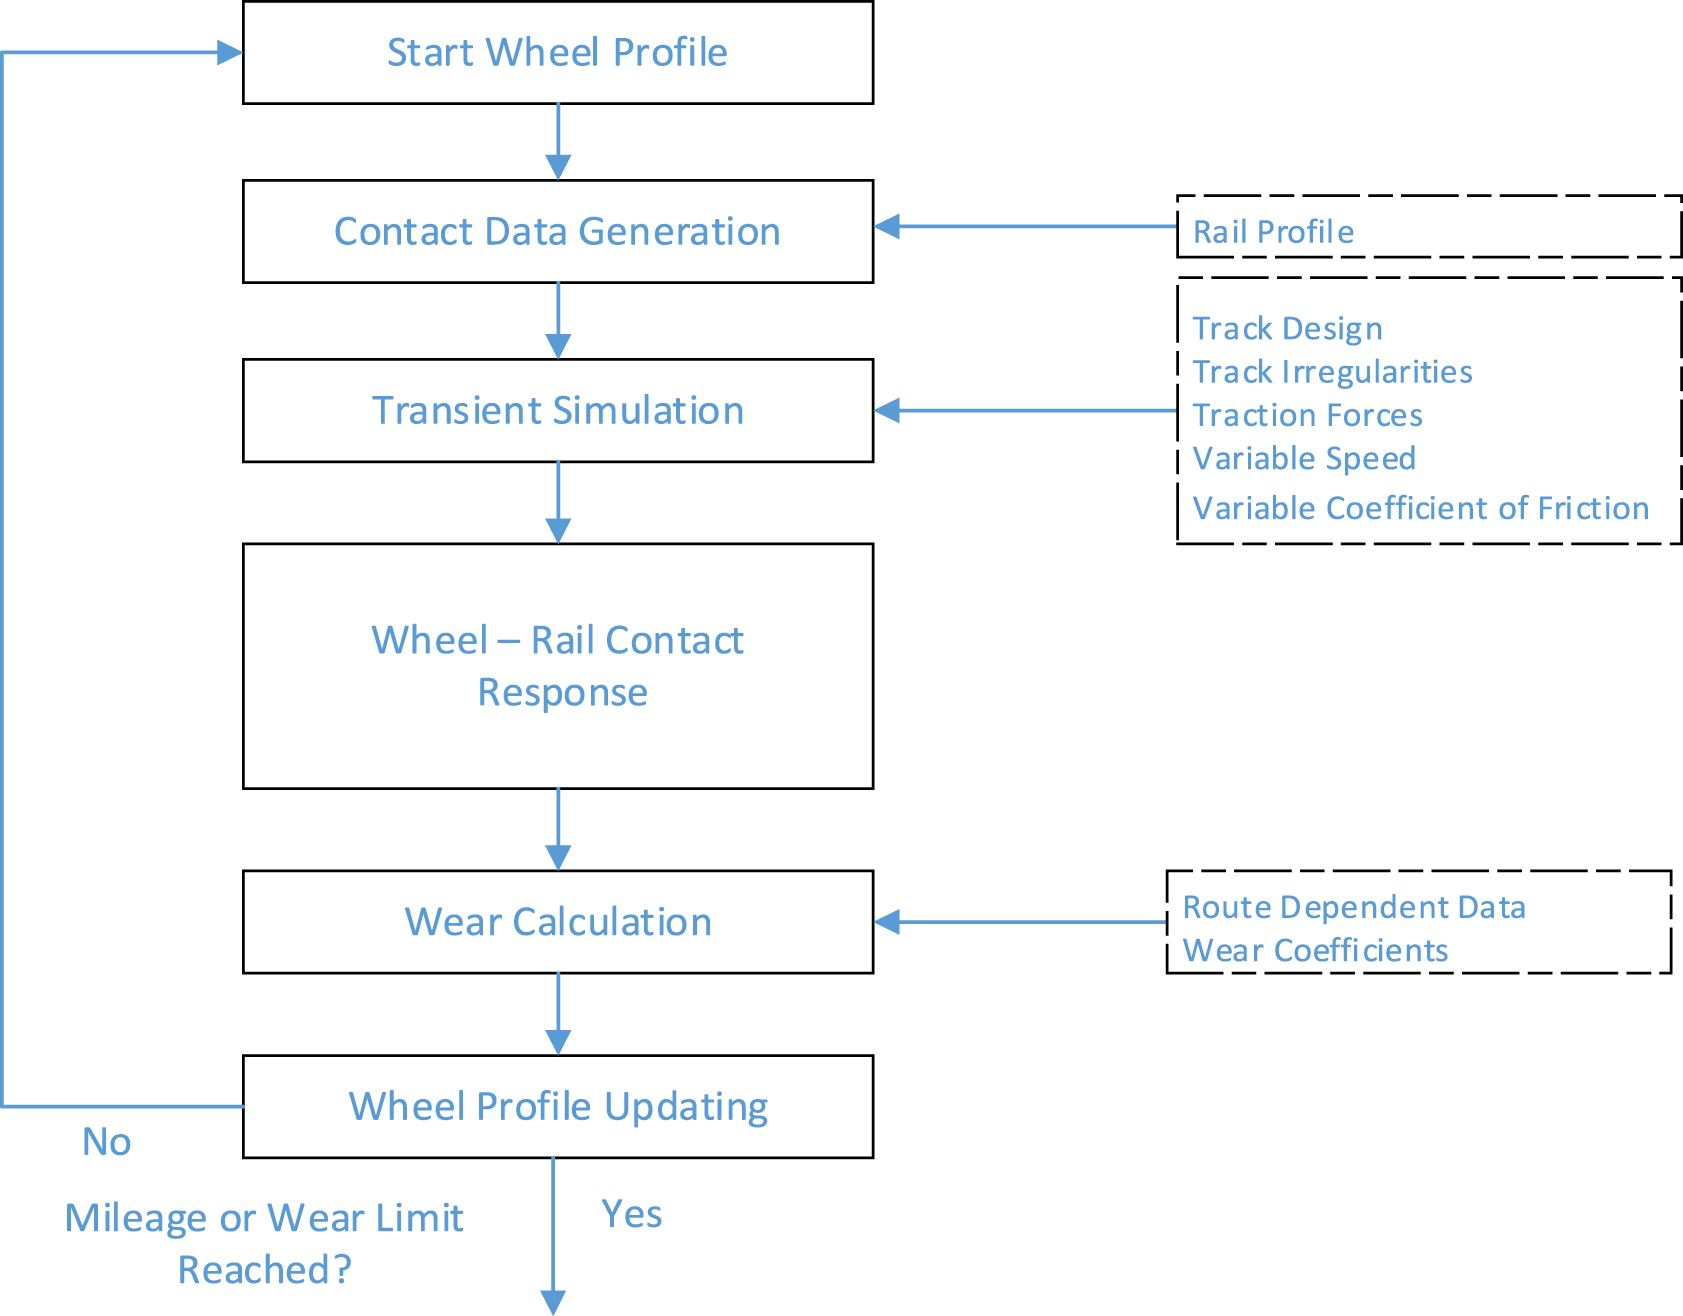
The output from the wheel wear prediction routines includes the change in flange height, Sh (tread wear) and thickness, Sd (flange wear) with increasing running distance. These parameters are generally used to describe wheel profile wear and to determine wheel turning periodicity. 16
As part of a previous study, the WPDM was used to predict the wear rate and shape for new full and thin-flange variants of P8 and P12 wheels for a typical electric multiple unit train (EMU1) running on rural and suburban routes and a higher speed variant (EMU2) running on an inter-city route. 1 The results were compared with measured wheel wear data and, following calibration of the wear model, were found to give a good prediction of both the shape and average wear rate of worn wheels in these cases. 1 EMU1 and EMU2 have different primary yaw stiffnesses ranging from relatively soft for EMU1 to relatively stiff for EMU2.
For the current study, the emerging wear rates and worn shape for design P8 and the proposed RFW4 wheel profiles were predicted for EMU1 running on sections of the South West Mainline (suburban) and Trans Pennine routes (rural) and EMU2 running on sections of the West Coast Main Line route (inter-city).
The distribution of curve radii for the simulated routes indicates that the rural route has higher percentage of curves with a radius that less than 1000 m (18% of total track length) compared to suburban route and inter-city route (respectively 14% and 1% of total track length). Additionally, the analysis showed that the radii for 87% of the inter-city route were higher than 2000 m.
Wear prediction – electric multiple unit 1, suburban route
The results show that the design P8 flange thickness reduces significantly in the first 20,000 miles and then tends to stabilise between 40,000 and 60,000 miles, as shown in Figure 10(a). The simulation results show that the amount of flange wear for EMU1 running over the chosen route was around 1.5 mm after 100,000 miles. Simulated flange thickness and height – electric multiple unit1 on suburban route, P8 and reduced flange wear4 profiles.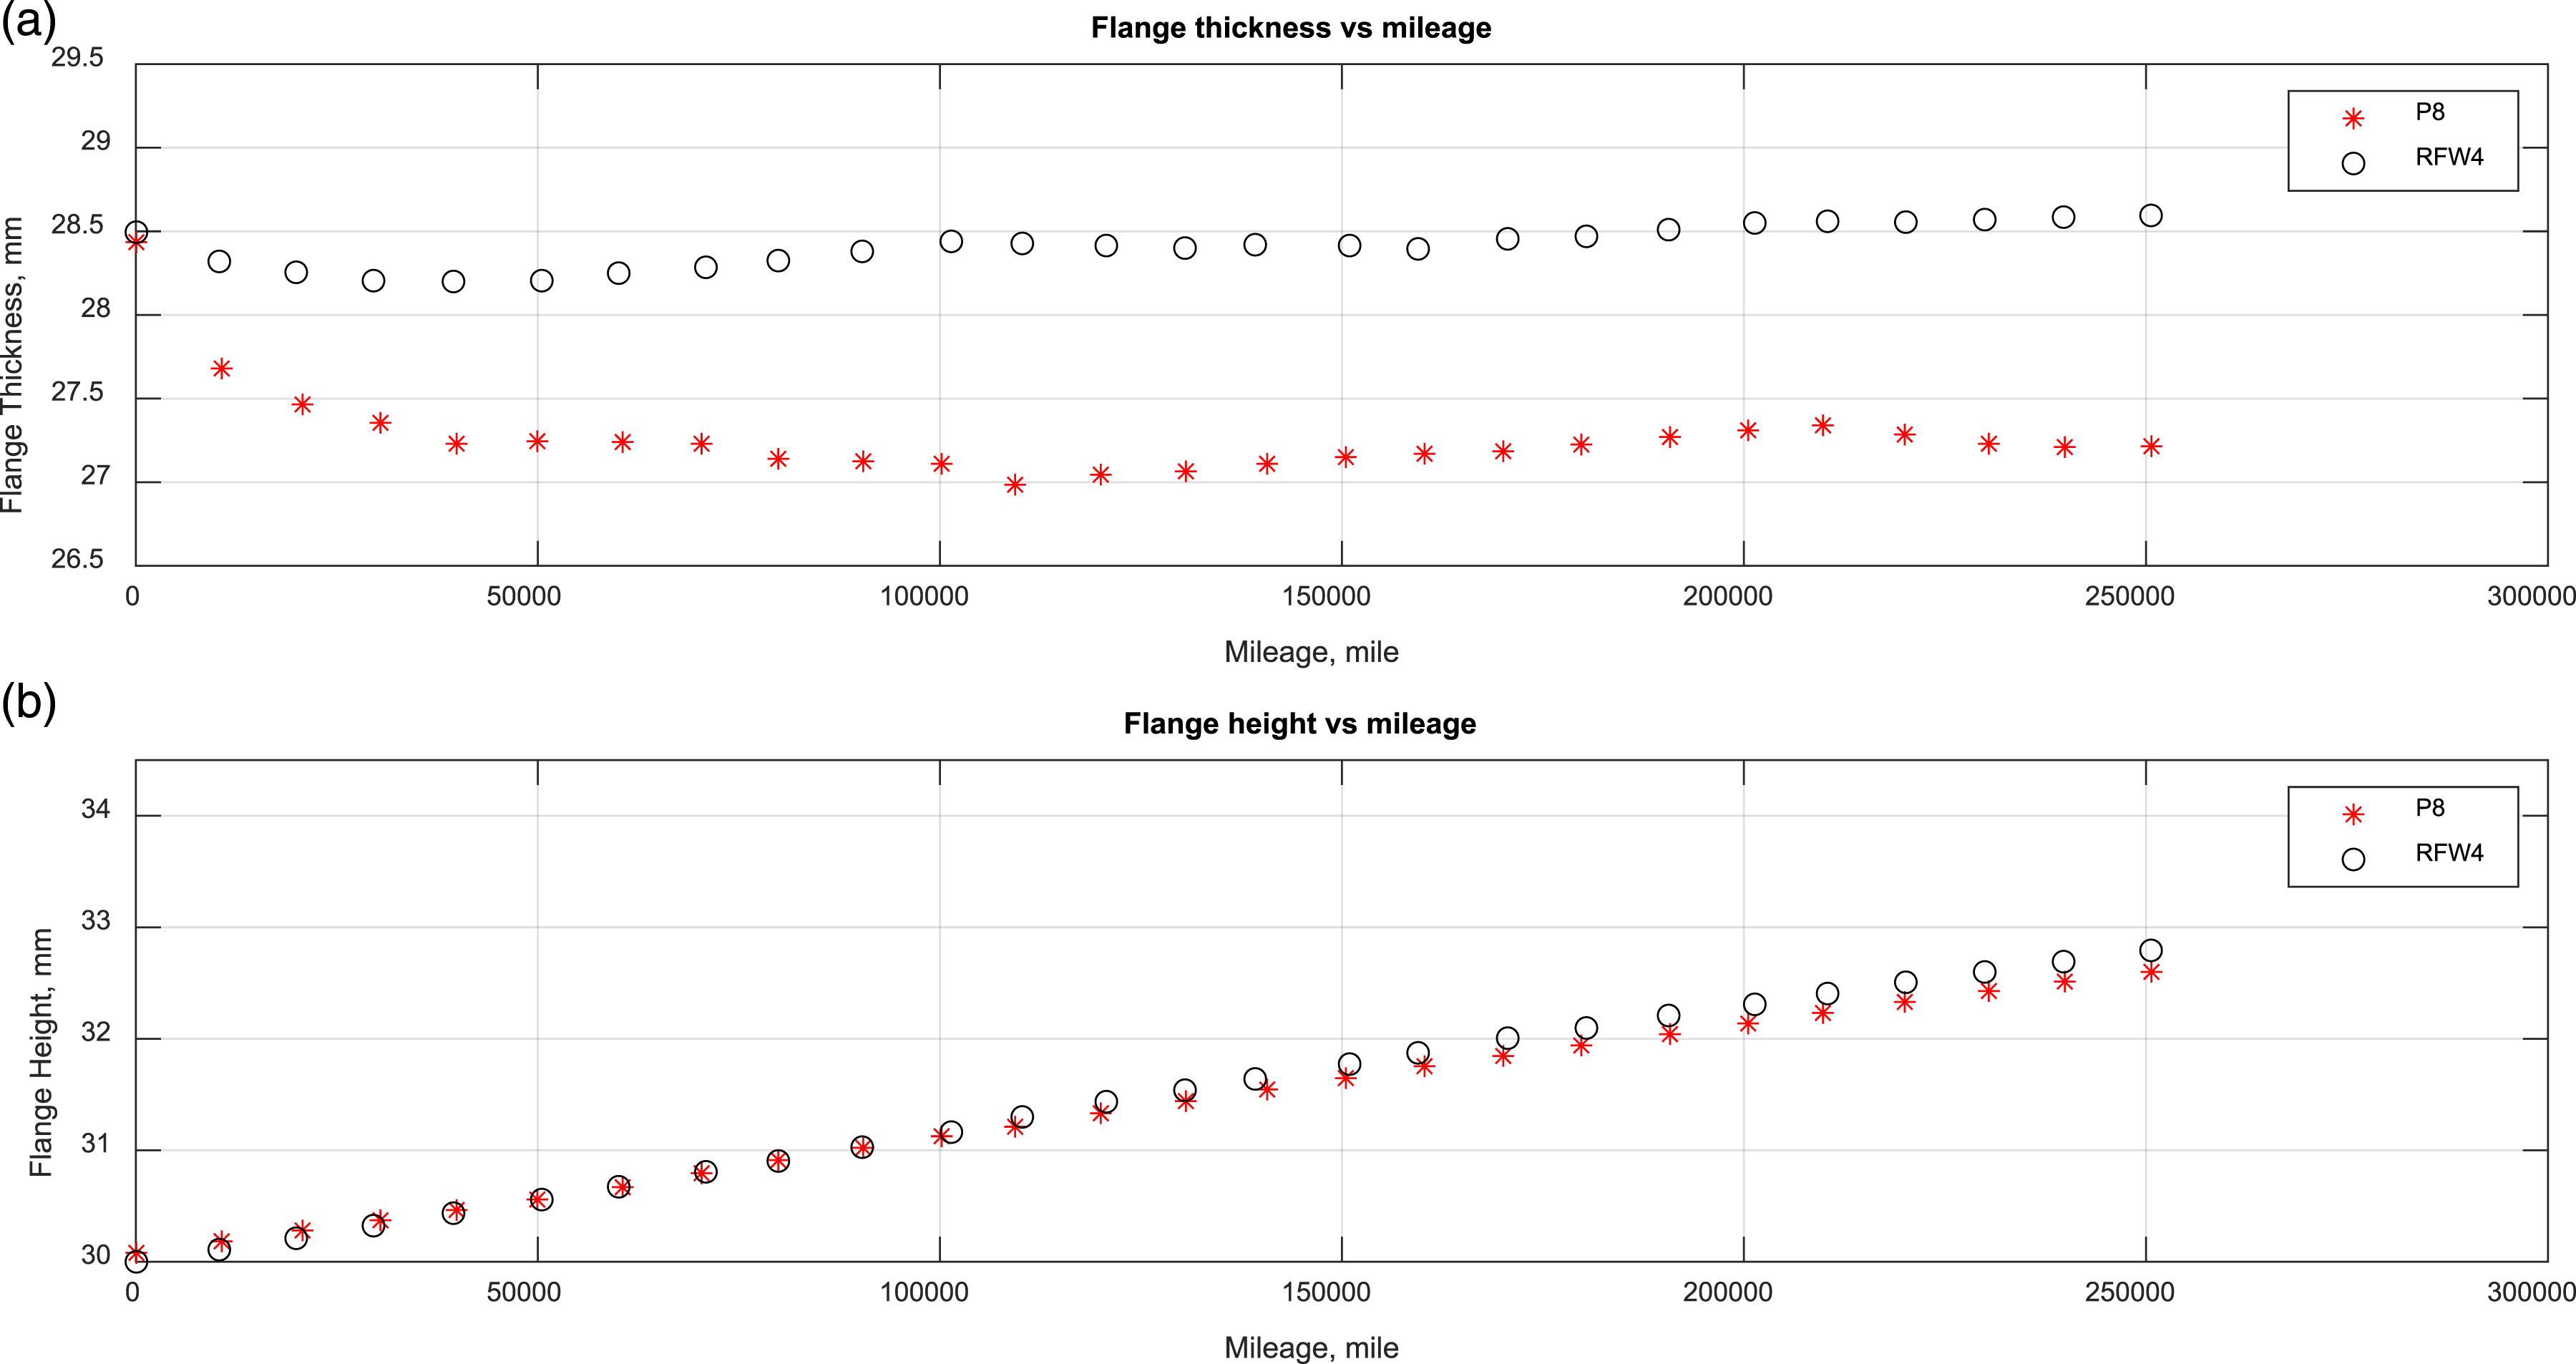
The results show that the RFW4 flange thickness reduces slightly in the first 20,000 miles and then stabilises between 30,000 and 50,000 miles. Beyond 60,000 miles flange thickness tends to increase, due to tread wear. The amount of flange wear for the RFW4 profile was around 0.3 mm after 30,000 miles. The result in Figure 10(b) shows that flange height increases linearly with the mileage run and that the simulated profiles have approximately the same tread wear. The results suggest that the RFW4 profile has considerably lower flange wear rates compared to design P8.
Reduced flange wear profile on electric multiple unit 1 - rural route
The simulated results show that the amount of flange wear of design P8 on EMU1 was around 1 mm after 100,000 miles, as shown in Figure 11(a). For the RFW4 profile, the results show that flange thickness reduces slightly in the first 20,000 miles and then stabilises afterward. The amount of flange wear for RFW4 profile was around 0.3–0.5 mm after 100,000 miles. Additionally, the design P8 and RFW4 profiles have roughly the same tread wear, refer to Figure 11(b). Once again, the RFW4 shows lower flange wear rates compared to design P8. Simulated flange thickness and height – electric multiple unit1 on rural route, P8 and reduced flange wear4 profiles.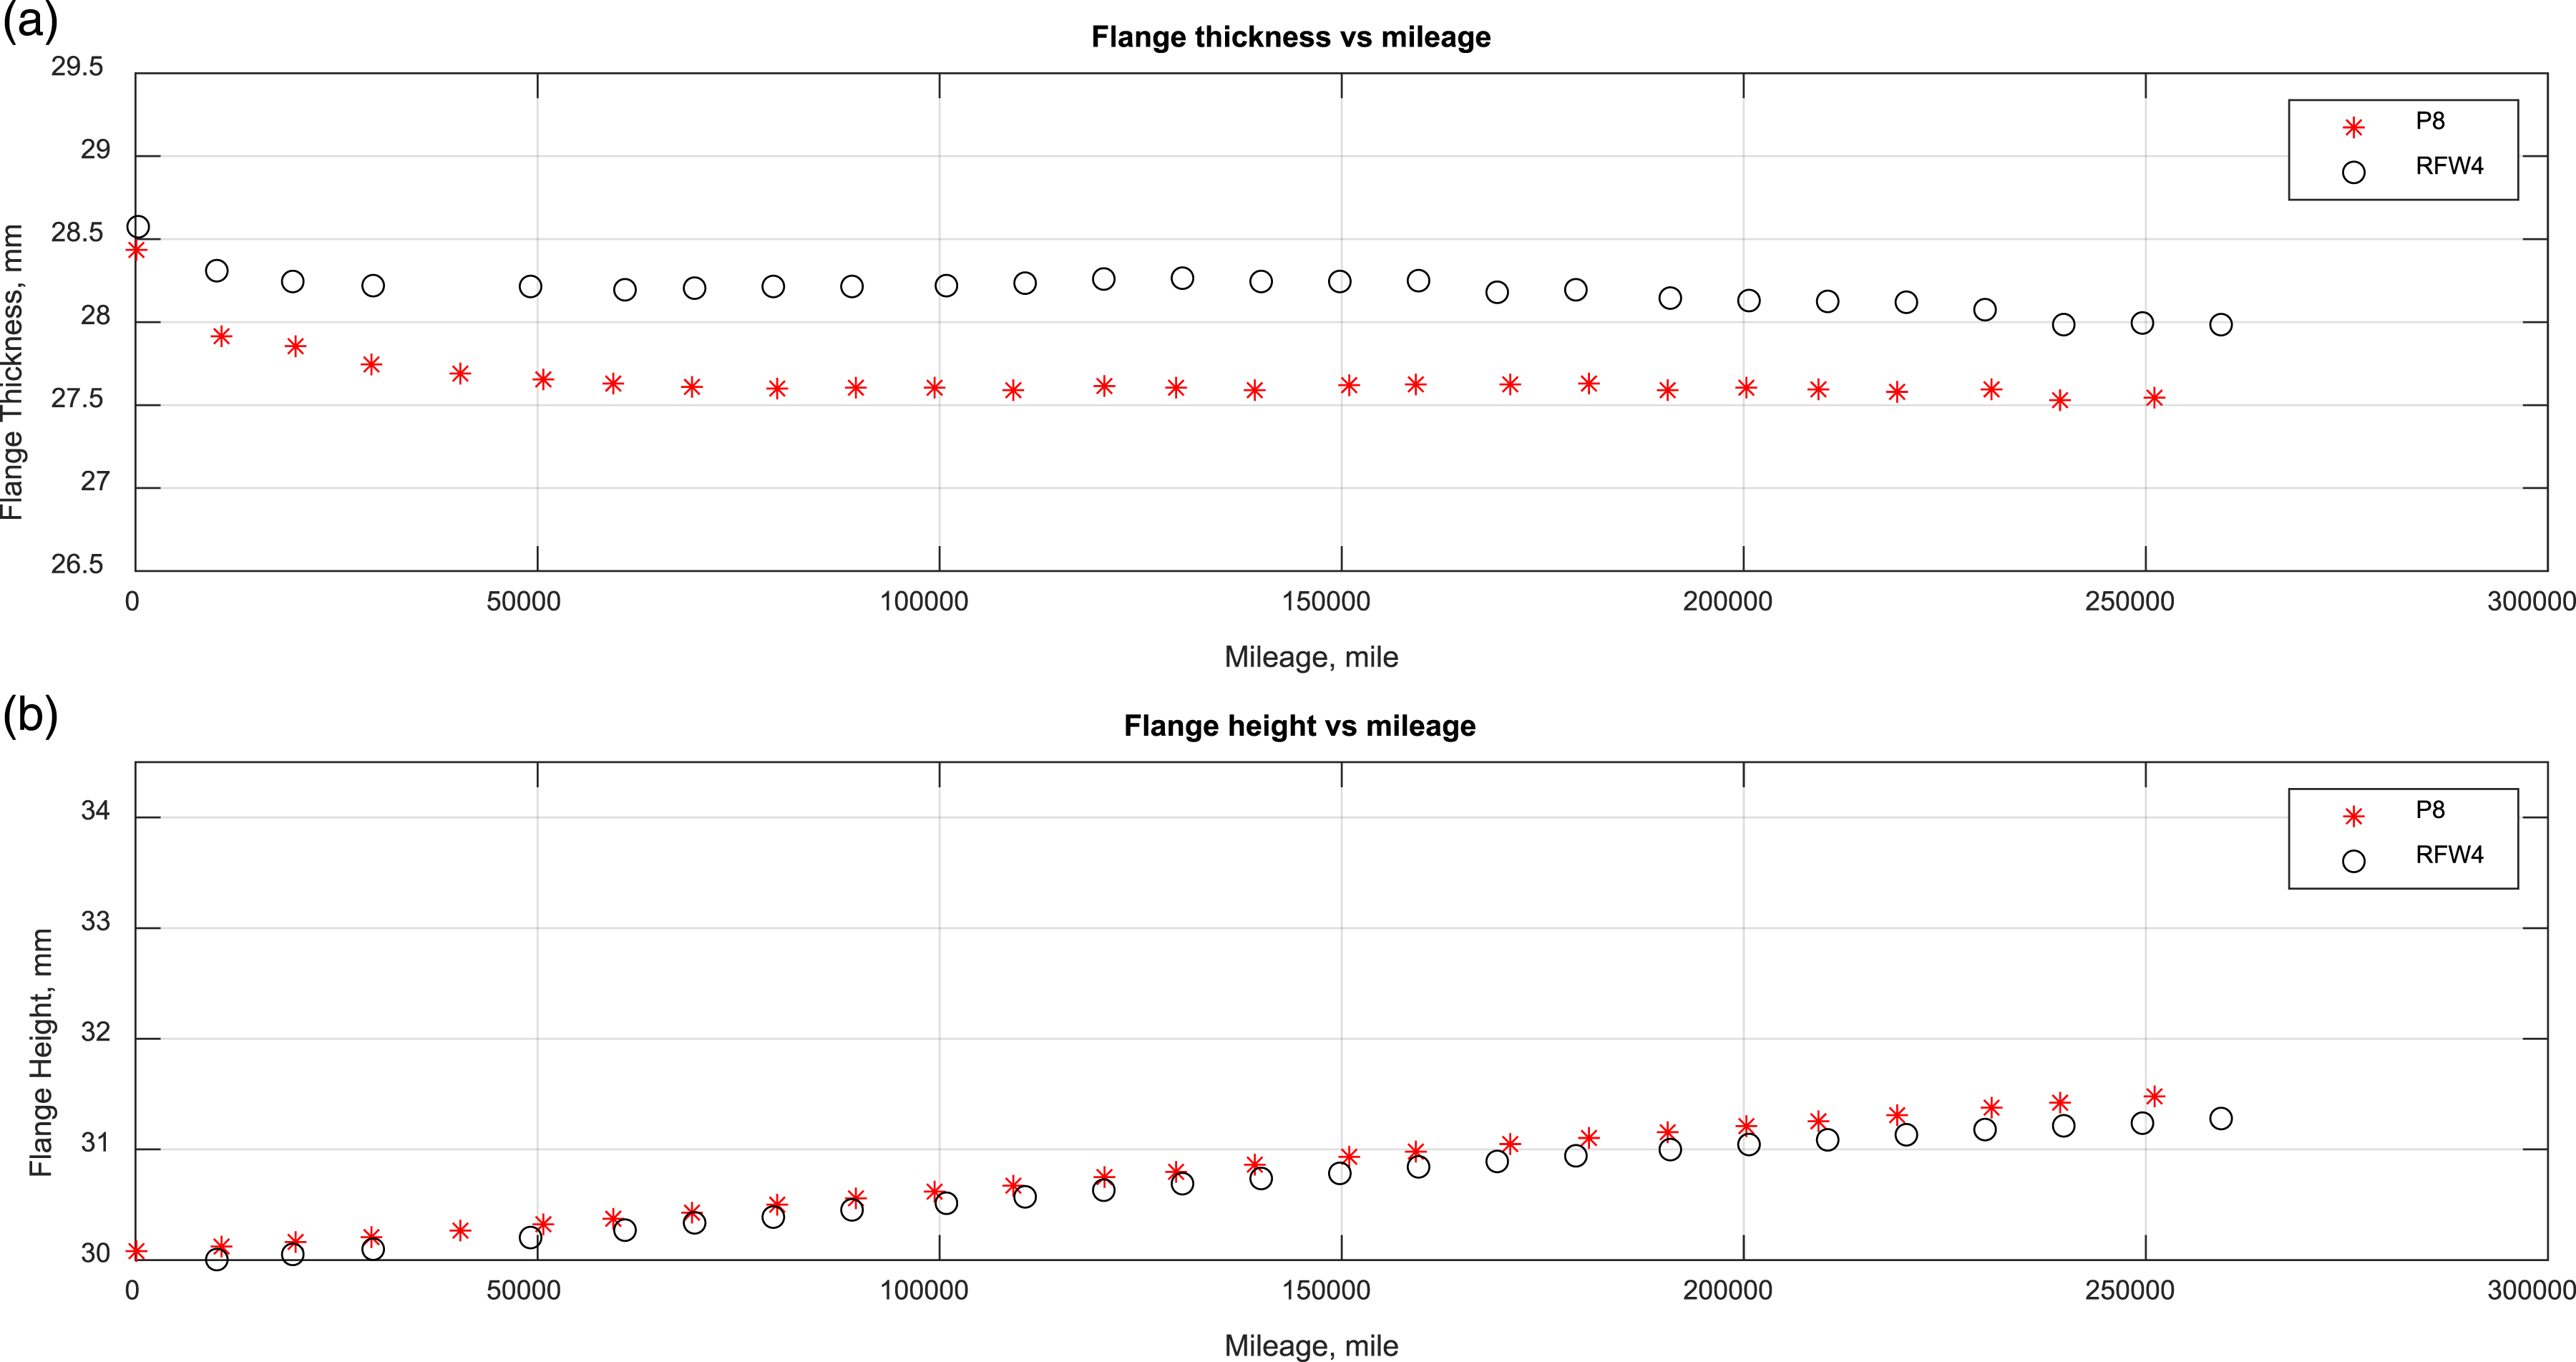
Reduced flange wear profile on electric multiple unit 2 – inter-city route
As shown in Figure 12(a), for the wheels on EMU2 operating on the Inter-city route, the P8 already has relatively low flange wear, after 40,000 miles the flange has worn by 0.5 mm and the flange width starts to increase after 40,000 miles due to tread wear. For the RFW4 profile, flange width starts to increase from very low mileages. Once again, the results show that P8 and RFW4 have a similar rate of tread wear, as shown in Figure 12(b). Simulated flange thickness – electric multiple unit2 on inter-city route, P8 and reduced flange wear4 profiles.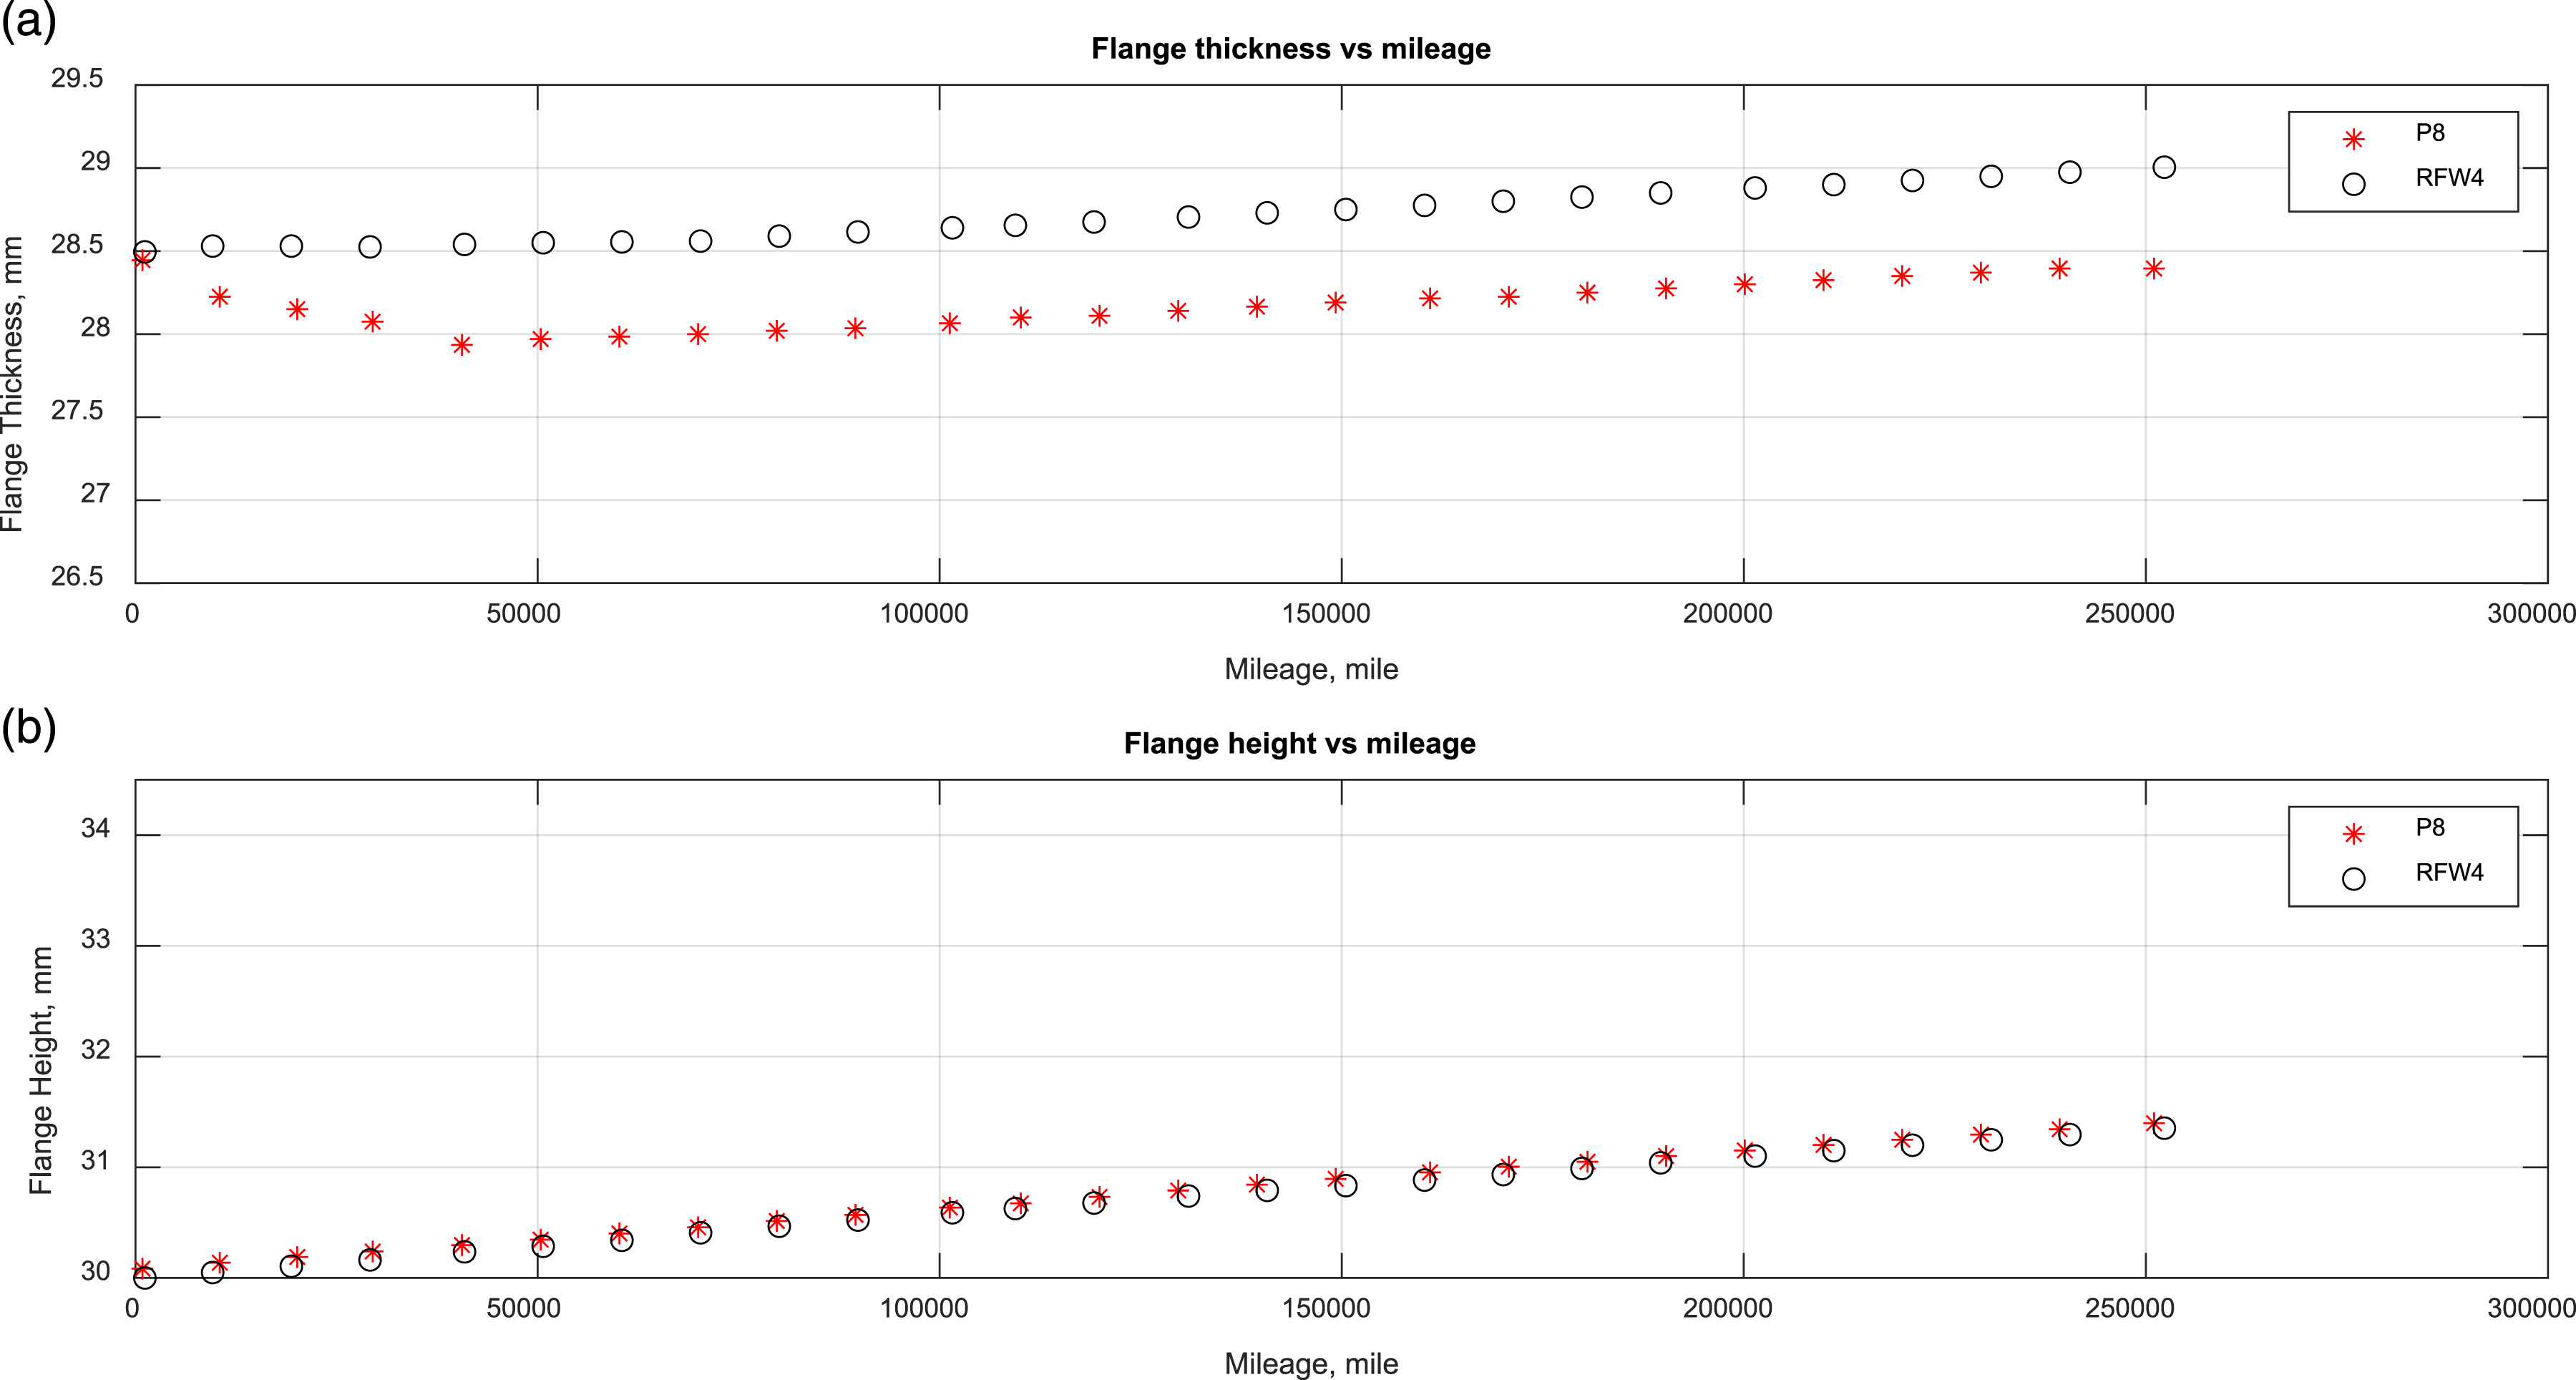
Overall, the simulation results suggest that the RFW4 wheel has significantly lower flange wear rates compared to design P8, and hence it could help to reduce the amount of material removed at each turn, as explained in more detail in Section 4.
Material removal at each turning
The materials removal was calculated for worn wheels, which have been in service for 125,000 miles and 250,000 miles.
In order to estimate the material removal at each turn, the design profiles (P8 or RFW4) were vertically shifted across the worn profile as shown in Figure 13. Later, the cut depth was obtained by measuring the vertical distance between the worn and design profiles at the tread datum point. Re-profiling worn wheel to the design P8 profile – 125,000 miles (electric multiple unit1 operating on suburban route).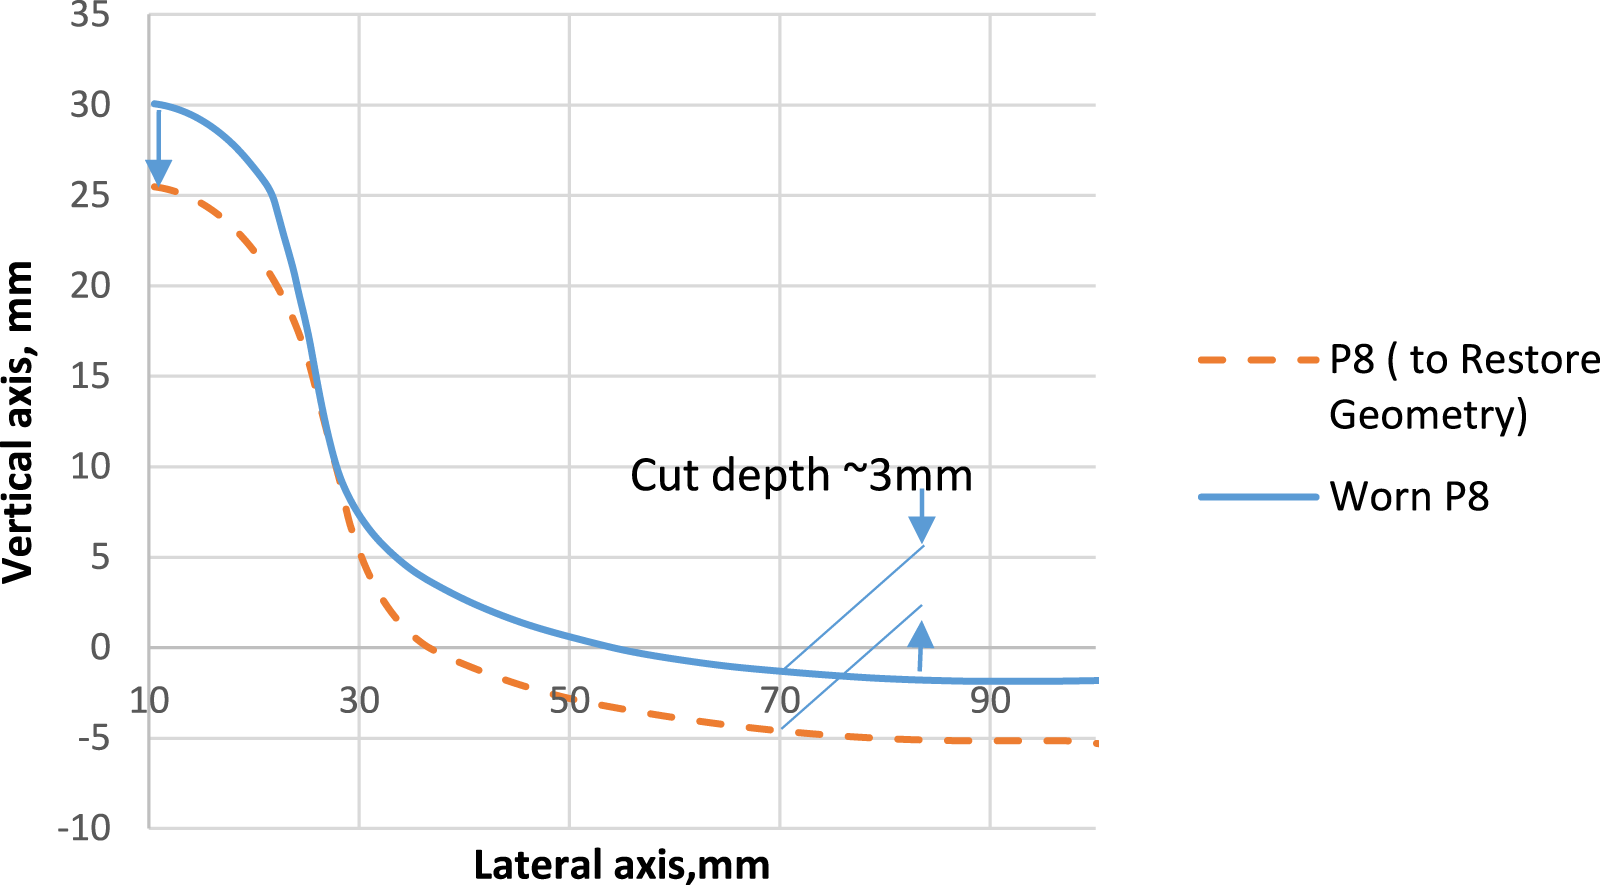
The comparison between cutting depth and crack depth at different running mileages.
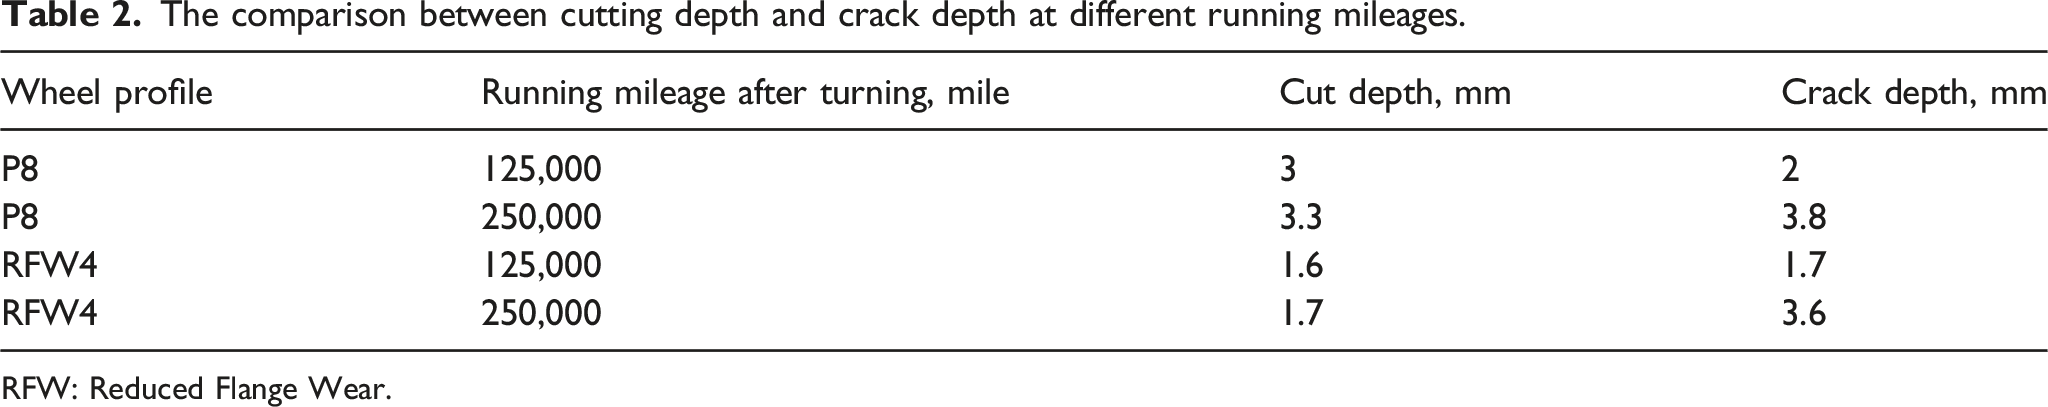
RFW: Reduced Flange Wear.
The wear modelling results suggested that RFW4 wheel shows considerably lower flange wear rates compared to design P8 on the suburban route. Based purely on restoring wheel profile geometry at turning, the RFW4 profile could reduce the amount of material removed at each turn by 50% for wheels that run up to 150,000 miles after turning.
However, turning is not only required to restore profile geometry but also to remove wheel RCF cracking from the wheel. To illustrate this point, Table 2 shows the cut depth required to restore wheel profile geometry versus RCF crack depth for each wheel profile at different running mileages. The crack depth was calculated using Wheel Profile Damage Model (WPDM). The WPDM uses the frictional energy in the contact patch (Tγ) to predict the formation of RCF cracks in a similar manner to models developed to predict RCF damage in rails. 16 A Tγ-damage relationship has been developed which accounts for the interaction of wear and RCF damage, where increased levels of wear remove damage associated with RCF cracking. This relationship has been validated against observations of wheelset damage from a number of GB fleets, more details can be found in Refs. 16 and 17.
As shown in Table 2, the cut depth for the P8 wheel profile (at 150,000 miles after turning) was 3 mm, which is deeper than the crack depth 2 mm, whilst the cut depth for the RFW4 wheel profile (at 150,000 miles after turning) was 1.6 mm, which is similar to the crack depth 1.7 mm.
However, at 250,000 miles, the depth of cut required at turning is controlled by RCF damage and not the worn shape. Considering the requirement to fully remove RCF cracks at turning, the P8 requires a cut depth of 3.8 mm whilst the RFW4 achieves a small reduction to 3.6 mm. The results in Table 2 indicate that the benefits of using RFW4 profiles are reduced as the RCF damage growth.
It is necessary to remove wheel RCF cracking at turning, which significantly reduced the possible savings in material removal in the cases that wheels run at high mileages (i.e., in this case 250,000 miles after turning). The benefit to be gained by the use of an RFW4 profile on any given fleet is therefore dependent on the extent to which wheel re-profiling is driven by the need to control RCF rather than wheel wear.
If a different, RCF resilient wheel material (for example the Lucchini Superlos wheels) is used, the benefits of the lower flange wear rate might be fully achieved even at high running mileages (i.e., higher than 250,000 miles after turning).
Rail rolling contact fatigue damage
There are two main methods for predicting RCF in wheels and rails. These methods are Shakedown theory19–26 and contact patch energy-based model. 27
The Shakedown theory correlates the load factor (represented by the shear stress of material (k) and normal contact stress (po)) and traction coefficient (μ) at the contact patch. According to this method, RCF could be initiated if the contact lies above the shakedown limit.19–25 Shakedown theory has been applied to study the establishment and development of RCF.23–25 However, this method does not account the competing effect of the wear, where increasing the level of wear will remove the RCF damage from the rail.
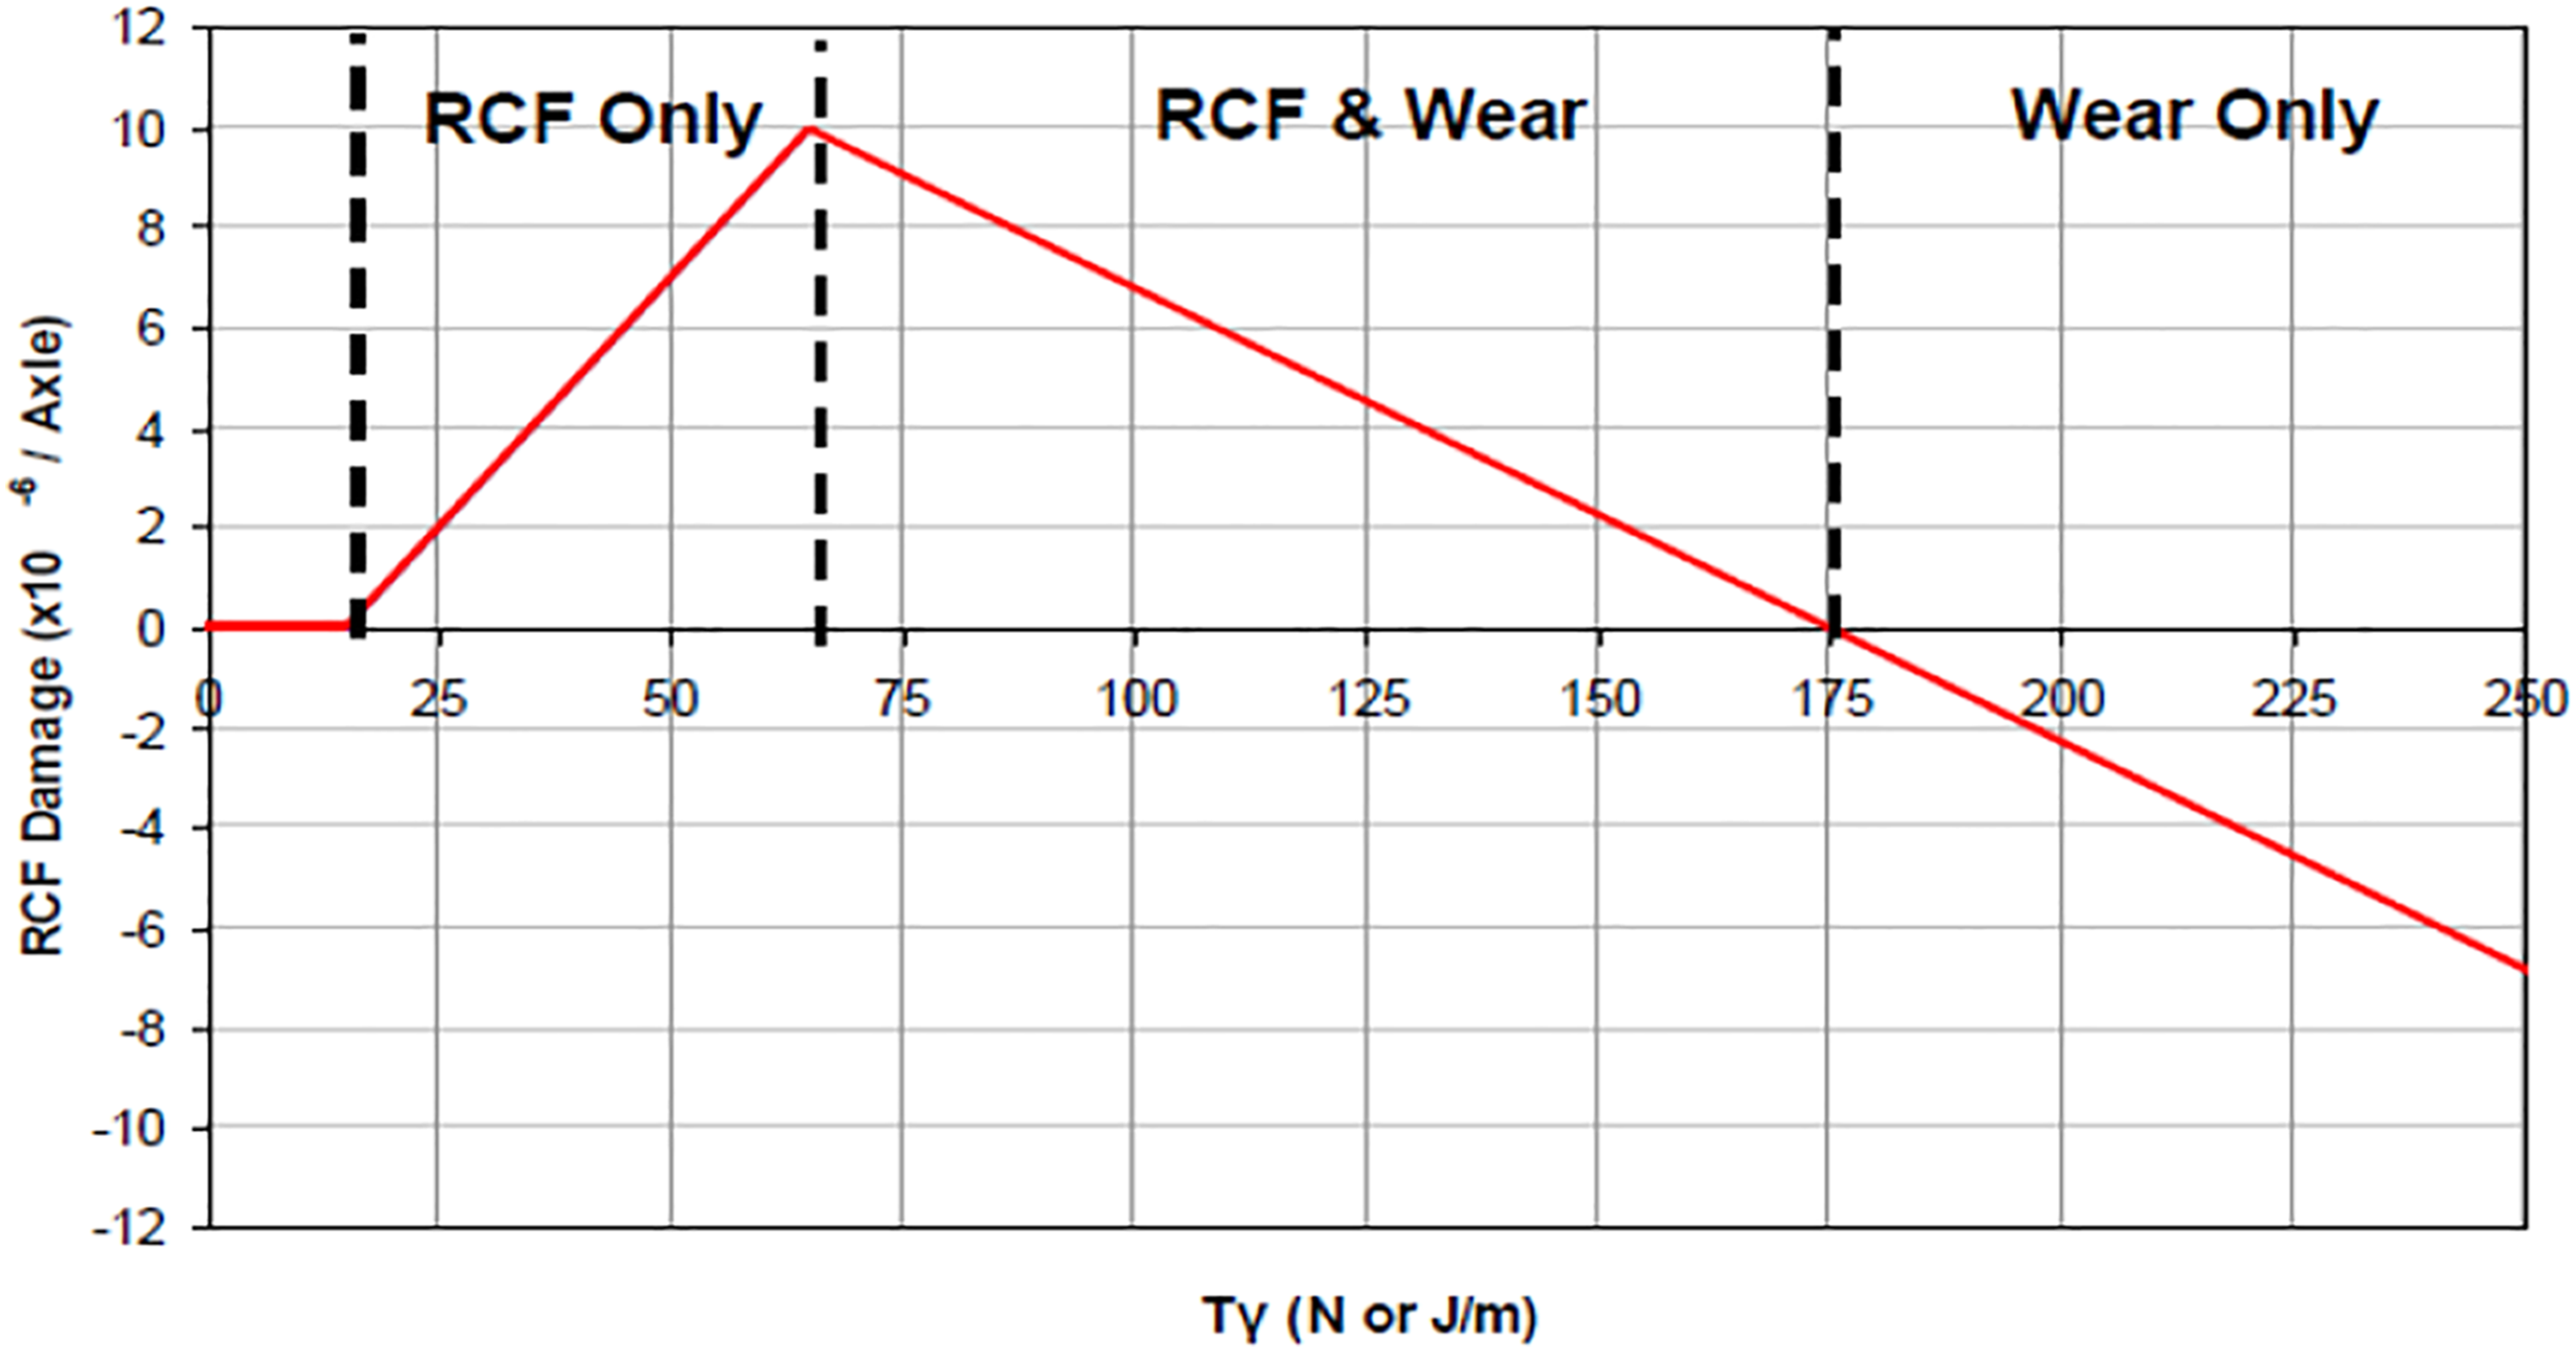
For the current investigation, the contact patch energy (Tγ) based model (known as Whole Life Rail Model) proposed by Burstow
27
was adopted to predict the RCF damage on rails. According to this model, the fatigue damage depends on the values of Tγ in the wheel-rail contact patch as shown in Figure 14. The Whole Life Rail Model (WLRM) does not directly include the effect of contact areas and contact pressures in RCF prediction, however it includes the effects of wear within the damage function, as shown in Figure 14. WLRM is now commonly used both in Great Britain and internationally to predict the susceptibility of rails to RCF. It is incorporated into several industry tools, such as VTISM
28
; and is also a key element of the Network Rail Vehicle Track Access Charge calculation. Whole life rail model damage function.
23
The rail RCF damage was calculated from the contact patch energy (Tγ), predicted for a range of different curve radii and cant deficiencies (40 mm, 75 mm, and 110 mm) using the Vampire® Transient Analysis, and the WLRM damage function. 27
The RCF damage index was calculated based on the contact conditions at the leading high-rail wheel of the EMU1 vehicle.
In order to establish a better understanding of how RCF damage behaviour might be effected by different wheel profiles, three design case rail profiles (CEN56E1, CEN60E2, and NR-HR1 ground rail anti-RCF profiles 29 ) were chosen together with a selection of new and worn wheels (with 60,000 miles since the last turning) and rail profiles. The worn rail profiles were obtained from the Wheel Profile Damage Model (WPDM) rail profile library for curves with a radius of 500 m and 1300 m. 16
The simulation results show that as the cant deficiency increases the RCF damage index decreases. 13 Additionally, the range of radii experiencing RCF is reduced (the damage curve is narrowed) by increasing cant deficiency. 13 The full analysis of RCF damage at different cant differences could be found in Ref. 13. Despite the small differences, similar RCF damage tendencies were found for P8 and RFW4 wheel profiles at different cant deficiencies. 13 The following paragraphs demonstrate the results of the RCF damage caused by P8 and RFW4 profiles at 40 mm cant deficiency.
Figure 15 shows the RCF damage index for design and predicted worn (from WPDM simulation) P8 and RFW4 wheel profiles. High rail electric multiple unit damage - 40 mm cant deficiency.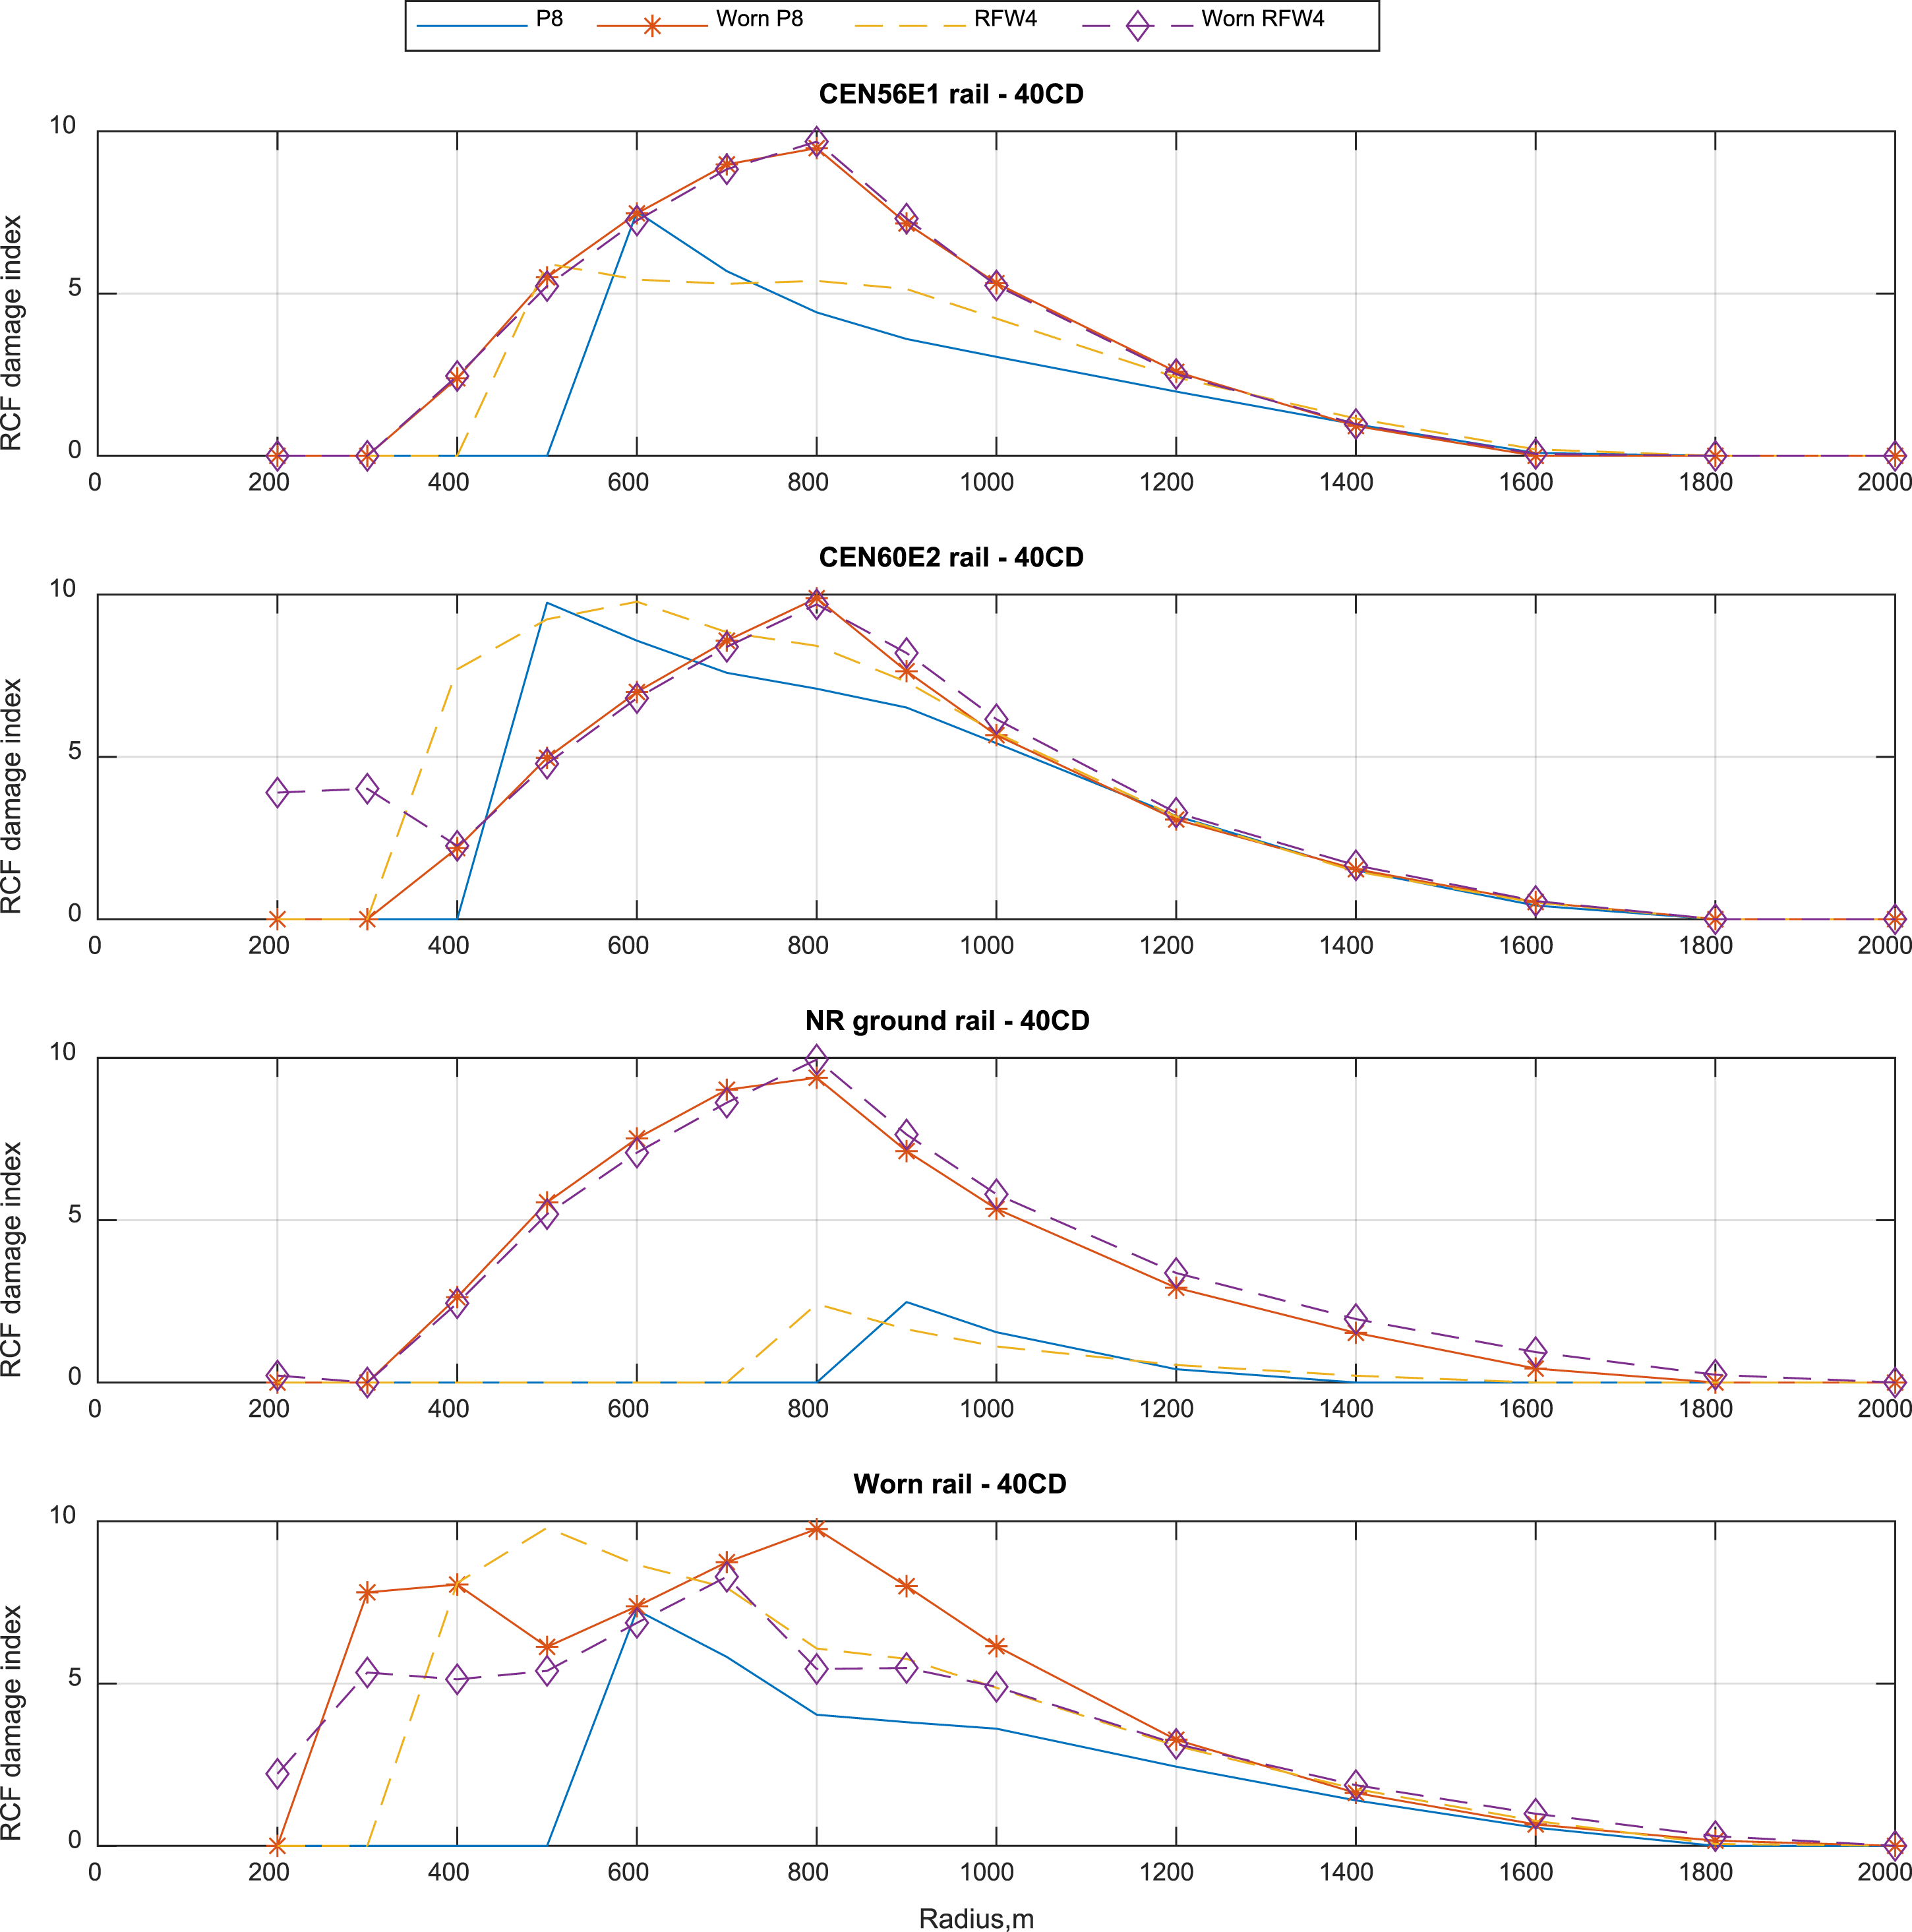
Apart from the NR-HR1 rail case, the RCF damage results indicate that the RFW4 profile has slightly higher RCF damage than design P8, especially for radii between 700 and 1200 m. As the radii become higher than 1200 m, the RFW4 profile tends to show similar RCF damage to the P8. On NR-HR1 rail, the RFW4 profile shows similar rail RCF to that caused by design P8 wheel.
Worn P8 and RFW4 show similar propensity to cause rail RCF on new rails, which is perhaps unsurprising given that the RFW profiles have been developed based on a typical worn shape of a P8 wheel.
Previous studies12,30 suggest that the generation of flange wear and rail RCF damage is related to the contact around the gauge corner and flange root. In order to steer away from flange contact with the rail, and hence reduce flange wear, contact between the flange root and the gauge corner/shoulder is needed. Yet the contact between the flange root and the gauge corner/shoulder might ultimately result in RCF initiation and growth.
Additionally, Johnson 31 suggested that the likelihood of RCF initiation could be reduced by allowing larger conformal contact areas between the wheel and rail. This will lower contact pressures in the region of contact and will lead the contact to lie under the shakedown limit.
As mentioned earlier in Section 2.1.1., the RFW4 profile has slight contact between the wheel flange root and the gauge corner of the CEN56E1 rail. Additionally, compared to the design P8, the RFW4 generates a lower contact area on the CEN60E2 rail. These features in the RFW4 profile could be the reason behind the slight increment in RCF damage prediction.
Whilst new P8 wheels overall show a lower propensity to cause rail RCF compared to the RFW4 it should be noted that wheels do not stay in the new condition for very long. As shown earlier in Figure 2, the design P8 flange thickness reduces significantly in the first 20,000 miles and then tends to stabilise after 30,000miles.
Conclusions
The results suggest that the proposed RFW profile does reduce flange wear compared to a P8, with larger reductions achieved on more curvaceous routes (i.e., the rural route and suburban route considered in this study). The benefits of using the RFW4 profile depend on the route characteristic. For example, on straight mainline routes (such as the inter-city route in this study), the P8 has a low flange wear rate (and flange thickness can even increase over time) and hence there is little scope for improvement. For routes containing more curves, the reduction in flange wear rate achieved by the RFW4 profile is more apparent.
The RFW4 profile could reduce the amount of material removed at each turn by 50% if only profile wear is considered. However, wheel turning is often necessary to remove RCF damage in wheels. There are several ‘RCF resistant’ wheel materials on the market and if these were used the benefits of the lower flange wear rate could be fully achieved. Further work would be required as different wheel materials also have different wear properties. The additional cost of premium wheel steels would need to be considered in the cost benefit analysis.
In some cases, a small increase in wheelset life can achieve larger savings, for example, if a wheelset has a typical life of 1.9 times the bogie overhaul frequency it is often simpler to replace that wheelset at every bogie overhaul. A small increase in wheelset life might allow the wheelset to be replaced every other bogie overhaul. In some cases, the RFW4 profile might contribute towards achieving this.
The flange root shape of a new RFW4 profile appears to cause slightly higher rail RCF than a new P8 (for radii 700 m < R < 1300 m); however, the predicted rail RCF caused by worn RFW4 is very similar to the rail RCF caused by worn P8.
Footnotes
Acknowledgements
This project has been undertaken as part of the Strategic Partnership between RSSB and the University of Huddersfield. The authors would like to thank the industry members of the project steering group for providing advice, guidance and practical support for this project.
Declaration of conflicting interests
The author(s) declared no potential conflicts of interest with respect to the research, authorship, and/or publication of this article.
Funding
The author(s) disclosed receipt of the following financial support for the research, authorship, and/or publication of this article: This study is supported by Rail Safety and Standards Board (COF-UOH-22).