
Abstract
The development, validation and control of a bi-mode train model is presented. A detailed modular model of a United Kingdom Class 800 train, which included carbon dioxide emissions data, was developed in MATLAB/Simulink. This model was validated against data obtained from a full day of rail journeys in the south-west of England. The validated model was used to develop control measures to reduce the carbon dioxide emissions of the train. Combining adaptive speed limit control with selective engine shutdown reduced the carbon dioxide emissions by 19.1% over a representative route without affecting the train’s on-time performance. The model was used to develop a tool for investigating the emissions benefits of (intermittent/discontinuous) route electrification. This tool shows that electrification of a route can reduce the carbon dioxide emissions by 66%.
Keywords
Introduction
As the impacts of CO2 generated by human activity on the global climate become clear, there has been a global effort to reduce these emissions (so-called “decarbonisation”) through elimination and reduction measures. This has been reinforced by a UK-wide commitment to stop the introduction of new internal-combustion-only cars by 20401 and a similar pledge to get “…all diesel-only trains off the track by 2040”. 2 This is set in the context of legislation requiring the UK to become net-zero carbon by 20503 and reflected in the Decarbonisation Report, which states that rail transport will support the UK’s push toward being net zero carbon by 2050. 4 These commitments tie into worldwide agreements on carbon reduction such as the Paris accord, 5 taken to limit the effects of climate change, and a range of projects undertaken by the Shift2Rail consortium in Europe to reduce the emissions of rail traffic.6–8
In order to decarbonise the UK rail sector it is likely that most (if not all) of the rail network will have to be electrified, as electrification provides the lowest carbon intensity for rail transport in the UK. 9 However, the UK government has recently cancelled its ambitious electrification strategy, 10 meaning other methods for decarbonising the rail network – such as battery, hydrogen and bi-mode trains – must be investigated as near-term measures until full electrification is complete. 11 This paper introduces a modular, forward-facing, power flow and carbon dioxide emissions model of a bi-mode train. This model is used to determine the effects of control interventions on the emissions of the bi-mode trains over a given route.
This paper’s novel contribution is a high-fidelity validated model of a high-speed bi-mode (diesel/electric) rail vehicle, including powertrain components, that can be used for calculating the energy and carbon dioxide emissions of the vehicle in both modes. Further novelty comes from the results of detailed investigations into several methods for reducing the CO2 emissions of the vehicle, including selective engine shutdown and a simplified feedforward controller. Previous studies in this area have focussed on high-level calculations and lower speed rail vehicle behavior.12,13
Background
Electrification of the UK rail network
The UK’s Rail Industry Decarbonisation Taskforce concluded that “electric traction, where the line is sufficiently intensively used, provides the lowest whole life carbon impact, and delivers services that are faster, more reliable, quieter and less polluting than diesel”. 4 Approximately 38% of the UK rail network (6,012 route-kilometres) is electrified and approximately 70% of all passenger rail traffic uses electric traction. 14 High speed, long distance lines are electrified using a 25 kV overhead system, extending to 9,697 single-track-kilometres in 2019/2020. 15
This paper investigates the reduction in carbon dioxide emissions from the operational phase of the bi-mode rail vehicle, it does not take into account the environmental effects or embodied carbon dioxide of track electrification,16,17 the manufacture of electric rail vehicles, 18 or the modal shift away from higher-polluting modes of transport. 19
Decarbonisation studies for the UK rail network
Network Rail, the UK infrastructure operator, has been tasked to produce a Traction Decarbonisation Network Strategy (TDNS) 20 to identify the preferred method of removing diesel traction from each route on the network. Possibilities include electrification, replacing diesel traction with hydrogen21,22 and battery powered trains. 23 RSSB report T1145 assesses the different energy sources available against journey requirements. 24
Vehicle energy consumption reduction
Previous studies have investigated driver interventions for reducing the energy consumption (and therefore carbon dioxide emissions) of rail vehicles and found that these can reduce energy consumption by up to 20%.25–27 Other work has focussed on the energy consumption of hydrogen trains. 21 However, this work was focussed on electric traction systems and did not consider internal combustion engines or bi-mode operation. It also relied upon high-level models rather than the detailed component-level model presented here. This paper will also report on vehicle-based interventions for reducing fuel consumption, similar to the equivalent consumption minimisation strategy (ECMS) developed for the automotive sector. 28
Model development
Figure 1 is a schematic representation of the developed train model. (The energy storage block shown was not implemented because this storage is not present in bi-mode trains. However, allowances have been made for this in the model and, due to the modular approach to the model, it would be straightforward to add the model of an energy storage device such as a battery or a unidirectional energy source such as a hydrogen fuel cell.) This shows the interactions between the driver and the vehicle, and the power flows between individual components within the model. This was developed as a high-fidelity model where each sub-model was created independently and can be easily swapped for another of the same type, similar to functional mock-up units (FMUs).29–31 The components are discussed in more detail below.
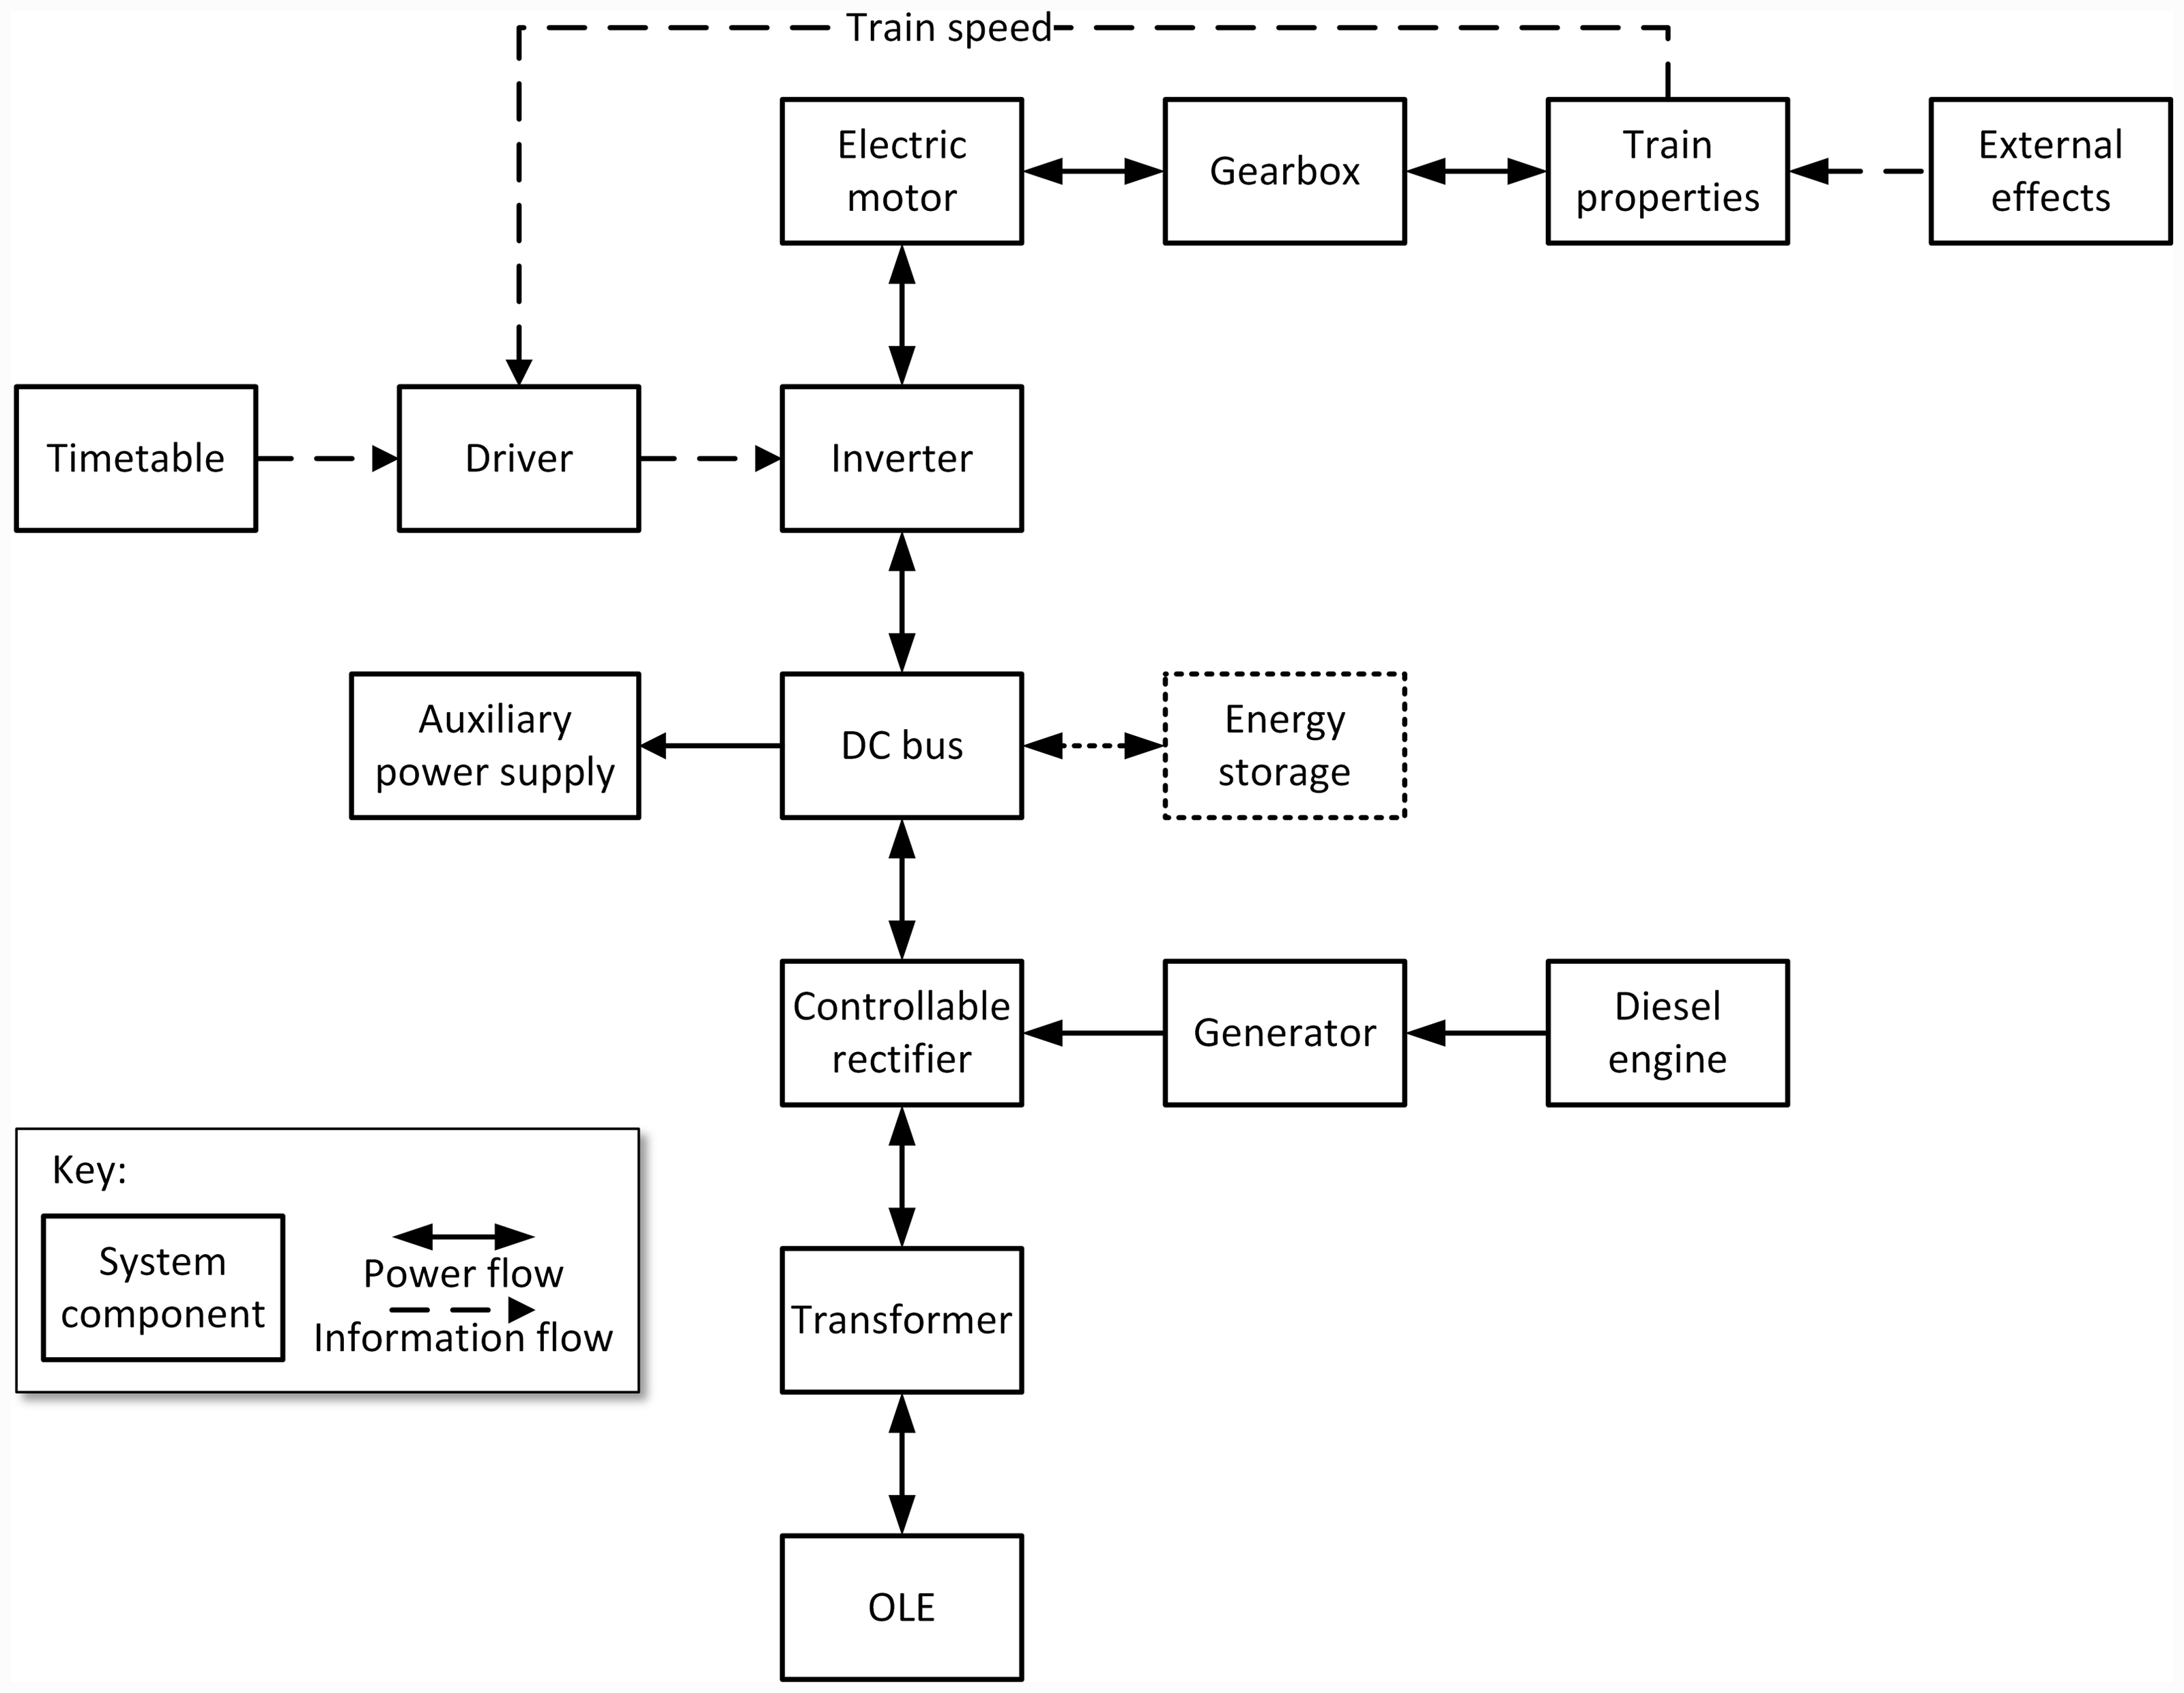
Schematic of the train model. OLE – Overhead line equipment.
This is based upon the Hitachi AT300 product family (Class 800, 801 and 802, here denoted as 80x) of trains currently being introduced onto the UK rail network. Class 800 and 802 are a 5 or 9 car bi-mode (25 kV electric/diesel) trains capable of operating at up to 225 km/h, manufactured by Hitachi Rail Europe (HRE). 32 Class 801 are similar but are 25 kV electric trains without the diesel engine and generator sets of the Class 800 and 802.
Timetable and routes
The route modelled is London Paddington to Paignton and Plymouth via Westbury. Working timetable data were accessed through OpenTrainTimes. 33 The speed limits for these sections of track were taken from the Network Rail sectional appendices for June 2019. 34
Train driver
The driver model aims to accelerate up to and then maintain the speed limit, and then to decelerate no harder than a pre-set deceleration limit. This was implemented with a proportional-integral (PI) speed controller. In the interests of consistency, a single driver model is used for all results in this study. The driver controller, G(s), was given by:

External effects
Gradient profiles were obtained for the routes identified above. 35 Currently the model assumes zero crosswind or headwind, but provision is made for these in the model. Adverse railhead conditions such as leaf fall, wet rails and wheel slip/slide are not considered, and neither are the detailed contact mechanics at the rail-wheel contact patch. Increased rolling resistance through curves is considered small and not included in this model.
Train dynamics and properties
Train characteristics such as the train mass and number of seats were taken from publicly available information32,36 and are given in Table 1. A 40% loading of passengers, each weighing 90 kg, was assumed for all cases modelled. 37
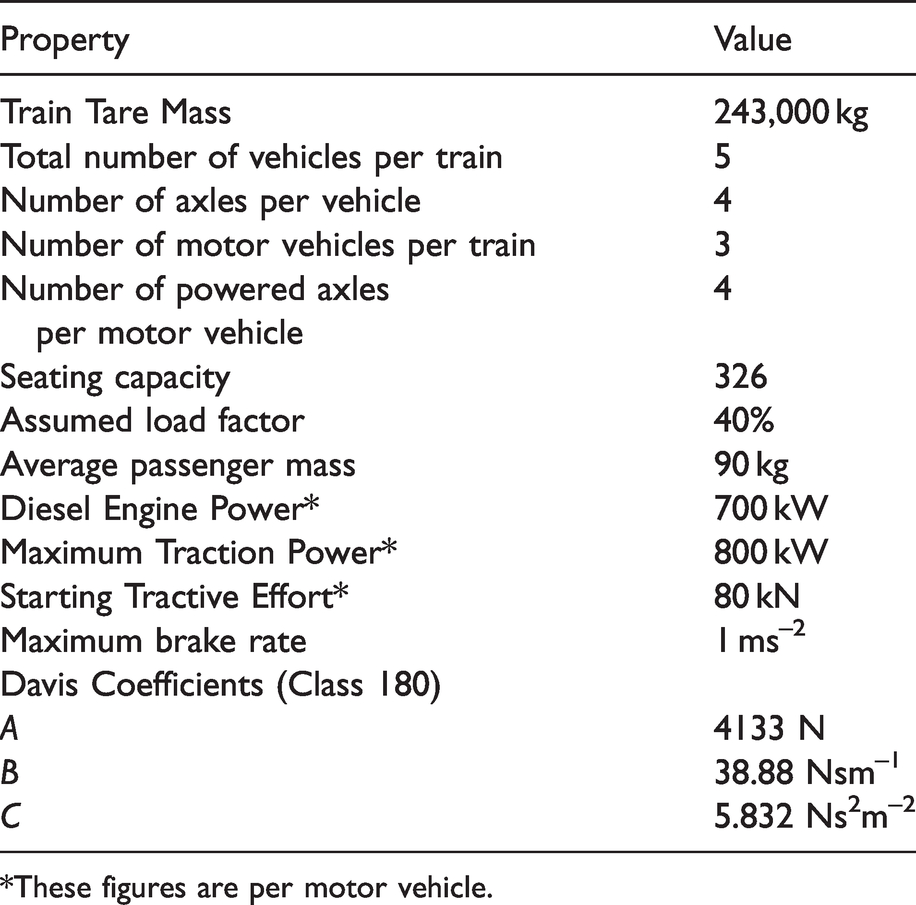
*These figures are per motor vehicle.
The drag acting on the train is comprised of three components: aerodynamic drag, rolling resistance drag and the gradient force due to gravity. The aerodynamic and rolling resistance drag forces (Fd) are commonly calculated using Davis coefficients.
38
There is a constant component (A), a component (B) proportional to the train speed (v), and a component (C) proportional to the square of train speed:
In the absence of Davis coefficients for a Class 80x train, the values for a Class 180 diesel train were used (see Table 1). These should be similar values, given the similar formation, performance and duty cycle of the Class 180 and Class 80x trains.
The gradient force (Fg) is calculated using:
The sum of these forces determines the acceleration of the train according to:
Motor and gearbox
The force accelerating the train, Fa, is provided by the traction motor:

The torque required to overcome wheelset inertia is calculated from the train acceleration, wheel radius and the moment of inertia of the wheelset, estimated from leading dimensions of the wheelset.
The motor is simulated as a simple DC motor and thus the torque generated by the motor is given by:


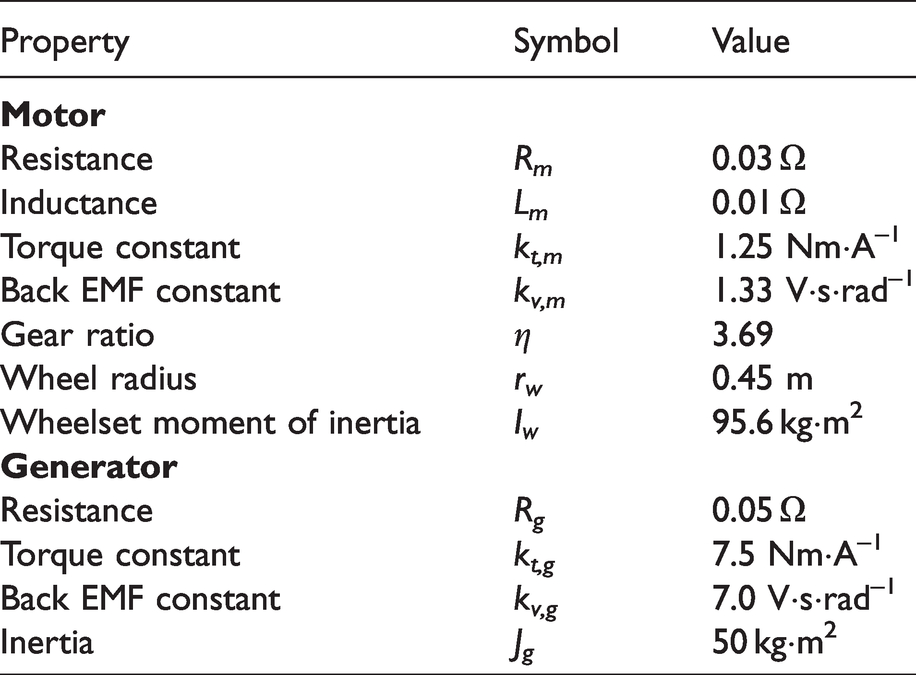
The properties for this motor are given in Table 2. Motor constants were calculated and extrapolated from data available from manufacturers of similar-sized motors. The maximum power and torque of the motors used on the Class 80x trains has been calculated from published data. 36 The gearbox ratio was inferred from information available from Voith. 39
Motor and generator properties.
Deceleration and braking
The Class 80x trains use electro-dynamic braking, blended with friction braking at low speeds. In electric mode, the power generated is fed back into the OLE. When in diesel mode, the energy is dissipated in resistors. The blend of electro-dynamic and friction braking is not modelled in detail. A regenerative braking efficiency of 40% is assumed when operating in electric mode. A target deceleration rate of 0.4 ms−2 is used when calculating the target velocity during deceleration.
Auxiliary power supply
The power required for air compressors, lighting, heating, ventilation and air conditioning was fixed at 20 kW per vehicle, based on discussions with rail operators. In reality, this may vary due to environmental and loading effects, with some finding maximum ‘hotel loads’ of up to 50 kW per vehicle for modern trains. 40 However, these were deemed as secondary effects, and therefore the power required was set at 20 kW per vehicle.
Diesel engine and generator
The diesel engine is based on a model of heavy goods vehicle engine available to the team. 41 The engine model has been scaled up to match the power available from the Class 80x train’s engines using data from the engine manufacturer. 42
The generator is modelled as a simple direct current (DC) generator using the properties in Table 2. The angular velocity ωg of the generator is given by:


When running under electrified overhead line equipment (OLE), the tractive force of the train is limited initially by the starting tractive effort, and subsequently by the maximum power of the electric motors, as it is assumed that the OLE can provide as much power as is required by the vehicle. This is considered reasonable for a 25 kV OLE and a 5-car train, but current limits can be introduced if required. The maximum power provided by the diesel engine-generators is less than the maximum power of the electric motors (see Table 1), therefore the performance of the train (maximum speed and acceleration) is limited when running on diesel.
Overhead line equipment (OLE)
The OLE is assumed to be a perfect power source – it can supply sufficient power for the train’s motors to run at their maximum power output. In some cases, the power supply can be limited (for example, due to the number of trains drawing power from a single substation), but these have not been considered here. However, the model can incorporate a power limit if it is considered necessary. The power usage at each model timestep is integrated to give the total energy used by the train in kilowatt-hours (kWh). The CO2 emitted when running on OLE is calculated using a figure of 257 g/kWh, the current carbon intensity of the UK national electricity grid. 43 It should be noted that as countries shift their electricity generation away from fossil fuels and towards nuclear and renewable energy sources, the carbon intensity of the grid will also decrease, further improving the net CO2 benefits of electrifying train routes.
Model validation
In order to ensure the model of the Class 80x train developed above was representative of a real train, model validation was undertaken.
Data acquisition
A day of data gathering was undertaken on the 7th February 2020. The chosen route originated and terminated at North Pole Depot in west London. After a positioning move from North Pole to London Paddington, the train ran from Paddington to Paignton and back, then from Paddington to Plymouth and back, before returning to North Pole depot (see Figure 2(a)). The vertical profile, which is an input into the train model, is given in Figure 2(b).
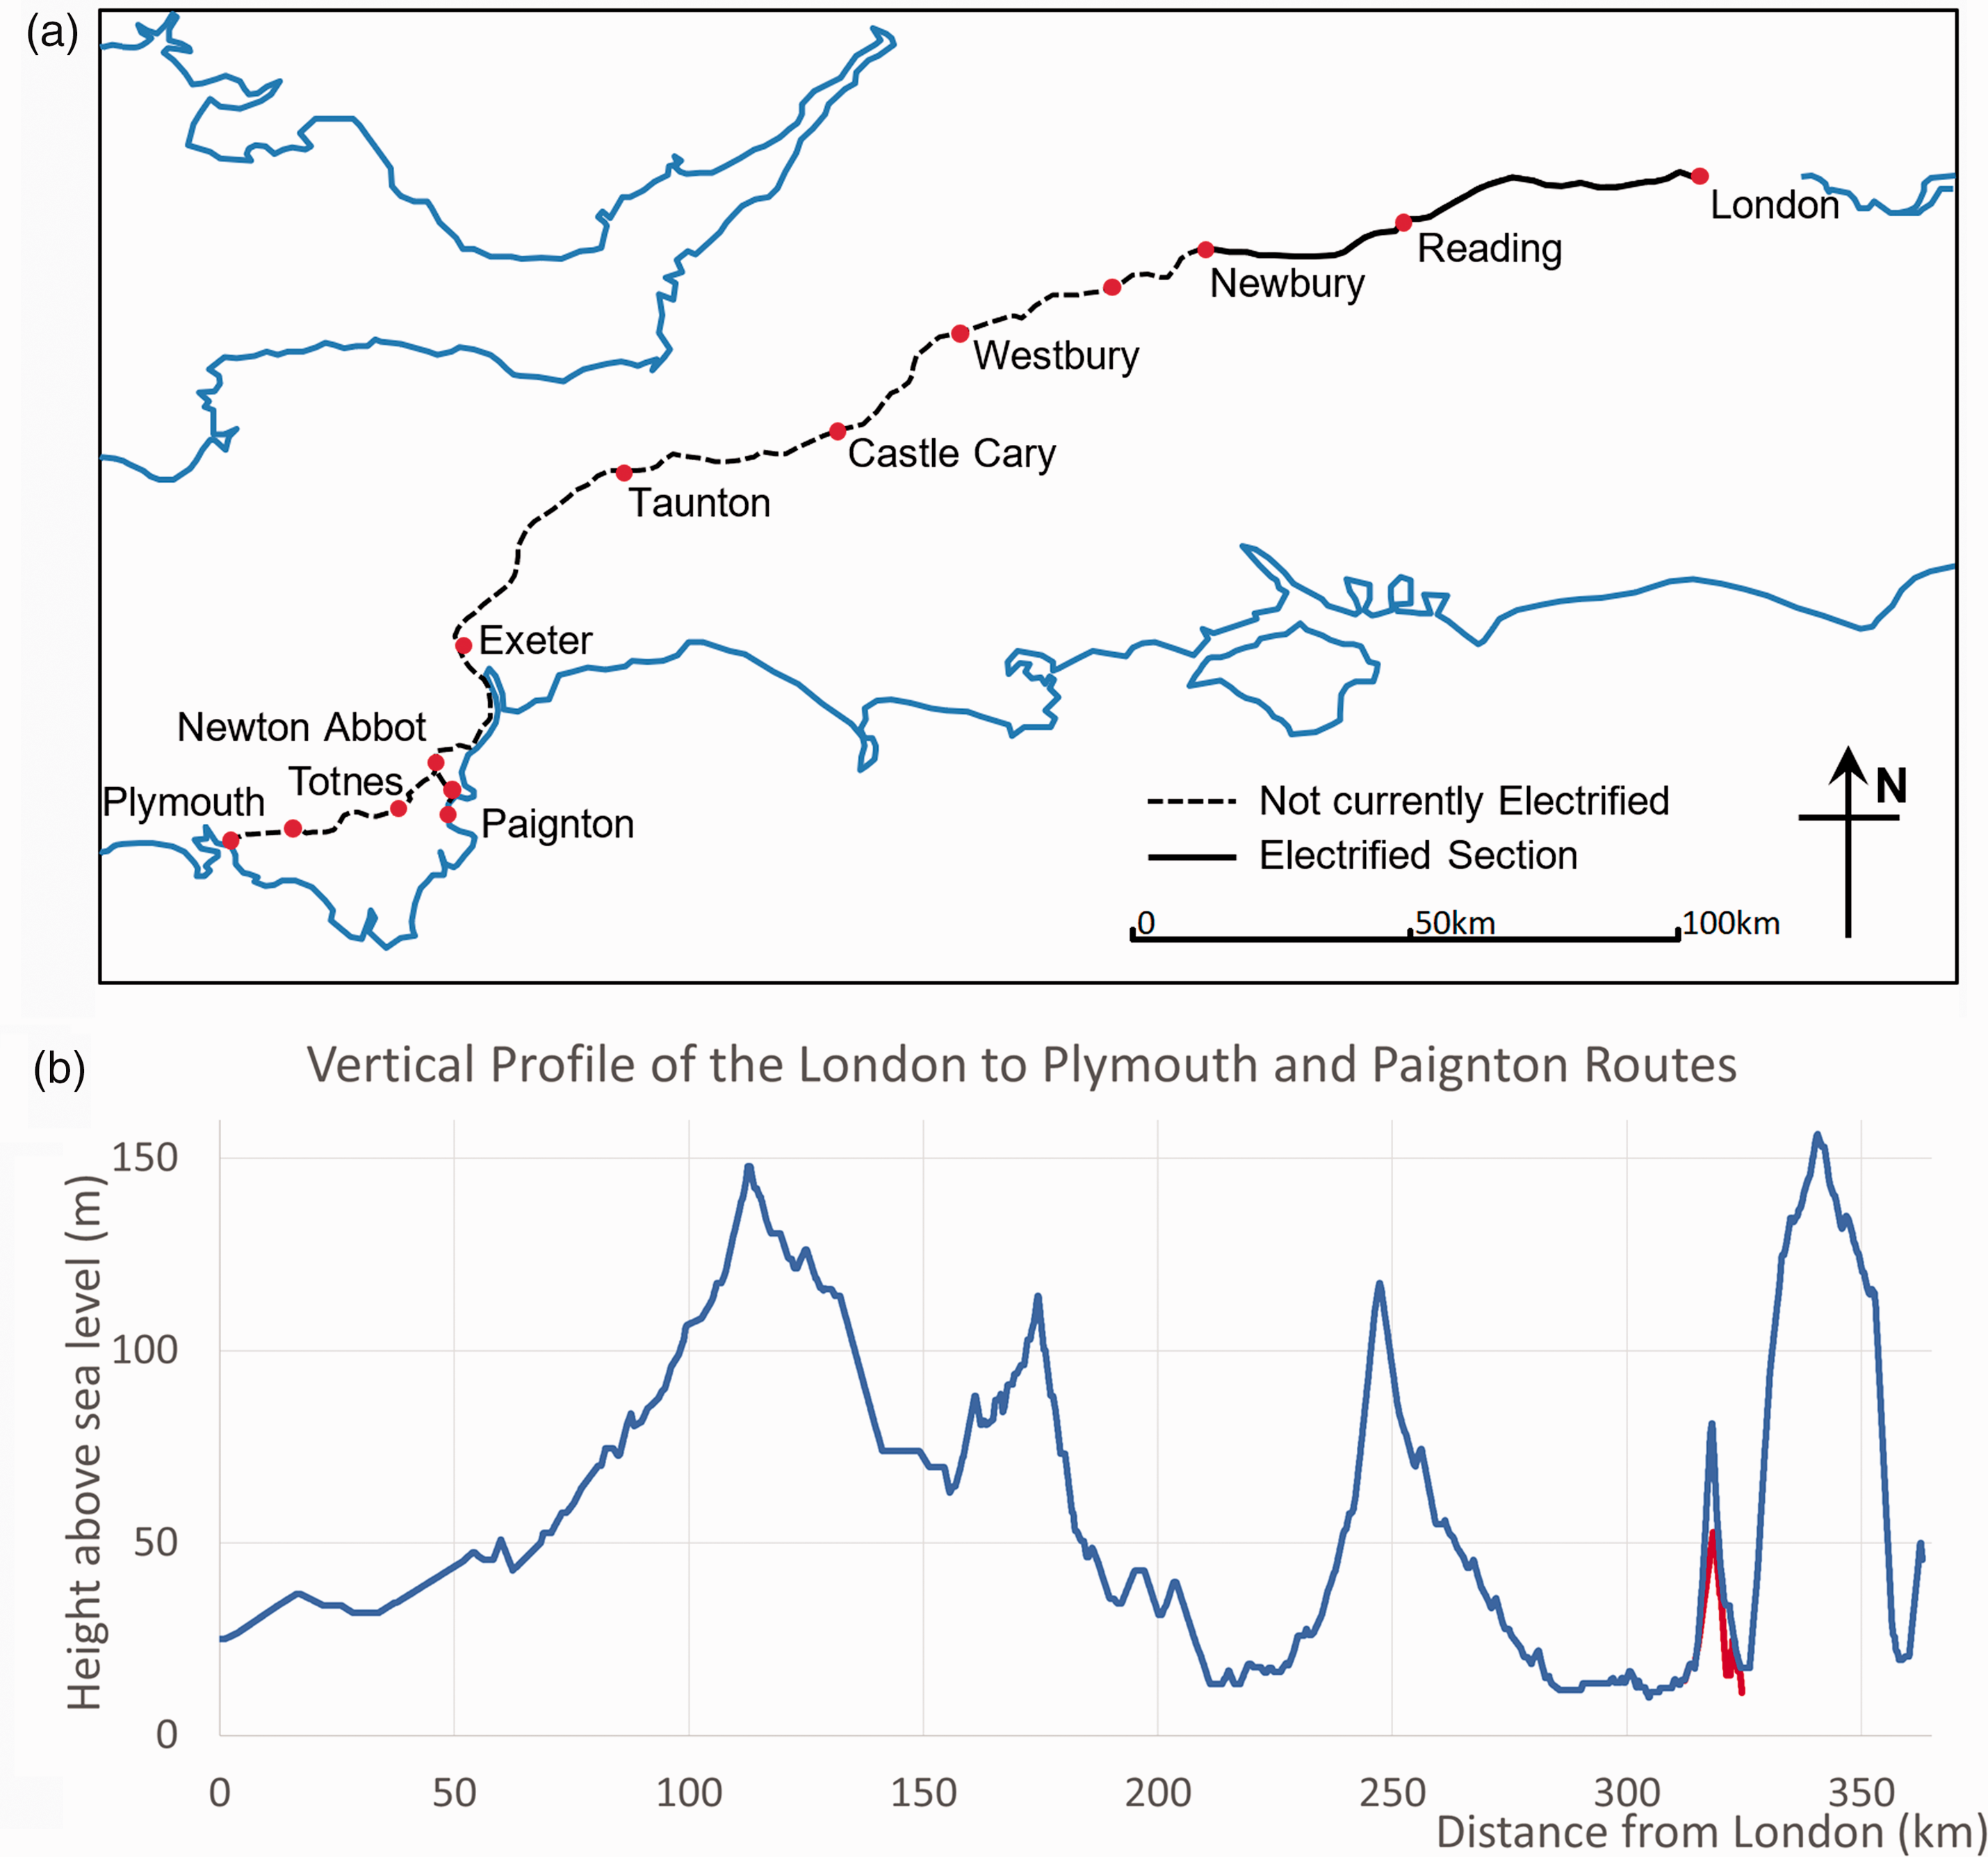
(a) London to Plymouth and Paignton route. (b) Vertical profile of the London to Plymouth and Paignton route (red line – branch to Paignton).
Trains run on electric power from the OLE between Paddington and Newbury and on diesel power west of Newbury. The trains operate at up to 125 mph between Paddington and Reading and up to 100 mph between Reading and Exeter. Beyond Exeter the maximum rated line speed is generally 60 mph, except for brief sections up to 100 mph.
Accelerations in 3 axes, rotational accelerations in 3 axes and Global Navigation Satellite System (GNSS) data were logged for the passenger journeys from London to Paignton and Plymouth. An inbuilt Kalman filter fused the data to determine the speed and position of the vehicle. 44
Validation results
The model developed above was run over the route from Paddington to Plymouth and compared to the measured data to validate the model. The speed of the model versus time is given in Figure 3(a) and versus distance in Figure 3(b). On both plots, the model result is given in blue, and the measured result is given in red. In Figure 3(b), the relevant speed limit is given by a dashed line.
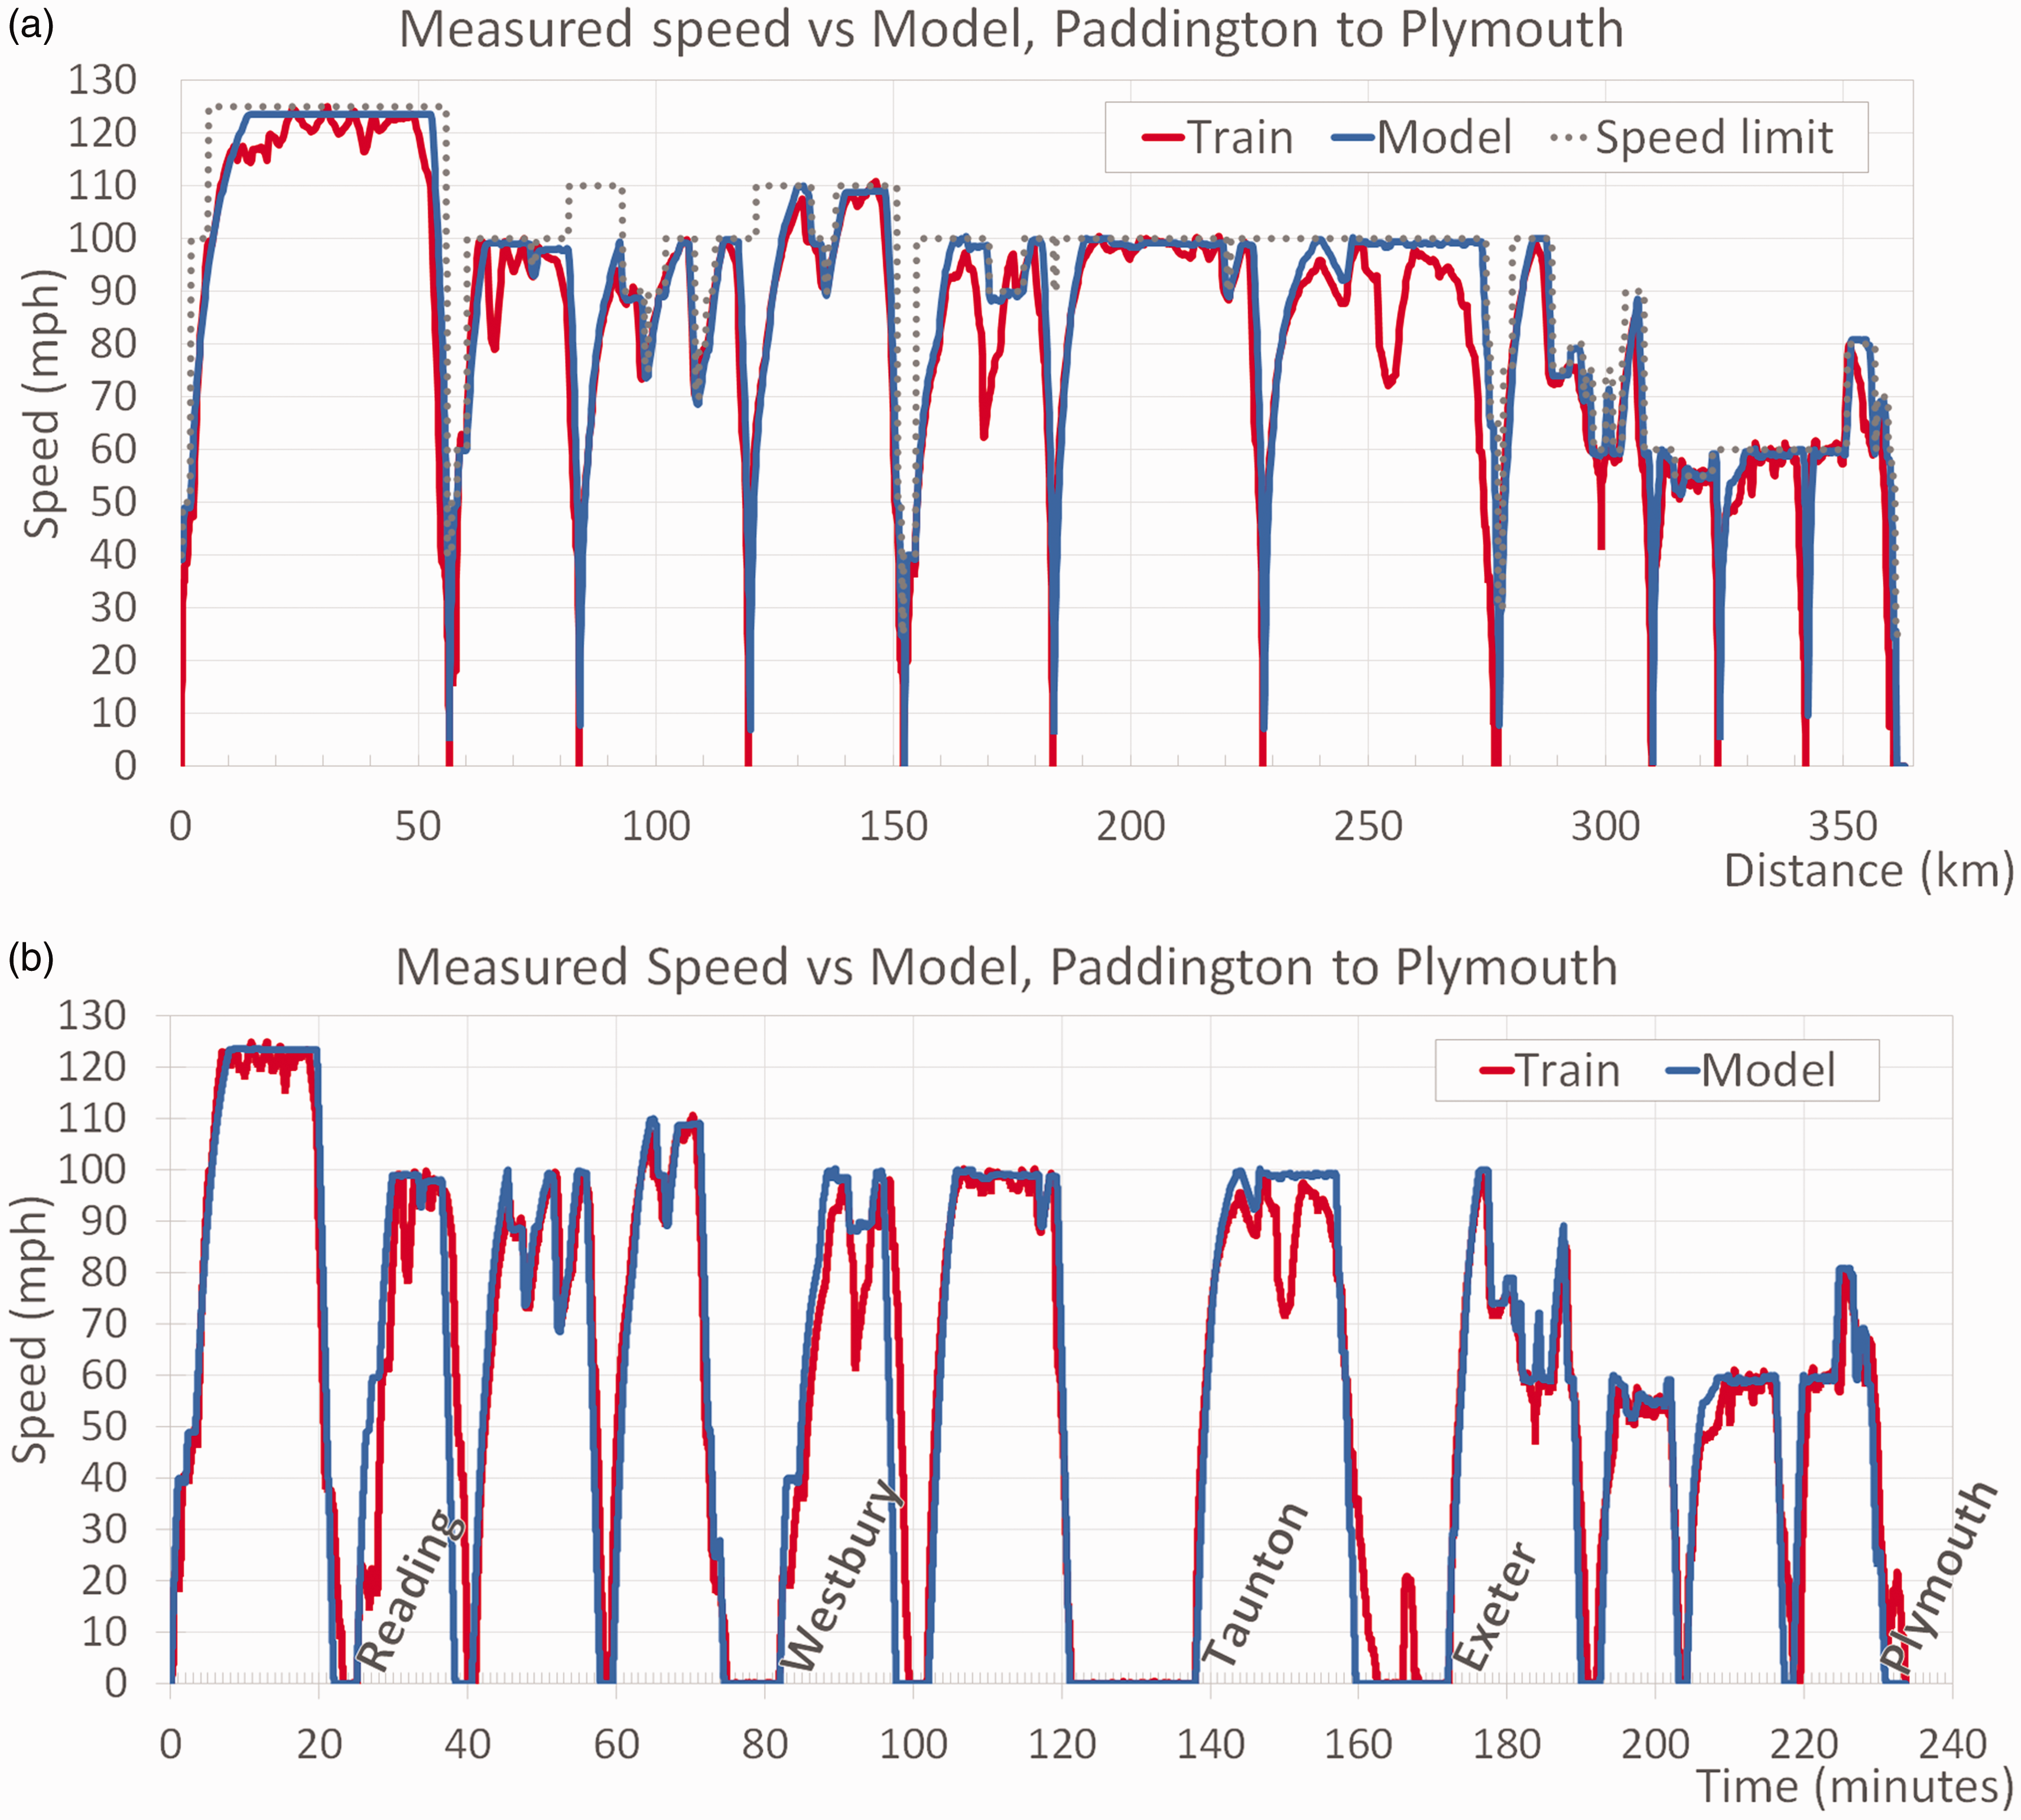
(a) Class 800 measured speed profile and modelled speed profile plotted against time London to Plymouth. (b) Class 800 measured speed profile and modelled speed profile plotted against distance London to Plymouth.
By observation, the model’s behaviour matches well with the behaviour of the real driver. Deceleration rates agree well during the earlier part of the deceleration into the stations. However, the real driver reduced the deceleration rate as the train approached the stations. The model shows less variation in the cruising speed than the train driver, meaning the model’s average cruising speed is somewhat higher than the measured train’s. This increased average speed results in the model arriving slightly earlier than the measured train at most stops.
The greatest exceptions are arrivals into Castle Cary, Exeter St. David’s and Plymouth. The model arrives earlier into Castle Cary as the measured train slowed significantly during the run from Westbury (85 to 95 minutes into the journey). On approach to Exeter St. David’s and Plymouth, the measured vehicle slowed more than necessary to enable a smooth run into the platform. It was assumed that these differences were caused by signal checks due to catching up with preceding trains. Also of note is that both the model and the train are equally late into Totnes.
Following the test runs, the estimated total fuel used by the train over the day was 2,208 litres, as measured by the train’s onboard vehicle management system which is known to have an accuracy of ±10%. This total fuel usage was used to calibrate the existing engine model in order to give a better correlation in term of with fuel usage from the test runs. (Note, the original engine model was under-powered as it was from a heavy goods vehicle rather than a diesel train.)
The results of running the model after this calibration are presented in the lower 4 rows of Table 3, showing the variation over the routes programmed into the model. Once the results have been normalised to litres per passenger kilometre, using a 40% passenger capacity, 37 the Class 80x trains show a significant improvement in fuel consumption over the previous generation of diesel-only trains.
Comparison of modelled fuel consumption to in-service train fuel consumption.
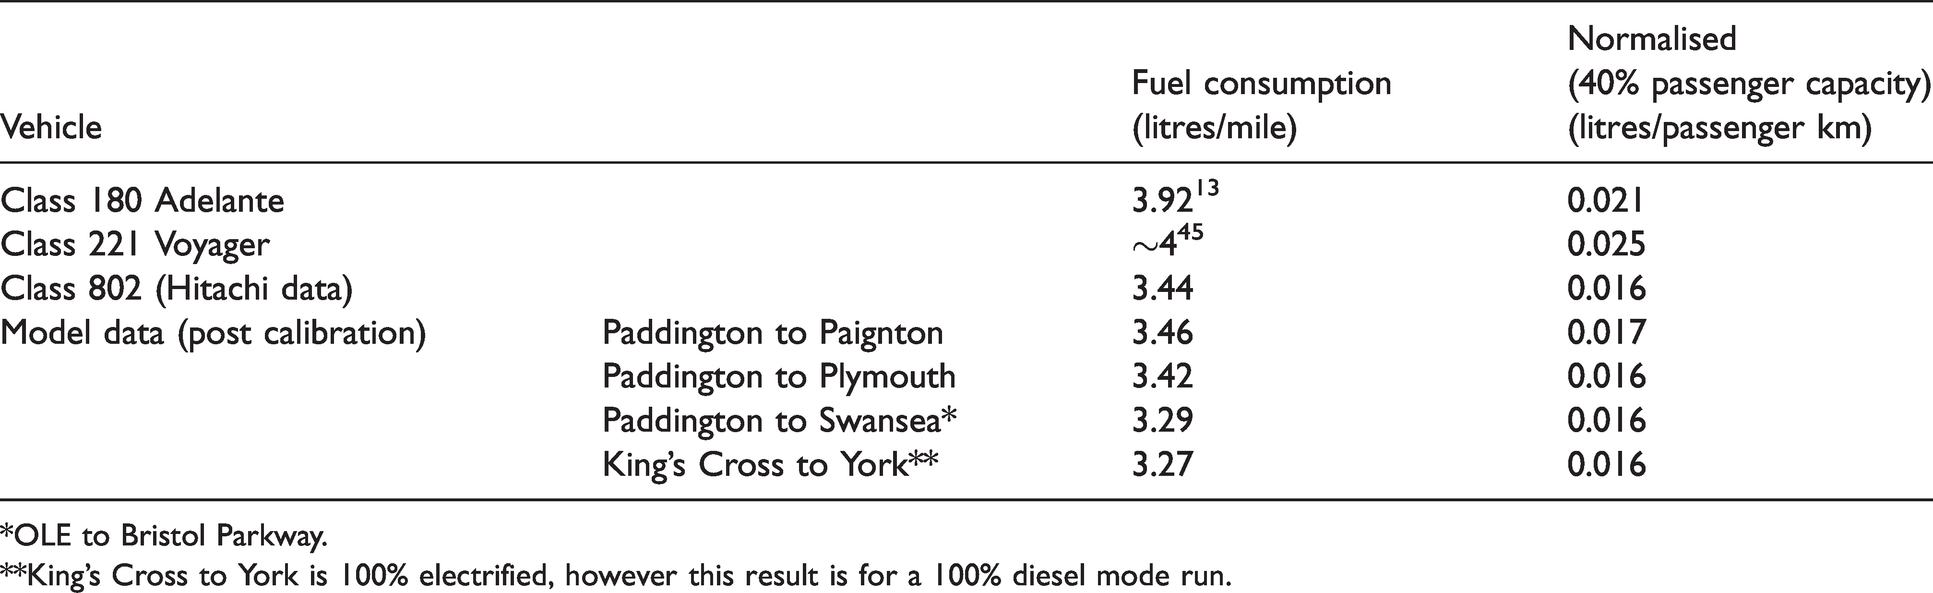
*OLE to Bristol Parkway.
**King’s Cross to York is 100% electrified, however this result is for a 100% diesel mode run.
The impact of electrification on carbon emissions
The validated model was then used to undertake an exploratory study looking at how CO2 emissions vary with the proportion of a route that is electrified. First, the effect of complete electrification of a range of routes on emissions was investigated. Then, the effect of continuous partial electrification was investigated. Finally, intermittent electrification was investigated and the effects this would have on the emissions from the routes were determined.
Full electrification
Total CO2 output was calculated using electric traction and diesel traction for the London to Plymouth and Paignton routes and for London to Swansea and York, and is given in Table 4. For routes out of Paddington, the electric-only figure is hypothetical as overhead line equipment is not currently installed along the complete route. The ‘current mix’ column refers to the mix of electric and diesel traction on the route as of 2019, i.e. electrification extends from Paddington to Bristol Parkway.
Comparison of CO2 output for electric and diesel traction over 3 different routes.
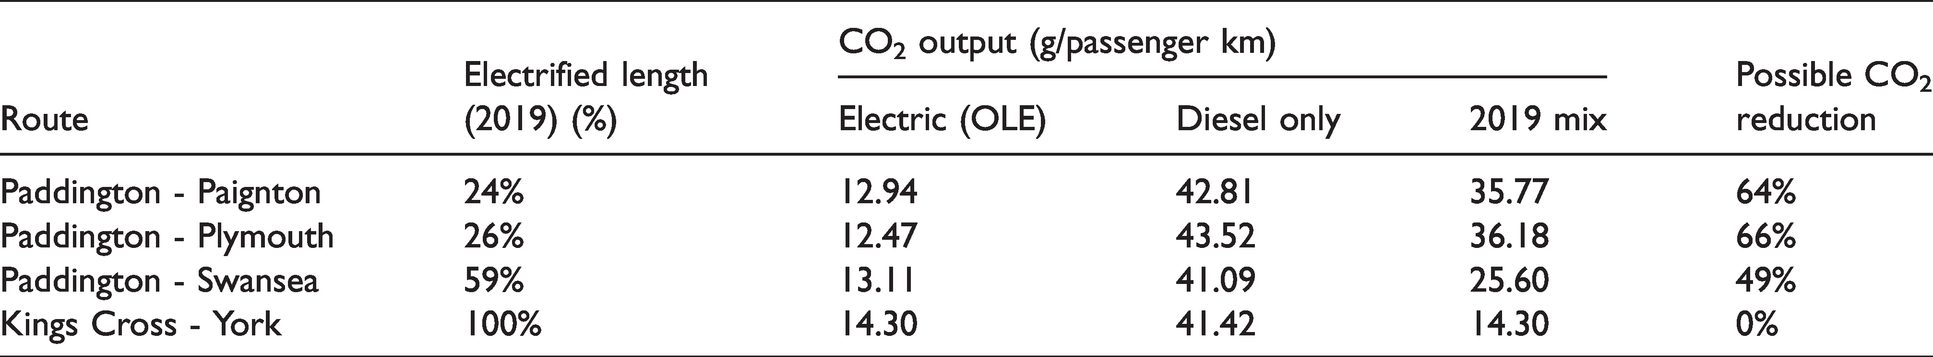
Table 4 shows that the CO2 emissions of these routes could be reduced by up to 66% based on the 2019 carbon grid mix. 43 The current part-electrification of the south-western routes contributes toward reducing the overall carbon intensity of the train operation. This also shows that electrification is an excellent way to quickly reduce the carbon intensity of passenger rail.
Partial electrification
Many routes on the UK rail network are part electrified. Bi-mode trains use the electrified sections where possible and use diesel power when away from OLE. Figure 4 shows how the CO2 emissions attributed to diesel and electric traction vary with the proportion of the route from Paddington to Plymouth that is electrified. The current extent of electrification on this route is to Newbury. The model estimates that this has reduced CO2 emissions by 17% when compared to using diesel traction for the complete route. Electrifying the route to Plymouth should reduce CO2 emissions by 66% over the current situation.
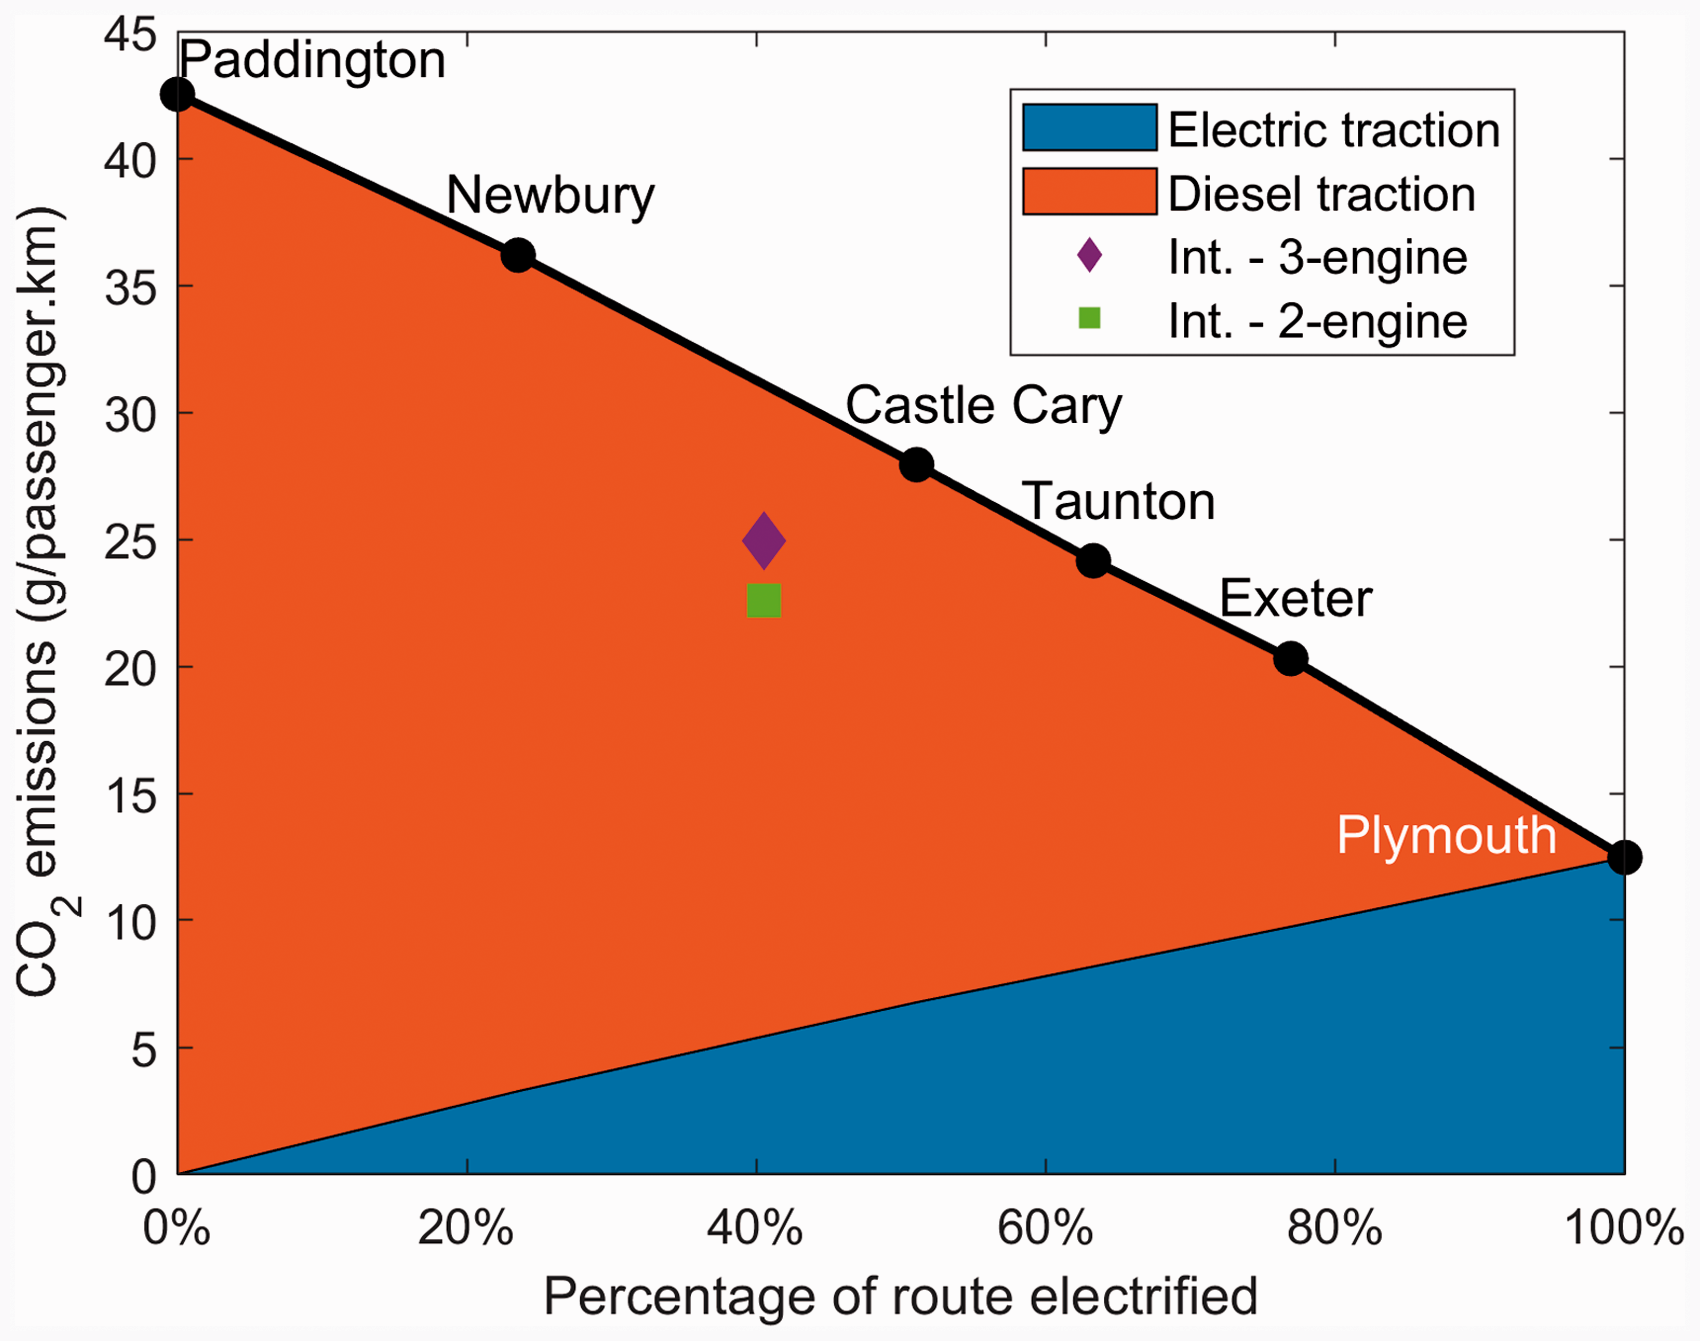
The effect of discrete electrification on carbon dioxide emissions. (Int. – Intermittent electrification of high-power sections.)
Intermittent (discontinuous) electrification
As opposed to partial electrification, which envisages a continuous electrified section along the route, intermittent electrification proposes electrifying separate sections of the route interleaved with unelectrified sections. The problem then becomes deciding on the parts of the route to be electrified.
The model was run over the Paddington-Plymouth route to determine where the highest power demands were. In general, these were departures from stations and steeper inclines. These sections of track, comprising 41% or the route, were then electrified in the model. When the model was run over this new intermittently electrified route, the carbon dioxide per passenger-kilometre was reduced by 31% when all three engines on the 5-car train were used, and 38% when only two engines were used. (See the later section on selective engine shutdown for more information about running with only two engine-generator sets.) These points are also plotted on Figure 4, for comparison against the continuous, partial electrification proposed above.
Figure 4 shows that on a per-electrified-kilometre basis, intermittent electrification would reduce carbon dioxide emissions by more than partial electrification. However, intermittent electrification poses several technical problems. One of these is the nature of the unelectrified sections. If they have OLE in place that is not electrified (so-called ‘neutral sections’), then the cost of erecting the OLE infrastructure remains the same as if it had all been electrified. On the other hand, if the OLE is only erected for the electrified sections, it is possible that more electricity substations would be required, increasing cost. This model gives a simple way make explicit the trade-off between electrified distance and CO2 emissions.
Controller development and CO2 minimisation
The purpose of this work was to develop a controller that reduced the CO2 emitted by the bi-mode rail vehicle model when compared to the existing vehicle model. The controllable sections of the model include the inverter, the controllable rectifier and the diesel engine-generator sets (see Figure 1).
Control parameters
The control parameters considered and tested in this work were (the top speed of the train was considered as a control variable. However, a more considered method was developed to reduce the train speed yet keep to the timetable. See the section on Predicted Arrival Time below): Current/torque demand rate limit – This limited the rate at which the driver could increase the demanded power during acceleration Control gain – This varied how vigorously the traction control system acts to follow the driver’s control input Throttle rate limit – This reduced the rapid opening and closing of the diesel engine throttle Generator power limit – This reduced the demand on the engine/generator as it approached full throttle. Velocity demand rising rate limit – This limited the acceleration rate of the train Target deceleration rate – This reduced the deceleration rate of the train into stations and before speed limits
The aim of adjusting these rates was to reduce the CO2 emitted by the train, without affecting the on-time performance over the route(s).
Each of the control parameters above was increased until the model ran late, that is, the mean arrival time of the model was positive (i.e. late), or the arrival time into Plymouth was later than scheduled. For each parameter, the value that gave the maximum CO2 reduction without making the model run late was chosen. The results of applying this optimal parameter to the model are given in Table 5.
Summary of the effect of control measures, including predicted arrival time speed adjustment and selective engine shutdown on fuel use, electricity use and CO2 emissions.
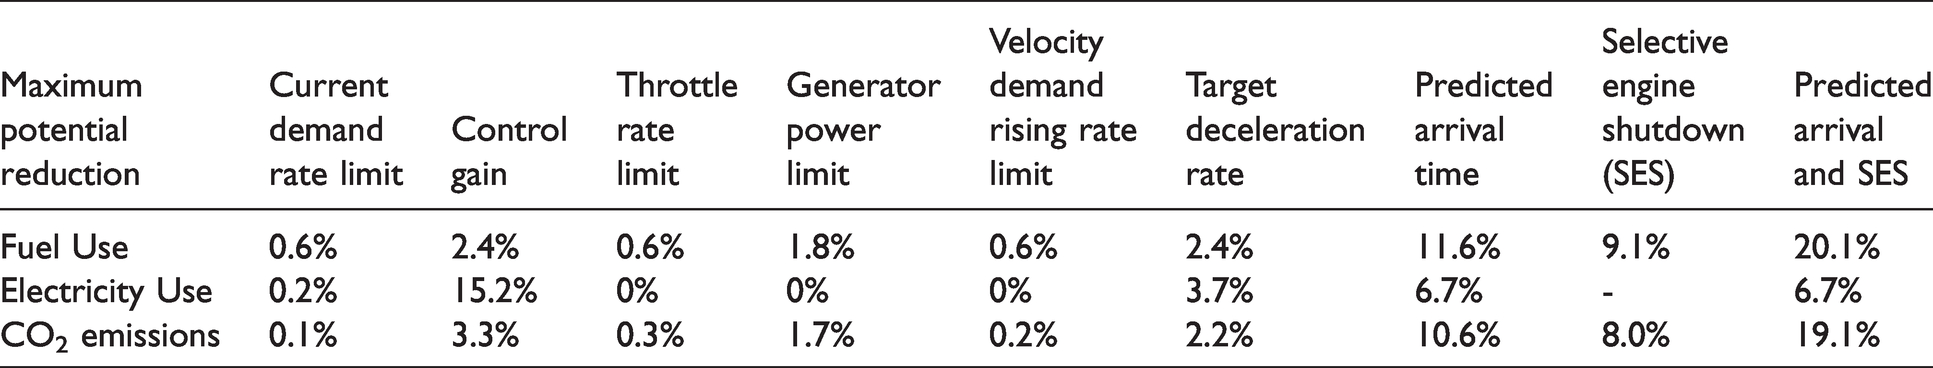
Table 5 shows that the control parameters can reduce CO2 emissions by up to 3.3%. The parameter with the greatest effect is the control gain, which reduces the electricity use by 15.2%, but has a more limited effect on fuel use (2.4%) and emissions (3.3%). The control gain limits the power output of the train. However, in diesel mode the power available to the traction motors is limited by the maximum power of the diesel engine-generator (see Table 1).
Predicted arrival time speed adjustment
If a train accelerates at maximum rate, maintains line speed and then decelerates at maximum rate, it will arrive early at the next station, as there is some slack built into the timetable to allow for recovery of the service following delay. It has been shown that phases of maximum acceleration, followed by constant speed, coast and maximum brake are the most energy-efficient way to travel between two points in a fixed time on non-steep track. 46 This is the basis for the next control intervention, a feedforward prediction of the arrival time into the station.
An algorithm was designed to predict the arrival time of the model at the next station. Predicted arrival time is constantly re-calculated by adding the time to reach the braking point for the next station, to the time to brake to a stop, based on the current speed. The predicted arrival time is then compared with the timetable and cruising speed is reduced if an early arrival is forecast.
The results of applying this algorithm to the Paddington to Plymouth route are given in Table 5. Reducing train speed to arrive at each station closer to the correct time has the potential to reduce CO2 emissions by 10.6%.
Selective engine shutdown
Class 80x trains have 3 diesel engines distributed along the length of each 5-car train. 32 Trains usually only require maximum power during acceleration, to overcome inertial forces, and when running at high speeds, to overcome aerodynamic drag. While cruising at lower speeds the train’s power demand is significantly lower.
Diesel engines are tuned to operate most efficiently at a given speed and power output. If, for example, the power required to maintain the cruising speed of the train is 2/3 of the maximum available power, then it is more efficient to generate that power by running 2 diesel engines at full power and shutting down the third engine (selective engine shutdown). This strategy is in use on at least 2 UK diesel train fleets; the Class 180 built by Alstom and the Class 185 from Siemens.13,47 Past research on selective engine shutdown for rail vehicles has focussed on high-level calculations rather than the detailed high-fidelity modelling of the vehicle’s fuel consumption and carbon dioxide emissions approach used here. 13
To implement selective engine shutdown in the model, an algorithm was developed to monitor the throttle position. Once the throttle position dropped below a threshold for a given time, one of the engines is shut down. The threshold and time are variables that can be altered to explore the range of potential emission reduction. The results for this intervention are given in Table 5.
Note that a decrease in fuel usage does not produce a decrease in CO2 emissions of the same proportion. This is due to the highly non-linear combustion process, in which other species (CO, NOx) are generated in varying proportions in tandem with CO2. 41
This simulation shows that selective engine shutdown has the potential to reduce fuel consumption by 9.1% and CO2 emissions by 8.0%. However, this must be offset against the potential engine and starter motor wear resulting from possibly several hundred start and stop cycles in any given day.
Comparison of selective engine shutdown and predicted arrival time modes
Figure 5 shows the speed-distance traces resulting from the two control methods – selective engine shutdown and predicted arrival time.
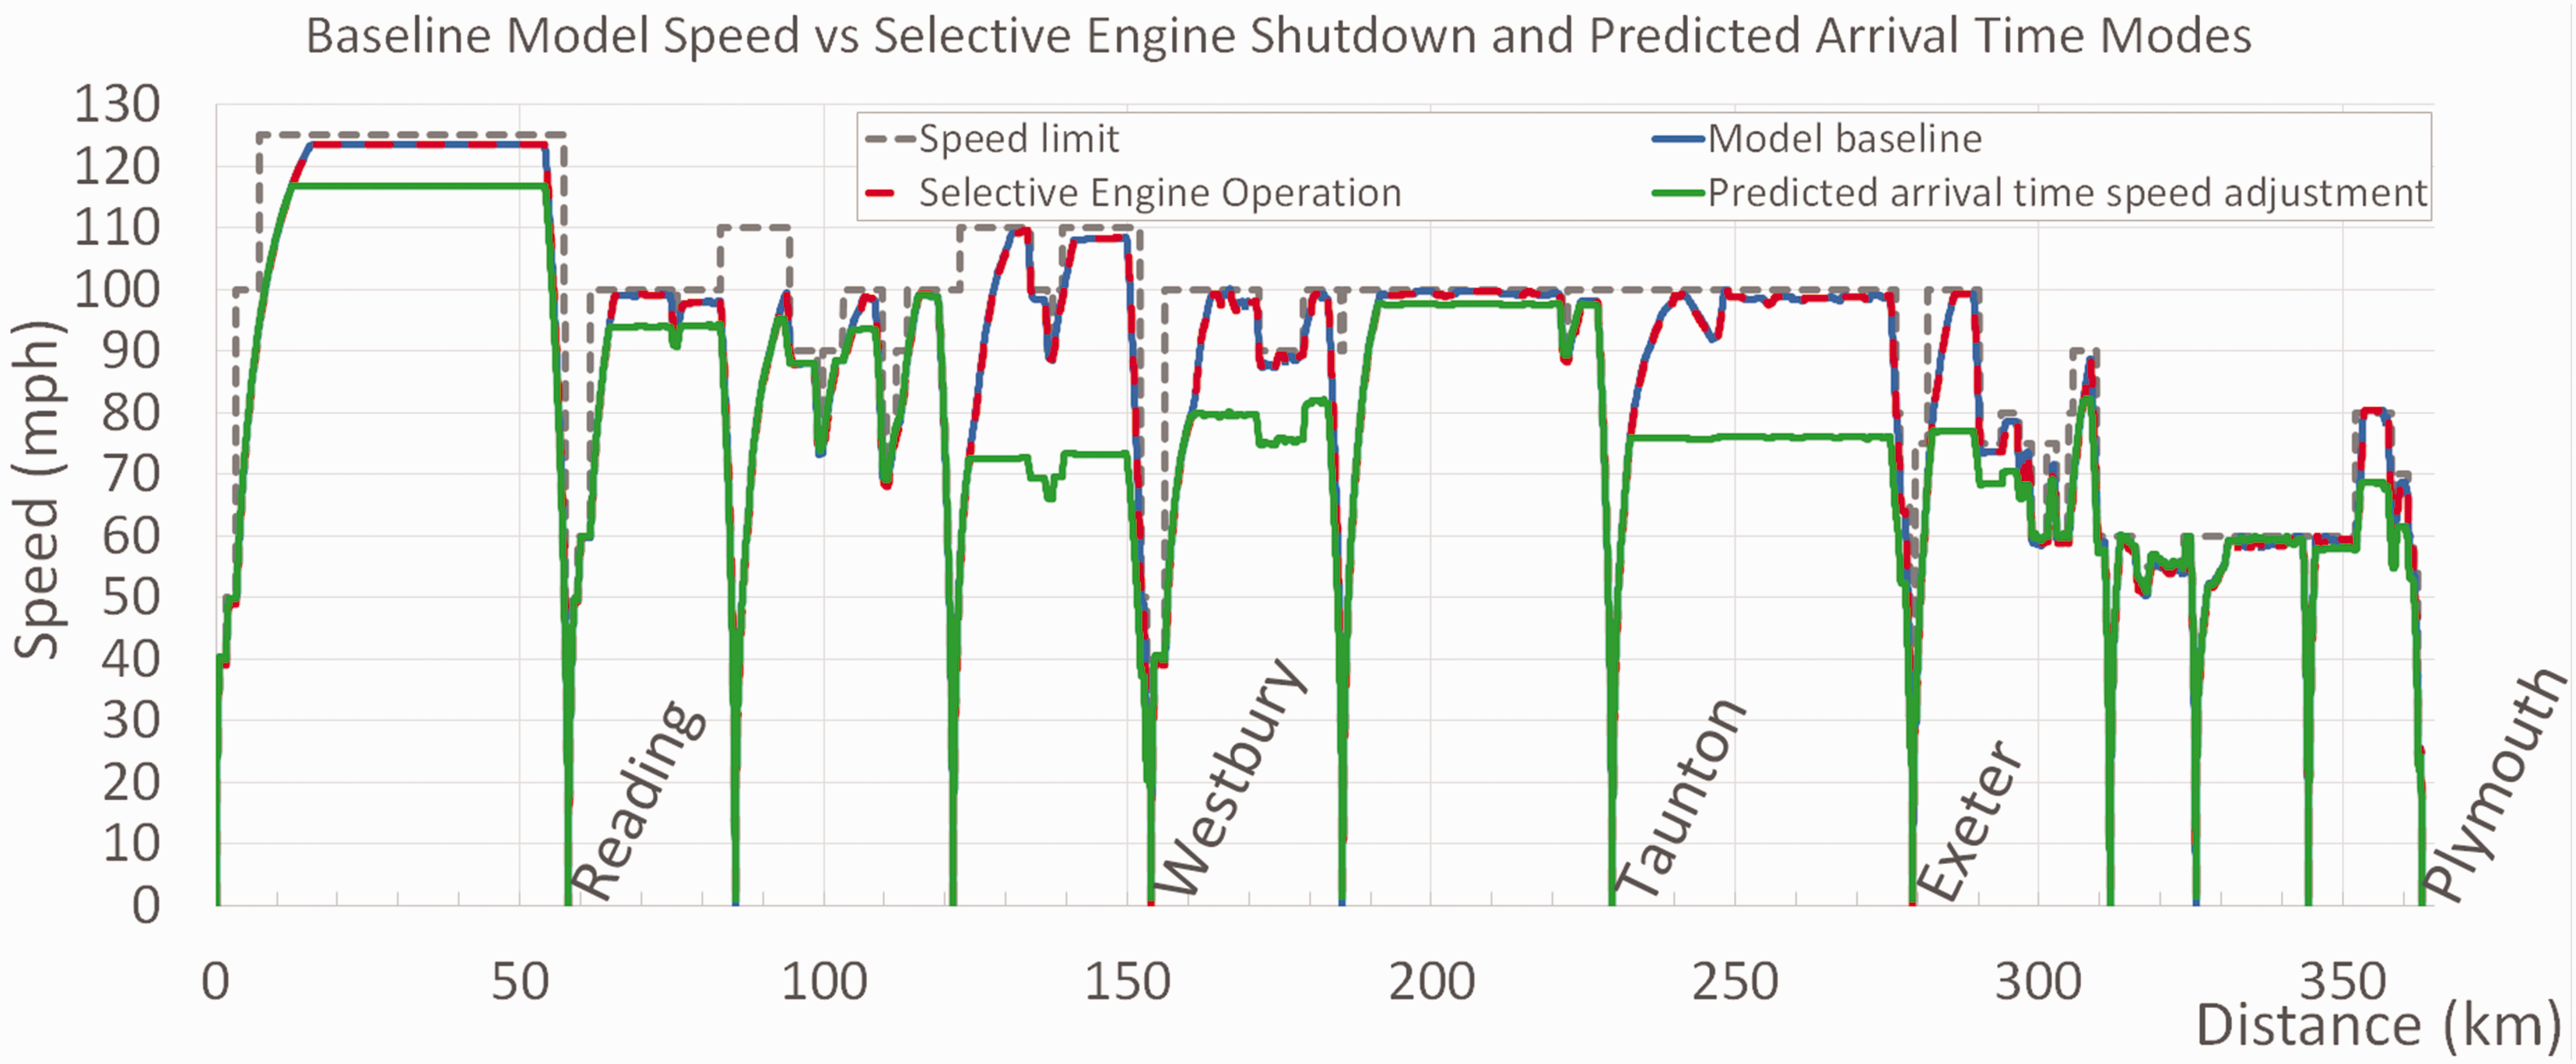
Effect of selective engine shutdown and speed adjustment for a right-time arrival on the speed vs time profile for a London to Plymouth journey.
Selective engine shutdown shows very little deviation from the model baseline. However, the predicted arrival time algorithm shows an obvious change in the speed profile: Top speed is reduced between the station pairs where there is slack in the timetable. Where slack is not present, the model runs closer to the maximum permitted speed. Timetabled arrival times are met in both cases.
Predicted arrival time speed adjustment and selective engine shutdown in combination
The combination of both the predicted arrival time speed adjustment and selective engine shutdown results in greater savings. However, it is not completely additive – the combination of both measures reduces CO2 emissions by more than the sum of the savings made individually as shown in Table 5. This is due to the interaction of the two interventions. If the train is running early, it can cruise at a speed lower than line speed. In this case, the power demand can be low enough to allow one of the diesel engines to be shut off, where that was not the case when trying to travel at line speed.
Conclusions
A model of a Class 800 train was successfully built in MATLAB/Simulink and was validated using data gathered from an in-service Class 800 train. The model is modular, and so can be easily expanded, for example to include the effects of energy storage, and it can be used to analyse any given rail route. This model was used to investigate and optimise possible control methods for reducing the carbon dioxide produced during operation.
The key conclusions of this work are: Significant CO2 reductions (up to 19.1%) are possible for high-speed trains if selective engine shutdown (turning off engines when they are not required) and adaptive speed limits (slowing the train down if it is running early) are used. Changes to lower-level control parameters such as torque rate limits and target deceleration rate can reduce CO2 emissions by up to 3.5%. Reductions to CO2 emissions can be made without changing the current timetable. The Class 802 uses 16 ml of diesel and produces 42g of CO2 per passenger kilometre of diesel operation. On electric power, this reduces to 13g of CO2 per passenger kilometre. Electrifying from Newbury to Plymouth would reduce the CO2 emissions of a journey on the Paddington-Plymouth route by 66%. Advanced control of bi-mode rail vehicles is a reasonable interim decarbonisation measure until full electrification of the UK’s railways is complete.
Future work for this project includes whole-life-cycle modelling of carbon-dioxide emissions, including those from vehicle manufacture and the construction of electrification infrastructure.
Footnotes
Acknowledgements
The authors wish to extend their thanks to the staff of the following organisations who have contributed to this study: RSSB, Hitachi Rail Europe, FirstGroup/GWR, Angel Trains and Chiltern Railways.
Declaration of Conflicting Interests
The author(s) declared no potential conflicts of interest with respect to the research, authorship, and/or publication of this article.
Funding
The author(s) disclosed receipt of the following financial support for the research, authorship, and/or publication of this article: The authors gratefully acknowledge the financial support provided by RSSB for the project Decarbonising High-Speed Bi-Mode Railway Vehicles through Optimal Power Control (COF-IPS-02).