
Abstract
Increasing traffic and speeds on passenger rail lines, and a short season for maintenance work, have motivated the industry to find new methods to assess the condition of existing infrastructure and determine where upgrades are required. In this study, acceleration data from the car body and axle boxes of a revenue car over 92 km of a Canadian passenger rail route in Ontario were collected for two purposes: first, to apply weighted filtering method according to ISO 2631-1997 standard as a technique to determine the locations which highly impact the ride quality and to investigate the effect of type of track features and speed on the ride quality; second, a new analytical method called the envelope of acceleration was applied to use the recorded accelerations to evaluate the alignment and surface roughness along the track. Since the alignment and surface roughness values are always positive and are calculated over a specified length (e.g. 9.5 m, 18.9 m, 38 m) an envelope technique was employed which uses spline interpolations over local maxima of the absolute magnitude of accelerations at every separated n samples corresponding to best fit with track roughness. The regression analysis between the envelope of accelerations and alignment and surface roughness presented a meaningful correlation and showed the applied method is a promising analytical technique to indicate rough sections of the track. The limitations to the application of envelope of acceleration are also discussed.
Keywords
Introduction
Increases in traffic and speeds on existing railways, a short season for maintenance work, and the construction of most Canadian railway infrastructure dating back to early 20th century call for new methods to evaluate the condition of rail infrastructure. New technologies and methods for track evaluation such as Portancemetre, 1 rolling stiffness measurement, 2 falling weight deflectometer (FWD), 3 , 4 and vertical track deflection (VTD) measurement5–11 have been developed to evaluate the track stiffness/modulus. However, in passenger rail transit, the level of vibrations felt by passengers due to dynamic interaction of the vehicle and track cannot be solely assessed by measurements of track stiffness. Previous research linking track parameters to vehicle vibrations have included a mixed filtering approach for track condition monitoring, 12 statistical correlation coefficient, 13 and the research conducted by Union Pacific Railroad (UP) which employed a Vehicle Track Interaction (VTI) monitoring framework with onboard accelerometers mounted on freight rail cars to measure vertical accelerations as the freight car travels over the track. 14
For passenger rail transit, ride quality and comfort are established indices used to assess the combined performance of the vehicle and track International standards ISO 2631-1: 1997 15 ; CEN, ENV 12299: 1999 16 ; UIC 513, 1995 17 ; JIS E4023, 1990, 18 as well as Sperling and Betzhold 19 give indications of passengers’ reactions to vibrations reported in public transport. This has been utilized, particularly in high-speed rail operations in Japan, 20 Europe, 21 and South Korea, 22 with a greater focus on vehicle dynamics, analysis of bridges, 23 , 24 soft subgrades, 25 track features using crowdsourced smartphone data, 26 , 27 or considering track geometry parameters and rolling stock dynamic properties. 28 , 29
Surface roughness and alignment roughness are important geometry parameters for assessing the quality of track geometry and safe operation of rail transit. 30 , 31 However, the measurements by heavy geometry inspection vehicle are usually limited to three times annually in the class 5 of track with highest allowable operating speed. 30 The Transportation Technology Center, Inc. (TTCI) developed NUCARS model that uses the Dallas Area Rapid Transit (DART) vehicle vibrations at different speeds to train the neural network to determine the correlation between ride quality and track geometry. 32 Sadeghi et al. also have incorporated the application of neural networks in evaluation of railway track quality condition. 33 Sadeghi et al. have investigated the effect of structural conditions on track roughness, 34 and developed a track geometry assessment technique that incorporates rail cant factor based on modelling of rail-wheel contact using ADAMS/Rail program, 35 as well as development of a train ride comfort (TRC) in railway slab tracks that has considered the slab track and rolling stock influencing parameters. 36 Other recent research has estimated the track geometry roughness of Shinkansen high-speed tracks using car-body motion 37 and in-service railway vehicles. 38
The first part of this paper applies a weighted filtering method as per ISO 2631-1997 standard to determine the locations where highly impact the ride quality, to investigate the influence of type of track features and speed on ride quality, and to assess the change of ride quality during the five months of study. The second part of the paper presents a method to evaluate rough sections of the track from unweighted acceleration datasets.
Materials and methods
Study area
Acceleration data were collected for a 92-km section of VIA Rail’s line in the Province of Ontario, Canada. This route covers three subdivisions, and ten passenger train trips are made over the line daily. The traffic passing the studied subdivisions is approximately 3.5 million gross tonnes (MGT) annually. The track consists of 52 kg/m (115-lb/yd) continuously welded rail on wooden ties supported by ballast. The terrain has a relatively level grade, and the tightest curves have radii of 245 and 452 m.
Collection of acceleration and track geometry data
The National Research Council Canada (NRC) Automotive and Surface Transportation (AST) Research Centre in collaboration with VIA Rail Canada Inc. instrumented a VIA Rail passenger coach car with 27 accelerometers. The layout of instrumentation and the location of accelerometers are illustrated in Figure 1(a): seven accelerometers on the underbody of the car (three at A-end and four on B-end; Figure 1(a) and (b)), five distributed across two bogies, and three on each of four axle boxes (Figure 1(a) and (c)). Three accelerometers are installed as a tri-axial block on the B-end of the floor of electrical room. The instrumented car was operated in a revenue service and data was collected between February and August of 2018. Same instrumented rail car was used within a train with a consistent consist for all runs of data collection. The instrumentations were identical for the studied runs. The speeds are kept quite consistent and on schedule as reasonably achievable on an in-service passenger train.
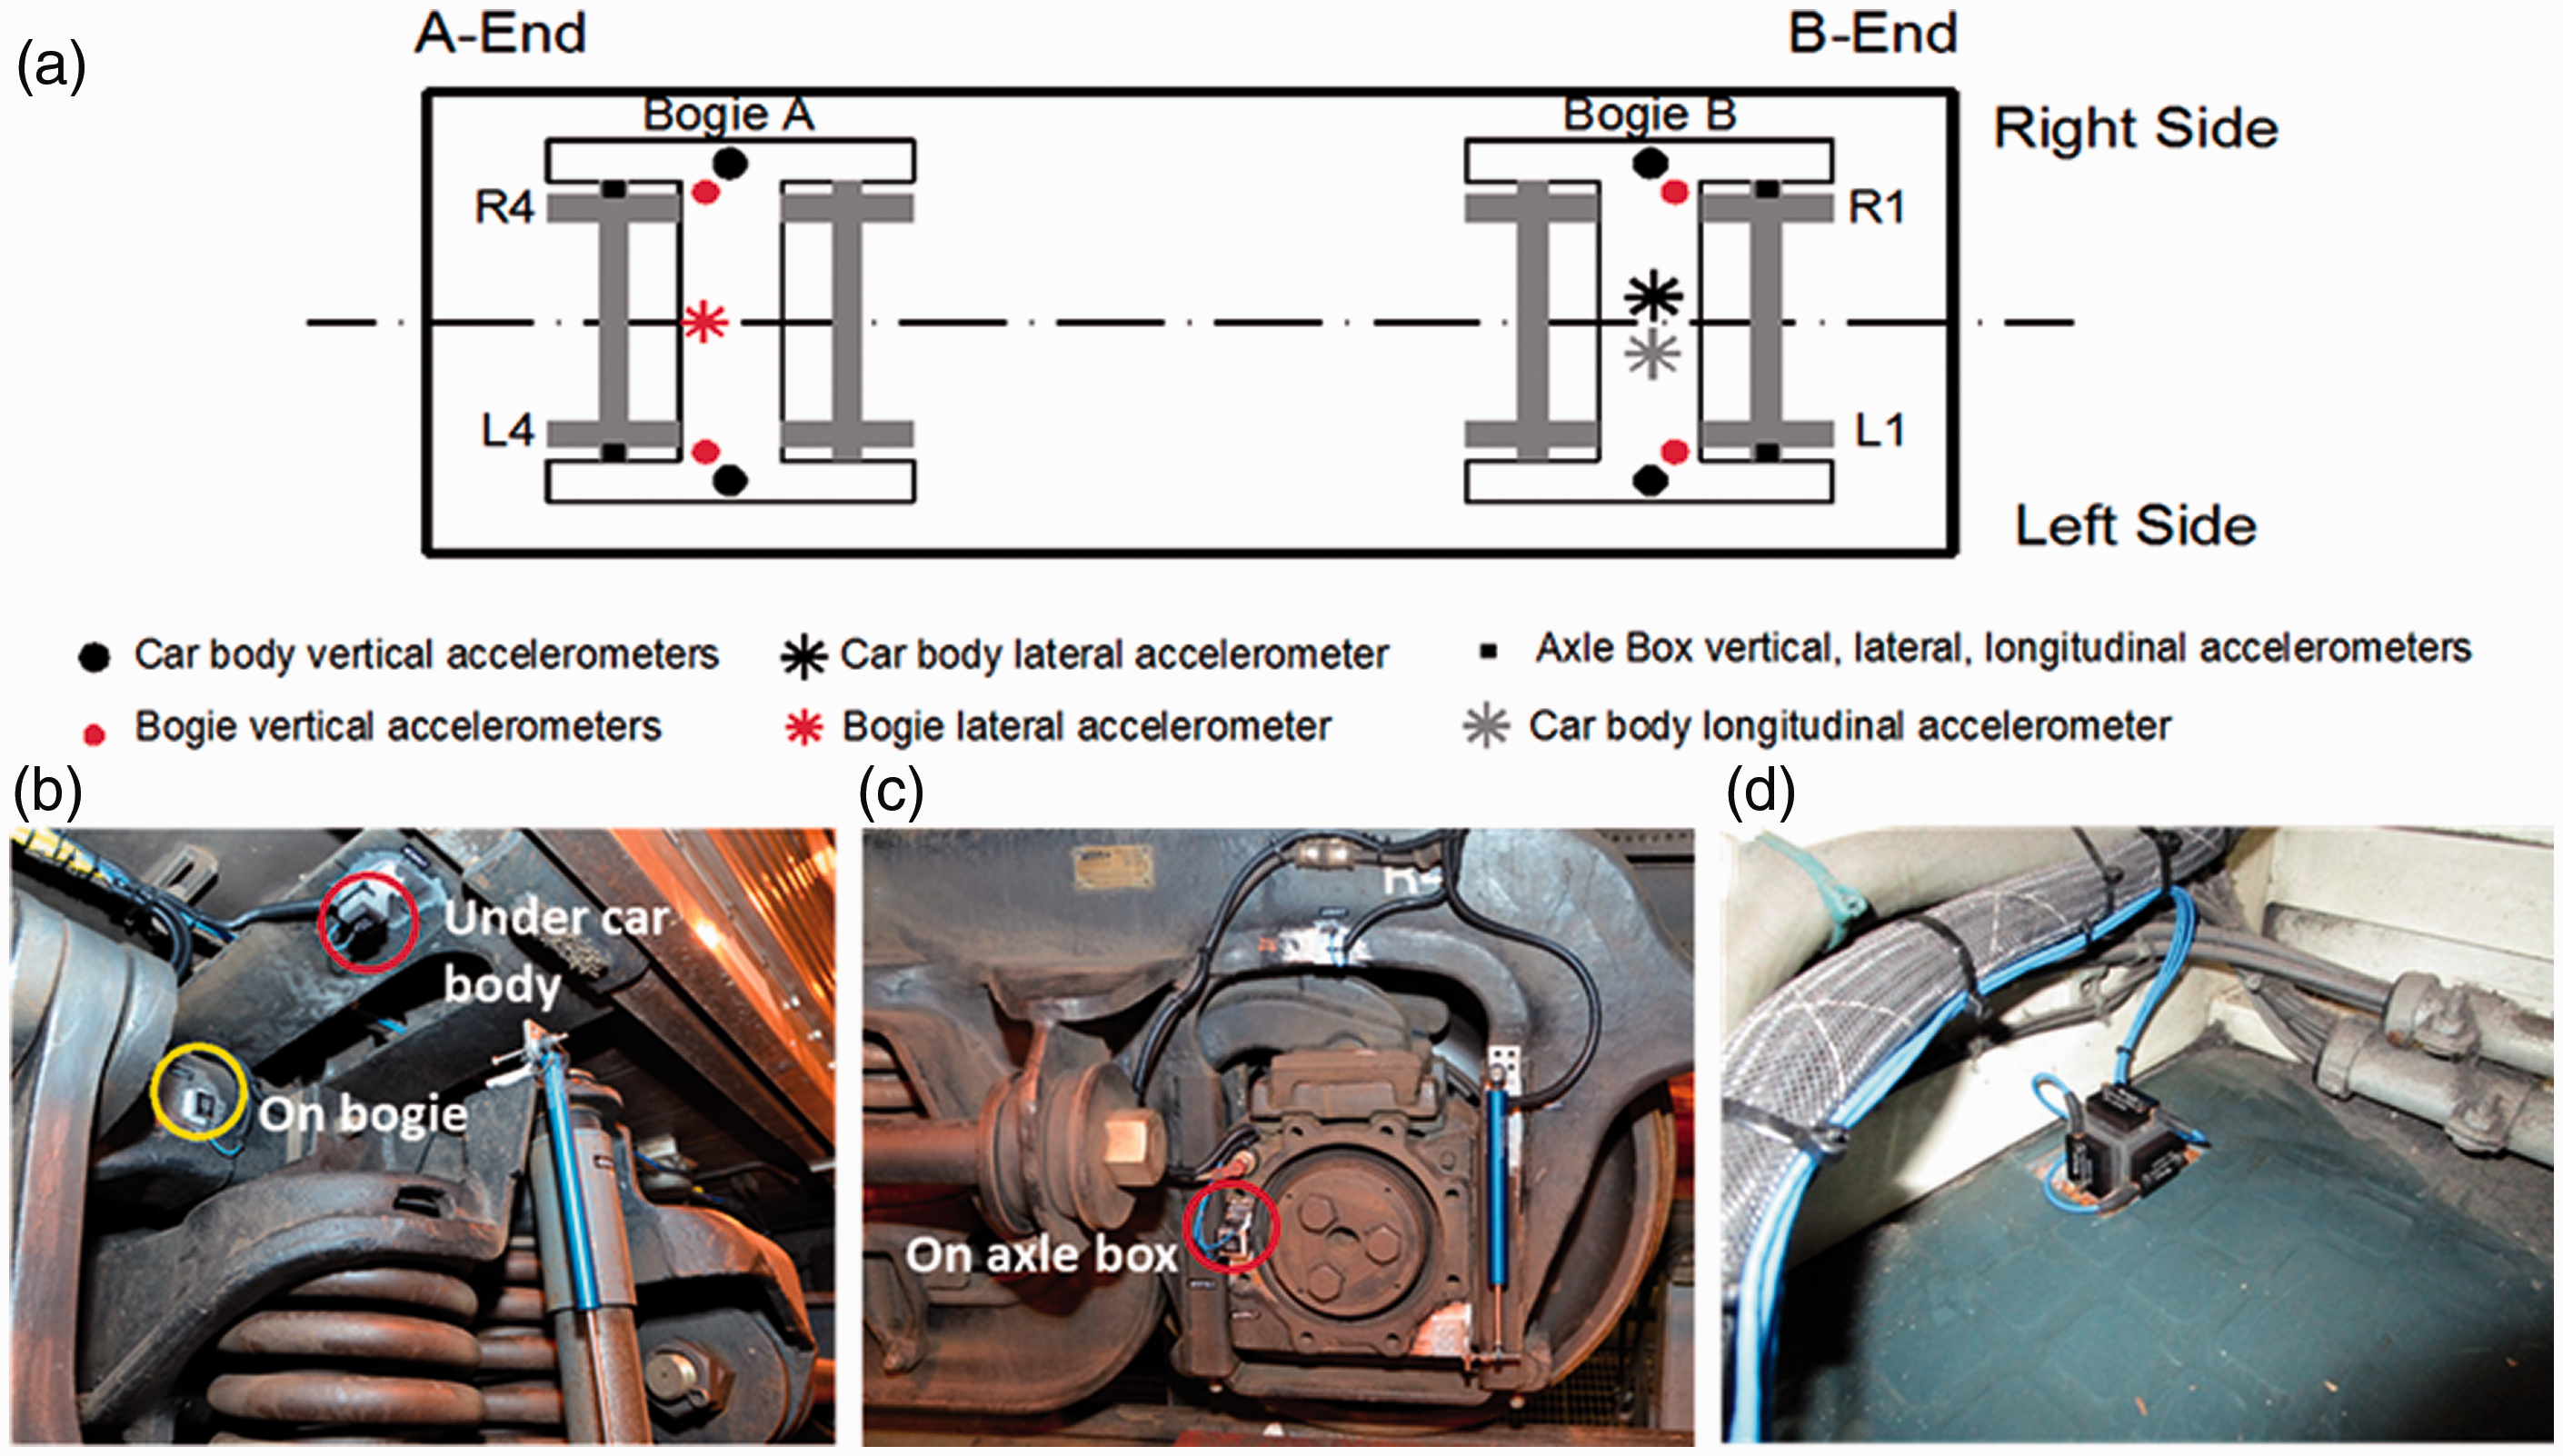
The location of sensors mounted on a) the layout of instrumentation b) the underbody of the car and the bogie and c) the axle box d) electrical room floor accelerometers (Images by authors.).
All accelerometers were high sensitivity DC MEMS-type instruments manufactured by PCB Piezotronics (Depew, NY). The car body vertical accelerometers (model 3741B1210G) had a range of ±10 g, 135 mV/g sensitivity and 0.35 mg broadband resolution (rms); lateral and longitudinal accelerometers (model 3741B1250G) had a range of ±50 g, 27 mV/g sensitivity and 1.50 mg broadband resolution (rms) and the axle box vertical accelerometers (model 3741B12100G) had a range of ±100 g, 13.5 mV/g sensitivity and 3.5 mg broadband resolution (rms). Similar studies by Sussmann (2007) and Ketchum and Wilson (2012) show that the sensitivity, measurement range and resolution of the mounted accelerometers are satisfactory for the ride quality and roughness study.
A comparison of data showed a difference less than 5% between the variation of acceleration data at A and B ends of the car body. Thus, only the accelerations of the B-end were selected for calculating the ride quality along the studied track. Acceleration data measured on July 18, 2018 was compared to track roughness measured on July 15, 2018 as the dates are very close.
Methods of analyses
Calculating track ride quality index
To indicate the locations where need upgrades for improving passengers’ ride quality experience, first, vibration contents related to ride quality were determined by frequency weightings:
15

In equation (1),
Second, according to ISO 2631-1 15 the crest factor is calculated as the modulus of the ratio of the maximum instantaneous peak value of aw to its ai value for the three studied subdivisions. Since the value of crest factors are below 9 for all three subdivisions, the evaluation of ride quality is followed based on basic evaluation method using equations (1) and (2).
Third, the vibration total value of weighted RMS, determined from vibration in orthogonal coordinates is calculated as follows:
15

The vibration total value,
The ISO standard’s classification for RQI is as follows: a) RQI< 0.315, Not uncomfortable; b) 0.315 ≤ RQI < 0.63, A little uncomfortable; c) 0.5 ≤ RQI< 1, Fairly uncomfortable; d) 0.8 ≤ RQI < 1.6, Uncomfortable; e) 1.25 ≤ RQI < 2.5, Very uncomfortable; and f) RQI ≥ 2, Extremely uncomfortable. Note there is not a sharp boundary between the “a little uncomfortable” and “fairly uncomfortable” as per ISO 2631-1: 1997. However, “a little uncomfortable” and “fairly uncomfortable” in this paper refer to RQI value between 0.315 and 0.5 m/s2 and RQI value greater than 0.5 m/s2, respectively.
Calculating track roughness
Track roughness (TR) along the track was calculated every 38 m (124 ft) separately in terms of surface and alignment roughness. TR is the standard deviation of n individual geometry measurements di (surface or alignment) with a mean value of

Employing the envelope of acceleration
Since the alignment and surface roughness values are always positive and were calculated over a specified length (e.g. 38 m) the absolute values of raw unweighted accelerations are calculated first. Then, an envelope technique was employed which uses spline interpolations over local maxima of absolute magnitude of accelerations at every separated n samples corresponding to best fit with TR calculated at every 38 m. This analysis was carried out with Peak Envelopes using MATLAB R2020a. 41 Separated 4000 and 40000 samples for car body and axle box accelerations, respectively found to best fit the TR graphs while decreasing the effect of high frequency unrelated peaks such as rail joints (350–500 and 1000–1200 Hz 42 ) or rail corrugations (420–1400 Hz 43 ) and resulting in the same wavelength as TR. Figure 2 shows the absolute values of the axle box accelerations and the envelope fit at every 40000-sample intervals. Matching of acceleration and geometry data was carried out by correcting GPS coordinates of the track inspection vehicle in respect to the location of recorded accelerations, accounting for their phase shift and distance lags using a differential correction method 44 in which the GPS coordinates of the Ottawa railway station was used as a base station. The GPS coordinates of both accelerations and geometry recordings are corrected first in respect to the GPS coordinates of the Ottawa railway station as a “base station” to correct for GPS errors that happens particularly for mobile GPS receivers as a result of GPS signals reflections from roads, buildings and trees, atmosphere and orbit eccentricities. 44 However, the corrected positions might not be perfectly accurate.44,45 In the second step, the distance shifts between the two types of recordings are calculated based on the GPS position of Ottawa railway station, the two middle stations and the location of the curves.
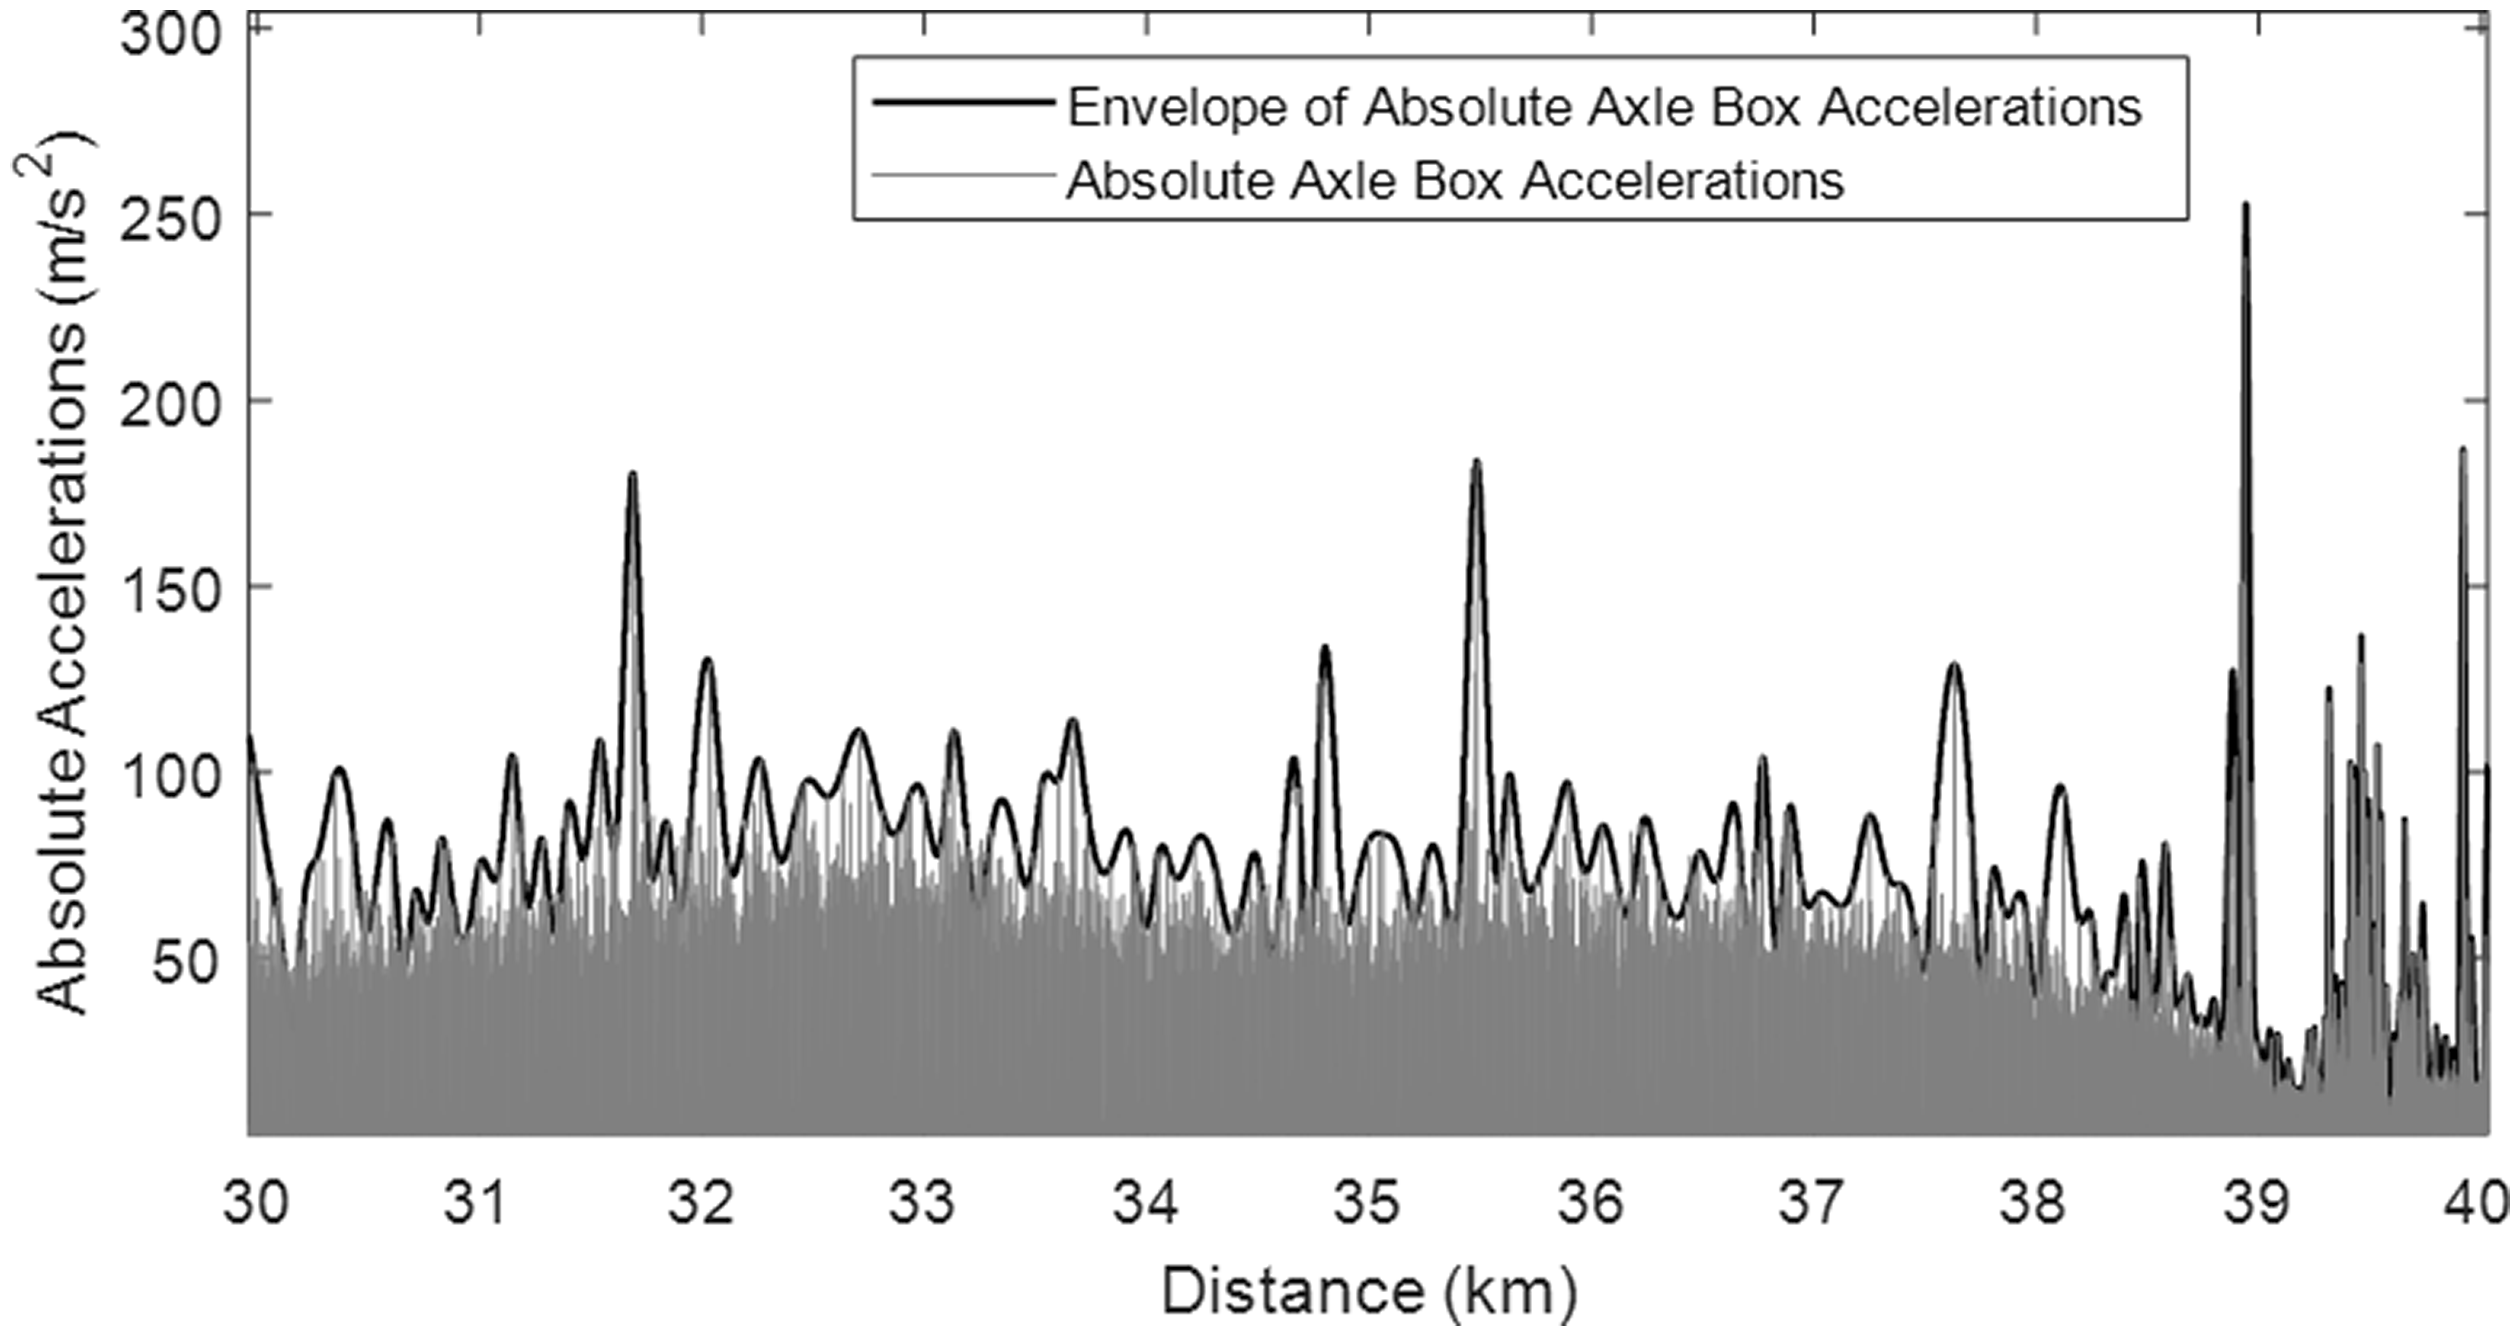
Comparison between the absolute values of axle box accelerations and the envelope of accelerations.
The correlation between the TR and envelope of accelerations was investigated by performing a regression analysis between surface roughness and vertical acceleration, and between alignment roughness and lateral acceleration.
Results
Figure 3(a) is a plot of the original vertical, lateral and longitudinal acceleration data recorded by B-end car body ±10 g (left side) and ±50 g (centerline) accelerometers, respectively, as well as the train speed during the collection of data on July 18, 2018. The data show the train predominantly operated at speeds greater than 100 km/h. The stops at two intermediate stations are identified from very slow speed and acceleration values in Figure 3(a). Figure 3(b) presents the track surface and alignment and corresponding curvature of the track recorded on July 15, 2018 by the track geometry car.
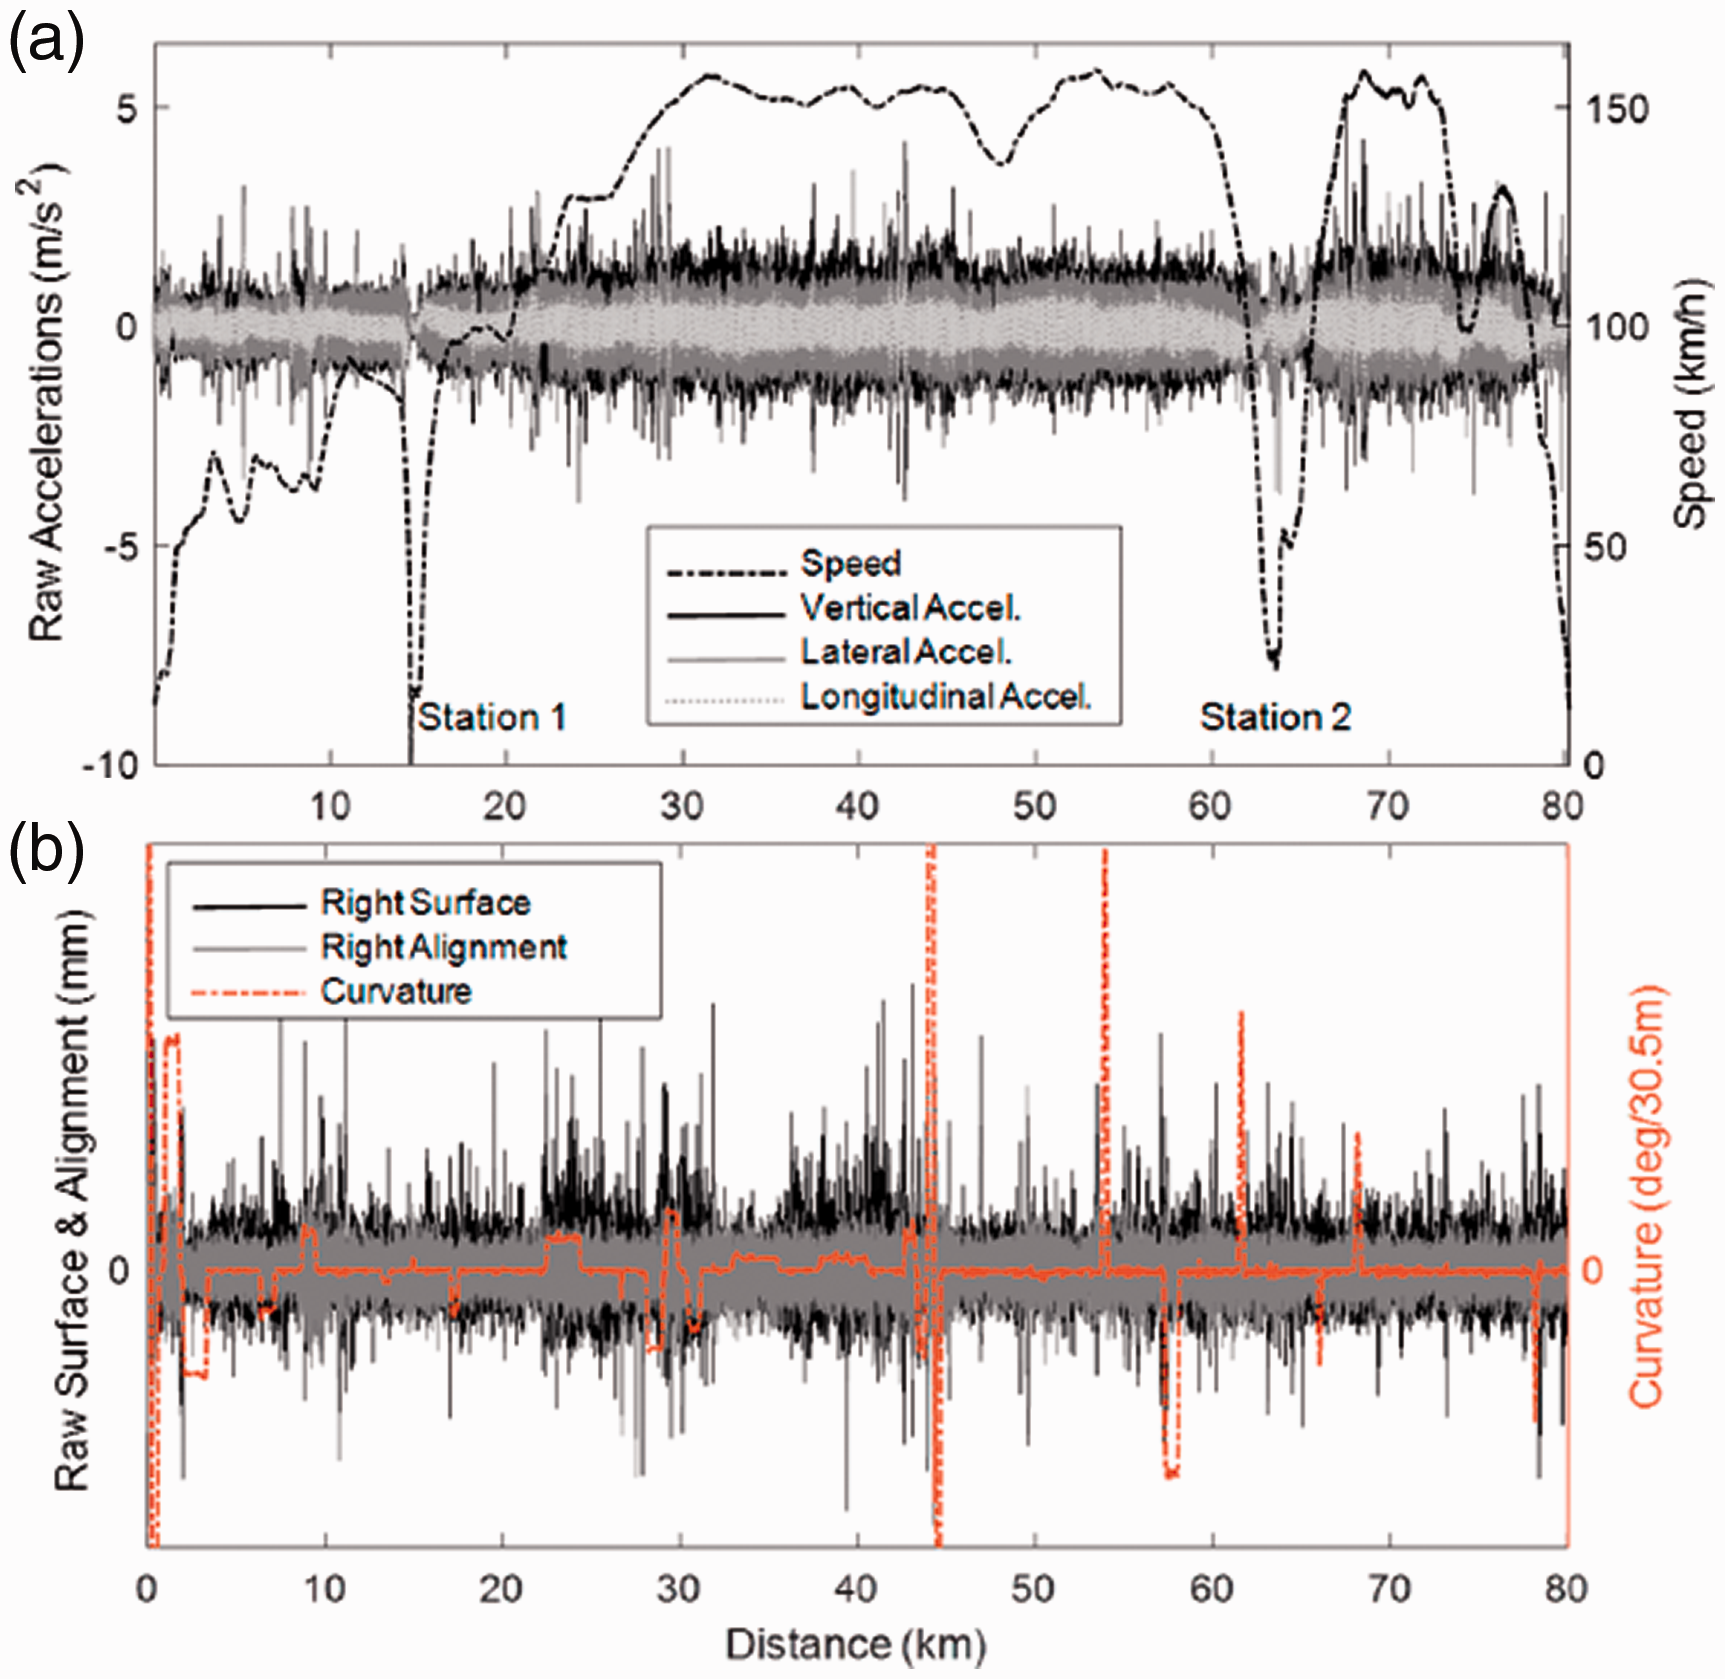
a) Example of raw acceleration data with corresponding train speed and, b) the corresponding track right surface and alignment and degree of curvature recorded along the track.
Accelerations for the evaluation of ride quality
Effect of track features on RQI
To determine the locations which may require upgrade to improve the ride quality, the ride quality was evaluated according to ISO 2631-1:1997 and the calculation of RQI using equation (2). Figure 4(a) presents the variation of RQI and the train speed along two subdivisions between distances 24 and 73 km. It was found that the peak values of RQI in Figure 4(a) correspond to major notable features, such as grade crossings, bridges, switches, and culverts result in uncomfortable vibrations along the track.
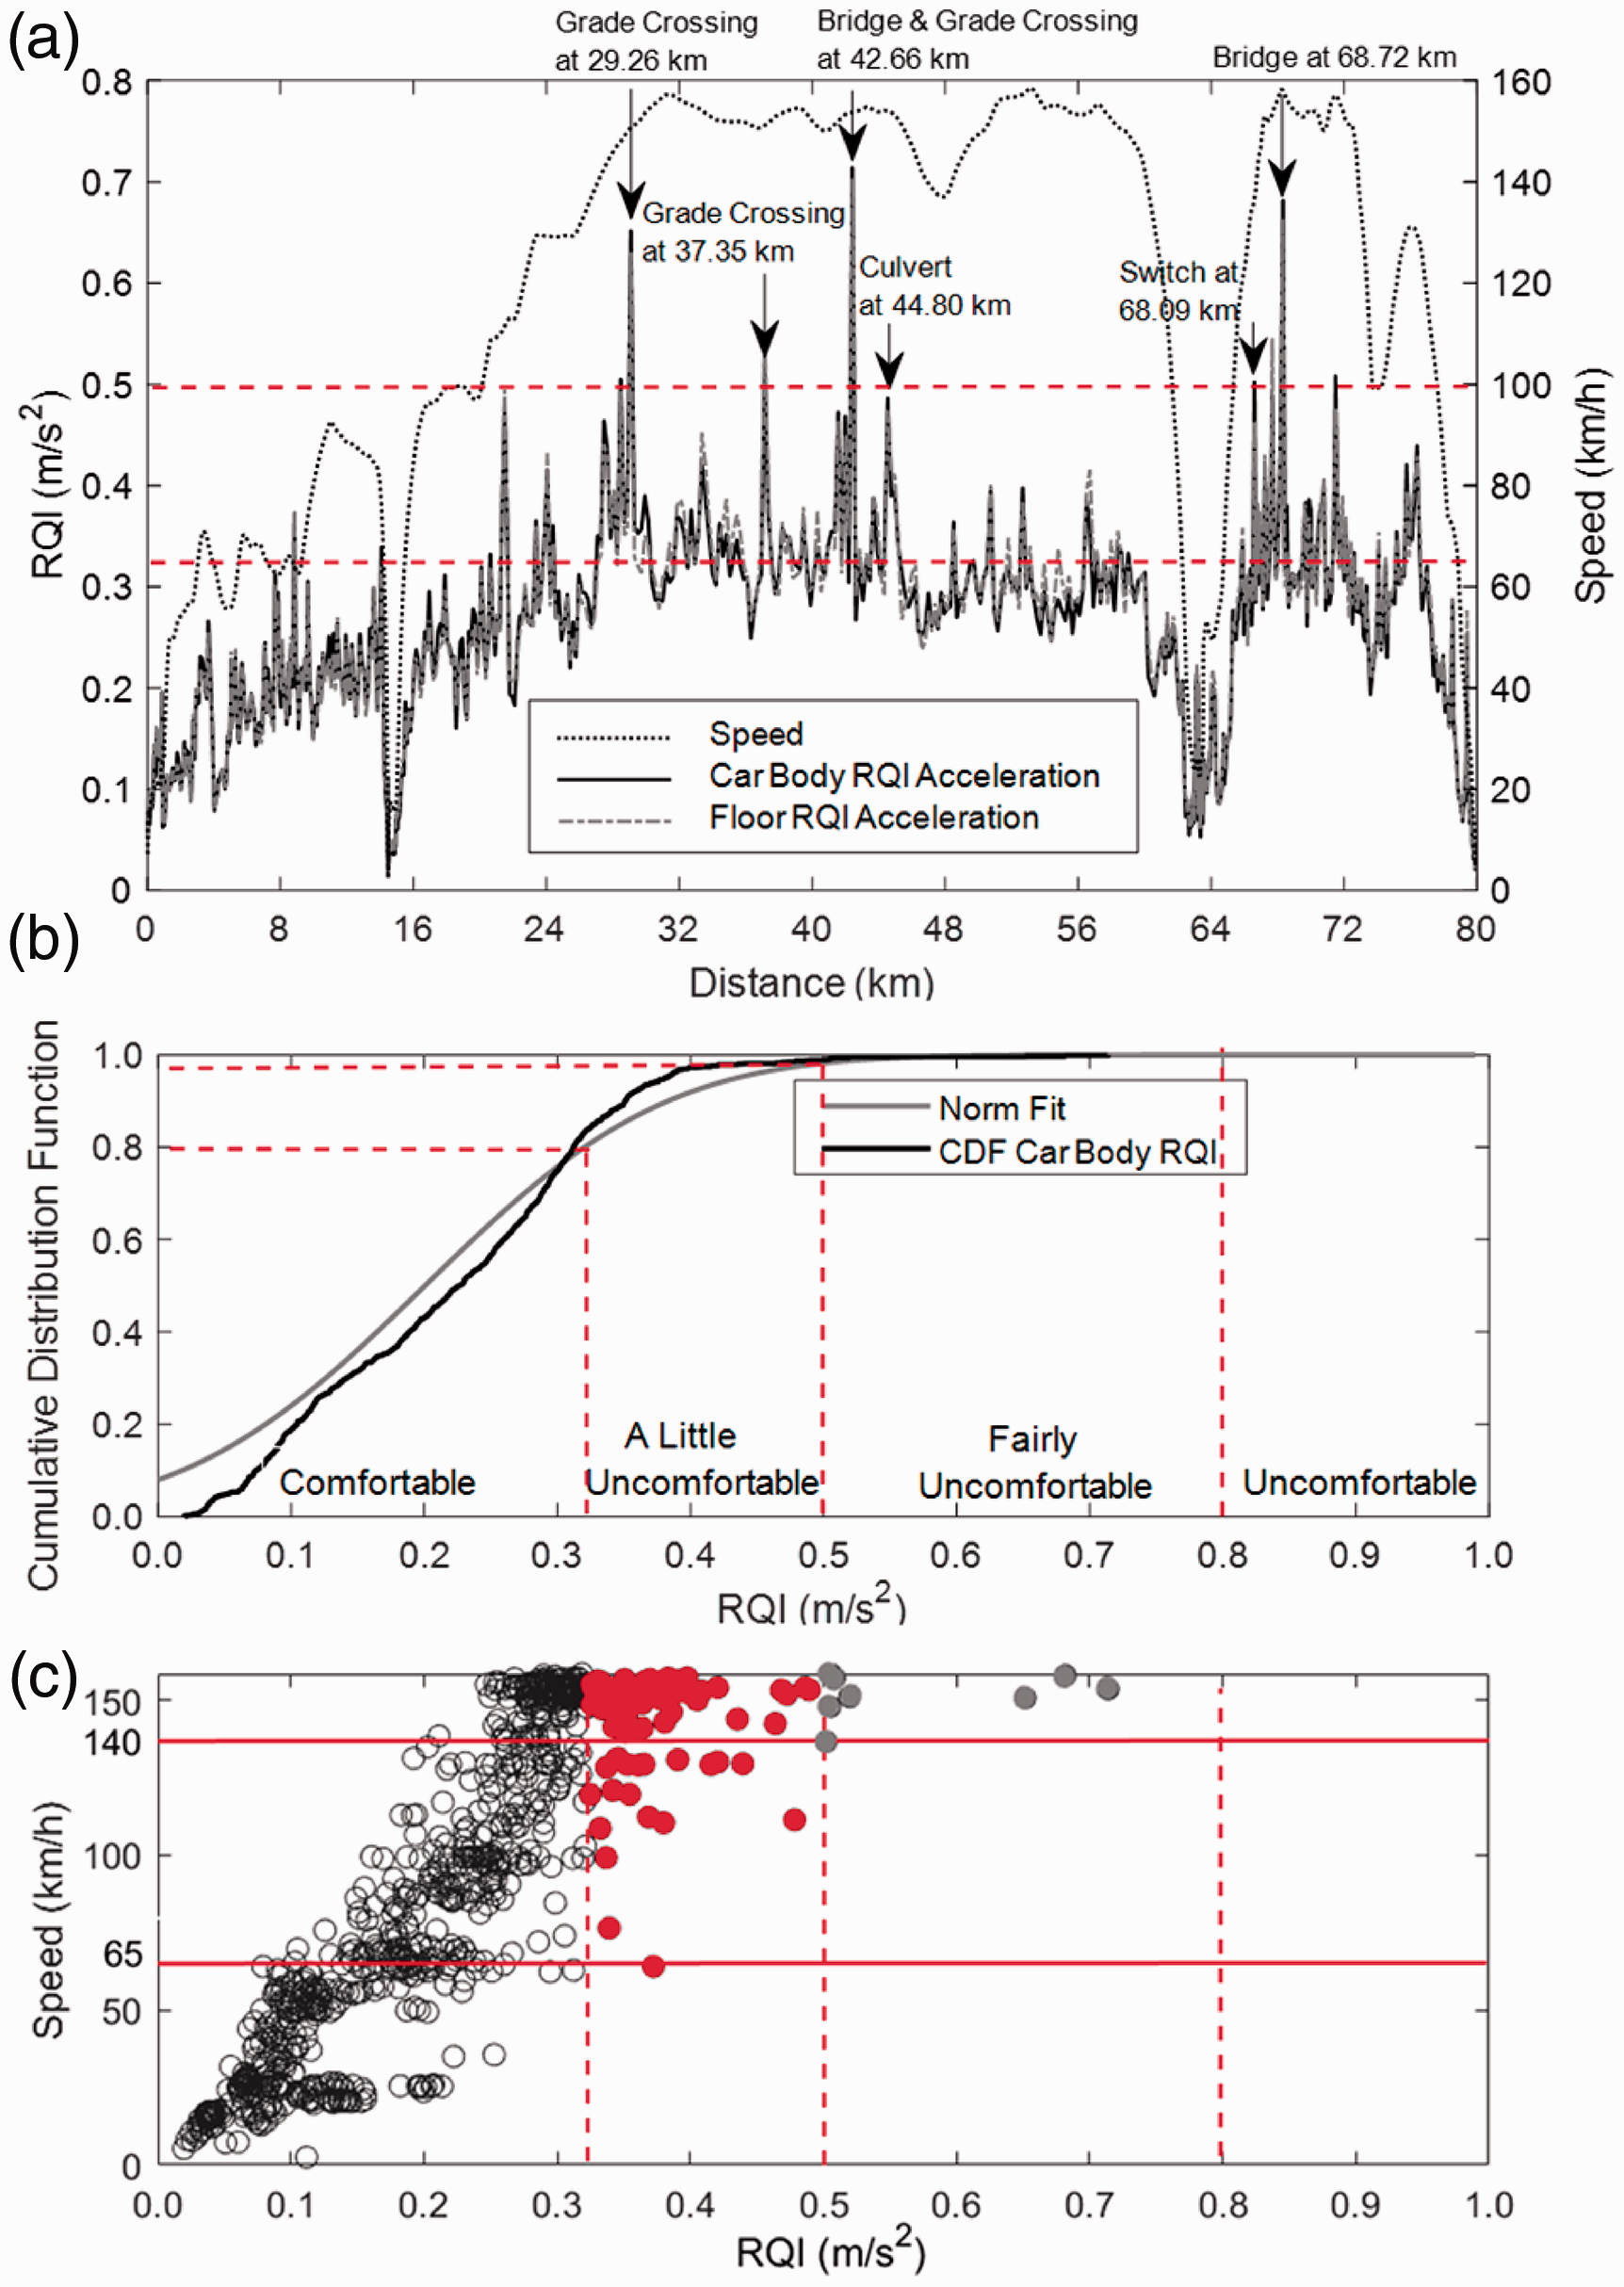
a) Variation of RQI values of floor and car body accelerations and the train speed versus distance, and the corresponding major notable features between distances 24 and 73 km that resulted in fairly uncomfortable vibrations; b) cumulative distribution function (CDF) of RQI values; and c) relation between RQI values and speed.
Calculated RQI values and the train operating speed at two example of different dates July 18th and August 1st, 2018 are plotted in Figure 5 to demonstrate the repeatability of RQI values, and the consistency of speed achieved between runs. Figure 5 also shows the RQI graphs have very similar trends between runs which is as a result of repeatable measurements of car body vertical accelerations.
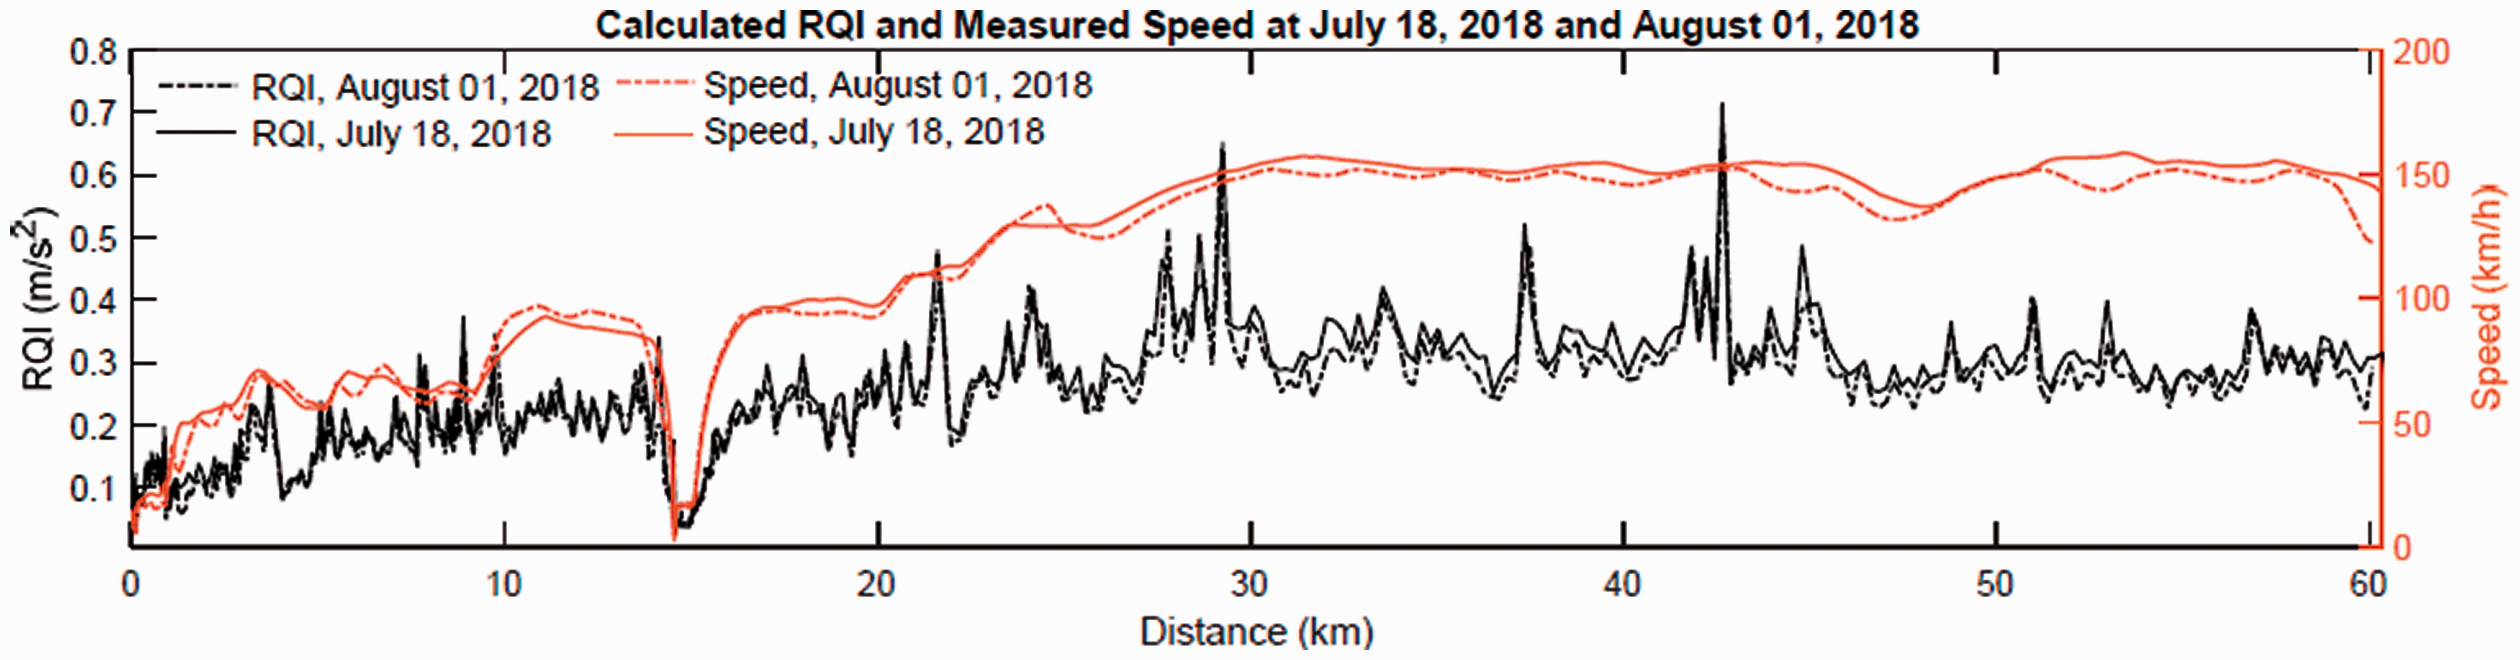
Variation of RQI values of car body vertical accelerations and the train speed versus distance at two examples of different dates at July and August 2018.
The number of occurrences of RQI values greater than 0.315 m/s2 at these major notable features is illustrated in Figure 6. As can be seen, bridges and grade crossings (Figure 6(a) – number of occurrences 19) and then switches (Figure 6(b) – number of occurrences 7) contribute the most to RQI greater than 0.5 m/s2 (“fairly uncomfortable”). Culverts and other track features (such as rail joints close to hot boxes) do not contributed to “fairly uncomfortable” RQI. Figure 6 also shows that the RQI value between 0.315 and 0.5 m/s2 (“a little uncomfortable”) was calculated for all types of track features including culverts and rail joints close to hot boxes. The average of recorded speed of train in the studied features in Figure 6 is greater than 134 km/h which is one reason to both “a little uncomfortable” and “fairly uncomfortable” RQI. Figure 6(a) and (b) also show that where bridges, grade crossings and switches fall within the “fairly uncomfortable” RQI, the average recorded speeds are 10 km/h greater than “a little uncomfortable” zone: 150 km/h vs. 140 km/h for bridges and grade crossings, and 144 km/h vs. 134 km/h for switches.
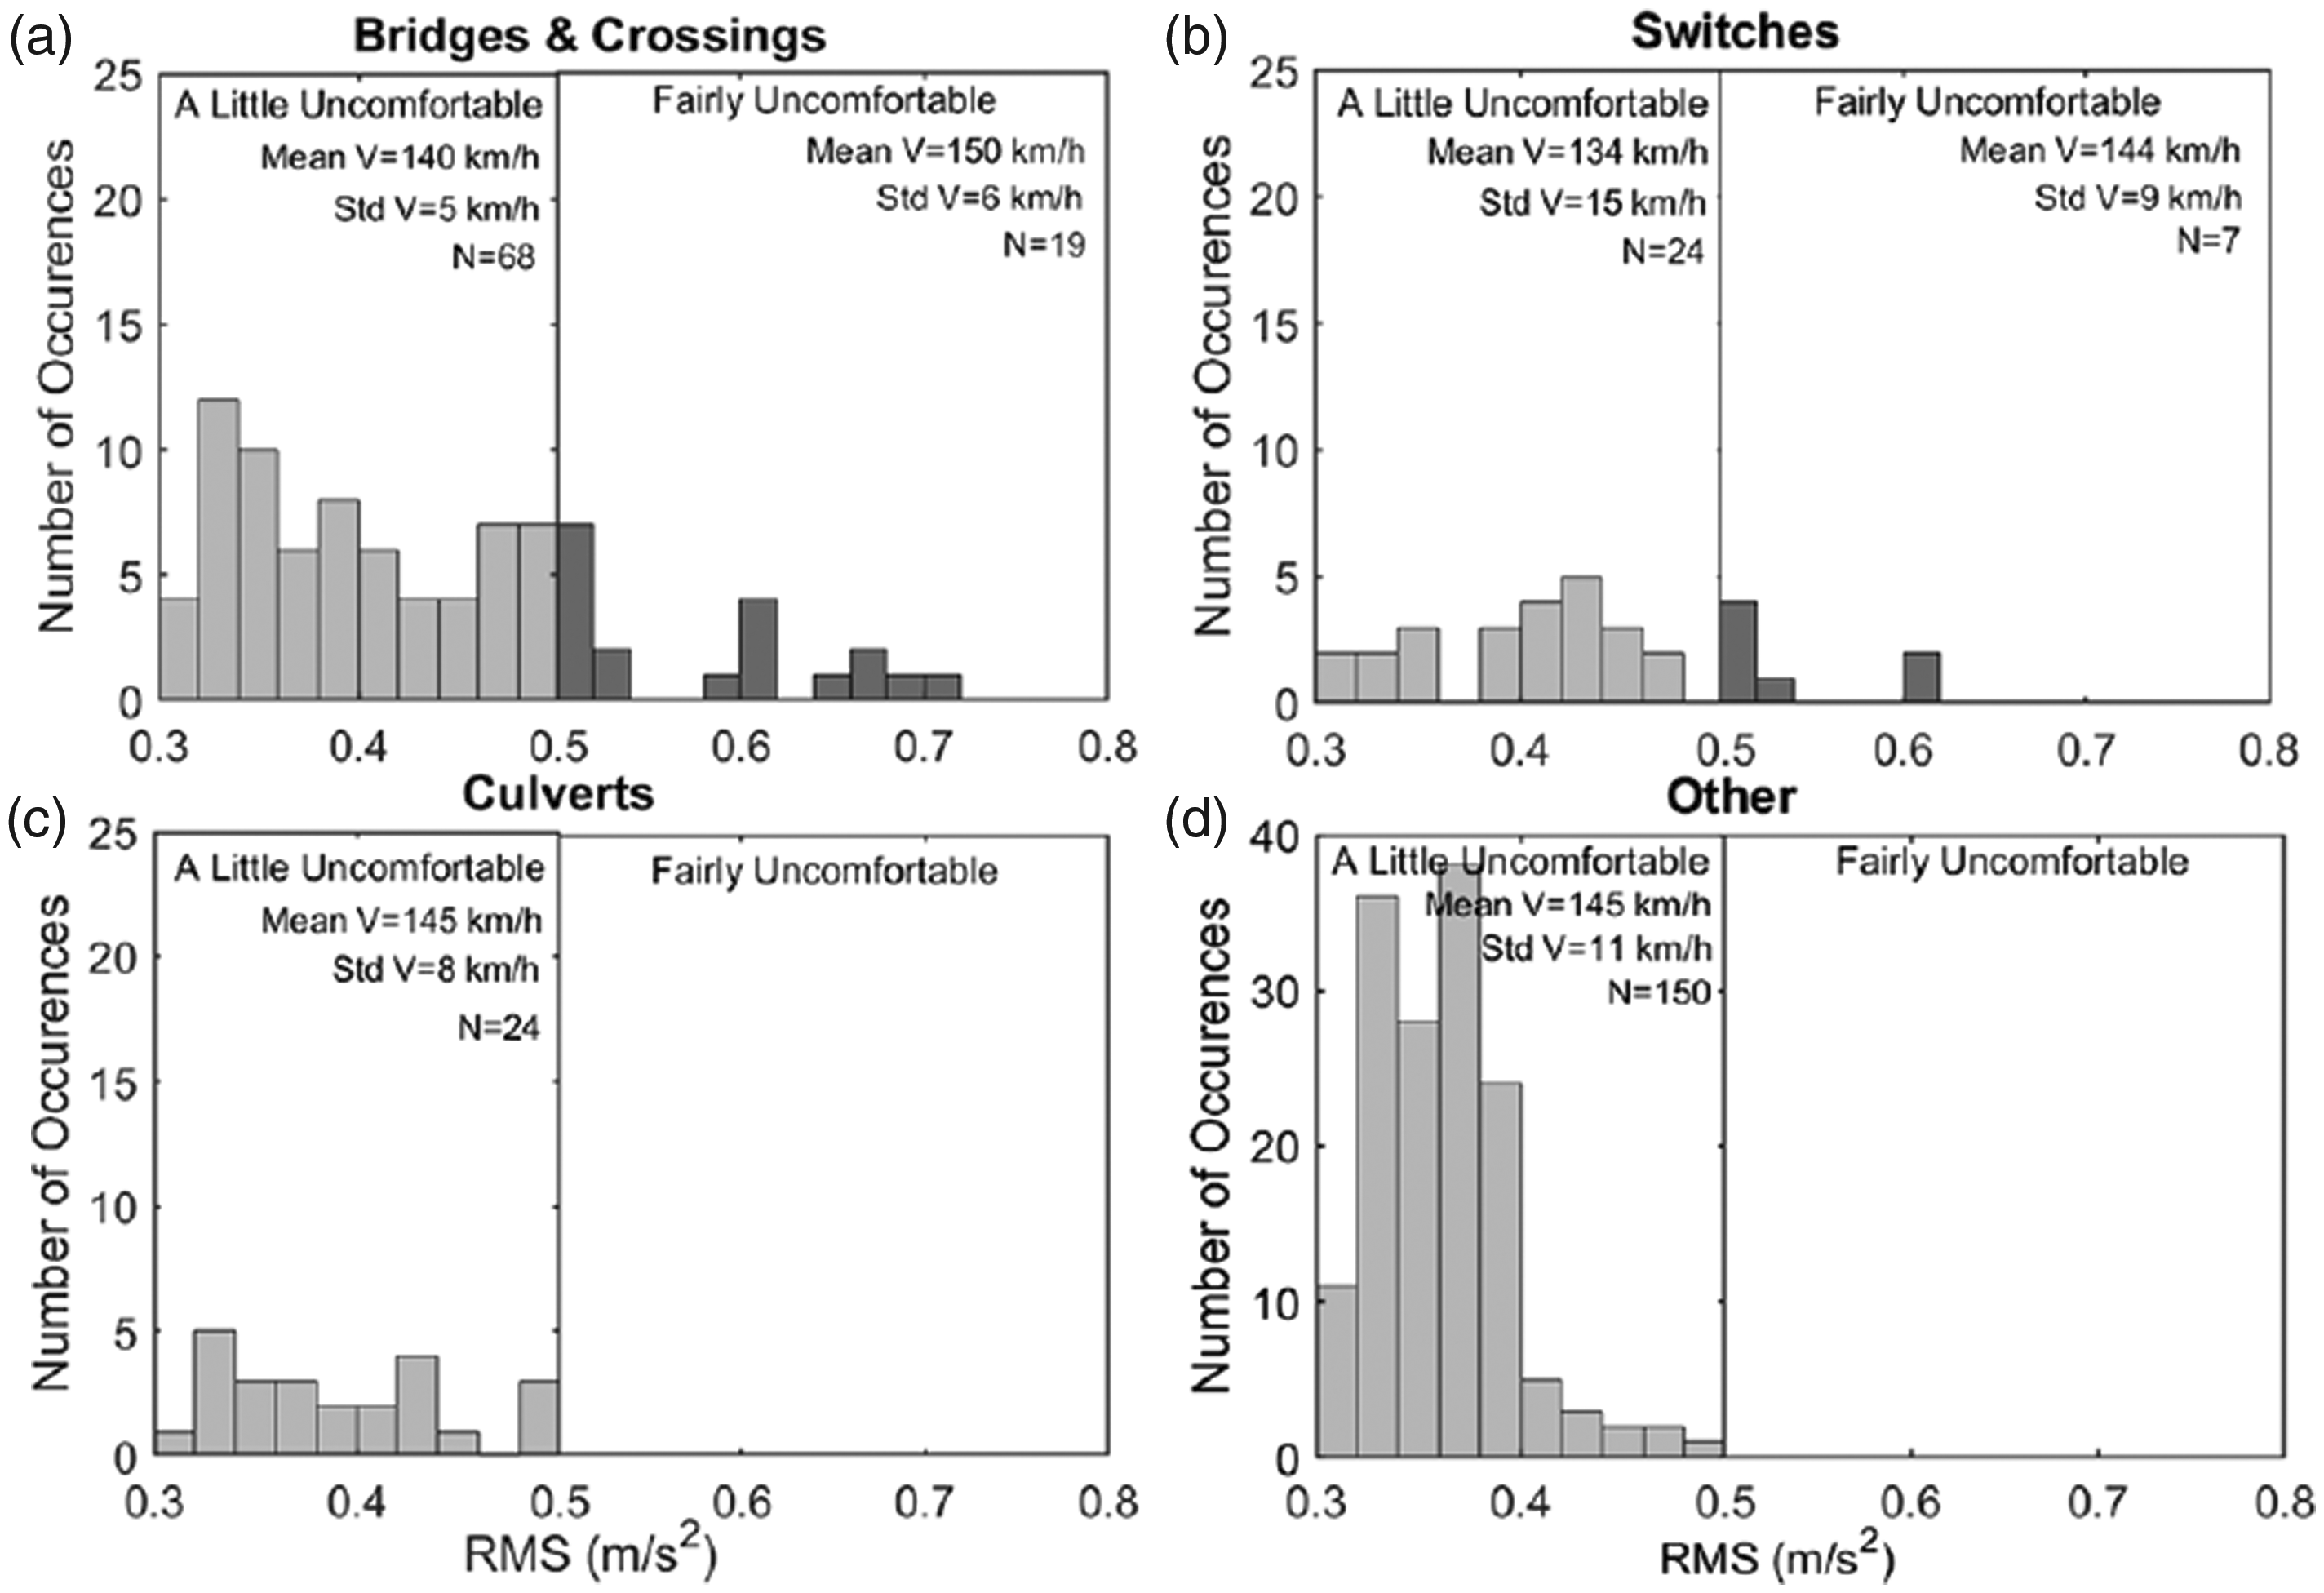
Number of occurrences per feature type for RQI values greater than 0.315 m/s2 based on eight runs of data collection: a) bridges and grade crossings; b) switches; c) culverts; and d) other track features.
Effect of speed on RQI
Figure 6 showed that the average recorded speed within the zone of RQI > 0.5 m/s2 (fairly uncomfortable) was greater than the zone 0.315 <RQI< 0.5 m/s2 (a little uncomfortable). The RQI was first calculated according to ISO 2631-1: 1997, and its variation and the corresponding train speed along the track are shown in Figure 4(a). Second, the likelihood of RQI values in the category of “a little uncomfortable” and “fairly uncomfortable” was investigated in Figure 4(b) as a cumulative distribution of RQI values within the ISO 2631-1: 1997 RQI classification. This figure depicts that 80% of the RQI values were within the “comfortable” category, and 20% were in the range of “a little uncomfortable” and “fairly uncomfortable”. To find the train speeds that result in “a little uncomfortable” and “fairly uncomfortable” ride quality conditions, the speed was plotted against RQI values. Figure 4(c) indicates train speeds greater than 140 km/h always contribute to RQI values above 0.5 m/s2 (highlighted by the gray points). For RQI values greater than 0.315 m/s2 (indicated by the red markers), the recorded speed is above 65 km/h. Even though the white-face black markers are within the “comfortable” region in Figure 4(c), they show the direct relation between increases in RQI value and speed.
Variation of RQI values over five months of data collection
To evaluate the change of RQI over the five months of data collection, the number of occurrences of peak RQI values between 0.315 and 0.80 m/s2 for each dataset are plotted in Figure 7. The dataset classified based on the date of data collection in Figure 7 are same as those used in Figure 6. The occurrences of peak RQI includes those from bridges and grade crossings, switches, culverts and other track features with “a little uncomfortable” and “fairly uncomfortable” ride quality.
The average speeds were very similar between these eight runs with a deviation of only ±3 km/h. Several track features had RQI values below 0.50 m/s2 in March 2018, but from April onwards these values exceed 0.50 m/s2; similar results were noted at locations with RQI values below 0.315 m/s2 that then increased to 0.315–0.50 m/s2. Figure 7 shows (i) the number of values between 0.315 and 0.5 m/s2 grew from 16 on March 9, 2018 to 63 on August 12, 2018; (ii) the number of occurrences of RQI values greater than 0.5 m/s2 increased from 4 on March 9, 2018 to ∼15 on August 12, 2018 which resulted in changing the shape of the fitted distribution of RQI values more being shifted from 0.52 to 0.68 m/s2. Both results show the general degradation of ride quality over this five-month period as a result of passing traffic which is 3.5 MGT annually.
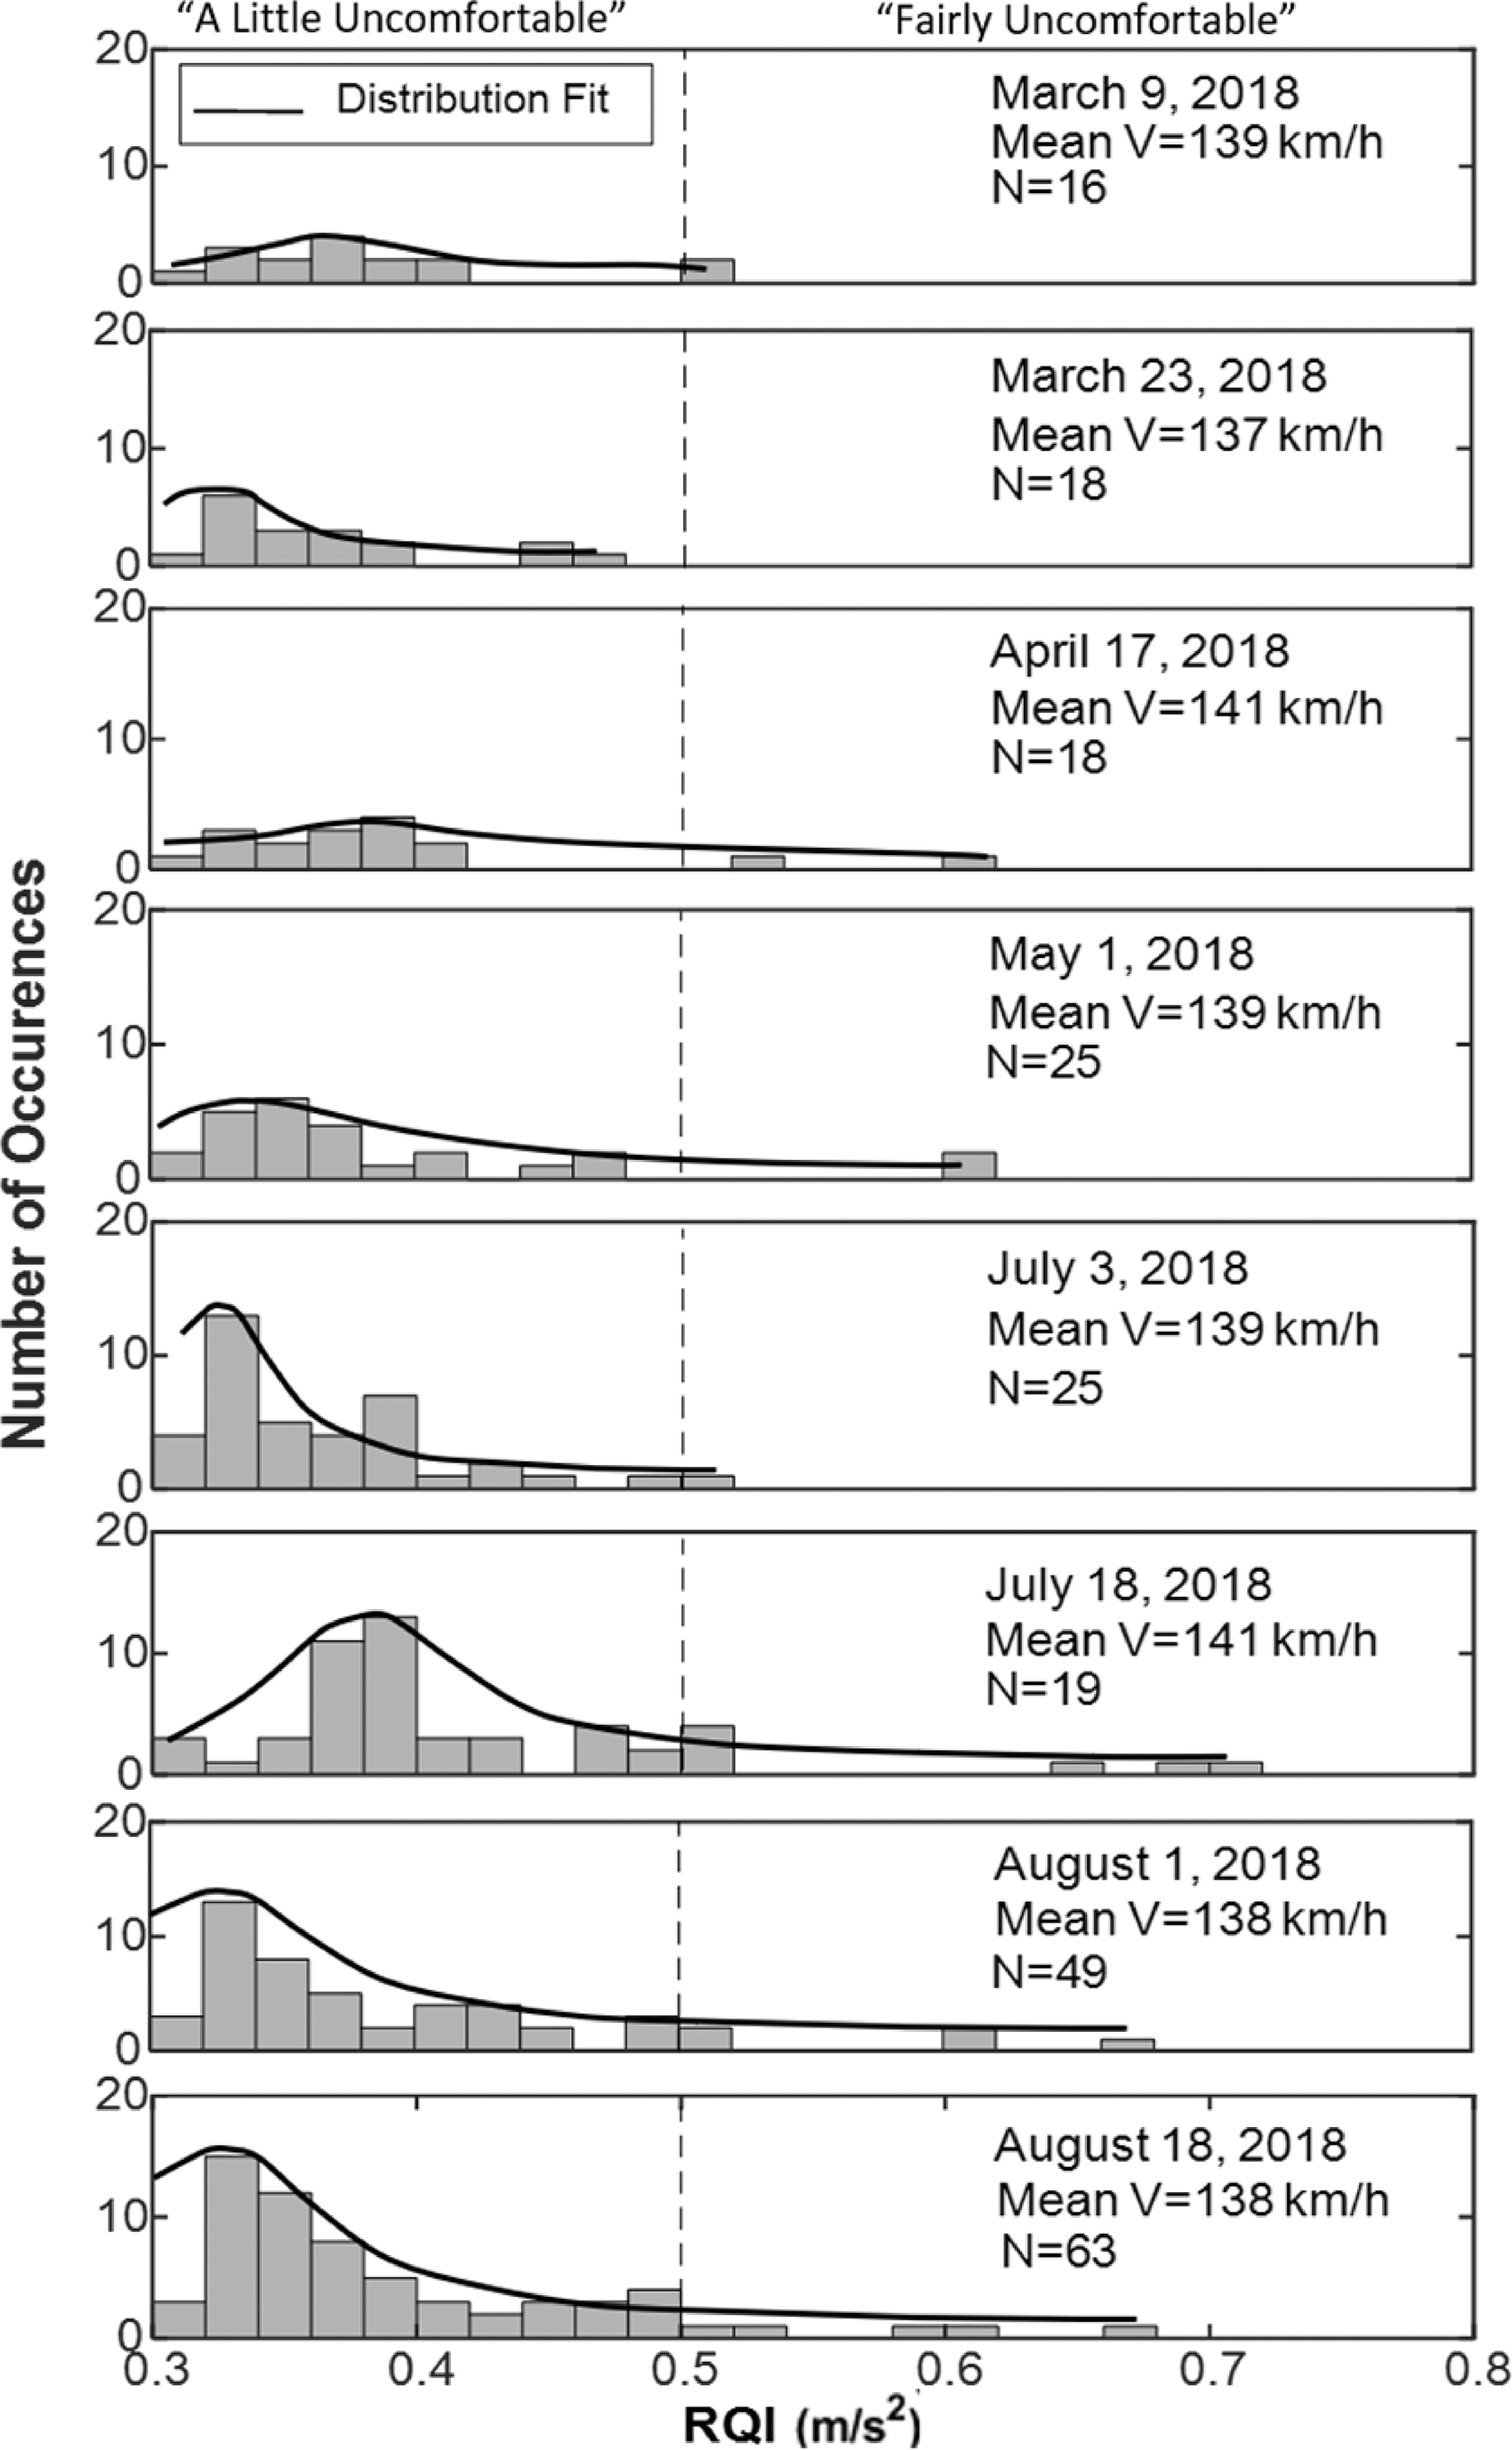
Change in the distribution of RQI values over five months of data collection.
The assessment of variation of ride quality values at track features over the five-month of study (Figure 7) indicated some locations had recurring measurements of high RQI in “fairly uncomfortable” category (0.5-0.8 m/s2). For example, for the grade crossing located 42.66 km from the origin station, the RQI values on March 9, 2018 and March 23, 2018 were 0.458 and 0.487 m/s2, respectively, but for April 17, 2018 and later dates increased and resulted in six successive calculated RQI above 0.5 m/s2 for this location. This recurring observation shows that the track features with increased successive RQI values potentially need improvement.
Evaluation of TR from accelerations
In this section, the feasibility of evaluating the track surface and alignment roughness from vertical and lateral car body and axle box accelerations is studied. For this purpose, the relationship between acceleration and TR was investigated by conducting a regression analysis of the surface and alignment roughness and the envelope of car body and the axle box accelerations between distances 30 and 60 km. This section of track was selected for the detailed study for two reasons: first, greatest magnitude of accelerations and track roughness was recorded in comparison to other track sections; second, this selection also eliminates track sections where roughness might not reflect in the accelerations due to lower operating speed.
Direct comparison of accelerations and surface and alignment data was not possible because the accelerations of the car body and axle boxes were collected at frequencies of 500 and 5000 Hz, respectively, while the geometry data were recorded at 0.30-m (1-ft) intervals. Therefore, after the GPS coordination of accelerations, surface and alignment datasets were matched, the track roughness was calculated using equation (3) over every 38 m-length. The envelopes of car body and axle box accelerations were calculated at every separated 40000 and 4000 samples. These sample numbers resulted to best fit with TR and its wavelength. The comparison of calculated TR and envelope of accelerations are plotted in Figures 8 and 9. Figure 8 shows the comparison of envelope of vertical axle box and car body accelerations with surface roughness between distance 30 and 60 km. As can be seen in Figure 8(a) and (b), many peak magnitudes of envelope of car body and axle box vertical accelerations coincide with surface roughness. The same observation can be made in Figure 9(a) between axle box lateral and car body accelerations and alignment roughness (Figure 9(b)).
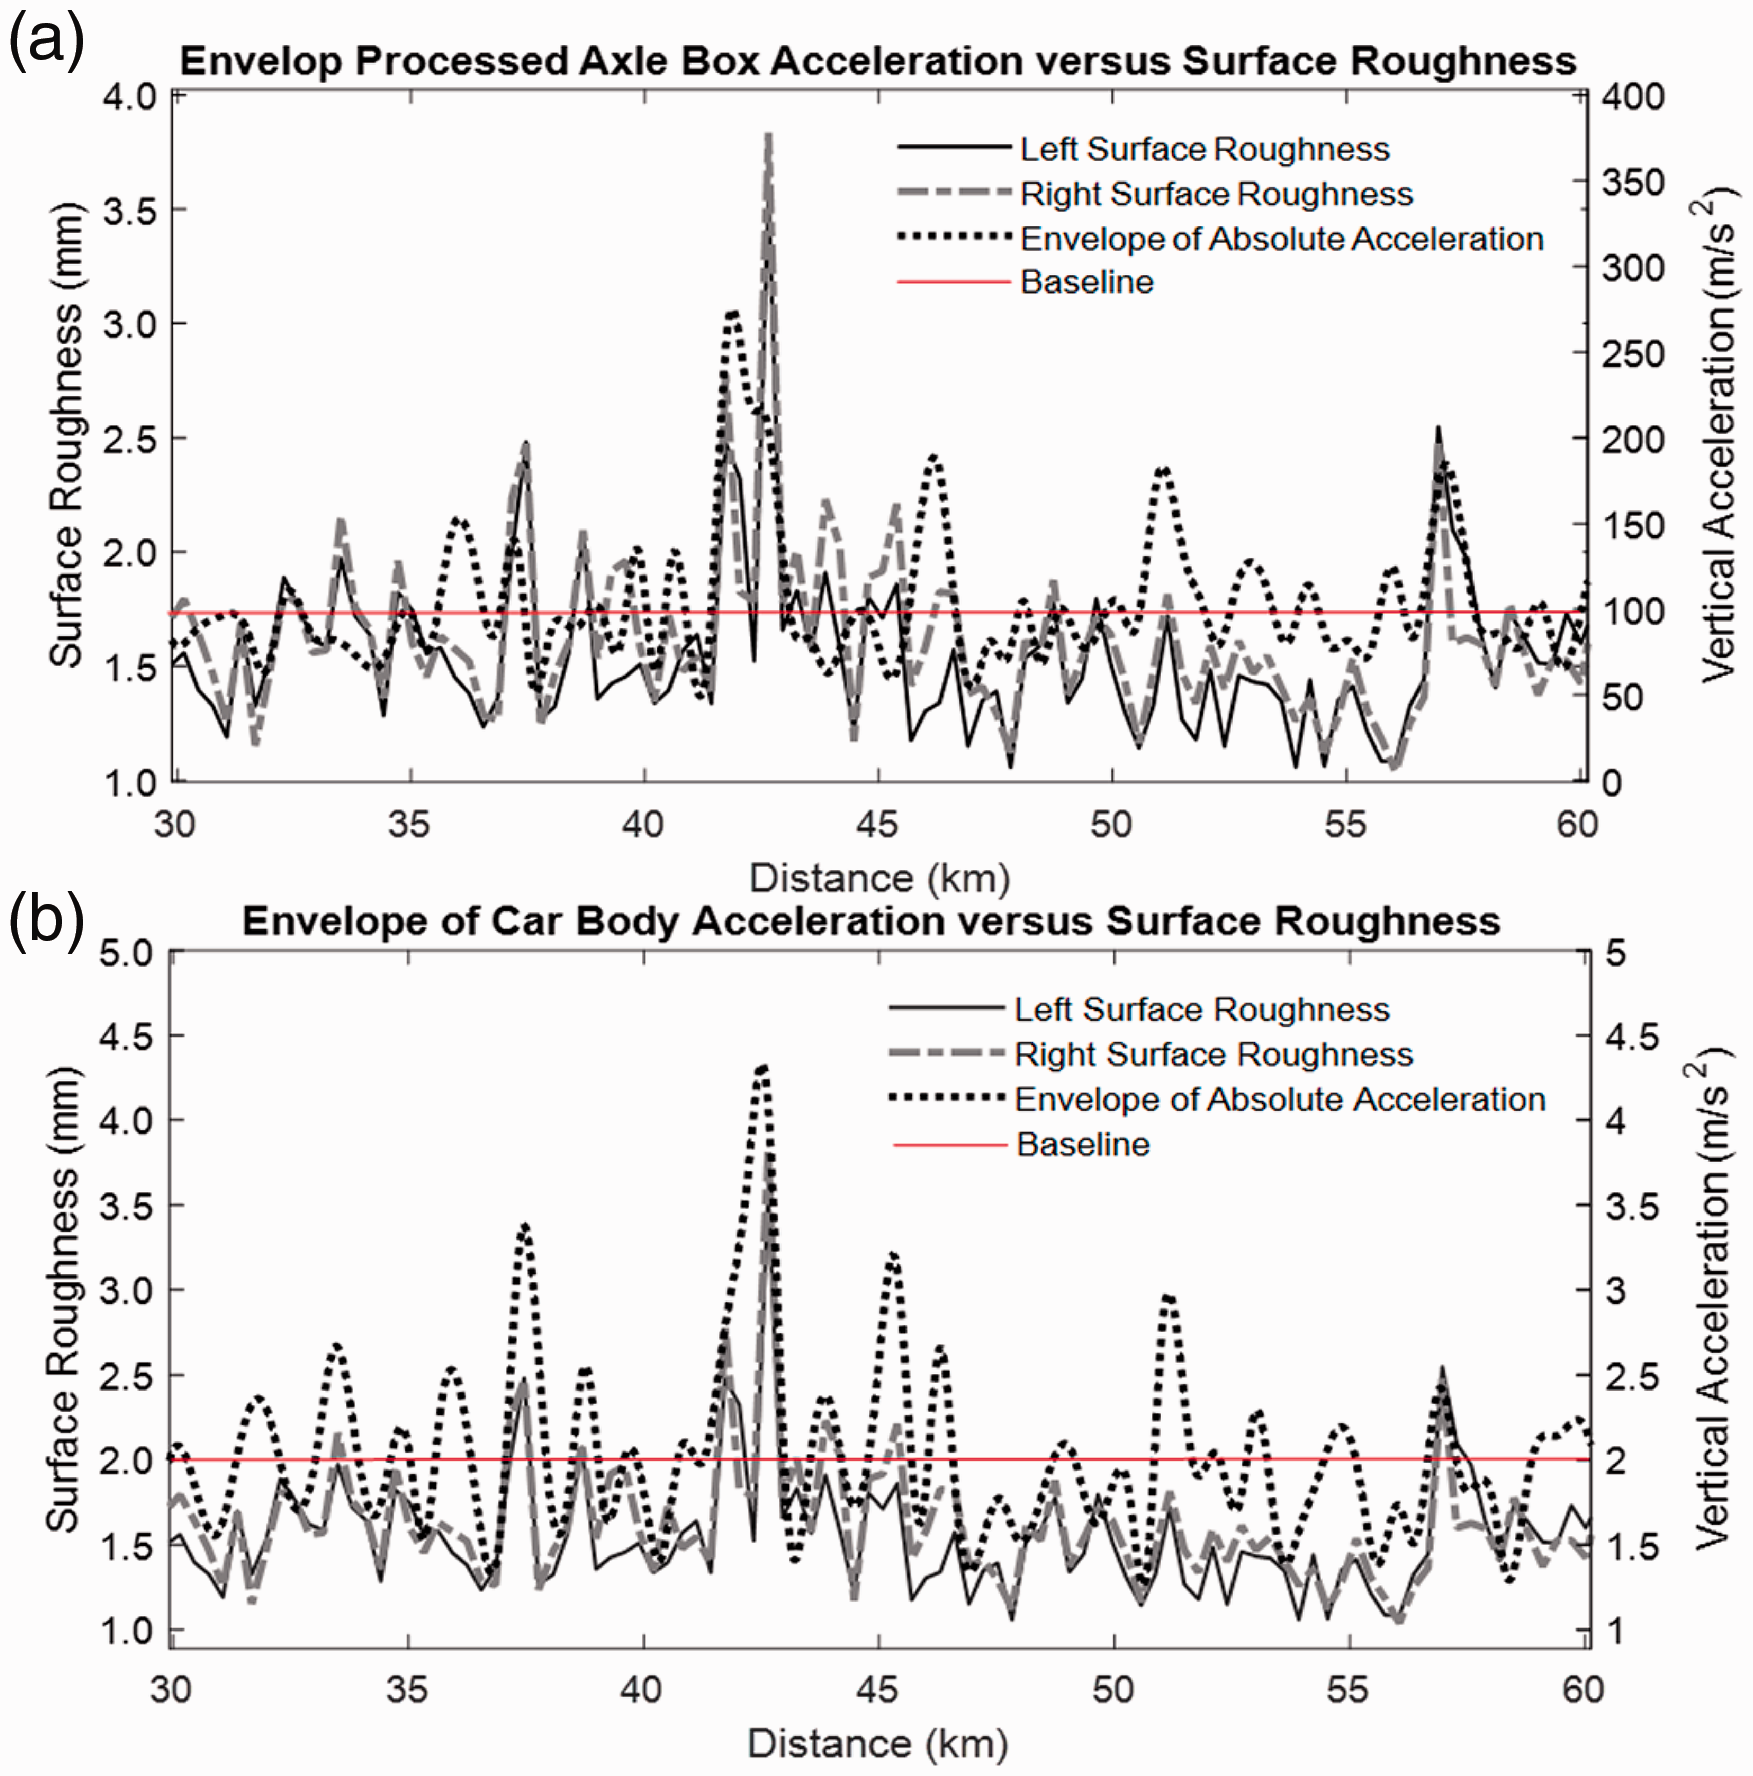
Comparison between the surface roughness and envelope of vertical acceleration: a) axle box; b) car body.
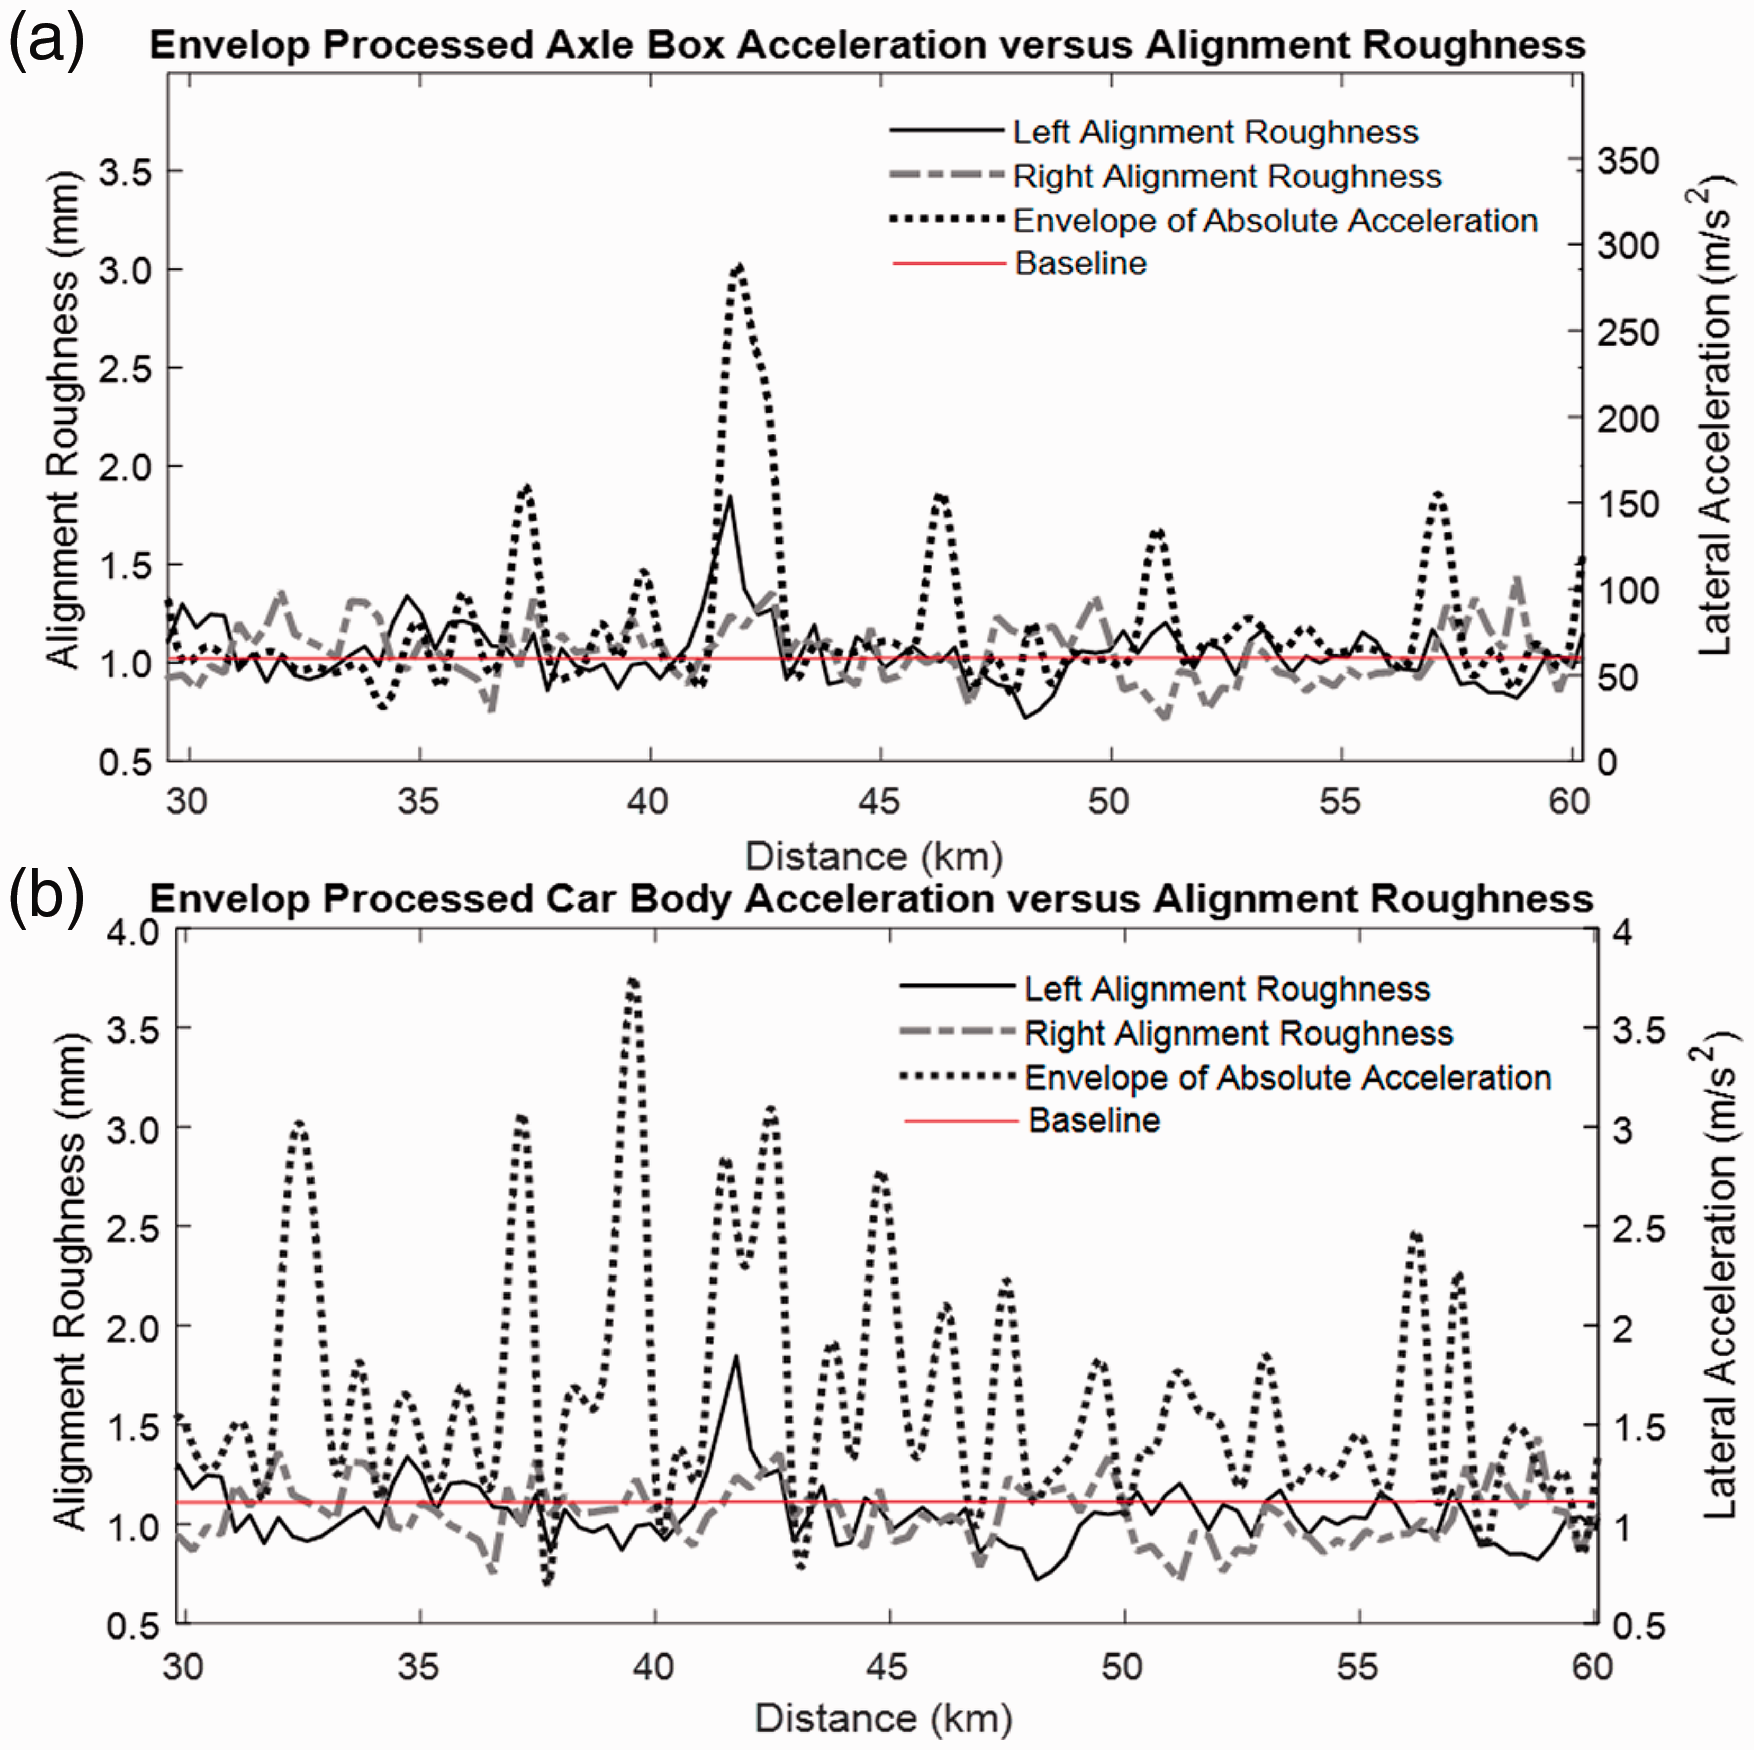
Comparison between the alignment roughness and envelope of lateral acceleration: a) axle box; b) car body.
Figure 10(a) to (d) illustrate the regression analysis in the tangent section of track. Each data point’s x-axis value is the peak value of envelope of acceleration corresponding to peak value of surface or alignment roughness to eliminate the low roughness/envelope of acceleration events that do not have significant effect on the response of vehicle-track interaction. Figure 10(a) and (c) show that the correlation between axle box vertical acceleration and surface roughness is much stronger than car body acceleration with coefficient of determination (R2-value) of 0.62. The outlier depicted as white-face circle marker in Figure 10(a) is related to the roughest surface at the start of curved track at distance 42.64 km (see Figure 3) where the magnitude of axle box acceleration doesn’t follow the same spike. This outlier resulted in R2-value of 0.62. This most rough surface is captured by the car body vertical acceleration in Figure 10(c). The R2 = 0.39 for the correlation between surface roughness and car body vertical acceleration is calculated without considering this point.
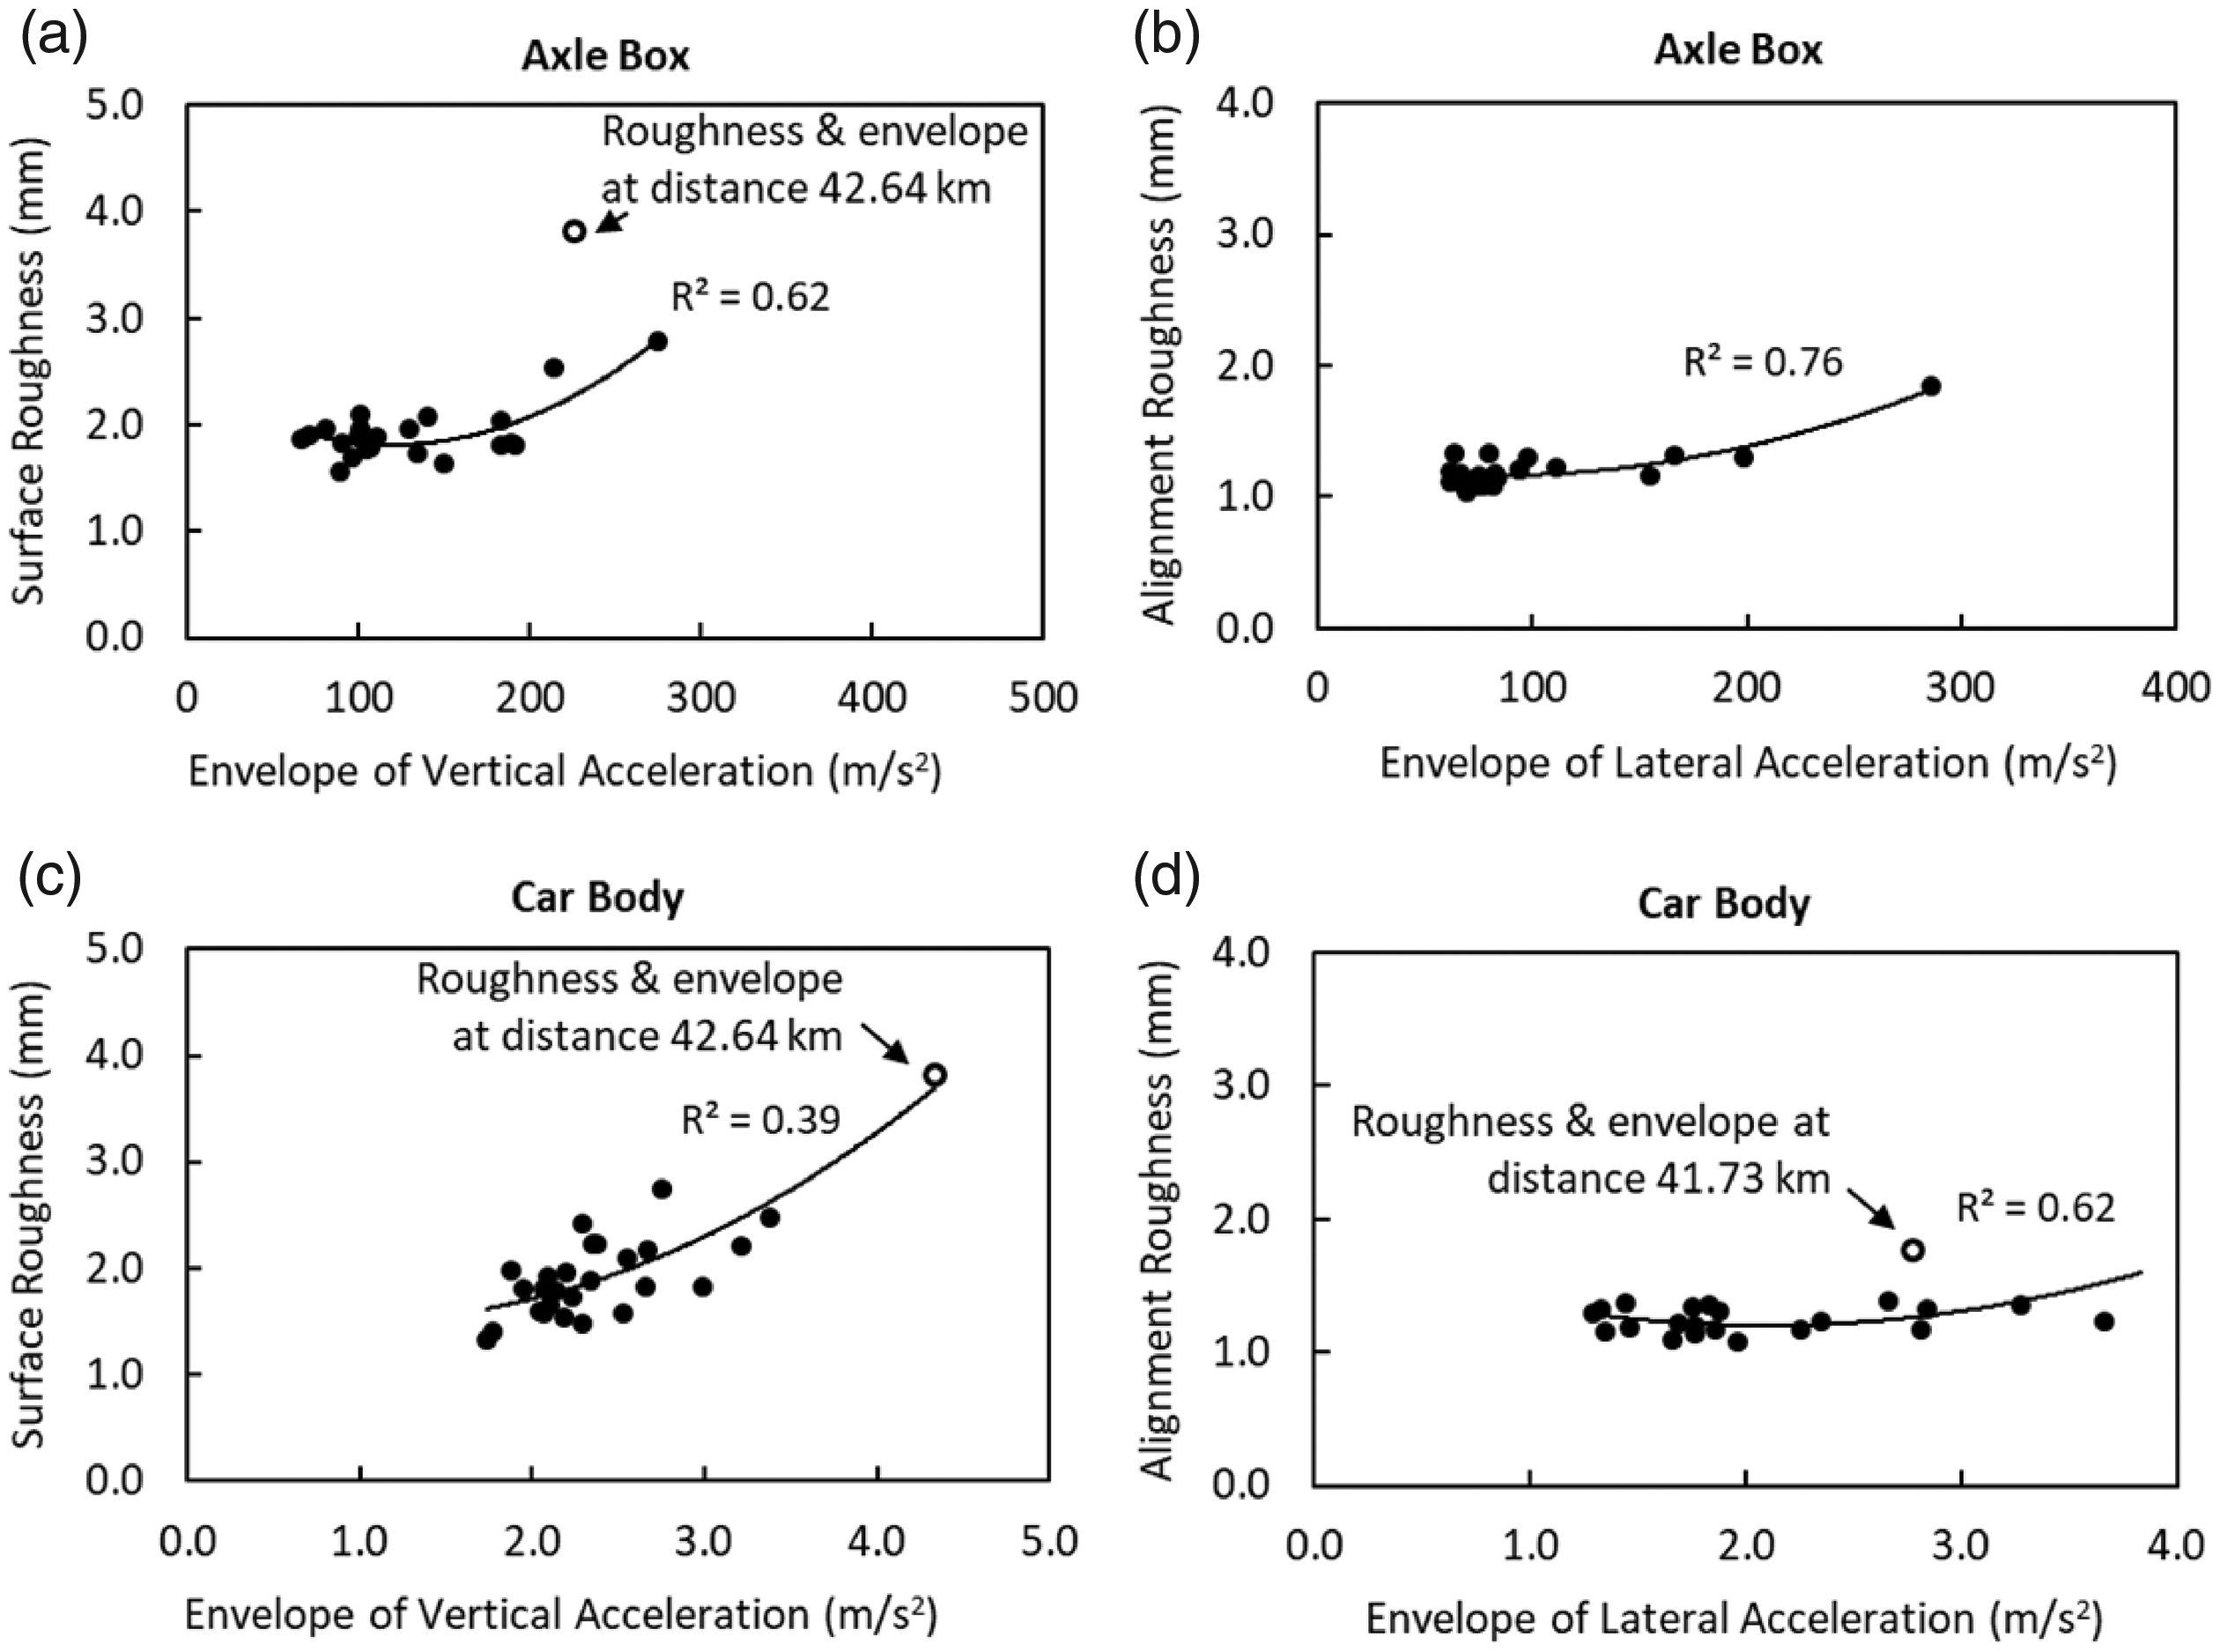
Results of regression analysis: a) envelope of axle box vertical acceleration and surface roughness; b) envelope of axle box lateral acceleration and alignment roughness; c) envelope of car body vertical acceleration and surface roughness; and d) envelope of car body lateral acceleration and alignment roughness.
Figure 10(b) and (d) show that axle box lateral acceleration has reasonable correlation with alignment roughness with R2-value of 0.76. But there is less correlation between car body lateral acceleration and alignment roughness (R2 = 0.62). The weaker correlation between car body vertical acceleration and surface roughness, as well as lateral accelerations and alignment roughness in respect to those relationship with axle box accelerations might be as a result of rail car’s first and secondary suspension system which filters out the harsh accelerations to isolate the passengers from the rough track.
Conclusions
Using onboard accelerometers mounted in a passenger car operating on the VIA rail route in Ontario, Canada, the ride quality was evaluated by calculating RQI values per as ISO 2631-1: 1997 standard. The sources of the relatively high values of “a little uncomfortable” and “fairly uncomfortable” ride quality (0.315–0.5 and 0.5–0.8 m/s2) were investigated within the eight datasets collected within a five-month period. It was found that “fairly uncomfortable” RQI are mainly attributed to bridges, switches and grade crossings. The speed of train at all determined “fairly uncomfortable” RQI is greater than 140 km/h. Multiple train travels with approximately same speed along the track has increased number of RQI with magnitudes over 0.315 m/s2 within the five-month monitoring period.
An envelope technique was applied which uses spline interpolations over local maxima of absolute magnitude of accelerations at every separated n samples corresponding to best fit the TR. The regression analysis between the envelope of accelerations and alignment and surface roughness presented a meaningful correlation, and showed the suggested method is a promising analytical technique to evaluate the variation of track roughness along the track from axle box accelerations.
Both ride quality measurements and the proposed method of calculation of envelope of acceleration presented within this paper do show that mounting onboard accelerometers in revenue service rail cars is useful to daily provide an inexpensive assessment of track to indicate the locations where highly impact the ride quality and to determine the location of rough track as a complementary technique to light and heavy track geometry inspections.
The relationship between the envelope of the acceleration and track roughness was studied where the travel speed of train and track geometry inspection car were relatively constant. The effect of different travel speed on the relationship between the track roughness and envelope of the accelerations need further study. Until then, the method of analysis can be applied to multiple smaller subsections where the speed is relatively constant.
The limitation to application of acceleration data for monitoring and assessment of track and railway features is that train speed for every run of data recording should be relatively similar for meaningful interpretation and evaluation of changes of ride quality and track roughness over a stretch of time.
Footnotes
Data Accessibility statement
Accelerations and geometry data used during the study were provided by National Research Council Canada (NRC). Direct requests for these materials may be made to NRC. Some codes used and generated during the study are available from the corresponding author by request (Correction for distance shifts and phase lags, RQI, CDF, envelope of acceleration, regression analysis, functions and scripts). All GPS coordinates data used during the study are confidential in nature and may only be provided with restrictions.
Acknowledgements
The authors acknowledge the National Research Council Canada (NRC) for providing the research project. The authors gratefully acknowledge the collaboration of VIA Rail Canada Inc., particularly the assistance provided by Paul Charbachi. Special thanks to NRC’s AST testing and evaluation team for installing and maintaining the instrumentation.
Declaration of Conflicting Interests
The author(s) declared no potential conflicts of interest with respect to the research, authorship, and/or publication of this article.
Funding
The author(s) disclosed receipt of the following financial support for the research, authorship, and/or publication of this article: This research was made possible through the Canadian Railway Research Laboratory (CaRRL) research program at the University of Alberta, which is funded by Canadian National Railway (CN), Transport Canada, NRC, and the Natural Sciences and Engineering Research Council of Canada (Grant number IRC 523369-18).