
Abstract
The environmental impacts of noise and vibration are becoming increasingly important in the assessment of new and upgraded railway routes. Vibration from railways propagates through the ground to nearby buildings where it may cause annoyance as feelable vibration or as re-radiated noise. To tackle the adverse effects of ground-borne noise a range of possible interventions are available, including softer rail pads, under-sleeper pads and under-ballast mats. The installation costs of such interventions are generally higher for the higher-performing track types. Additionally, there are potential effects on track maintenance costs which may be positive or negative, for example by reducing sleeper damage or increasing the need for ballast tamping. This study presents a socio-economic analysis of the effects of several interventions to reduce ground-borne noise. By selecting a whole route, the installation and whole-life costs are assessed using Network Rail’s Vehicle-Track Interaction Strategic Model (VTISM) and these are offset against benefits in terms of reduced social costs. Ground-borne noise is predicted at various distances from the alignment using the Modelling of Train Induced Vibration (MOTIV) model and the effect of track interventions is determined as insertion loss spectra. The re-radiated noise within a typical domestic building is then estimated using generic building transfer functions. Geographic Information System tools are used to estimate the population affected by ground-borne noise and their expected level of exposure. The methodology is illustrated using a case study route between Brighton and Portsmouth in the South of England.
Keywords
Introduction
The railway in Britain has experienced something of a renaissance over recent decades. Passenger journeys have almost doubled in 20 years (up from 0.89 billion in 1998/99 to 1.76 billion in 2018/19 1 ) and the number of passenger train kilometres travelled has increased 6.6% since 2010/11. 2 However, there has only been a very modest increase in total route length open to traffic, with an additional 70 km (0.4%) since 2010/11. 3 This means that more trains are running along the same infrastructure, resulting in higher maintenance costs due to more rapid degradation of track. 4 Britain has the most congested network in Europe, 5 accounting for 40% of total congested track in the EU, 6 and parts of the network have reached capacity limits. This severely restricts the opportunities to access the track for maintenance without causing disruption to services. Furthermore, while this shift to rail is considered a success story from a sustainable transport perspective, the higher track usage can have a negative environmental impact by increasing the airborne noise, ground-borne noise and vibration experienced by those living and working close to the railway. 7
These issues have raised interest in the potential of track interventions to extend track life and reduce maintenance and renewal (M&R) costs and activities, while also limiting or reducing impacts on non-users. There is, therefore, a need for a rigorous economic assessment of alternative interventions that takes account of the costs and benefits to all stakeholders. Recent work to assess the economic impact of interventions, including under-sleeper pads (USPs), rail dampers, and noise barriers, has been carried out as part of the Track21 8 and Track to the Future (T2F) 9 research programmes. 10 The validity of any analysis of costs and benefits will largely depend on the accuracy of the financial inputs. While there is an established mechanism for obtaining M&R costs using Network Rail’s Vehicle and Track Interaction Strategic Model (VTISM), the approaches used to quantify and monetise the changes to noise and vibration experienced by non-users have often been rather simplistic. For example, in an assessment of the installation of USPs on the London to Waterloo route, 10 it was assumed that everyone living within 80 m of the track would experience the same ground-borne noise reduction of 4 – 6 dB, resulting in a present value of benefits (PVB) of between £102 million and £153 million. This is a highly aggregate, one-size-fits-all, approach which could give an inaccurate and misleading result. It does not take account of the expected frequency-dependent attenuation of vibration over 80 m, the impact of ground properties, or the effect of USP characteristics (such as stiffness). It also assumes that the impact of USPs with respect to ground-borne noise will always be a positive one. This paper sets out a more disaggregate and spatially detailed approach that overcomes these limitations and aims to be readily transferable.
Methodology
To illustrate the proposed methodology, the route between Brighton and Portsmouth in the South of England, known as the West Coastway line, was selected as a case study (see Figure 1). The route consists of double track throughout, with the exceptions of short three-track sections at Hove, and between Fratton and Portsmouth & Southsea. The total length of track making up running lines is some 92 miles. The maximum line speed varies between 15 and 85 mph, with a median speed of about 70 mph. The track interventions that were considered as part of the case study are as follows:
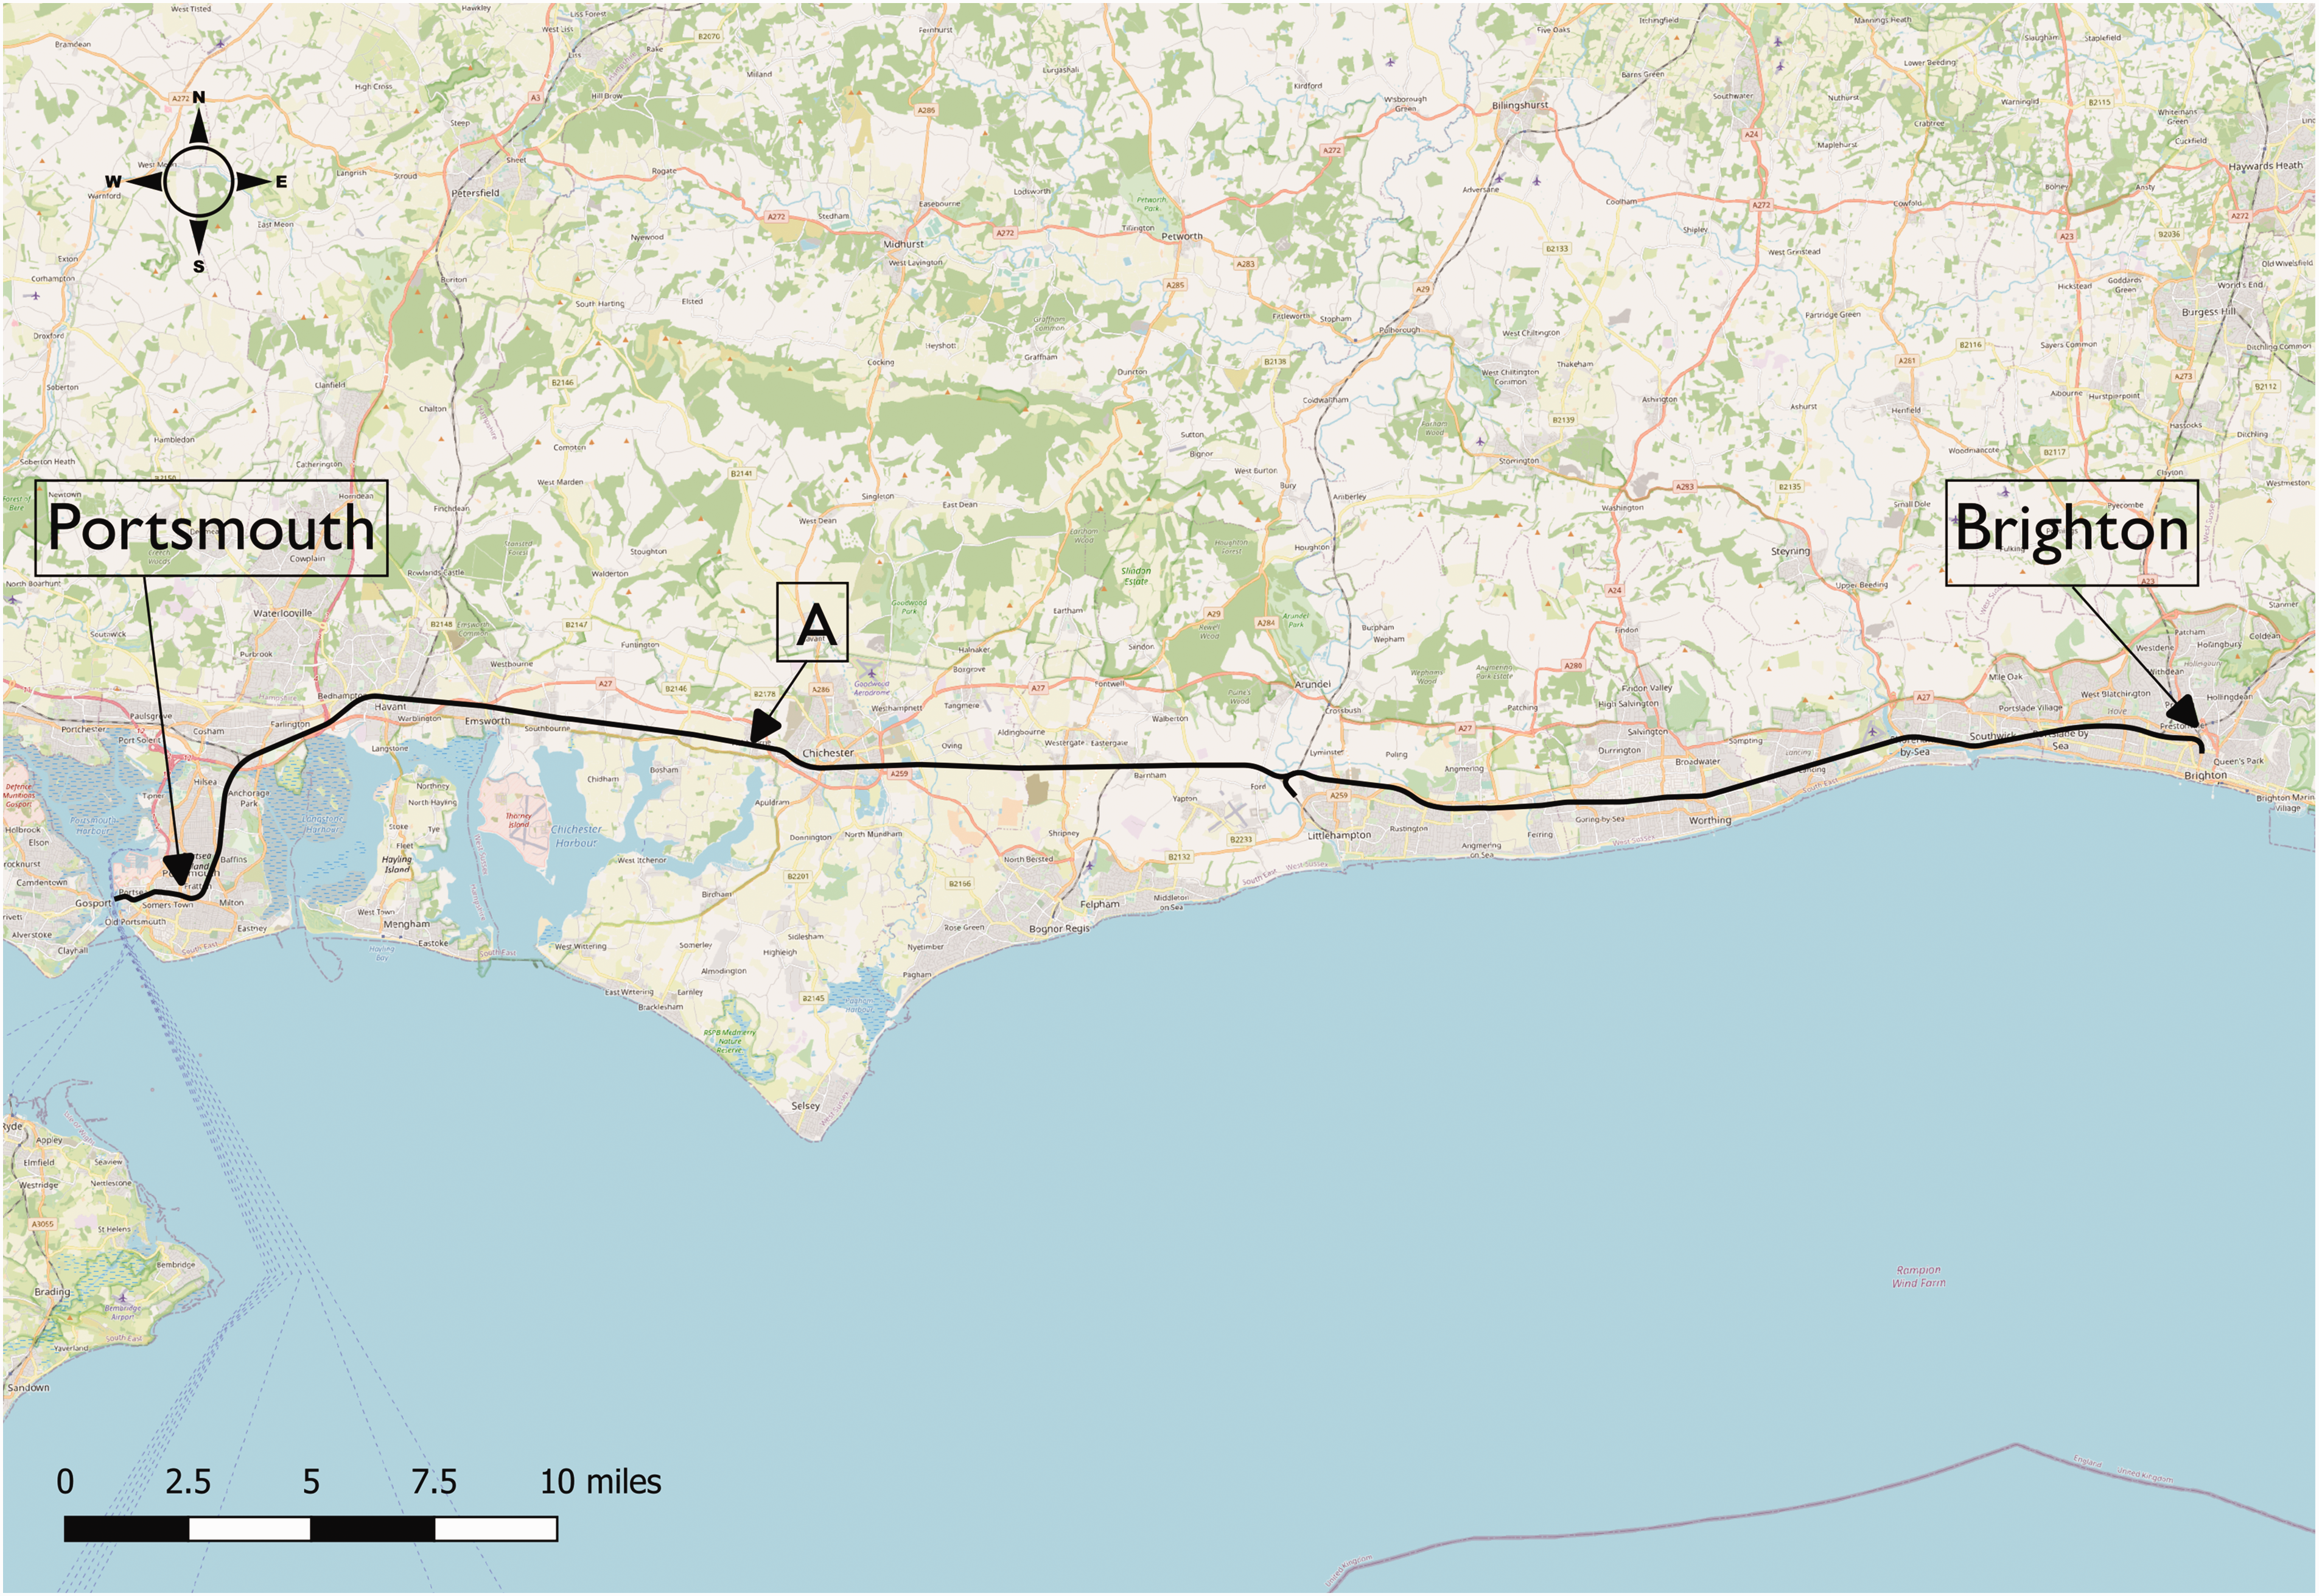
Location of the case study route.
Soft rail pads - ballasted with pad stiffness 120 MN/m
Stiff USP (USP1) with 250 MN/m2 (250 MN/m3 stiffness modulus for a 2.6 m long 0.25 m wide sleeper and 0.65 m sleeper spacing)
Soft USP (USP2) with 100 MN/m2 (100 MN/m3 stiffness modulus for a 2.6 m long 0.25 m wide sleeper and 0.65 m sleeper spacing)
Under-Ballast Mat (UBM) with 27 MN/m2 (9 MN/m3 for 3 m ballast-soil interaction width).
Ground-borne noise modelling
An accurate assessment of ground-borne noise inside buildings requires prediction models based on field measurements and engineering practice. 11 Such assessments, which are usually performed by acoustic consultants, are focused on specific sites along the railway route and result in an across-the-board quantification of ground-borne noise. Without a more detailed understanding of who will benefit and by how much, this is not always particularly useful. A detailed assessment of ground-borne noise inside buildings adjacent to the railway for a whole network route would require a huge amount of field measurement data and computational effort given the variation of operating trains and speeds, the type and condition of the track, soil formation and building design. A pragmatic approach has therefore been adopted in this paper, with ground-borne noise inside a typical single-family residence predicted at set distances from the track for three ground types expected to be encountered along the route.
Theoretical model
The ground vibration from a moving train, on a surface railway or in a tunnel, can be predicted using the Modelling of Train Induced Vibration (MOTIV) model. The ground is modelled as a horizontally layered semi-infinite medium (layered half-space). The model is formulated in the wavenumber-frequency domain and uses the stiffness matrices for the ground given in Kausel and Roesset. 12 The response spectrum of the track and the ground is calculated in a frame of reference moving with the speed of the train using the closed form formulation given in Sheng et al. 13 The response is calculated at any ground depth and an inverse Fourier transform (from the wavenumber to the spatial domain) is used to obtain the vibration level at any distance from the track. The track is modelled as beams supported by vertical springs with consistent mass, and the train is modelled as a multi-body vehicle with primary and secondary suspension. More information about the MOTIV model can be found in Ntotsios et al. 14
Model parameters
Soil properties were selected based on British Geological Survey data 15 and known soil parameters for a site adjacent to the route reported in Duley 16 (location A in Figure 1). In general, the geology of this region is characterized by a 0 – 2 m layer of ‘weathered’ topsoil consisting of soft sandy clay mixed with silt and gravel. This surface layer is usually removed when the railway line is constructed. The topsoil lies on layers of clay-based superficial soil deposits that can be 4-10 m thick. At greater depths, the area is characterized by London clay or chalk bedrock. To cover representative soil properties expected to be encountered along the route, three soil types were used in MOTIV. Ground type 1 has the properties of location A and is considered the median soil case for the area. Ground types 2 and 3 represent properties of the stiffest and softest expected soil case respectively.
The type of operating trains, speeds and track condition for the case study route were obtained from Network Rail and previous noise and vibration studies. The reference track is a typical ballasted track with sleeper spacing of 0.65 m and 3.2 m wide ballast-ground interaction area. The parameters of the train are based on the 4-car Class 377 EMUs that typically run on this line. The modelled speeds are 65 km/h and 140 km/h. The rail unevenness spectrum was obtained from measured data for a typical track in the UK. The vibration level at the ground surface was estimated at distances between 7.5 m and 200 m from the track centreline. Details of the model parameters are available in the accompanying online dataset.
Ground vibration predictions
The vertical vibration velocity level at the ground surface due to the passage of the train on the reference track is shown in Figure 2 for the three ground types and two speeds. The results are shown as the average one-third octave band spectrum at 7.5 m from the track during train passage. Ground type affects the vibration levels significantly, with the softest ground (type 3) showing higher levels of vibration at low frequencies (below 30 Hz). This is associated with the ‘cut on’ of the first wave localised in the upper surface layer of the soil (denoted as fundamental P-SV wave or Rayleigh wave). For ground type 3, this fundamental wave starts to propagate (‘cut on’) at lower frequencies than the other two ground types and shows higher vibration levels due to the lower stiffness. However, the level drops more rapidly at high frequencies, displaying vibration levels about 10 dB lower than the other ground types at frequencies above 30 Hz.
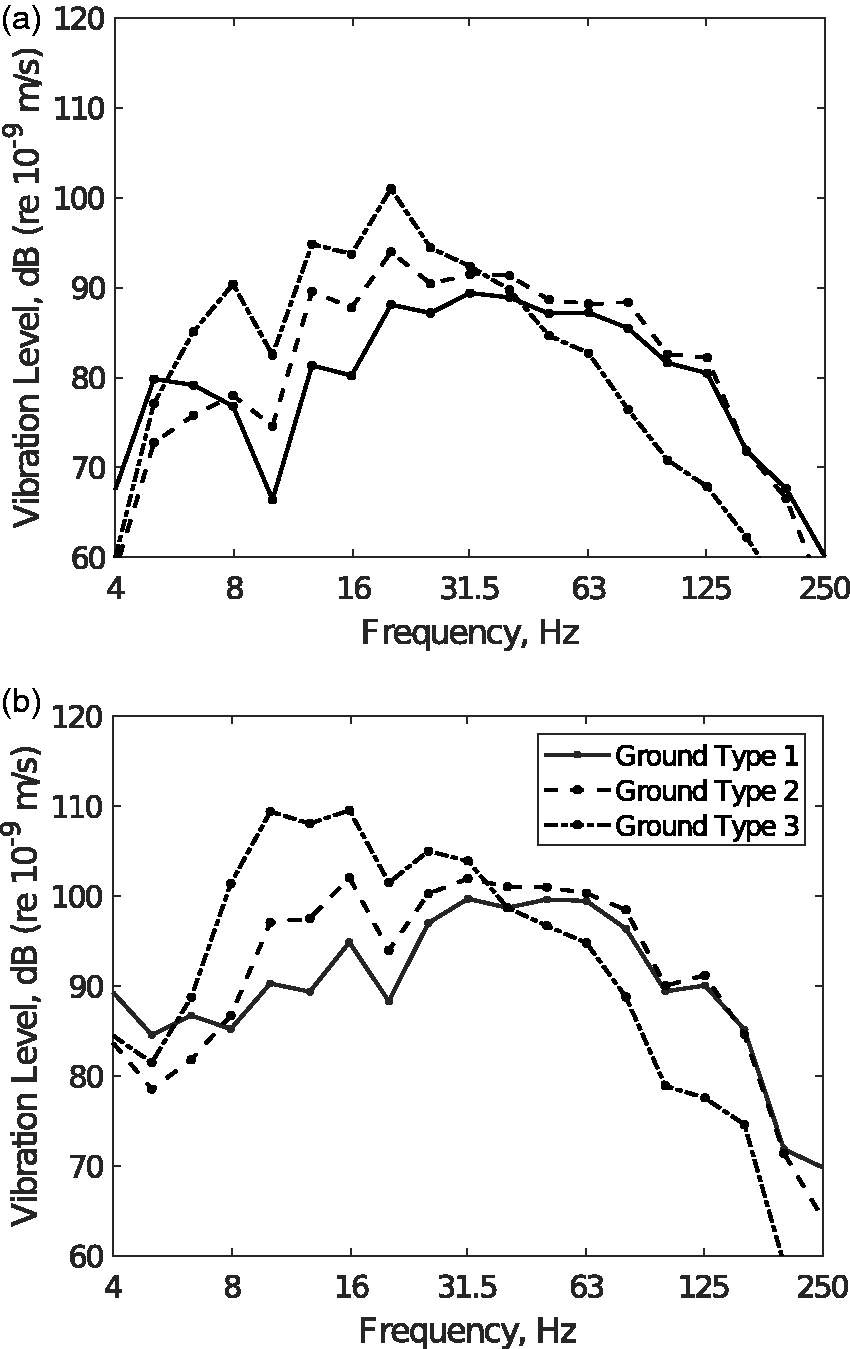
Ground vibration velocity level in one-third octave bands at 7.5 m from the track and for train speed: (a) 65 km/h and (b) 140 km/h.
Estimation of noise level within buildings
The vibration inside single-family residences on strip foundations is calculated according to the Detailed Vibration Assessment procedure.
17
Empirical data show the vibration at the base of these buildings to be about 5 dB lower than in the ground immediately outside. In Saurenman et al.,
17
the effects within buildings (floor and wall vibration) are also quantified. Once the vibration spectra of the floor or walls have been determined, the radiated noise spectrum and the sound pressure level can be estimated using the ‘Kurzweil formula’ approach:
17

Interior sound pressure levels were estimated at distances of 7.5 m, 10 m and then every 10 m to 200 m. Figure 3 shows the estimated sound pressure level for a family residence located 7.5 m from the track centreline, with the A-weighted equivalent sound pressure given in the legend. Although the soft ground (type 3) shows higher vibration levels at frequencies below 30 Hz, due to the A-weighting the equivalent sound pressure is more than 6 dB(A) lower than the other two ground types. Results for the reference track and each intervention for each ground type are available in the accompanying online dataset. Prior to subsequent analysis the sound pressure levels were linearly interpolated for each of the 12 maximum speeds on the route.
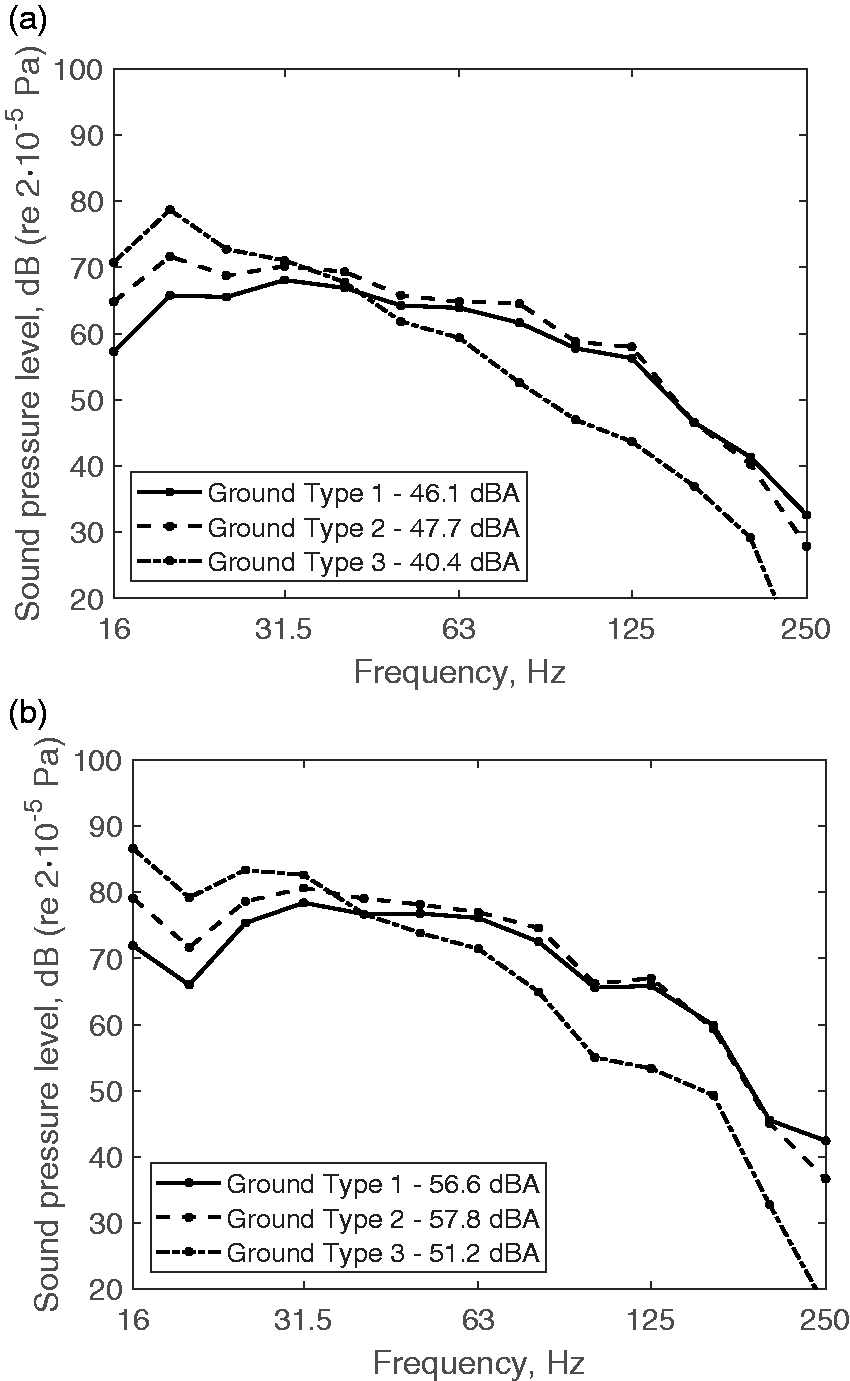
Sound pressure level inside a single-family residence: (a) 65 km/h; (b) 140 km/h.
GIS analysis
The outputs from the MOTIV model provide the predicted internal noise level within a typical domestic building, depending on the distance from the track and the assumed running speeds in operation on this route, for the reference track, several track interventions and three ground types. The purpose of the GIS analysis was to develop a transferable and automated method using open source tools (to ensure wide reproducibility), to identify the resident population affected by ground-borne noise and their expected level of exposure. Unlike earlier work,10,18 the method adopts a disaggregate approach at a high spatial resolution to better represent the actual ground-borne noise levels experienced by individuals, and consists of the following key steps:
generating a representation of the railway track and its characteristics identifying the location of resident population living close to the track determining the expected level of ground-borne noise experienced at each location for the reference case and each intervention and calculating the affected population.
Generating a representation of the railway track and its characteristics
A geospatial representation of the rail network in GB, known as the ‘Network Model’, was obtained from Network Rail (NR). The following three layers were used (see Figure 4):
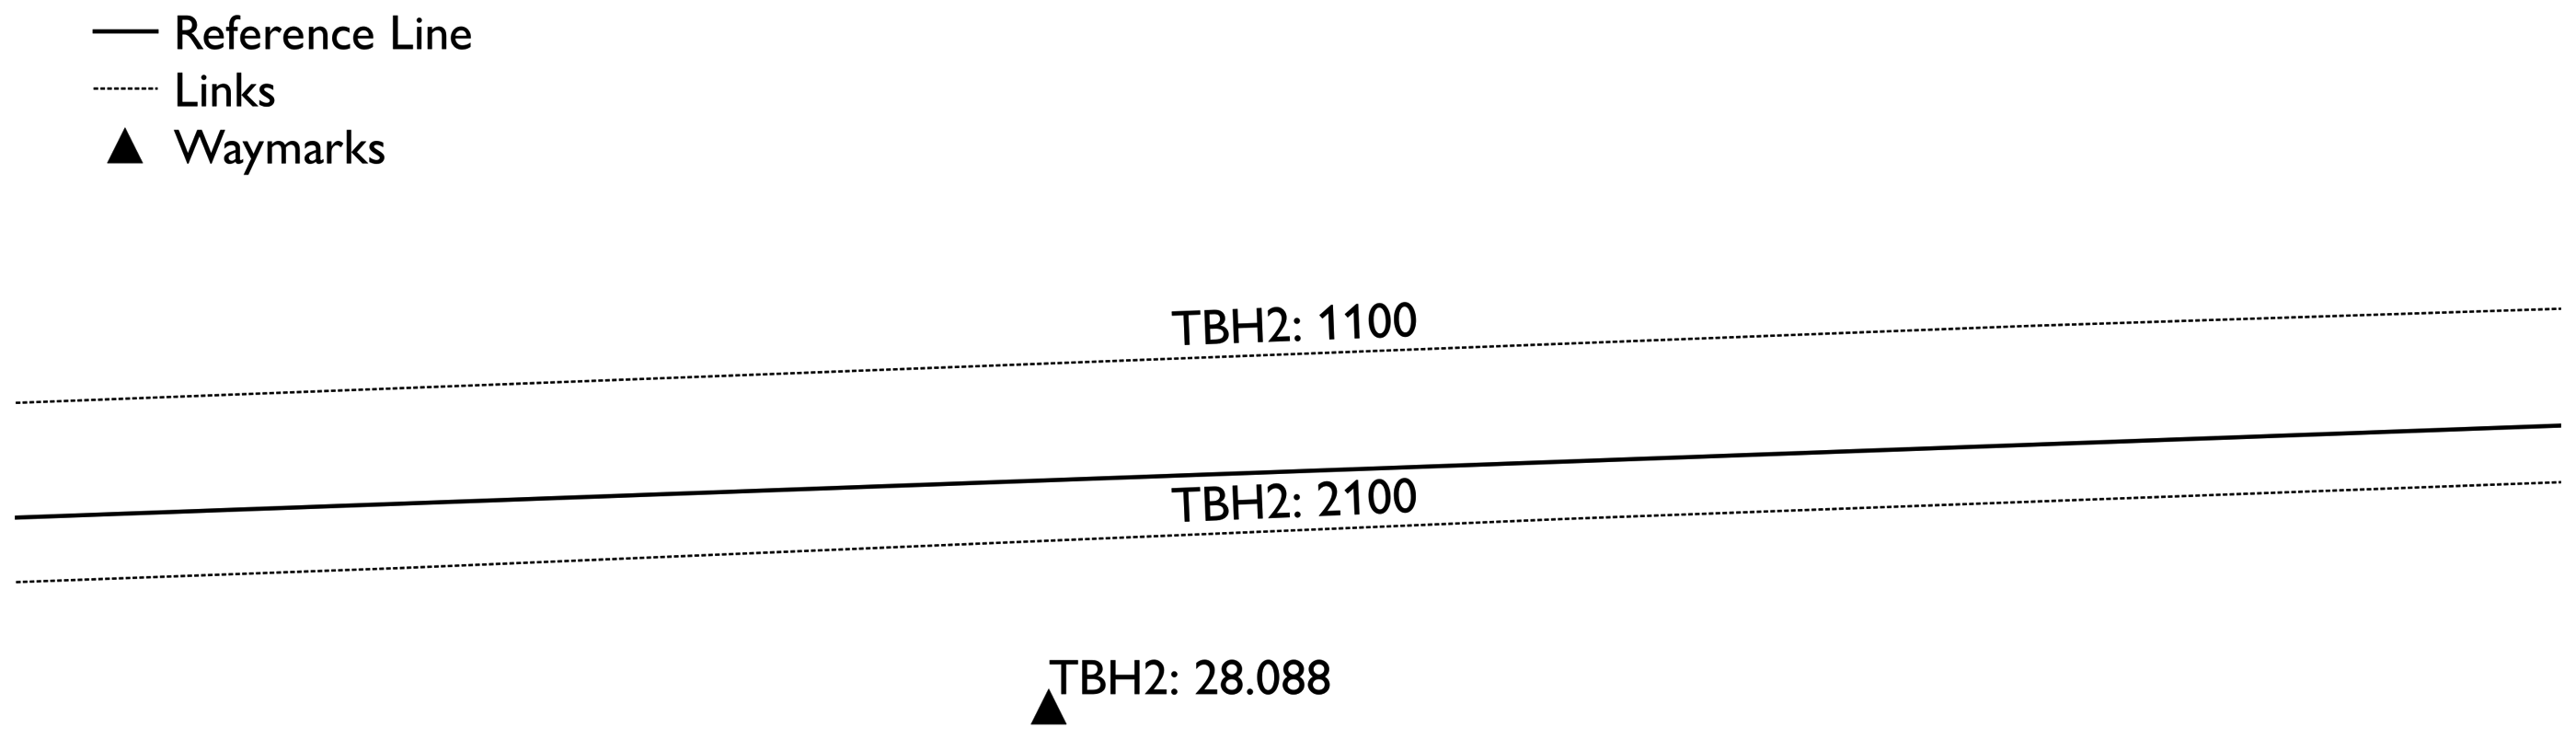
Network Model layers. ELR is TBH2. Links include the up main line (Track ID 1100) and the down main line (Track ID 2100). A waymark is at 28 miles, 880 yards.
Reference Line – a line for each Engineer’s Line Reference (ELR), representing the centre of a set of tracks. An ELR defines a specific section of a rail route and has a start and end measure, which is the distance in miles and yards from some datum. Three ELRs are required for the case study: TBH2, BLI1, and WPH2.
Waymarks – a point dataset identifying the location of physical mileposts for each ELR. There is a milepost every quarter of a mile (or 440 yards).
Links - the derived centre line of each track.
Information about the track is contained in a track database supplied by NR, consisting of some 680,000 track segments. This has no spatial data, so cannot be used directly within a GIS. However, as each track segment has an ELR and a start and end measure, a linear referencing process can be used to position the segments along the Reference Line. Using the QGIS plugin, LRS, 19 the reference line is first calibrated using the waymarks and then each track segment is located onto its matching ELR line. There can be multiple segments overlapping on the reference line, for example representing the up and down main lines. The actual track that a segment relates to is identified by its Track ID (TID). A total of 2,346 segments for running lines with the following top level TIDs were selected from the database and located on the reference line: 11xx (up main); 21xx (down main); 31xx (bi-directional main); 36xx (bi-directional other).
Identifying the locations of resident population
The smallest spatial unit for which population data is available in the UK is the unit postcode, which typically represents around 15 residential addresses. Each unit postcode has a centroid (a centre of all the address points within that postcode) to which the population is assigned. As the level of ground-borne noise generated by a passing train can attenuate rapidly over short distances, the noise experienced at the centroid is unlikely to be indicative of the exposure for every individual within that postcode. A method is therefore needed to distribute the population to the locations where they are expected to be living.
The University of Southampton’s GeoData Institute has developed the OpenPopGrid dataset for England and Wales, 20 using a dasymetric mapping process to distribute the centroid population across a 10 m resolution grid based on the location of residential buildings (as mapped in the Ordnance Survey’s Open Vector District dataset). The OpenPopGrid for the TQ, SZ and SU 100 km squares is loaded into QGIS as a raster grid and then converted to a vector layer of point features, with a point generated at the centre of each 10 m grid square and assigned the population value from the raster.
Calculating the expected level of ground-borne noise at each location
For each population point in the vector grid, the distance to the nearest track is obtained using a spatial join. A second join is used to obtain the database ID of the nearest track segment(s) (from the LRS process) to each point. As there can be multiple segments at the same location, additional points will be generated at this stage. For performance reasons, the point layer is then written to a table in a PostgreSQL database for further analysis. This database also contains the NR track database and the noise modelling outputs.
A SQL query is then run which groups the population points by their original ID and joins data from the track database (matched on the database ID of the segment) and the noise modelling results table (matched on distance and maximum running speed). When grouping, the extra population points generated during the earlier spatial join are eliminated, and an aggregate function is used to select the maximum train speed. For example, if the nearest point on the reference line has both up and down track segments present, then the highest maximum speed will be associated with the population point. Distances < 7.5 m are adjusted to 7.5 m (the lowest modelled distance) and remaining distances are rounded to the nearest 10 m (the resolution of the original population grid). The query results are then returned to QGIS as a SQL layer. Figure 5 shows the expected reference case ground-borne noise levels for ground type 1 at each population point on a small part of the route.
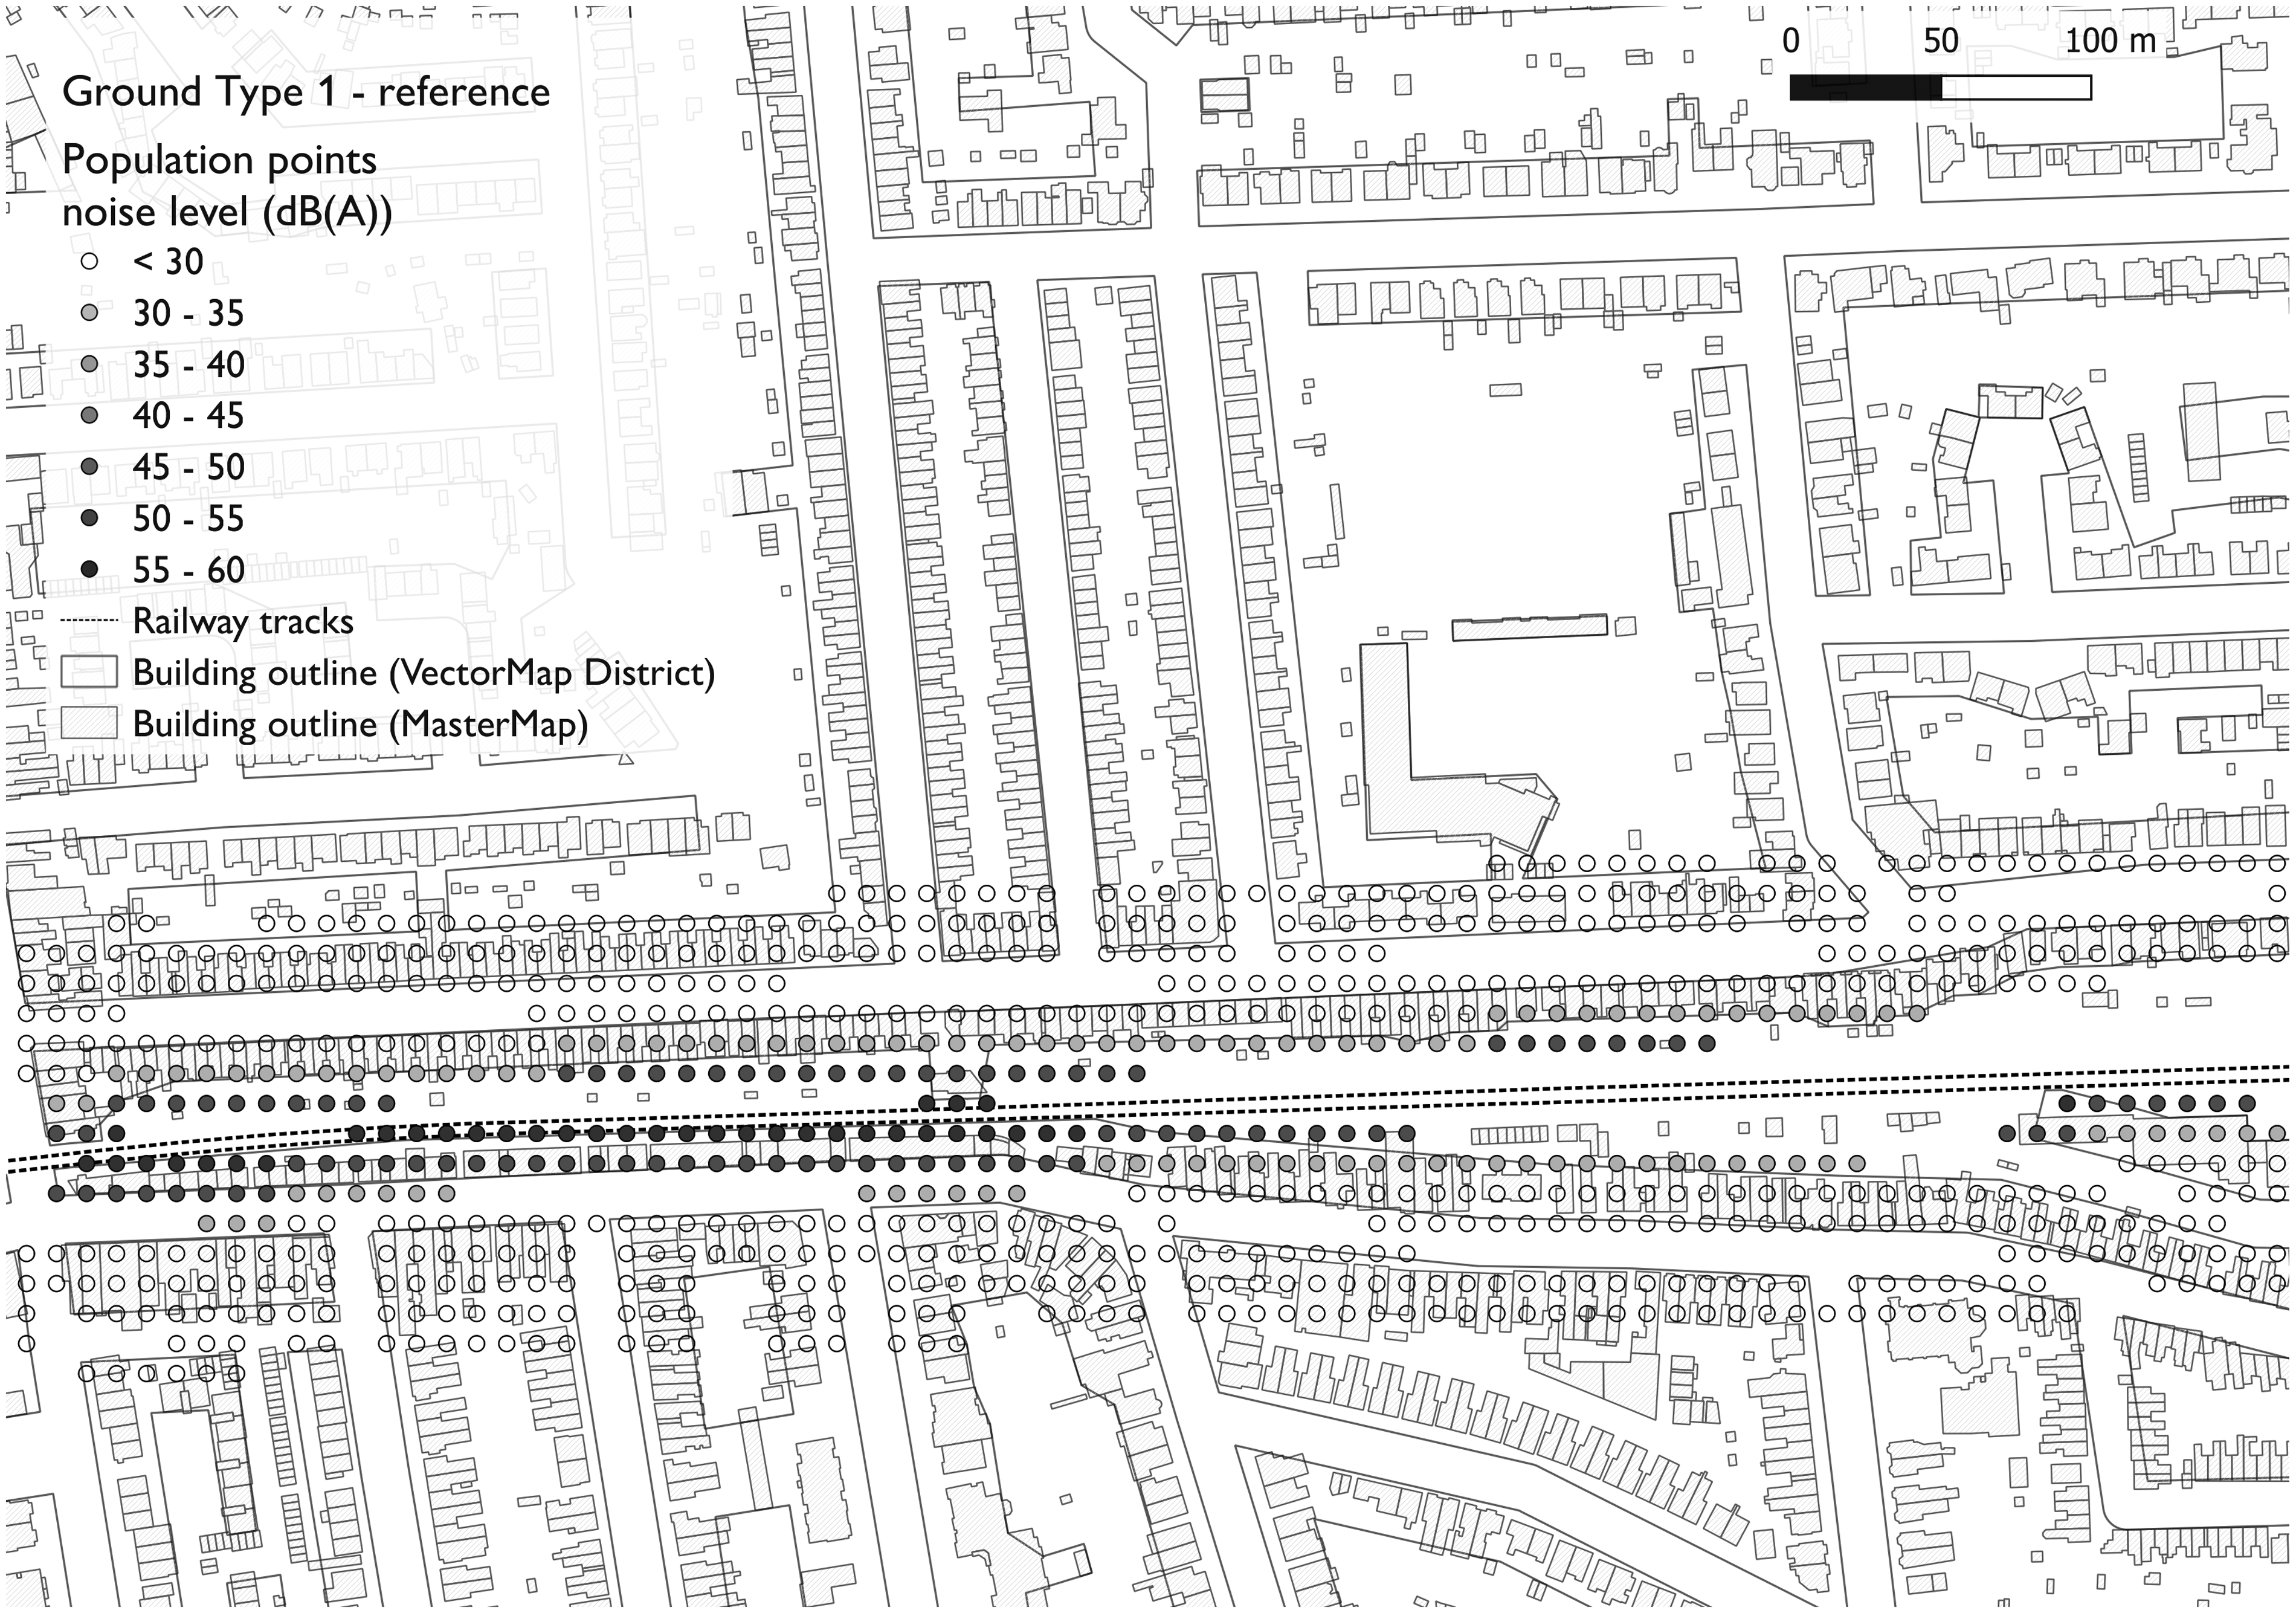
Expected reference case ground-borne noise levels for ground type 1.
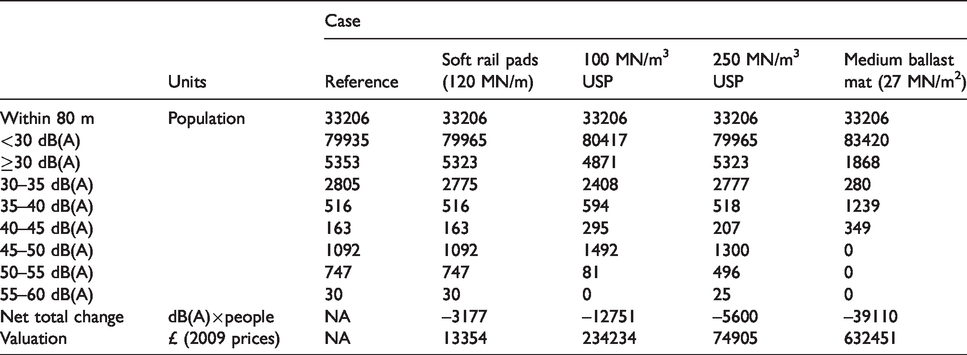
The steps described above, except for the Linear Referencing, have been automated with two custom QGIS models. The first processes the source Network Model and track database data, while the second performs the population point analysis. In the final stage of the GIS analysis, the SQL layer of population points is exported and further processed in R. The total population falling within 80 m of the track (the measure used in previous work), and within specific noise bands is then calculated. In addition, the monetary value of the change in noise level at each population point for each intervention is calculated (see ‘Valuation of socio-economic benefits/disbenefits’). A summary of the affected population by distance and noise level bands for ground type 1 is shown in Table 1 (full results are available in the accompanying online dataset).
Ground type 1 – Summary of affected population and valuation.
Life cycle cost modelling
Life cycle costing (LCC) is a cost-benefit analysis (CBA) approach to project appraisal that quantifies costs and savings which accrue to stakeholders in each year of the (notional) project life. Values for future years are discounted and then summed over all stakeholders and years to obtain an estimate of the present value of costs or benefits. For this analysis, track M&R costs and social benefits associated with ground-borne noise are considered.
Track maintenance and renewal costs (USPs)
Track M&R costs were obtained for both USP types using VTISM, assuming a 60-year project period. The base year for discounting is 2009, with a discount rate of 3.5% for the first 30 years and 3% thereafter. 21 Approximately 237,000 USPs would be required for the entire route, covering an equivalent of 95.8 track miles. The anticipated cost of installation per track mile is circa £37.1k, assuming a unit cost of £15 (2009 prices). All costs have been adjusted for inflation using the consumer price index-based GDP-deflator from the Department for Transport. 22 For a detailed CBA using VTISM refer to Ortega et al. 18
The main benefit of USPs is expected to be a reduction in the volume of M&R, and VTISM indicates fewer renewal interventions over the simulated period against the base scenario. The main savings (in percentage terms) arise from reduced sleeper and reballast traxcavation (removal with heavy excavation machinery), switches and crossings (S&C) renewal, and complete renewal with traxcavation. Conversely, rail renewal requirements increase by 7.8–8.4%. For track maintenance, VTISM indicates a reduction of S&C tamping and stone blowing (24.6–25.4% and 6.70–9.40% respectively) and an increase in plain track tamping and rail grinding. Inspection activities are assumed identical for all scenarios, representing 7.1–7.8% of total costs for this route. The highest LCC savings in absolute terms, accounting for 86% of total discounted savings, arise from the reduction in volume of S&C renewals, complete renewals with traxcavation, and sleeper and reballast traxcavation.
Based on this analysis, irrespective of the type of USP selected, the payback period is approximately three years from first installation (see Figure 6). If the investment for the entire route is budgeted in 2009, then the payback period will be four to five years longer, but the accrued benefits are projected to be about 4% greater overall. The total savings are around 8–9%, with the equivalent absolute figure normalised per single track mile c. £137–145k.
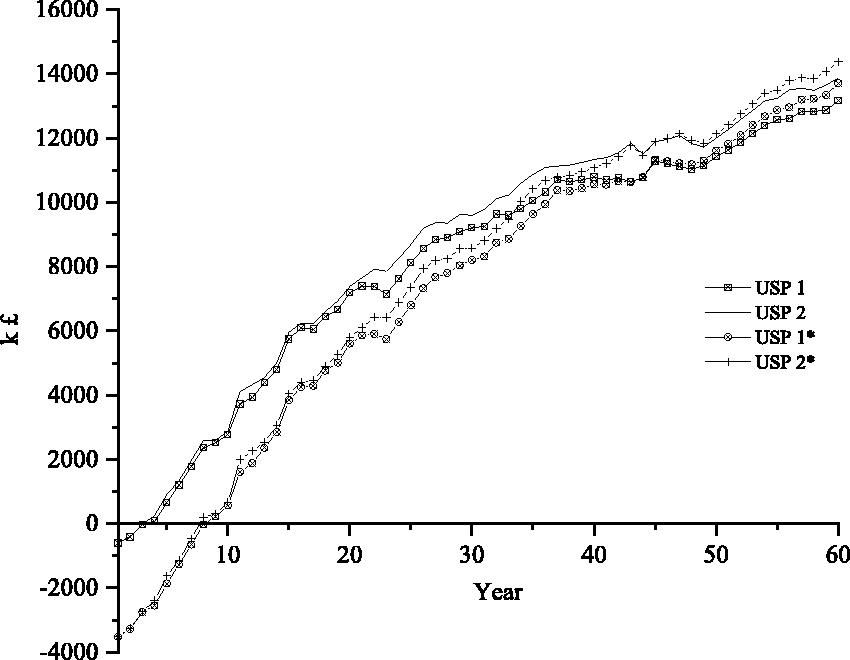
Accumulated M&R benefits from the inclusion of stiff or soft USPs. * denotes entire investment made in 2009.
Valuation of socio-economic benefits/disbenefits
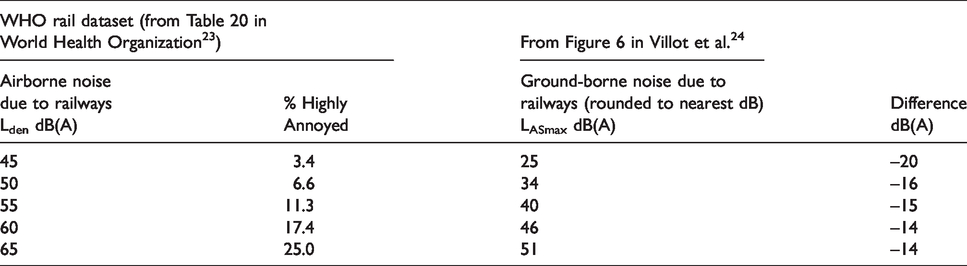
Due to the absence of any available data on the monetary value of ground-borne noise, previous work has assumed the valuation to be the same as that for airborne noise.10,18 However, in practice there are substantial differences between ground-borne noise which is experienced inside a property (assessed as maximum level during a train pass-by) and airborne noise that is measured outside a property (assessed as long-term equivalent level). The relationship between exposure to either type of noise and level of annoyance has been established in previous studies. The percentage of people expected to be highly annoyed by railway airborne noise at various levels (obtained from Table 20 in World Health Organization 23 ) is shown in Table 2. Also shown is the level of railway ground-borne noise required for the same level of annoyance (obtained by digitisation of Figure 6 in Villot et al. 24 ) This indicates that the same percentage of people would be highly annoyed with ground-borne noise at levels approximately 15 dB lower than that for airborne noise. UK-based values for a 1 dB(A) change in surface transport-related airborne noise occurring within several 5 dB bands are given in Table 5 of Nellthorp et al. 25 Each of these bands was adjusted downwards by 15 dB, thus giving a set of per person per annum values appropriate for applying to changes in ground-borne noise, as shown in Table 3.
The association between exposure to railway noise and annoyance (% highly annoyed).
UK-based values for transport-related noise, 2002 prices and values. Airborne noise intervals and values from Nellthorp et al. 25 Ground-borne noise interval low and high bounds reduced by 15 dB(A).
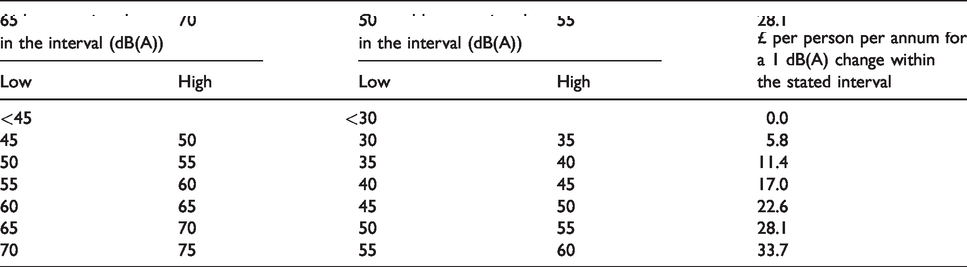
The value of each 1 dB(A) change (increase or decrease) between 30 dB(A) and 60 dB(A) is determined by which one of six 5 dB(A) bands the change occurs within. There is assumed to be no value to changes that occur below the threshold of 30 dB(A). The noise level change between the reference case and intervention for each population point and each intervention was allocated across the value bands. For example, a decrease of 21.3 dB from 57.5 to 36.2 would be split as follows: –2.5 dB in the 55–60 band, –5 dB in the 50–55 band, –5 dB in the 45–50 band, –5 dB in the 40–45 band and –3.8 dB in the 35-40 band. The change within each band was then multiplied by the value for that band and the population associated with the population point. The values were then summed for all population points. The calculated valuations for ground type 1 are shown in Table 1 (additional tables are available in the accompanying online dataset). Also shown is the net total change for each intervention. This is the change in noise level (at or above 30 dB(A)) summed across the affected population.
Results
The results are presented in terms of the net economic benefit of various track interventions, taking account of installation costs, life-cycle costs and socio-economic benefits (see Table 4). Several conclusions can be drawn. First, the installation of soft USPs (USP2) generates a higher NPV and S-PVB (from a reduction in ground-borne noise) than stiff/medium USPs (USP1). Second, only the installation of soft USPs on ground type 1 could be justified on the basis of ground-borne noise reduction alone. For stiffer USPs, the benefits (if present) are relatively small compared to the PVC. If investment for the entire route is budgeted in 2009, and it is assumed that no further installations will be needed over the 60-year period, the social benefits arising from soft USPs or UBMs on ground types 1 and 2 would be sufficient to offset the investment.
Comparison of investment options (2009 prices).
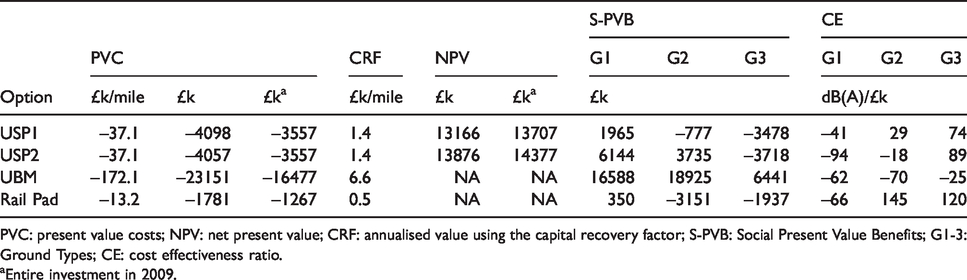
PVC: present value costs; NPV: net present value; CRF: annualised value using the capital recovery factor; S-PVB: Social Present Value Benefits; G1-3: Ground Types; CE: cost effectiveness ratio.
aEntire investment in 2009.
As laboratory element test data is not available for UBMs and rail pads, it was not possible to calculate their impact on LCC. Instead, the capital recovery factor (CRF) has been used to determine annualised values that can be evaluated and compared. The CRF for each option has been normalised on a per mile basis to enable a comparison of interventions where the absolute levels of investment differ due to some sections of track being replaced multiple times throughout their lifecycle. The CRF of USPs suggests that a minimum annual revenue stream (capital plus interest earned) of £1.4k/mile for the 60-year period is necessary to justify their investment. For UBMs the equivalent figure is nearly five times greater. Although the installation of soft rail pads has a considerably lower annualised cost, they could bring a social disbenefit of up to £3.2 million for the route depending on the ground conditions present. The extent that this would be offset by M&R benefits is currently unknown.
The non-user benefits account for less than 30% of NPV irrespective of the underlying ground conditions and USP stiffness, with greater benefits expected for ground type 1. UBMs and soft USPs generate the most improvement in terms of ground-borne noise, although the LCC profile of the former could not be fully examined to determine if a business case can be made. There is also no real evidence of the efficacy of using UBMs on earthworks, with applications to-date limited to points of transition between normal track and hard substructures (bridges, tunnels) or other special sites (S&Cs, cuts, or elevated stations). 26 However, experience from an installation in a tunnel section of the Gospel Oak line in London demonstrated reduced ballast degradation and lower ballast depth requirements. 27
To better quantify and compare the effectiveness of different interventions in terms of ground-borne noise improvement, a Cost Effectiveness Analysis (CEA) was completed. This approach is increasingly adopted in public health and healthcare settings, 28 where CBA is considered inappropriate. Here, we are trying to answer the question: ‘what is the outcome of each intervention per monetary unit spent?’, by devising a utility-cost ratio. We propose an incremental Cost Effectiveness (CE) index based on the net dB(A) change (at or above 30 dB(A)) against the status quo totalled across all the population affected, divided by the annualised change in costs from a given intervention (see Table 4). A large negative CE ratio indicates higher relative effectiveness, while a positive ratio indicates that an intervention is worse than the status quo.
The CEA analysis suggests that soft USPs would be the most effective by delivering a net change of 94 and 18 dB(A)×people per annum for each £1,000 invested for ground types 1 and 2 respectively. The next most effective option would be UBMs, with a potential net change of up to 70 dB(A)×people per annum for each £1,000 spent. Interestingly, UBMs are the only intervention to have a positive effect irrespective of the ground conditions present. Lesser benefits are anticipated from the use of stiff/medium USPs. Theoretically, 3.1-5.1k people (c. 1.3–2.2k households based on 2009 average occupancy of 2.36 29 ) would need to benefit to break-even on the investment of soft USPs. However, these findings may change if the impact of greenhouse gas emissions, 30 airborne noise or improvements in ride quality for rail users 18 were taken into account. It should also be noted that installation of soft USPs could result in some non-users experiencing an increase in ground-borne noise in locations where soft ground conditions are present.
Conclusions
Previous assessments of track interventions have focussed either on accurate modelling of noise and vibration benefits, or on their economic impacts. The methodology described in this paper combines expertise in both areas to improve the social benefit financial inputs into the LCC analysis. The GIS analysis of affected population for ground type 1 (of known characteristics) shows that 33,206 people live within 80 m of the track (see Table 1). Using the previous approach for medium/stiff USPs, where an across-the-board 5 dB(A) reduction valued at £8.47 (2002 prices) per person per dB (based on average occupancy of 2.36) was assumed, 18 a PVB of £43.79 million would be indicated. In contrast, the new methodology suggests that only 5,353 people would experience noise levels at or above the 30 dB(A) threshold in the reference case, producing a PVB of £1.97 million (a 22-fold reduction). Previous work has also assumed that USPs will always result in a ground-borne noise reduction, while the results presented here show that under some ground conditions USPs can lead to disbenefits. It is also potentially useful to know if an intervention produces social benefits across all modelled ground types (as with UBMs in this paper), given that there will always be uncertainty as to the actual ground conditions present along the length of an entire route.
While these results suggest that the simplistic approach previously used has over-estimated social benefits, it is possible that the new methodology may under-estimate the affected population and their exposure. For example, there can be several population points within the same property with differing exposure levels, dependent on their distance from the track. In reality, everyone in a single-family dwelling might be expected to experience the same level of noise disturbance. However, offsetting this are several factors that may over-estimate the affected population and their exposure. These include: population points that are closer to the track than the actual buildings due to the resolution of the OpenPopGrid data; train running speeds that are lower than the maximum speeds, especially in the vicinity of stations where there will also be a higher population density; and in some domestic properties individuals will experience lower noise levels, for example in a block of flats.
Future work will seek to address some of these issues as well as enhancing the approach to take account of the impact of cuttings and embankments. The methodology will also be extended to analyse airborne noise. The possibility of creating an automated tool incorporating the noise and LCC models and the GIS analysis, perhaps implemented on the Data and Analytics Facility for National Infrastructure (DAFNI), 31 will also be considered. This could be via an ontology-based assessment framework which is being developed by other members of the T2F team. 32 These developments will allow infrastructure managers to make informed decisions, especially for new or substantially upgraded lines, where otherwise there could be pressure to install countermeasures that may not be cost effective. While the methodology has been demonstrated for a single case study, it could be readily extended to other routes and applied in other countries.
Footnotes
Acknowledgements
The authors are grateful to Network Rail for provision of industry data and expertise. Base map data is ©OpenStreetMap contributors. OS MasterMap Topography Layer [GeoPackage geospatial data], scale 1:1250, tiles: TQ, updated: 28 November 2019, Ordnance Survey (GB), using: EDINA Digimap Ordnance Survey Service, <![]() >, downloaded: March 2020. Contains OS data ©Crown Copyright and database right 2020.
>, downloaded: March 2020. Contains OS data ©Crown Copyright and database right 2020.
Data accessibility statement
Declaration of Conflicting Interests
The author(s) declared no potential conflicts of interest with respect to the research, authorship, and/or publication of this article.
Funding
The author(s) disclosed receipt of the following financial support for the research, authorship, and/or publication of this article: This study was financially supported by the Engineering and Physical Sciences Research Council (EPSRC) through the Track to the Future programme grant (EP/M025276/1).