
Abstract
Two non-electrified railway lines, one in Norway and the other in the USA, are analysed for their potential to be electrified with overhead line equipment, batteries, hydrogen or hydrogen-battery hybrid powertrains. The energy requirements are established with single-train simulations, including the altitude profiles of the lines, air and rolling resistances, and locomotive tractive-effort curves. The composition of the freight trains, in terms of the number of locomotives, battery wagons, hydrogen wagons, etc. is also calculated by the same model. The different technologies are compared by the criteria of equivalent annual costs, benefit–cost ratio, payback period and up-front investment, based on the estimated techno-economic parameters for years 2020, 2030 and 2050. The results indicate the potential of batteries and fuel cells to replace diesel on rail lines with low traffic volumes.
Introduction
Increased electrification of rail transport is considered in many parts of the world as a measure to curtail emissions and adapt the sector to increasingly stringent environmental regulations.
Economically, electrification can reduce energy costs due to the lower price of electricity compared to diesel fuel. Maintenance of an electric locomotive is also cheaper than that of its diesel equivalent, since the former has fewer moving parts. In some markets, such as Norway and the rest of Europe, diesel fuel is especially expensive due to excise taxes; in other ones, such as the USA, diesel is cheaper, but its price is volatile due to oscillations in the price of crude oil. On the other hand, electrification by overhead line equipment (OLE) requires major investments in infrastructure with many years of payback period (PBP),1,2 which may offset the advantages of cheaper energy and maintenance.
Only about one-quarter of rail lines worldwide are electrified with OLE, 3 though they represent a higher share of usage since electrification is prioritised on lines with heavy traffic. There is ample spread in the rate of OLE electrification among countries, from Switzerland's 99%, 1 to the EU's 62% 4 and the USA's 1%. 1
The general trend towards requiring lower emissions has brought some authorities, such as the Norwegian government, to investigate the possibility of electrifying remaining diesel-powered lines. 5 This is also seen as a way to make the railway system more flexible, by allowing electric trains to be used on the entire Norwegian rail network, of which already 80% is electrified with OLE. 5
Previous studies on hydrogen trains have focused on the technological feasibility6–8 and impact on emissions,9,10 and recently there have been reports considering also the economic aspect of hydrogen trains for specific cases,11,12 but little consideration has been given to mainline freight rail applications; this paper intends to widen the perspective by comparing multiple technologies for two very different cases.
This paper focuses on freight railways because this rail sub-sector constitutes the main economic activity on both analysed lines, and frequently freight trains rely on diesel power for propulsion even on electrified lines when part of their route is not electrified. The same technique can be applied to passenger railways, but this is beyond the scope of the paper.
All alternatives are evaluated with the aid of single-train simulations to establish energy requirements, considering volume and mass implications; the results are then used to calculate potential capital and operating expenditures related to infrastructure, rolling stock and energy.
This study is applied to two lines with very different characteristics; however, other lines may not necessarily produce results that align somewhere between the two chosen extremes.
The Nordland line in Norway is a 731 km long, single-track rail line from Trondheim to Bodø, with a ruling grade of 19‰. 13 This line features passing loops dimensioned for 600 m, constraining maximum train length; furthermore, it features 154 tunnels and 293 bridges. 14
The US route is a 2883 km long, double-track line from Kansas City to Los Angeles, with a ruling grade of 22‰. 15 With no need for passing loops, trains can be much longer; the line features one single tunnel. 16
Method
We first determine the energy requirements and train compositions for both lines and all considered technologies by means of Single-Train Simulations (STS); the resulting technical data will then be used to calculate the economic performance.
Single-train simulations
STS is a well-established method to calculate energy requirements for trains over specific routes
17
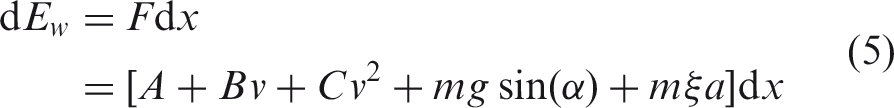
: typically, Lomonossoff's equation8,18,19 is solved over the journey to determine the duty cycle and energy requirements. Lomonosoff's equation is

Parameters A and B, related to rolling resistance,20,21 are found from empirical correlations given by Lindgreen and Sorenson
22
for Sgis wagons (three 20-foot containers, four axles). Parameter C, related to air resistance,20,21 is found from another empirical correlation in the same reference


The lines are described as a series of segments with given slope, length and speed limit. In order to obtain the train's speed profile, a discretisation over the line is performed with a step of 10 m; the speed profile is first initialised to the speed-limit profile, before additional calculations, outlined next, are performed to determine the speed profile and duty cycle. All trains start their journey at zero speed, and acceleration is calculated by Lomonosoff's equation (1); speed is finally calculated by integrating acceleration over the entire line, under the constraints of speed limits and maximum acceleration. In this STS, trains will limit acceleration and deceleration to a maximum value of 0.1 m/s2, typical for freight trains. 1
The net energy at wheel level provided by the locomotive over an infinitesimal segment
Note that
The net energy consumption for the whole train movement is then found by integrating
Line data
The required line data are a set of vectors describing the length
For the Nordland line, data are extracted from the railML model of the Norwegian national railway network made publicly available by Bane NOR
13
; the line profiles are presented in Figure 1.
Height, speed and power profiles (for a nominal diesel train) for the Nordland line, from Trondheim to Bodø.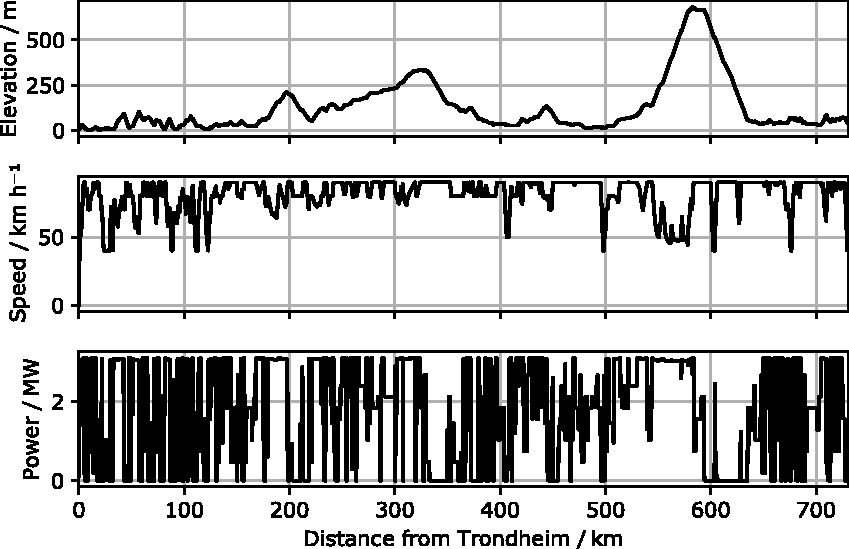
For the US route, data were digitised from printed altitude diagrams;
16
the line profiles are shown in Figure 2.
Height, speed and power profiles (for a nominal diesel train) for the US route, from Kansas City to Los Angeles.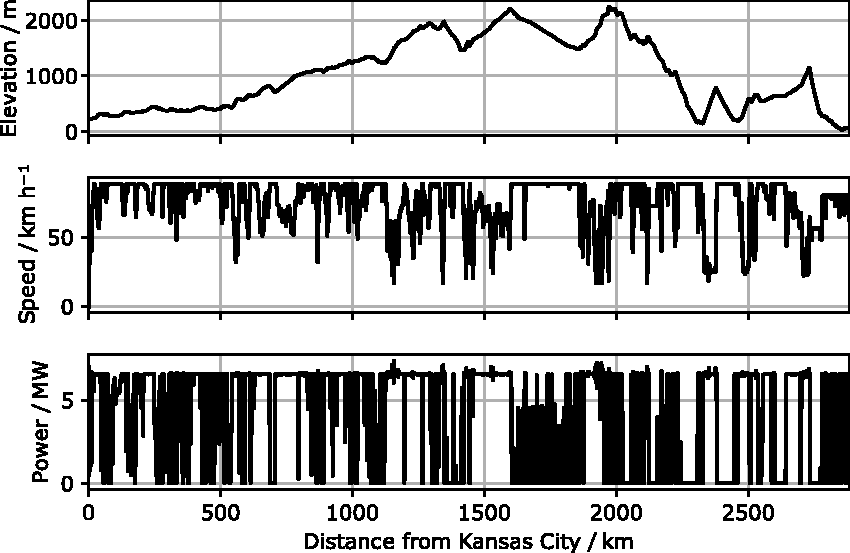
For both lines, the speed-limit data series was extracted from the nominal speed limits of freight trains, provided in the respective documentation sources. If, in any segment, the calculated combined resistance is larger than the tractive effort of the train's locomotives, speed will be reduced accordingly.
Train data
The required train data are the total train length L, the number of wagons n c , and the total mass m.
The specifications of the locomotives considered in this study.
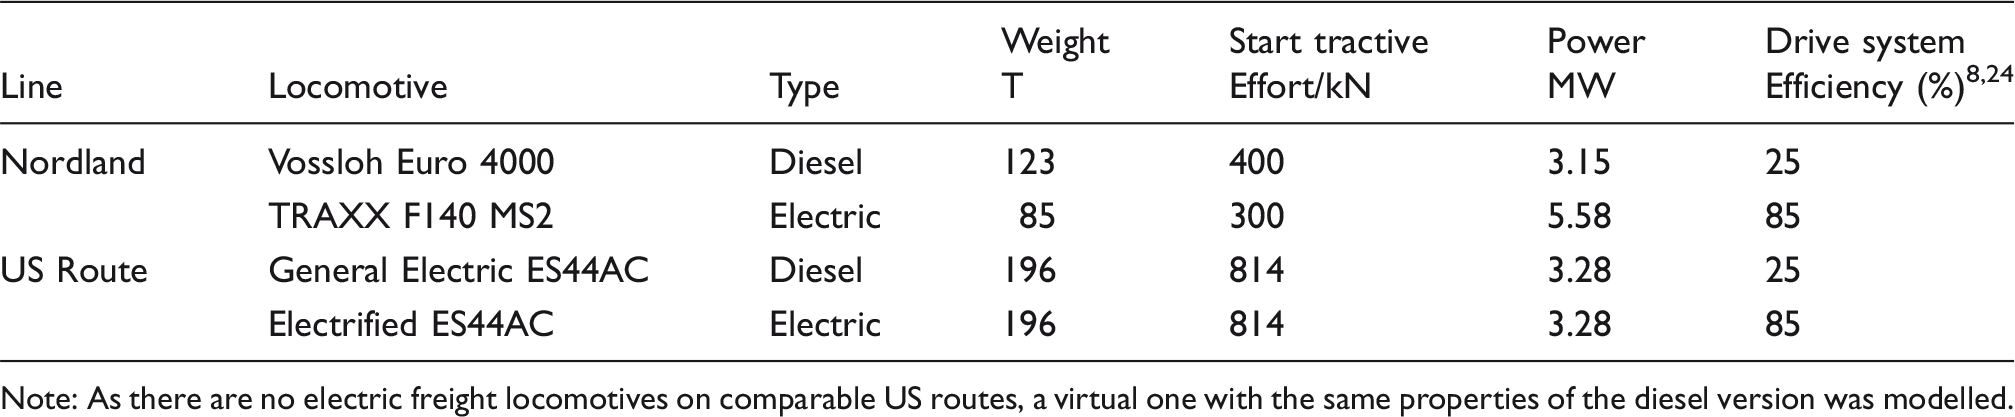
Note: As there are no electric freight locomotives on comparable US routes, a virtual one with the same properties of the diesel version was modelled.
Trains on the Nordland line have 28 cargo wagons corresponding to 575 m and 1000 t. 13 If trains are modified with battery or hydrogen wagons, these will replace some of the cargo wagons, so that the total length of the train shall not increase, otherwise it would not fit in the passing loops.
There are 3000 complete train movements yearly on the Nordland line, counting both directions. 5 If battery or hydrogen wagons are used, the number of train movements will be increased to compensate for the lower cargo capacity; as long as the increase is limited to a few percent points, the Nordland line is able to handle the additional capacity. 5
For the US route, we assume a representative average of 73 wagons (obtained after communication with railways), each weighing 80 t. Any battery, hydrogen or fuel-cell wagons will simply be appended to the train, leaving the cargo section unmodified, which we deem a reasonable assumption given that an average train is modelled and addition of wagons is not excessive. In the US, the loading gauge is larger and the maximum axle load is higher compared to Norway, allowing for larger and heavier wagons. However, we have not considered this impact and assumed the same wagons for both routes, based on the smaller and lighter Norwegian case, to enable easier comparison between the two. The exact number of train movements on the US route is confidential information, but can be estimated from public documents on railroad crossings. 25 We assume 12,000 complete train movements yearly on the US route, counting both directions. Note that these numbers can vary significantly from year to year, according to the state of the US economy.
Techno-economic parameters
Here we present the data to quantify the economic performance of different technologies. Costs of items that are identical for all alternatives, such as maintenance of freight wagons and tracks, have no influence on the comparison and will not be presented.
Diesel propulsion
Fuel prices are variable, and are set to 13 NOK/L for Norway (agreed with operators) and 2.5 $/gal for the US (rounded average cost from 2007 to 201626). These prices correspond to energy costs “at the wheel” (i.e. already netted for drive-system efficiency) of 606 $/MWh (Norway) and 264 $/MWh (US).
Note that diesel prices in the US are volatile, and only a few years ago (2011–2013) they were over 3 $/gal for railroads.26,27 In Norway, as in most European countries, fuel prices are high because of excise taxes, which also make the price more stable.
A diesel locomotive is expected to require an investment of 25.1 MNOK (2.95 M$) and to have a standard useful life of 20 years; its maintenance is assumed proportional to its travelled distance, 45.12 NOK/km or 5.31 $/km.2
Furthermore, Norway has a specific tax on diesel transport, which for freight trains is 20.72 NOK/km, or 2.44 $/km.2
Electric propulsion
The cost of electric power for rail applications in Norway is set to 310 NOK/MWh, 2 or 36.47 $/MWh. For the US, we assume that an electrified US route would be able to buy electricity at the 2016 industrial rate of 67.5 $/MWh. 28
Electric locomotives are estimated to require an investment of 34.9 MNOK (4.1 M$), with maintenance costs of 25.78 NOK/km (3.03 $/km) and a lifetime of 20 years. 2
OLE electrification
We set the cost of OLE installation at 15 MNOK/km (1.76 M$/km) for the Nordland line, as this value has been used by the Norwegian government to allocate three billion NOK to electrify about 200 km of tracks. 29
This estimate is maintained unchanged for OLE on the US Route. Whereas the cost for the overhead line may increase because of the double track, the Nordland line features over 150 tunnels, whereas the US route only has a short one and does not cross major urban areas between Kansas City and Los Angeles; labour costs will also likely be lower.
Yearly maintenance of the OLE system was quantified by the Norwegian Railway Authority to 50 NOK/m, or 5.88 $/m. The lifetime is estimated at 75 years. 2
Power losses in the railway transmission system are about 5%-10% 30 ; we assume 5% for new electrification systems. This comes in addition to the drive-system losses indicated in Table 1.
Battery electrification
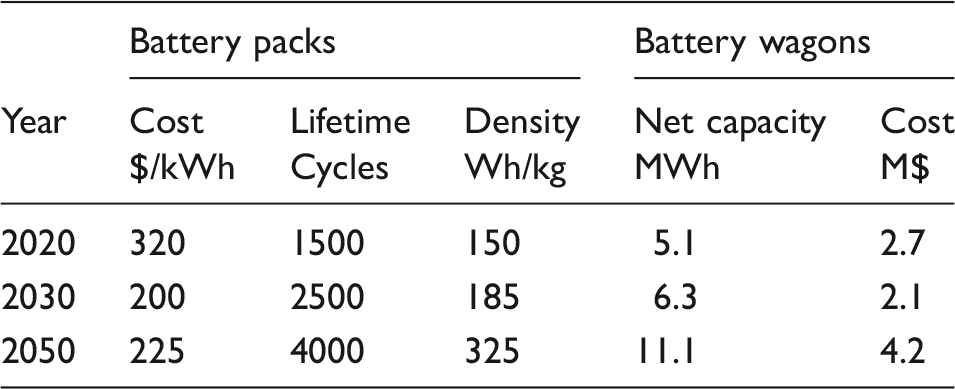
Batteries are assumed to be installed on standard flat wagons with a tare weight of 23 t and a maximum load of 57 t. 31
Battery technology is developing rapidly, with increasing energy densities and decreasing costs.32–34 Data for battery lifetime are highly variable across sources, depending primarily on the type of battery and operating conditions. There is a significant spread in the opinions of academic and industry experts on the future development of the technology. 35
The round-trip energy efficiency of batteries also varies with type of battery and operating conditions, but is in general high; to account for the losses due to the thermal management system that will be necessary in such a large application, we set it constant, at a relatively low 80%.
The number of necessary battery wagons is found by increasing it until their stored energy is sufficient for the train's journey according to the STS.
Battery electrification with en-route fast charging
Batteries can be made smaller if the train stops regularly for fast charging; in this case, we must consider the costs for charging infrastructure, power tariffs and time the train is forced to remain idle.
Fast charging is usually implemented with dedicated DC charging stations; according to a press release by leading car manufacturers, such fast chargers cost approximately 600 $/kW 36 ; we assume a lifetime of 20 years.
Fast-charging stations will be subject to power tariffs, which in Norway are specified by the national grid operator to be 393 NOK/kW/year (46.2 $/kW/year) 37 ; this value will be assumed to be representative of the US as well.
Fast-charging stations will be dimensioned to be able to fully charge a train within 1 h. Waiting time itself has a cost, which is quantified at 13.37 NOK/h/t (1.57 $/h/t), referring to the cargo weight only. 2
Electrification with hydrogen fuel cells
In this case, a train will require extra wagons for hydrogen tanks; again, we will assume they are installed on a flat wagon with a capacity of 57 t, as for the battery case.
For hydrogen storage, we consider compressed-hydrogen tanks at 35 MPa, which is a common choice for heavy-duty applications. Their overall energy density is 1633 Wh/kg, 38 allowing a single hydrogen wagon to store up to 93 MWh, i.e. over 12 times the energy available from a battery wagon (2020 data, after conversion efficiencies are factored in). Similar values have been reported in specific studies on hydrogen passenger trains. 8
The volumetric density of 35 MPa tanks is 0.533 MWh/m3, 38 which translates to a volume requirement of 175 m3 for the 93 MWh storage estimated above. Considering that the length of such wagons is 19.5 m and that the Norwegian load profile allows for a cross-section of 9.93 m2, 31 the available volume is 193 m3, sufficient to store the hydrogen tanks without exceeding the Norwegian loading gauge.
The maximum power of a TRAXX locomotive is 5.58 MW, while for an electrified ES44AC it is 3.28 MW: fuel cells shall be dimensioned to deliver this power. Power density for fuel cell systems is reported at 650 W/kg and 650 W/l 39 ; this gives a weight of 8.6 t with volume of 8.6 m3 and 5.0 t with a volume of 5.0 m3 respectively; due to their high power density, relatively low weight, and relatively low volume, it is assumed that fuel cell systems will be integrated into the existing locomotive configuration. Even if fuel cell systems for locomotives would be significantly heavier and larger than automotive systems per kW, it would be very unlikely that such an increase would prevent installation in the locomotive.
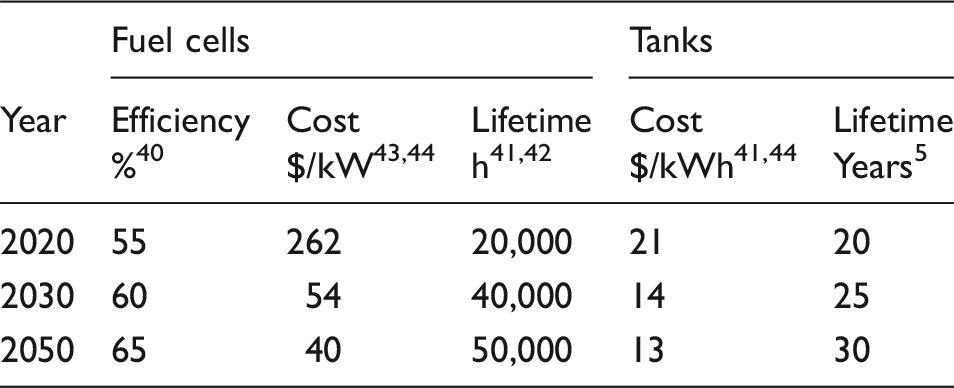
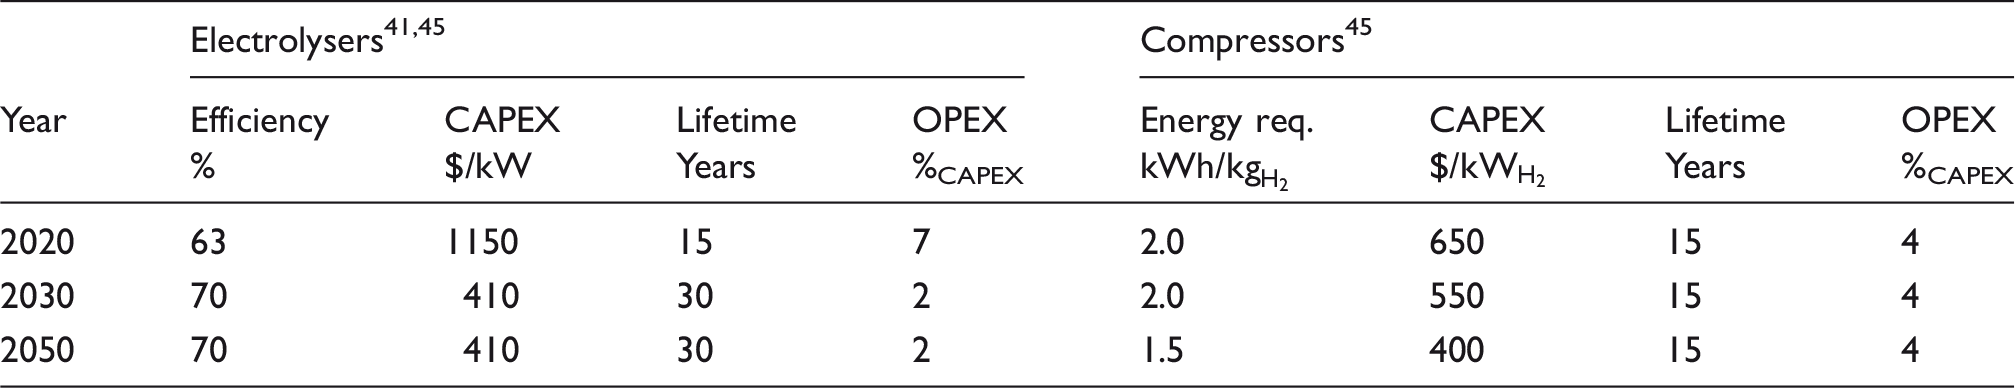
Expected evolution of parameters for heavy-duty fuel-cell systems and 35 MPa hydrogen tanks.
Expected evolution of parameters for hydrogen production.
Battery-hydrogen hybrid
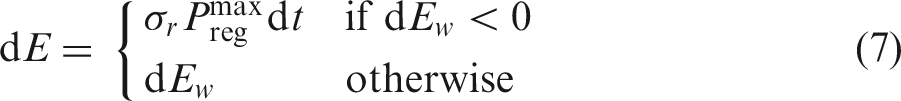
In the previous section, fuel cell systems were dimensioned according to the power rating of the locomotive. It is possible to reduce the size of fuel cell systems by hybridising them with batteries, so that fuel cells will provide a constant, average power P, while the batteries will meet power peaks; furthermore, this enables regenerative braking.
When the energy provided by the fuel cell system in a segment ( Total energy requirement E and travel time t are calculated with STS; Average power A differential energy balance for batteries is defined as Net buffer battery size is then defined as Actual size is calculated assuming that only the capacity between 20% and 80% of state of charge is used.
It would also be possible to seek an economically optimal battery size, smaller than the one found in the previous procedure, by allowing some dynamic operations of the fuel cell system and curtailing some regenerative braking; this is, however, beyond the scope of this paper.
Note, also, that all fuel cell systems usually include a buffer battery, and are therefore “hybrids”; the battery-hydrogen hybrid presented here is different in that the battery is large enough to absorb all power fluctuations during the journey.
Comparison criteria
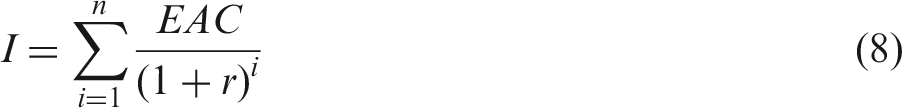
The presented propulsion alternatives have widely different capital expenditures (CAPEX), operating expenditures (OPEX) and lifetimes. To compare them, their CAPEX will be annualised as Equivalent Annual Costs (EAC), which will be then added to OPEX.
EAC is a virtual yearly cost through an asset's lifetime that has the same Net Present Value (NPV) as the CAPEX. Since for an investment I at t = 0 it is trivially I = NPV, we find
EAC is a convenient metric for comparison, but it does not account for opportunity costs nor “lock-in” effects.
The benefit–cost ratio (BCR) for each electrification alternative is the ratio between the costs of diesel technology, which are no longer incurred, and the costs associated with each alternative; a BCR larger than 1 indicates an advantageous investment.
The discounted PBP is the time after the initial investment when the discounted cash flow of an alternative surpasses that of diesel. For an investment with BCR less than one, a PBP cannot be calculated.
Finally, the up-front investments (UFIs) required for a technology are an important criterion in decision making.
Results
Train compositions and energy requirements
Energy consumption (netted for regenerative braking) for one train on each line, battery charging and minimum size (netted for oversizing), journey time and train composition (in addition to cargo) for the Nordland line and US route.
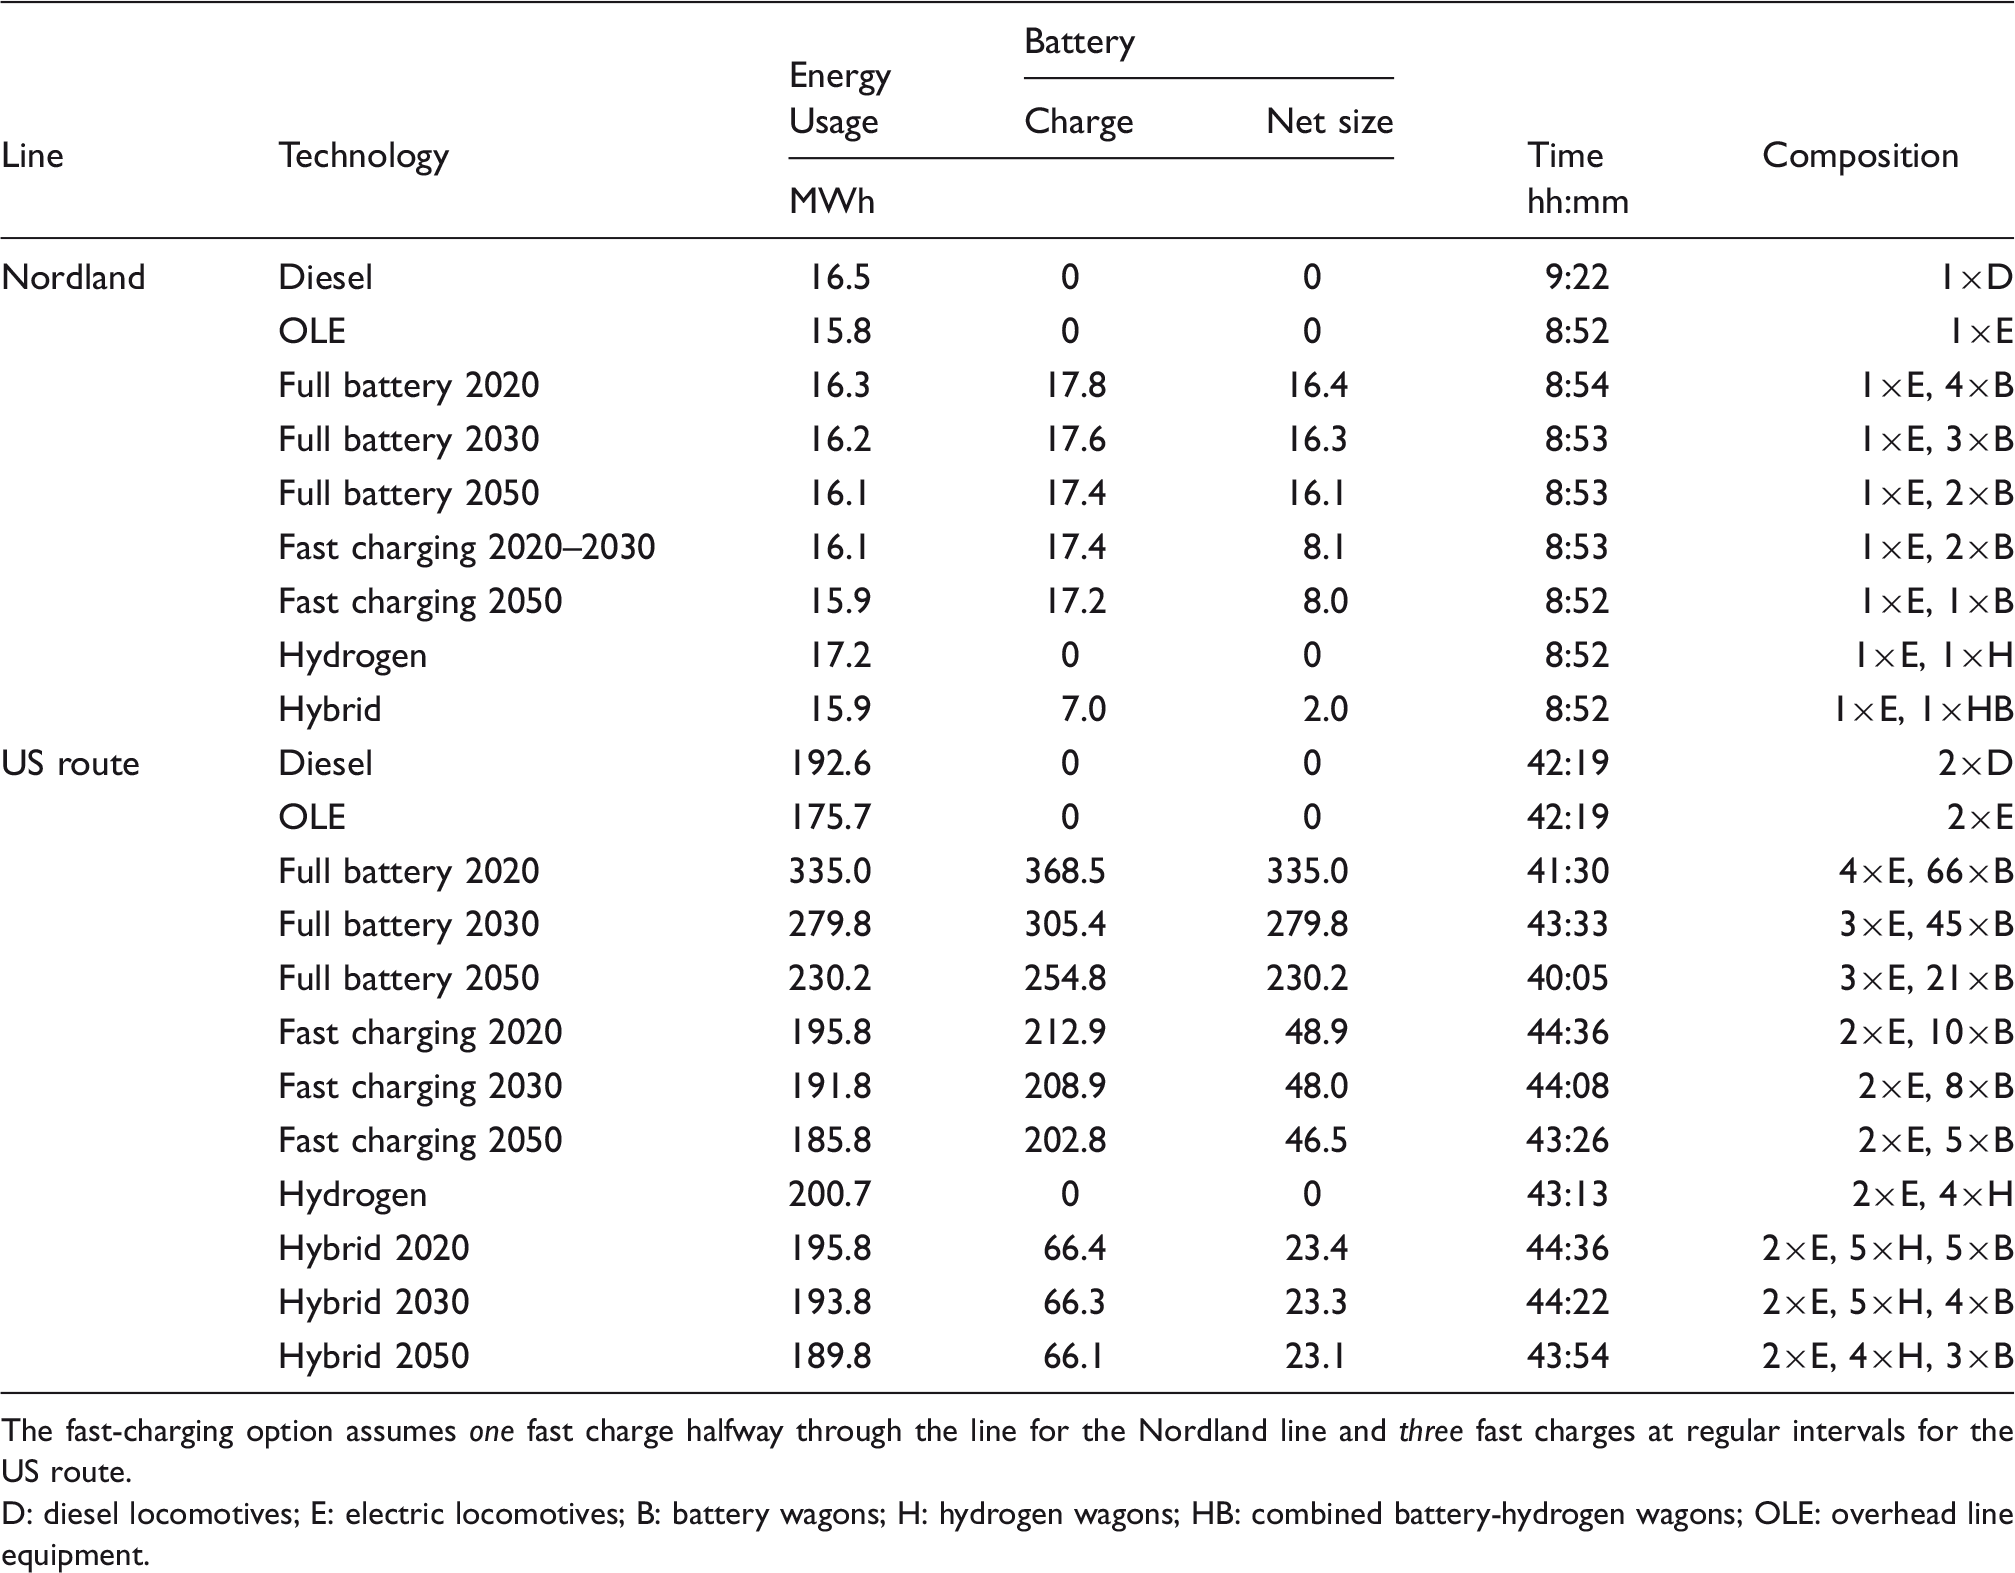
The fast-charging option assumes one fast charge halfway through the line for the Nordland line and three fast charges at regular intervals for the US route. D: diesel locomotives; E: electric locomotives; B: battery wagons; H: hydrogen wagons; HB: combined battery-hydrogen wagons; OLE: overhead line equipment.
Changes in future train configuration are due to improvements in battery energy density, and are more visible in the US case since trains and distances are larger, and battery wagons are added to the train rather than replacing cargo as in the Norwegian case.
Travel times in Table 5 are calculated assuming an uninterrupted journey through the line, neglecting stops and delays due to other rail traffic, crew replacement, etc.
Economic analysis
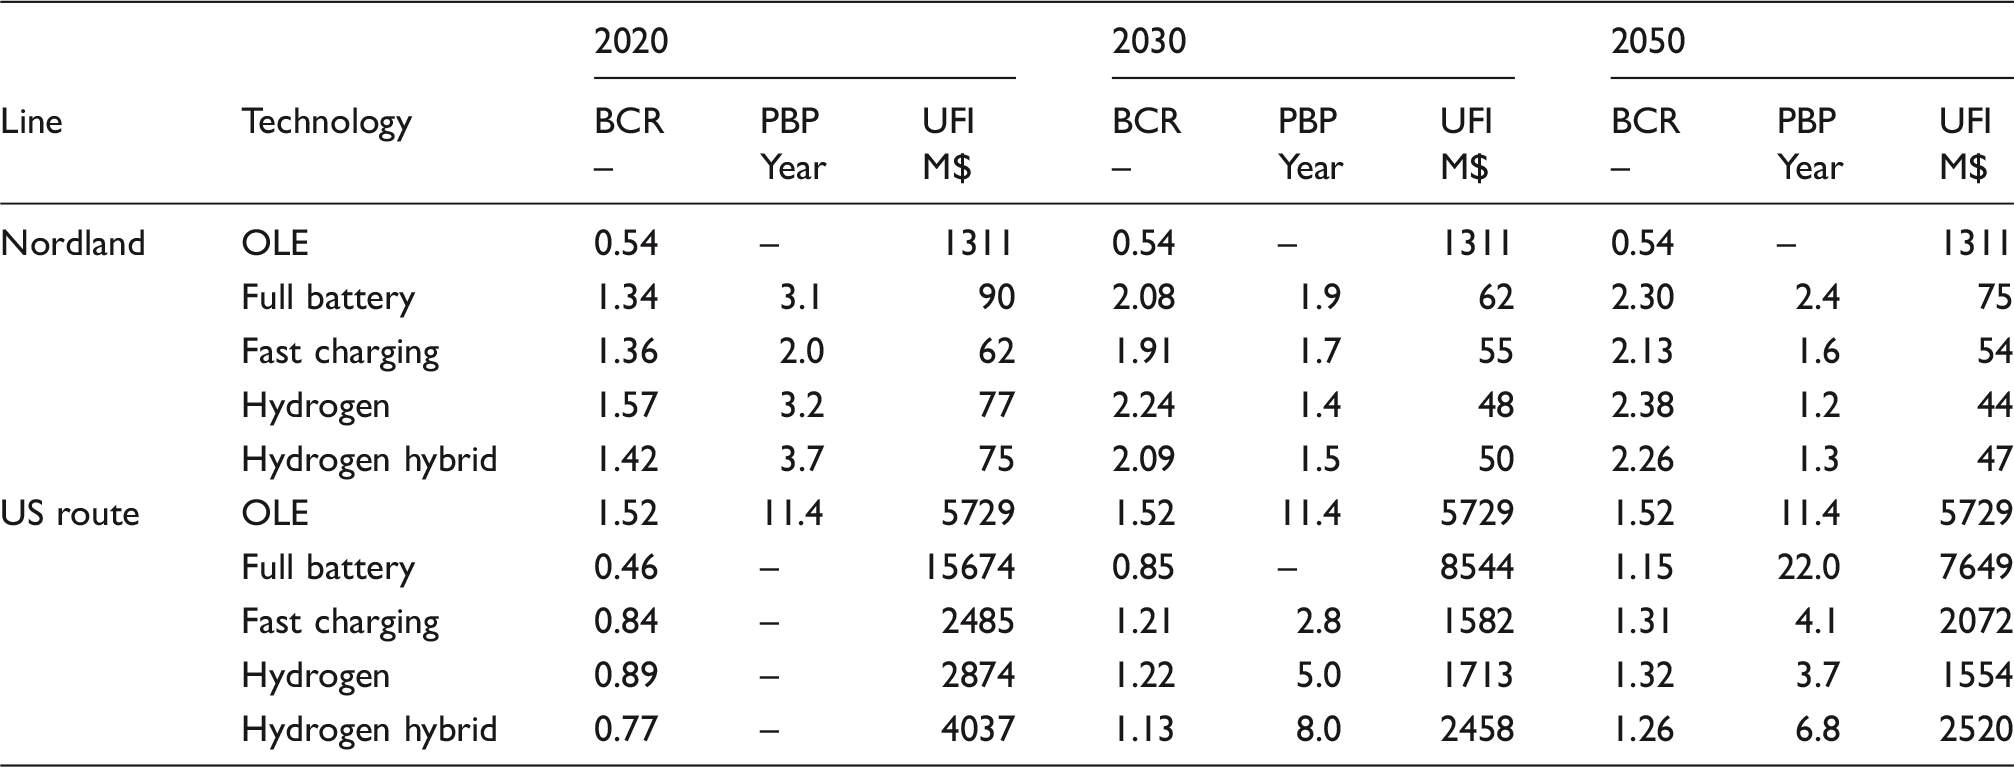
Based on the presented methods and simulation results, the EACs for the two lines are calculated and plotted in Figure 3; other economic parameters (BCR, PBP and UFI) are listed in Table 6.
Equivalent annual costs for different technologies on the Nordland line (left) and US Route (right). The benefit–cost ratio (BCR), payback period (PBP) and up-front investment (UFI) required for the presented electrification alternatives compared to diesel operation.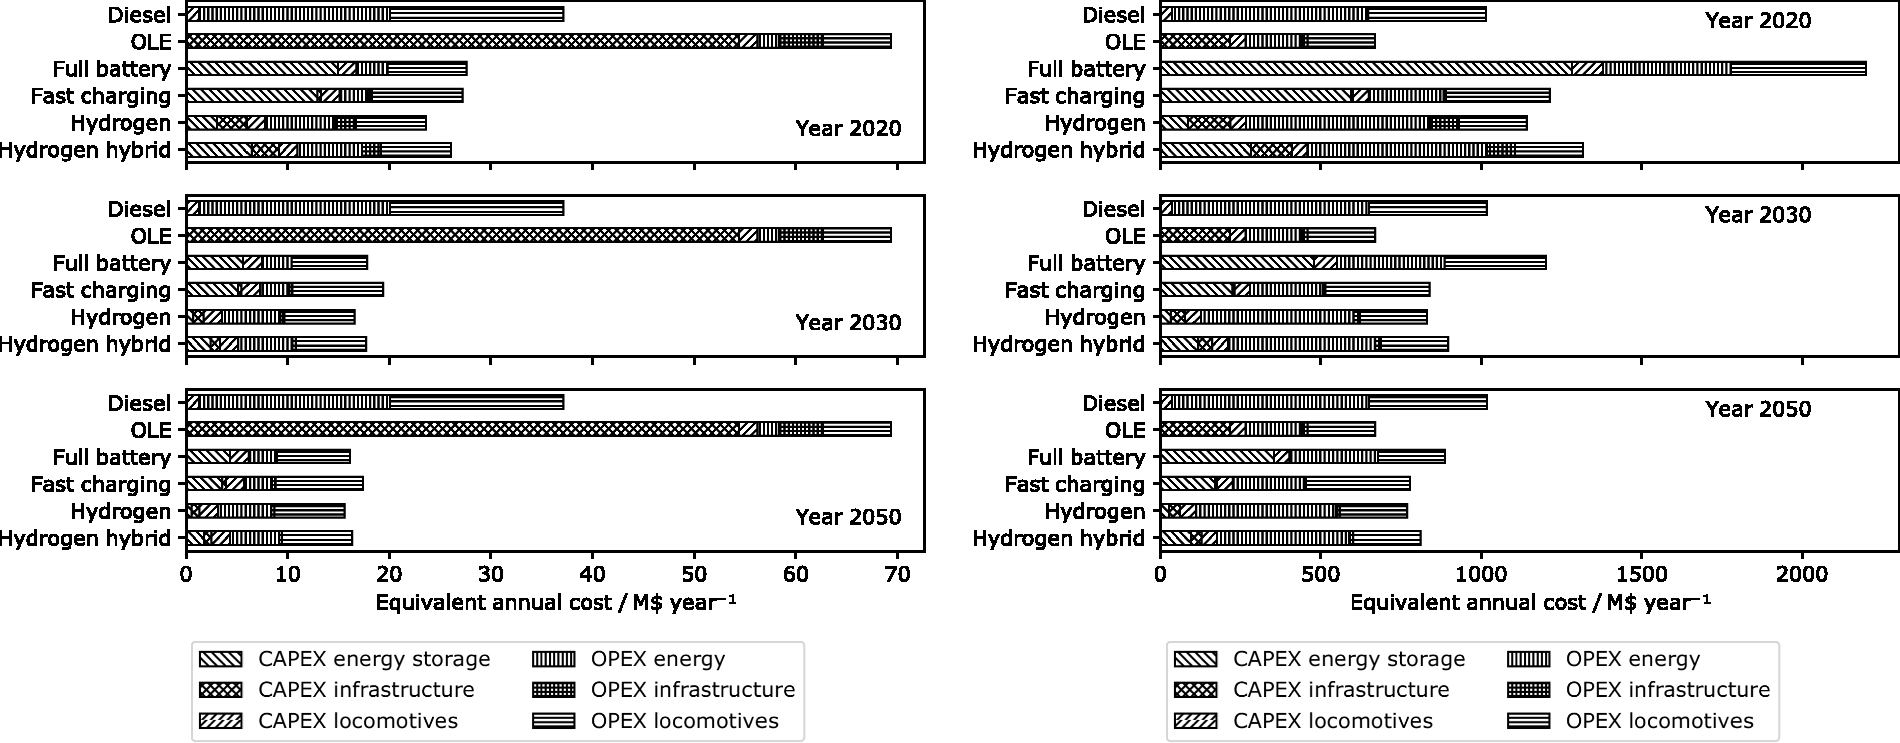
EACs are aggregated into six categories:
CAPEX energy storage: batteries, fuel cells and hydrogen tanks (annualised); CAPEX locomotives: electric or diesel locomotives (annualised); CAPEX infrastructure: OLE, charging stations, electrolysers and compressors (annualised); OPEX energy: diesel and electricity (including compressor operation); OPEX infrastructure: maintenance for OLE, electrolysers and compressors; OPEX locomotives: maintenance for locomotives, tax on diesel locomotives (Norway only), and pricing of waiting time when fast-charging.
OLE installation is the most expensive option on the Nordland line, and compares very unfavourably with the current technology, diesel. Furthermore, OLE requires over 1300 M$ in UFIs; in a small country such as Norway, this would likely entail political discussions at the national level.
However, all other electrification options on the Nordland line compare favourably with diesel, and are expected to improve. Hydrogen has the best BCR in 2020, with about 13.5 M$ lower EAC than diesel; full battery gradually closes in to hydrogen towards 2050. En-route fast-charging actually has a slightly worse BCR compared to full battery from 2030. The hydrogen-battery hybrid generally performs worse than hydrogen, even with regenerative braking.
All alternative electrification technologies on the Nordland line have fast PBPs, notably all below two years in 2030.
On the US route, OLE is significantly better than diesel, with an EAC margin of about 347 M$ a year, and it also outperforms all alternative electrification technologies as well until 2050. The UFI cost for the OLE option would be over 5700 M$, which is comparable to the yearly income of large US freight railways.
For the US route, full battery is very expensive in 2020, but improves rapidly and is competitive with diesel in 2050; its UFI, however, is always higher than OLE. Fast charging widely outperforms full battery in all parameters.
In 2020, hydrogen is the non-OLE electrification option closest to diesel in terms of EAC, and is the overall best performer of this group; fast charging, however, has marginally lower EAC and significantly shorter PBP in 2030. The hybridised hydrogen solution performs poorly compared to plain hydrogen in all parameters.
Discussion
Results are very different for the two lines, highlighting how the potential of alternative electrification technologies depends on the context in which they are deployed.
Energy cost is an important difference between the two cases: in Norway, diesel is more expensive, but electricity is cheaper. The additional taxes on usage of diesel locomotives in Norway further worsen their performance.
However, one key finding is that OLE electrification is actually cheaper than diesel on the US route, and much more expensive than diesel on the Nordland line. The reason is the much lower traffic density of the Nordland line, which distributes OLE CAPEX over much fewer trains: in fact, the annualised OLE CAPEX alone is larger than all expenses considered for diesel, making the lower costs for energy and locomotive maintenance irrelevant. On the US route, the reduction in energy costs is significant, but not as extreme: yet, as the OLE CAPEX is distributed across many more trains, OLE outperforms diesel.
Batteries, especially in the short term (2020), are penalised by their high cost, which is much larger than energy costs. This is, however, expected to improve rapidly towards 2030, as battery costs decrease and their energy density increases, requiring fewer wagons for energy storage.
On the Nordland line, the option of using a smaller battery and fast-charging halfway along the route does not yield halved battery costs: the battery is indeed smaller, but is also charged more often, reducing its lifetime, thereby resulting in a similar annualised cost for the two options. This is not true for the US route, where the fast-charging option is significantly cheaper than full-battery: the reason is that the latter's battery wagons significantly add to the train's weight and energy consumption.
Hydrogen does not have one predominant cost component and, in the case of the Nordland line, scores consistently well in all parameters. Compared to batteries, the lower efficiencies of fuel cells and electrolysers increase energy costs, which is a disadvantage on the US route, where electricity prices are higher. There are significant costs for the hydrogen refuelling stations; however, these are more than compensated by the lower cost of energy storage and conversion. This is visible in the case of the US route, where hydrogen is competitive with batteries until 2050, though its energy costs are higher, by virtue of its lower annualised CAPEX.
The option of hybridising fuel cells with batteries does not appear to be an attractive option in either line. The cost of fuel cells is lower, but is offset by the relatively high cost of batteries: even if the battery is small, it is being charged and discharged often, resulting in a short lifetime. Energy savings from regenerative braking are not sufficient to offset the additional capital cost of batteries.
Other factors
In addition to purely technical and economic data, there are other factors that will influence the willingness and ability of operators to switch from diesel to battery or hydrogen trains.
Environmental requirements are gradually becoming more stringent across the world, and several governments are considering banning the sale of fossil-fuelled vehicles; similar bans may in the future include trains. With a locomotive lifetime of 20 years, operators may not want to acquire new diesel locomotives that could be banned before being fully depreciated.
Availability of technology is not off-the-shelf for batteries, fast chargers, fuel cells, hydrogen tanks and electrolysers in the scales describe in this paper, but the modularity of these technologies and their limited requirement for infrastructure will facilitate their adaptation from other sectors.
A regulatory framework and safety protocols for batteries, fuel cells and hydrogen storage in trains will need to be developed. As these technologies are deployed in e.g. road transport, such protocols should be ready in relatively short time.
Operators are also concerned about flexibility and robustness: a battery or hydrogen train can run on non-electrified lines, whereas an OLE train relies on infrastructure being installed. However, battery trains require regular stops to recharge their batteries, and hydrogen trains depend on refuelling infrastructure.
Sensitivity analysis
In addition to the technical parameters considered in this analysis, there are others that can influence the results.
Diesel cost is volatile, especially in the US, and is a major component of EAC. If US diesel were to cost 4 $/gal (a national average retail level reached in the summer of 2008 and last reached in summer of 2014 on the West Coast 27 ), OLE would be at a much stronger advantage against diesel, with 713 M$ lower equivalent annual costs, a BCR of 2.1 and a PBP of 6.4 years.
Electricity costs may decrease in the US with the uptake of renewables. For example, the Mexican government announced that a long-term auction for clean energy production resulted in a price of 20.57 $/MWh, even lower than in Norway. 46
Changing electricity prices will not influence the results of the Nordland line significantly, since energy costs are already a minor item; for the US route, however, the electricity price announced by the Mexican government would strengthen all electrification options, especially hydrogen and hydrogen hybrid due to their lower efficiency compared to the other options aside from diesel. Hydrogen would become the most favourable option in 2030, with an EAC 515 M$ lower than diesel (and 46 M$ lower than OLE as well), a BCR of 2.0 and a PBP of 2.2 years.
The capital cost of OLE is difficult to estimate, especially on the Nordland line, which has many single-track tunnels and extreme weather conditions. There, the cost of OLE is actually more than all diesel cost items combined. In order to make OLE competitive with diesel on the Nordland line, its CAPEX should be reduced below 0.79 M$/km.
We assumed that the cost of OLE is the same for the single-track Nordland line and the double-track US route. If, however, the cost of OLE were to double, it would still hold a 132 M$ EAC advantage over diesel, but its PBP would be longer than 31 years. Furthermore, hydrogen and fast charging would have lower EACs than OLE already in 2030, and with far shorter PBPs.
It should be noted that some ongoing projects have far larger OLE costs than we assumed; for example, the Caltrain electrification project 47 has a budget of over 1100 M$ (netted for train acquisition and contingencies) for just 113 km of double track, giving a cost of approximately 10 M$ per route kilometer. However, this is mostly due to the project being located in a highly urbanised area with many passenger stations. On the other hand, in some less-populated areas the US grid might not be sufficiently established to support a large-scale electrification project, adding to cost. It is very difficult to predict large-scale electrification cost in the US due to the limited projects that have been implemented, particularly in recent years. Cost discrepancies in OLE installations between US and Europe have been noted before by Weiss. 48
The discount rate assumed in this paper has been consistently 4%, which is the value recommended by the Norwegian Railway Authority for their calculations. 2 However, this value may be too low for a private corporation such as the owners and operators of the US route; running the US calculations with a 10% discount rate significantly increases the EAC of OLE, which however still compares favourably with diesel and maintains a BCR of 1.05. Solutions with shorter PBPs are boosted, and from 2030 fast charging and hydrogen are the best-ranked solutions with similar EACs, about 130 M$ below diesel, and BCRs of 1.14.
The EAC of fuel cells is in all investigated cases a minor item, and further price reductions will be of limited impact; increases in their efficiency will be relevant for the US route, where electricity prices are higher. Currently, non-mass-produced fuel cell systems for heavy-duty applications can cost over 1000 $/kW; using this value in 2020, however, causes only an increase of 3.5% in total EAC for the US route and 10% for the Nordland line.
Battery development will strongly enhance their economic performance, especially on the longer US route. It is currently difficult to find reliable estimates for their future developments, as experts in the field have widely different opinions on battery cost and cycle life in 2030. 35
It should be noted that some of the parameters considered in this brief sensitivity analysis, especially energy costs, are historically difficult to predict and known to fluctuate from one year to the next. The optimal solution under this uncertainty may be different from one optimised for either low or high prices, and rather be focused on flexibility and adaptability to new scenarios. 49
Conclusion
A comparison of the techno-economic evaluations of electrification technologies on the Nordland line and a US route revealed substantial differences. The US route has sufficiently intensive traffic to support an OLE system, whereas the Nordland line cannot.
Alternative electrification technologies do not require costly OLE infrastructure, and can compete with diesel propulsion if external economic and political factors are right: the cheap electricity and the heavily taxed fossil fuel of Norway put diesel at a strong disadvantage. In Norway, hydrogen and batteries are expected to be competitive against diesel already in 2020.
While diesel is, in 2020, economically superior to batteries and hydrogen in US conditions, the evolution of battery and fuel-cell technology should close the gap by 2030. Cheap renewable electric power and diesel price volatility may further motivate electrification in the US.
En-route fast-charging to reduce battery size is not beneficial unless the journey is so long that the batteries make up a significant section of the train, as we find for the US route.
Hybridisation of hydrogen fuel cells with batteries did not yield favourable results: battery wear more than offsets the savings in fuel cell system power and energy reduction from regenerative braking.
The most influential parameters for the results were energy costs, traffic intensity, OLE costs and battery technology. Low-traffic lines will favour electrification by battery and hydrogen instead of OLE, and low electricity prices will favour hydrogen.
Footnotes
Acknowledgements
The authors wish to extend their thanks to the Norwegian Railway Authority (Jernbaneverket) for the data they provided and their collaboration.
Declaration of Conflicting Interests
The author(s) declared no potential conflicts of interest with respect to the research, authorship, and/or publication of this article.
Funding
The author(s) disclosed receipt of the following financial support for the research, authorship, and/or publication of this article: The work leading to these results was partially funded by the Norwegian Railway Authority and the MoZEES Research Centre, financed by the Norwegian Research Council (Project Number 257653).