
Abstract
Air pollution from diesel emissions is becoming an increased international concern, and whilst attention has been primarily focused on the automotive industry, concerns have also been raised about emissions from diesel rail vehicles. This paper reports an extensive series of measurements made at the Birmingham New Street station, a major rail interchange in the Midlands of England, with a mix of diesel and electric train movements, which is of particular concern because of the enclosed nature of the platforms. This study was undertaken in collaboration with Network Rail to better understand the environment in and around the station over a longer period to provide a more detailed analysis of the complex environment at the station. The station environment has been considered in terms of the European Union (EU) and Department of Environment, Food and Rural Affairs (DEFRA) limits as part of the monitoring methodology, but it should be noted that these limits do not apply in this environment as the Management of Health and Safety at Work Regulation 1999 and the Control of Substances Hazardous to Health Regulations 2002 are applicable. The monitoring campaign consisted of diffusion tube measurements to measure nitrogen dioxide at a large number of different locations throughout and around the station. These were followed by detailed measurements of oxides of nitrogen, particulate matter, carbon dioxide and black carbon (a diesel tracer) at a smaller number of sites at the platform level. The results are analysed to give concentrations over a wide variety of time scales, and long- and short-term averages. The effects of ambient wind conditions and individual train movements are also considered. Recommendations are made for possible remedial measures and for future work to more fully understand the physical mechanisms involved.
Keywords
Introduction
Rail transportation is becoming an increasingly popular mode of transport around the world, and nowhere more so than in the UK1,2 with more than 1731 million passenger journeys made in 2016–17. 3 In 2015–16, 33.7% of track was electrified, 4 although by passenger miles, 60% of passenger journeys are made on electric services. 5 This leaves a significant proportion of passengers still travelling on diesel services.
Diesel engine exhaust emissions (DEEEs) pose a significant threat to health, so much so that the International Agency for Research in Cancer classified DEEEs as carcinogenic in 2012. 6 DEEEs comprise a number of harmful pollutants including oxides of nitrogen (NOX), black carbon (soot), carbon dioxide, carbon monoxide (CO), oxides of sulphur, polycyclic aromatic hydrocarbons and other contaminants. 7 DEEEs are controlled by non-road mobile machinery (NRMM) regulations, which regulate CO, unburned hydrocarbons, NOX and particulate matter (PM) emissions. However, from its introduction in 1999 until 2006 (stages I–II), railway engines were exempt from the regulations.8,9 From stage III, phased in from 2006 to 2013, railway diesel engines were subject to NRMM regulations, which have subsequently tightened over the last 10 years.8,10–12 Engines must meet the emission regulations in place on the date they first came into service, resulting in older rail engines abiding by older, outdated NRMM regulations and new engines meeting the new, stricter NRMM regulations. Thus, it is important to consider the age of the UK rolling stock when investigating emissions. At the end of 2015–16, the average age of rolling stock nationally was 21 years and this is the first time the average age has exceeded that of the start of the record in 2000–1. 4 The average age indicates that a considerable proportion of the current rolling stock was deployed before the NRMM regulations were enforced 11 years ago 9 and therefore, this rolling stock is not bound by any emission control regulations but is operating quite legally. Since 2006, class 172 and 185 trains have been introduced to the rail network and Hitachi’s class 800 and 802 diesel/electric hybrid trains are currently in production, all of which are subject to the regulations.
Furthermore, ambient air quality is also regulated by EU air quality standards and DEEEs are amongst those that are regulated by these standards. The EU limits relating to these DEEEs and relevant to this study are as follows
13
:
Nitrogen dioxide (NO2) – hourly average of 200 µg/m3 not to be exceeded more than 18 times in a year; NO2 – annual average not to exceed 40 µg/m3; PM with a size less than 10 µm (PM10) – daily average of 50 µg/m3 not to be exceeded more than 35 times in any year; PM with a size less than 10 µm (PM10) – annual average not to exceed 40 µg/m3; PM with a size less than 2.5 µm (PM2.5) – annual average not to exceed 25 µg/m3.
In the UK, however, these limits only apply to outside air and railway stations are not legally subject to these regulations. There are also Workplace Exposure Limits (WELs) for a range of pollutants that only overlap with the above for NO2. For this the limits are 955 µg/m3 for a time-weighted 8 h exposure period and 1910 µg/m3 for a time-weighted 15 min exposure period, i.e. much higher than the EU limits. These limits will not be considered further in what follows, as staff exposure times, which are required for their evaluation, were not measured. Instead, EU limits will be considered to gain in depth understanding of Birmingham New Street and to be in line with previous research.8,31
Previous research work has mainly been focused on PM concentration and composition from railway traffic in subway and metro systems, both outside and inside carriages.14–24 As these systems are by and large electrified, the PM originates from non-exhaust emissions of electric services, such as wear from wheel–rail contact. The origin and composition of these non-exhaust emissions have also been extensively researched.25,26 However, apart from very small-scale trials to monitor staff exposure on an occasional basis, there has been limited research into concentrations of NOX and particulates at enclosed railway stations, with two stations in the UK, London Paddington and Edinburgh Waverley, and one station in Netherlands being the only ones previously investigated.8,27,28
New Street station in the centre of Birmingham is the seventh busiest station in the UK and the busiest outside of London. It is also the fourth busiest interchange and again, the busiest outside of London with 170,000 passengers using the station on a daily basis.
29
An extensive redevelopment of the station was completed in 2016 and it now has the capacity to handle up to 300,000 passengers a day. On 19 November 2016, Birmingham New Street station had a record number of people, 230,000, using the station.
30
It has previously been identified as a potential pollution ‘hotspot’, due to its underground nature.
31
Twelve platforms lie beneath the large, new concourse, in a tunnel like environment, and the enclosed space is approximately 5 m high, 160 m wide and 240 m in length making the volume considerably smaller than other enclosed railway stations, such as London Paddington.
31
Trains approach the station via three tunnels under the city centre, from the South West, North West and East. Although the station is electrified, many of the train services run on non-electrified routes and as a result, there are approximately 600 diesel train movements per day at the station. These are formed by the following train classes:
Class 43 (HST) – locomotive hauled trains, with two power cars and up to eight coaches, built between 1975 and 1982 with a maximum speed of 200 km/h. Class 43 accounts for approximately 1% of services at Birmingham New Street. Class 150 (Sprinters) – two or three car units built between 1984 and 1987 with a maximum speed of 120 km/h. Class 150 accounts for approximately 8% of services at Birmingham New Street. Class 158 (Express Sprinters) – two or three car units built between 1989 and 1992 with a maximum speed of 140 km/h. Class 170 (Turbostars) – two or three car units, built between 1998 and 2005 with a maximum speed of 160 km/h. Classes 158 and 170 account for approximately 19% of services at Birmingham New Street. Class 220/221 (Voyagers) – four or five car units, built between 2000 and 2002, with a maximum speed of 200 km/h. Class 220/221 accounts for approximately 14% of services at Birmingham New Street.
These trains do not carry any form of emission control equipment, such as catalysts or particulate filter systems, due to their manufactured date and the reduced legislative requirements for emissions at that time. The station is also a focal point for buses, taxis and local traffic, including delivery vehicles to on-site and local shopping centres. There have recently been a number of complaints made to the Confidential Incident Reporting & Analysis System by staff regarding the air quality at Birmingham New Street.32,33
In 2009, a contractor carried out air quality analysis at the station prior to its redevelopment. The three-month monitoring campaign measured NOX, PM10, carbon dioxide, sulphur dioxide and PAHs. The contractor concluded that the only pollutant that should be monitored during the redevelopment was PM10, despite finding that NO2 levels exceeded the EU annual air quality objective of 40 µg/m3 and were likely to have exceeded the 200 µg/m3 hourly limit on several occasions, although stated it would not be a problem in this environment.31,34 However, there are limitations to the sampling methodology. NO2, sulphur dioxide and selected volatile organic compounds (benzene, toluene, ethylbenzene and xylenes) were measured solely by diffusion tubes, which are passive samplers and take a long term average irrespective of operation use. Moreover, the diffusion tubes used to measure NO2 were placed near the open end of the platform ‘tunnels’ rather than in the centre where passengers are more likely to wait for their service. Only PM and carbon dioxide were measured with continuous monitors during the study.
It is clear that a more extensive sampling campaign was required at Birmingham New Street to evaluate the air quality across the entire station, at both platform and concourse level, and its implication on/from the surrounding area. Therefore, the purpose of this study is to (i) obtain quantitative data for a range of pollutant concentrations and (ii) inform development methodologies for interventions to reduce pollutant concentrations. The methodology for this study is set out in the next section, and the pollutant concentration measurements described in the ‘Results’ section, where the concentrations of the different pollutants are considered on a range of time and spatial scales, and compared with measured environmental conditions and train operating patterns. The ‘Discussion and concluding remarks’ section presents a more detailed discussion of some aspects of the work and makes some concluding remarks and suggestions for further work.
Methodology
Outline
Both diffusion tube monitoring, at a large number of sites across the station, and more detailed continuous monitoring, at a small number of sites, took place at Birmingham New Street as part of the sampling campaign. Diffusion tube sampling was carried out first and was chosen to give an overview of the air quality at the station and identify potential pollution hotspots. Using this information, the continuous monitoring then focused on particular areas with a greater temporal resolution. At this point it should be noted that as part of the redevelopment at the station a ventilation fan system was installed to blow air out of the platform tunnel. However, due to constant platform works during the station redevelopment, it had not been possible to validate settings, etc. and the ventilation system was not fully operational during the course of the experiments. The ventilation through the platform area was thus driven by the natural ventilation along the platform.
Diffusion tubes
The sampling campaign at Birmingham New Street commenced with four weeks of diffusion tube sampling to monitor levels of NO2 in the station, at the platform and concourse level, and in the surrounding area of the city. There were three diffusion tube sites on each platform: A end (east), B end (west) and middle (Figure 1(a)). Each site had three diffusion tubes in order to increase their reliability and to mitigate any loses in data if a tube was to be vandalised or stolen. In the concourse, a set of three diffusion tubes were placed in each of the red, blue and yellow lounges (Figure 1(b)). Diffusion tubes were also strategically placed around the city centre to analyse the interaction with the surrounding area (Figure 1(c)). Again, three tubes were set up at each site. In total, 294 diffusion tubes were used for this study and these gave an indication of the spatial variation of NO2 concentrations within the station environment and surrounding area.
Diffusion tube monitoring locations (a) at the platform level in Birmingham New Street station, (b) at the concourse level at Birmingham New Street station and (c) outside Birmingham New Street station (A–K, excluding I). There were three tubes at each location. Microsoft product screen shot reprinted with permission from Microsoft Corporation.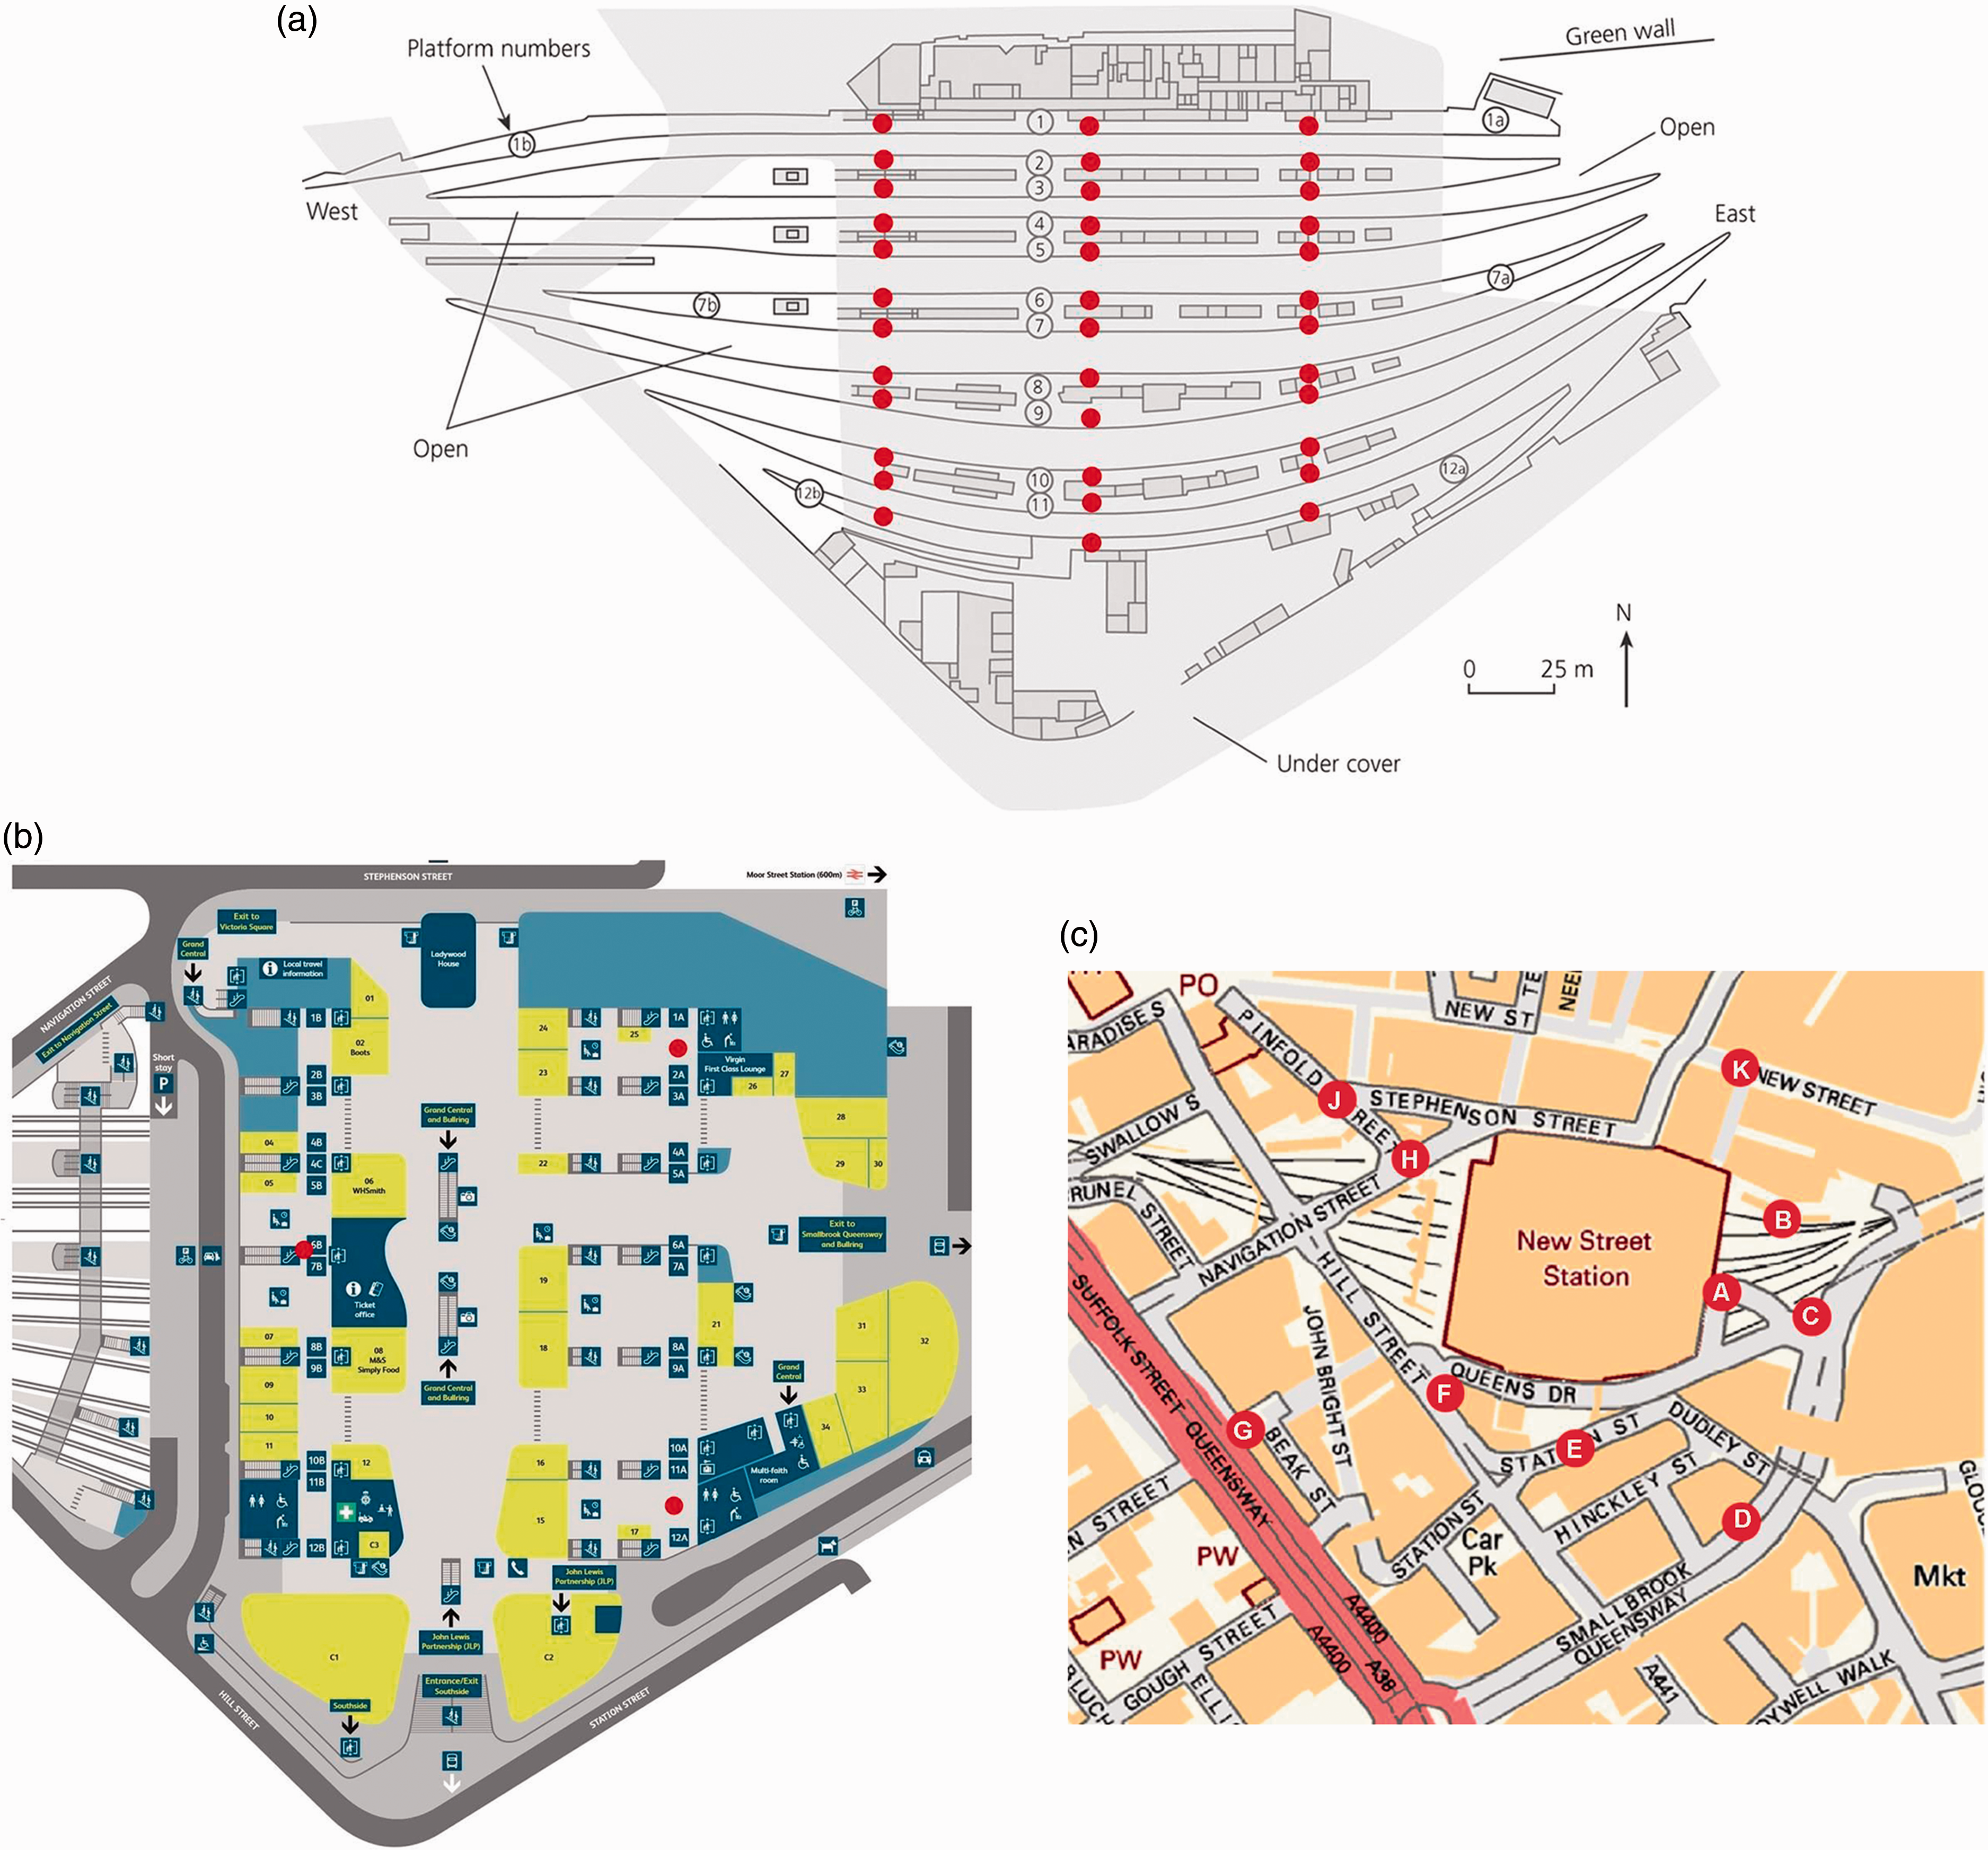
The four-week diffusion tube sampling was broken down into two 2-week periods: 18 October 2016–1 November 2016 and 1 November 2016–15 November 2016. The diffusion tubes were replaced with a second set of tubes after the first two-week period. The diffusion tubes were supplied and analysed by Gradko (United Kingdom Accreditation Service (UKAS) accredited).
Diffusion tubes are an indicative sampling technique since their uncertainty is higher than reference analysers. Therefore, to investigate their accuracy, a set of diffusion tubes were co-located alongside the automatic Horiba APNA-360 analyser on Moor Street Expressway in Birmingham. The results of these two monitoring techniques were compared using the DEFRA bias adjustment tool 35 and a correction factor of 0.89 ± 0.02 was determined. All diffusion tube results were subsequently multiplied by this factor to obtain the adjusted results.
Continuous monitoring
Three continuous monitoring sites, located on platform 10/11, were used to monitor NOX, PM, carbon dioxide and black carbon for 68 days from 17 November 2016 until 23 January 2017. Platform 10/11 was chosen, as this platform predominantly serves diesel trains. Site A was situated at the east end of platform 10/11, Site B was situated at the west end and Site C in the middle of platform 10/11 (Figure 2(a)). NOX were measured using a Horiba APNA-360 ambient NOX analyser, which continuously monitored NO, NO2 and NOX at 1 s intervals. The instrument was placed inside an air quality enclosure, with the inlet exposed out the top of the enclosure, close to breathing height (Figure 2(b)). The Horiba APNA-360 is a reference instrument, as it was calibrated with calibration gas prior to deployment at the station. Three Horiba APNA-360 analysers were present at the Birmingham New Street station from 8 December 2016 until 23 January 2017. The Horiba APNA-360 analysers were absent from Birmingham New Street between 17 November 2016 and 8 December 2016, due to being rescaled by the manufacturer.
(a) Continuous monitoring locations (A, B and C) at the platform level in Birmingham New Street station and the circles identify the location of the respective wind sonics. The table describes the pollutants and meteorological variables measured at each location. (b) Image of continuous monitoring site with labels to the monitor inlets and sensors in the cage on the top of the enclosure. BC: black carbon; NOX: oxides of nitrogen; PM: particulate matter.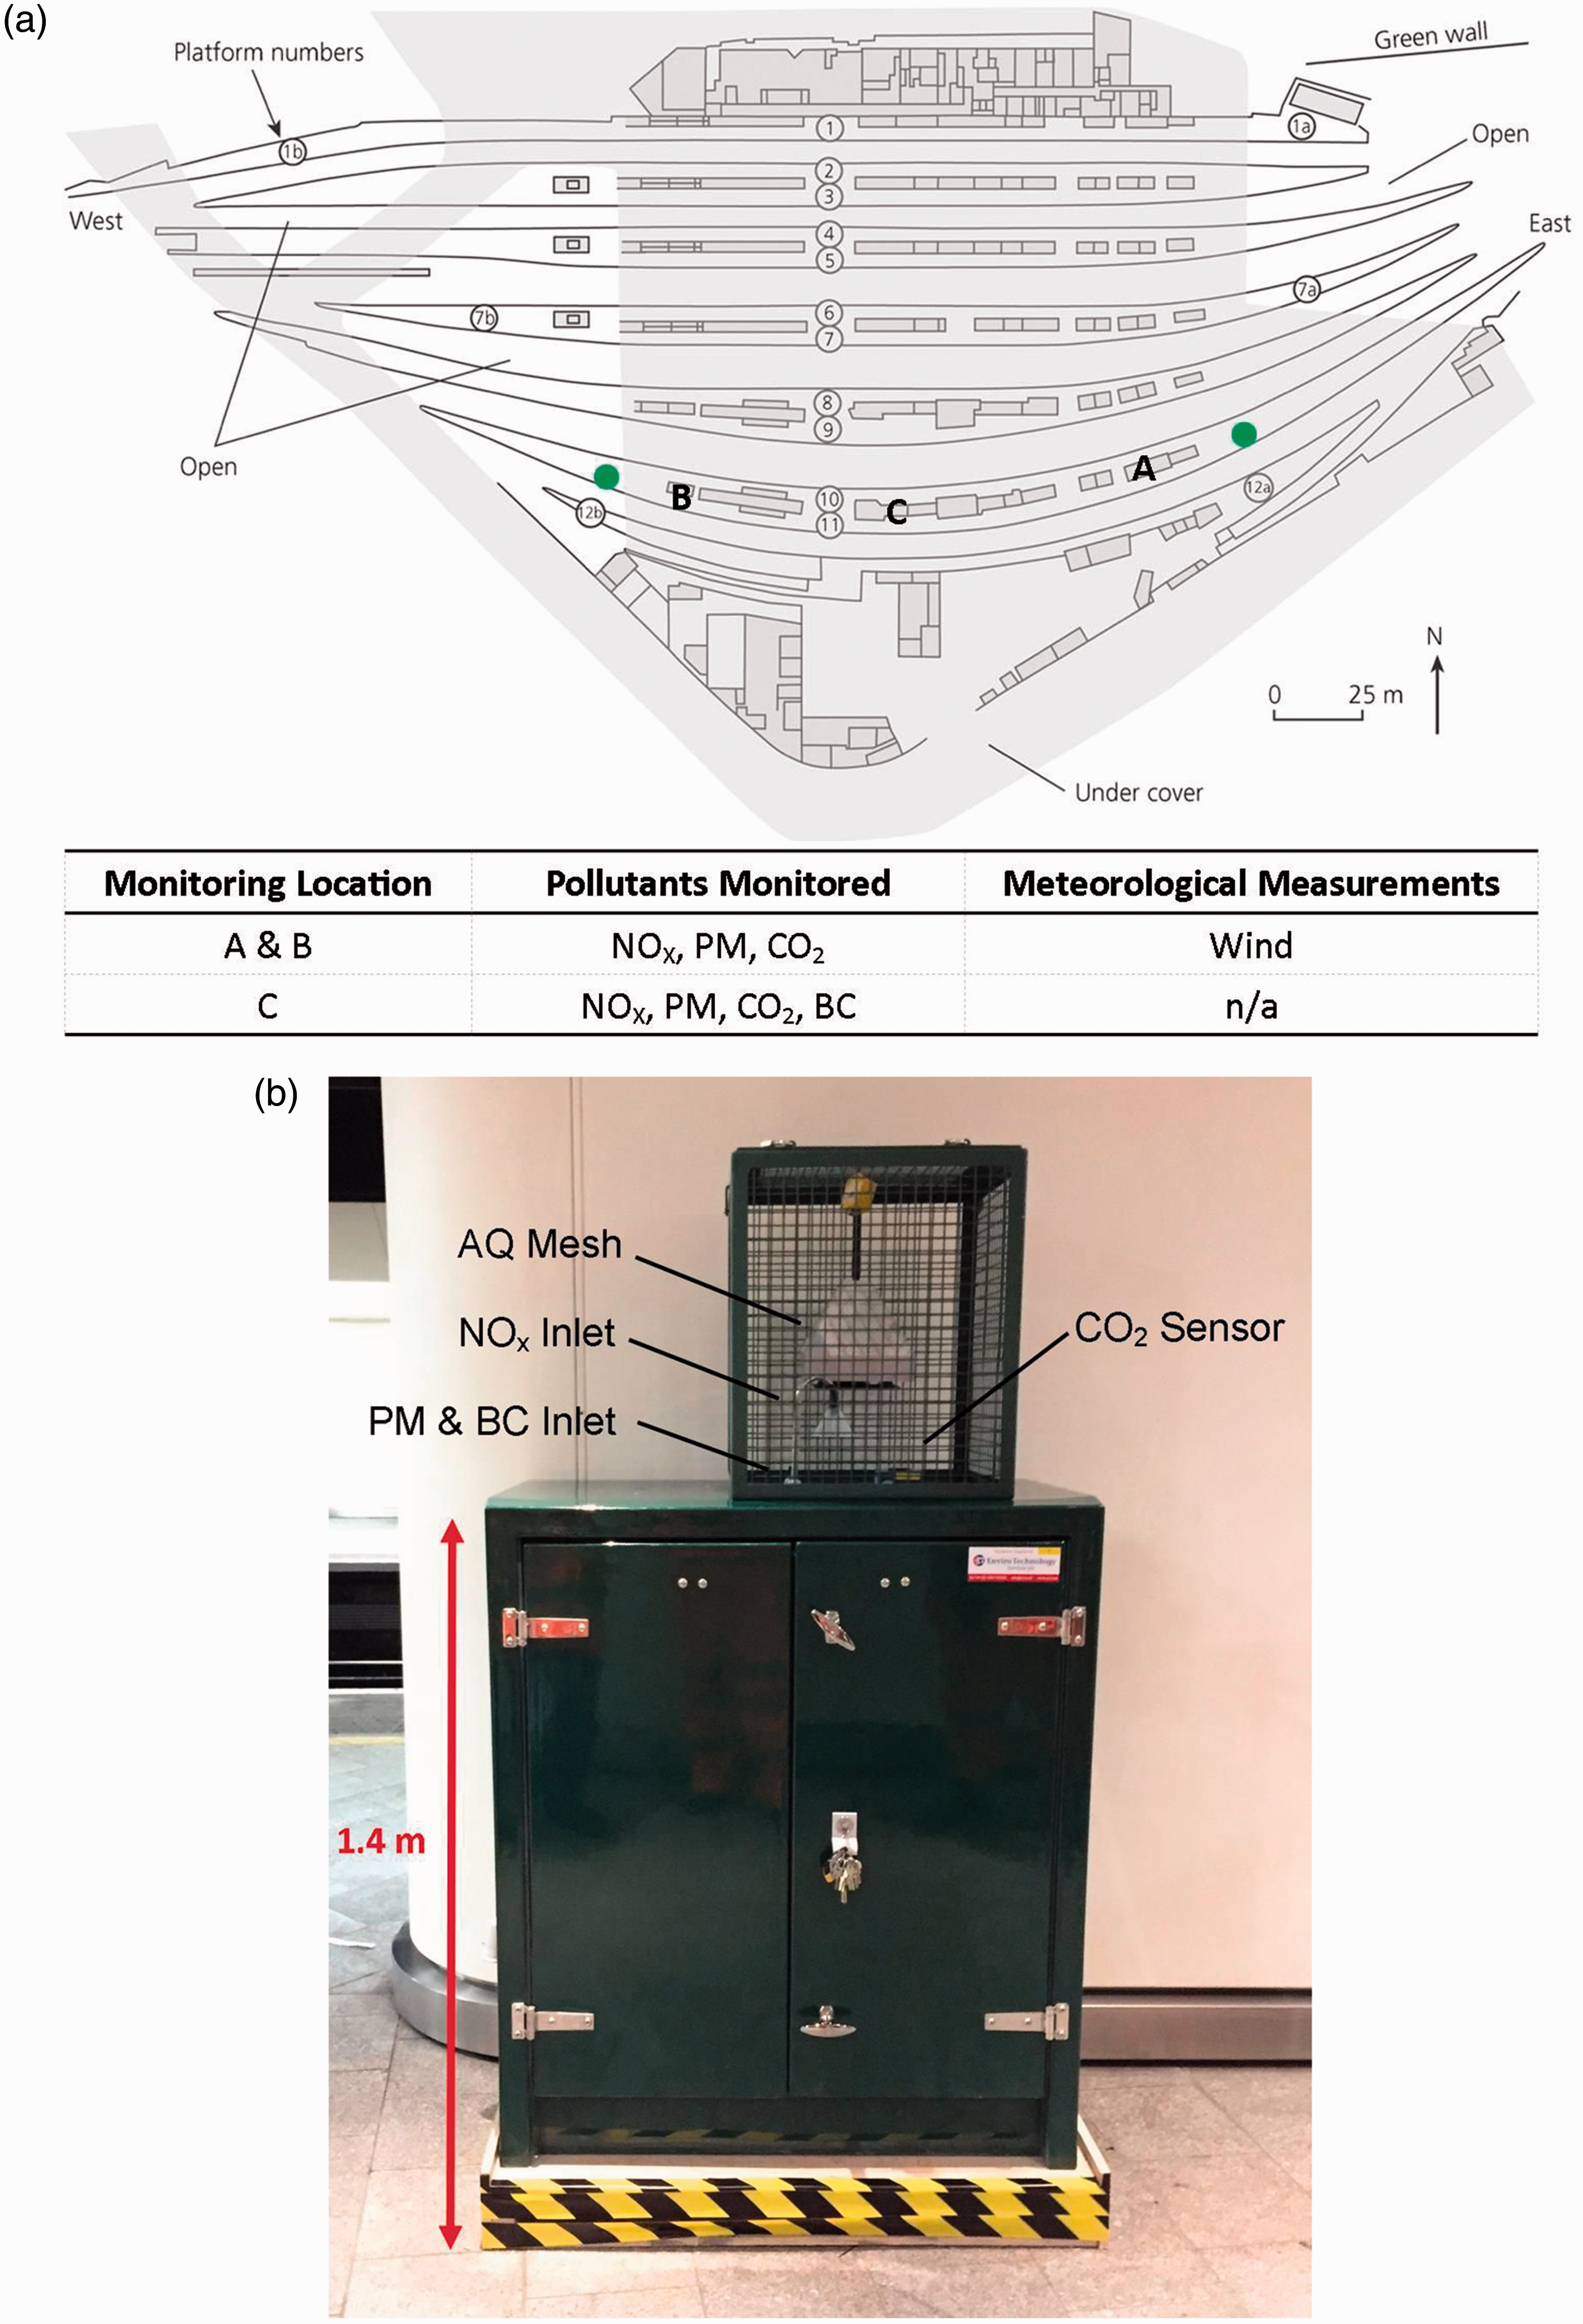
Correction factors for PM2.5 and PM10 concentrations from the DustTraks at sites A, B and C, and NO, NO2 and NOX from the AQ Mesh at Site C, where xcorr is the corrected concentration and xraw is the raw data from the instrument.
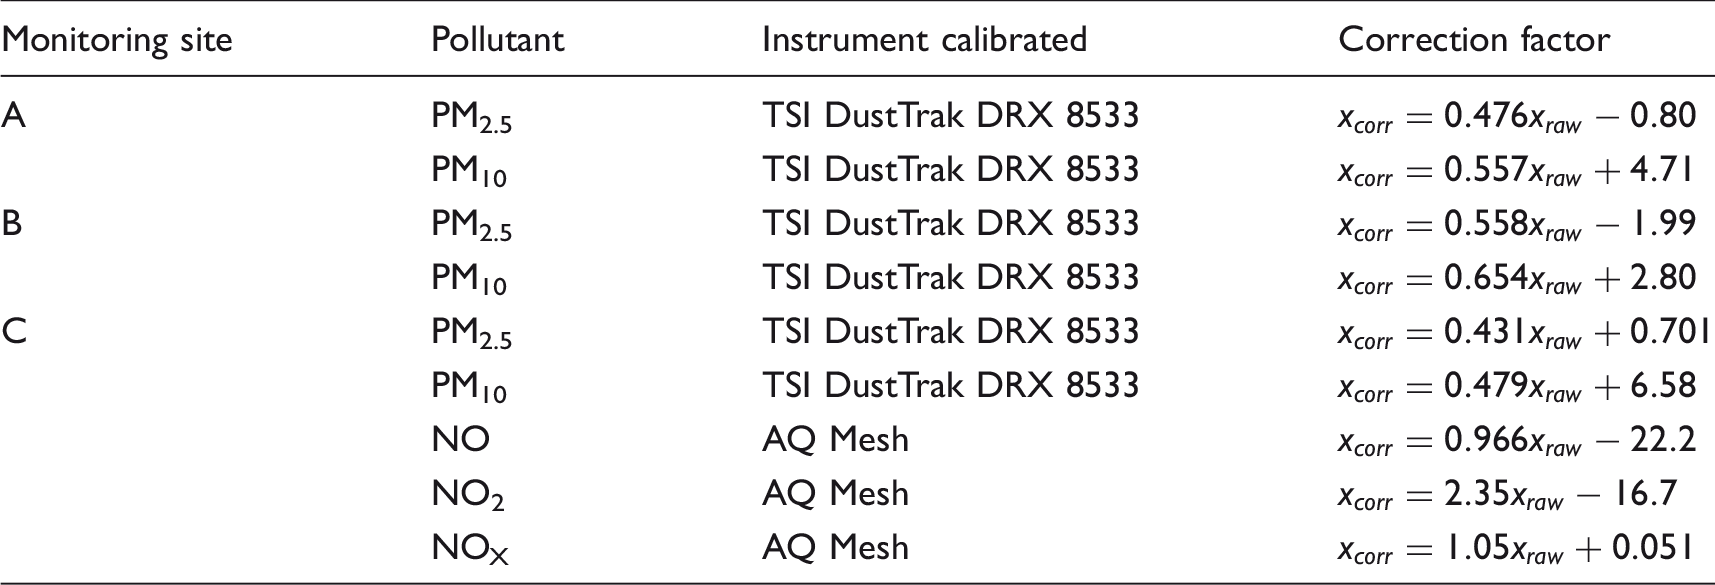
NOX: oxides of nitrogen; PM: particulate matter.
PM was measured using three TSI DustTrak DRX 8533 aerosol monitors. The instrument measured PM at a variety of size fractions (PM1, PM2.5, PMresp, PM10 and PMtotal) at 1 s intervals; however, PM2.5 and PM10 are most relevant to this study. Similar to the Horiba APNA-360, the DustTraks were situated inside the enclosure and the inlet exposed from the top. The DustTraks were calibrated against Birmingham City Council’s TEOM 1400a with FDMS 8500c at Tyburn Road in Birmingham for PM2.5 and PM10. This co-location provided a correction factor for each of the DustTraks, which were applied prior to analysis (Table 1).
Black carbon was monitored at 1 s intervals using an Aethalometer model AE33 and was located at Site C. The aethalometer measures at seven wavelengths (UV–IR) providing a full spectrum analysis; however, to obtain a black carbon measurement, only absorption measurement at 880 Hz is required. The AE33 Aethalometer also incorporates the new Dual-Spot™ measurement method36,37; the key benefit of this method is the elimination of the loading effect present on previous aethalometer models and manual correction of the results is no longer required, unlike previously.38–40 Prior to deployment, the aethalometer underwent a series of tests by the manufacturer, Magee Scientific, to ensure they are in line with their reference AE33 Aethalometer.36,41
Carbon dioxide was monitored at 1 s intervals using CozIR CO2 sensors at all three sites on platform 10/11. These sensors were mounted on top of the environmental enclosure inside the cage to avoid being tampered with.
Wind speed was measured in three dimensions by a Gill R3-100 Sonic Anemometer. Wind speed was measured in each direction every second. Two wind sonics were used during the sampling campaign, one was located at the extreme east (A) end of platform 10/11, at the end of the platform tunnel, and connected to Site A monitoring site and the second was located at the extreme west (B) end of the platform, at the end of the platform tunnel, and connected to Site B (Figure 2(b)). The wind sonics were mounted approximately 3 m above the platform.
Data were collected using a data logging system designed by Birmingham Centre for Railway Research and Education. The data logging system comprised three computers, one at each site, connected to one another using Wi-Fi, and data exported to a cloud-based system every 10 min. To prevent data loss, a backup of all files was stored on Site C’s computer.
Results
Diffusion tubes
Average NO2 concentration, in µg/m3, from the three diffusion tubes at platform level locations.
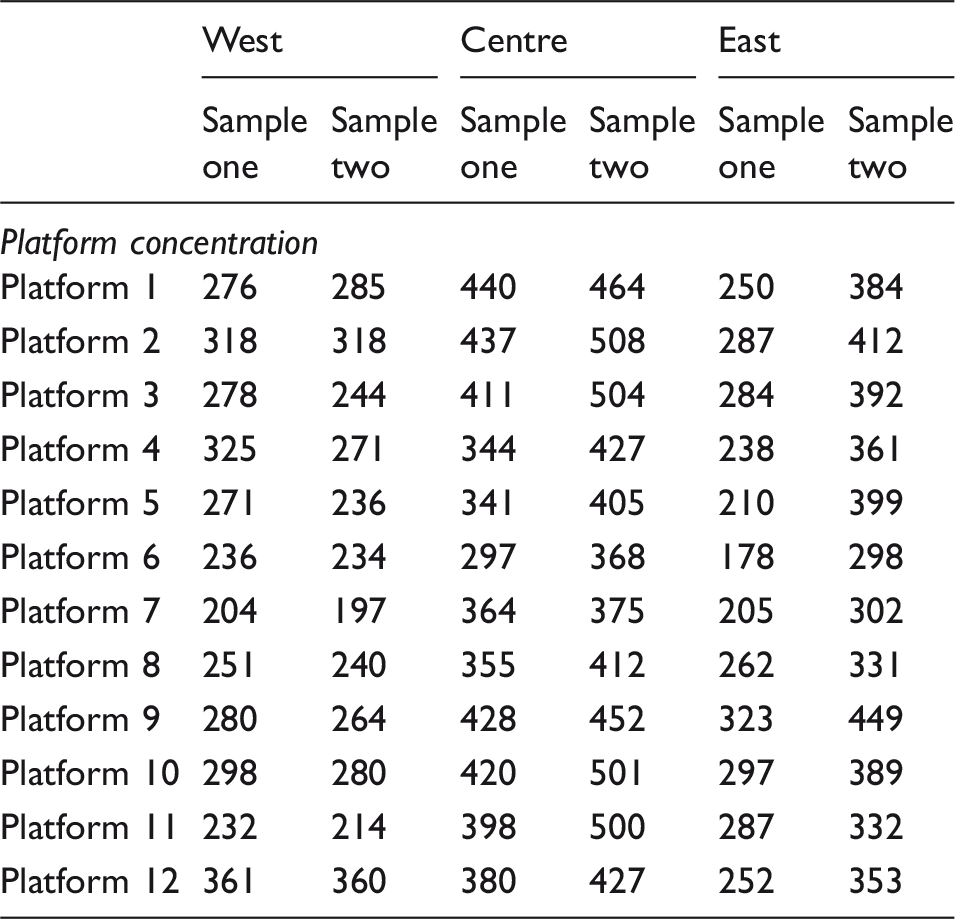
Sample one refers to the first sampling period from 17 October to 1 November 2016 and sample two refers to the second from 1 November to 15 November 2016.
Average NO2 concentration, in µg/m3, from the three diffusion tubes at concourse level locations.
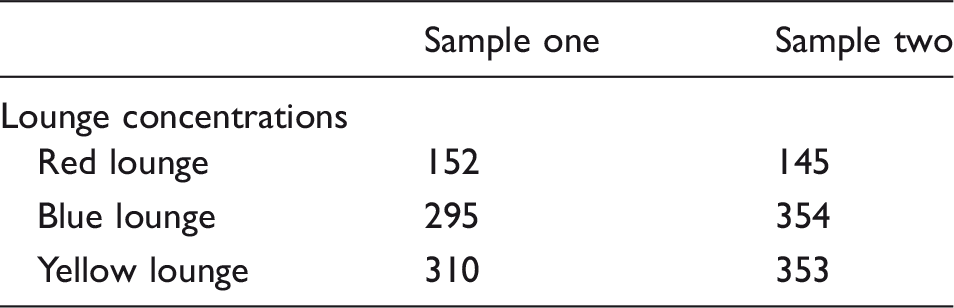
Sample one refers to the first sampling period from 17 October to 1 November 2016 and sample two refers to the second from 1 November to 15 November 2016.
Average NO2 concentration, in µg/m3, from the three diffusion tubes at locations surrounding the station.
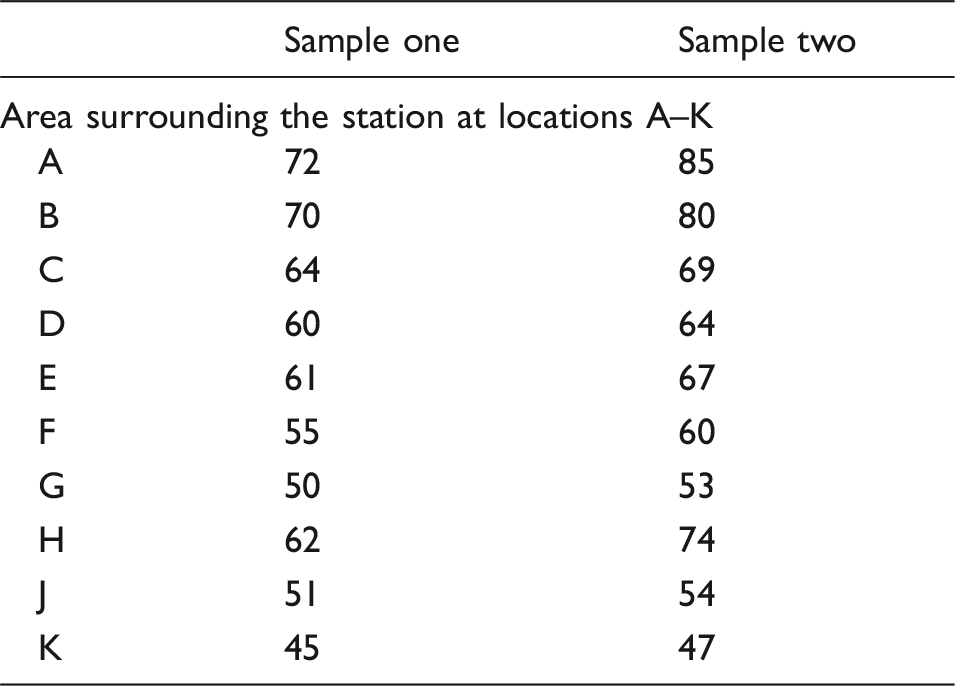
Sample one refers to the first sampling period from 17 October to 1 November 2016 and sample two refers to the second from 1 November to 15 November 2016.
Continuous monitoring
Long-term concentrations
Long-term averages for the monitoring period at Birmingham New Street for NO2, PM2.5, PM10, black carbon and CO2 and the percentage data capture (DC) for the monitoring period (for limits, see ‘Introduction’ section).
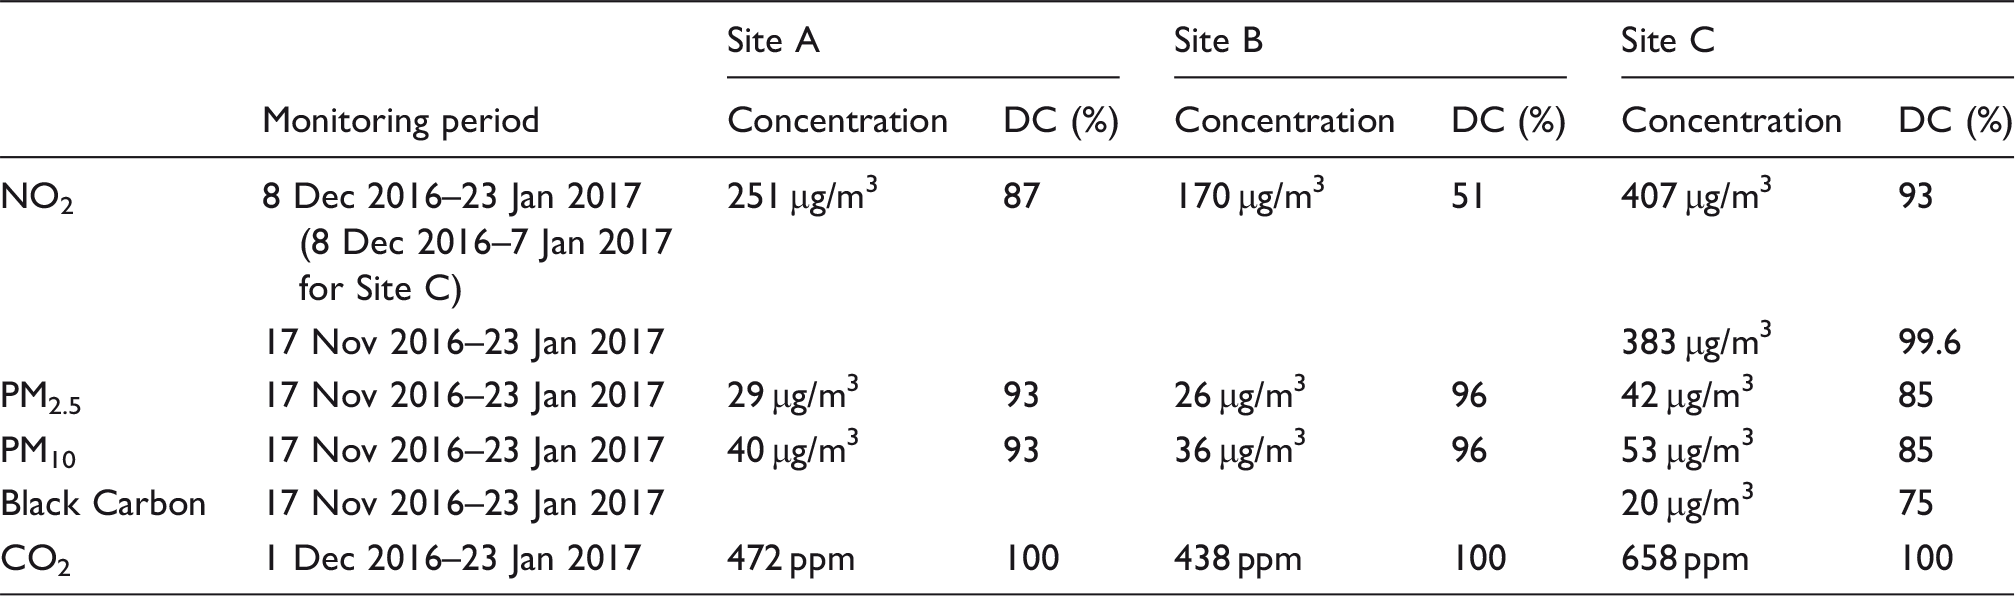
PM: particulate matter.
Daily and hourly averages of NO2, PM2.5 and PM10
Figure 3(a) shows the daily averages of NO2, as measured by the Horiba APNA-360 and AQ Mesh instruments, at Site C over the measurement period. The agreement can be seen to be good and thus the AQ Mesh will be used for further comparison as it recorded NO2 for the entire monitoring campaign, unlike the Horiba APNA-360.
(a) NO2 concentrations from the AQ Mesh (solid line) and Horiba APNA-360 analyser (dashed line) at Site C on platform 10/11, (b) daily NO2 concentration, (c) daily PM2.5 concentration, (d) daily PM10 concentration for Site A (dashed line), Site b (cross-dashed line), Site C (solid line) on platform 10/11. Note daily NO2 concentration for Site C was measured using the AQ Mesh. PM: particulate matter.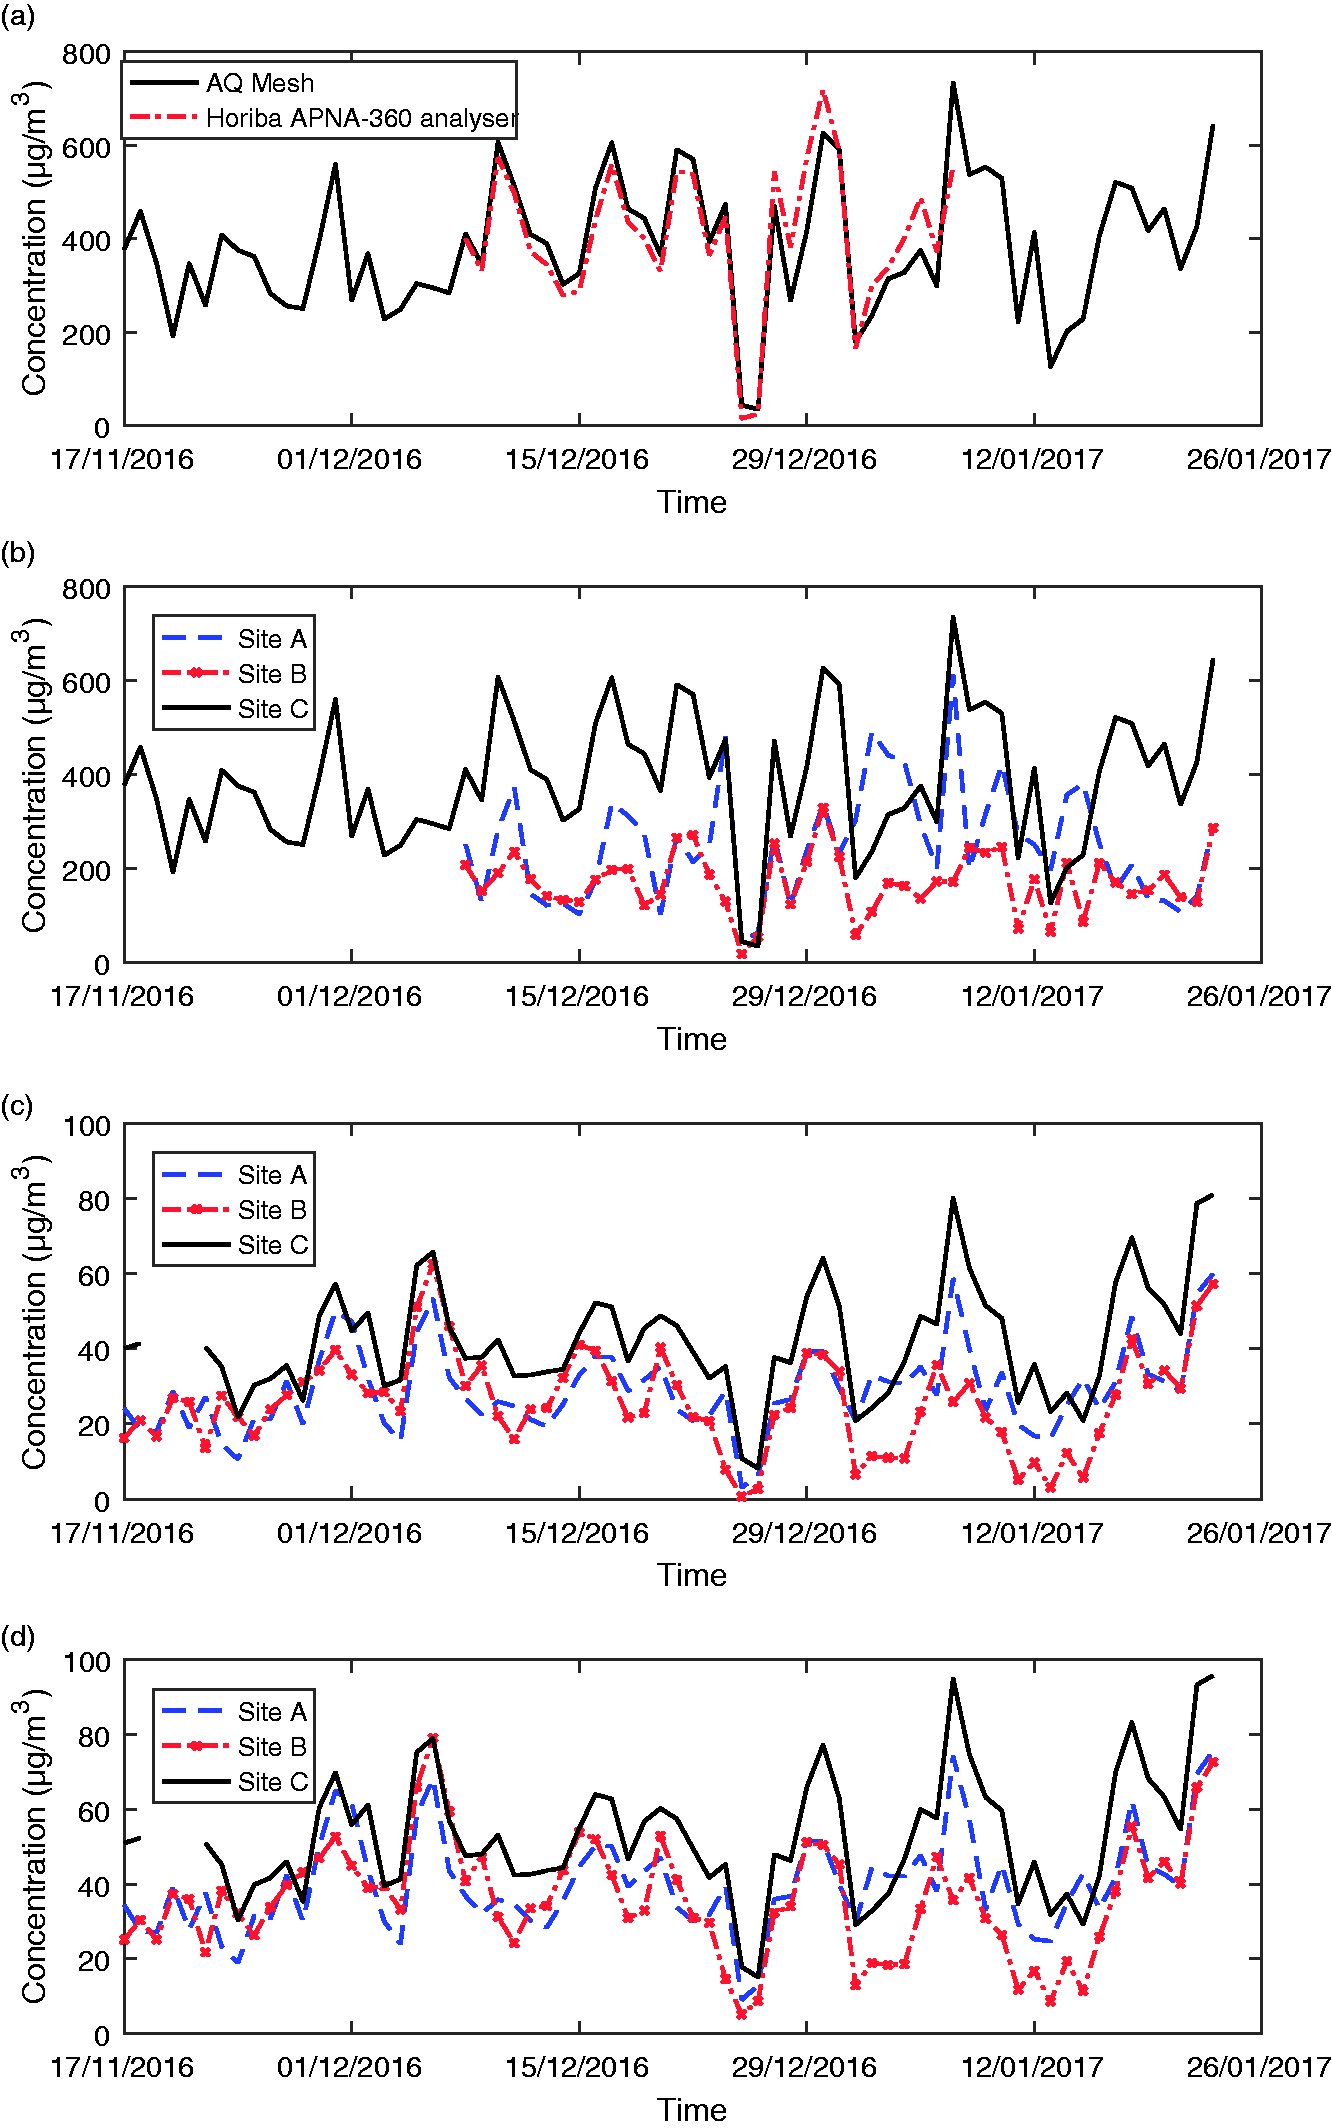
Maximum hourly average concentration for the entire monitoring period and the number of times hourly NO2 concentration exceeded 200 µg/m3 for the monitoring period for sites A, B and C.
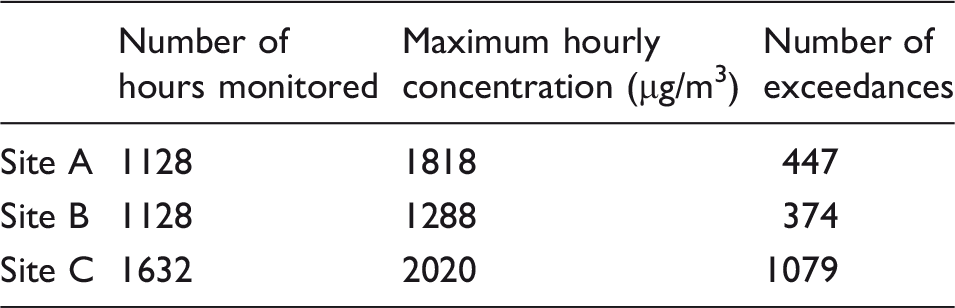
Figure 3(c) and (d) illustrates the PM2.5 and PM10 concentrations, respectively, at all three monitoring sites on platform 10/11. Like NO2, PM2.5 and PM10 concentrations are lower at sites A and B than at Site C. For PM10, there is a 24 h limit of 50 µg/m3, which is not to be exceeded more than 35 times per annum in ambient conditions. At Site C, the 24 h PM10 average is over 50 µg/m3 on 33 out of the 68 measurement days and would almost certainly exceed this limit. Sites A and B only exceeded the limit on 14 and 12 days, respectively, and again are highly likely to breach the annual limit.
PM appears to follow the same trend at all three sites (Figure 3(c) and (d)), whereas NO2 (Figure 3(b)) shows some differences. This is likely to be due to atmospheric chemistry affecting the concentration of NO2, primarily by NO oxidation, at varying rates at each site.
All pollutant concentrations fall considerably on Christmas Day and Boxing Day, when there were no passenger trains at Birmingham New Street, to values of around 39 µg/m3 for NO2, 10 µg/m3 for PM2.5, 17 µg/m3 for PM10, 875 ng/m3 for black carbon and 414 ppm for CO2.
Figure 4 shows a comparison of NO2 measurements, at Site C, against the average wind speed along the platform. The average wind speed along the platform is calculated by averaging wind data from sites A and B. Visually it can be seen that there is an indication that when there is a low wind speed, less than 0.05 m/s (the grey bars in the figure) concentration levels are high. This is to some extent confirmed by Figure 4(c) and the negative correlation coefficient of −0.39.
(a) Time series NO2 concentration at Site C with shading indicating when average along platform wind speed (data averaged from Sites A and B) is less than 0.05 m/s, (b) average wind speed along the platform, using data from Sites A and B, with shading where wind speed is less than 0.05 m/s and (c) the correlation of the magnitude of the average wind speed and NO2 concentration with a linear regression line for Site C. Positive wind speed indicates wind in a westerly direction along the platform and negative, easterly.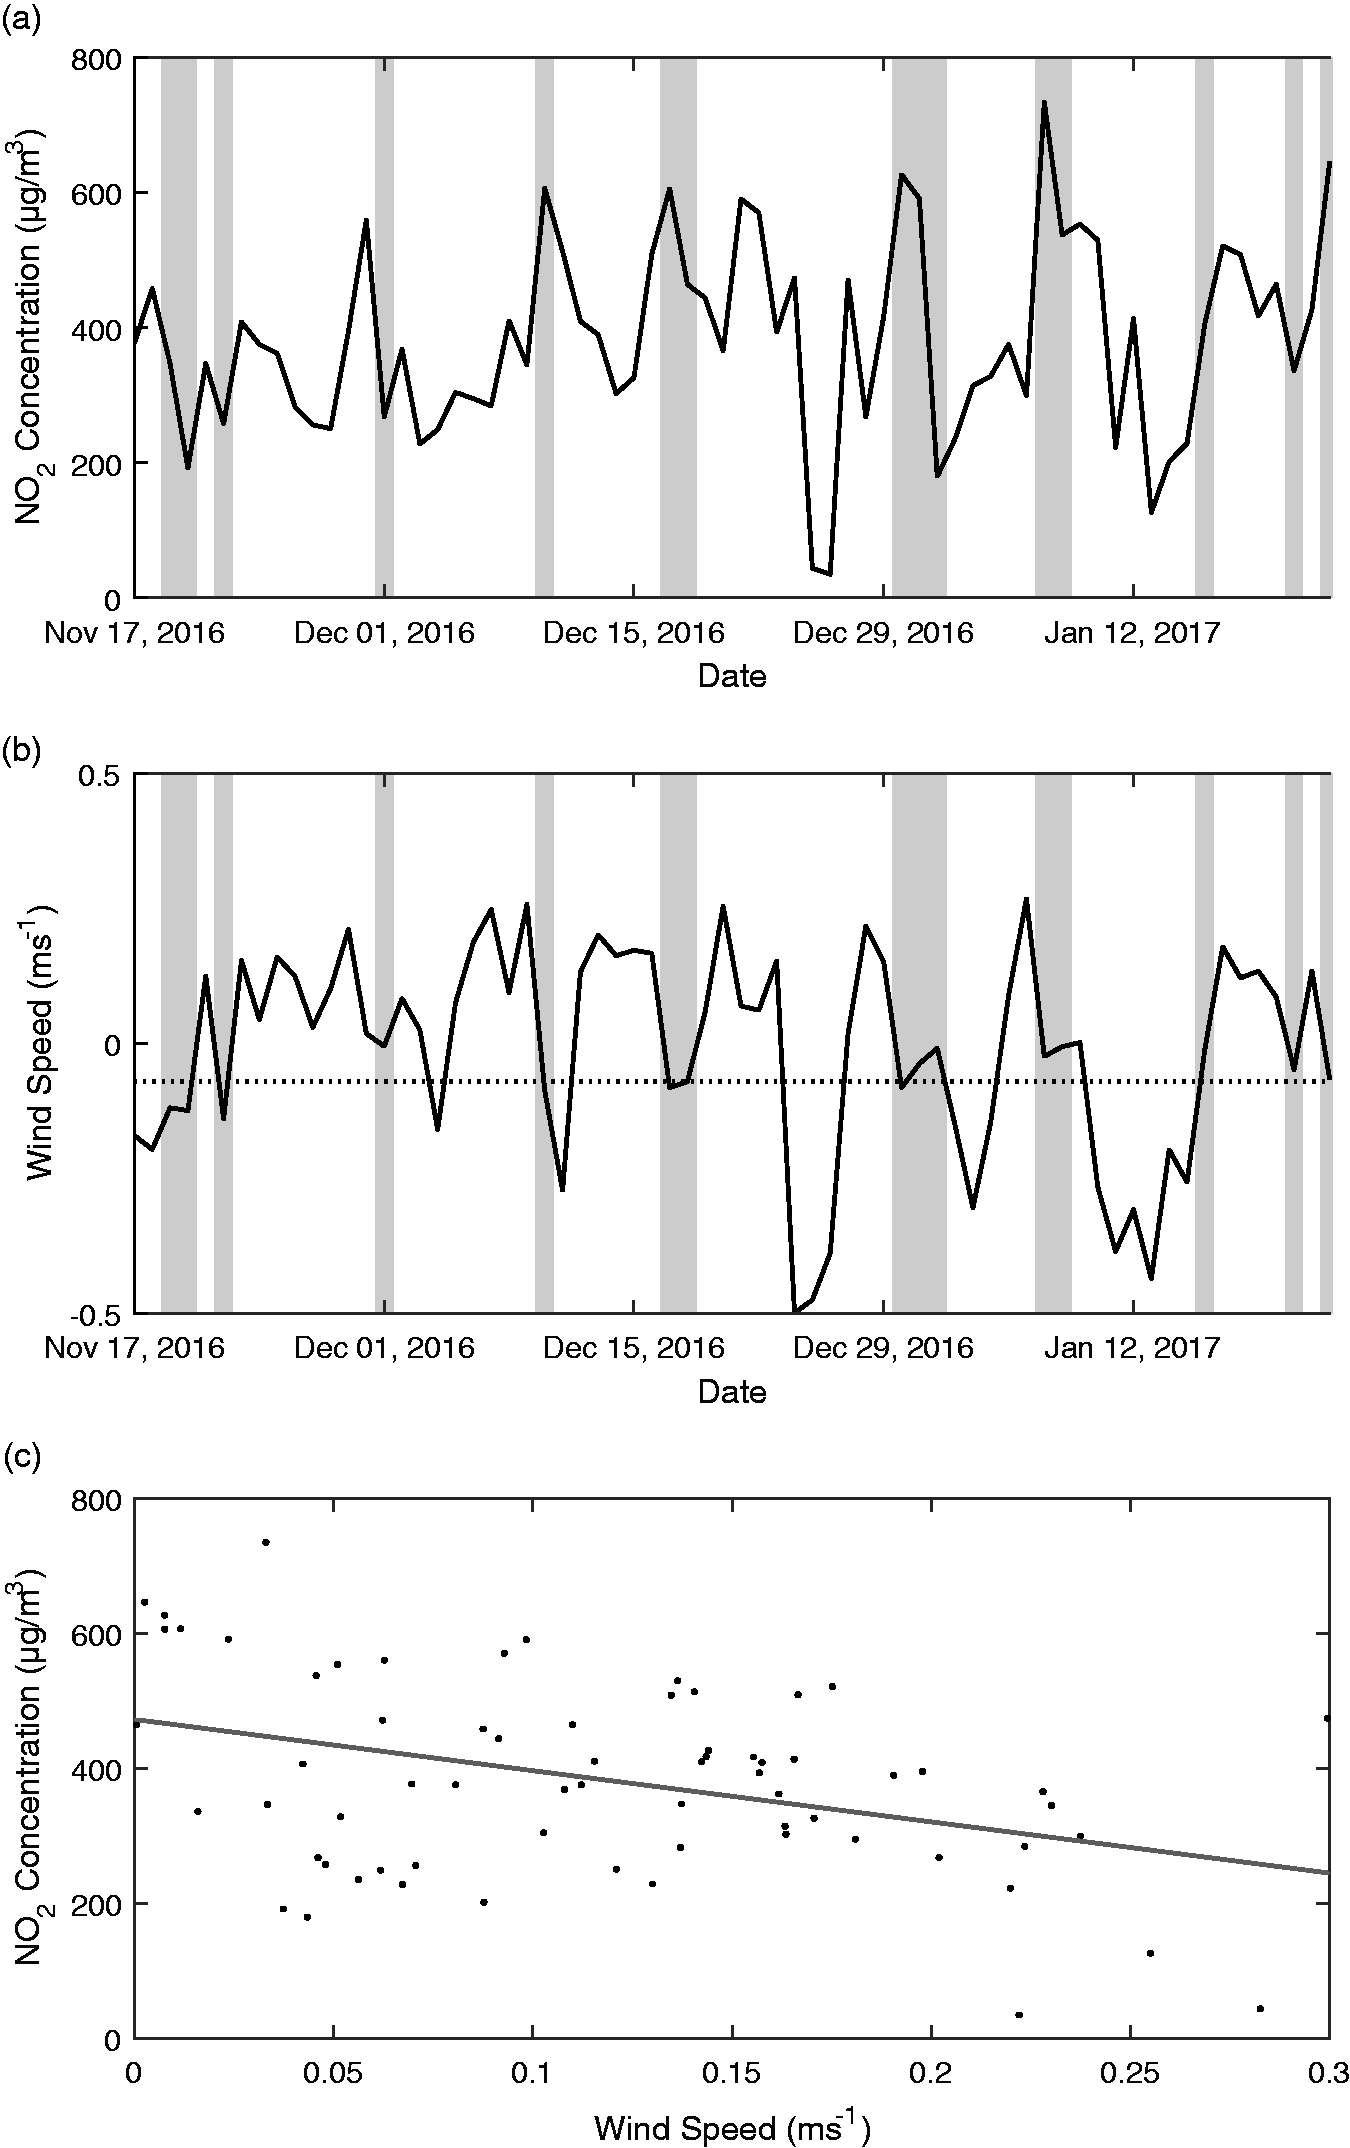
Daily time series
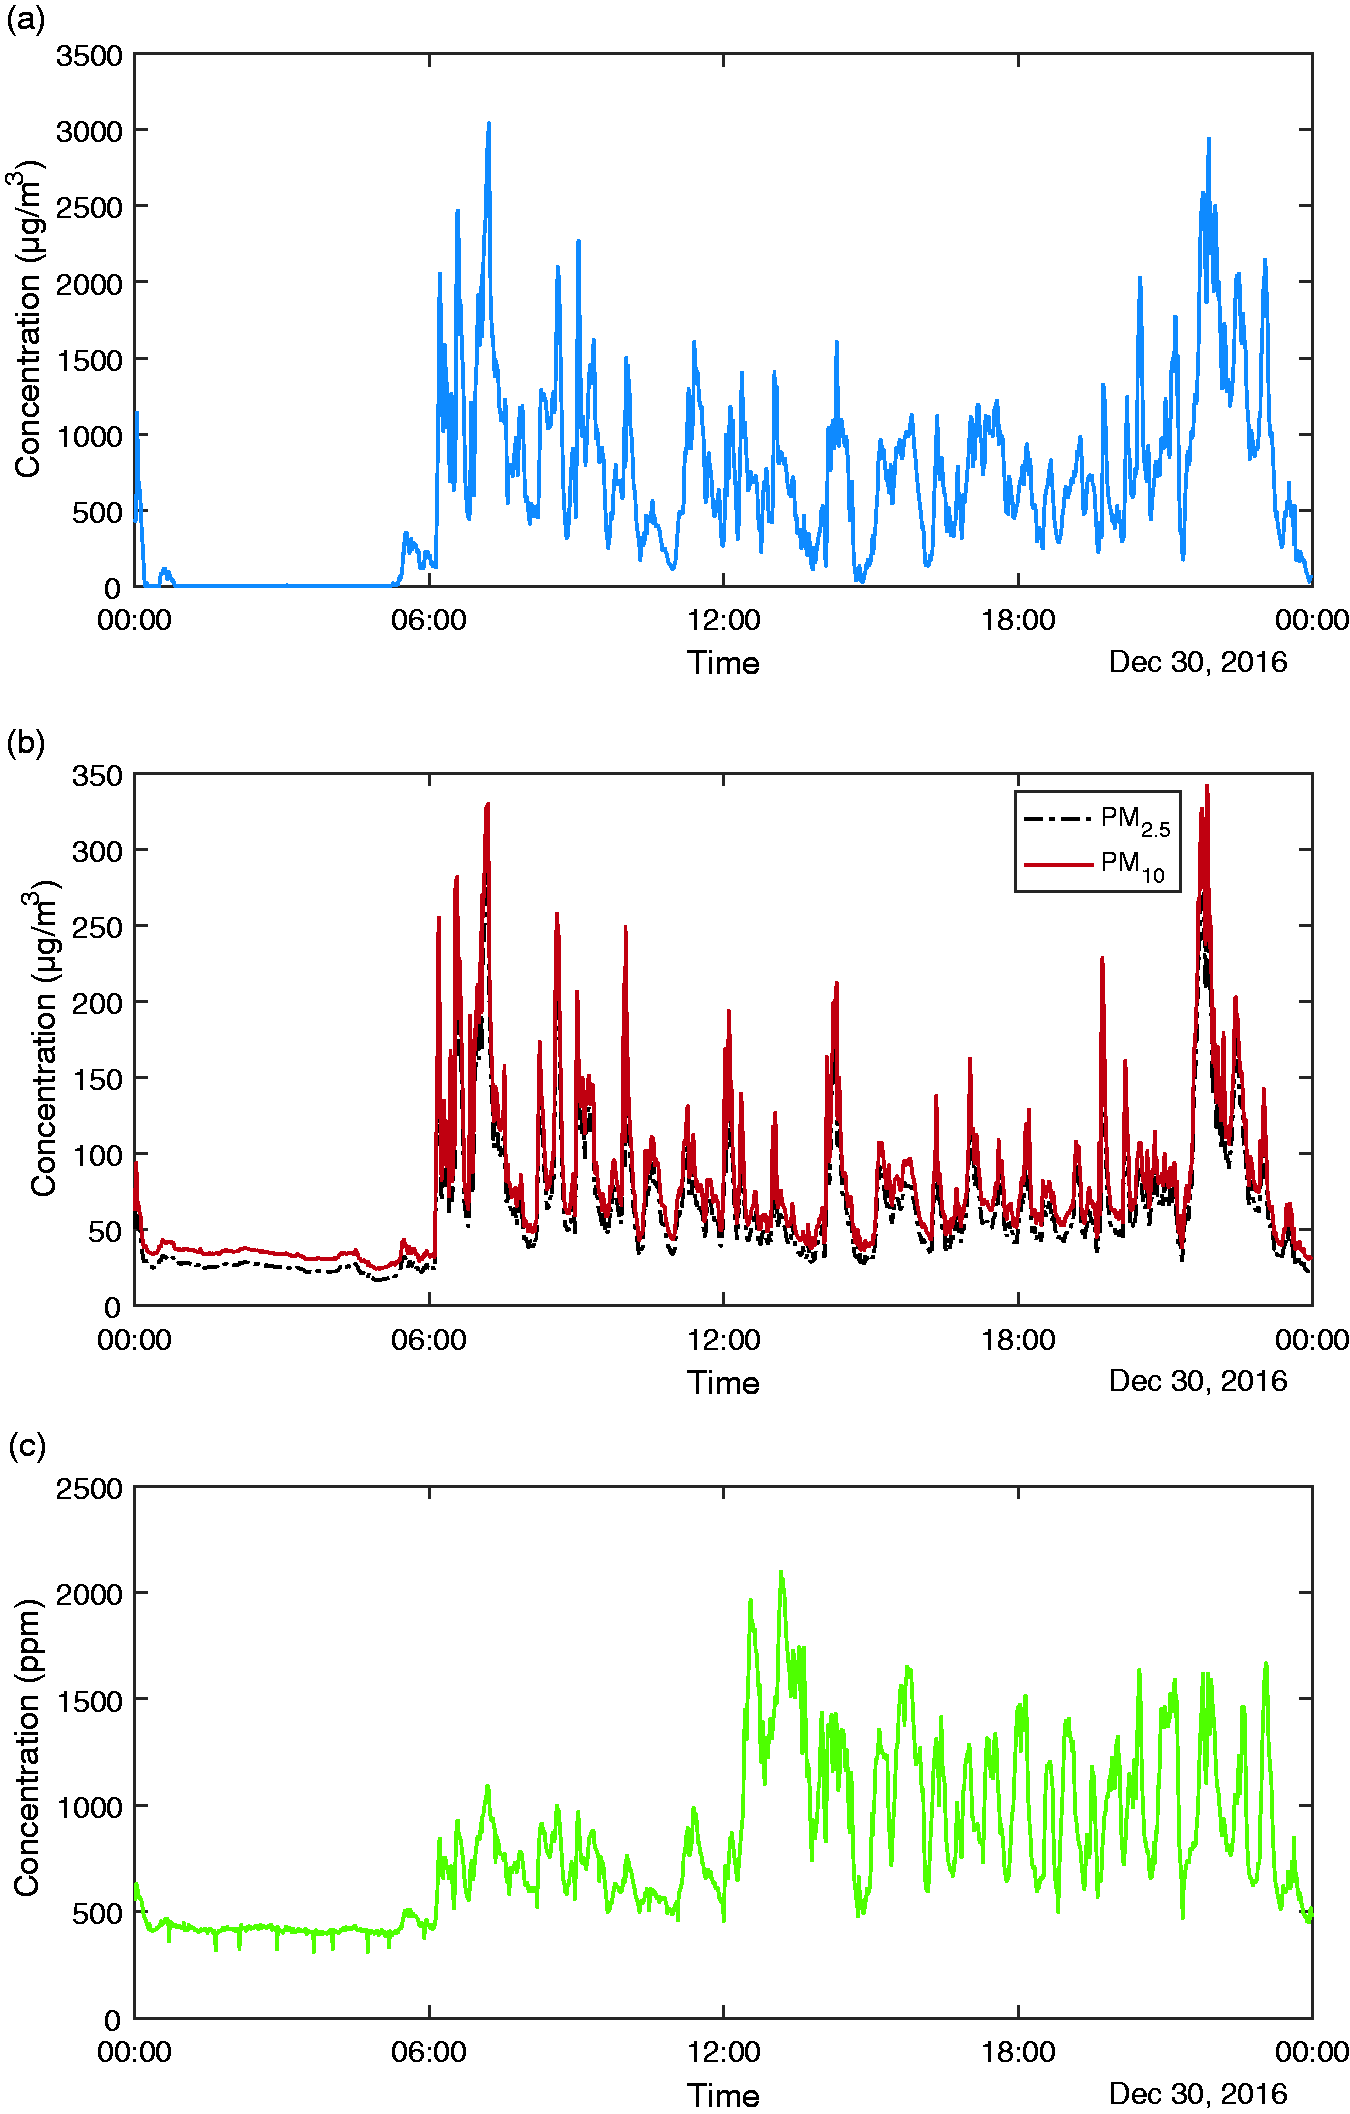
Two days were chosen for detailed analysis of the results: 14 December 2016, when concentrations of NO2 and PM were low and wind speeds were relatively high, and 30 December 2016, when concentrations were high and wind speeds were low. Figures 5 and 6 show minute concentrations of NO2, PM and CO2 for 14 and 30 December, respectively. The NO2 and PM concentration shows a significant variation through the day, with low levels at night and generally high levels in the early morning and late evening.
Minute concentrations of (a) NO2, (b) PM2.5 (dashed line) and PM10 (solid line) and (c) CO2 for 14 December 2016. PM: particulate matter. Minute concentrations of (a) NO2, (b) PM2.5 (dashed line) and PM10 (solid line) and (c) CO2 for 30 December 2016. PM: particulate matter.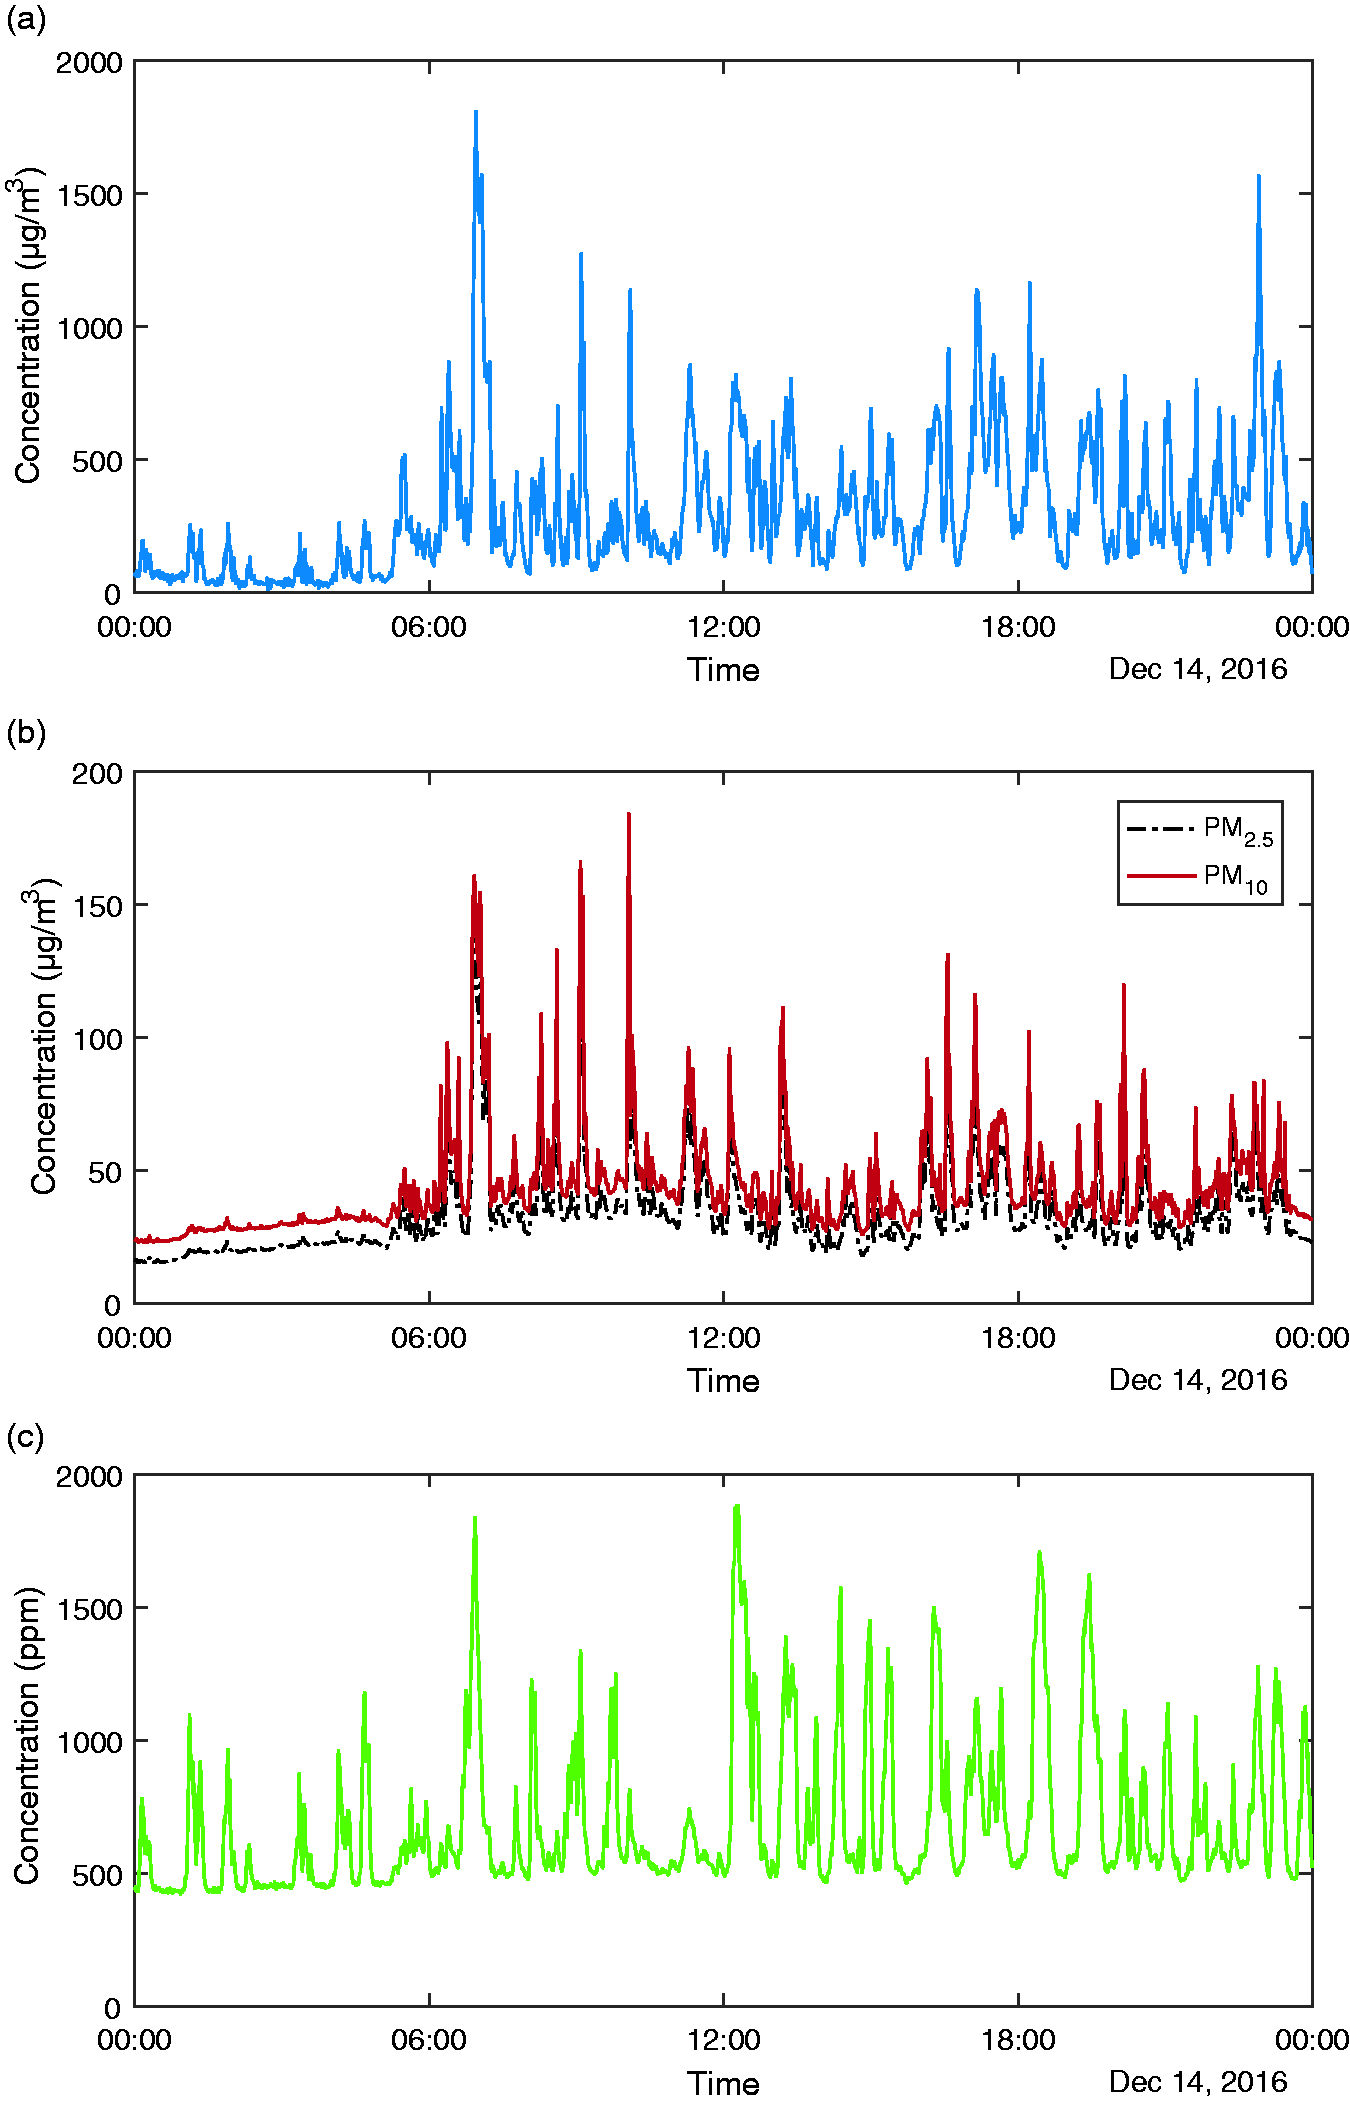
R2 of CO2 to NO2, PM2.5 and PM10 for 14 and 30 December 2016.
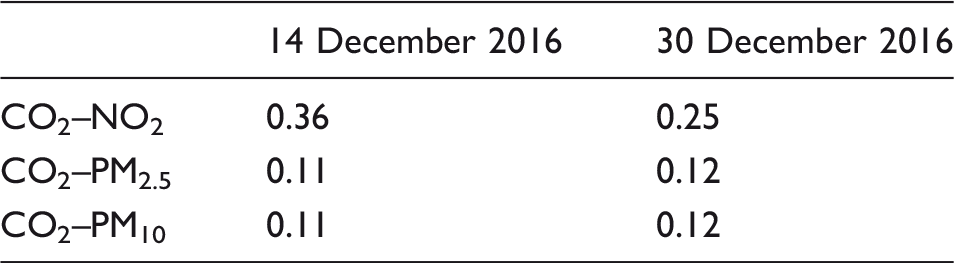
PM: particulate matter.
There is an indirect source of NO2 production, from NO oxidation, which makes it increasingly difficult to identify peaks with particular trains as the days go on, due to the effect of previous trains. Figure 7 shows the variation of the NO/NO2 ratio for 14 and 30 December 2016, as measured at Site C using data from the Horiba APNA-360 analyser. During the day, this ratio is around 5. It can be seen that this ratio falls in the night, when there are no train movements, and increases around 5 am, when train activity resumes. This could be mainly attributed to the lack of NO emissions from diesel trains during the night, due to lack of train activity. The oxidation of NO to NO242 would contribute also to the observed pattern of small NO/NO2 ratio during the night since small peaks of NO2 are observed throughout the night period (Figure 8).
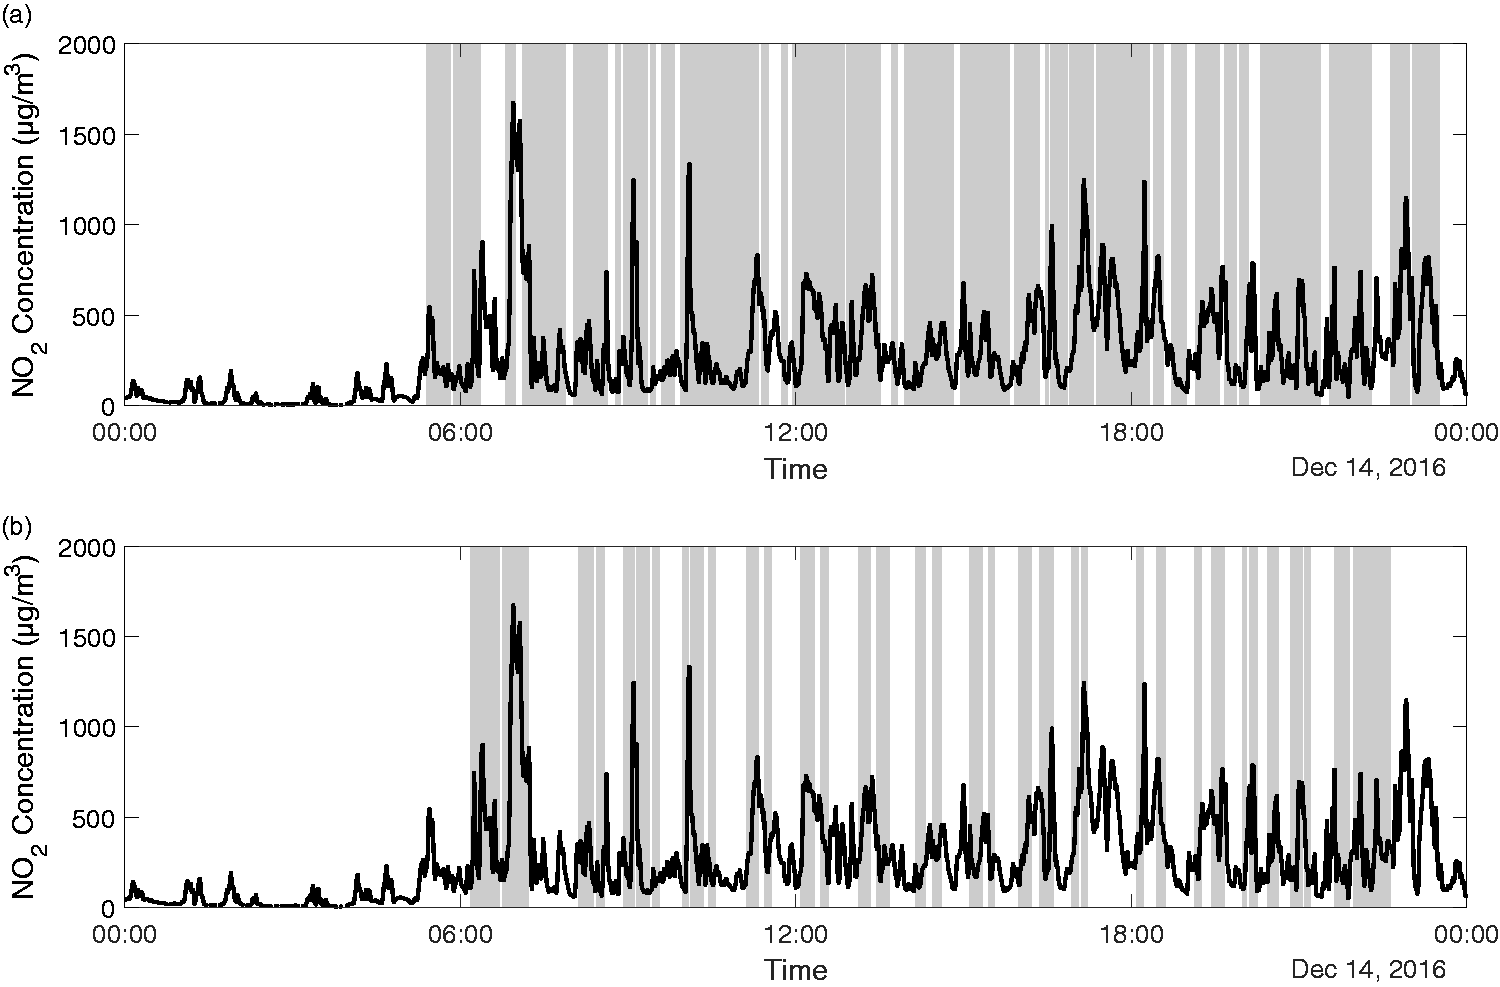
NO/NO2 ratio for (a) 14 December 2016 and (b) 30 December 2016. Minute NO2 concentration (µg/m3) for 14 December 2016 with shading showing when (a) class 158/170 (Super Sprinter/Turbostar) and (b) Class 220/221 (Voyager) trains are occupying platform 10 and/or 11.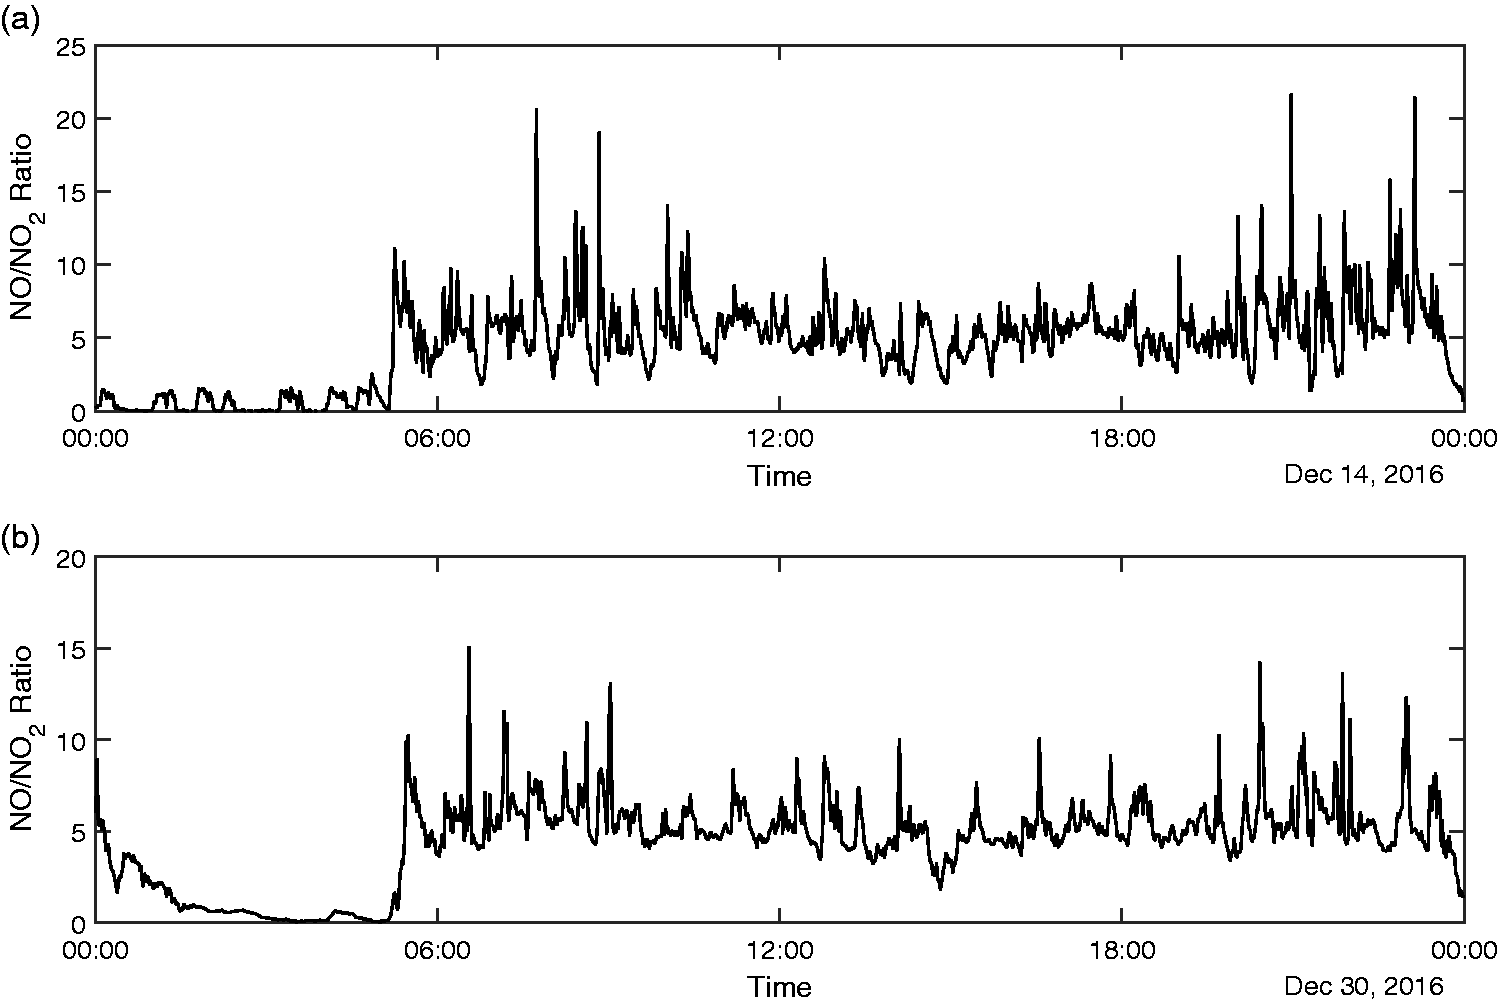
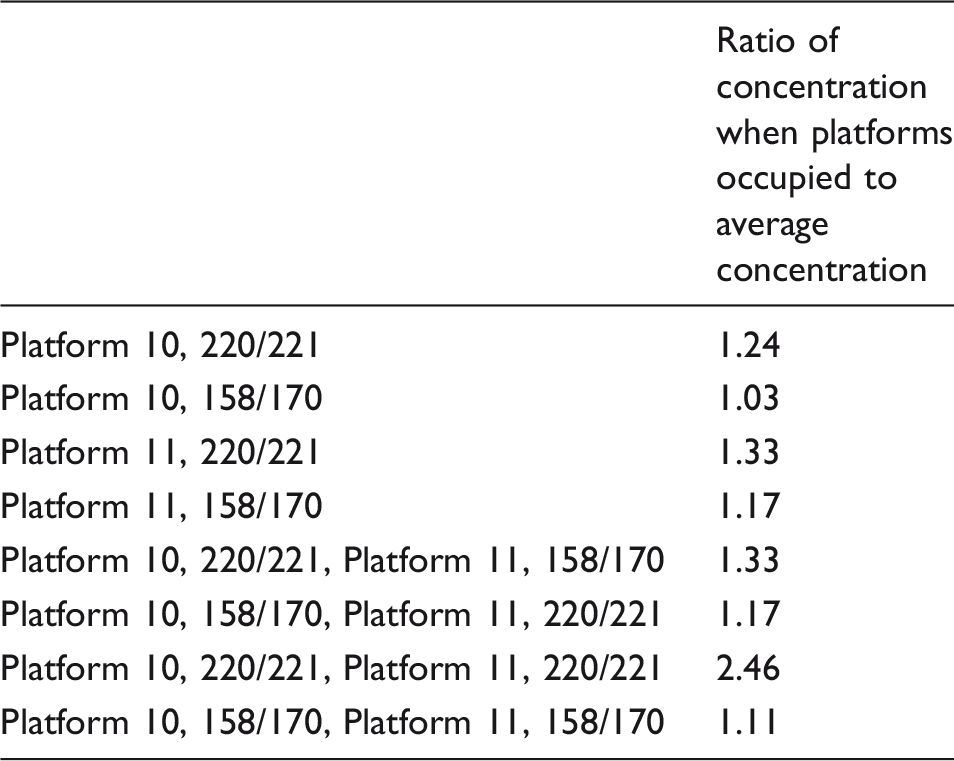
NO2 ratios for platform occupancy periods for different train types to daily averages (measured between 04:00 and 24:00).
Discussion and concluding remarks
From the experimental results described earlier in this paper, it is clear that the concentrations of the NO2, PM10 and PM2.5 at Birmingham New street are all very high, and significantly in excess of the various EU limits given in the ‘Introduction’ section, particularly significant with regard to NO2. Note again however, that these EU limits are not legally applicable to stations in the UK. The concentrations of NO2 can approach and exceed the WELs at times, although as staff exposure times were not measured, it is not possible to say if these guidelines were exceeded for station staff. The average of the daily maximum hourly concentrations at the central site over the measurement period was 1048 µg/m3, which compared to an average of 75 µg/m3 on the A4540, Birmingham Ring Road, over the same period.
It is thus clear that mitigation methods are required. These will be discussed further below. In the first instance, however, it is of interest to consider some general points relating to the experimental results. First, the effect of ambient wind conditions on the concentrations is clear from Figure 4, with higher external winds causing pollutants to be exhausted from one end of the station or the other. For different station geometries, with different ventilation patterns, wind effects can be expected to be different, but nonetheless the results do suggest that wind-induced ventilation of stations should be taken into account in any design of ventilation systems, to ensure that the systems act with, rather than against, such effects. The system installed at New Street works with wind direction, although the system was not fully operational at time of monitoring.
Second, the limited work that has been done to relate train movements to pollutant concentrations shows that in some instances high peak values can be associated with specific trains, particularly early in the day, but later in the day, whilst higher than average concentrations can be associated with platform occupancy by diesel trains in statistical terms, the effect of individual trains is difficult to discern. This is believed to be for two reasons. First, there is the general diffusion of high concentration levels across the station as the day proceeds, and emissions from vehicles continue. Second, Figure 7 shows that overnight the ratio of NO to NO2 falls significantly, indicating that oxidation of the former is taking place. This can also be expected to be happening throughout the day – in other words, NO2 is produced by secondary processes as well as primary emissions. Again, this makes identifying individual trains particularly challenging. This should also be taken into account in considering the design of suitable ventilations systems.
With regard to the specific situation at Birmingham New Street itself, it is clear that, although the legal situation does not require it, such methods are, at the time of writing, being actively pursued by Network Rail and the train operating companies. These include the following:
The optimisation of the ventilation system and the development of suitable operational strategies for this system. Note that the experimental results show that the correlations between CO2 and the other pollutants are only moderate (despite HSE guidance that it can be used as a surrogate for other pollutant species
44
) and care will be required in using it as a surrogate for the other pollutants, in the triggering of the fan system. Fan running periods beyond the initial detection may be the solution but yet to be confirmed with validation. Changes in operational procedures to ensure that engines of diesel trains are turned off whenever possible when they are scheduled to remain in the station for any length of time, and to investigate the possibility of stopping diesel trains in the more open parts of the station towards the ends of the platform, are under development with the station team and train operators.
Of course, the obvious long-term solution would be to adopt the strategy being pursued by large sections of the automotive industry, in the development of electric cars, and the move away from diesel and petrol vehicles, and to eliminate diesel trains completely with whole system electrification with energy being provided by ‘green’ sources. This possibility is not being considered by the UK Department for Transport and current strategies see the development of electric/diesel hybrids in the near future.
Considering the wider picture, it is by no means clear whether such high concentrations can be expected in other railway station environments, as Birmingham New Street is in some way unique, with a large proportion of diesel trains in what can be classed as an underground station. Other station topographies, with more open platforms or with much higher train sheds, can be expected to have lower concentration levels. Clearly this is an area where further work is required, to assess pollutant concentrations in other railway station geometries. There are a number of other areas that would also benefit from further research:
The current data set needs to be more fully analysed to look at the environmental effects of concentration levels, and also to investigate, in depth, the relationship between the concentrations and individual trains. An investigation into tail pipe measurements to gain an understanding of the nature of diesel engine emissions from a variety of different train types. Previous emissions data have already been collected for Class 220.
45
The measurement of NOX and PM concentrations on-board trains, and in other enclosed railway environments, such as tunnels and cuttings. The measurements of concentrations of metallic particles from brake, rail and overhead line wear. The development of an understanding of pollutant dispersion in railway environments, in particular the dispersion by slow moving trains.
Footnotes
Acknowledgements
This work was carried out as part of the University of Birmingham/Network Rail Strategic Partnership. The help and advice of Network Rail colleagues at Birmingham New Street station, especially Ian Oakley and his team for their work during installation and disassembly, are gratefully acknowledged as is the assistance offered by colleagues in the Birmingham Centre for Railway Research and Education, especially Mani Entezami and Sarah Jordan. Peter Porter from Birmingham City Council, Zoe Fleming from Leicester University and staff from Public Health England gave helpful advice and loaned equipment for use in the project, and their help was much appreciated.
Declaration of Conflicting Interests
The author(s) declared no potential conflicts of interest with respect to the research, authorship, and/or publication of this article.
Funding
The author(s) disclosed receipt of the following financial support for the research, authorship, and/or publication of this article: The first author was supported by an EPSRC Scholarship from the School of Engineering at the University.