
Abstract
Computational fluid dynamics modelling of internal two-phase flow induced transient forces at 90° elbows have been carried out to evaluate the effect of pipe diameter on the characteristics of multiphase flow induced vibration. Simulations of two-phase flows of slug, cap bubbly and churn induced vibration at a pipe elbow were carried out using the volume of fluid model for the two-phase flows and the k – ε model for turbulence. Modal analysis has been carried out to evaluate the risk of resonance. Results were compared across three geometrically similar pipes of different diameters. Simulation results showed that the behaviours of the flow induced forces at the pipe elbow as a function of gas velocity for internal diameters of 0.0525 and 0.2032 m are similar. However, the multiphase flow induced force characteristics are different in the 0.1016 m diameter (intermediate) pipe. It can be attributed to the transition behaviour of gas–liquid two-phase flows caused by Taylor instability in an intermediate sized pipe. The predicted root-mean-square flow induced forces as a function of Weber number were correlated with an existing empirical correlation for a wider range of pipe sizes and gas volume fractions between 40% and 80%. Furthermore, the pipe natural frequencies increase with the increase of gas volume fraction in smaller pipes and the resonance risk increases with the increase of pipe diameter.
Keywords
Introduction
Internal multiphase flow induced vibration (MFIV) in pipe elbows poses significant fatigue failure risks in the piping network of oil and gas production, nuclear power plant and chemical process systems.1,2 Current industry guideline has been developed considering single-phase flows, while the few existing MFIV models reported in literature are based on small-scale laboratory experiments which do not completely address the differing multiphase flow mechanisms between small and large pipes. In addition, literature shows that MFIV is two-phase flow regime dependent with the slug and churn flows having the most significant forcing functions.1,3 Since flow regimes behaviours (especially slug and churn flow) and transition differ in small and large diameter pipes, the force correlations developed from experiments and modelling from small pipes can lead to costly flow assurance, pipeline integrity and safety problem if applied to large diameter pipes. Kataoka and Ishii
4
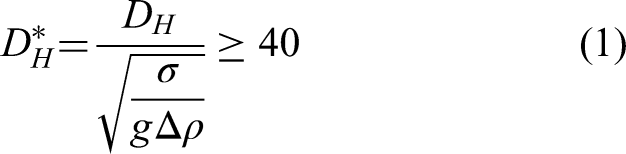
defined the critical diameter at which large slug bubble could no longer be sustained in a pipe as:
Experimental studies on MFIV in large pipes are few. The most relevant of such studies were conducted by Nennie and Belfroid 5 and Belfroid et al. 6 These experiments were also used to validate computational fluid dynamics (CFD) studies that were conducted in a subsequent phase of the project.7–9 These studies concluded that the fluctuations of liquid hold-up resemble the multiphase flow induced force fluctuations at pipe elbows. Belfroid et al. 10 summarised the results of all the test cases that were investigated by Nennie and Belfroid. 5 Their findings on the relationship between the non-dimensional force fluctuation and Weber number compared fairly to the model by Riverin et al. 11 and data from Liu et al. 3
Most of the reported literature on FIV in pipe bends in large pipes are for nuclear power plant applications. 12 Yamano et al. 13 results prove that both pipe size and configuration have effects on MFIV characteristics. The cost and hazard of comprehensive life scale experiments of oil and gas and nuclear power plant pipework could be prohibitive. Hence recent FIV investigations were mainly focused on numerical methods.14–16 Pontaza et al. 9 applied the volume of fluid (VOF) model for two-phase flows and large eddy simulation (LES) approach in their CFD investigation of MFIV and concluded that the standard deviation of flow induced forces agreed with the experimental measurements within ± 20%. A similar study was carried out by Emmerson et al. 7 using the CFD approach and their results showed that CFD was able to predict the magnitude of force fluctuation within 2–7%. Studies have applied U-RANS approach to capture the mechanism of FIV in large pipe bends due to pressure fluctuations, dominant in single-phase flows.12,13,17 In general, the risk of FIV increases in multiphase flows. 18
Additionally, a complete assessment of the dynamic behaviour of a structure vibrating under loading includes the determination of its modal parameters. Kim and Srinil 19 investigated a full-scale M-shaped subsea jumper transporting slug flows and established the resonance risk because the predominant frequencies of the stress and displacement fluctuations were similar to the natural frequencies of the jumper. Finally, Wang et al. 20 observed in their numerical study that the first three orders of natural frequencies of a pipeline conveying gas-liquid two-phase flow, increased as the gas volume fraction at pipe inlet increased. Their findings also showed that high amplitude and frequency of pressure and displacement fluctuations observed within the slug flow regime could induce excessive stress and fatigue failure in the pipeline.
In addition, the effect of added mass due to internal multiphase flow is crucial in evaluating the natural frequencies of a pipe structure and should not be ignored in an MFIV assessment. However, this effect has not been quantified and compared for different pipe sizes so far. Therefore, the present study has implemented a validated CFD approach 21 to model slug/cap-bubbly to churn-turbulent flow regime induced force fluctuations in pipes of 0.1016 m I.D. (intermediate size) and 0.2032 m I.D. (large size). A comparison of key FIV parameters of dominant frequency and RMS of flow induced force fluctuations has been carried out between previously reported laboratory scale pipe diameter of 0.0525 m I.D. (small) and the newly obtained data from intermediate and large pipes. Moreover, the effect of added mass due to internal multiphase flow on the natural frequencies of a pipe structure as a function of pipe diameter has been studied.
Numerical methods
Volume of fluid method
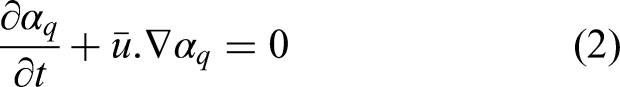
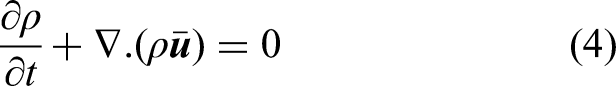
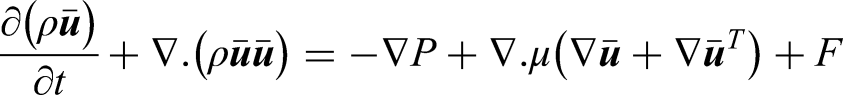
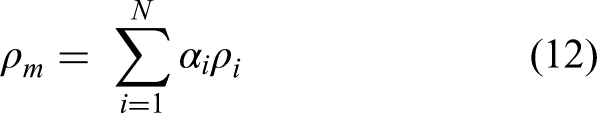
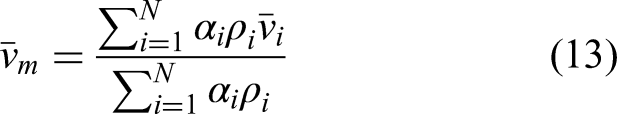
This study implements the VOF method to model the flow of air and water by solving a single set of momentum equations. In this method, an equation representing the conservation of the volume fraction α and one continuity equation for both phases are also solved. The VOF method tracks the volume fraction of each phase through the computational domain.22,23 The volume fraction continuity equation of one phase given in equation (2) is used to track the phases:
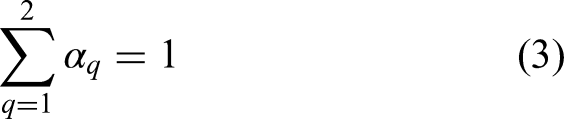
The volume fraction of the other phase is obtained from the relation

Turbulence model
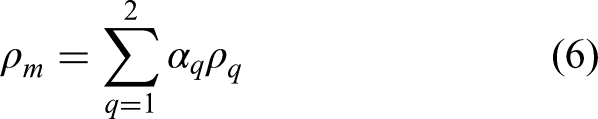
The mixture
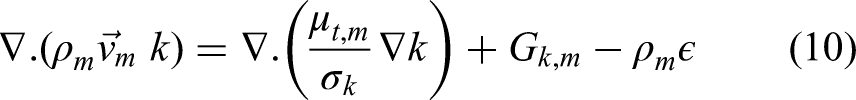
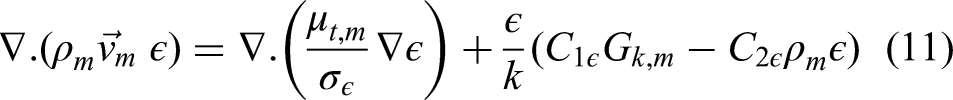
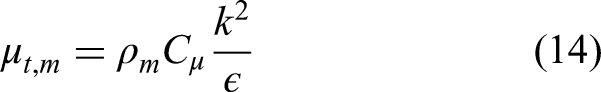

The standard k-ε URANS turbulence model requires a modest computing resource to produce a reasonably accurate solution compared to the rest models and approaches of calculating turbulence. It is well established and performs within reasonable accuracy for many industrial flows. The unsteady k-ε model cannot predict the turbulence pressure fluctuations, however, unlike single-phase flow, the effect of the impact forces on bends due to density difference of the alternating slugs and large interface waves, is more significant than the effect of turbulence fluctuations in two-phase slug/churn FIV.
Computational geometry
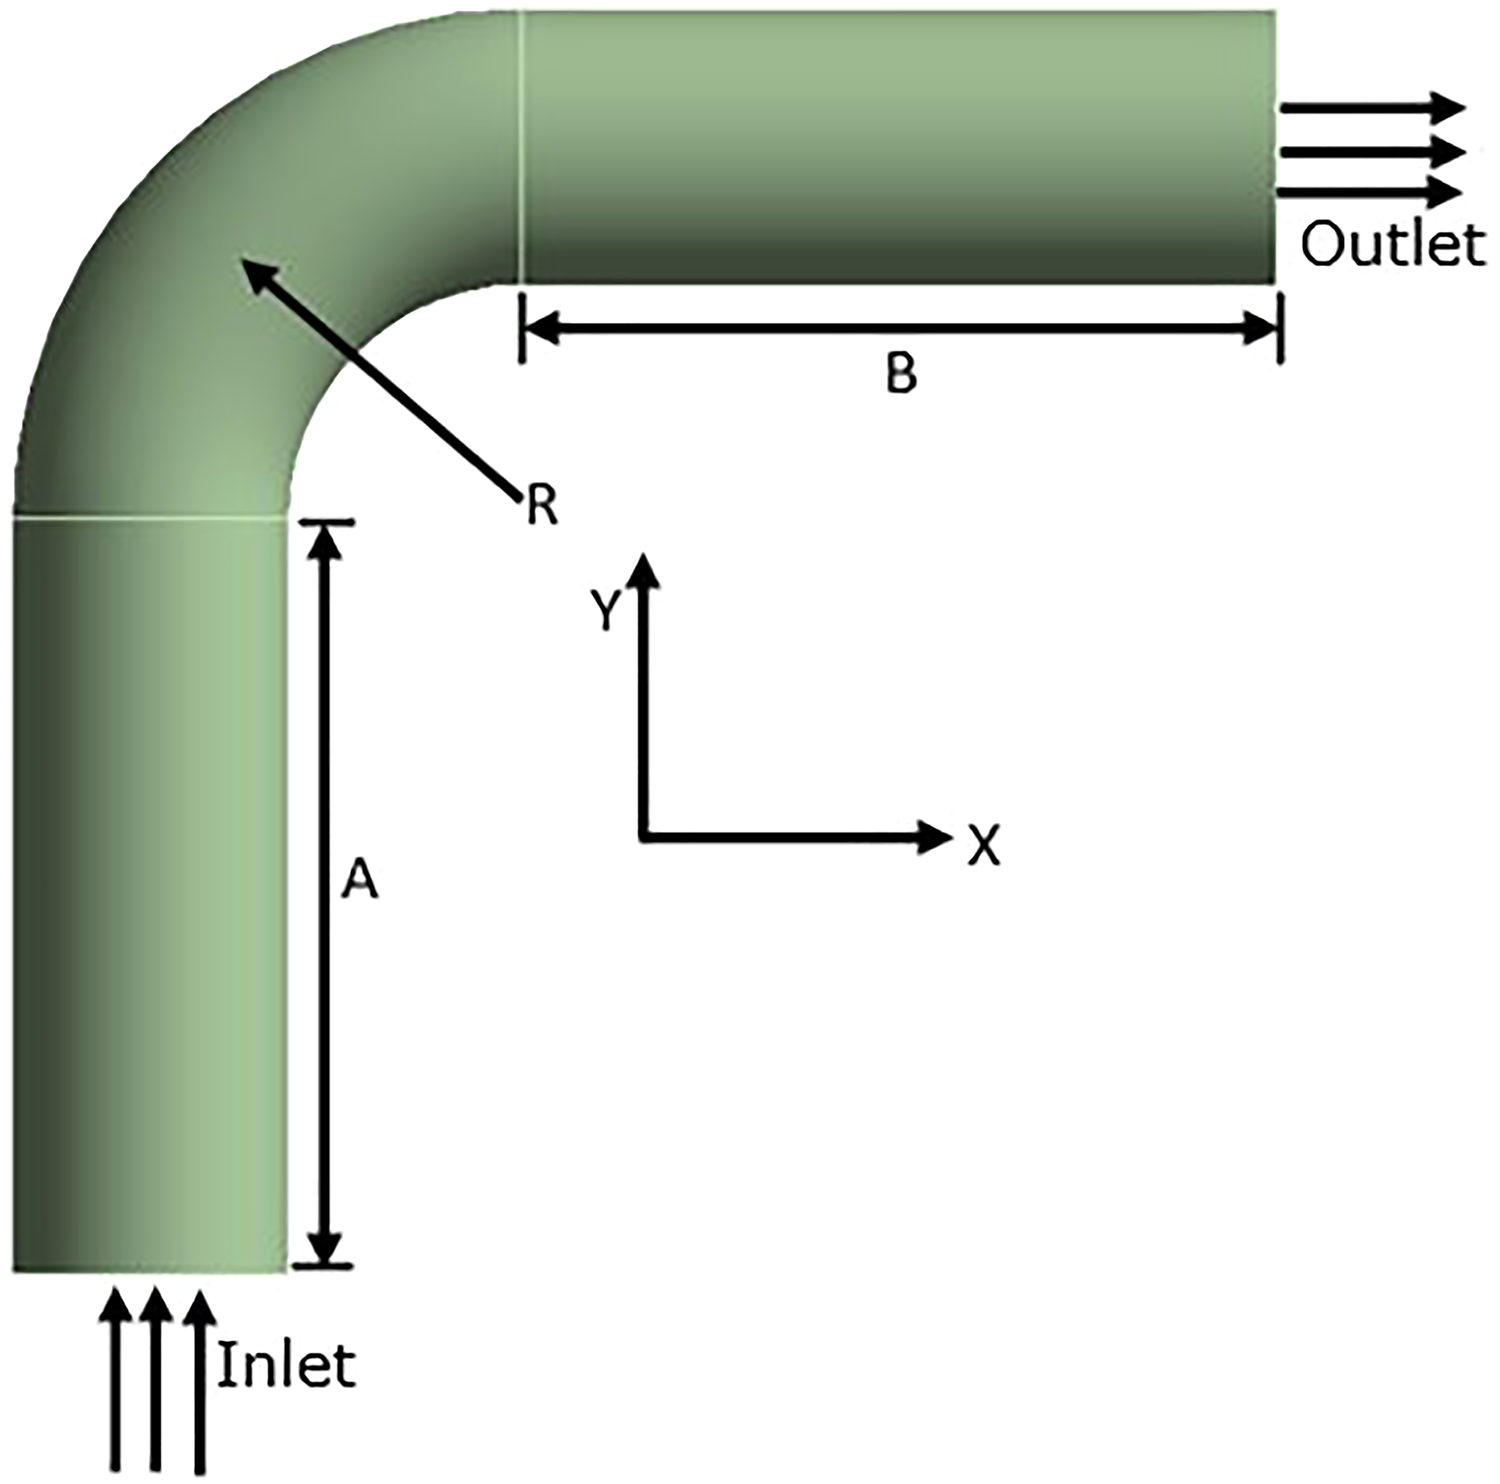
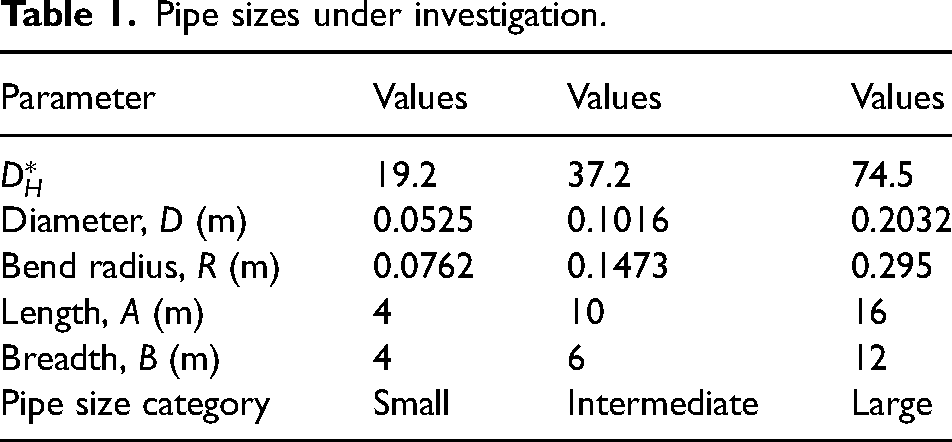
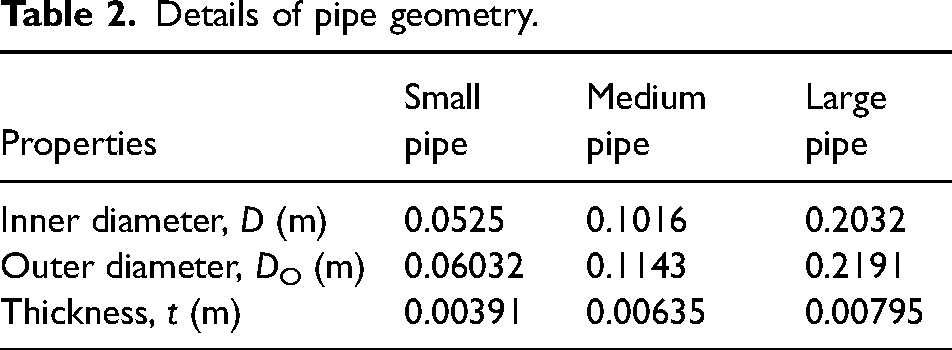
Three different pipe sizes presented in Table 1 were studied, the pipe sizes were categorised according to the critical diameter criteria. The pipe geometry is shown in Figure 1. Base case pipe geometry represented in Table 1 as small is taken from Liu et al. 3
Boundaries of the computational domain.
Pipe sizes under investigation.
Inlet and outlet boundary conditions
Based on the entrance length mechanism suggested by Taitel et al. 25 for slug-churn flow regime, with sufficiently long entrance length, multiphase flows introduced into a flow channel at individual phase velocities will eventually separate into the flow patterns corresponding to the superficial velocities. However, the concentric two inlets method described in Parsi et al. 26 has been utilised in the present study, where air and water are introduced into the pipe through two separate inlets. This method expedites the development of multiphase flow regimes. The central core in Figure 2 is used to introduce air by setting the air phase velocity while water was introduced through the outer annular region by setting the water phase velocity. Both are velocity inlets.

Domain inlet.
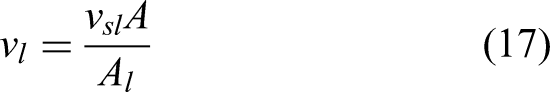
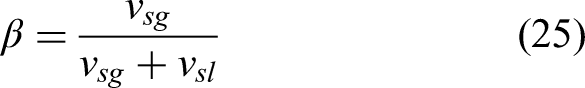
The phase velocities are calculated as: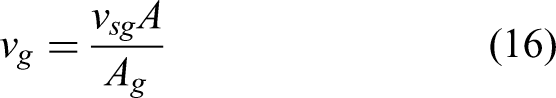
The turbulent intensity and hydraulic diameter given as I and 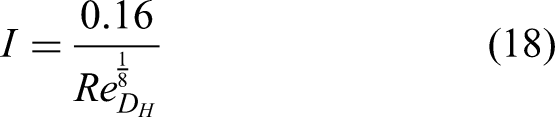
CFD solution methods
The choice of the time step size is conditioned by the Courant number-based stability criterion. Based on a pre-assigned maximum allowable Courant Number of 0.25 and the smallest time spent by fluids in cells (control volume) in the region near the free surface to empty out of the cell, the present numerical algorithm automatically refines the sub-time step for the volume fraction calculation. The sub-time step size is calculated as: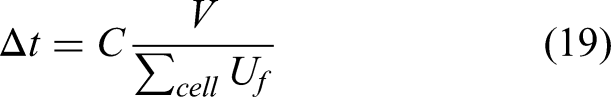
Natural frequency model
The natural frequencies and mode shapes are important parameters in the design of a structure under dynamic loading. A modal analysis determines the free vibration characteristics by solving a equation of motion for an undamped system.
27
The equation is given in matrix form for the elements of the structure model (Figure 3) as
28
:
Structural model.


Details of pipe geometry.
The test conditions and flow regime map
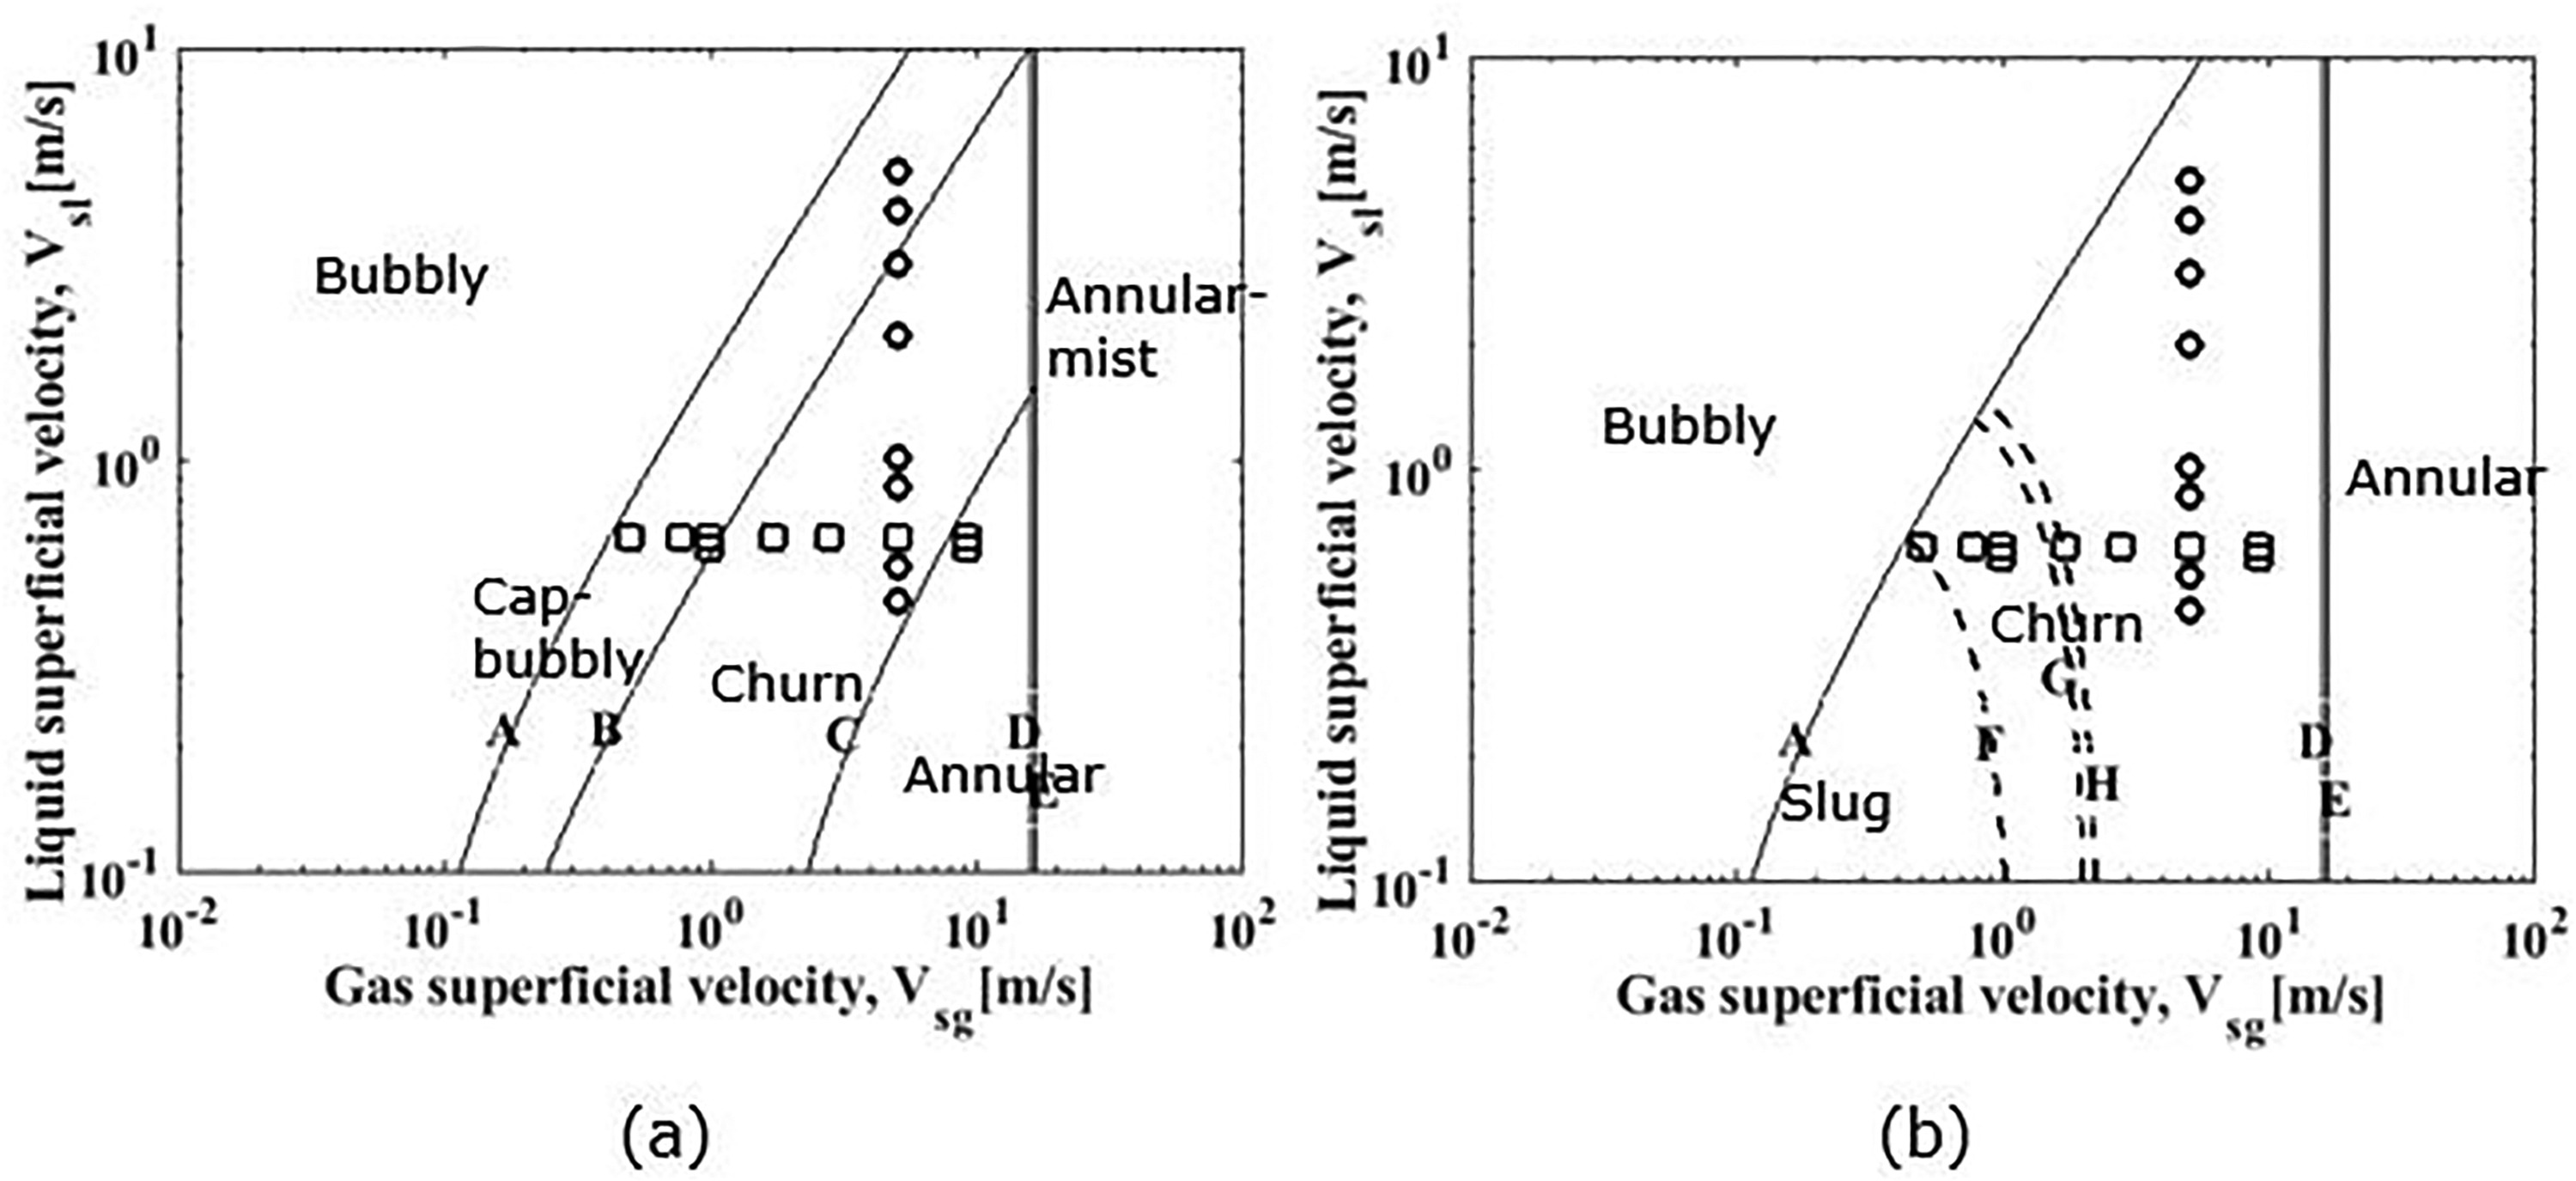
The flow conditions have been plotted on two vertical pipe flow regime maps based on Kaichiro and Ishii 29 and Taitel et al. 25 as shown in Figure 4(a) and (b), respectively. In Figure 4(a), Kaichiro and Ishii 29 flow regimes map shows the cap-bubbly flows for large pipe diameter, whereas in Figure 4(b) curves F, G, H show the transition from slug to churn depending on pipe sizes of 0.0525, 0.1016 and 0.2032 m, respectively.
Results and discussion
Mesh sensitivity and validation studies
The present CFD approach was validated and reported in an earlier study by Hossain et al. 21 In the validation, void fraction and flow induced force signals obtained from CFD simulations were qualitatively and quantitively compared to the experimental report of Liu et al. 3 for the 0.0525 m pipe diameter. The simulation results conformed with the experimental results. Supplemental Table 4 shows the scale-up of the 0.0525 I.D. pipe to the geometrically similar intermediate and large pipes of 0.1016 m and 0.2032 m I.D. shown in Table 1. Further mesh independency studies have been carried out for each of the pipe sizes. The pipe scaling was also adopted in reporting, the largest pipe scale is 1.
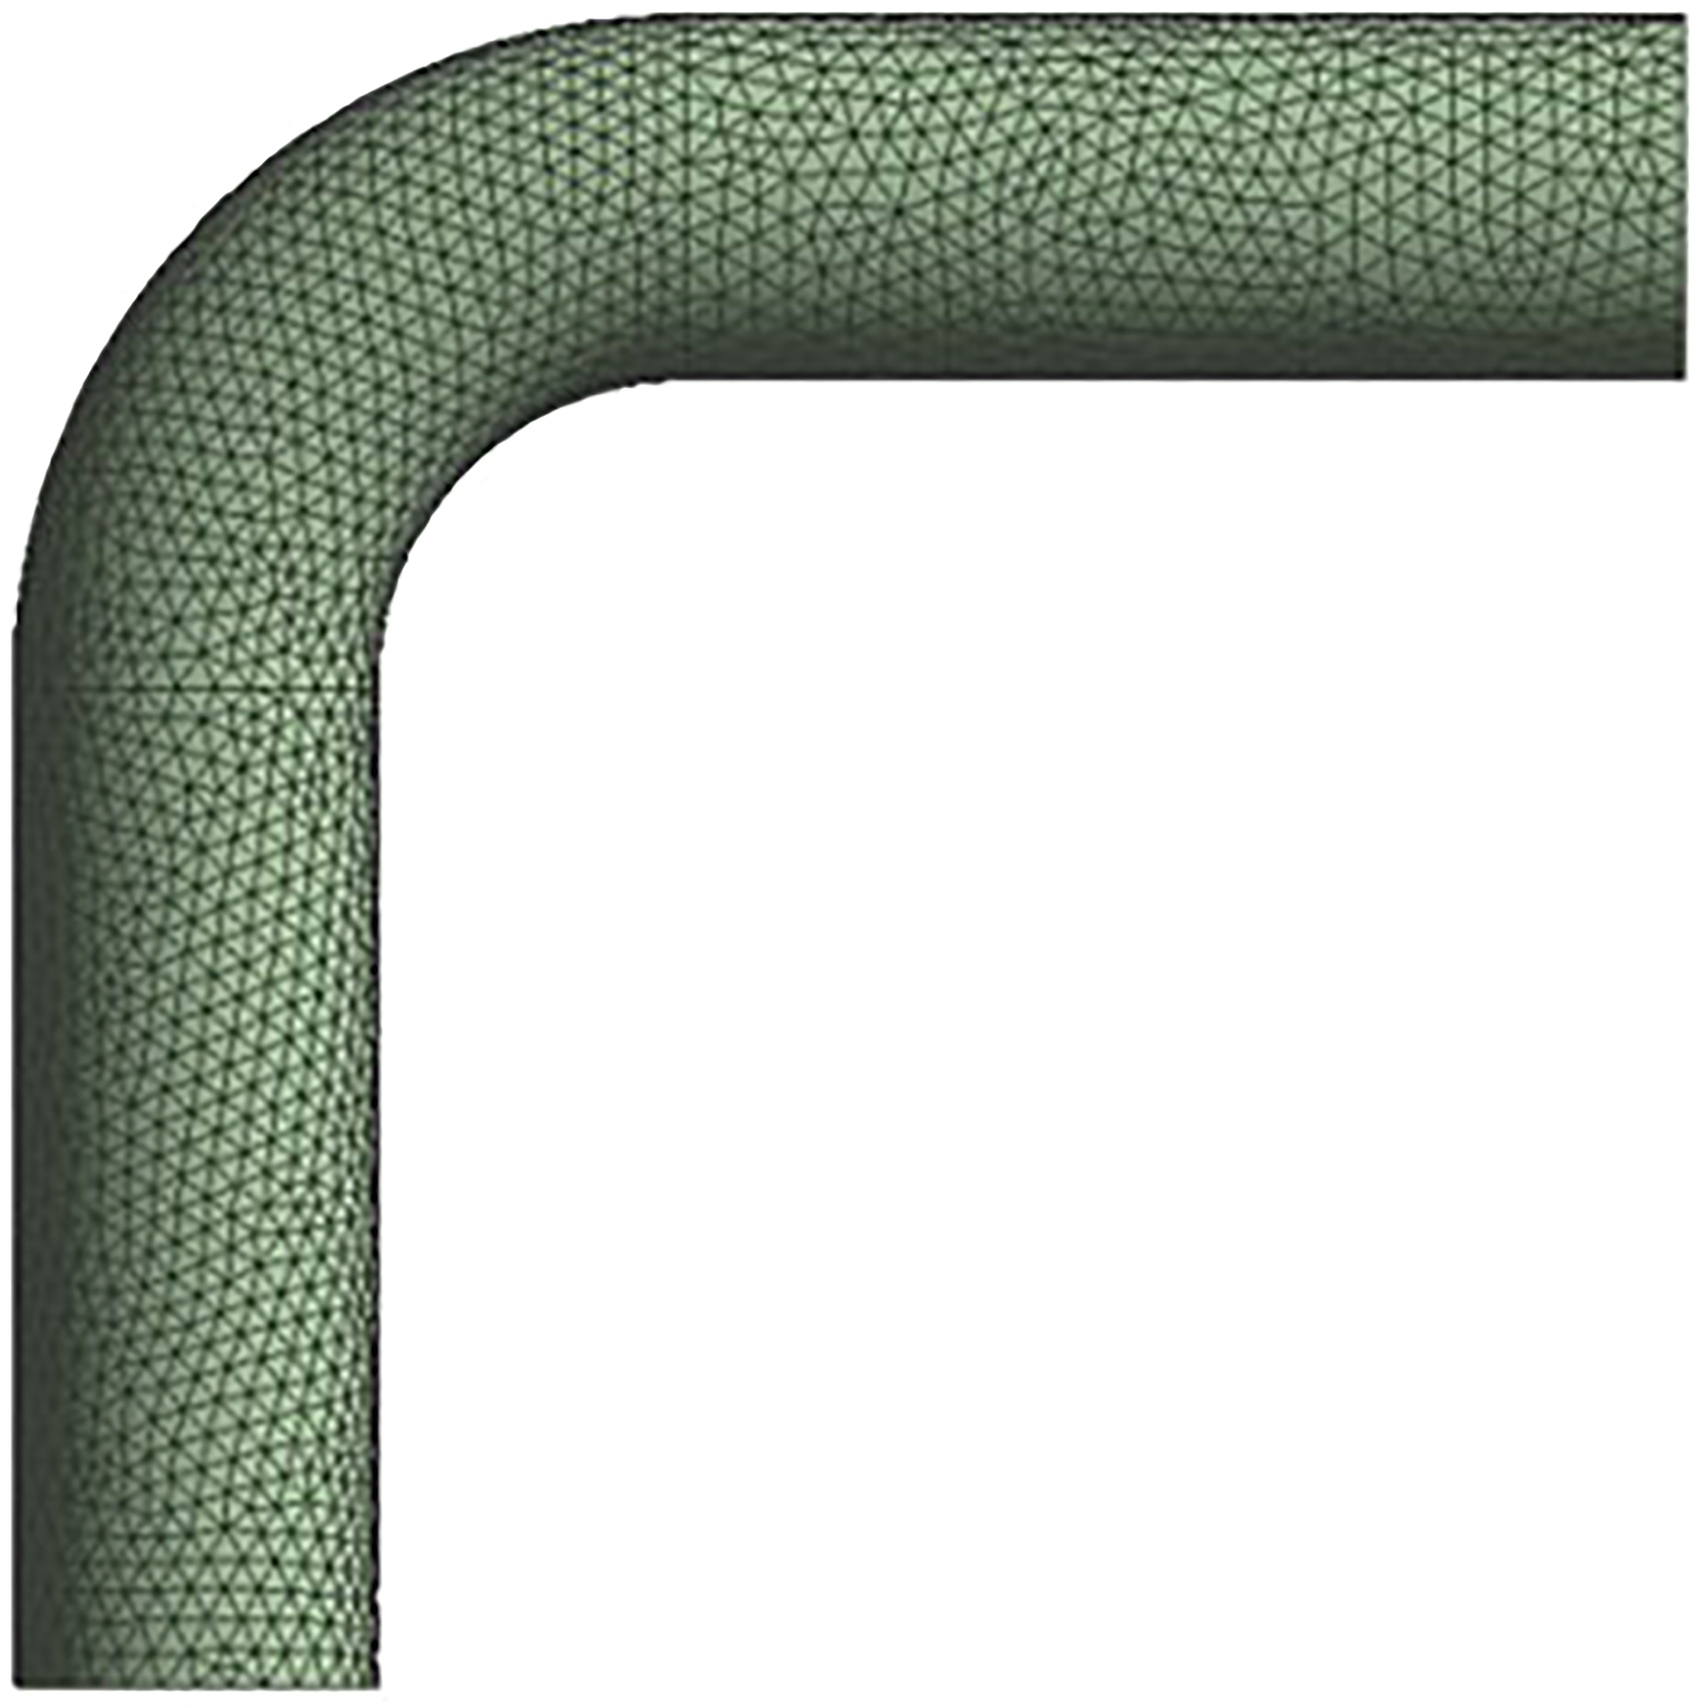
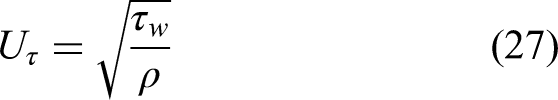
Figure 5 shows a typical wall view of the meshes used in this study. Out of three different mesh sizes for each geometry, the meshes which were finally selected as a result of the mesh independence studies are 366912, 690688 and 269010 for the pipe diameters of 0.0525, 0.1016 and 0.2032 m, respectively, as shown in Figure 6(a)-(c). The geometries were created in ANSYS Design-Modeller while hexahedral meshes were created in ICEM CFD 18.0 meshing software. Supplemental Table 5 shows the refinement parameters that were adopted. The near wall cell size was predicted using the expression: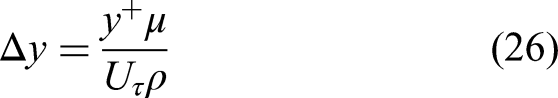


Meshing on pipe wall.
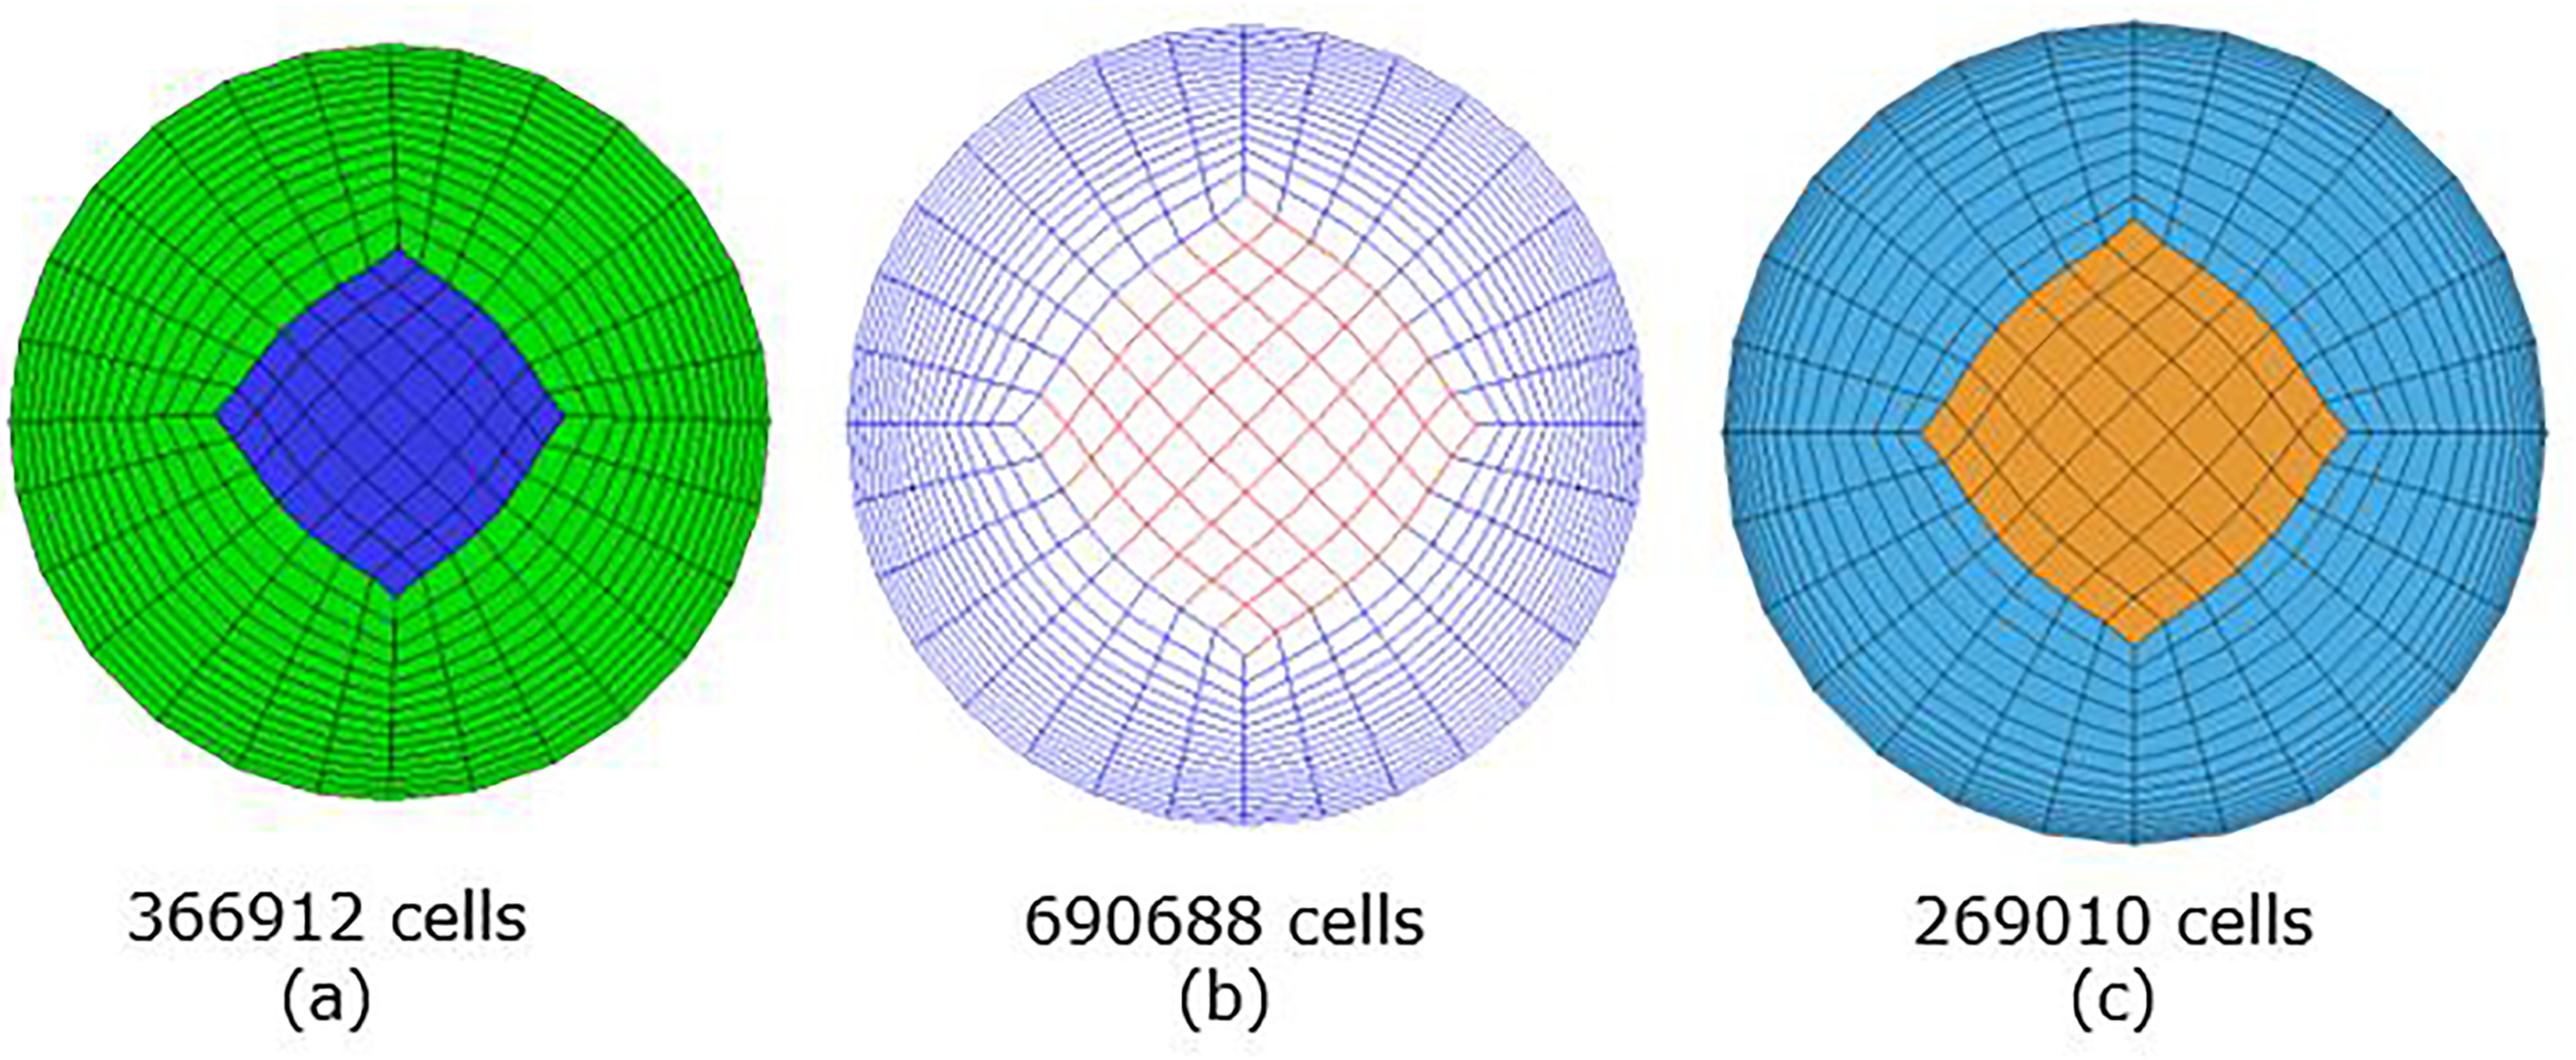
Pipe meshes for I.D. (a) 0.0525 m, (b) 0.1016 m and (c) 0.2032 m.

For mesh independence study, the slug flow condition was modelled as a homogenous mixture. Velocity profiles shown in Figure 7(a) and (b) were obtained in the 0.1016 and 0.2032 m I.D. pipes. The figures show that the velocity profile at planes positioned at 11.6 and 15.4 m, respectively, from the entry upstream of the bend for all three meshes in each case are identical and they represent typical velocity profile of fully developed turbulent flows in circular pipes.
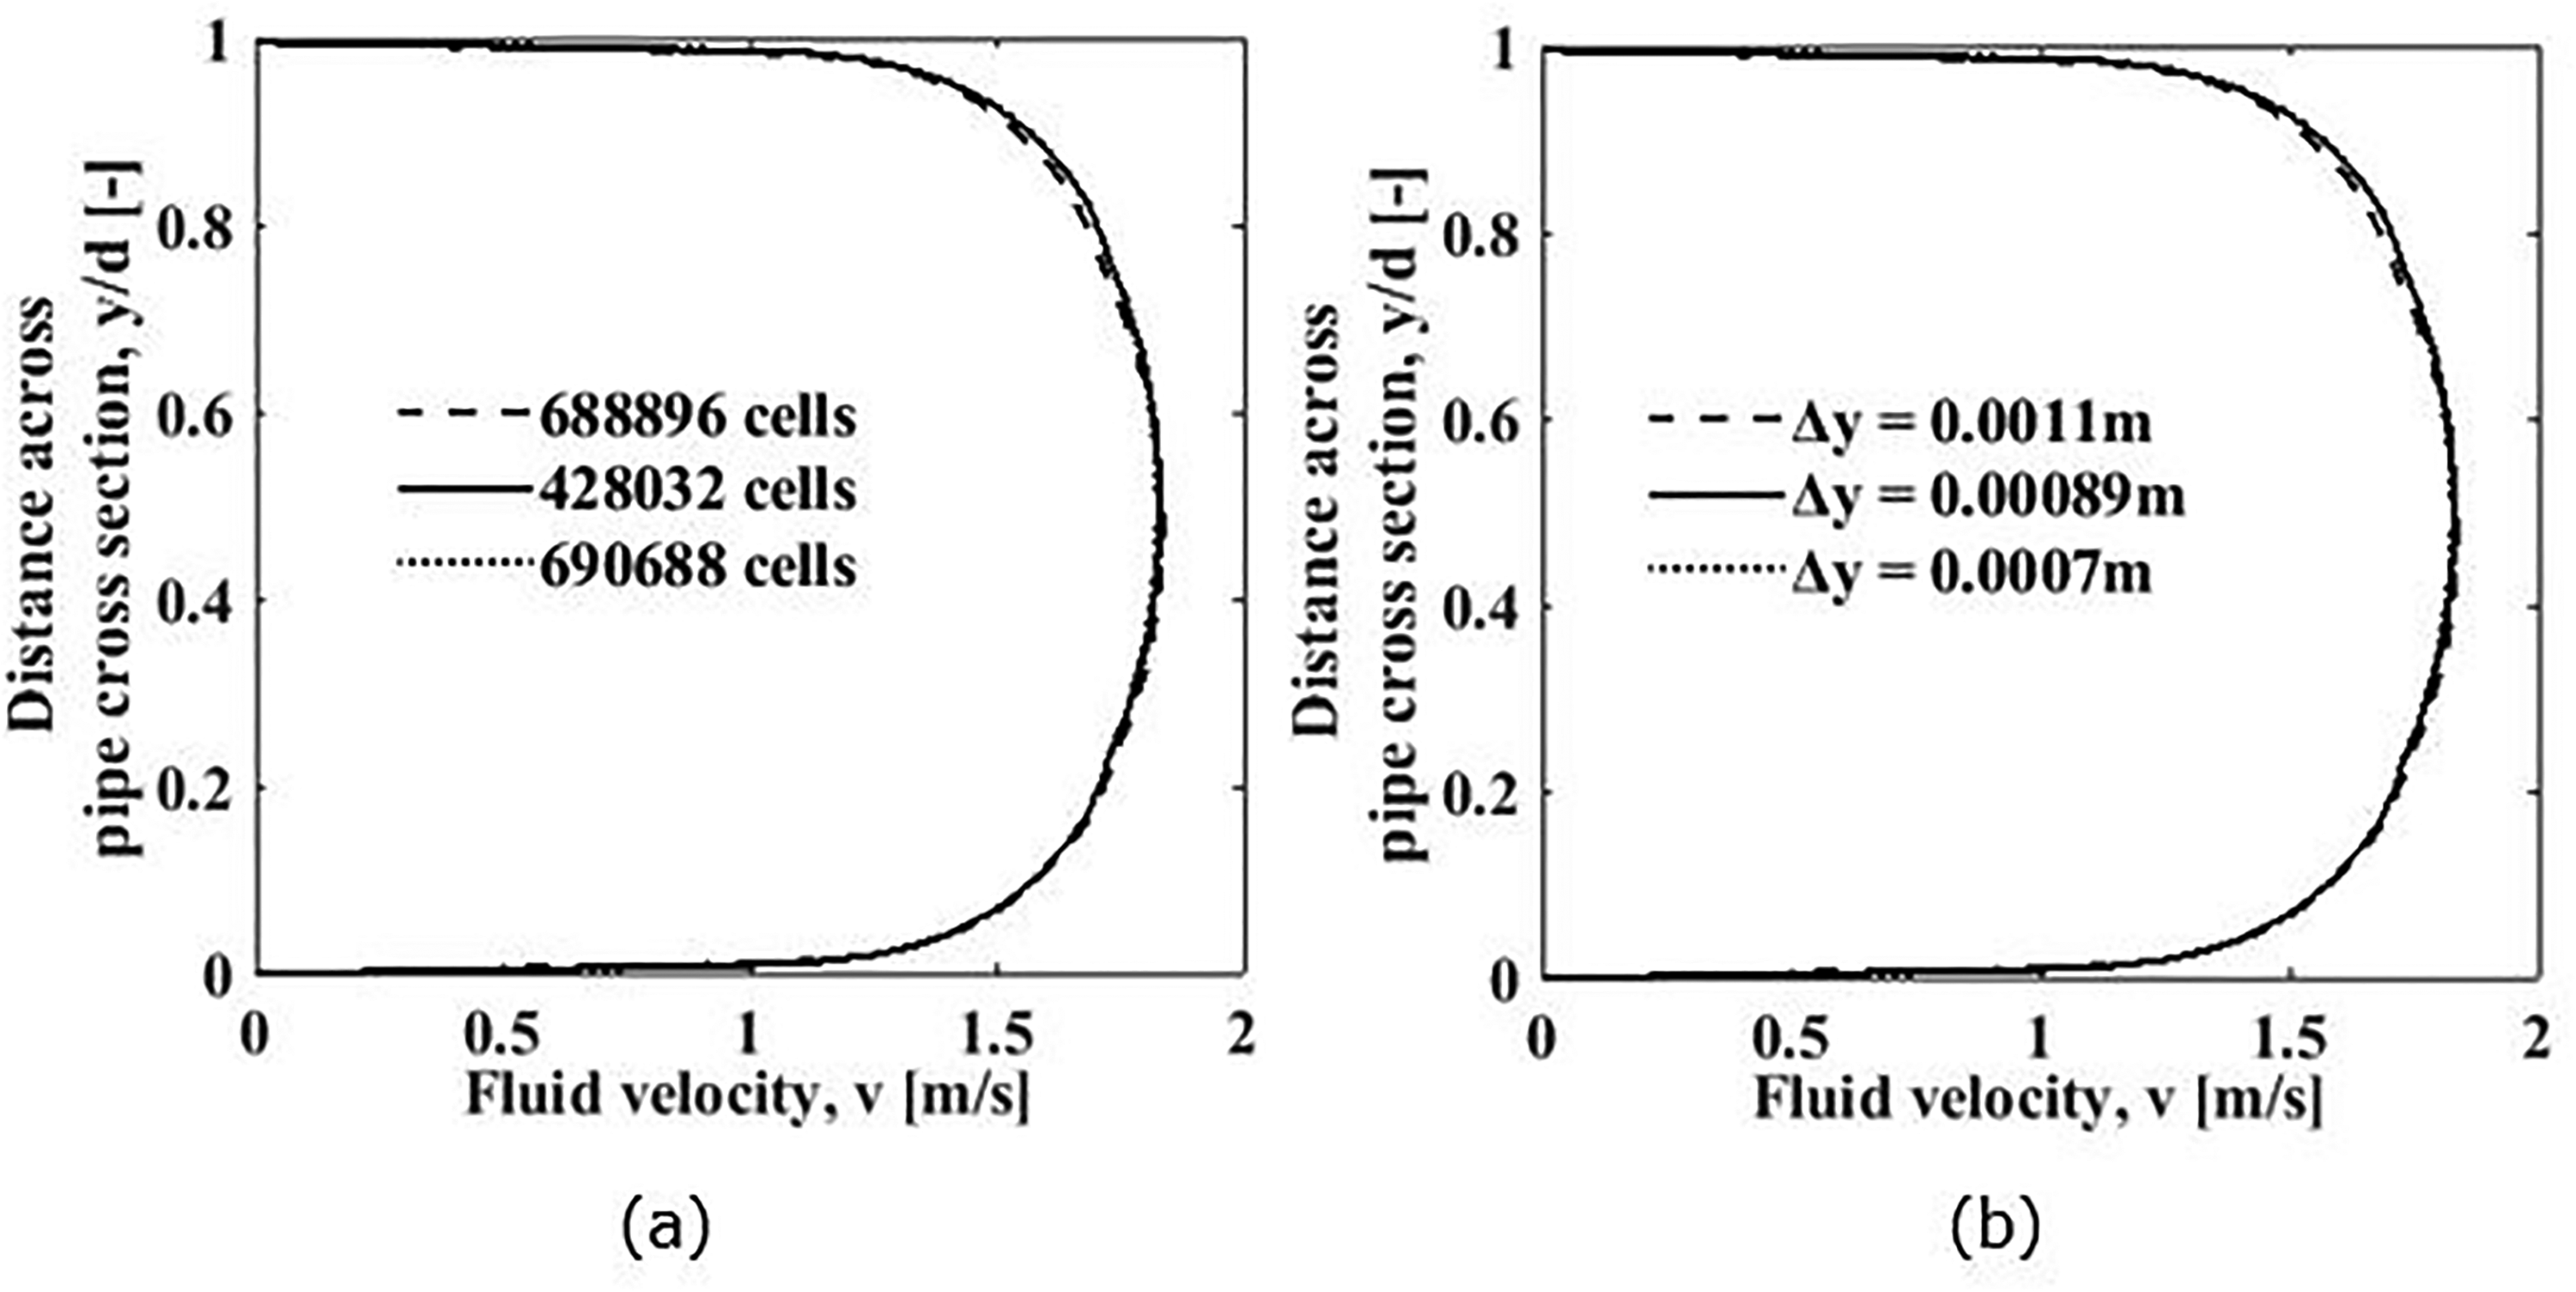
(a) and (b) show the predicted velocity profiles for different mesh sizes in pipes of 0.1016 and 0.2032 m, respectively.
Typical flow patterns obtained by the simulation
Figure 8 and Supplemental Figure 9 present the contour plots and PDFs of typical slug and churn flow patterns observed in the three pipe sizes. Both flow conditions were validated for the pipe of 0.0525 m I.D. in the CFD investigation carried out by Hossain et al. 21 Findings were compared to the experimental results of Liu et al. 3 Figure 8 and Supplemental Figure 9(b) represent the PDFs of the void fraction fluctuation extracted at a cross-section above 70D from the pipe inlet. Figure 8(b) shows that the two peaks in the PDFs of void fraction in the small pipe became almost equal while in the larger pipes the leading peak representing low void fraction of liquid slug containing small bubbles was higher than the trailing peak which represents cap bubbles. These behaviours are consistent with reported experimental observations of slug and cap bubbly flow regimes characteristics.30–32 The contour plot in Figure 8 shows that the liquid slug could still bridge the pipe cross-section. On the other hand, the contour plot in Supplemental Figure 9 shows that the liquid slugs could rarely bridge the pipe cross-section. The large liquid wave structures which are characteristic of churn flows are also visible in Supplemental Figure 9(a) and the observation is consistent with the findings in literature.31–34 The PDFs in Supplemental Figure 9(b) all show peaks above 0.8 in the three pipe sizes. In summary, the CFD method was able to reproduce the basic physical behaviours of the slug, cap-bubbly and churn turbulent flow regimes expected in the pipes. Slug flow regimes which were observed in the vertical pipe section in small pipes transitioned into cap-bubbly flow in large pipes.
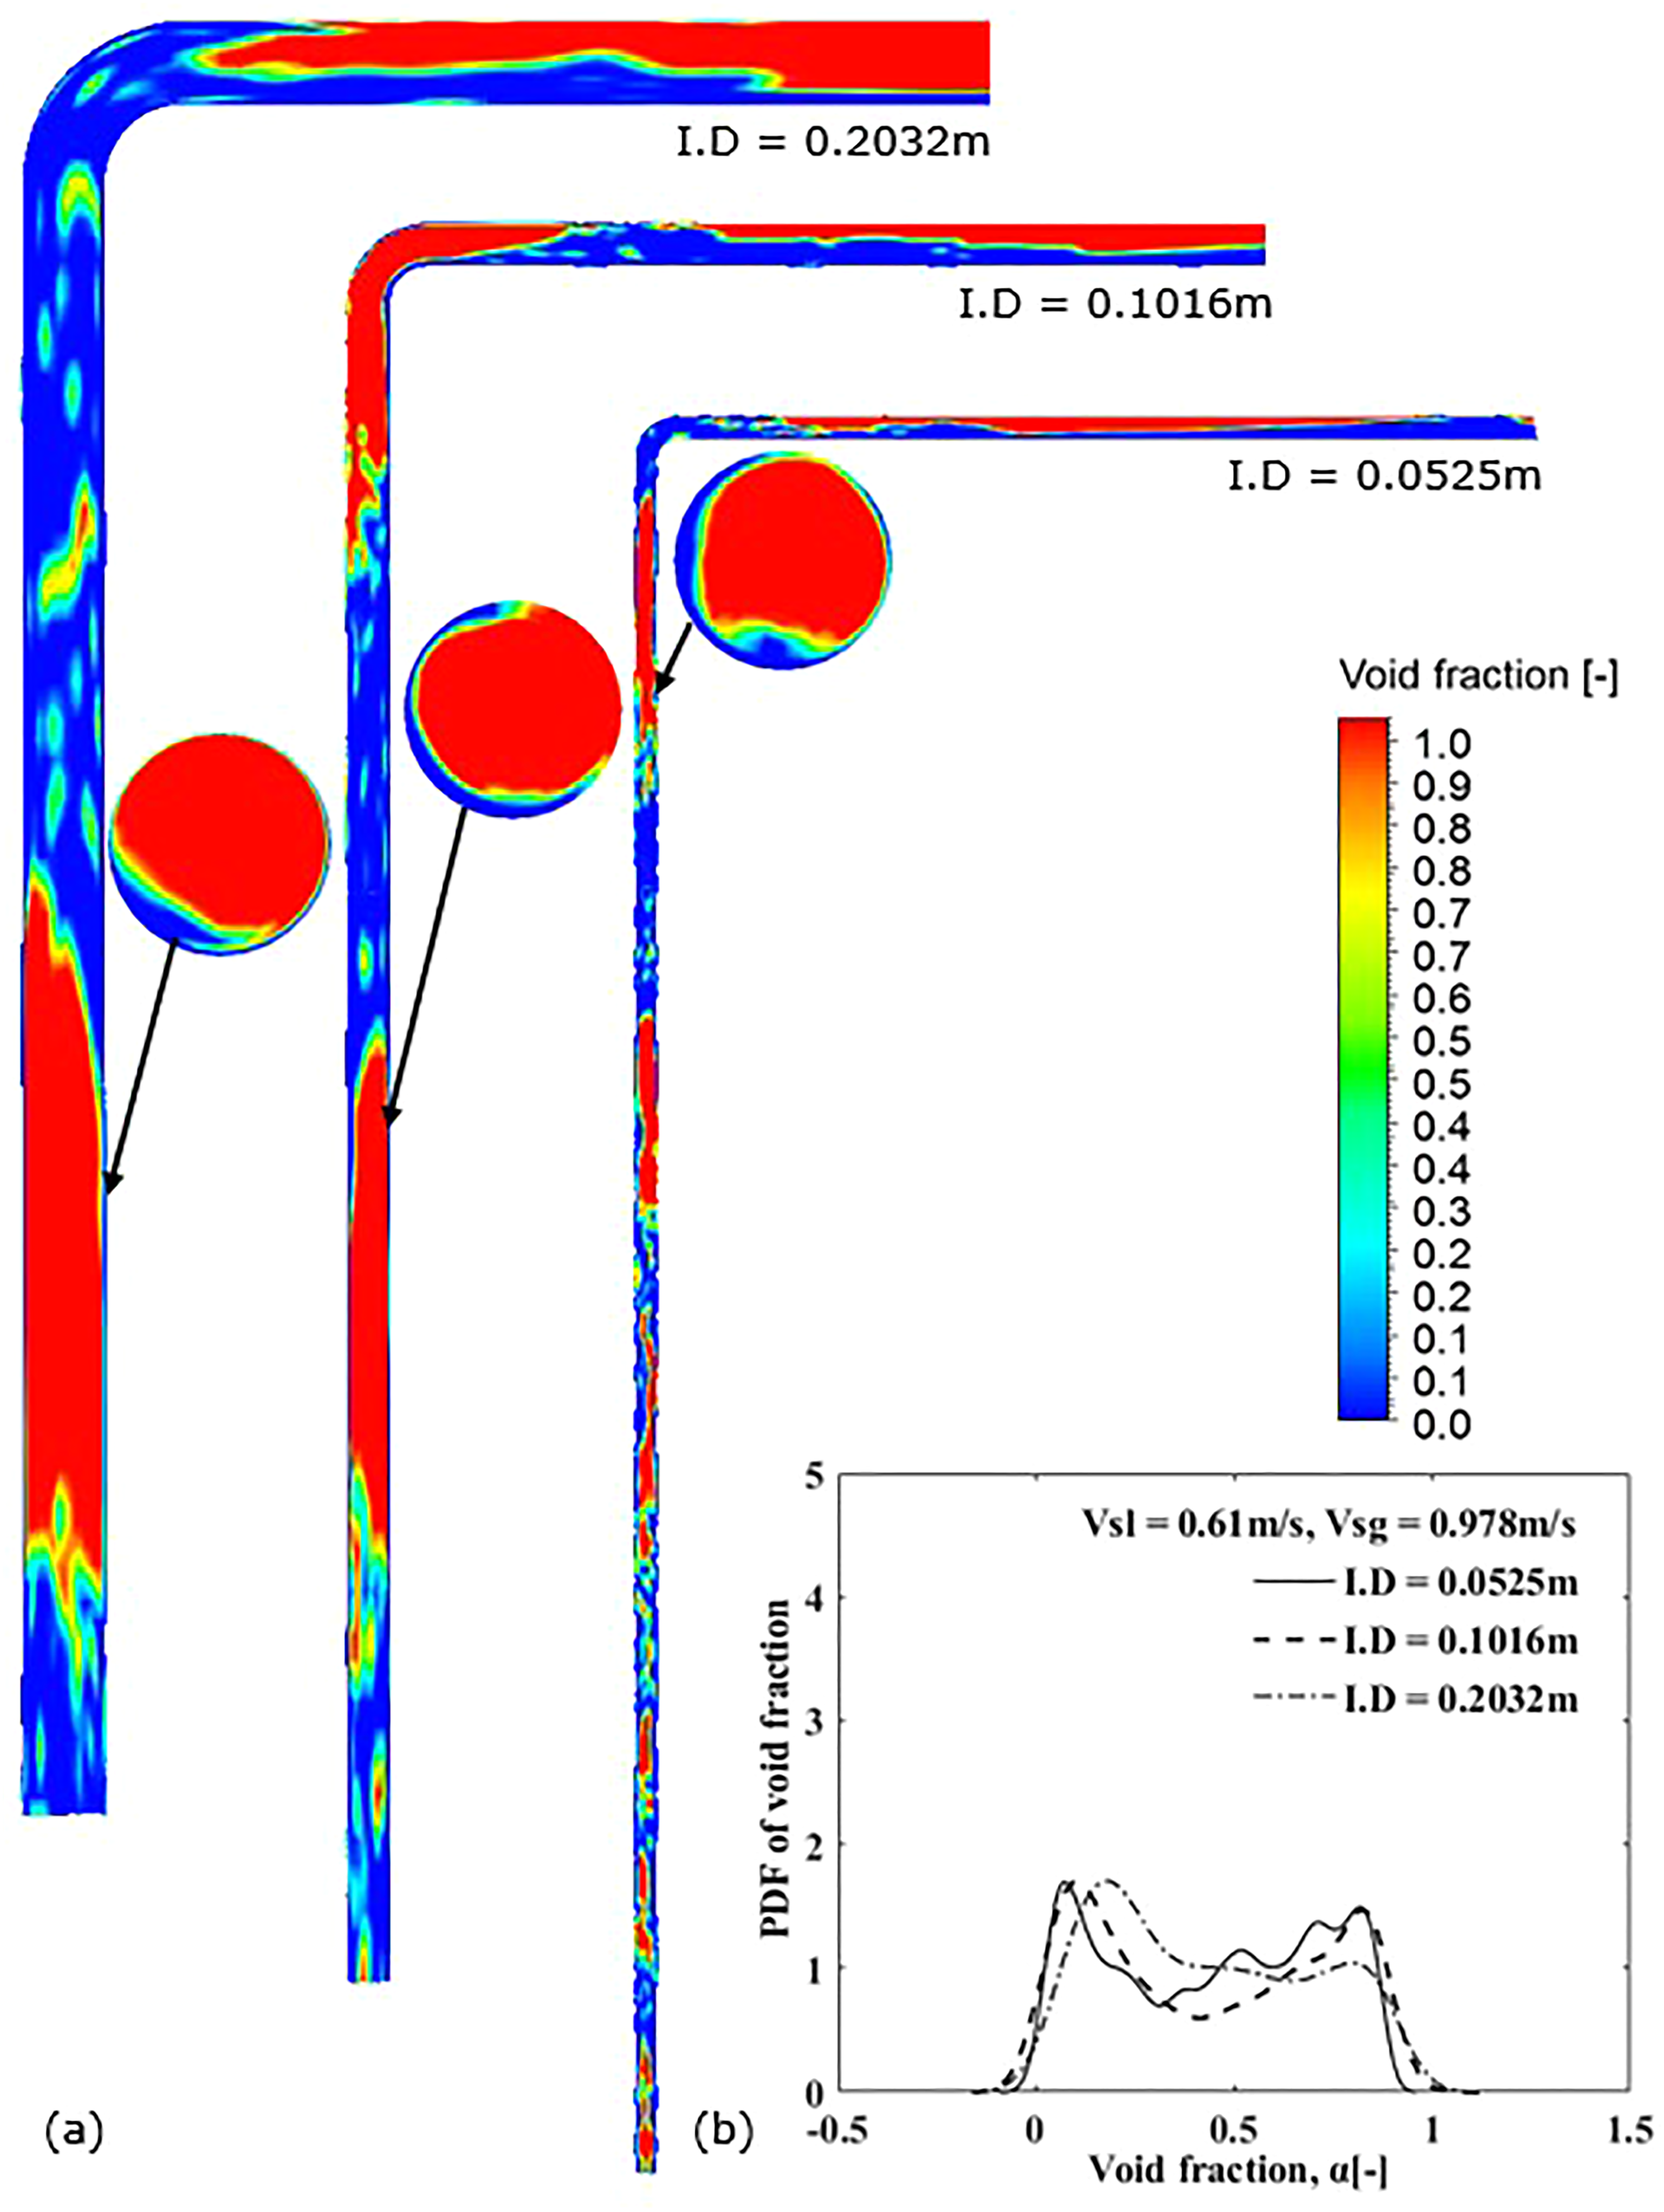
(a) Contour of air volume fraction and (b) PDF for Vsl = 0.61 m/s and Vsg = 0.978 m/s in the three pipe sizes.
Two-phase flow induced force
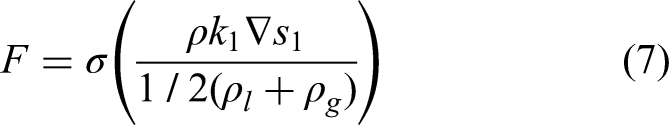
The fluctuating forces acting on the elbow of the pipe were calculated using equations (29) to (31) based on a control volume around the elbow. The x is in the horizontal direction, while the y is in the vertical direction (see, Figure 1).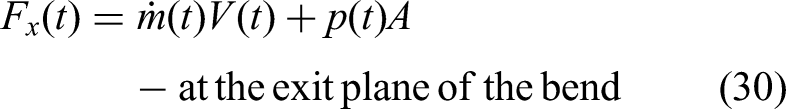

The y-components of force fluctuations were consistently higher than the observed x-component fluctuations although, the magnitude of the difference reduced as gas superficial velocity increased towards churn flow regime (Vsg = 9.04 m/s). This observation is consistent with findings reported in Hossain et al. 21 for the pipe of 0.0525 m I.D. The high amplitude of Fy fluctuation is attributed to the impact of liquid slugs on the bend in the y-direction while the lower amplitude of Fx which is more prominent in the moderate slug flow cases up to Vsg of 1.7 m/s (Supplemental Figures 10 to 14) is as a result of the change in flow pattern into stratified/stratified wavy flow downstream of the bend.
In both pipes, Supplemental Figures 10(b) to 18(b) show that higher frequencies greater than 2 Hz became more prominent as
Supplemental Figures 19 and 20 show the predominant frequency and the RMS of force fluctuations in the x and y direction, respectively, for all three pipe sizes. The predominant frequency is identified as the peak frequency corresponding to the maximum force fluctuation strength in flow directions. Supplemental Figures 19(a) and 20(a) show that the predominant frequency increase gradually followed by a drop as gas superficial velocity increased from slug flow regime to churn flow regime in the 0.0525 and 0.2032 m I.D. pipes. A more irregular behaviour was rather observed for the 0.1016 m I.D. pipe especially within the slug flow regime. In addition, the present single 90° bend study showed that at a constant liquid superficial velocity of 0.642 m/s, the predominant frequencies of force fluctuation were at a maximum of 1.7 Hz in the 0.0525 m (small) pipe and reduced to 1 and 0.8 Hz in the 0.1016 and 0.2032 m I.D. pipes, respectively. However, the other important peak frequencies which exist beyond 2 Hz especially in churn flow regimes should be taken into consideration in the design and monitoring of pipe network of similar dimensions to avoid the occurrence of resonance.
The RMS of force fluctuations in Supplemental Figures 19(b) and 20(b) showed similar behaviour with increasing superficial gas velocities in the three pipe sizes. At constant liquid superficial velocity, the RMS increased monotonically with gas superficial velocity within slug flow regime. However, at Vsg = 5 m/s which coincides with the transition region to churn flow regime, the RMS of force fluctuation dropped suddenly in the larger pipes, before increasing significantly again in the churn flow regime. Also, the RMS of force fluctuation were significantly (>5 times) higher in the 0.2032 m I.D. pipe compared to the 0.1016 and 0.0525 m I.D. pipes despite a size scale ratio of only 2 and 4, respectively. The maximum values of RMS were observed in churn flow regime and values of 450, 72 and 18.5 N were calculated for the large, intermediate, and small pipes, respectively.
Momentum flux and pressure fluctuation
Supplemental Figures 21 and 22 present the contributions of the momentum flux and fluid pressure fluctuations to the calculated force fluctuations. The momentum and pressure fluctuations arise from the alternating nature of liquid and gas phases in slug and churn flow through pipe bend control volume. The bend control volume analysis that was adopted in the present study to calculate force at the bend was based on momentum balance theory also implemented by Liu et al. 3 A control volume created at the bend starts at a plane positioned at the immediate upstream vicinity of the bend forming the inlet of the control volume. The control volume terminates at the immediate downstream region of the bend forming the control volume exit. Pressure and momentum are calculated on the inlet and outlet surfaces at each time step and the values depend on the fluid phase flowing through the surface at the time. Similar to the findings of Hossain et al. 21 for a small pipe of 0.0525 m I.D., Supplemental Figure 19(a) shows that the RMS of momentum flux fluctuation is significantly correlated to the RMS of force fluctuation in the x-direction for the intermediate and large pipes examined in the present study. This was not the case in the y-direction. Supplemental Figure 19(b) shows a less significant correlation between the momentum flux fluctuation and the force fluctuation in the intermediate and large pipes compared to the small pipe. This is more pronounced at lower force and momentum values corresponding to slug and cap-bubbly flow regimes where Vsg≤0.978 m/s and Vsl≤0.642 m/s. Supplemental Figure 20(b) shows that the deficiency in the RMS of momentum flux fluctuation corresponding to the cap-bubbly flow regime in large pipes was compensated by the pressure force fluctuation which correlated more to the force fluctuation in y-direction in the larger pipes compared to the small pipe.
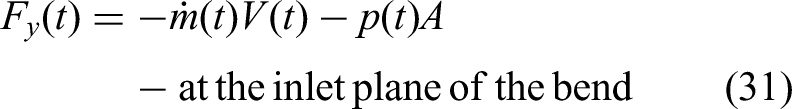
Performance of Riverin et al. 11 correlation for non-dimensional RMS of excitation force in both small and large pipes
Supplemental Figures 23 (a) and (b) present the comparisons of the non-dimensional RMS of force fluctuation for the three pipe sizes to the model by Riverin et al.
11
In Supplemental Figure 21 (a), the constant C appearing in equation (32) is left as its original value of 10. In Supplemental Figure 21 (b), the correlation has been modified by setting the value of the constant C to be 20. The modified correlation is given as: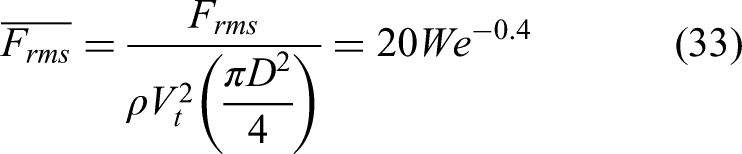
Effect of flow pattern on natural frequency
Supplemental Figures 24(a) to (c) present the natural frequencies of the three similar pipe sizes. The added mass effect due to contained fluid is captured by defining the global volumetric gas fraction at the pipe inlet. Generally, as the gas fraction increases corresponding to increasing gas superficial velocities (Vsg) represented by the increasing trend of Vsg/Vsl in Supplemental Figure 24, the natural frequencies of the first three modes of vibration increases, approaching the highest value corresponding to gas volumetric fractions (β) of 0. Based on their experiment, Wang et al. 20 also reported that increasing gas volume fraction at inlet had similar effect on the first three natural frequencies of an acrylic material pipeline riser of 0.0514 m I.D. and thickness of 0.0058 m conveying gas-liquid two-phase flow. However, the present study shows that the increase in natural frequencies with gas superficial velocities and volume fraction were most significant in the smallest pipe of ¼ scale than the ½ and 1.0 scale sized pipes. Frequencies as low as 1 Hz were recorded in the 1.0 scale pipe while the lowest frequency in the ½ scale pipe is ∼2 Hz.
Resonance risk assessment
Risk of resonance in the three pipe sizes, subjected to identical internal multiphase flow conditions were examined. The 1.0 scale pipe presented the highest resonance occurrence risk. Supplemental Figure 25(a) to (c) presents the comparison of the first three natural frequencies of the pipe bends with fixed supports (representing modes 1–3) as a function of gas superficial velocity and the dominant frequencies of force fluctuation. In Supplemental Figure 23(c), the dominant frequencies of force fluctuation were close to the first natural frequency of the pipe structure with and without contained fluid at gas superficial velocities of 1.7 and 2.765 m/s. Generally, the risks of resonance were most likely within slug/cap bubbly and churn turbulent flow regimes up to
In summary, although the risk of resonance in the ¼ scale (Supplemental Figure 23(a)) is insignificant, further studies might show frequencies of pipe deformation or displacement coinciding with natural frequencies or high frequency stress circles which could also reduce the fatigue life of the structure.
Conclusion
A numerical investigation to evaluate the effect of diameter on MFIV characteristics and the effect of internal two-phase flow on the resonance behaviour of three different sizes of geometrically similar pipe bends have been carried out. The significant findings in this study are summarised as follows:
At constant liquid superficial velocity, the predominant frequency of force fluctuation in flow direction increases gradually with the increase of gas superficial velocity within slug flow regime followed by a drop as the gas superficial velocity increases to churn flow regime in the 0.0525 m (¼ scale) and 0.2032 m (1 scale) I.D. pipes. A more irregular behaviour was present in the 0.1016 m I.D. (intermediate) pipe. A very good corroboration of RMS of resultant force fluctuations with Riverin et al.
11
correlation was observed for the ¼ scale pipe where the constant C is 10. However, when the larger pipe sizes were considered, the correlation using C = 10 could not predict the non-dimensional RMS of forces well. A better prediction was obtained using C = 20. In all cases, the presence of internal two-phase fluid changed the natural frequencies of pipe. This change was more significant for small pipes. Increasing the gas volume fraction increases the natural frequencies of the pipe, especially in the small pipe. However, the risk of resonance was higher in the large pipe since the observed low natural frequencies were closely matched with the low peak frequencies of force fluctuations.
Supplemental Material
sj-docx-1-pie-10.1177_09544089221115520 - Supplemental material for Investigation of the effects of pipe diameter of internal multiphase flow on pipe elbow vibration and resonance
Supplemental material, sj-docx-1-pie-10.1177_09544089221115520 for Investigation of the effects of pipe diameter of internal multiphase flow on pipe elbow vibration and resonance by Nkemjika Mirian Asiegbu, Mamdud Hossain, Ghazi Mohamad Droubi and Sheikh Zahidul Islam in Proceedings of the Institution of Mechanical Engineers, Part E: Journal of Process Mechanical Engineering
Footnotes
Declaration of conflicting interests
The author(s) declared no potential conflicts of interest with respect to the research, authorship, and/or publication of this article.
Funding
The author(s) disclosed receipt of the following financial support for the research, authorship, and/or publication of this article: This work was supported by the Commonwealth Scholarship Commission in the UK for Nkemjika Mirian Asiegbu’s PhD study.
Supplemental material
Supplemental material for this article is available online.
Appendix
References
Supplementary Material
Please find the following supplemental material available below.
For Open Access articles published under a Creative Commons License, all supplemental material carries the same license as the article it is associated with.
For non-Open Access articles published, all supplemental material carries a non-exclusive license, and permission requests for re-use of supplemental material or any part of supplemental material shall be sent directly to the copyright owner as specified in the copyright notice associated with the article.