
Abstract
Despite the advantage of being quieter than traditional internal combustion engine vehicles, electric vehicles are often distinguished by high-frequency tonal components, which can be perceived as unpleasant to the occupants and the environment. To ensure optimal acoustic comfort in electric vehicles, it is important to analyze the NVH behavior of e-powertrains during the early stages of the design process which poses inherent uncertainties, such as varying operating conditions, partial knowledge of design parameters, dispersion in measurement-based data, etc. To effectively address these uncertainties, it is necessary to use fast and comprehensive stochastic models during the design phase. In this work, a probabilistic framework is presented to estimate the electric powertrain’s interior whining noises considering the structure-borne contribution. Hence, two different stochastic metamodels are developed for efficient quantification and propagation of uncertainties from electric motor stage to powertrain mounting system. Multivariate Bayesian regression models help to incorporate prior knowledge on the uncertain parameters and generate the respective posterior distributions using Markov chains Monte Carlo (MCMC) techniques. For this particular application, the data is generated through weakly-coupled multi-physical domains estimated using semi-analytical approaches and combined with measured vehicle transfer functions. Importantly, the validation of each domain is conducted separately to ensure accurate representation. The results obtained from the developed probabilistic framework will aid in the early design stages by guiding engineers in making informed decisions to optimize NVH performance.
Introduction
In the mobility sector, Battery Electric Vehicles (BEVs) have emerged as a promising solution in transitioning toward sustainable future utilizing clean energy, eliminating the need of fossil fuels and reducing greenhouse gas emissions. Moreover, the ever increasing imposition of stringent policies and global pressure to go net zero-emission have propelled vehicle manufacturers to expand their EV fleets at a rapid pace. 1 As a result, automakers are pivoting their focus on enhancing various attributes of EVs to fulfill customer’s needs and comfort.
Among various characteristics, Noise, Vibration, and Harshness (NVH) is a crucial aspect that significantly influences the customer’s perception of quality and overall image of the vehicle. The absence of an Internal Combustion Engine (ICE) in EVs results in reduced noise levels, but introduces a distinct acoustic signature. The interior noise contribution is characterized by high-frequency components, commonly referred to as whining noise, which are often perceived as intrusive and causes discomfort to the occupants. 2 Additionally, the noises that were previously masked by the ICE are now far more audible. From a broader perspective, the major sources of noise in EVs (see Figure 1) can be classified under three categories, namely tire-road interaction noise, aerodynamic wind noise, and e-powertrain noise. The first two sources form the background (or masking) noise and the primary source of tonal noise is from electrified powertrains. Further classification is possible for noises originating from electric powertrains: noises of mechanical origins, such as gear meshing and shaft misalignment, aerodynamic origins from air flow through and over the motor, and electromagnetic origins from electromagnetic interaction, refer to Gieras et al. 3
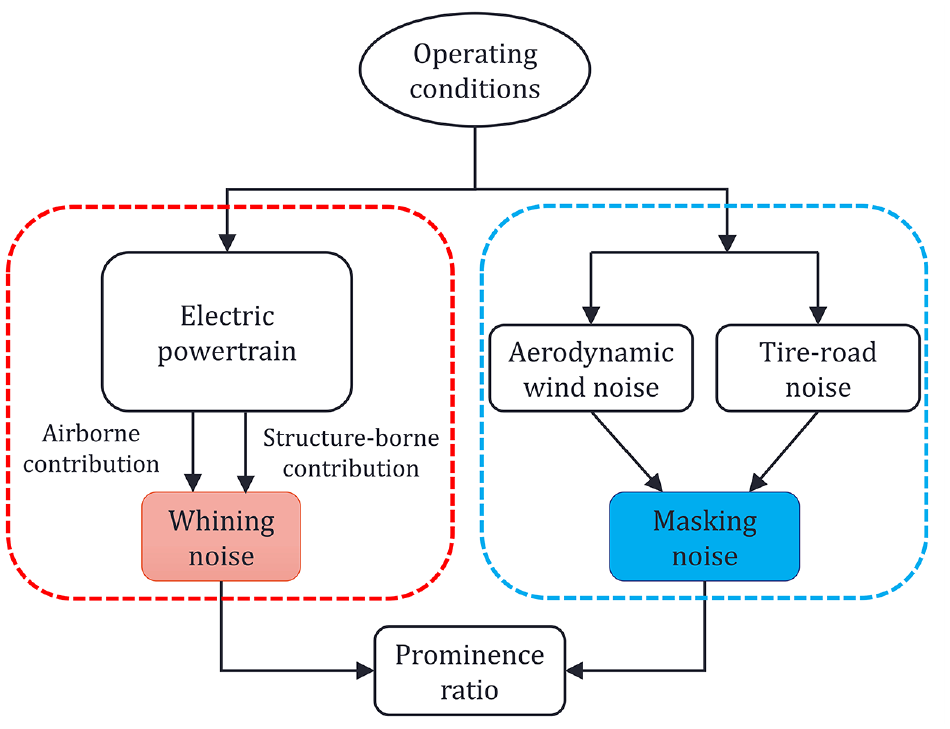
Global scheme summarizing the perceived interior cabin noise due to three major sources in a typical BEV.
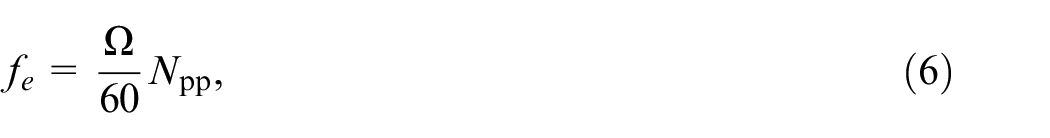
During vehicle design phase, computer simulations are often used to estimate the vibration response and acoustic levels using detailed full-vehicle structural-acoustic computational (refined 3D finite element) models, which are generally time-consuming. However, during early stages of the design process, when quick assessments of different design alternatives is desired, such detailed 3D design-based simulations are not feasible due to their time-intensive nature. Some other challenges during early-stage BEV design process include the limited (or partial) knowledge of unknown design parameter space, lack of simulated/measured data, and variable driving conditions. The outcome of this is a substantial lack of credibility in the deterministically estimated dynamic responses due to uncertainties originating from multiple sub-systems. Therefore, in order to have more informative predictions, it becomes necessary to quantify such uncertainties early in the design phase and assess the influence of the key design parameters on the resulting outputs. This is achieved using surrogate models (or metamodels) which are simpler approximations of a complex model depicting the functional relationship between the inputs and the corresponding outputs. 4
In automotive NVH domain, different metamodels have been employed to achieve minimal engine noise, optimal vehicle mass, learning an aerodynamic wind-noise model, etc. 5 Nowadays, such surrogates are commonly needed for performing optimization studies. With respect to the noise generated from electrical machines, neural network based surrogate was built to predict the natural frequencies of the stator. 6 Likewise, Mohammadi et al. 7 used three neural networks to predict the average torque, the torque ripple, and the sound pressure level (SPL) for multi-objective optimization. In another study by Ibrahim et al., 8 multiple surrogate models were compared to predict the acoustic noise. As the electromagnetic excitations in e-machines can be sensitive to even slight variations of the geometric and control parameters of the active magnetic parts, it is important to consider such variations in the output predictions. In this regard, Jeannerot et al. 9 conducted a time-consuming FEM-based probabilistic robust optimization of an e-machine to reduce SPL, taking into account the variability of random parameters. Beltrán-Pulido et al., 10 on the other hand, developed a Gaussian process surrogate model of an e-machine using nonlinear FEM to account for uncertainty in torque, flux linkage, and core loss. Almost all prior studies have only evaluated SPL from e-machine without taking into account the various transfer paths contributing to interior cabin noise. As a result, a “global” perspective of metamodels with uncertain parameters in BEVs global acoustic response was missing. This paper addresses this gap.
Probabilistic modeling provides flexibility to evaluate design alternatives by yielding a probability density function (PDF) of the output responses. To accomplish this, Monte Carlo (MC) simulation techniques have been primarily used by researchers for the probabilistic quantification of uncertainties. In automotive context, for instance, Durand et al. 11 built a non-parametric model to capture the variability in the booming noise prediction through random matrices, 12 quantified the variability in booming noise and body in-white, 13 and recently, Brogna et al.14,15 used Bayesian approaches with Gibbs sampling to model global vibro-acoustic behaviors. When partial objective knowledge/data about the system is available, the Bayesian approach is particularly useful as it allows the incorporation of prior-knowledge (coming from domain expertise/literature/measurement database, etc) in the form of PDF on the uncertain parameters, making it a reasonable choice to be investigated. The work presented here builds upon the ideas and research established by Brogna et al. 15
In the Bayesian framework, the learning process involves modifying the initial probability statements/assumptions about the parameters before observing the data to updated or posterior probabilities that combine both the prior-knowledge and the data available. However, the posterior distribution can not always be represented in a closed form and is difficult to compute due to intractability issues. Therefore, sampling methods such as MC are used to sample from the unscaled posterior distribution which approximates the true distribution when the sample size is large enough, refer to Bolstad 16 and Gelman et al. 17 Also, it is important to build models where the parameters have physical sense and are interpretable, which in turn allows more control and flexibility over the output responses and allows design loops (from an optimization-problem point of view). Therefore, a parametric surrogate modeling approach is investigated here, characterized by a fixed number of physically pertinent key parameters that do not grow with the size of the input data set. Such parametric models make stronger assumptions on the nature of the data distribution and are generally faster than the non-parametric models which are more flexible but often computationally intractable, refer to Murphy. 18
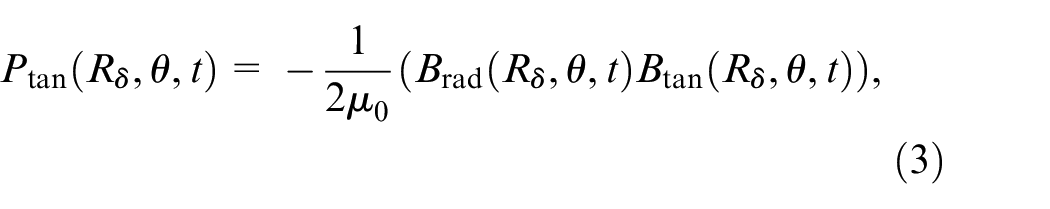
The SPL perceived inside a BEV is, indeed, dependent on many parameters, for instance the operating speed of the e-machine, thereby defining the vehicle’s wheel speed, environmental factors (e.g. road conditions), EV body type (e.g. sedan, hatchback), etc. As can be seen from the global scheme in Figure 1, all three major categories of sources of noise are dependent on the operating conditions and when combined, different key performance indicators can be estimated, like the prominence ratio, which results in the prominent tones in the SPL spectra. In a recent article, Prakash et al. 19 developed Bayesian surrogates to consider such background noises (dashed blue box in Figure 1) using measurement databases. Hence, the focus of this article is on developing surrogate models for the electromagnetic whining noise originating from e-powertrains, as depicted in the dashed red box in Figure 1. As can be seen, whining noise is a combination of airborne and structure-borne contributions. In terms of SPL, it is given by their quadratic average as
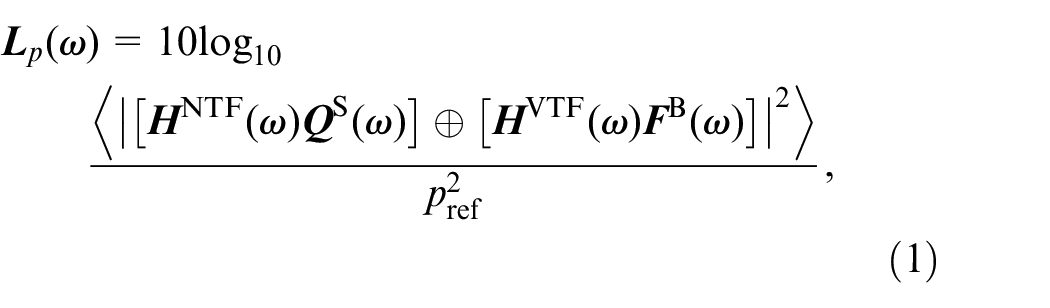
where ⊕ denotes the complex addition of airborne and structure-borne contributions,
Due to the complexity of global noise assessment involving the interaction between different weakly-coupled physical mechanisms and design parameters, a certain level of assumptions/simplifications is necessary. They are as follows:
The work considers an interior PMSM (IPMSM) in which the permanent magnets are embedded in the rotor core. IPMSMs have been widely used in EVs for traction application due to their high torque to inertia and volume ratio and high efficiency. 20 Skewing and the magnetic saturation effects are not taken into account for this early stage study.
The mechanical (e.g. gear whine) and aerodynamic noises in the powertrain are neglected and the focus of this article is only on the noise due to electromagnetic origins.
Assessment of airborne noise contribution involves the computation of the radiated acoustic power, the equations for which are readily available in the literature.
3
Therefore, this study focuses on assessing the interior SPL considering only the structure-borne path that is, on estimating
The subsequent sections of this paper are structured as follows. Section “Physical problem description and modeling” describes the physical problem and the modeling approach chosen for deterministic evaluation of output responses. The methodology encompassing input parameter sampling, simulated data generation, and the Bayesian-driven metamodeling procedure is explained in Section “Metamodeling for electromagnetic domain.” Within Section “Metamodeling for electric powertrain suspension,” the metamodeling strategy for the electric powertrain suspension is explained, wherein the Bayesian framework harmonizes with a dimensionality reduction technique. The uncertainties from electric motor stage and eletric powertrain suspension stage are coupled together to produce uncertain interior SPL, as described in Section “Interior sound pressure level through coupled stochastic metamodels.” The paper concludes with the validation of each physical block.
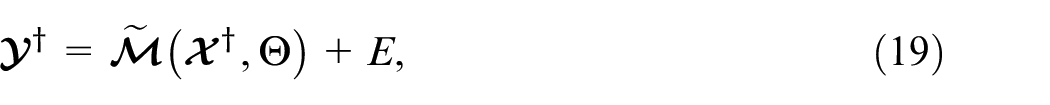
Physical problem description and modeling
In this paper, a lower-case character denotes a scalar variable, a lower-case bold character represents a vector, and a matrix is expressed as an upper-case bold character. Later in the paper, random variables are introduced which are expressed as upper-case characters.
Input parameters
The noise perceived inside the cabin due to electric powertrain is assumed to be largely dependent on three sets of parameters:
parameters related to the operating conditions (OC) belonging to the set
geometrical parameters of IPMSM such as stator length, rotor outer diameter, etc. belonging to the set
control parameters that define the information related to the three-phase sinusoidal current excitation,
Multiphysical nature of electric powertrain noise assessment
In IPMSMs, the input current harmonics, combined with the motor’s geometry and the winding pattern, result in the harmonic distribution of the magnetic flux density in the airgap, thereby exerting electromagnetic (EM) forces on the stator core and frame of the machine. As a consequence, the stator and the frame vibrates at the corresponding excitation frequencies, generating magnetic noise and vibration.
The noise assessment of electric powertrains involves an interplay among different weakly-coupled physical mechanisms, as shown in Figure 2. Generally, the methods used for noise assessment are categorized under numerical, semi-analytical, and analytical methods. The computation of magnetic flux densities in the airgap is performed in the EM domain. In the structural domain, the excitations coming from the EM-domain are first transformed from time-domain to frequency domain and are then mapped onto the structural mesh. This can easily be achieved using commercially available FE solvers as was done in many previous studies.9,21 Despite being more accurate than analytical or semi-analytical methods, such purely-numerical methods are time consuming and prediction on wide-speed range becomes a challenge. 20 Therefore, a common technique is to resort to semi-analytical methods by calculating the EM force through a simplified 2D-FE model and then obtain vibration and acoustic predictions using analytical approaches.22,23 Indeed, the magnetic flux densities in the airgap can also be estimated analytically using a magnetomotive force function and a permeance function. 3 However, the precision of such purely-analytical models are usually limited due to their simplification. Therefore, in this study, a more informative nominal model (using FEM) is preferred for computing the EM-domain.
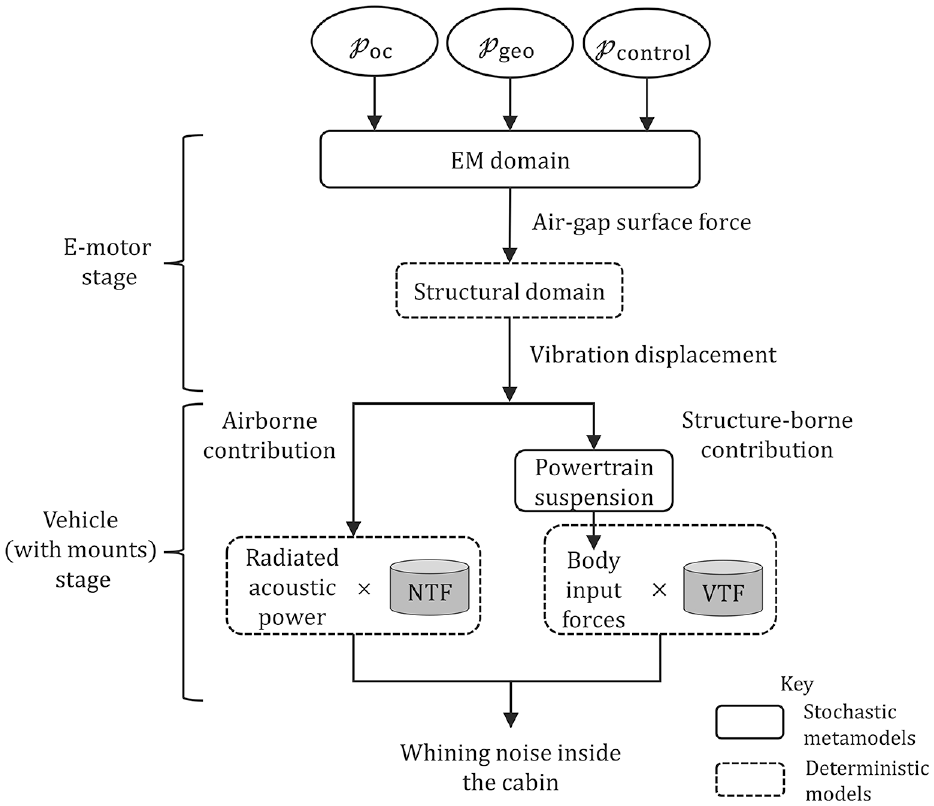
Overview of the multi-physical mechanism involved in the generation of whining noise in BEVs. NTF and VTF are the measured noise transfer function and vibration transfer function, respectively.
Semi-analytical nominal model for e-motor stage
The vector potential approach is utilized to solve the magnetic problem. The use of the magnetic vector potential in 2D-FEM has a well-established theoretical foundation.
24
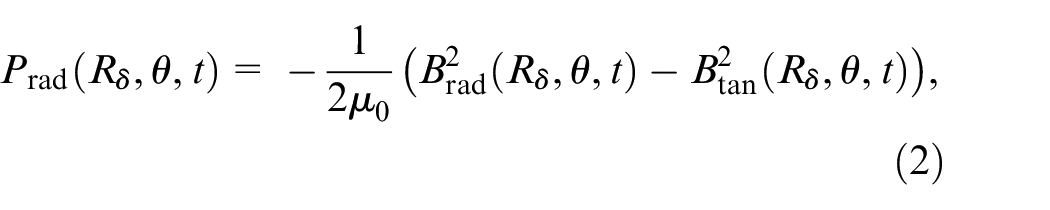
A 2D analysis of the IPMSM is generally preferred since only the magnetic flux densities need to be estimated, neglecting thermal and time-dependent effects (which are generally observed in 3D analyses). Also, under magnetostatic assumption, eddy current and temperature dependent effects are not considered. The radial and tangential Maxwell pressure, also referred to as the Airgap Surface Force (AGSF) in N/m2 applying on the stator core along the airgap
where
where
where
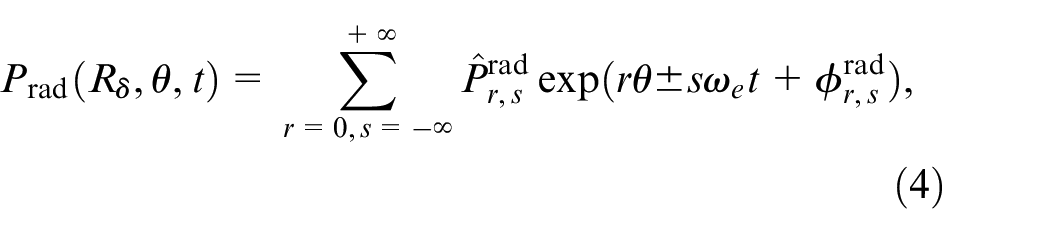
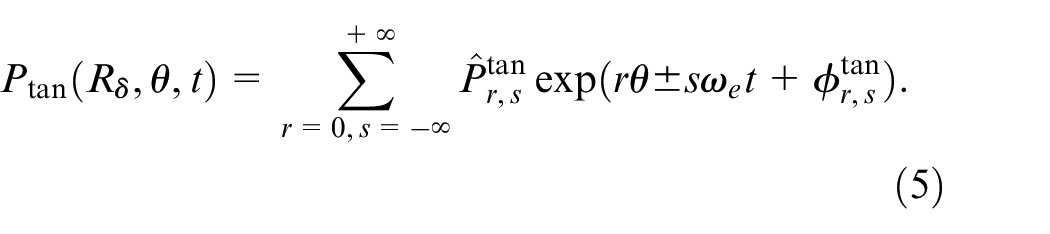
In this article, a progressive wave of spatial order

It corresponds to the slotting effect in PMSMs and mainly occurs at

with

In the structural domain, the dynamic response of the stator is calculated by the modal frequency response. To estimate the natural frequencies analytically, the stator system is simplified by considering the stator core with teeth, winding, and the frame which are modeled separately. Then, the natural frequencies of the stator system can be approximated as 3
where
Metamodeling for electromagnetic domain
Problem statement
Metamodeling is a process that involves creating a simplified representation of a complex system. In principle, it involves three main steps: first step is the Design of Experiments (DOE), where the most important input features are selected and sampled as per prior-knowledge; second step is to collect the data using measurements or simulations using the sampled input features from the first step; and the final step is the metamodel development by choosing an appropriate functional mapping that relates input features and the output responses using statistical techniques, followed by metamodel validation and exploitation. 30 In the context of this work, these steps are explained in the subsequent subsections.
Sampling of input parameters
The parameters defined by
Joint distribution of the sampled OCs
Here, the number of geometrical parameters considered is
where,
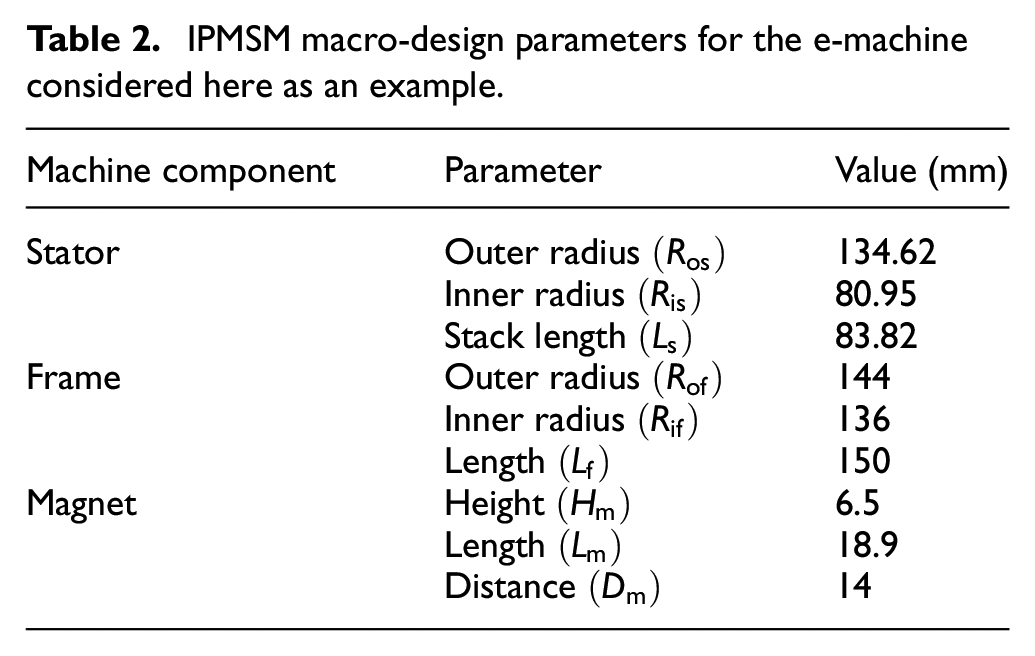
A nominal IPMSM is considered with the same parameters as used for the study.
27
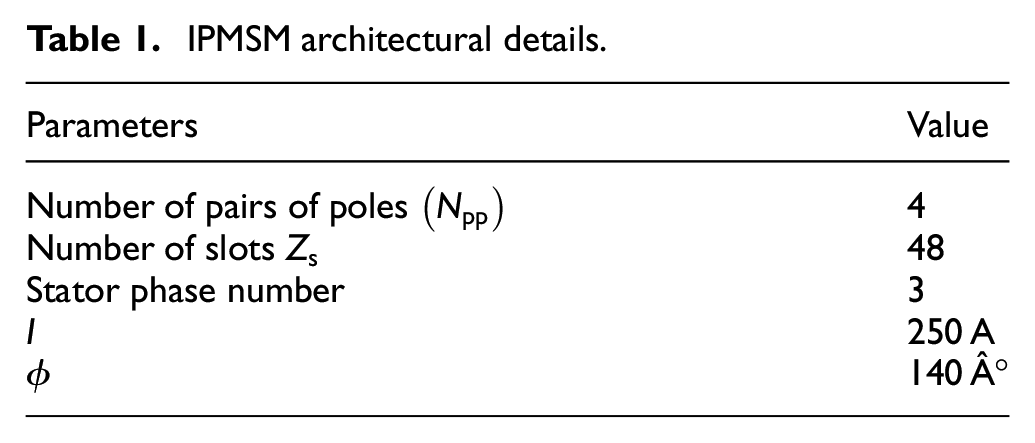
The architectural details along with the macro-design parameters are presented in Tables 1 and 2, respectively. The mean of the distribution for each parameter in
IPMSM architectural details.
IPMSM macro-design parameters for the e-machine considered here as an example.
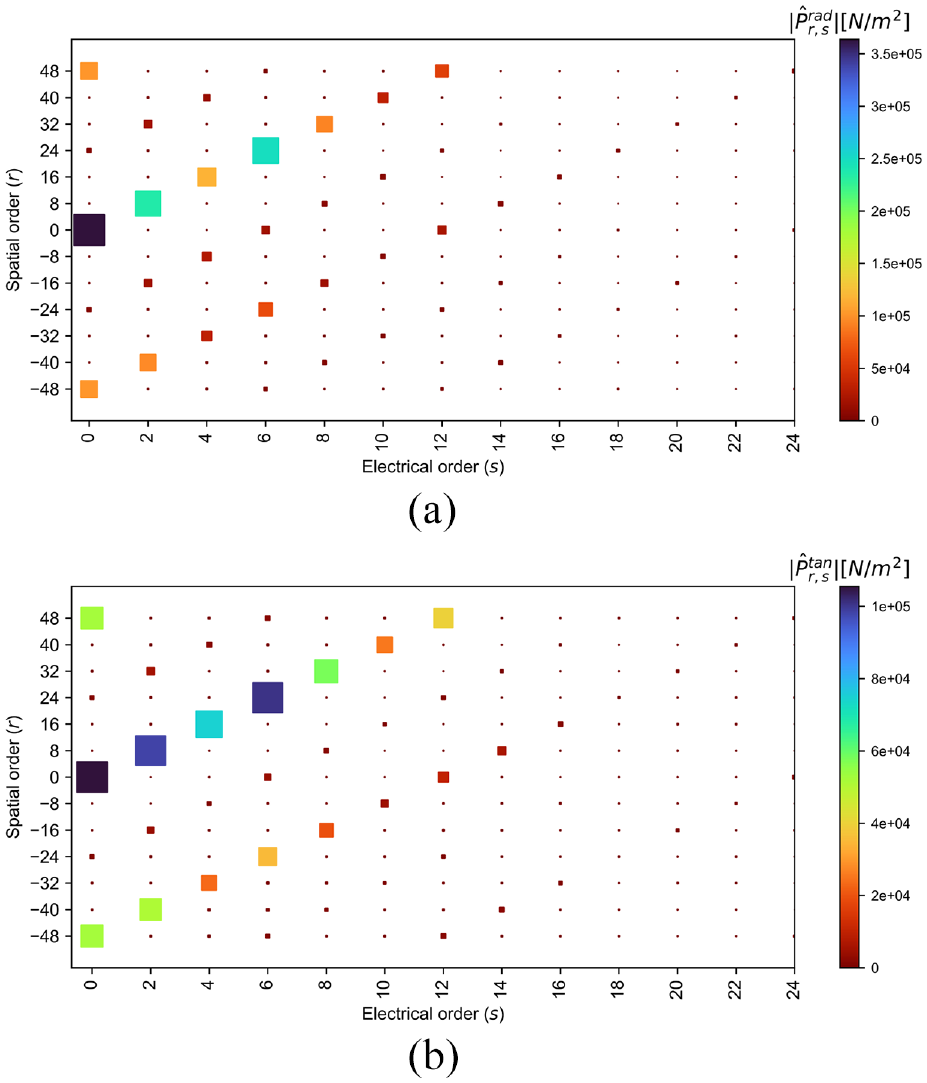
Air-gap surface force (N/m2) along dominant spatial and mechanical orders, computed for
Simulated data generation for EM forces
For the set of input parameters
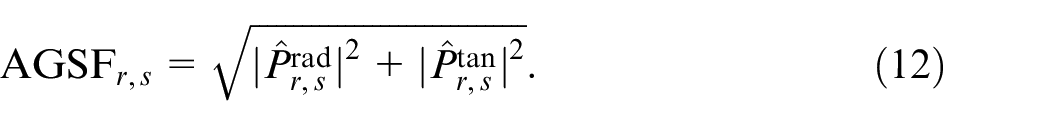
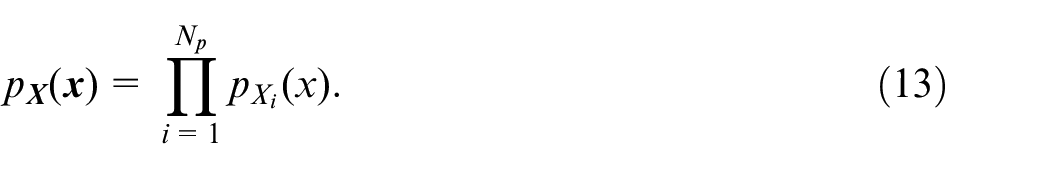
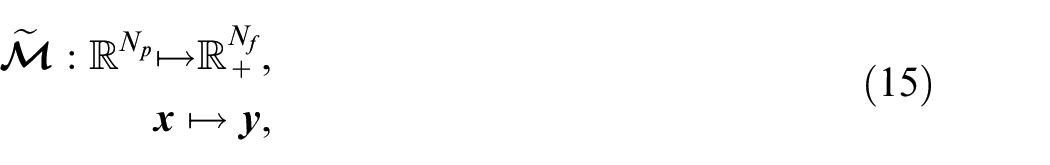
Figure 5 depicts the AGSF at different spatial orders along the first 10 frequencies. Each frequency bin corresponds to a specific mechanical or electrical order. For simplicity, only the data at
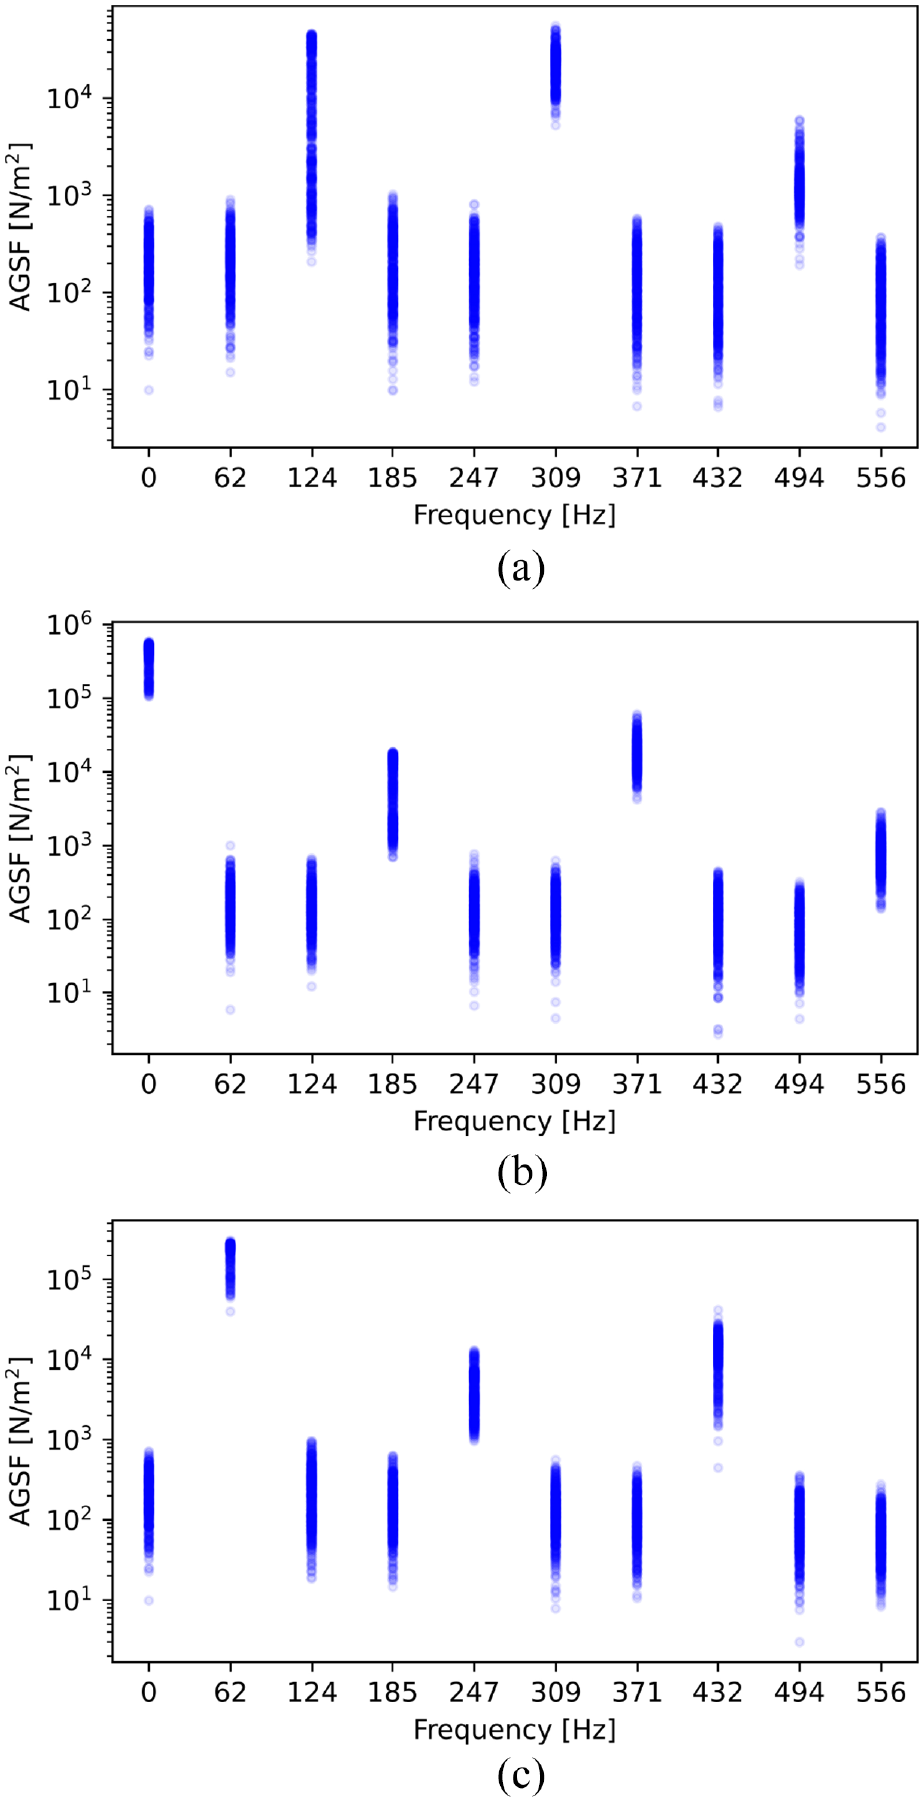
Air-gap surface force (N/m2) samples generated for different spatial orders at
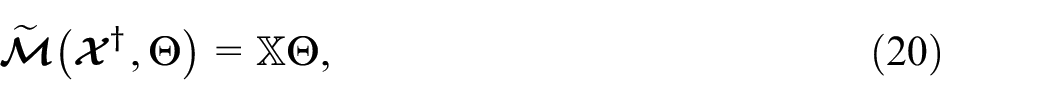
Multivariate multi-target parametric metamodel
In the case of stochastic setting, let
With the random input vector

A realization of
which is a simplified parametric approximation of the simulation model described in equation (14), that predicts
For the given

where each model

where
Deterministic check for multi-target regression model
Before proceeding with the stochastic analysis using Bayesian approach, a fundamental practice is to perform the deterministic model evaluation to check the generalization error of the model developed. As discussed Prakash et al.,
19
Once the deterministic model is validated with sufficient accuracy, stochasticity in the model can be induced using Bayesian modeling approach, which is described in the next subsection.
Bayesian hierarchical model for forward analysis
Bayesian networks are probabilistic directed acyclic graphical models used to represent the relationships between random variables. It consists of nodes representing random variables and directed edges between them representing the probabilistic dependencies between those variables.
18
The main goal of performing the Bayesian analysis is to combine the prior knowledge with the available data to quantify the uncertainties in the output responses. In principle, the wide-range of input parameters used to generate the simulated data through model
Metamodel training stage
The available simulated data
where,
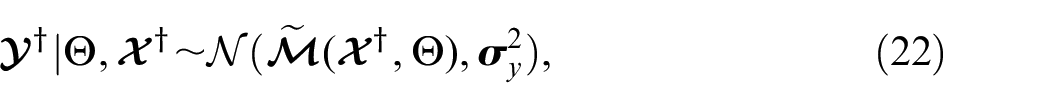
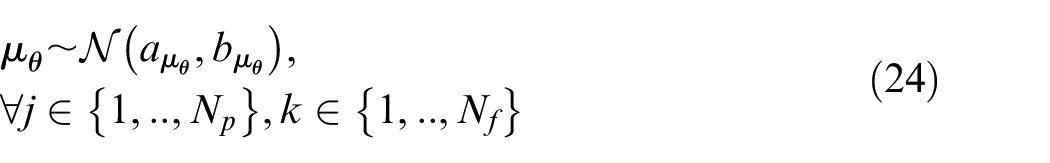
Let the “prior” PDF of the parameters

Markov Chain Monte Carlo (MCMC) methods are used to sample from this unscaled distribution which approximates the true distribution provided that the sample size is large enough.
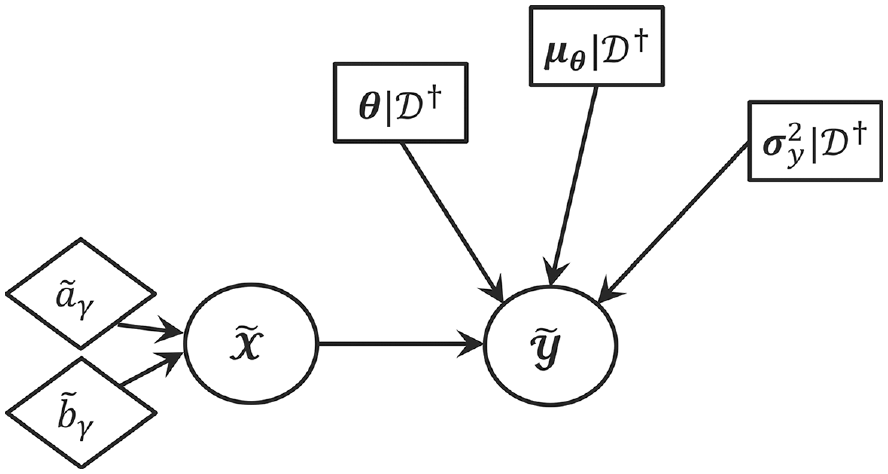
During the training stage, the following steps are followed which are also described as a hierarchical model in Figure 7.
1. Firstly, the training data is log-transformed in order to reduce the skewness and then it is standardized as shown in Figure 6. It is assumed that this transformed training data is distributed as per the Normal distribution with mean given by the model shown in equation (20), and variance
2. Formulate the function

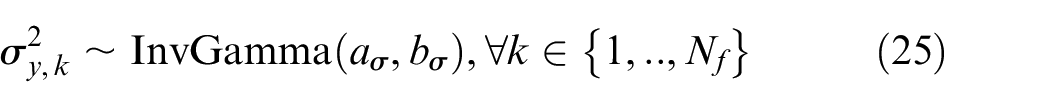
3. The model considers heteroscedasticity (Hetero-scedasticity refers to the property of a dataset where the dispersion of the dependent variable (output response) around its mean is not constant along the space of independent variables.) in the observations and therefore, the variance is distributed accordingly along the input frequency range and follows the inverse-gamma distribution:
4. Compute the posterior distribution of each random parameter using Hamiltonian Monte Carlo approach, specifically NUTS algorithm,
38
modeled using an open-source library PyMC3.
39
A total of four different MCMC chains were simulated resulting in 10,000 samples from which first 500 samples from each chain were discarded (commonly referred to as the “burn-in” process) to let the chain converge to its stationary distribution. The marginalized posterior distribution of each random parameter in the model is shown in Figure 8. Due to the high-dimensionality and random nature of the coefficient matrix
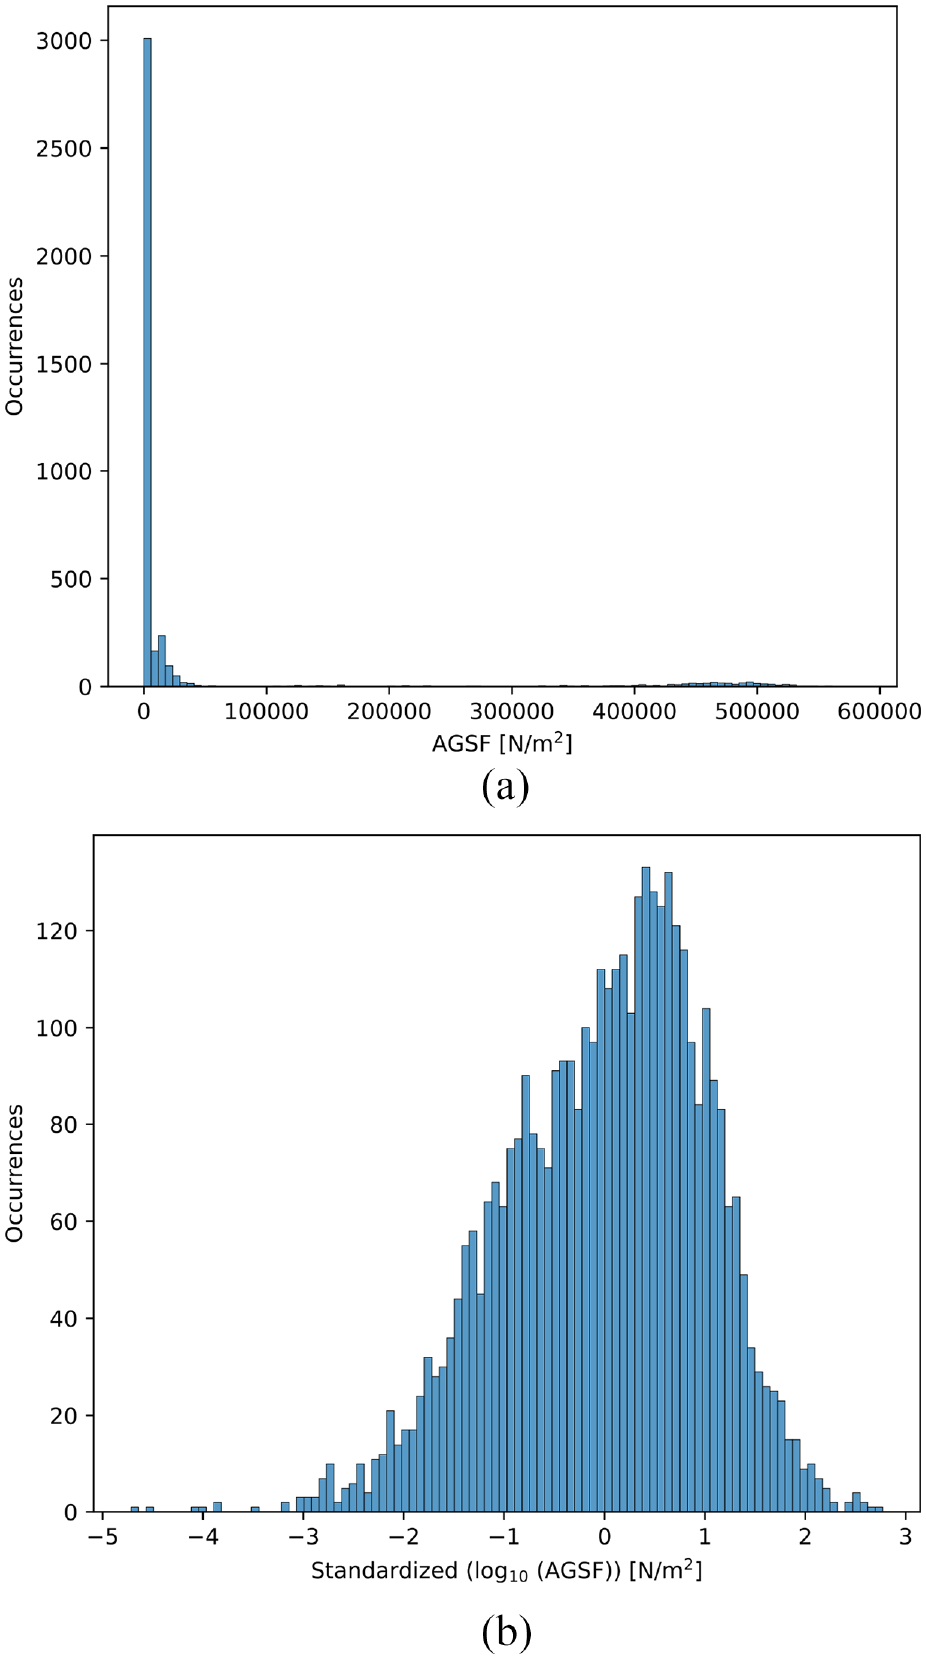
Data transformation to better represent the assumption of Bayesian modeling approach: (a) shows the occurrences of the original output training data (AGSF) and(b) the occurrences of the output training data after their standardized transformation.
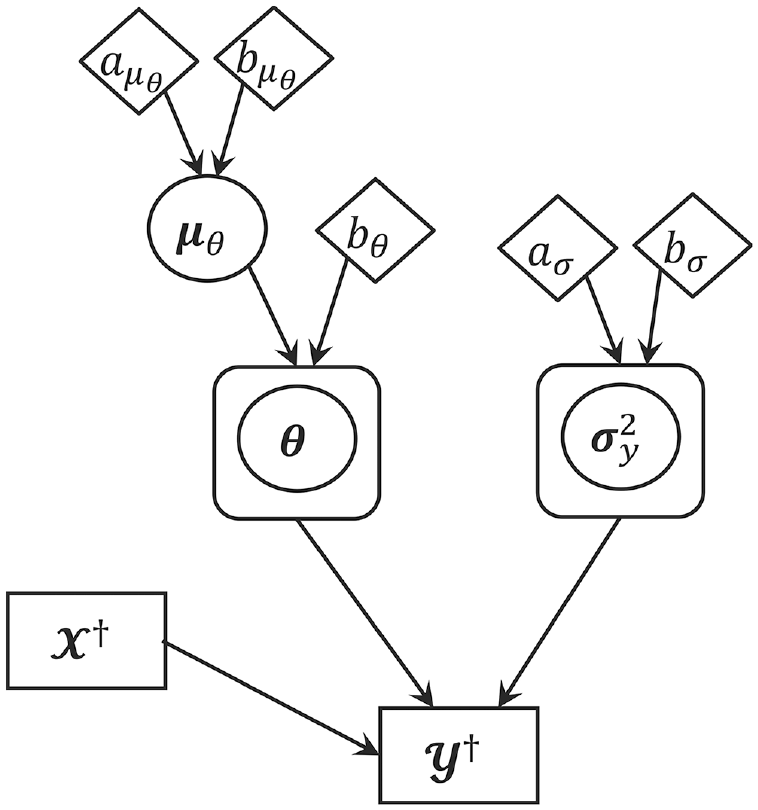
Bayesian hierarchical model. Key: rectangular boxes for deterministic data, random variables are shown in circles, diamonds represent the hyper-parameters of prior-distributions, and rounded boxes represent the replication of variables following the plate notation.
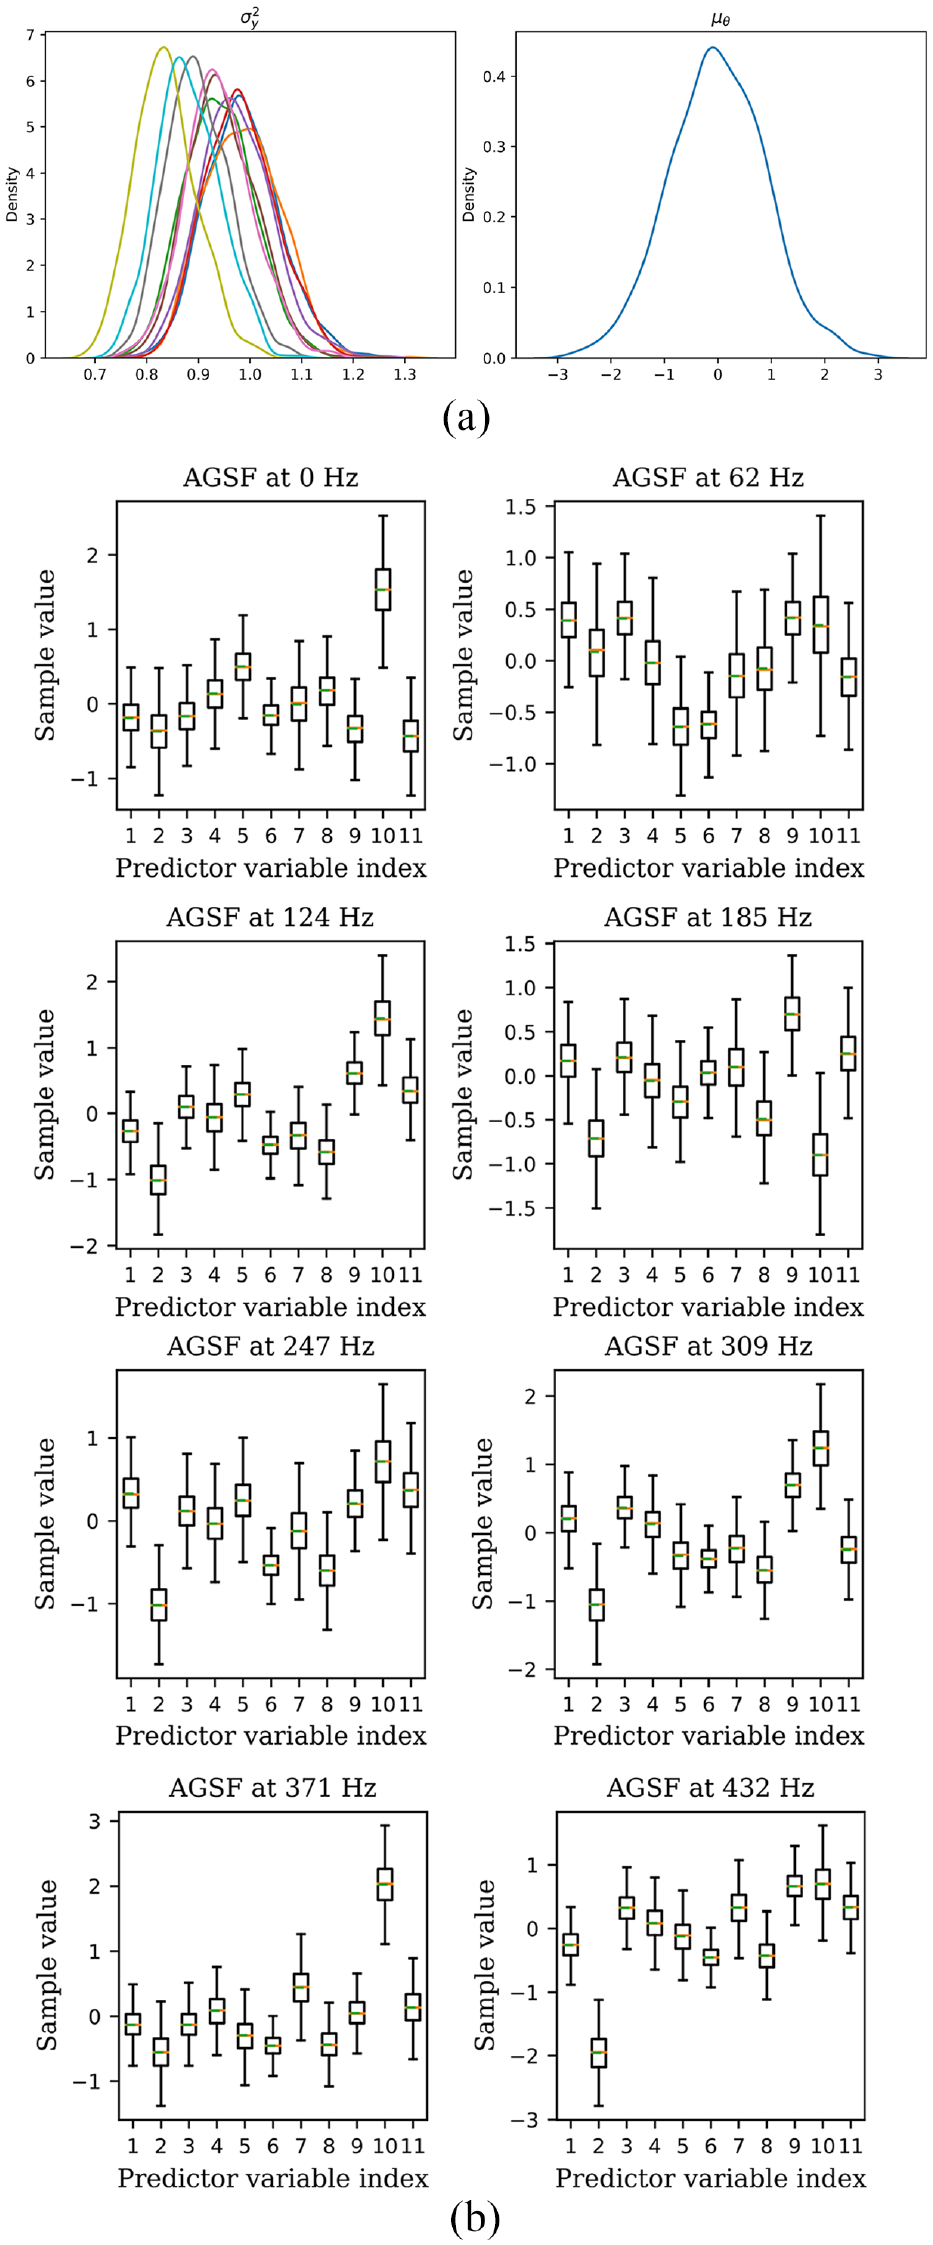
Posterior distributions of random variables in the Bayesian hierarchical model: (a) depicts the posterior distribution of 1000 posterior samples of the random variables
Bayesian metamodel validation
The trained Bayesian model must be validated on the basis of the approximated posterior distribution of each unknown random parameter and its predictive capability on the validation dataset given by
The distribution of replicated data is compared against the distribution of original data, both for the overall marginalized distribution and also for the marginalized distribution at each frequency bin (or target), as shown in Figure 9. It is noticed that the model is able to capture the pattern in the training data. However, when the data distribution exhibits bimodality, for instance at
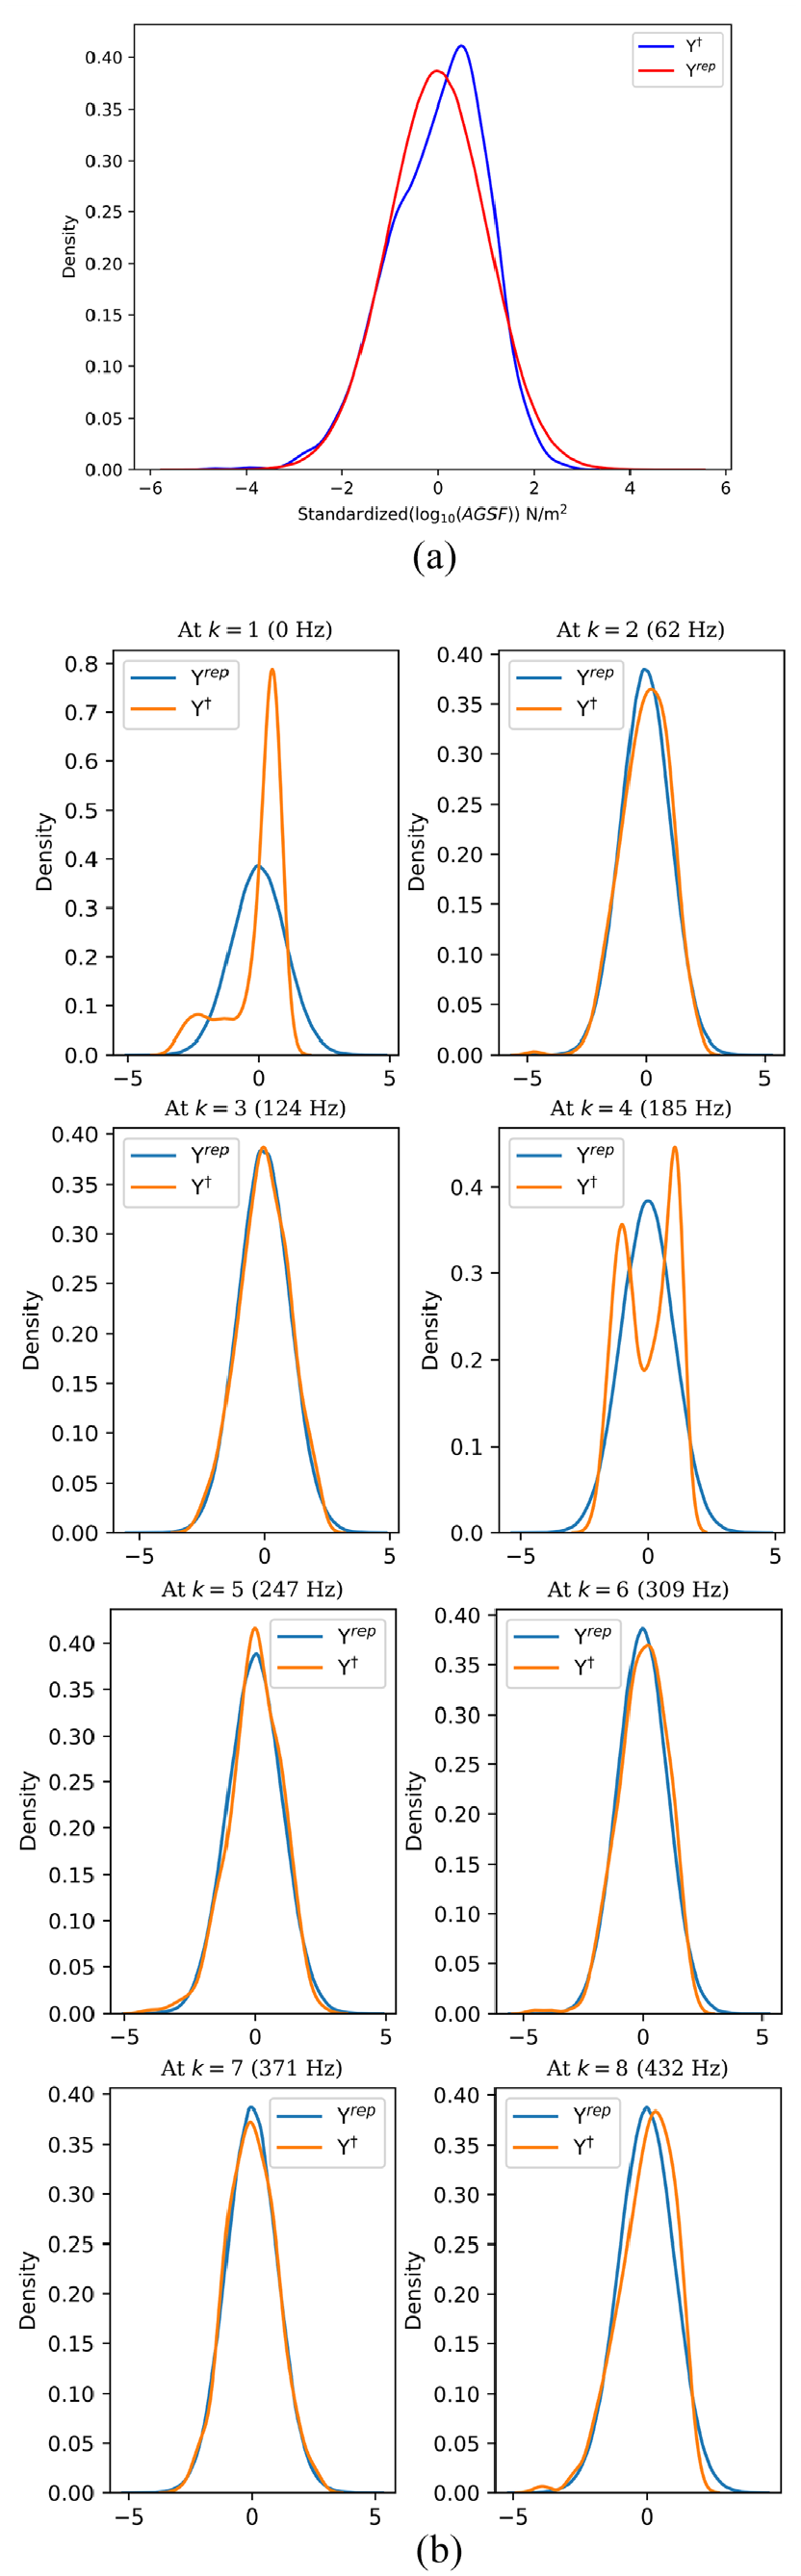
Posterior predictive check: (a) shows the marginalized distributions of the overall training data and the overall replicated data and (b) shows the marginalized distributions of the training data and the replicated data at each frequency bin.
Exploitation of Bayesian metamodel
Conditioning on the observed training data
where,
Scheme depicting the exploitation phase of Bayesian metamodel (key to identify different elements and relationships remains same as used in Figure 7).
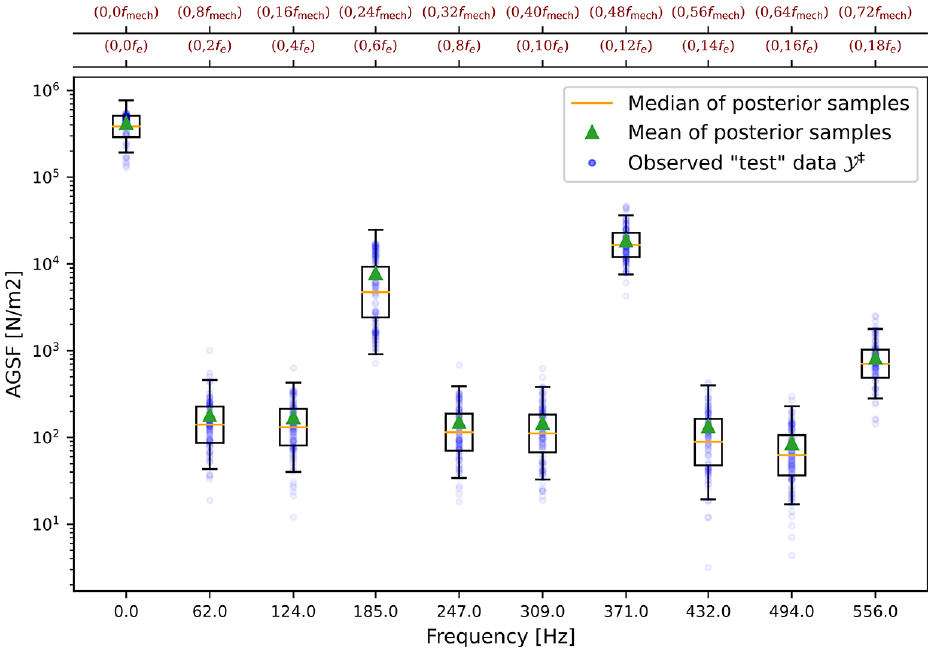
Posterior predictive samples for the validation dataset
On the basis of these posterior predictive samples
Propagation of uncertainties in electric motor stage
The dynamic vibration displacement of the IPMSM surface is directly dependent on the harmonic characteristics of magnetic excitation and the natural frequencies and mode shapes of the stator-system (refer to equation (10)). The uncertainties in the magnetic excitation is captured through the Bayesian metamodel developed in the previous subsection. The uncertain geometrical parameters
where
Metamodeling for electric powertrain suspension
Problem statement
In order to mitigate the vibrational energy transmitting from the e-powertrain to the vehicle body side, powertrain mounts are generally installed between them. The primary function of the engine mounts is to reduce the transmission of dynamic forces at lower frequencies and provide a static support to the powertrain weight. In the literature, the analysis of vibration characteristics of powertrain mount systems focused mostly on internal combustion engines (ICE). 43 However, the vibrations transmitted from e-powertrain is quite different from the classical ICE powered drivetrains as e-motors have lower inertia, vibrates at higher frequencies and lower amplitudes along with the reverse torque. Nevertheless, globally for e-powertrains, some design considerations regarding the mounting architecture remains the same with certain modifications to adapt the electrification. Different models have been realized in the literature to study the dynamic behavior of e-powertrain mount resonances with its dynamic mass participation and with different mounting architectures.44–46
As the scope of this paper is rather global, a few degrees of freedom (dof) linearized model is sufficient to model the forces transmitting from the e-powertrain to the mounts on the vehicle body. In this context, an internal Stellantis tool has been used to estimate these forces by considering a three-point suspension architecture, consisting of three mounts each with three translational dofs (
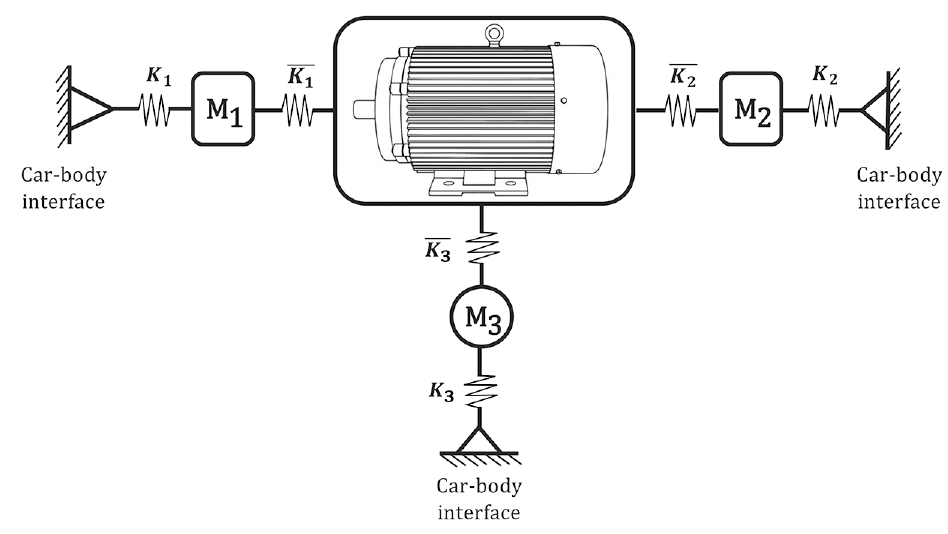
A simplified schematic of a typical three-point e-powertrain suspension architecture showing three mounts (
Let

where ⊙ represents the Hadamard product for element- wise multiplication.
To account for the uncertainties in the mounting behavior through the transfer function model


where “c” and “k” represents the position coordinate and the stiffness parameter of the rubber mount, respectively characterized with their hyper-parameters. Then, Latin hypercube sampling, 47 a widely used stratified sampling technique, is employed to sample from these distributions once the values for the hyperparameters are decided.
A similar Bayesian framework is applied as the one used for training and validating the electromagnetic forces in e-motor stage. However, the output space for EM-domain depends on the number of mechanical orders
Bayesian principal component regression with data reduction
Bayesian principal component regression (BPCR) essentially involves two steps: First, the principal component analysis (PCA)
48
is performed on the output training matrix to obtain the orthogonal principal components (PCs). Then, a small subset of PCs containing most of the “information” is chosen (resulting in dimensionality reduction) to perform Bayesian regression to predict the response variable. To determine the number of PCs to retain, multiple methods have been proposed in the literature and grouped under subjective (e.g. scree plots), distribution-based (e.g. Barlett’s test), and computational procedures (e.g. cross-validation).
49
In this article, percentage of total variance explained by a subset
Let the complex-valued output training data (transfer function) be defined as
where
where
where
The same approach is followed for the metamodel training as presented in Section “Metamodel training stage” with the difference that, it is now trained on PCs. The Bayesian model for each dof reads


where
where the augmented predictor matrix is given by
The predictive distribution of the transformed posterior samples is as per equation (26). However, these samples are needed to be transformed back to obtain the true predictions. Let
Consider

Application of BPCR on a typical e-powertrain architecture
In this article,
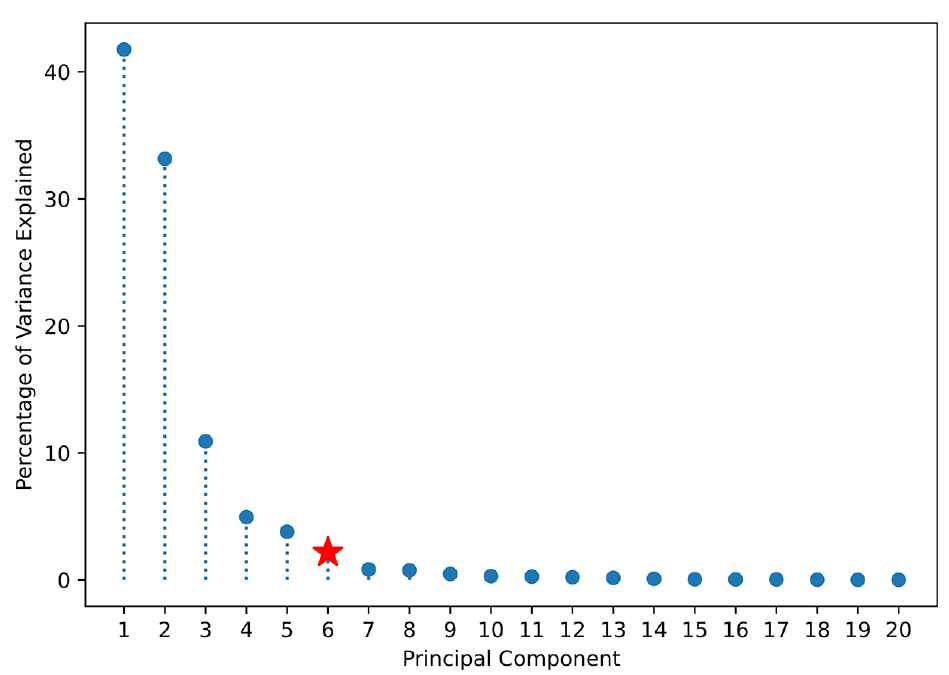
Scree plot depicting the total variance explained by each PC. The highlighted star-marked point indicates that
The magnitude of the posterior samples drawn from the posterior predictive distribution through the left mount
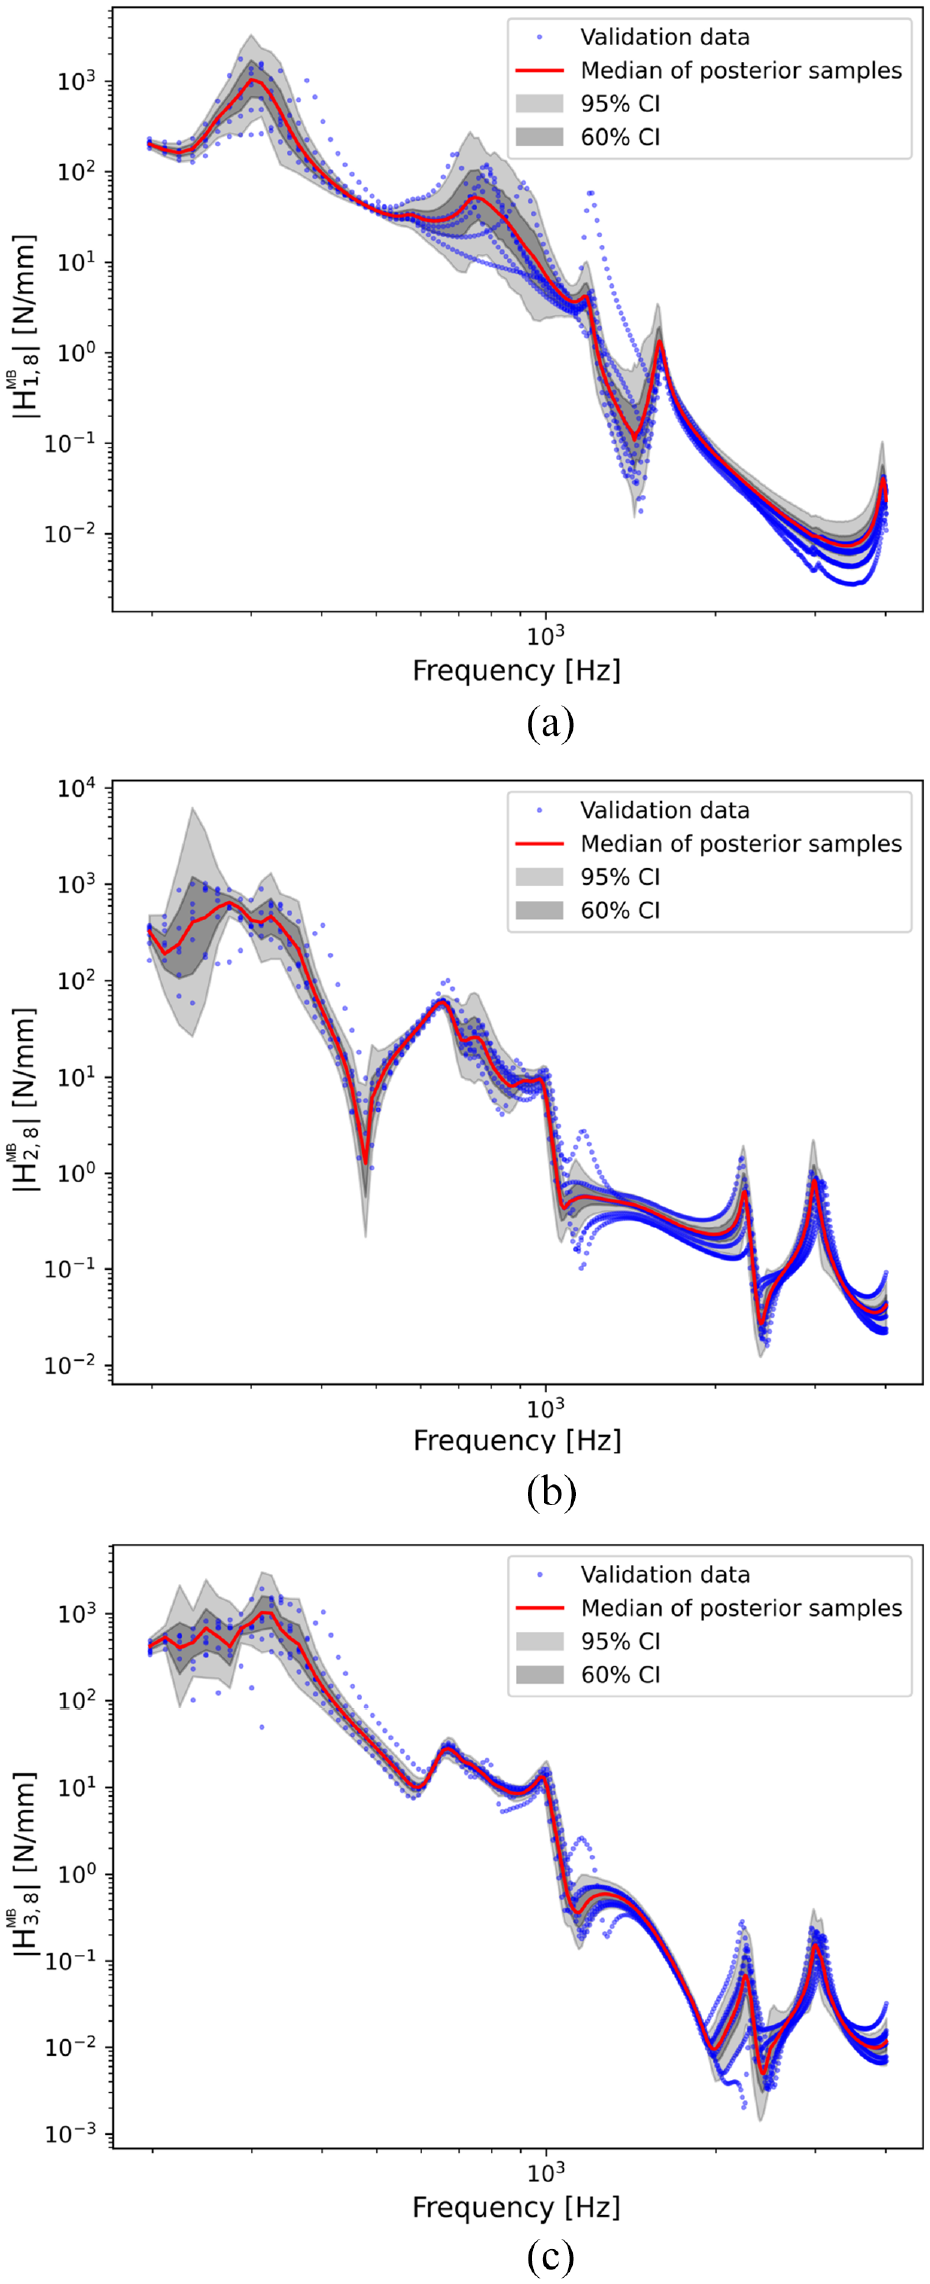
Magnitude of posterior predicted samples of the transfer function
Interior sound pressure level through coupled stochastic metamodels
In this section, an example use-case is considered where low prior-knowledge is assumed on the physical parameters. Let


where
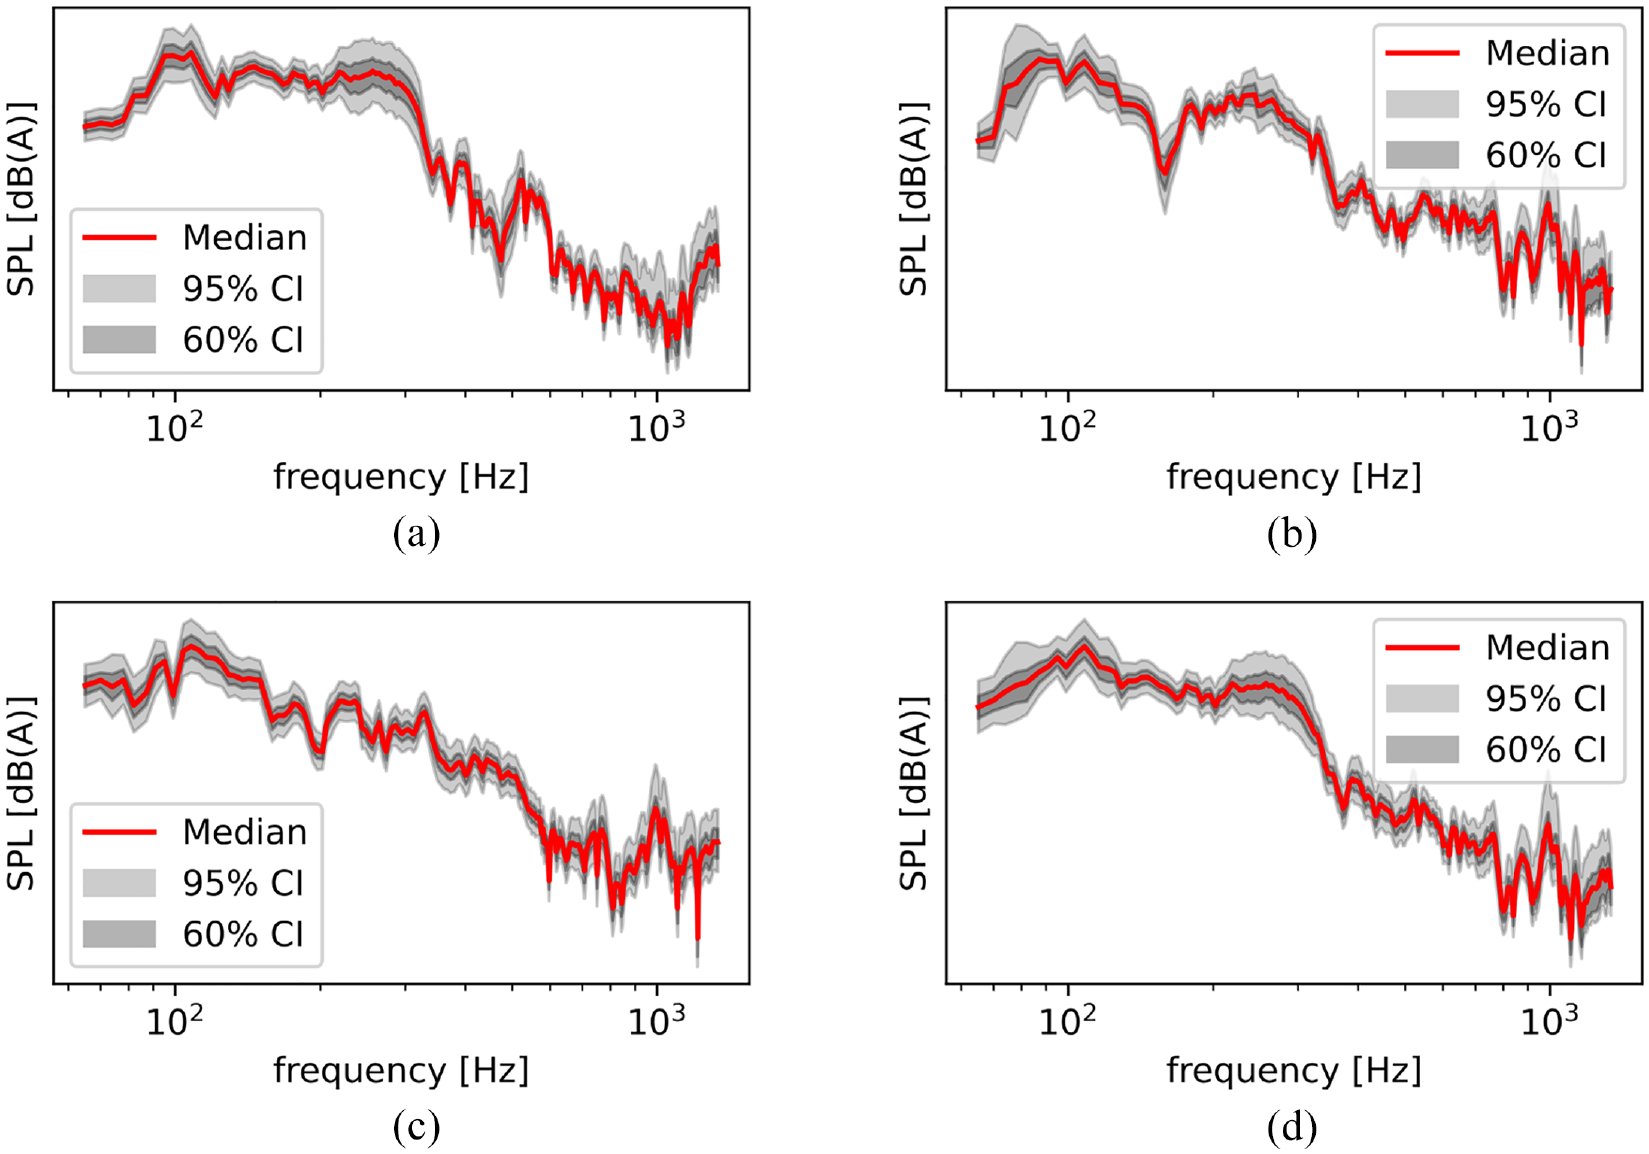
Interior SPL through left mount
At each dof, the e-powertrain suspension metamodel has been trained and the acoustic levels are predicted at each specific mechanical order. The frequency resolution depends on the number of sampled speed profiles and therefore,
Validation
The validation of the developed stochastic scheme for the structure-borne whining noise can be done by employing two distinct approaches: first, direct validation by measuring the SPL inside the cabin and then overlaying the measured data on the estimated dispersed data; second approach is, a block-wise validation scheme considering the electromagnetic, structural, and coupling domains separately, for the different domains shown in Figure 2. Despite serving as a crucial benchmark for method evaluation, with direct validation approach, the measured SPL data must be readily available for specific e-machine configurations, which is usually limited or nonexistent in the early stages of design. On the other hand, block-wise validation approach can be used in the absence of measured data and in identifying any limitations or discrepancies in each domain, allowing for targeted improvements or adjustments to the method developed.
Validation of EM-domain
The EM-domain is validated by comparing the average EM torque (as briefly described in Section “Validation of the simulation of EM-domain” and also refer to Pile et al. 26 for more details on EM torque computation using Maxwell Stress Tensor method) from the simulated data using Pyleecan and the measured data used in the reference article by Yang et al., 27 in which the measurement was done on the same e-machine configuration as used in this study (refer to the nominal parameters in Table 2). Figure 16 shows that the simulated EM torque values and thereby the AGSF agree well with the measured data at different OCs.
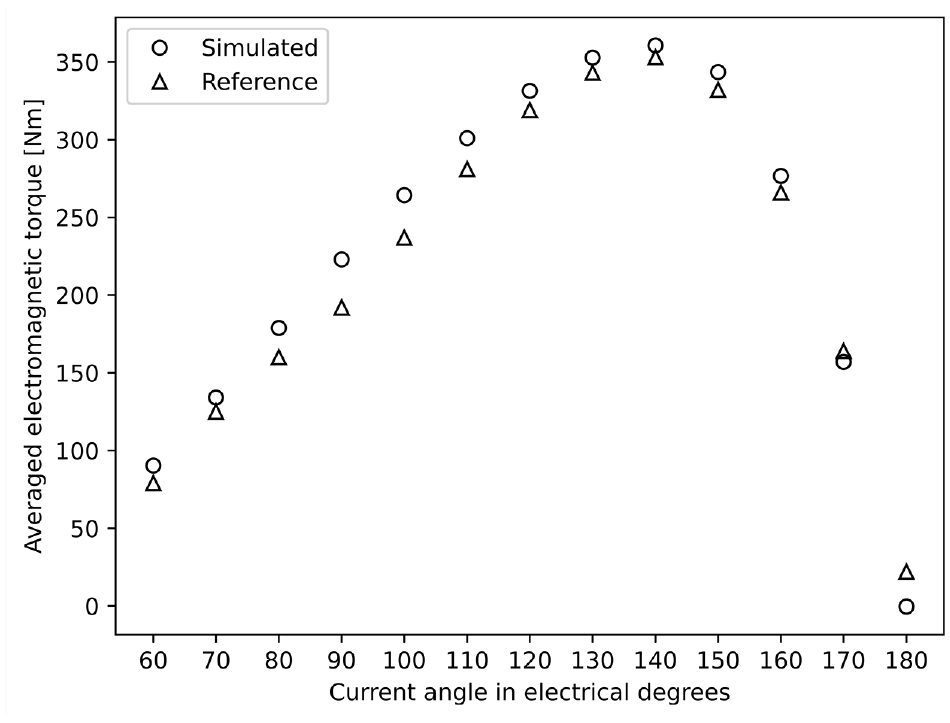
Comparison of average electromagnetic torque from simulated data using the open-source tool and the reference data (measured in Yang et al.
27
) at
Validation of structural domain
In structural domain, the analytical estimation of natural frequencies
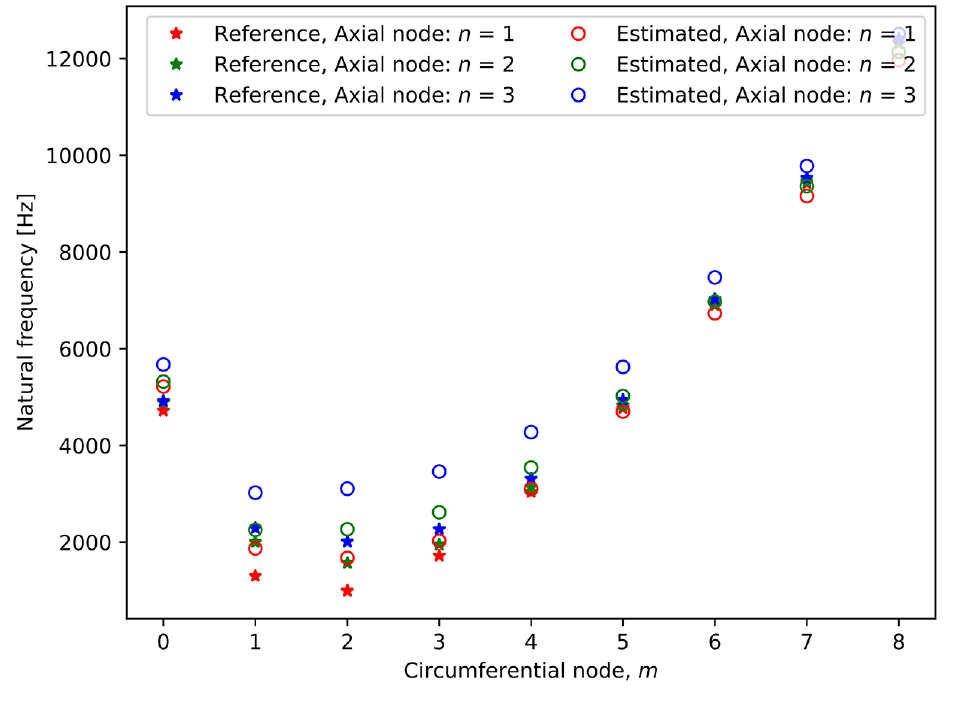
Comparison of natural frequencies of the stator system (design parameters same as the one used in Gieras et al.,
22
p. 117) between the referenced data and the estimated data for different
Validation of the in-house developed e-powertrain suspension model
For the validation of the in-house developed model for transmitting vibrations from e-motor to the mounts on the car-body side, the calculated vibration accelerations (using the internal Stellantis tool) at each dof is compared against the measured data for each spatial order. The measurement is done for a speed ramp-up
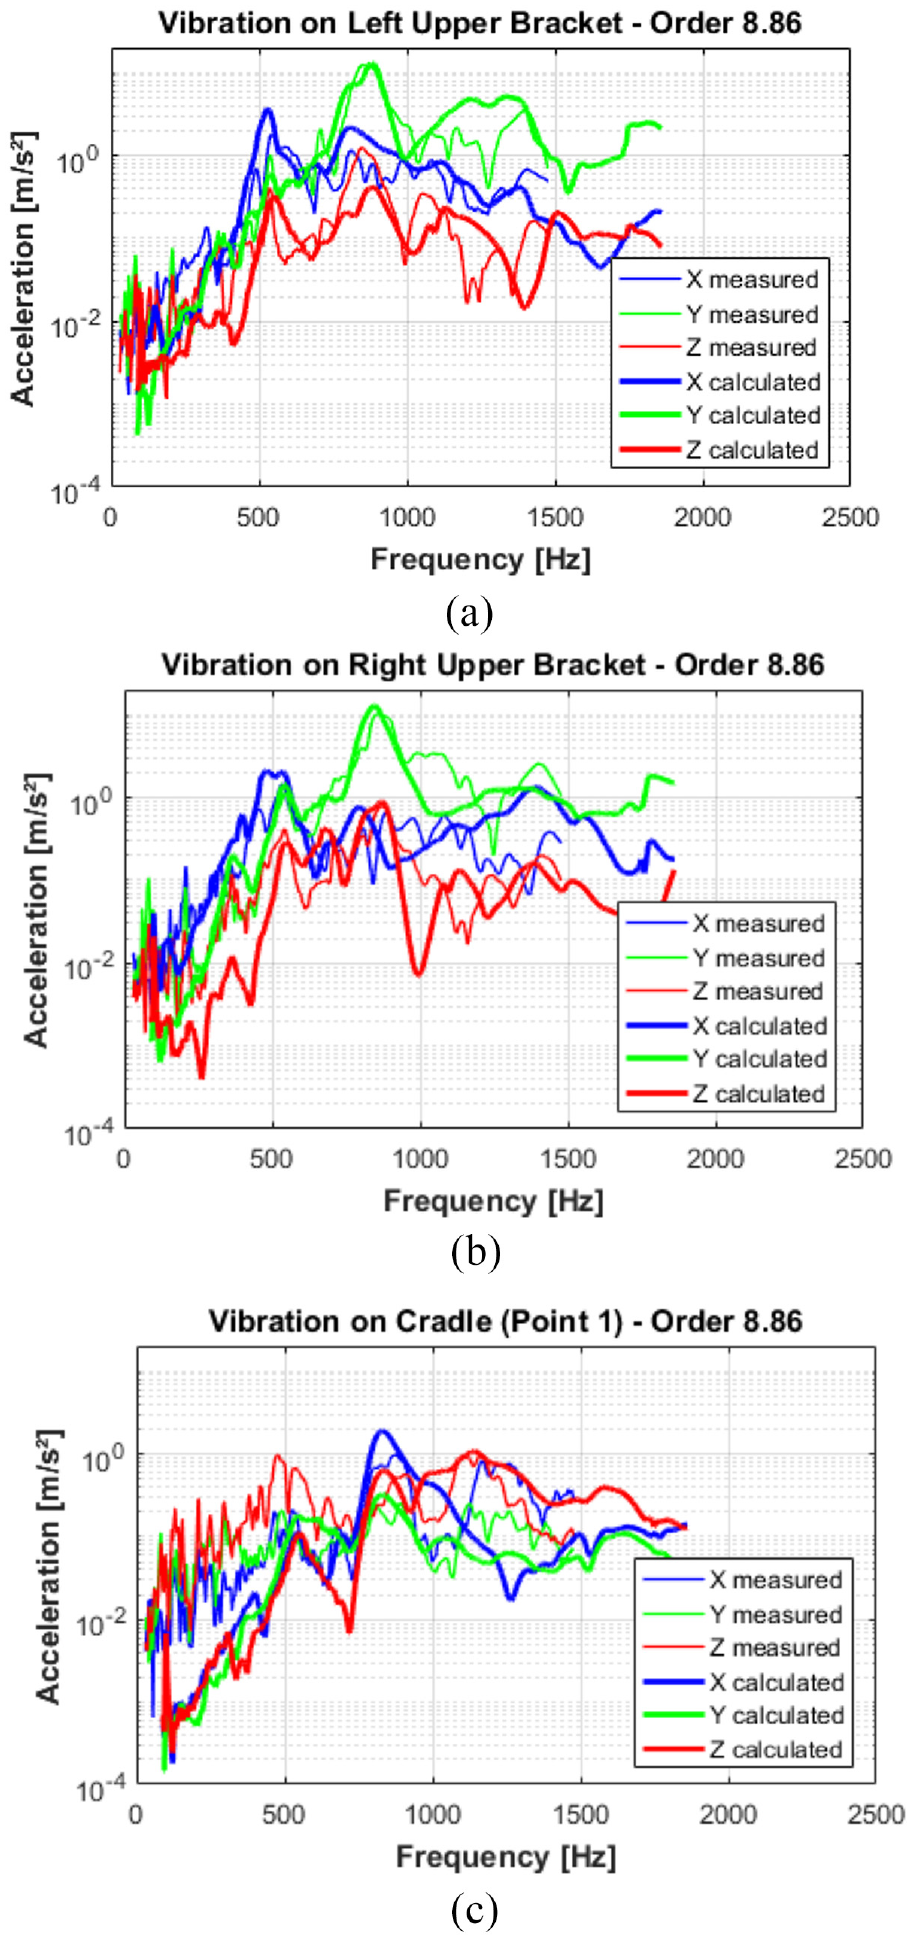
Comparison of vibration accelerations on three mounts at a specific mechanical order 8.86: (a) shows the vibration acceleration on mount
Conclusions and outlook
In this article, stochastic predictive metamodels are developed within the Bayesian paradigm to efficiently incorporate a priori domain knowledge along with the available data. The developed framework considers Bayesian model training, validation, and exploitation through multivariate-regression along with the objective engineering based assessment of the hyper-parameters. Multiple metamodels allow the quantification and propagation of uncertainties from the EM-domain to the structural domain and then through the e-powertrain mounting system to the vehicle-body. The data used for modeling are generated using a semi-analytical approach. Due to the time-efficient sampling from the posterior distribution using MCMC process, further accelerated by BPCR framework, NVH risks can be assessed during the early stages of the design process. The knowledge gained could facilitate in prioritizing suitable noise mitigation techniques that can be implemented, as well as state of the art methodologies for addressing technical requirements.
For perspectives, uncertainties coming from the available measured data could be considered along with efficient data reduction techniques improving further the performance of the metamodel training stage. A comprehensive “global” metamodel would then include not just the estimates from structure-borne contribution but also from airborne contribution. Moreover, such metamodels would allow, as a straight forward usage of the stochastic metamodel, performing efficient sensitivity analysis to infer information about the most influential design parameters.
Footnotes
Appendix
Declaration of conflicting interests
The author(s) declared no potential conflicts of interest with respect to the research, authorship, and/or publication of this article.
Funding
The author(s) disclosed receipt of the following financial support for the research, authorship, and/or publication of this article: This research work is funded by the European Commission’s H2020-Innovative training network (ITN) under the project ECODRIVE (Grant Nr. 858018) and we gratefully acknowledge the support of OpenLab Vibro-Acoustic-Tribology at Lyon, Laboratoire Vibrations Acoustique (LVA), INSA Lyon, the NVH department of Stellantis N.V., and EOMYS Engineering for their contribution toward open science through Pyleecan.