
Abstract
Cooperative truck platooning, a convoy of trucks driving together while communicating and coordinating with each other, represents a technology-driven approach to improve energy conversion efficiency, lower greenhouse gas emissions, and enhance road safety. Despite numerous studies have explored these potentials, there is a scarcity of empirical investigations into on-road cooperative truck platooning during commercial operations, particularly in winter driving conditions. This paper presents the findings of an experimental study on the first commercially focused truck platooning implementation on a Canadian public highway in the winter season, using two SAE level 2 class 8 trucks. The on-road trials took place on the Queen Elizabeth II Highway, between Calgary and Edmonton, with ambient temperatures ranging from −27°C to 12°C, and truck weights spanning 16–39 tons. Nine well-trained and experienced drivers conducted 41 incident-free (platooning and baseline) test trips, covering a distance of 22,855 km. The experimental results confirmed the feasibility of operating commercial truck platooning with 3–5 s time gaps on public roads during the Canadian winter season including various road surface conditions. The results also show that the platooning engagement ratio reached up to 88.9%, with an average of 61.6% across 25 platooning trips. Furthermore, the follower truck achieved a 1.6% fuel savings on flat road sections during platooning, but its freight transportation specific fuel consumption was higher than that of the lead truck on hilly terrain. Test results indicate the lighter truck exhibited higher specific nitrogen oxides (NOx) emissions. Moreover, the frequent engagement and disengagement of the cooperative truck platooning system had adverse effects on the powertrain system of the truck, leading to increased fuel consumption and engine-out NOx emissions. This study provides real-world data to identify limitations and needed areas for improvement in adapting cooperative truck platooning technology to commercial operations on public roads.
Keywords
Introduction
The emerging connected and automated vehicle (CAV) technology holds significant promise in the realm of traffic safety enhancement, energy efficiency improvement, and traffic throughput optimization.1,2 One practical application is platooning, where two or more CAVs collaborate, forming a road train. Trucking dominates freight shipping in Canada, a crucial pillar of the economy, but also a major source of pollution; freight trucks account for 37% of Canada’s transportation-related greenhouse gas (GHG) emissions. 3 Thus, truck platooning, electronically connected multiple trucks in convoy, is a promising way to lower energy consumption and GHG emissions by reducing aerodynamic drag and gaining smooth speed profiles for follower trucks via coordinated efforts among the trucks. 4
Numerous projects have been contucted globally to explore truck platooning and its impact, some detailed in Table 1. The European Commission’s PROMOTE CHAUFFEUR project initiated truck platooning exploration from 1996 to 2003 with two phases (I and II). Demonstrations on test tracks and in mixed traffic showed fuel savings of up to 21%.5,6 The California Partners for Advanced Transit and Highways (PATH) program embarked upon its research on truck platooning in 2000. Two identical Freightliner tractors towing 53-foot trailers, linked by an electronic control system with only an automated longitudinal control function, were tested on an unused airfield runway in Crows Landing, California. Results indicated an average fuel saving ranging from 11% at 3–4 m spacing to 8% at 8–10 m spacing. 7 Other than the above-mentioned projects tested on a closed track or unused airfield runway, the German national project KONVOI, from 2005 to 2009, developed the first platoon system (KONVOI system) which enabled a platoon of four heavy-duty trucks to successfully operate for 3100 km in real traffic, although the fuel consumption was not measured. 8 It should be noted that during the demonstration, an escort vehicle and a police car accompanied the platoon, potentially influencing the interaction between platoon trucks and other road users. 9 In 2008, Japan launched the 5-year project Energy ITS, which investigated the energy consumption of heterogeneous truck platoons composed of three heavy trucks and a light truck. The tests on a closed track and along an expressway before public use demonstrated fuel savings of up to 15%.10,11 Canada conducted the cooperative truck platooning trial in 2018 with two SAE Level 1 trucks not only on multilane divided highways but also on forestry roads to verify the performance of the platoon system, although the trial did not quantify fuel savings. Furthermore, to address safety concerns raised by officials, the truck platoon was led and followed by escort vehicles, and system engineers sat alongside and accompanied the drivers, which could affect the public interaction with the platoon and interfere with the truck drivers. 12
Summary of reviewed truck platooning projects.
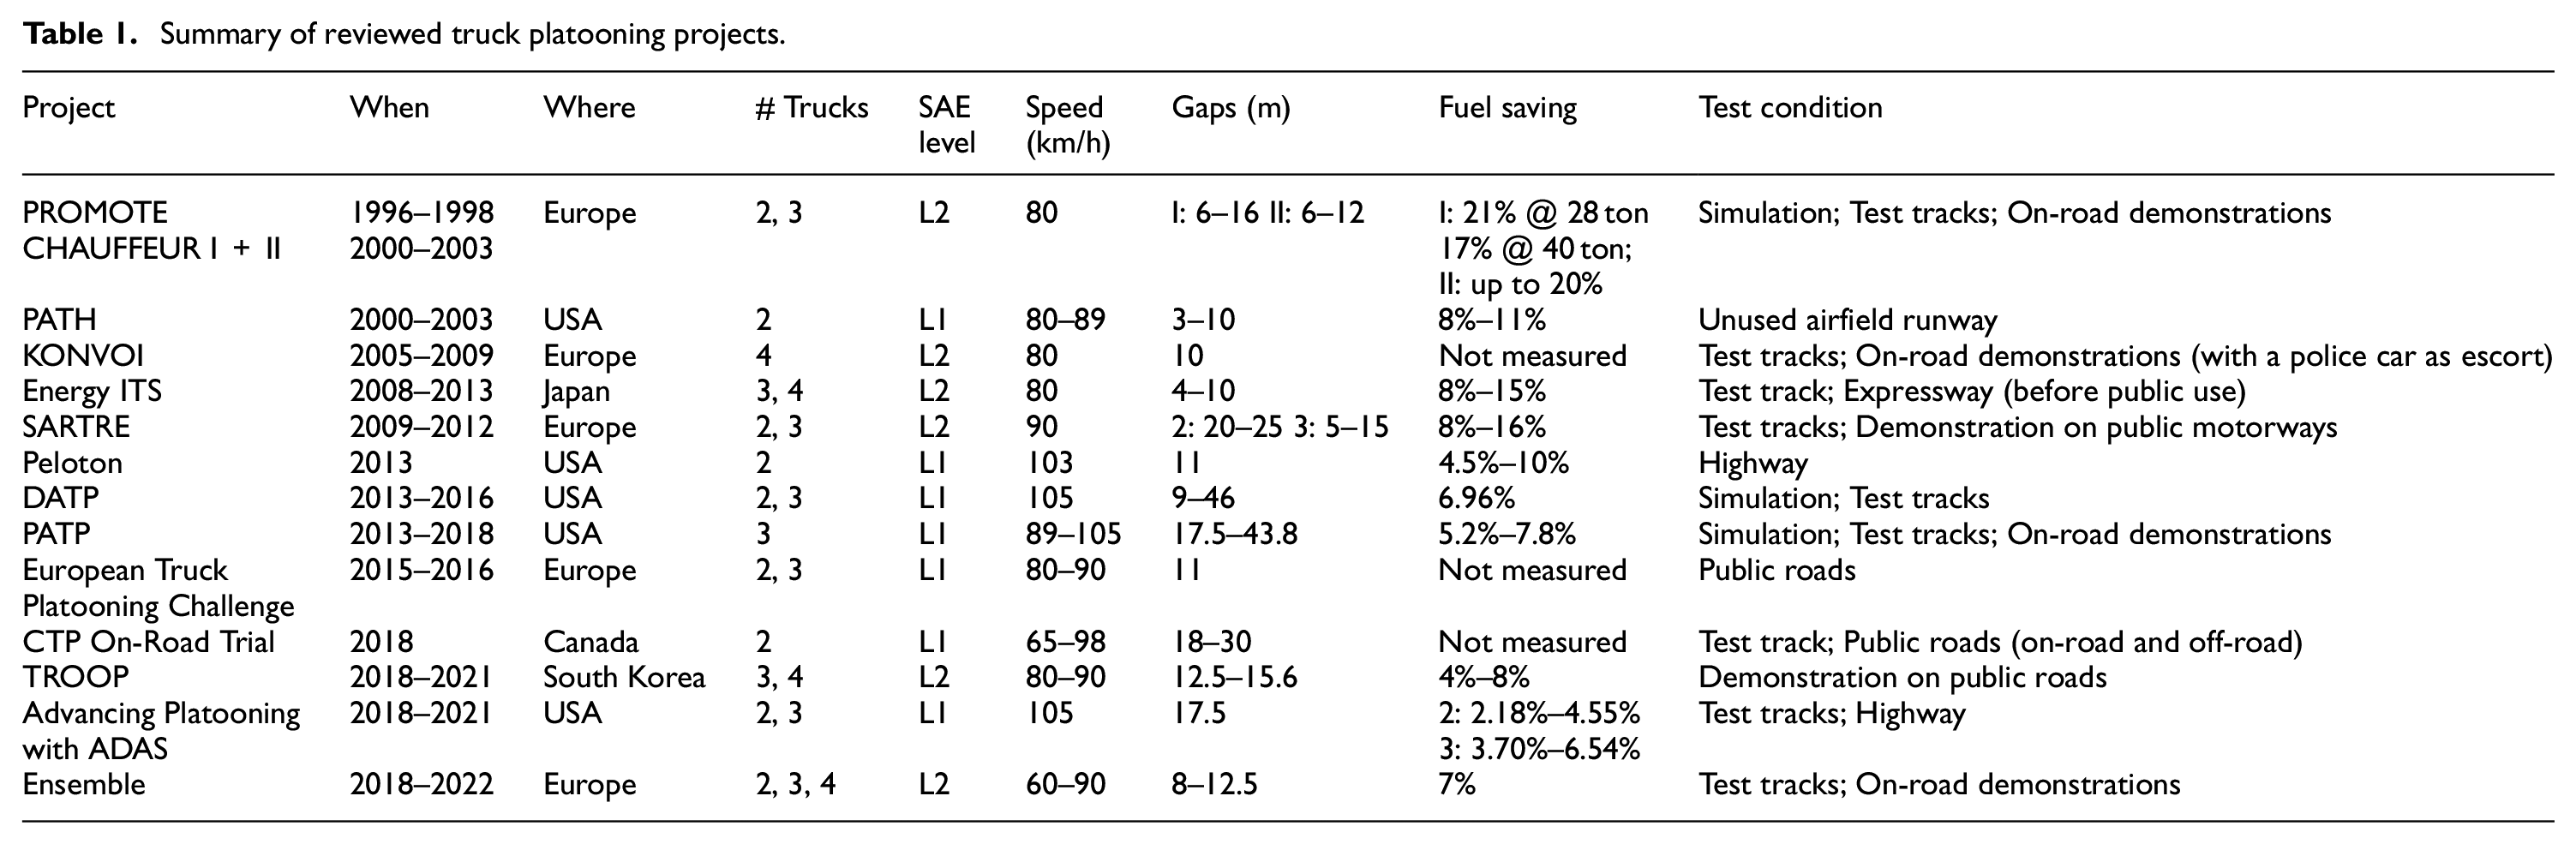
These projects have shown technical feasibility and highlighted fuel-saving and emissions-reducing benefits under “controlled” conditions. Previous studies mainly focused on air drag reduction through small separation gaps, without assessing the impact of cooperation on smooth speed profiles by reducing acceleration and deceleration frequency. Compared to the prior research, this study has clear objectives to explore the feasibility of implementing cooperative truck platooning under commercial operation on public highways, especially in winter driving conditions with varying road surfaces, to assess the performance of the cooperation during truck platooning, and also identify limitations and needed areas for improvement by using the real-world truck platooning data.
Figure 1 presents a summary of previous truck platooning projects under different SAE levels of driving automation. 24 Most of the truck platooning projects focused on SAE levels 1, 2, and 4. These projects were mainly conducted on test tracks and some of them were on public roads, while there are very few projects conducted on public highways under a commercial operation, especially in winter driving conditions with varying road surfaces. There is also a dearth of research examining commercial truck platooning for freight transport in the unforgiving cold conditions. To investigate the impact of commercial truck platooning in winter driving conditions, a project entitled “Cooperative Truck Platooning System (CTPS) Trial” was initiated in Canada, marking the country’s first commercial truck platooning trial during a Canadian winter. The trial involved two SAE Level 2 class 8 trucks with a minimum time gap of 3 s (equivalent to 83.3 m at the intended vehicle speed of 100 km/h) mandated by local authorities for safety in winter conditions on public highways. The setting of the separation distance in this trial was relatively large compared to other studies, which predominantly occurred in controlled environments such as closed tracks or roads, and some on highways with escort vehicles. Although a relatively large time gap could expect an inconsiderable reduction in aerodynamic drag of the platooning trucks, this study mainly focused on investigating the coordination between trucks in winter driving conditions to gain smoother speed profiles. By avoiding unnecessary deceleration and acceleration, follower trucks can lead to fuel savings and reduced engine transients, ultimately resulting in lower transient vehicle emissions. This paper leverages the real-world data to assess CTPS and specify the areas to improve.
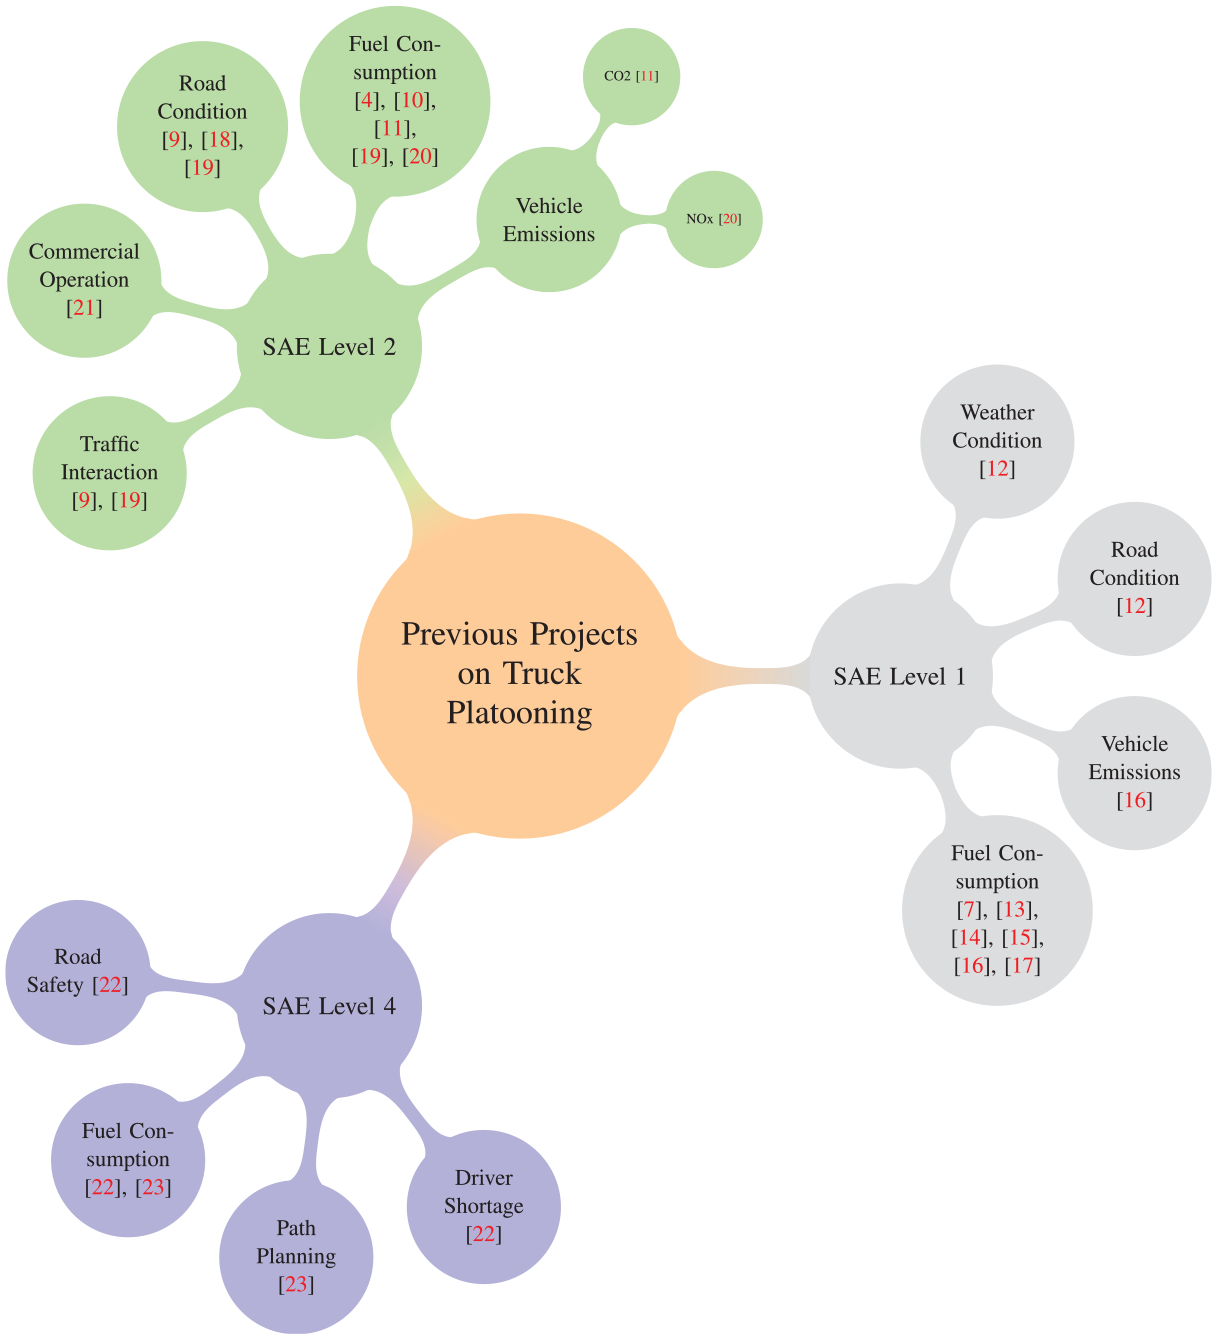
A summary of previous truck platooning projects categorized by different SAE levels of driving automation.
The main contributions of this study include:
Filling the gap in implementing cooperative truck platooning for commercial operation in winter conditions with different road surfaces, and also providing real-world data from CTPS performance in winter condition under commercial operation.
Introducing a new perspective by illustrating safe truck platooning distances for winter public road operation, emphasizing benefits in smooth speed profiling rather than significant aerodynamic drag reduction. To the best of authors’ knowledge, this is the first study to show results with this setting since all prior studies have much shorter platoon distances.
Offering a quantitative assessment of platooning performance, including platoon engagement ratio, speed profile, fuel consumption, and NOx emission, under winter commercial operation with different road surface conditions and varying cargo loads.
Presenting an event-based analysis focusing on the effects of platoon engagement status on powertrain instantaneous response under commercial CTPS operations in public traffic. This dimension adds depth to our understanding of dynamic interactions within the platoon, shedding light on the effects on powertrain performance.
The remainder of this paper is organized as follows. Section ``Test conditions'' introduces the test conditions for the CTPS trial. The test procedures and data collections are presented in Section ``Test procedure and data collection''. The test results from the platooning trips are given in Section ``Test results''. In Section ``Conclusion'', the conclusions are presented.
Test conditions
The test was conducted in the real-world environment, and it included a number of variables. The primary controlled variables were the number of drivers, truck operating mode, time gap, and route. Non-controllable variables comprised road surface conditions, weather conditions, traffic conditions, cargo weight, and trailer configuration. Certain variables such as road surface conditions, truck weights, and road slopes were interconnected with respect to the vehicle dynamics, which can affect fuel consumption in parallel. To eliminate the impact of the interdependencies, we conducted post-processing on the data to ensure the presentation of precise results. For example, we can limit the weight difference (±5%) between platoon trucks to assess the impact of road gradiant on fuel consumption under the same road surface conditions. Similarly, we can analyze the effect of truck weights on fuel consumption under the same road section with the same road gradient and road surface.
Test route and road information
Alberta’s Queen Elizabeth II Highway (also known as Highway 2), the major transportation corridor between Edmonton and Calgary, was selected to conduct the CTPS trial. The designated route is a predominately four-lane divided highway. As shown in Figure 2, the single-trip mileage between the origin and destination is 323 km, and the planned platooning trip was aimed for a portion of Highway 2 between Airdrie and Leduc with a distance of 234 km. Furthermore, the elevation difference between the origin and destination is 360 m. In the direction from Edmonton to Calgary, the road grades range from −5.1% to 5.6%, and the minimum horizontal curve radius is 680 m. In the opposite direction, the road grades vary from −5.8% to 5.3%, and the minimum horizontal curve radius is 700 m. Via round trips, trucks’ data was collected on both directions as traffic characteristics were different for outbound and inbound trips.
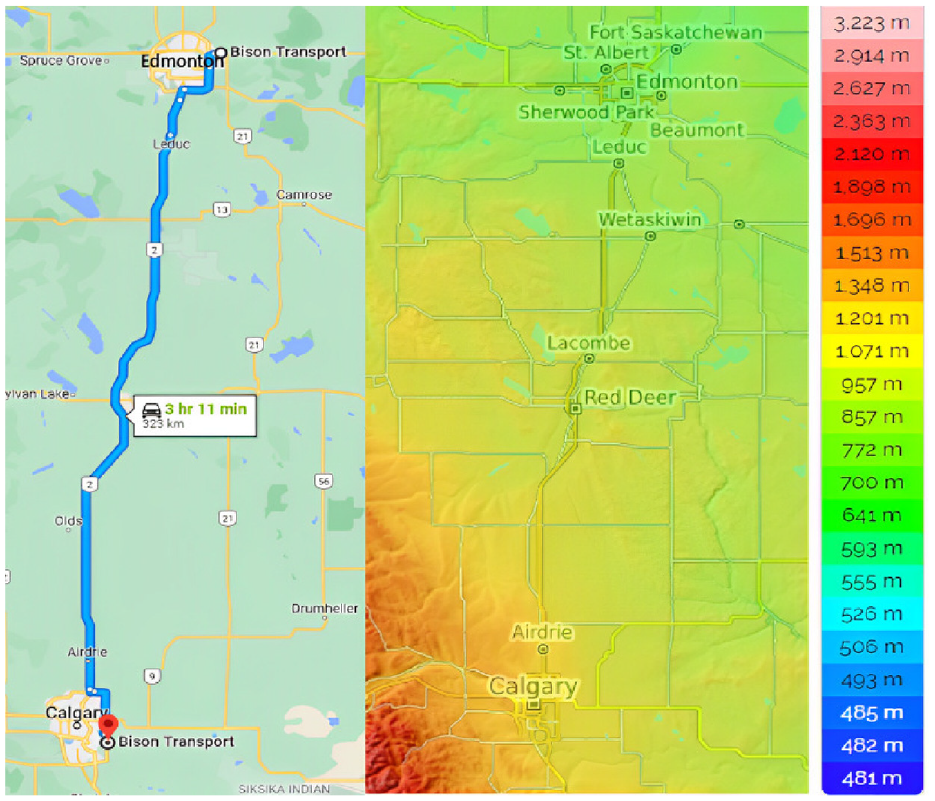
The test route in this study and the topographic map showing the elevation from sea level for the test route.The left-side navigation map was generated from Google Maps and the right-side topographic map was generated from topographic-map.
Truck and trailer configuration
Two class 8 trucks were used for all CTPS trial phases. Both vehicles used in the study were Peterbilt 579 trucks and the model years were 2019. The trucks were outfitted with Cummins X15, 14.9 L engines certified to 2017 US EPA Tier III emission regulations. All the trailers used in on-road trials were dual tandem axle, and ran on SmartWay (low rolling resistance) certified tires. Furthermore, all trailers were equipped with side skirts. Table 2 shows the truck and trailer specifications.
Truck and trailer specifications.
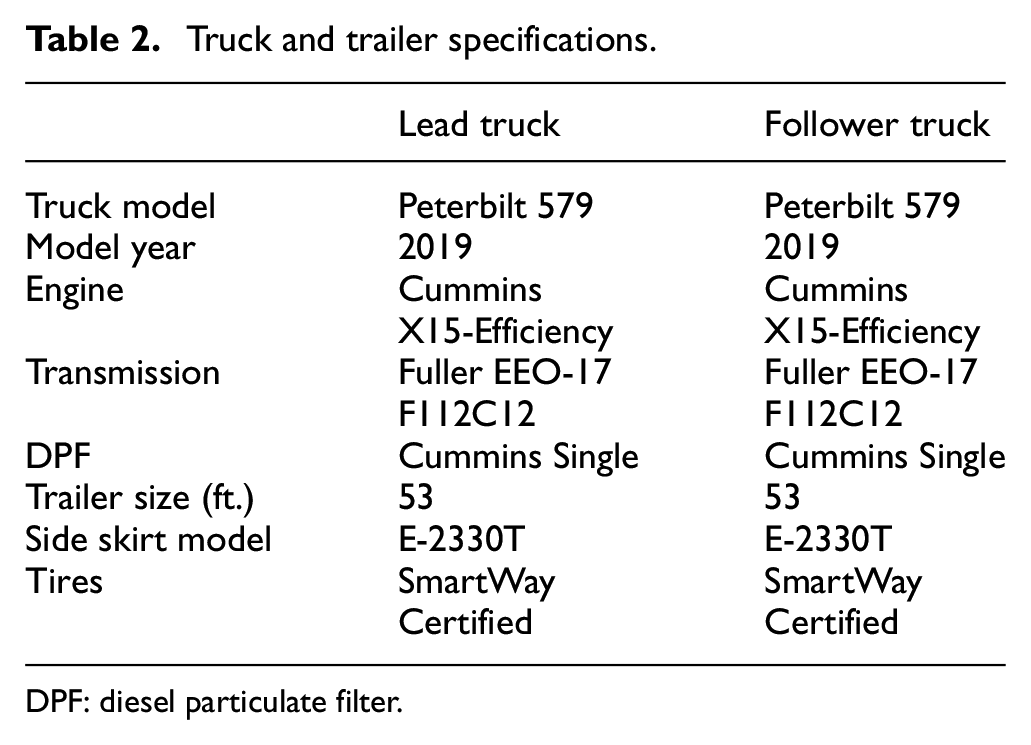
DPF: diesel particulate filter.
An image of a Peterbilt 579 tractor towing a Bison Transport trailer is shown in Figure 3. Cargos that were included in the trailer for the trips on Highway 2 were mainly retail products along with some paper products and supplies directed to warehouses. They were dry and temperature-controlled materials. It should be noted that the heating, ventilating, and air conditioning (HVAC) systems of the refrigerated trailers were powered by a separate fuel reservoir on-board the trailer and had a negligible aerodynamic impact.
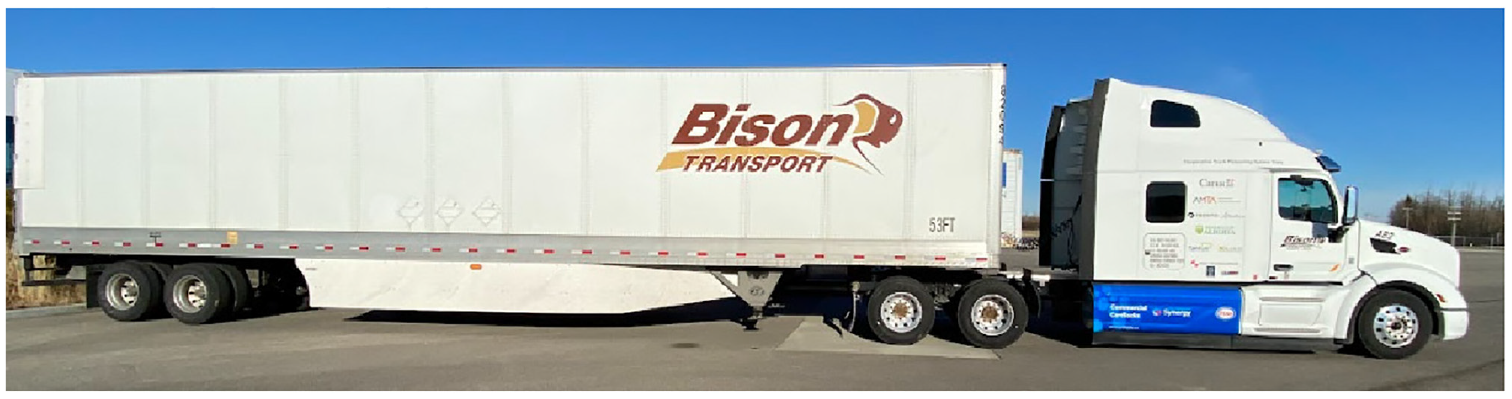
A picture of the Peterbilt 579 tractor pulling a trailer from Bison Transport.
Truck platooning system
In this study, the platoon included two class 8 trucks equipped with cooperative truck platooning systems, consisting of global positioning system (GPS), vehicle-to-vehicle (V2V) communication, cameras, radars, and other sensors, as shown in Figure 4. The GPS provided accurate positions of the trucks, and the long-term evolution (LTE) antenna allowed two trucks to communicate with each other and convey important information for platooning. The forward-facing camera on the windshield was responsible for detecting objects (e.g. vehicles, lane markings, etc.), and the driver-facing camera was used to monitor the driver’s behavior for attentiveness. The radar in the front bumper was employed to detect preceding vehicles and measure the distance between the host truck and other vehicles. Furthermore, the sensor fusion between the forward-facing camera and the radar was used to provide an accurate estimation of the distance between the two trucks. The trucks outfitted with CTPS in this study are classified as SAE Level 2 automation according to the SAE J3016 standard, 24 which means the system supports steering and deceleration/acceleration (e.g. lane centering and adaptive cruise control at the same time), but the driver must constantly monitor these support features and be ready to take over control of the truck as needed to maintain safety. Figure 4 shows the two trucks during cooperative platooning operation.
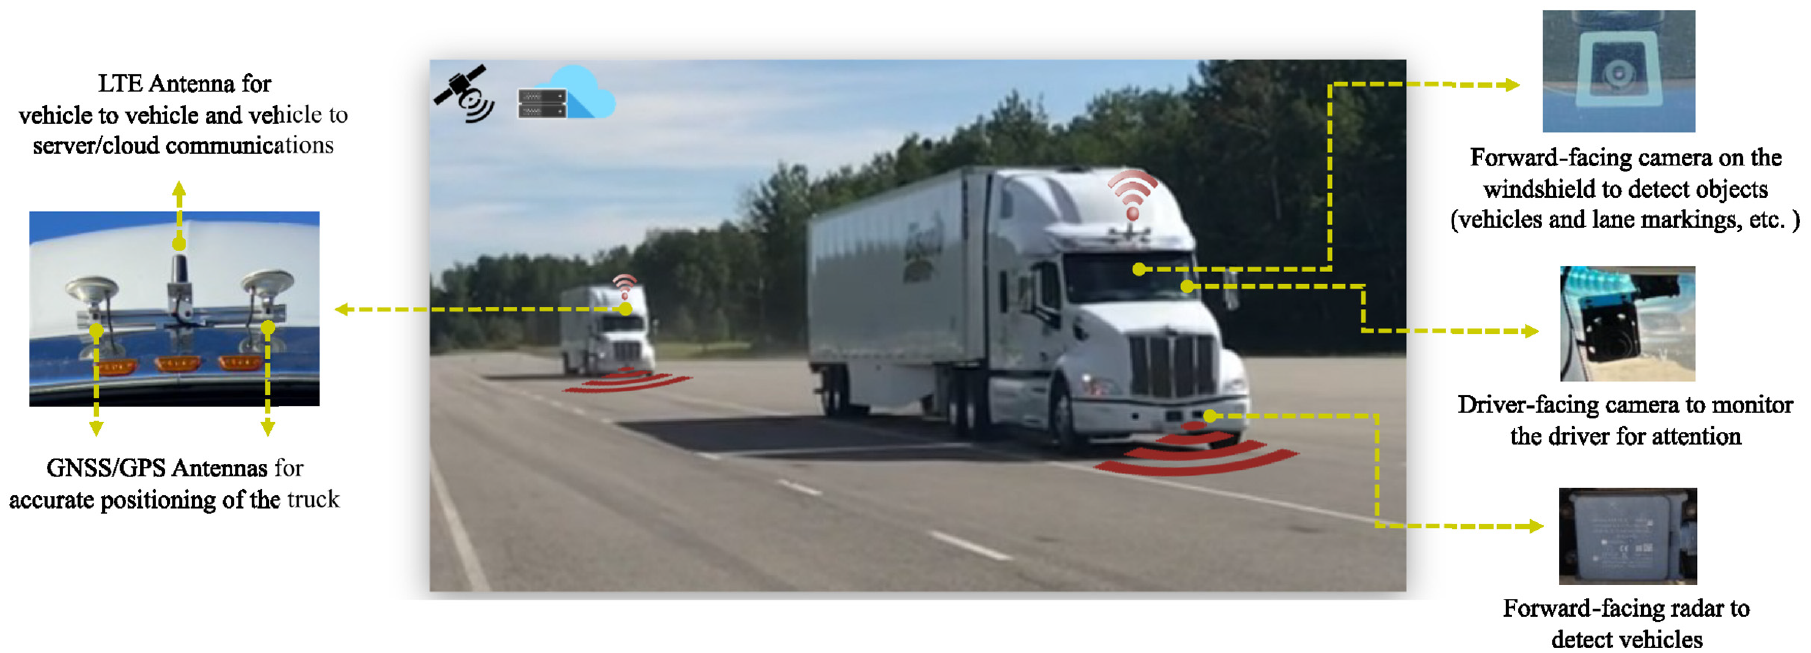
Equipment and sensors used to enable cooperative truck platooning.
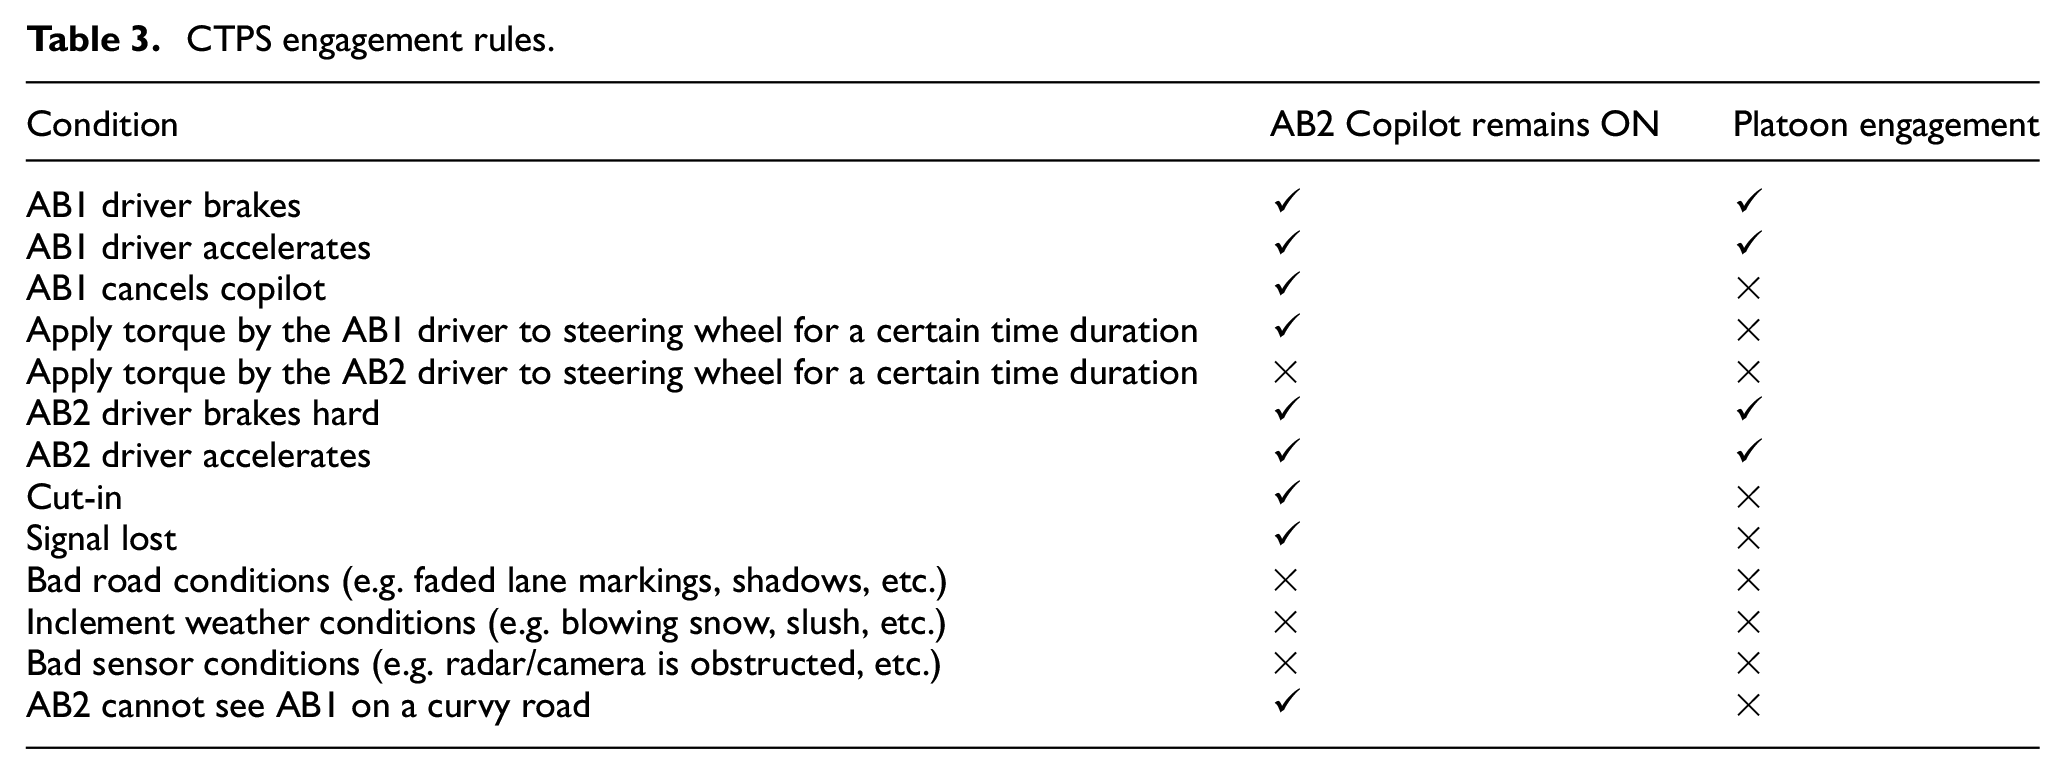
Three CTPS conditions must be met to allow the two trucks to engage into a platoon:
Both the lead truck (also referred to as AB1 in this study) and follower truck (also referred to as AB2 in this study) should be engaged in Copilot mode. The Copilot mode uses the combination of lane centering control (LCC) and adaptive cruise control (ACC), which could keep the truck centered in the lane, and adjust its speed while maintaining a safe following distance from the preceding vehicle.
Both AB1 and AB2 should be in the same lane.
No other vehicles should be between AB1 and AB2.
When the above-mentioned conditions are met, the systems will automatically enter into platoon mode. However, a variety of real-life driving conditions could affect the platooning system’s engagement status. Table 3 summarizes the conditions that would affect the Copilot and CTPS platooning engagement status.
CTPS engagement rules.
Test procedure and data collection
Instrumentation
To collect high frequency and synchronized data, a custom-designed integrated central data acquisition (ICEDAQ) system was designed and built for this study. It included safeguarding data, remote live monitoring of the system, and various data recording capabilities. A schematic of the ICEDAQ and subsystems is provided in Figure 5. The subsystems included controller area network (CAN) buses (SAE J1939 and CTPS), weather station, fuel flow meter, cameras, etc. The ICEDAQ systems were installed in both the lead and the follower trucks, and the data between the two systems were synchronized through a GPS time signal.
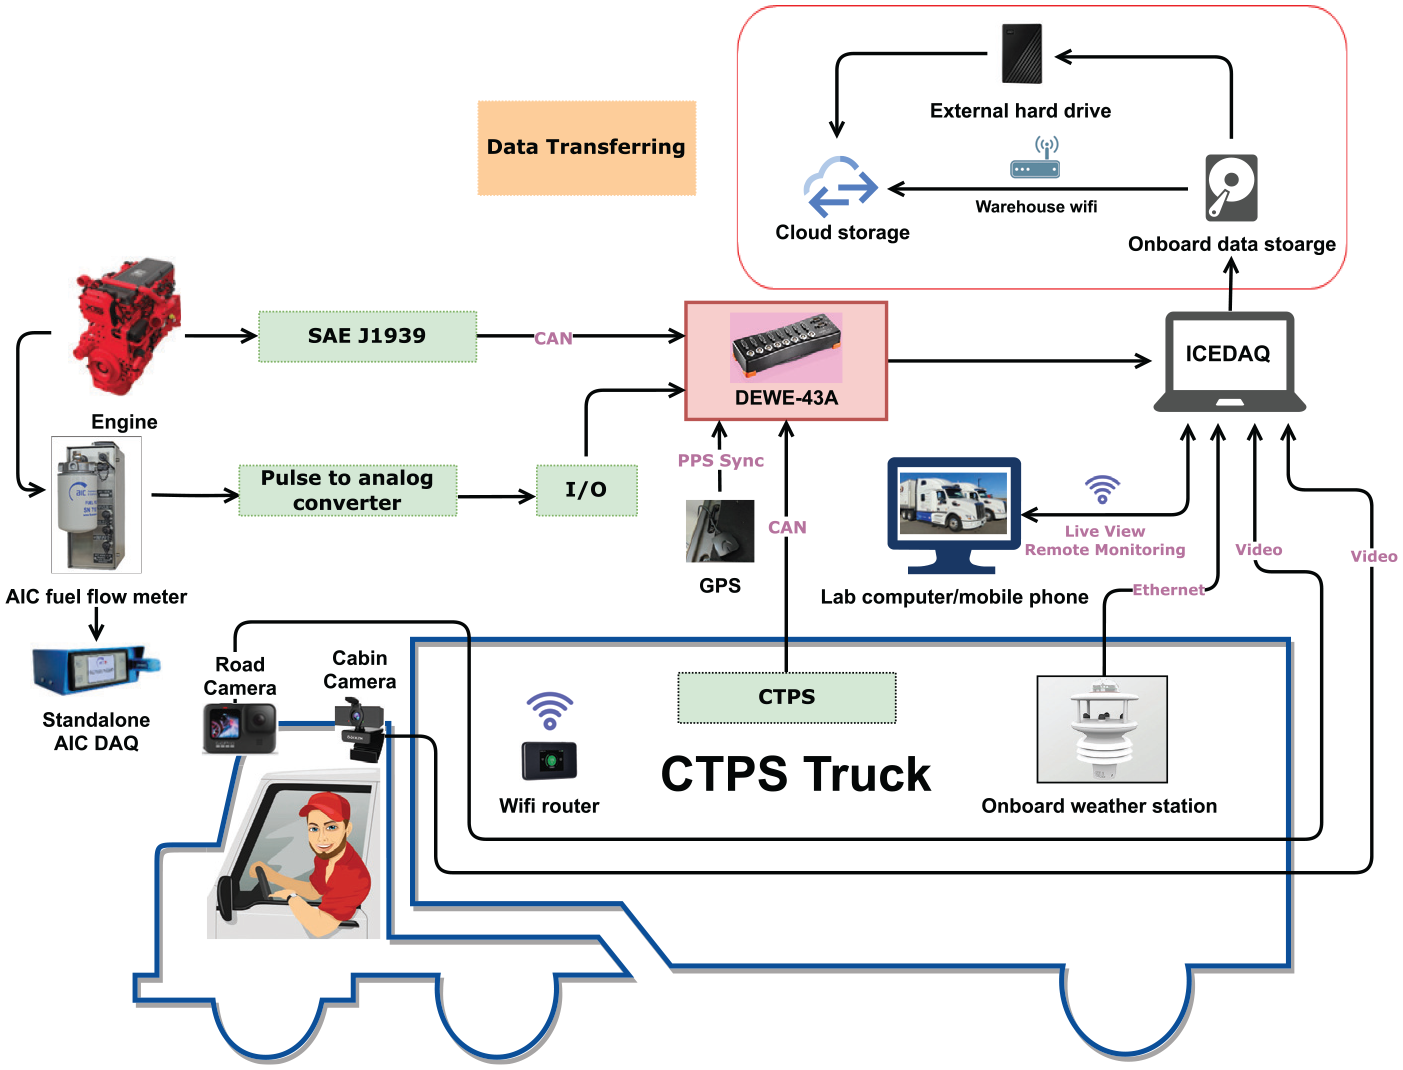
Schematic of ICEDAQ and all subsystem interfaces on the lead and the follower trucks.
Test procedure
The daily CTPS trial was divided into two trips, as shown in Figure 6. Trip 1 was from Calgary to Edmonton, and trip 2 was from Edmonton to Calgary. The trucks only got engaged in cooperative platooning between Airdrie and Leduc. The driver on the lead truck set up the platooning speed but without exceeding the maximum speed limit of the selected route on Alberta Highway 2. Then the driver on the follower truck adjusted the following distance by selecting the time gaps of 3, 4, or 5 s. To properly assess the effect of platooning on fuel saving by the follower truck, a third truck denoted as the “control truck” is typically needed according to the SAE J1321 standard. 25 However, given the platoon distance between the lead and follower trucks in this study was substantial, the lead truck would not have measurable fuel saving under platooning. 26 Therefore, the lead truck was used as the “control truck” and served as the baseline.
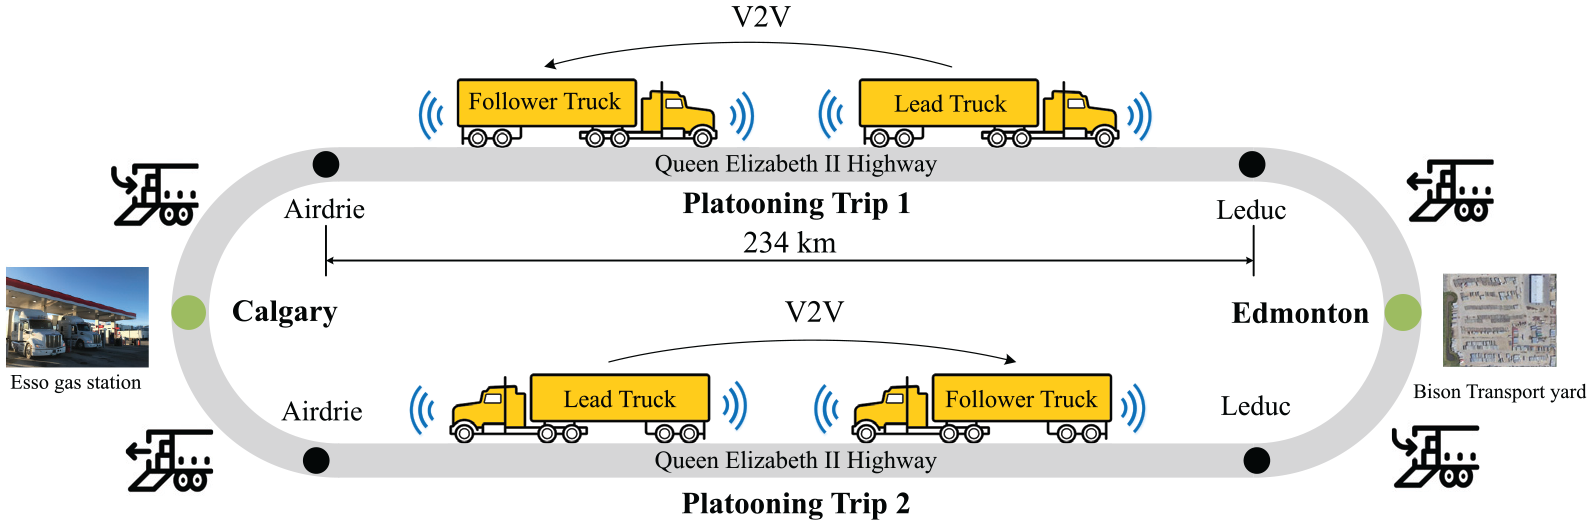
Schematic of the CTPS test procedure.
Data collecting and transferring
In this study, a number of data sources were installed in both trucks. One of the major focus areas of data sources is vehicle driving data via CAN buses. Specifically, the SAE J1939 CAN and CTPS CAN were used in both class 8 trucks to collect data, which can aid in the assessment of vehicle exhaust emissions, powertrain performance, and platooning operation details during the trial. Furthermore, the extra fuel flow meter provided accurate information on instantaneous fuel consumption, and the wind speed measurements were collected by the weather station installed on the top middle of the lead truck. On-road traffic video data was captured by the road-facing camera, and the driver’s behavior video data was gathered by the in-cabin camera. All the data was collected on the ICEDAQ laptop, which was located in the cabin of the truck. As this trial was to investigate the impact of truck platooning under commercial operation, none of the researchers were present in the trucks during any trips. In each trip, 339 parameters at up to 10 Hz sampling frequency were collected from two trucks.
Test results
A total of 41 trips between Calgary and Edmonton were performed with the participation of nine experienced drivers. Moreover, 25 of the trips were platooning tests, in which 3, 4, and 5 s were set for the time gaps between the two trucks based on the traffic regulation from Alberta Transportation. The truck weights ranged from 15,963 to 39,342 kg for all trips, while ranged from 15,963 to 38,785 kg during the platooning trips. The lead truck was heavier than the follower truck in 86% of platooning trips, and in 32% of them, both trucks had a similar weight (±5%). Furthermore, the ambient temperatures ranged from −27°C to 12°C during all the trips, while the platooning trips were conducted at ambient temperatures ranging from −24°C to 8°C. In 78% of platooning trips, the minimum temperature was below 0°C. With respect to the non-platooning trips, they were primarily conducted as baselines for comparison. In this section, therefore, we will only focus on presenting the test results related to the platooning trips.
Platoon engagement ratios under different road surface conditions
During the platooning trips, three road surface conditions of bare dry, bare wet, and shoulder ice/snow were encountered. The largest portion of the road surface conditions was bare dry, which made up 76.0% of the platooning trips. The trips with bare wet road condition accounted for 20.0%. Furthermore, due to the uncontrollability of the weather condition in the real world, only one set of data under the shoulder ice/snow road surface was collected, which might not give us the whole picture of this road condition, but it still helped us gain some insights into the difference in the platoon engagement ratio under different road conditions.
The platoon engagement ratio was calculated based on the platoon engagement time divided by the time it took in each platooning to drive between Airdrie and Leduc (platooning portion of the test route). As shown in Figure 7, under bare dry surface conditions, the platoon engagement ratio ranged from 19.0% to 88.9%, with the average ratio being 62.9%. There was a trip (Jan 26: E-C 4 s) where the driver did not feel comfortable wearing the Muse headband for a long period of time for the human factor studies. This could have affected his use of the CTPS system during the trips. Excluding this trip, the platoon engagement ratio ranged from 36.3% to 88.9%, with the average ratio being 65.3%. Under bare wet surface conditions, the platoon engagement ratio ranged from 40.7% to 80.2%, and the average ratio was 55.7%. Furthermore, under the shoulder ice/snow road condition, the platoon engagement ratio was 66.1%. Overall, the average platooning engagement ratio including all road surface conditions was 61.6%.
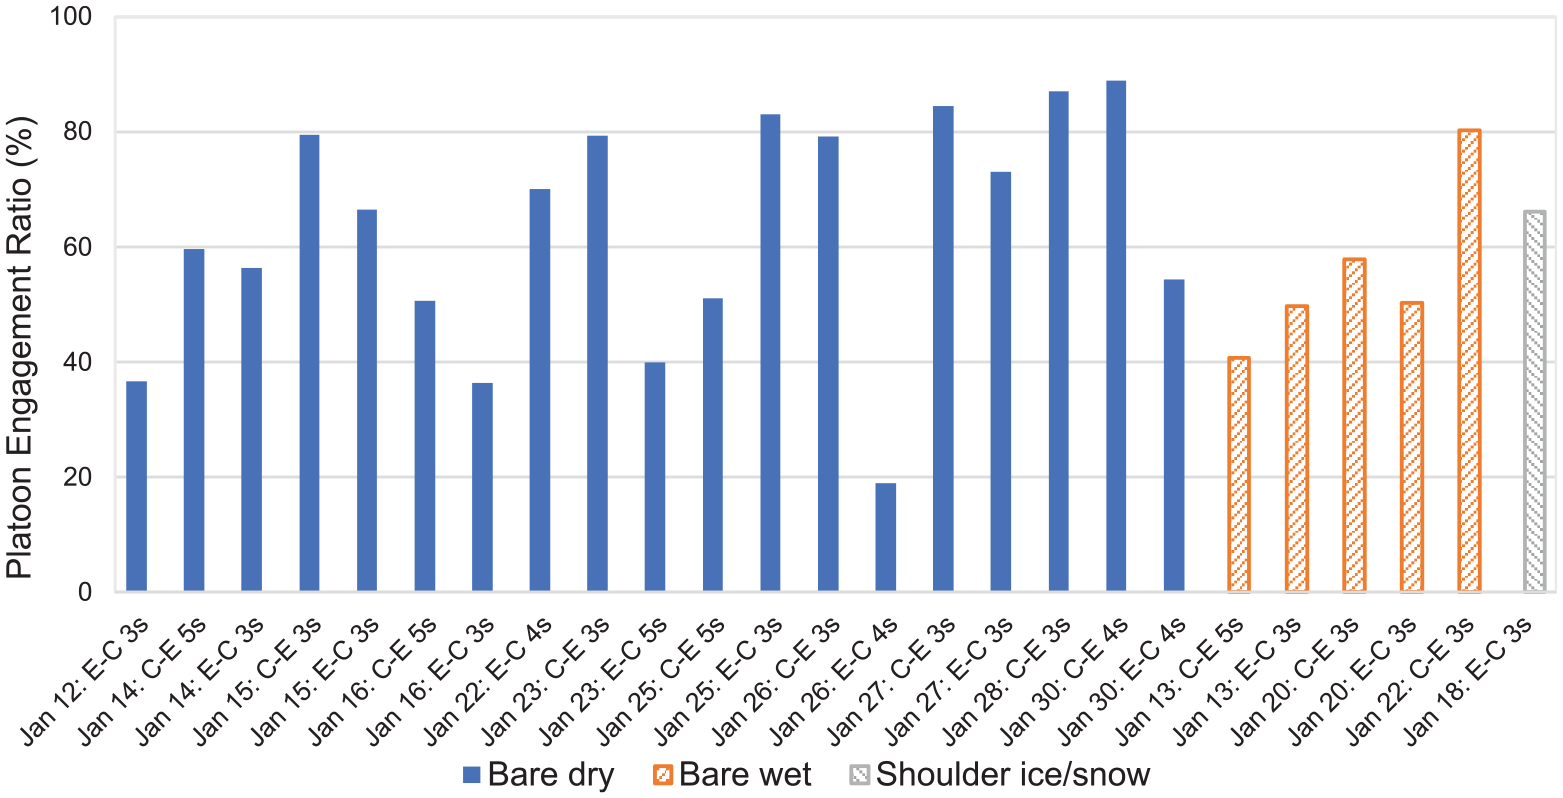
Platoon engagement ratio under unequal distribution of road surface conditions.
In the CTPS trial, a number of conditions would affect the truck platooning engagement ratio, such as cut-ins, weather conditions, road geometries, drivers’ actions, and others, which are detailed in Table 3. Different road surface conditions, including bare dry, bare wet, and shoulder ice/snow, lead to different road frictions. For instance, when the road was bare wet, the road-friction coefficient became relatively small, which could result in insufficient traction for the follower truck to keep the desired separation distance under some driving scenarios. Furthermore, the truck drivers might take actions to increase the intervehicle space to improve the platoon safety in the case of wet road surface or shoulder ice/snow. When separation distance between two trucks became larger, the cut-ins by other public vehicles occurred more frequently. These cut-ins disengaged trucks from platooning. Therefore, the varying road conditions contributed to variations in the platoon engagement ratio.
Truck speed under platooning
In the platooning portion of the test route, the driver on AB1 set up the platooning speed while observing the speed limit, and the driver on AB2 selected the desired time gap to follow it. The speed profile of both trucks, thus, determined the CTPS performance. As shown in Figure 8, the average speed of AB1 ranged from 88.8 to 95.0 km/h. The maximum speed of AB1 under platooning ranged from 100.4 to 115.8 km/h, and the minimum speed ranged from 57.2 to 84.2 km/h. The truck’s lower speed values were mostly affected by the traffic conditions on the highway. Furthermore, the average speed of AB2 under platooning ranged from 88.9 to 95.2 km/h. The maximum speed ranged from 99.5 to 114.5 km/h, and the minimum speed ranged from 62.6 to 80.8 km/h. Figure 8 also shows that the speed standard deviation of AB1 ranged from 2.1 to 4.8 km/h, with an overall average of 3.2 km/h. By contrast, the standard deviation of the follower truck ranged from 2.6 to 5.9 km/h, and the average was 3.6 km/h. Meanwhile, only in two trips (Jan 18: E-C 3 s and Jan 23: C-E 3 s), the speed standard deviation of AB2 was less than that of AB1. Overall, the lead and follower trucks traveled at similar speeds under platooning conditions, but to be more specific, AB2 generally enjoyed slightly more speed fluctuations compared to those of AB1.
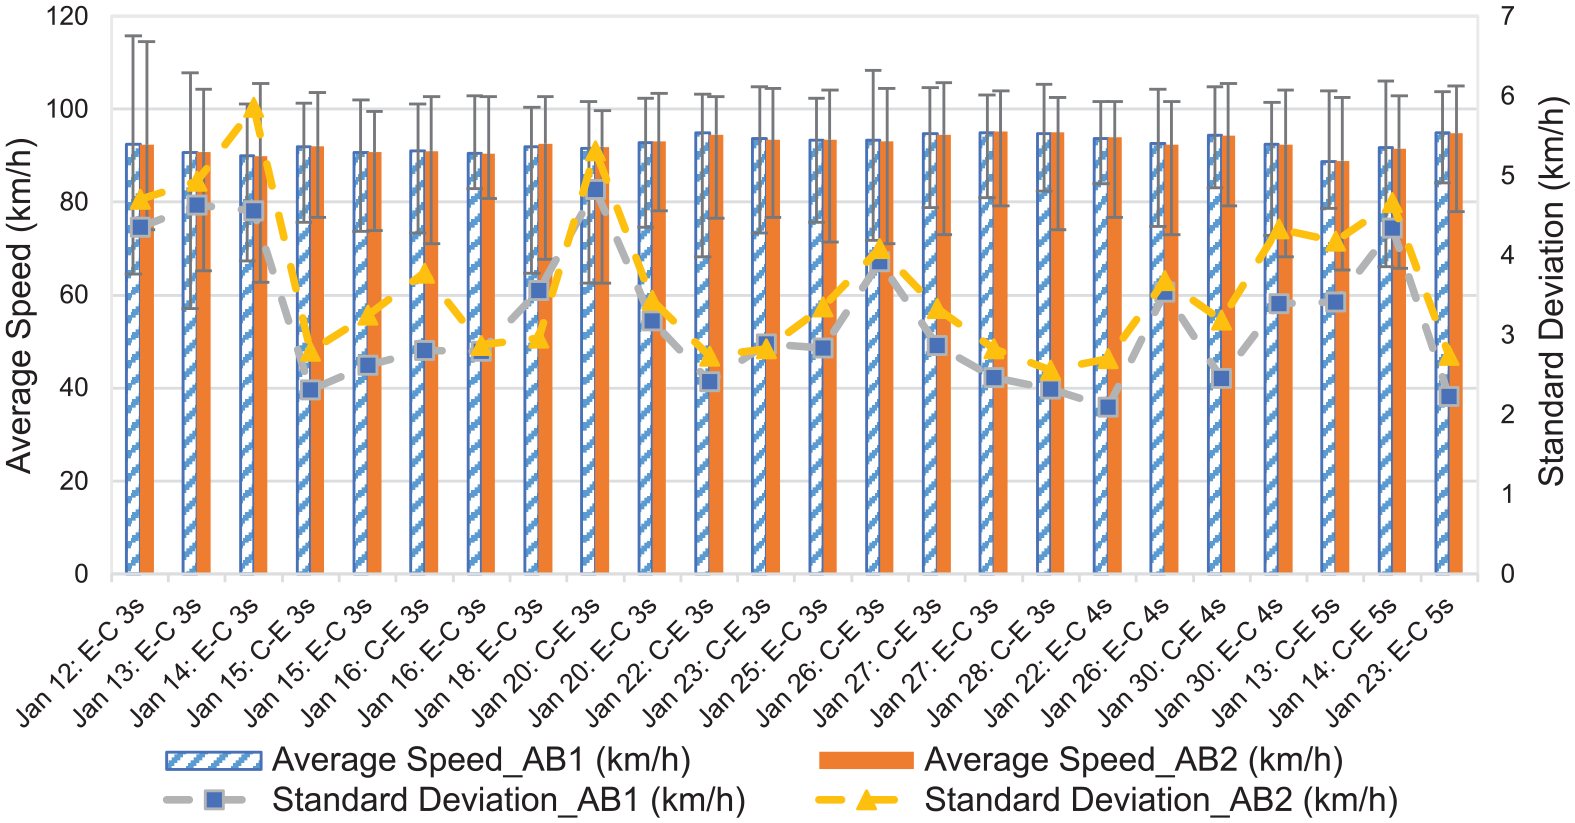
Truck speed profile under platooning.
Fuel consumption
Truck weight has a significant effect on fuel consumption, see Appendix. The trucks in each trip had different weights, so in order to properly compare the fuel consumption under platooning, the reported fuel consumption values were normalized based on truck weights – freight transportation specific fuel consumption (Freight transportation specific fuel consumption is calculated by dividing fuel consumption (kg/100 km) by gross truck weight (ton)). Figure 9 shows the freight transportation specific fuel consumption of 25 platooning trips, varying from about 0.5 to 1.3 kg/(ton·100 km). For the heavy configurations, the freight transportation specific fuel consumption got close to the value of 0.65 kg/(ton·100km). When there was a substantial weight difference between the lead and follower trucks, the freight transportation specific fuel consumption of the heavier truck was lower than that of the lighter one. Therefore, trucks with a similar weight (±5%) are important data to help understand the effect of platooning on fuel consumption. A strong trend is not observed in Figure 9, since in some of the trips (marked in dotted yellow rectangle) AB1’s freight transportation specific fuel consumption was more than AB2’s under similar weights, while in some other trips (marked in solid green rectangle) the trend was opposite. This could be caused by the different road grades. Table 4 illustrates the follower truck saved fuel with a ratio of 1.6% on the flat road during platooning, but consumed up to 12.5% more fuel when encountering hilly terrain. Furthermore, the follower truck’s fuel saving ratio decreased when the road sections became steeper. Thus, the platooning engagement status on different types of road sections led to the different trends of trucks’ overall freight transportation specific fuel consumption.
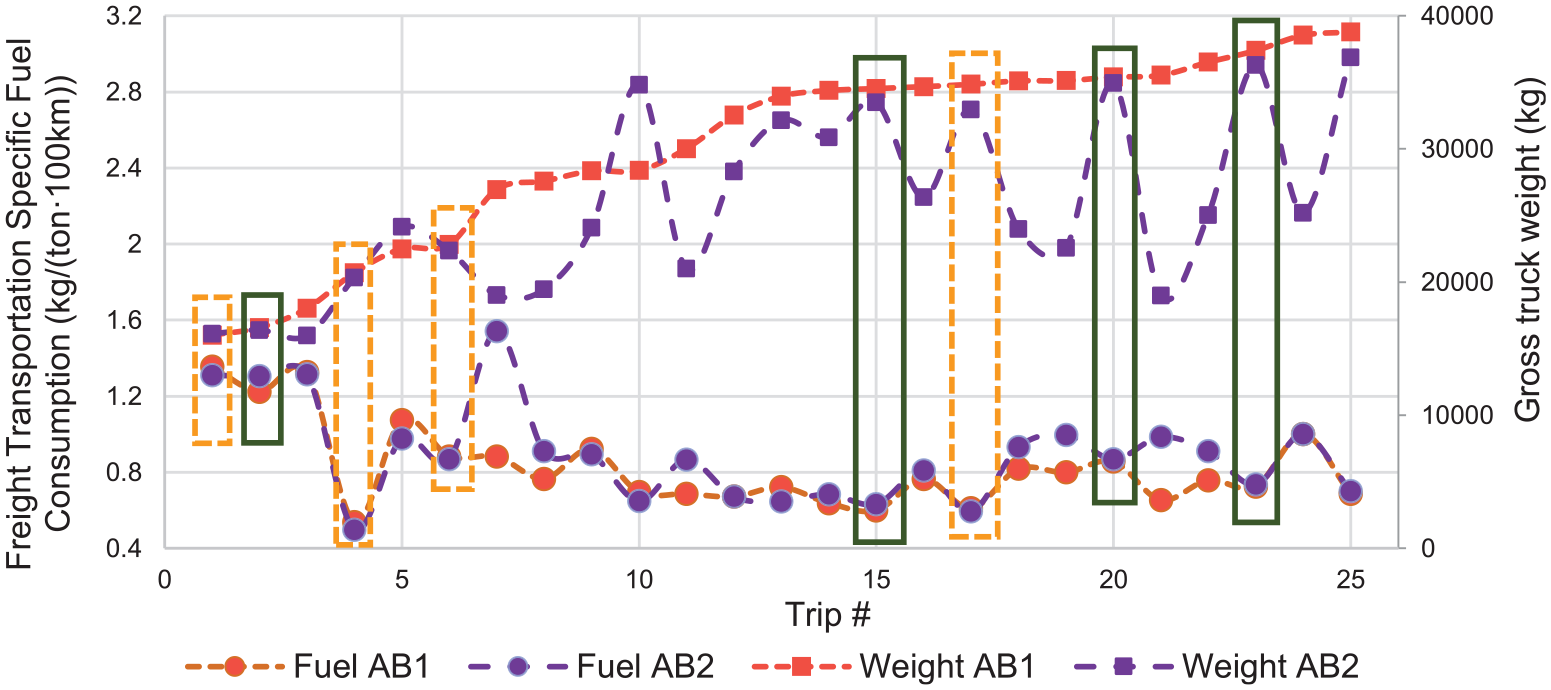
Cumulative specific fuel consumption of lead and follower trucks during platooning.
Follower truck’s fuel saving ratio under different road grades during platooning.
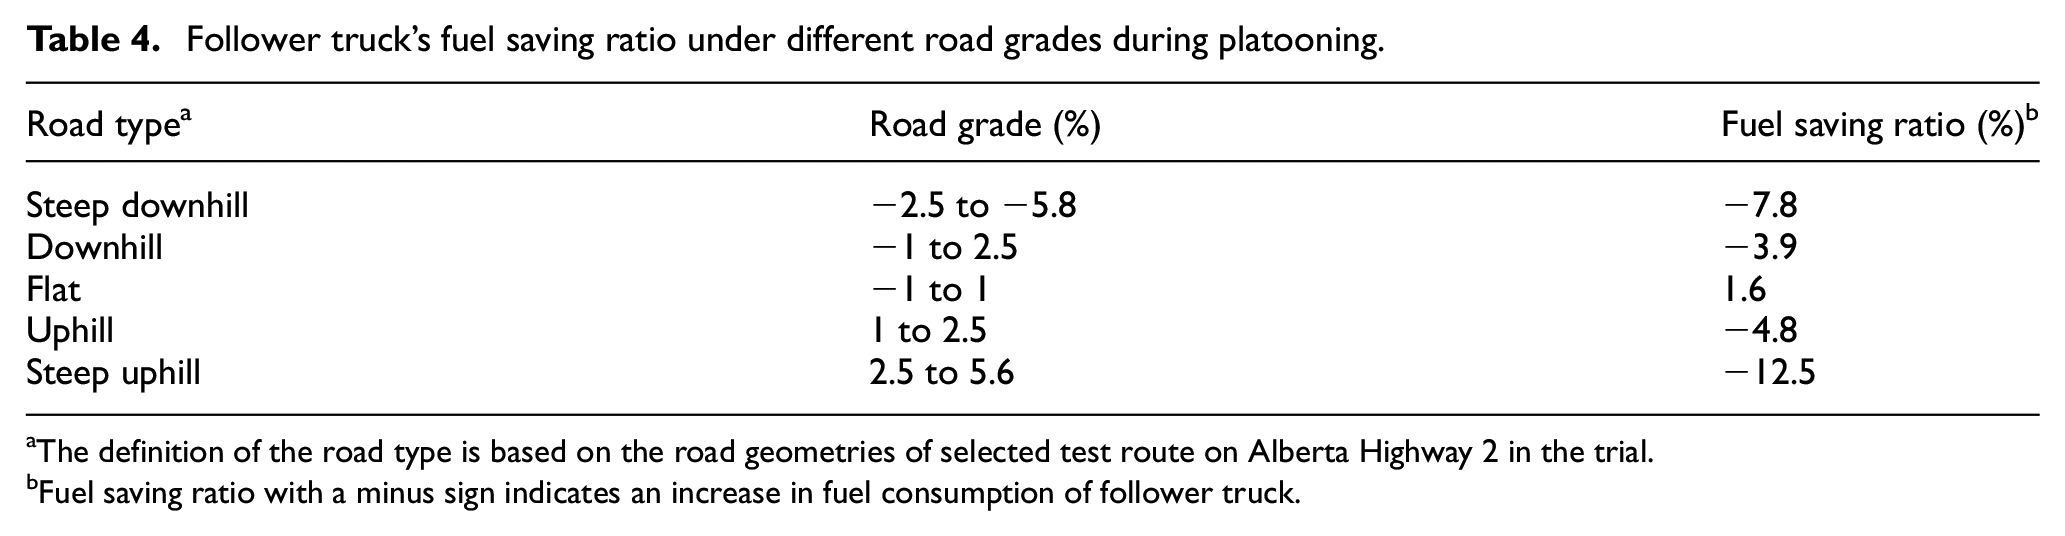
The definition of the road type is based on the road geometries of selected test route on Alberta Highway 2 in the trial.
Fuel saving ratio with a minus sign indicates an increase in fuel consumption of follower truck.
NOx emissions
The aftertreatment system of the two trucks had different conversion efficiency in this study. In fact, the aftertreatment system of AB1 had better conversion efficiency compared to that of AB2, so the comparison of tailpipe NOx between two trucks in platooning trips was complex. Thus, we only present the engine-out NOx emissions in this paper. Throughout the platooning trips, the average engine-out NOx emissions of AB1 varied from 318 to 905 g/100 km, and AB2’s ranged from 190 to 737 g/100 km. Figure 10 shows the specific NOx (engine-out) emissions during platooning trips. Trips with light truck configurations (<20 ton) exhibited high specific NOx emissions, varying from 10 to 30 g/(ton 100 km), with an average of 22 g/(ton 100 km). Meanwhile, for medium-weight trucks falling within the 20–30 ton range, specific NOx emissions spanned from 12 to 34 g/(ton 100 km), with an average of 17.1 g/(ton 100 km). In contrast, heavy truck configurations (>30 ton) demonstrated specific NOx emissions ranging from 10 to 21 g/(ton·100 km), with the average declining to 15.6 g/(ton·100 km). Thus, truck weight was the dominant factor affecting specific NOx (engine-out) emissions. This was due to the effect of truck weight on engine operating points.
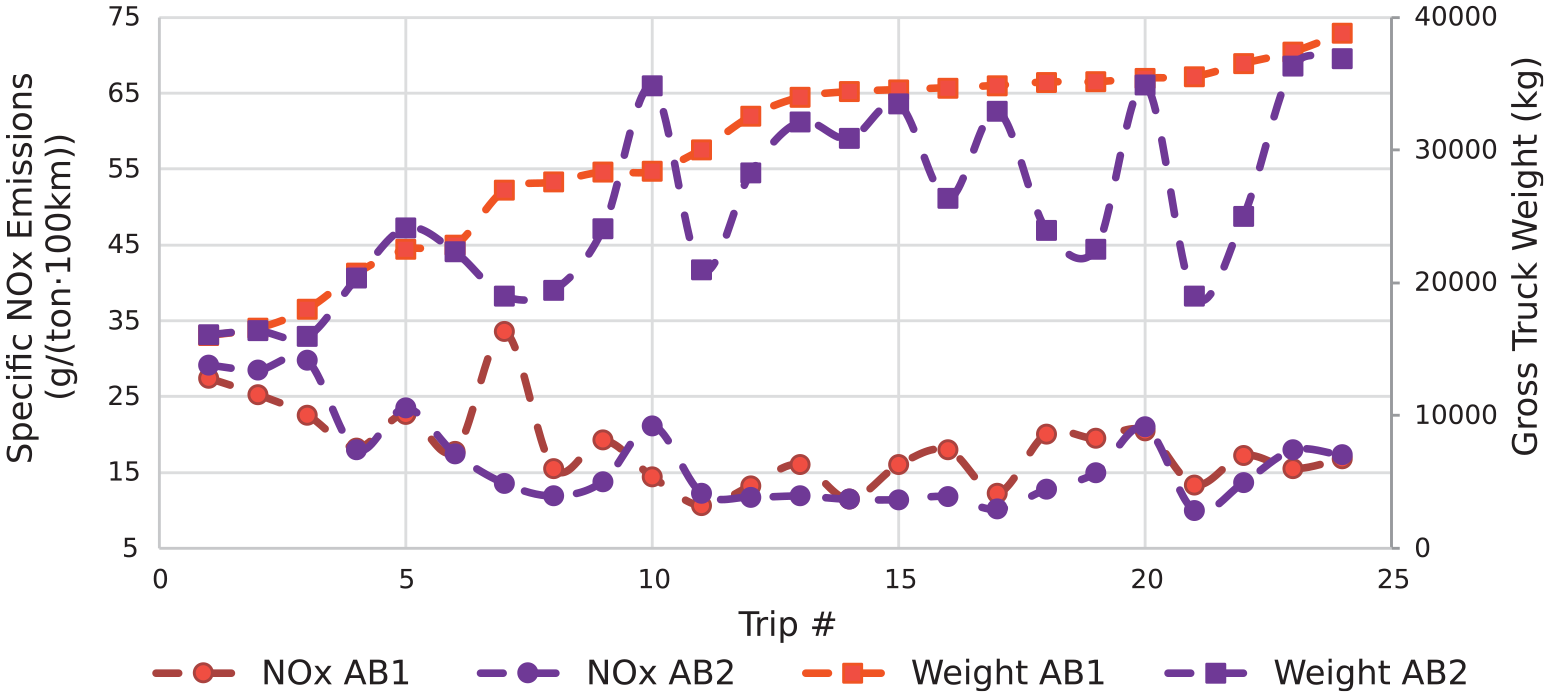
Engine-out NOx emissions during platooning.
Disengagement and re-engagement effects on powertrain instantaneous response
The continuous engagement of the platooning system is essential for optimal performance during trips. However, various real-world driving conditions, as presented in Table 3, influence the platooning system’s engagement status. Notably, the average number of CTPS disengagements observed during platooning trips was 74, significantly impacting the overall performance. In examining the system behavior through an event-based analysis, as shown in Figure 11, the platooning system experienced frequent disengagements and re-engagements. Within a brief period of 2 min and 35 s, the system underwent eight such transitions. These decisions were autonomously made by the platoon control system, not the driver, and each activation or deactivation introduced transient effects on powertrain management. Detailed power output analysis of follower trucks reveals that responses to transient inputs manifested as fluctuations in engine power. The follower truck’s engine power exhibited more pronounced instantaneous fluctuations compared to the lead truck, resulting in substantial step inputs to the powertrain control system. These power fluctuations caused by frequent disengagements and re-engagements contributed to increased fuel consumption in the follower truck.
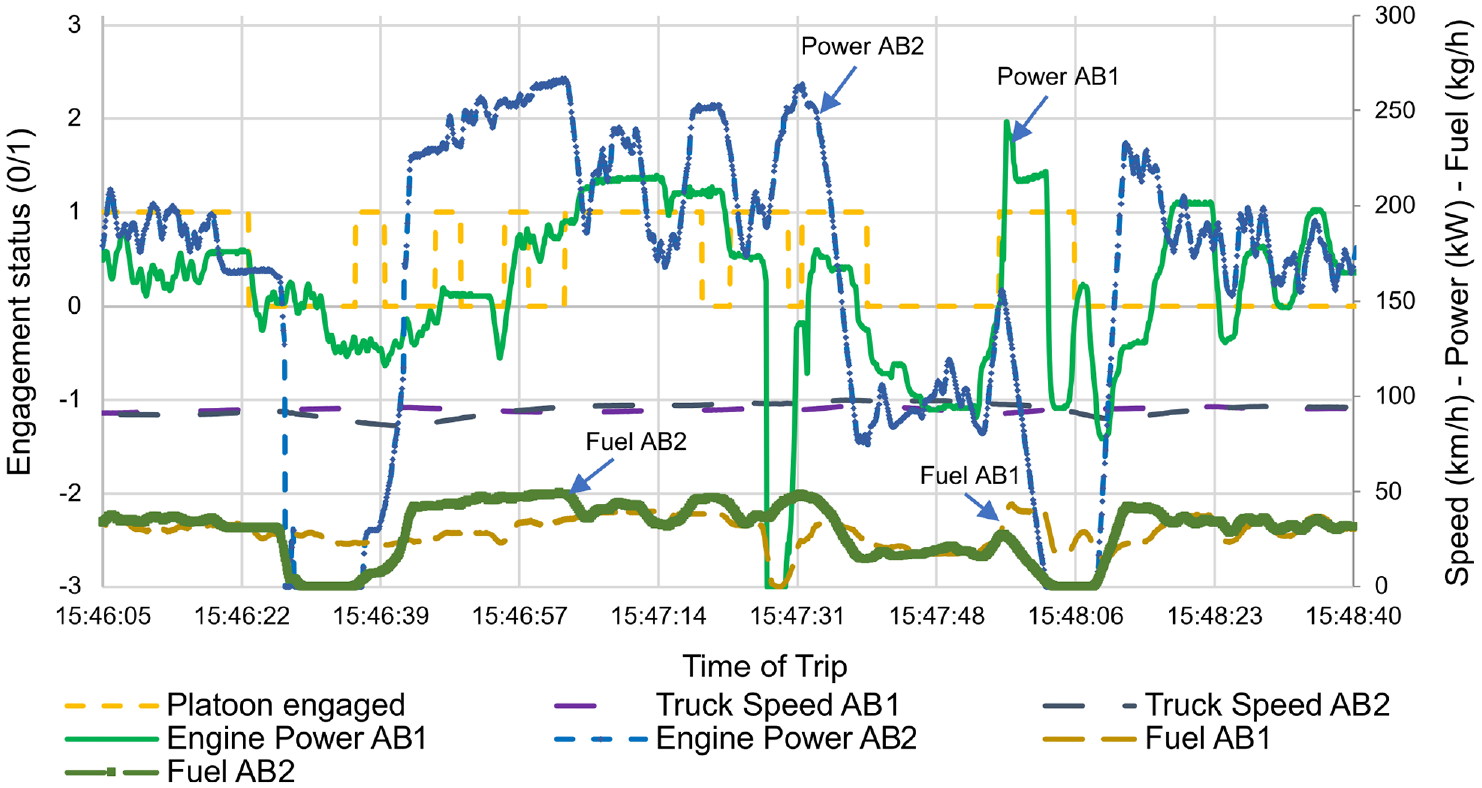
Segment-wise platooning performance signals along with the engine power oscillation.
Furthermore, the engagement status also had effects on the engine-out NOx emissions. As shown in Figure 12, the platooning system disengaged and re-engaged three times, and then remained the engaged status until the end of the section. Within the selected section of the road, 13 large oscillations in the engine power of AB2 were observed. On the other hand, the engine power of AB1 had relatively smoother variation along this section of the trip. AB2’s engine had considerable power oscillations, and the magnitude of the oscillating value for each power oscillation cycle showed a 70%–100% ratio compared to the power magnitude before the start of oscillation. This type of aggressive power output oscillation was not desired for the engine’s fatigue life, particularly with high frequency.27,28 It is visible that for each engine power oscillation, the fuel consumption also oscillated, and the fuel consumption was relatively high when power oscillation happened. This also had adverse effects on engine-out NOx emissions. NOx emissions showed the same behavior followed by engine power and fuel consumption. Thus, AB2 emitted more NOx in each power oscillation cycle.
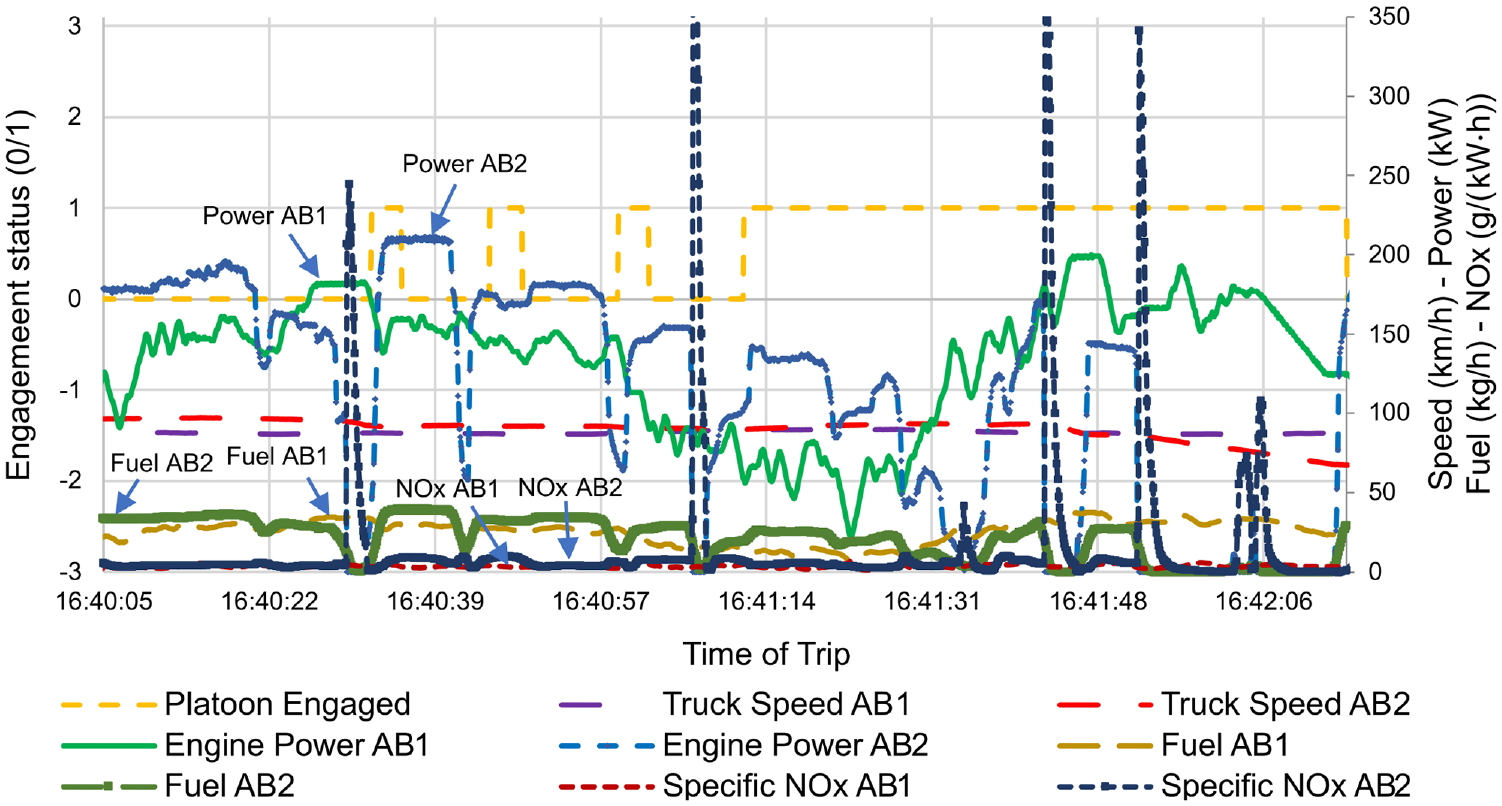
Event-based analysis of effects of engagement status on engine life.
Conclusion
In the CTPS trial, extensive vehicle instrumentation was employed to collect data from two class 8 trucks operating in winter conditions, encompassing both platooning and non-platooning scenarios. The study involved 41 incident-free trips covering 22,855 km between Calgary and Edmonton, engaging nine drivers. Of these trips, 25 involved platooning, while others served as a baseline for comparison. Key findings include:
Confirmation of the feasibility of cooperative truck platooning in Canadian winter conditions, demonstrating efficacy in ambient temperatures as low as −24°C with varied road surfaces.
Platooning engagement reached a ratio of 88.9%, with an average of 61.6% across 25 platooning trips under different road conditions.
No consistent fuel-saving trend observed throughout platooning trips due to variations in trucks’ specific fuel consumption on different road geometries. Fuel savings were noted on flat roads but increased fuel consumption on hilly terrain.
Trips with light truck configurations exhibited higher specific engine-out NOx emissions (10–34 g/(ton 100 km)) compared to heavy truck configurations (close to 10 g/(ton 100 km)).
Frequent engagement and disengagement of CTPS adversely affected fuel consumption and engine-out NOx emissions.
The CTPS trial offers valuable insights into commercial truck platooning in winter conditions. Future work is recommended to further improve the platooning performance:
Enhance coordination between platooning control systems and vehicle powertrain ECUs to improve safety and potential fuel savings.
Narrow the time gap range for platooning trucks to gain expected aerodynamic drag reduction, increase platoon engagement ratio, and enhance fuel savings.
Investigate the impact of frequent platoon engagement-disengagement-reengagement events on engine life.
Footnotes
Appendix
Acknowledgements
The authors would like to thank Transport Canada, Alberta Motor Transport Association, Alberta Transportation, Pronto AI, Bison Transport, Tantus Solutions Group Inc., and the traffic and human factor teams from the University of Alberta for their support in the CTPS trial. The authors would also like to thank Dr. Vahid Hosseini from Simon Fraser University for providing expertise at the initial stage of the project for the design of the data acquisition system for trucks.
Declaration of conflicting interests
The author(s) declared no potential conflicts of interest with respect to the research, authorship, and/or publication of this article.
Funding
The author(s) disclosed receipt of the following financial support for the research: This work was supported in part by Transport Canada (Contract No. T8009-190376/001/SL).