
Abstract
This paper focuses on investigating the effect of sand moisture content on the performance of a Mixed Service Drive (MSD) truck tire of size 315/80R22.5. The truck tire is modeled using multiple layers and materials within a Finite Element Analysis (FEA) environment. Moist sand is modeled using the Smoothed-Particle Hydrodynamics (SPH) technique. Initially, dry sand is modeled using a hydrodynamic elastic-plastic material, while water is modeled using the Murnaghan equation of state. The numerical interaction between the sand and water is identified using Darcy’s law. The moisture content of the sand is then calibrated using direct shear-strength tests and validated against physical measurements conducted in a laboratory under similar sand conditions. The tire-sand interaction is defined using a hybrid FEA-SPH interaction model, and a non-symmetric node-to-segment contact with edge treatment contact algorithm. The tire tractive performance including tractive effort, motion resistance coefficient, and tire sinkage was examined under various operating conditions, including different sand moisture content levels and tire longitudinal speeds.
Introduction
The capacity of a tire to retain grip and traction on the road surface under diverse driving circumstances is referred to as the tire’s tractive performance. It is considered a critical factor in the overall performance of the vehicle, as the tire’s ability to maintain traction affects its handling, braking, and acceleration capabilities. Some of the significant factors that affect tractive performance include the tread pattern, tread compound, tire size, tire pressure, and terrain conditions.
Recently in 2023, Shenvi et al. 1 analyzed the correlation of the tire traction performance on snow using measured parameters of ASTM F1805. The study focused on the analysis of a dataset of five winter seasons of 14-inch rim size. the findings of this study highlighted the relative importance of the compression and shear characteristics of the snow on the traction of the tire. The study also highlighted the importance of utilizing a single physical tire as the reference tire for benchmarking according to the ASTM F1805. It should be noted that the study did not consider the effect of the tire rim size on the findings and did not consider the lag in the snow temperature variation with respect to ambient temperature variation.
Earlier in 2022, Zeng et al. 2 performed an indoor experimental study to investigate tire traction performance on granular terrain. The study investigated several operating conditions including tie slip, vertical load, tread pattern, and granular medium. It was concluded that the traction force and tire sinkage were directly influenced by the tread pattern, furthermore, with the increase in slip angle a failure in the sand terrain was noticed. According to the experiments, off-road tires demonstrate superior trafficability on gravel terrain compared to sand terrain. Additionally, groove tires exhibit better traction performance under the same sand conditions when compared to smooth tires. However, the study only presented preliminary results and was lacking further quantification of traction efficiency, and maneuverability.
In the same year, Baek et al. 3 evaluated the traction performance of an electric all-wheel-drive (AWD) tractor based on the power transmission and electric systems. The traction was calculated using torque that was measured using the load measurement system. The study concluded that the proposed electric AWD tractor demonstrates improved traction performance under high-load conditions, based on the output torque of the electric motor and the traction effort was in the range of 0.60–0.80. The authors also indicated that future work to improve the motor control algorithm is needed.
In 2020, Liang et al. 4 evaluated the tire traction performance on dry surfaces using a tire-road contact stress technique. In this study, the authors deployed finite element analysis to model a detailed tire with tread pattern using Abaqus software. It was found that the results from simulation and experiments are in good agreement and that the tire model can be used to simulate tire-road interaction. The study also presented the footprint results at several applied vertical loads and slip ratios, it was concluded that the footprint contact length increases with the slip ratio increase from 0% to 8%, and remains almost constant under slip ratio from 8% to 35%. It should be noted that the study lacked the analysis of the tire-ground contact pressure distribution as well as tire traction force measurement with slip ratios.
In 2020, El-Sayegh 5 conducted a study to predict and analyze the influence of terrain moisture content on truck tire cornering stiffness. The research focused on introducing a novel terrain moisturizing technique by using dry sand as a reference terrain. To model the dry sand, the researchers employed the hydrodynamic elastic-plastic material, and the addition of moisture was simulated by modeling water layers on top of the sand using the Murnaghan equation of state. The study’s main finding indicated that further moisturizing in the soil leads to a corresponding rise in the cornering stiffness of the truck tire, given a constant inflation pressure and vertical load. This suggests that varying moisture levels in the terrain have a significant impact on the tire’s cornering performance. By exploring the relationship between terrain moisture and tire cornering stiffness, the research provides valuable insights into how different environmental conditions can affect the handling and performance of truck tires, ultimately contributing to advancements in tire design and optimization for various terrains. However, the study only focused on the cornering characteristics and did not include any tractive performance analysis.
In 2019, He et al. 6 performed a series of tire-soil drawbar pull experimental tests. The study outlined their experimental methodology and the specific operating conditions involved. The results indicated that the rut depth increased with higher slip ratios, while the tire drawbar pull coefficient initially rose with slip ratio until reaching an optimal point associated with the maximum drawbar pull coefficient. Afterward, He took the data obtained from these experiments and incorporated it into a tire model, which was then used for parameterization. However, the study covered experimental testing for one soil only and did not consider the effect of moisture content on the tire-soil drawbar pull.
In 2015, Ekinci et al. 7 investigated the impact of radial tires on tractive performance. The study considered three different tire lug heights, axle loads, and inflation pressures. Through a series of experiments and investigations, the researchers sought to gain insights into how radial tires perform in challenging terrains and diverse driving scenarios. Various off-road vehicles equipped with radial tires were tested extensively under different conditions to evaluate their tractive performance. The researchers collected data on factors such as tire lug heights, axle loads, and inflation pressures to analyze their influence on the tires’ traction capabilities. By utilizing the gathered data, the researchers developed mathematical models to predict and simulate the tractive performance of radial tires in a variety of off-road situations. Among the models used, the Artificial Neural Network model trained using the Levenberg–Marquardt algorithm demonstrated higher accuracy in producing results. The study’s findings contribute to a better understanding of how radial tires perform in challenging off-road environments and underscore the significance of utilizing Artificial Neural Networks to enhance the accuracy of tractive performance predictions.
In 2012, Çarman and Taner 8 investigated the relationship between tractive performance and travel reduction using an artificial neural network. The study proposed a novel approach to predict how well a tire will maintain grip and traction on the road surface under various driving conditions. The study also employed an artificial neural network to model the complex relationship between tire-related factors such as tread pattern and compound and tractive performance. The study concluded that the developed model could serve as a valuable reference for future tractive performance investigations. Additionally, the authors suggested that enhancing the system with fuzzy logic could further refine its capabilities. However, the research lacked specific information regarding the acquisition of experimental data and adherence to specific standards.
In 2010, Lyasko 9 determined the impact of the soil conditions on the tractive performance of the tire. The study developed methods to assess how variations in soil properties, such as moisture content, compaction, and texture, affect a tire’s ability to maintain grip and traction on different terrains. The findings of this study contributed to improving off-road vehicle capabilities and safety, enabling better decision-making for tire selection and vehicle operation in diverse environments. However, the study is based on several assumptions such that all models work with an assumption that all grousers are fully penetrated into the soil. The study also utilized non-invariant parameters as constant values in calculations of different (dimensions, type, loads, etc.) vehicles without experimental verification which resulted in a large uncontrolled error.
This research introduces a novel and innovative approach to measuring the impact of sand moisture content on the performance of an MSD truck tire, specifically the size 315/80R22.5. Based on the literature review provided there exists a gap in quantifying the effect of moisture content on tire tractive performance, especially using computational techniques which is highly desirable. The truck tire is meticulously modeled in the FEA environment, while the moist sand is modeled using the SPH technique. The interaction between sand and water is numerically determined using Darcy’s law. To ensure accuracy, the moisture content of the sand is modeled based on direct shear-strength tests and then calibrated against experimental measurements mirroring similar sand conditions and bulk density. This research investigates the influence of sand moisture content on tire tractive performance under various operating conditions, including different levels of sand moisture content and varying tire speeds. By combining these advanced modeling techniques and experimental data, the study provides valuable insights into how sand moisture affects the tractive performance of truck tires in real-world conditions.
Truck tire modeling and validation
The truck tire modeling technique using Finite Element Analysis, along with the validation tests including radial stiffness, footprint, and drum-cleat are described in this section.
Truck tire modeling
The MSD truck tire size 315/80R22.5 is modeled using the FEA technique in a visual environment that offers a comprehensive modeling tool, namely Pam-Crash. The MSD truck tire consists of 16 different layers including the tread, under tread, shoulder, beads, carcass, and rim. Figure 1 illustrates a schematic of the modeled tire in several views. The MSD truck tire has an outer diameter of 10.72 cm, a width of 31.5 cm, and a sidewall height of 18.8 cm.
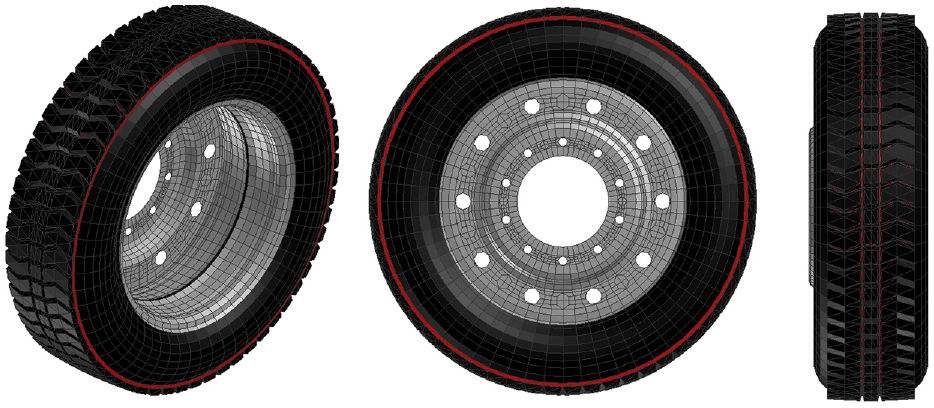
Schematic of the MSD truck tire in Pam-Crash.
The tire sidewall along with the carcass and the plies are designed using member elements and layered membrane material based on published research. 10 The tread, tread base, shoulders, and bead fillers are designed using solid elements and Mooney-Rivlin material.
The tire tread and under-tread play a significant factor in the tractive performance and thus it is highly important to simulate the proper materials. Table 1 describes the material properties of the tire rubber compounds provided by measurements.
Mooney-Rivlin input characteristics of the solid elements
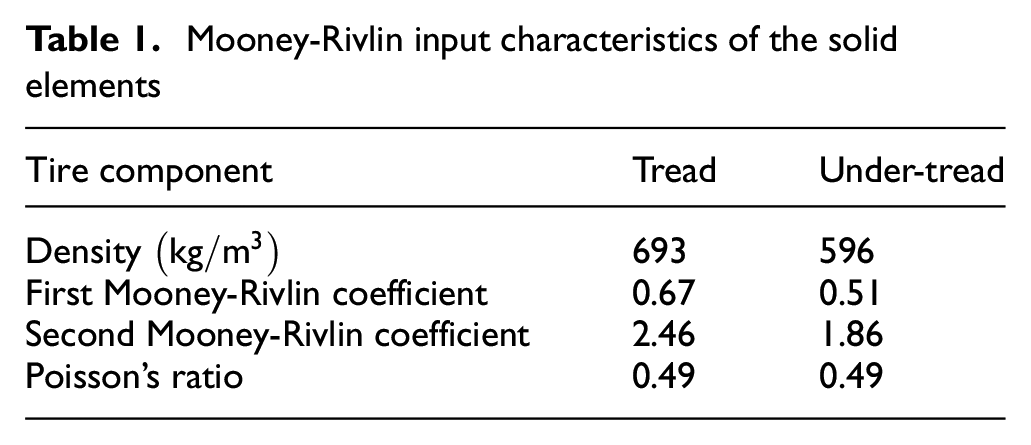
Additionally, the beads are designed using elastic-plastic beam elements which correspond to a doubly symmetric arbitrary section bi-linear elastic-plastic beam material. 10 The null material for shells is used to model the tire rim since it is a convenient and economical tool for modeling contact surfaces when internal forces and deformations of these surfaces are not of interest. This research only focuses on the tire-terrain interaction and not the tire-rim interaction, in the case tire-rim research is of interest it is advised to change the material definition of the rim.
Overall, the tire consists of 8300 elements and one rigid body definition. The tire-rim connection is developed using a rigid body definition that enables the addition of an element of infinite stiffness defined on a number of nodes. In this case, the links with the rest of the model are fixed, that is, moments are transmitted. The motion of the rigid body is completely defined by the translations and rotations of its center of gravity, which in this research is referred to as the rim center. The movement of the rigid body is fully determined by the movement of the “rim center” located at the rigid body’s center of gravity.
Truck tire validation
For the truck tire to be validated several tests were performed in static and dynamics domains. The first test is the radial stiffness test which is performed in the static domain to calculate the radial stiffness of a tire. During the radial stiffness test, the tire’s center is only allowed to move in the translational vertical direction. The vertical load is gradually deployed to the tire’s center and the tire’s vertical displacement in response to the loading was computed and utilized to compute the radial stiffness of the tire as illustrated in equation (1).
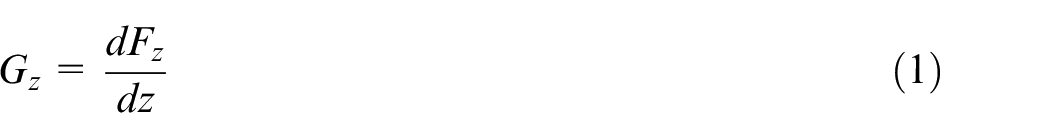
Where
The stationary footprint test is also adopted to compute the impact area bounded by the tire over a hard rigid surface. During the test, pressure is applied to the tire sidewall to generate the desired tire air pressure, the tire is then subject to a constant vertical load and allowed to stabilize on the surface. Later, when the tire reaches a steady state and the simulation ends, the contact area is computed from the contact characteristics. The contact area is determined and validated using data provided by the manufacturer at a tire air pressure of
The drum-cleat test is performed in the dynamic domain to compute the critical vertical model of the vibration of the tire. During the test, the tire is only permitted to translate about the vertical axis and rotate about the lateral axis. The tire is loaded onto a
The results of the radial stiffness test for both simulation and measured are shown in Figure 2. It is noticed that both measured and simulated results show an increase in the vertical displacement as the vertical load increases. Furthermore, the measured and simulated results are in good agreement and fall within the same range.
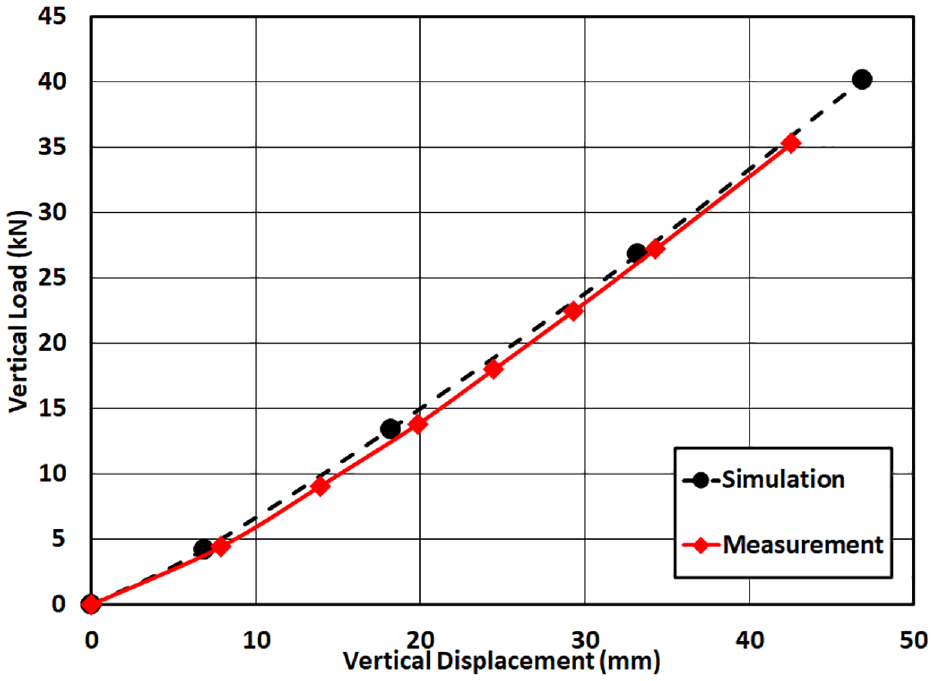
Vertical load as a function of vertical displacement for measured and simulation tire at
The simulation results of the radial stiffness,
Radial stiffness and first mode of vibration for the truck tire at 40kN vertical load and several inflation pressures
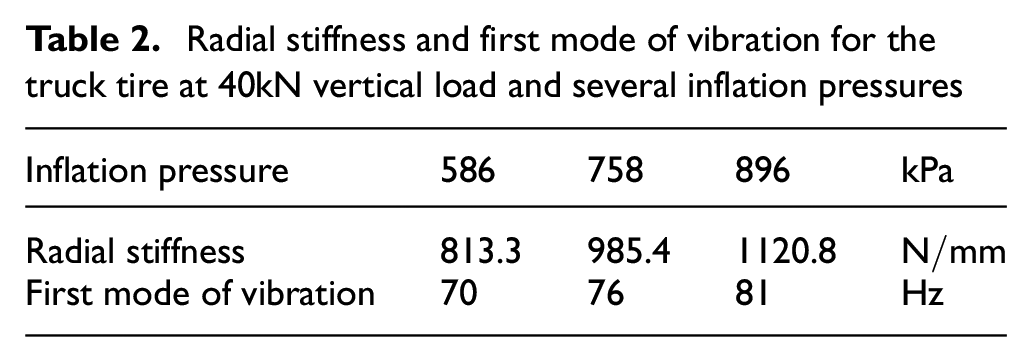
It should be noted that the truck tire was tested at the tire load index corresponding to
Moist sand modeling and calibration
In this section, the approach utilized to model moist sand is presented and discussed. In addition, the experimental tests performed to calibrate the moist sand are described.
Moist sand modeling
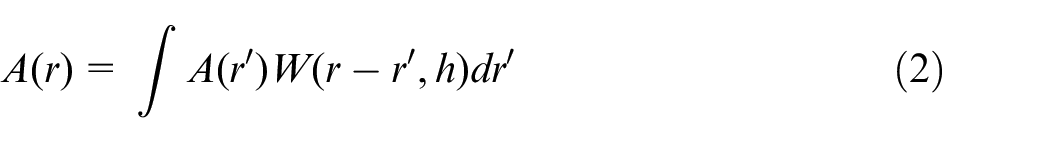
The smoothed-particle hydrodynamics method is endowed with interpolation, allowing the representation of any function based on its values at a set of non-uniform points. The concept of SPH was first introduced by Gingold and Monaghan
13
to simulate fluid dynamic behavior. The kernel estimate is an integral interpolant is a function

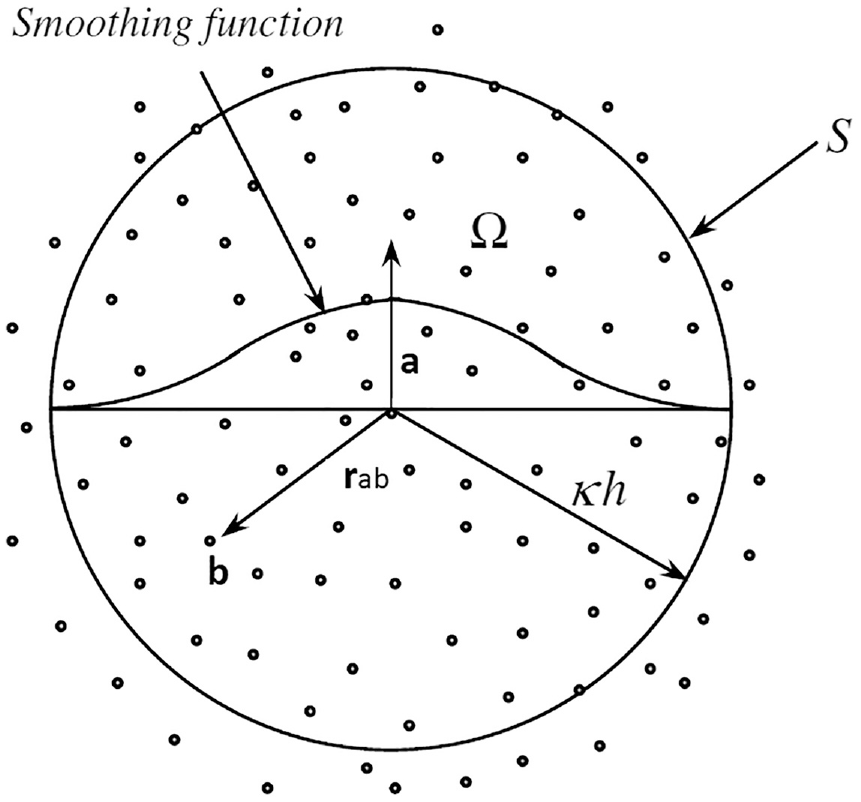
Smoothing function definition for a particle a with a domain influence. 16
The method deployed in this study makes use of the cubic spline interpolation function developed by Monaghan and Lattanzi.
17
Equation (6) illustrated the smoothing cubic spline function for several
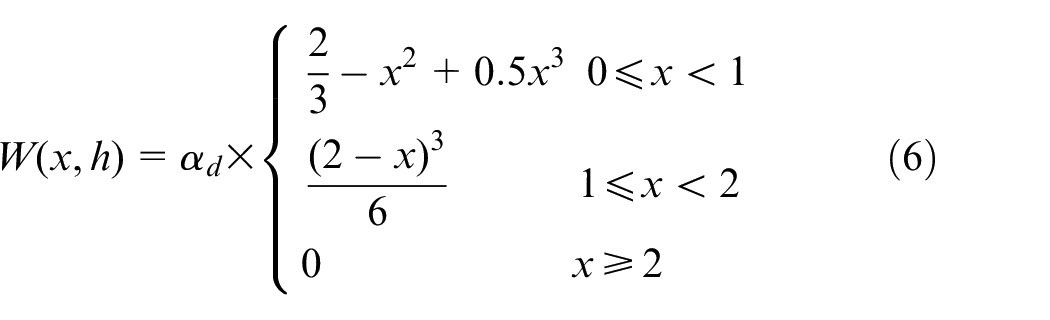
In this case,
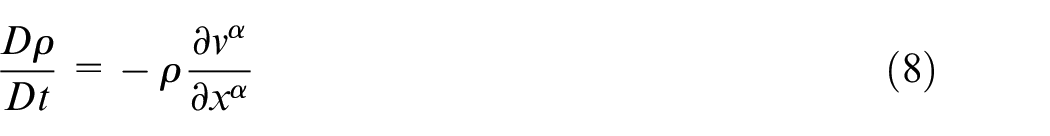
Water modeling
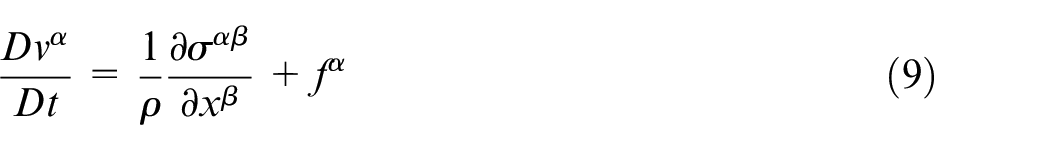
The Navier-Stokes relationships serve as the fundamental partial differential equations that describe the motion of viscous fluid and are commonly used to model water flow. The conservation of mass and momentum, as described in the Lagrangian approach, are represented by equations (8) and (9), respectively.
18
In these equations,
Equation (10) describes the stress tensor

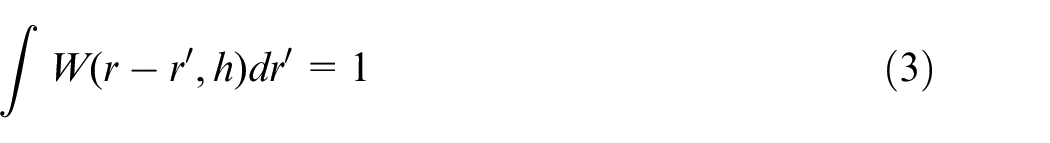
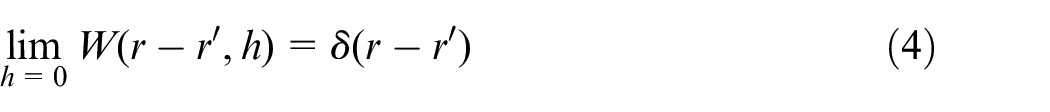
In addition to the above-mentioned relationships, the pressure-volume behavior of the water is illustrated in equation (11). The manner in which the water behaves in this scenario is similar to how a liquid with artificially enhanced compressibility would behave in a certain class of hydrodynamic simulations, where the flow velocities are kept much below the speed of sound and compressibility effects are only marginally significant. 15
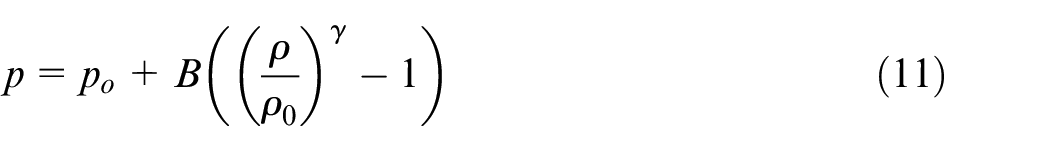
Equation (11) illustrates the influence of the density ratios on the pressure. In this case,
Sand modeling
Sand behaves equivalently to water in a numerical model, and the density and velocity of sand particles are estimated using the mass and moment conservation equations. The stress tensor, however, is what sets the sand and water models apart from one another. In the case of sand, the behavior corresponds to an isotropic elastic-plastic hydrodynamic solid material. Its pressure-volume relationship is governed by an equation of state and it behaves as an elastic-plastic material at low pressure. The stress tensor for the modeled sand is illustrated in equation (12), and comprises two components: the deviatoric shear stress, denoted as

Equation (13) illustrates the hydrodynamic behavior of the sand, while the elastic behavior is described by the shear modulus. In this case,
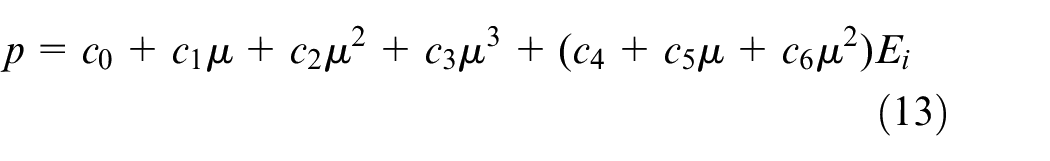
The solution to the equation (13) is soil-specific and necessitates a calibration process to determine the correct material behavior. In the case of dry sand, the coefficients
Shear stress elements must generally be kept to a minimum to avoid surface failure, which happens when the plastic flow starts. To identify the plastic flow region, the Mohr-Coulomb criterion is applied, as presented in equation (14). Here,

Notably, the values of
Sand-water interaction
The conservation equations developed previously apply to a single flow phase. However, to evaluate the interaction between sand and water (two phases), the concept of seepage force is deployed. The seepage force similar to the gravitational force acts on each particle individually. Those forces are usually incorporated as external forces and are added to the sand and water momentum relationships. Equation (15) is derived from Darcy’s law,
24
and represents this concept. In the equation,

In this case, the dry sand permeability value of 5 cm/h is adopted from existing literature for dry sand. 25 This formulation allows for the accurate modeling of the interaction between sand and water phases in the simulation.
Moist sand calibration
The categorization was based on the Unified Soil Categorization System (USCS), and the sand calibration was carried out experimentally using a poorly graded and non-plastic sand sample (USCS).
26
The maximum measured sand dry density,
In the simulated sand model, the recorded
The experimental shear strength testing was conducted at Carleton University, Ottawa, Canada, in accordance with ASTM D3080/D3080M-11. Figure 4 illustrates the equipment used for the shear test on moist sand at various moisture content levels. The equipment comprises two boxes and a pressure plate, along with two sensors to measure the lateral and vertical displacement of the soil.
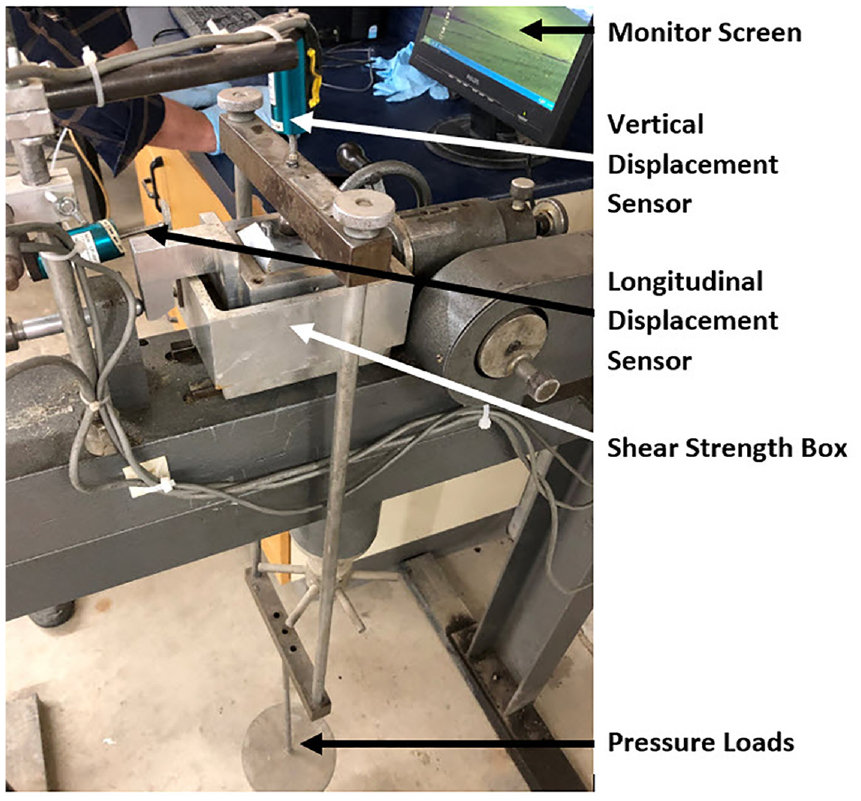
Equipment used during shear-strength testing.
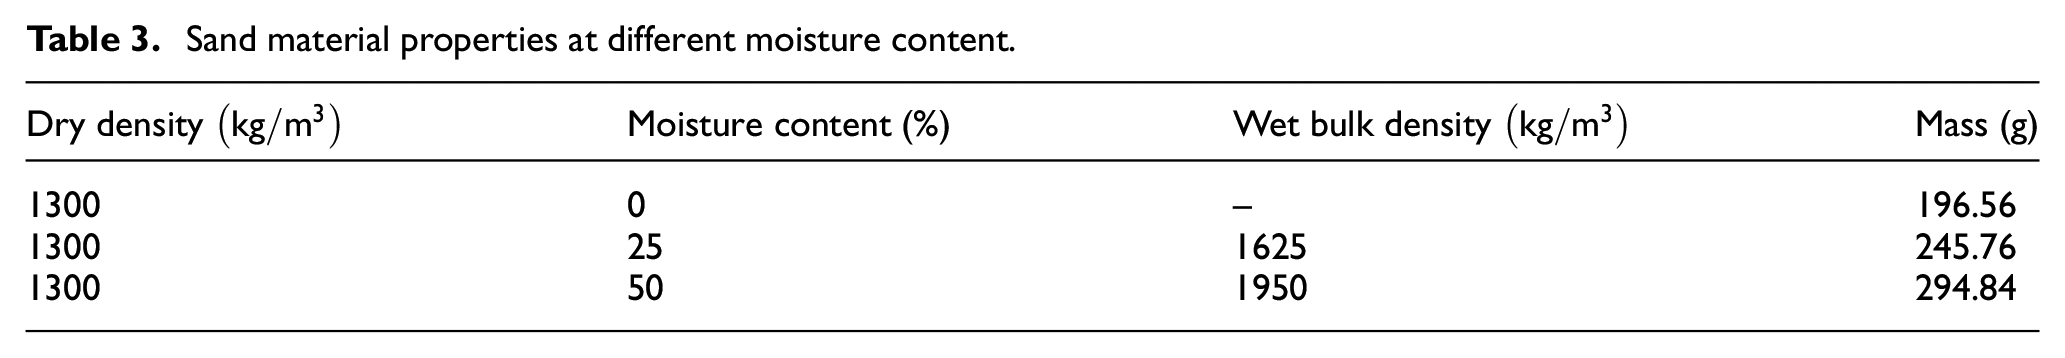
At least nine samples were needed in order to acquire adequate soil properties at three distinct moisture contents (0%, 25%, and 50%). In order to generate one soil internal friction angle and one sand cohesiveness at a certain moisture content, each test was conducted three times at various applied pressures.
Table 3 shows the sand properties for each acquired sample and the mass of the shear box measured before the test. Equation (16) illustrates the calculated bulk density which was kept constant during the experimental testing.
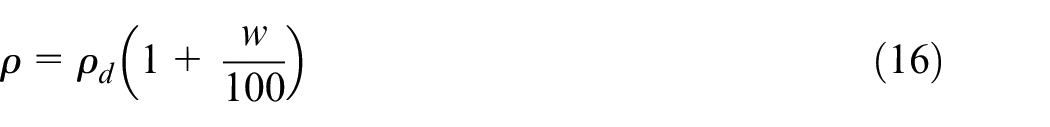
Where
Sand material properties at different moisture content.
The direct shear test procedure in both experimental and simulation setups is identical. A vertical load was applied to the top of the shear box resulting in particles being compacted and pressurized. Then a constant linear horizontal speed of 0.01
The fluctuation of shear stress with respect to shear strain at three different pressures for sand with a 50% moisture content is shown in Figure 5. It is clear from the graph that the shear stress grows as the shear strain climbs between 0% and 2%. The shear strain then rises until it reaches 10%, at which point the shear stress levels out. It is also interesting that the maximum shear strength occurs at the highest pressure. The maximum shear strength for 50% damp sand at a pressure of 100 kPa is precisely measured to be around 70 kPa.
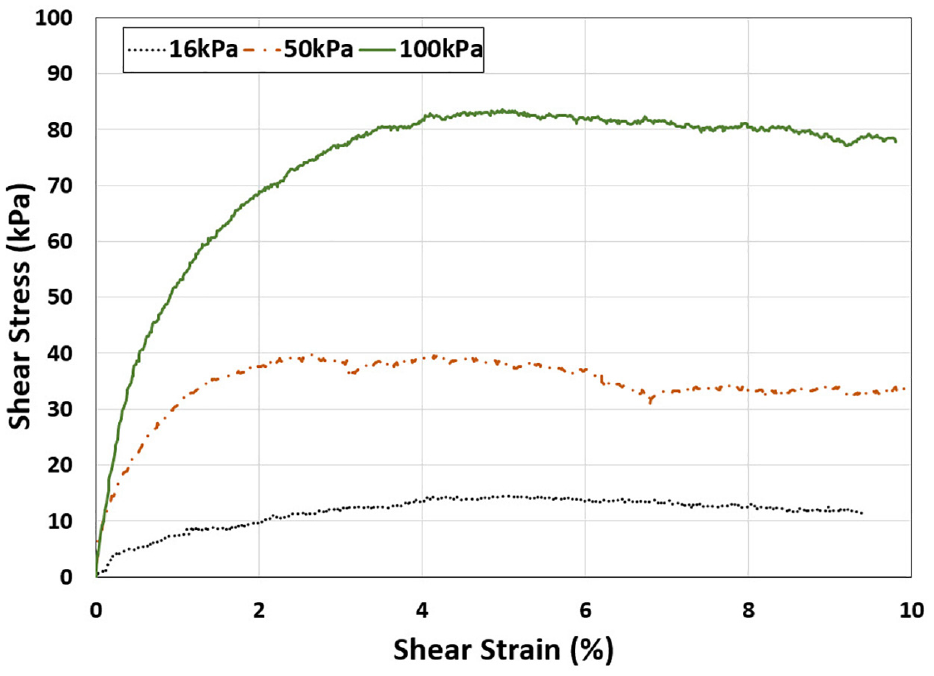
Shear stress sample for sand with a 50% moisture content as a function of shear strain.
Figure 6 depicts the shear-strength results for the dry sand, including both simulations and measurements. The solid trendlines in the figure represent the optimal square fitness for both the experimental measurements and simulations. To calibrate the SPH sand, the direct shear strength test’s experimental data was used. From this calibration, the sand’s internal friction angle and cohesiveness were computed by fitting the shear-strength lines.
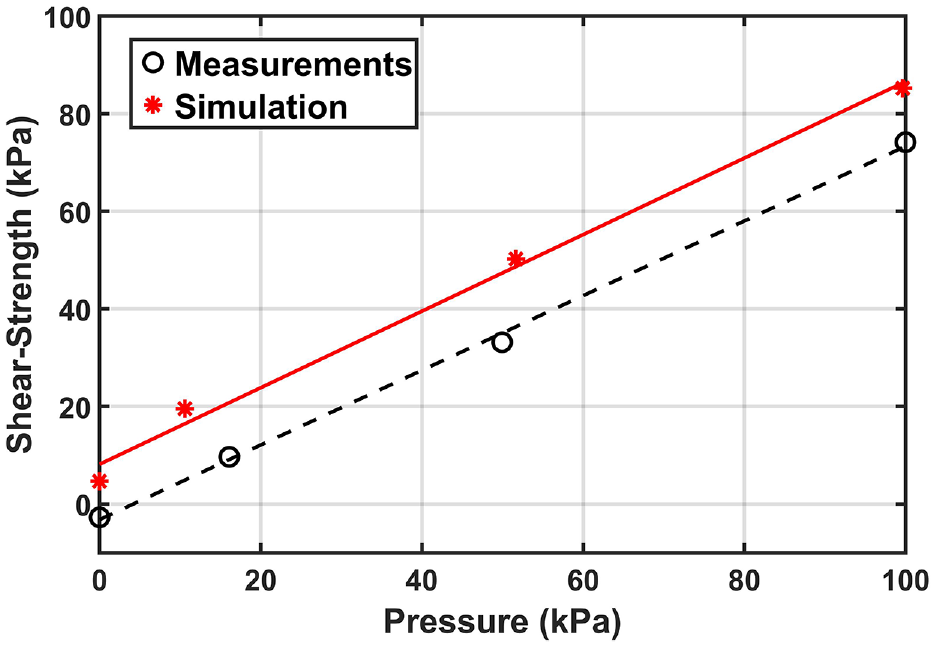
Dry sand direct shear strength results for simulation and measurements.
The sand’s internal friction angle was determined using the slope of the trendline, while the cohesiveness was calculated as the intercept on the shear axis of the Mohr-Coulomb shear resistance line. It is essential to mention that the tested sand falls under the classification of poorly-graded, non-plastic sand, and it is also defined as non-cohesive based on the Unified Soil Classification System. 26
The observed cohesiveness for sand with a moisture content of 0% is about
Tire-moist sand tractive performance
In this section, the tractive performance of the MSD truck tire operating over moist sand at different operating conditions is discussed. The operating conditions include three sand moisture content ranging between 0% and 50% and three longitudinal speeds ranging between 0 and 30
It should be noted that the soil box thickness was selected in a way that the tire does not penetrate through the soil and reach the bottom of the box. The exact thickness was selected as 535 mm based on the literature data. 28
Tire-moist sand interaction setup
Figure 7 shows the MSD truck tire mounted on top of a box filled with SPH sand particles. In order to incorporate interaction between structures and parts of structures that are not permanently connected by standard finite element connectivity conditions a contact algorithm was needed. The non-symmetric master-slave ode-to-segment contact with edge treatment was deployed. In this case, the tire was defined as the master, and the sand was defined as the slave. The contact works in two steps, first, the search operation is performed to detect possible contact even, and then the contact normal and tangent forces are calculated based on the friction input.
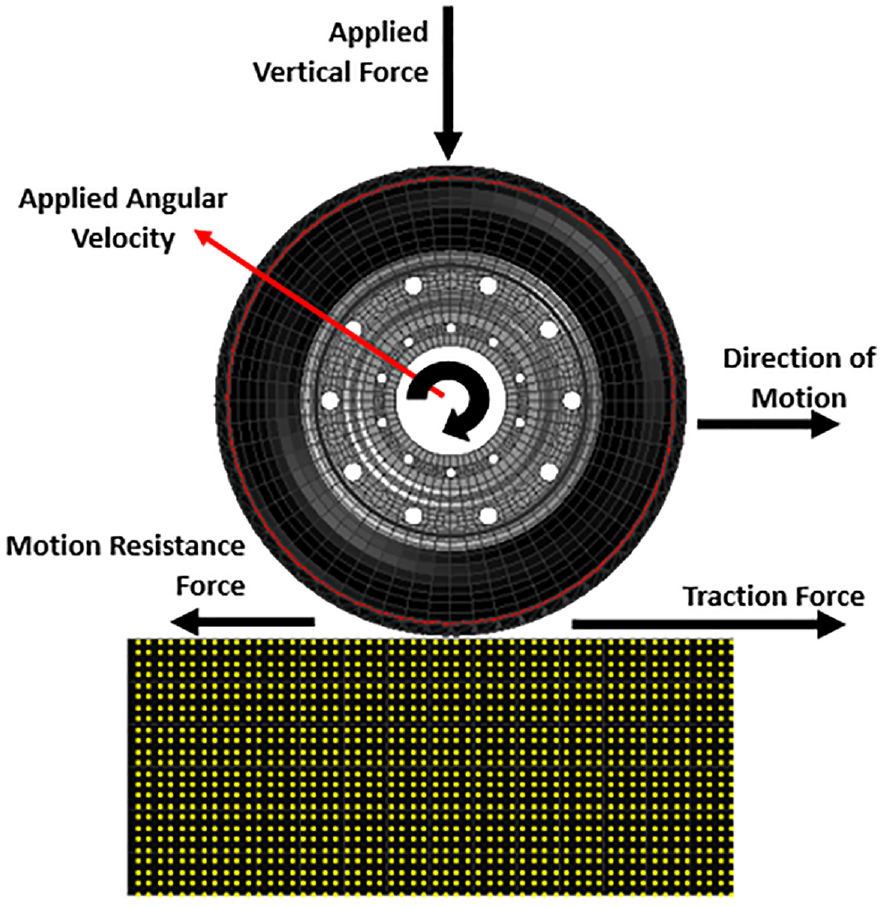
Free-body diagram of the MSD truck tire-sand interaction model.
During the simulation, the tire is first subjected to a nominal inflation pressure of 896
The tire is allowed to stabilize on the sand and then an angular velocity in the lateral axis of the tire is applied. The angular velocity consists of two portions; a ramp portion where the tire slip varies from 0% to 100% and a constant angular velocity where the slip angle is constant. The angular velocity applied reflects the desired longitudinal velocities of 10, 20, and 30
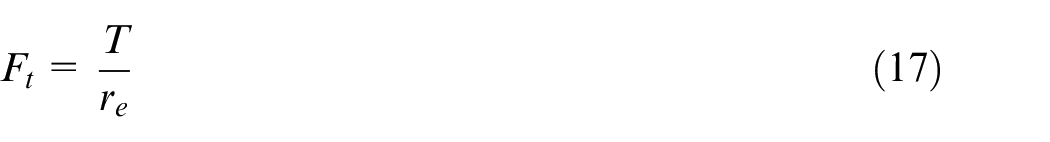
where

The tractive effort coefficient and the motion resistance coefficient are then calculated by dividing the tractive force and the motion resistance force by the vertical load, respectively.
Steady-state tractive performance analysis
In the course of steady-state analysis, a consistent rotational speed is imposed at the tire’s center. The contour simulation in Figure 8 depicts the MSD truck tire’s interaction with dry sand at velocities of 10 and 20
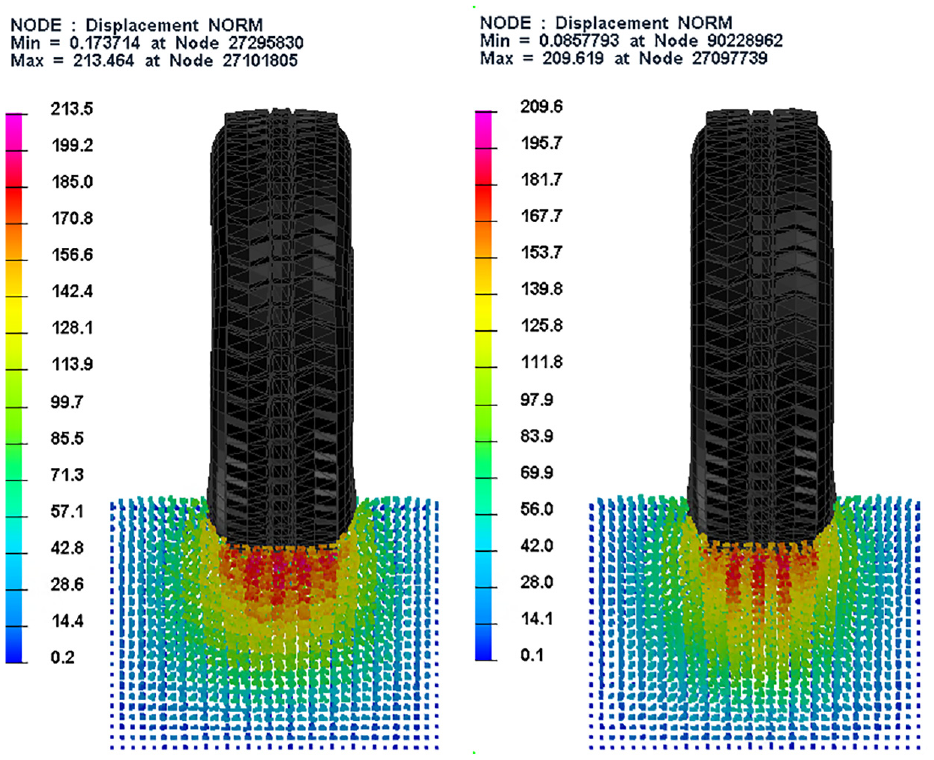
Rut depth generate in dry sand at 10
In broad terms, it’s evident that at lower longitudinal speed, the tire penetrates deeper into the sand, resulting in increased compression and soil normal displacement (rut depth). Furthermore, it is noticed that the rut depth accumulated in the sand after the tire passes over is slightly higher at lower speeds. For instance, the maximum recorded rut depth for a tire operating at
Figure 9 illustrates the influence of the moisture in the sand on the tractive effort coefficient at diverse longitudinal speeds.
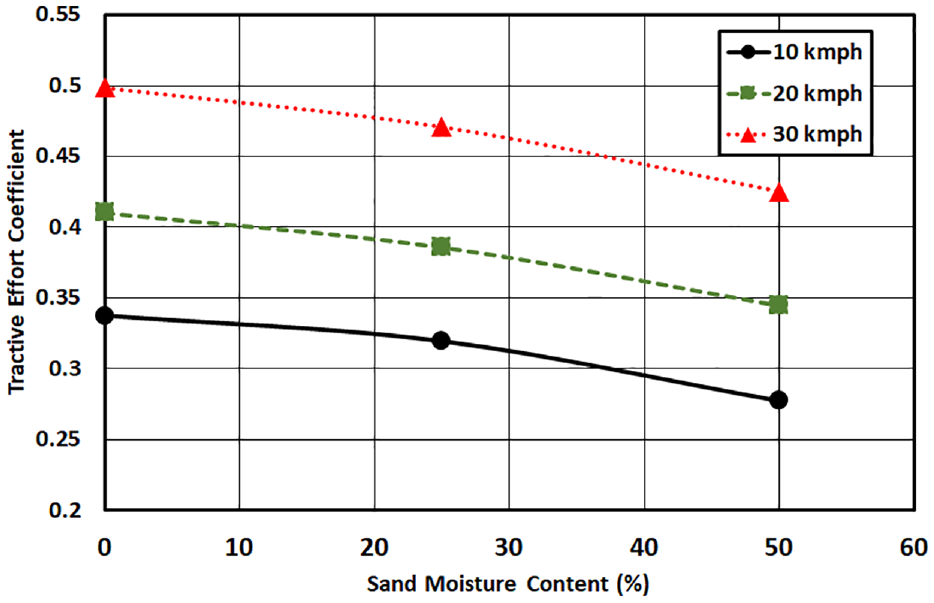
Influence of sand moisture content on the tractive effort coefficient at rated inflation pressure and vertical load.
It is noticed that as the longitudinal speed raises the tractive effort raises as well at a constant sand moisture content. As an example, when the tire is operating over dry sand at
Figure 10 illustrates the influence of the sand moisture content on the motion resistance coefficient at various tire longitudinal speeds. Similar to the tractive effort coefficient, as the longitudinal speed raises the motion resistance coefficient raises as well at a constant sand moisture content. On the other side, as the sand becomes more moisturized the motion resistance coefficient lowers at a constant tire speed. For instance, for dry sand operating at 10
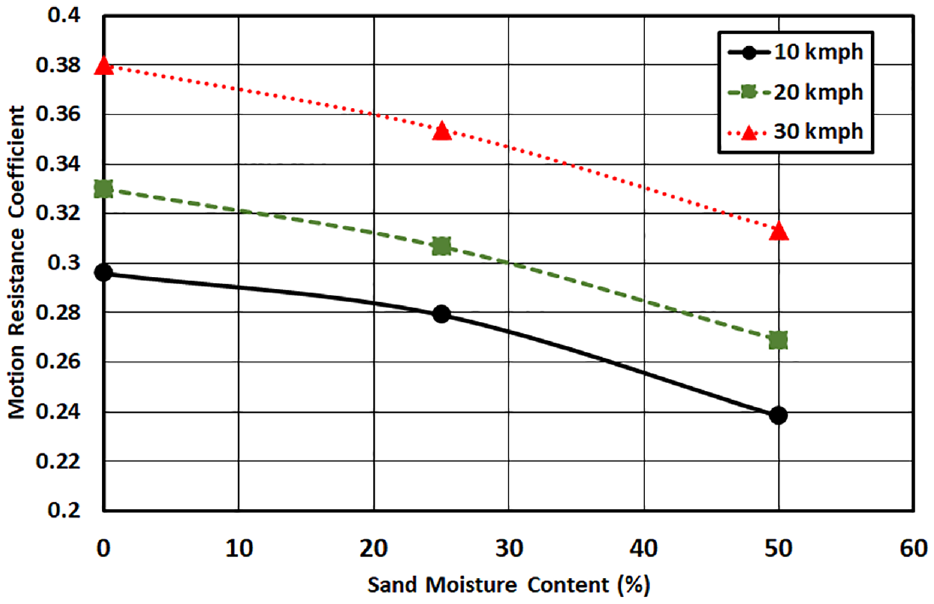
Influence of sand moisture content on the motion resistance coefficient at rated inflation pressure and vertical load.
In order to further understand the tractive performance the effect of sand moisture content and tire speed on the tire sinkage is illustrated in Table 4. The maximum recorded tire sinkage is
Tire sinkage in the sand as a function of moisture content and longitudinal speed at rated inflation pressure and vertical load.
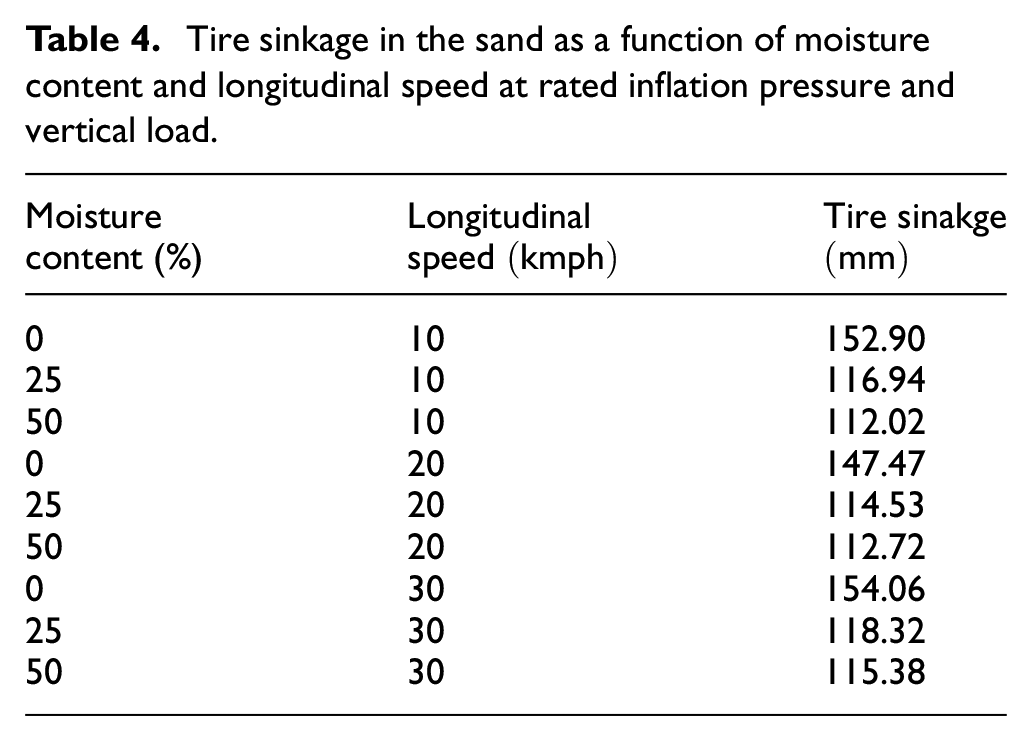
Figure 11 shows the variation of the lateral contact force between the truck tire and the sand as a function of moisture content at different speeds. It can be noticed that the lateral contact force increases as the sand moisture content increases at a given longitudinal tire speed. The lowest recorded lateral contact force is around 169
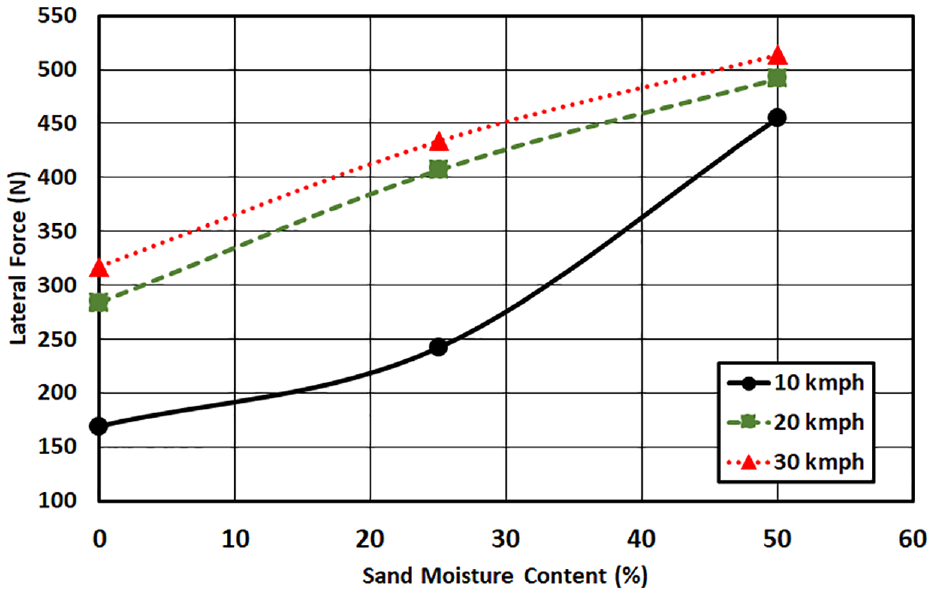
Tire-sand lateral contact force as a function of sand moisture content at different operating speeds at rated inflation pressure and vertical load.
Furthermore, the effect of vertical load on tractive effort coefficient can also be investigated as shown in Figure 12. It is noticed that as the vertical load increases the tractive effort coefficient increases as well, at a given sand moisture condition. The highest recorded tractive effort coefficient is at 40
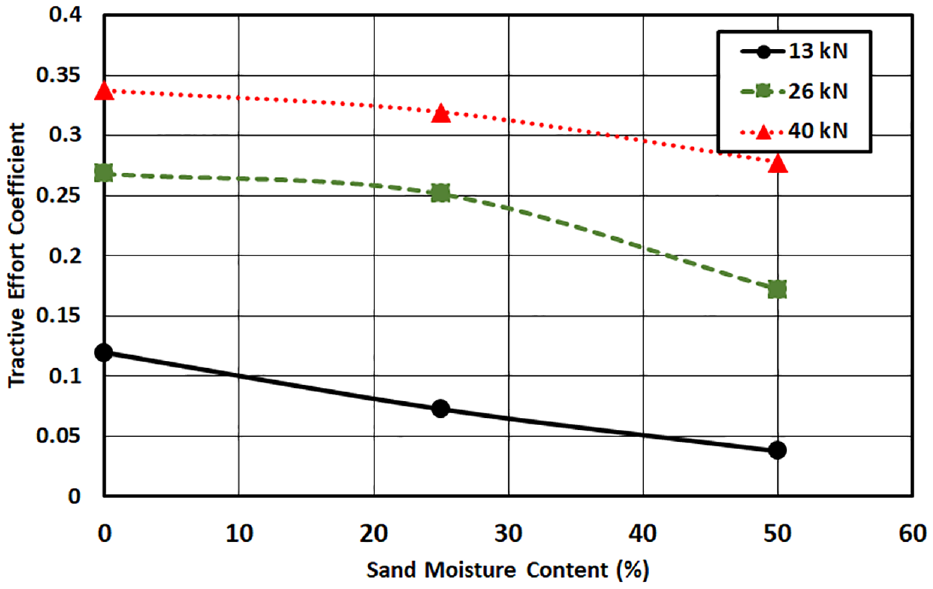
Influence of sand moisture content and vertical load on the tractive effort coefficient at rated inflation pressure and
Transient tractive performance analysis
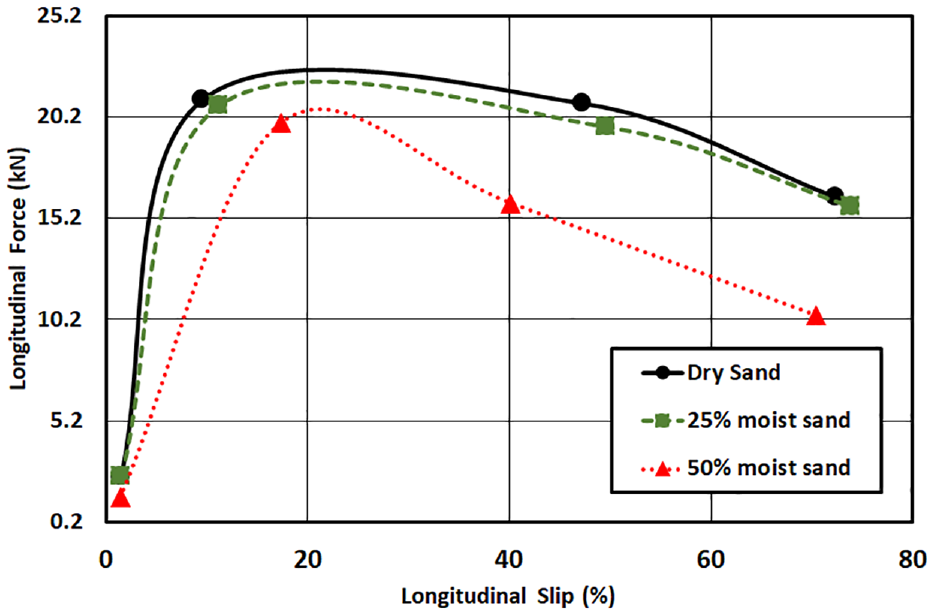
During transient analysis, a rapid angular velocity is activated to the tire’s center causing the tire to generate longitudinal slip. Figure 13 shows the variation of the longitudinal force as a function of longitudinal slip for dry and, 25% moist sand, and 50% moist sand. Since this analysis is performed at a rapid angular velocity, the steady-state condition is not achieved. The equivalent longitudinal speed at which this analysis is performed is between 0 and 45
Tire sinkage in the sand as a function of sand moisture content at rated inflation pressure and vertical load.
It is noticed that the trend of the longitudinal force versus slip is similar along all sand samples. The dry sand and the 25% moist sand exhibit similar values and are close to each other, with both having the maximum peak at around 10% slip. On the other side, the 50% moist sand exhibits a lower longitudinal force over the range of slip and has a peak value at around 17% slip. Furthermore, for all slip values the dry sand has the highest longitudinal force, followed by the 25% moist sand. This trend is in agreement with the trend observed for the tractive effort coefficient and motion resistance coefficient in the steady-state analysis. Overall, the maximum recorded longitudinal force is 21
Conclusions
During the course of this study, the influence of moisture in the sand on the tractive performance of a mixed service drive truck tire of size 315/80R22.5 was performed. First, the MSD truck tire was modeled and validated using the classical Finite Element technique along with Mooney-Rivilin material for solid rubber elements. Then, the dry sand and moist sand were modeled using the innovative Smoothed-Particle Hydrodynamics technique and calibrated against experimental testing results. Later, the tractive performance of the mixed service drive truck tire operating over several moist sands was evaluated. It was found that as the longitudinal speed rises the tractive effort rises at a given sand moisture content, and as the sand moisture content increases the tractive effort coefficient reduces at a constant longitudinal speed. Furthermore, it was also found that as the longitudinal speed increases the motion resistance coefficient increases at a given sand moisture content, and that as the moisture content increases the motion resistance coefficient reduces at a given tire speed.
The transient analysis of the truck tire over moist sand was also discussed and it was found that the influence of the longitudinal slip on the longitudinal force is similar along all sand samples. In addition, the peak longitudinal slip occurred at a longitudinal slip between 10% and 17%. Overall, the maximum recorded longitudinal force is 21
Footnotes
Acknowledgements
The author would like to acknowledge Volvo Group Trucks Technology for their continuous support during this research work.
Declaration of conflicting interests
The author declared no potential conflicts of interest with respect to the research, authorship, and/or publication of this article.
Funding
The author received no financial support for the research, authorship, and/or publication of this article.