
Abstract
The idle start-go (ISG) system has been widely used, but there have been few relevant studies of its effect on emissions. This paper investigates fuel economy, total hydrocarbon (THC), carbon monoxide (CO), nitrogen oxides (NOx), particulate mass (PM), and particle number (PN) emissions from China VI gasoline direct injection (GDI) vehicles with and without ISG. Three test cycles were performed under hot start conditions, that is, the worldwide harmonized light vehicle test cycle (WLTC), the China light-duty vehicle test cycle (CLTC), and the USA federal test procedure-75 (FTP-75). About 28 idling phases were selected to specifically analyze the influence of ISG system. The results reveal that ISG system helps decrease fuel consumption, THC and CO emissions but aggravates NOx and solid PN emissions. Also, ISG system increases the proportions of sub-23 nm and nucleation-mode particle emission. Idling time plays a role in fuel economy, THC and CO emissions, while accelerated speed affects the emissions of THC, CO, NOx, and PN.
Introduction
With the rapid growth of vehicle populations, environmental and energy issues have become increasingly prominent, which has also promoted stringent regulations on vehicle emissions and fuel consumption in the past several decades. 1 In China, there were 281 million vehicles in 2020, from which the total emissions of CO, HC, NOx, and particulate mass (PM) were 694.3, 171.2, 622.2, and 6.9 ten thousand tons, respectively, 2 and oil consumption of motor vehicles accounted for approximately 60% of the total oil consumption. 3 In the United States, the transportation sector consumed approximately 29% of the total energy in 2017. 4 In India, the transportation sector is the third largest-emitter of greenhouse gases, in which the biggest contributor is road traffic, meanwhile vehicles in major metropolitan cities of India are estimated to account for ∼70% CO, ∼50% HC, ∼30%–40% NOx, and ∼30% suspended particulate matter of the total pollution load. 5 In particular, PM2.5 is considered a main factor which influence air quality, 6 and vehicle emissions accounted for 16%, 26%, and 39.8% of local ambient PM2.5 pollution in New York, Beijing, and Shanghai, respectively. 7 There is no doubt that vehicle fuel consumption and emissions are two of the biggest contributors to the energy dilemma and regional air pollution problem. On the other hand, severe traffic congestion has been the norm as a result of high vehicle ownership density, 8 especially in the growing megacities of developing countries. 9 Idling conditions account for a larger proportion of daily travel, and it is estimated that more than 6 billion gallons of gasoline and diesel are consumed by idling phases every year in America. Approximately half of this is attributable to personal vehicles, which generate approximately 30 million tons CO2 annually just by idling. 10
The idle start-go (ISG) system, well-known as an effective measurement to reduce idling time, has been employed by numerous manufacturers to improve fuel economy, which can shut down the engine as the vehicle is stopped and keep the engine off until the brake pedal is released. 11 Actually, the impacts of this system on fuel economy and emissions can be regarded as a trade-off between the idling and starting conditions, as reported that ISG system can reduce fuel consumption when the average vehicle parking time is longer than 9 s. 12 Along with the rapid development of electrification, vehicles equipped with ISG systems will occupy more market share in the coming years, and it is predicted that approximately 63% of vehicles will implement ISG systems in the North American market by 2025. 13 Many studies focused on the fuel economy benefit of ISG systems.14,15 Bishop et al. 16 investigated the fuel efficiency improvement of an ISG system based on a 12 V electrical system using an enhanced power supply, noting that the test vehicle had a 5.3% improvement in the city drive cycle and an approximate 4% improvement in the highway drive cycle. The results of Wishart and Shirk 17 showed that for Mazda 3 powered by a gasoline direct injection (GDI) engine, the percent differences in fuel economy values between ISG enabled and disabled modes for the five-cycle methodology, NEDC, JC08, and on-road test were 1.1%, 8.3%, 7.0%, and 2.0%, respectively. Fonseca et al. 18 conducted experiments on two diesel vehicles with/without an ISG system to evaluate its effect on on-road CO2 emissions. They demonstrated that the CO2 emissions from the test vehicle equipped with ISG system are reduced by more than 20% compared with the baseline, even though this result is also affected by other factors, such as traffic flow and engine oil temperature. Dimaratos et al. 19 also validated the effect of ISG system on CO2 emissions by AVL Cruise, the reduction rate of CO2 emission is 2.5%–4.8% in NEDC and 1.2%–2.6% in WLTP. Obviously, different effects are mainly due to the various proportion of the idling period in the driving cycle. 20 With the fuel economy regulations coming into force in China, vehicle fuel consumption has significantly declined. Previous studies on the fuel consumption of ISG systems are mainly based on vehicles that met the Euro IV emission standard or earlier, which are hardly representative of GDI vehicles subjected to China VI. Thus, it is necessary to reassess the impact of ISG systems on fuel consumption.
The influence of ISG systems on vehicle emissions has not been extensively studied. Ji et al. 21 numerically researched the emission performance of a gasoline vehicle under NEDC test cycle. The results proved that NOx emissions decreased by 5.5% after employing ISG system, whereas the accumulative CO emission mass was 18.1% higher than that of the original vehicle, and HC emissions increased by 87.5%. GDI vehicles are known to produce higher PM and particle number (PN) emissions than port fuel injection vehicles and diesel vehicles equipped with diesel particulate filters. 22 According to Storey et al. 23 the total PM and soot emissions from a vehicle equipped with a GDI engine increased with start-stop operation in the FTP 75 cycle, but the increase was not significant. In addition, some researchers have also been devoted to studying the emissions of engine starting stage24,25 and hybrid vehicles.26,27 Studies of the starting stage only focus on several transient processes, and for hybrid vehicles, there may be a long interval between two engine starts. Hence, the results cannot accurately reflect the variation in gaseous and particulate emissions during the ISG process.
Today, several countries and areas have promulgated regulations to reduce unnecessary idling conditions. 5 As a major measurement to achieve this goal, it is essential to evaluate the influence of ISG system on the fuel economy and emissions of mainstream vehicles. This paper employed two GDI vehicles certified to meet the China VI emission standard to investigate the influence of ISG system on fuel consumption and CO, THC, NOx, and PN emissions based on WLTC, CLTC, and FTP-75. Furthermore, 28 idling phases were selected from the test cycles, and 5 parameters related to the idling phase, including average accelerated speed, average decelerated speed, idling time, acceleration time, and deceleration time, were used to analyze the specific influence rule of ISG system during different idling phases. We observe that ISG system is conducive to decreasing fuel consumption, THC and CO emissions but increases NOx and solid PN emissions, as well as the proportion of sub-23 nm (particle diameter of 5.6–23 nm), which is not yet under consideration of emission regulations, and nucleation-mode particles (particle size <50 nm). There are a large collection of papers focusing on the effect of idling time on fuel consumption and emissions, while very little attention has been given to the impact of deceleration process and acceleration process before and after idling. Acceleration phase is considered to affect the influence of ISG system on THC, CO, NOx, and PN emissions in this research. This paper has made two major contributions. First, we comprehensively evaluate the influence of ISG system on fuel economy and emission characteristics, including particle size distribution. Second, we propose the concept of the idling phase to analyze the effect laws of ISG systems on different emissions, which are expected to guide the design and employment of ISG systems, as well as the development of relatively recommended guidelines.
Experiment setup and procedure
Test vehicle and fuel parameters
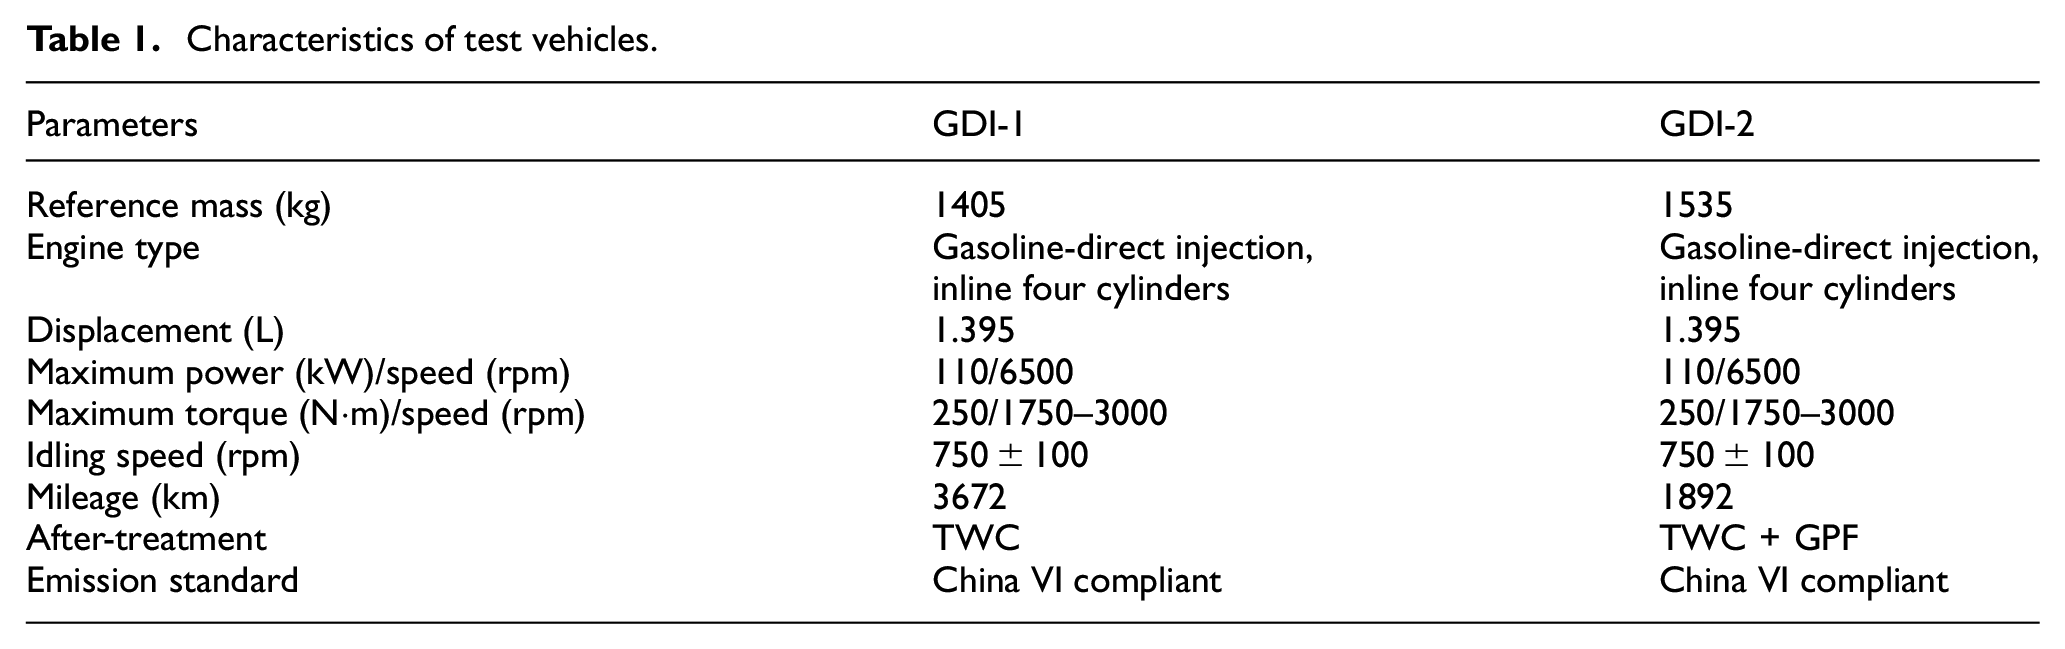
Two light-duty GDI vehicles equipped with an original OEM calibration ISG system are employed in this paper, denoted as GDI-1 and GDI-2. The main technical parameters are listed in Table 1. They are mounted with a three-way catalyst (TWC) and certified to meet the China VI emission standard. In addition, GDI-2 is equipped with a gasoline particulate filter (GPF) to reduce particulate emissions. The GPF on GDI-2 was 5.2 in. in diameter and 4 in. in length, with an 8-mil cell wall thickness and a cell density of 300 cells per square inch. It had a washcoat with palladium (Pd) and rhodium (Rh). The filtration efficiency of GPF was between 60% and 80% according to working conditions. All after-treatment devices were in good working condition during the tests. Both test vehicles were manufactured on the same platform; therefore, they possess similar powertrain and ISG system configurations. The prerequisites to ensure that ISG system works normally are shown in Supplemental Table S1. Before each test, the battery state of charge (SOC) was maintained at 80%, and the air-conditioning system was disabled during the experiment. The driver can turn on or off the ISG function manually according to the experimental requirements.
Characteristics of test vehicles.
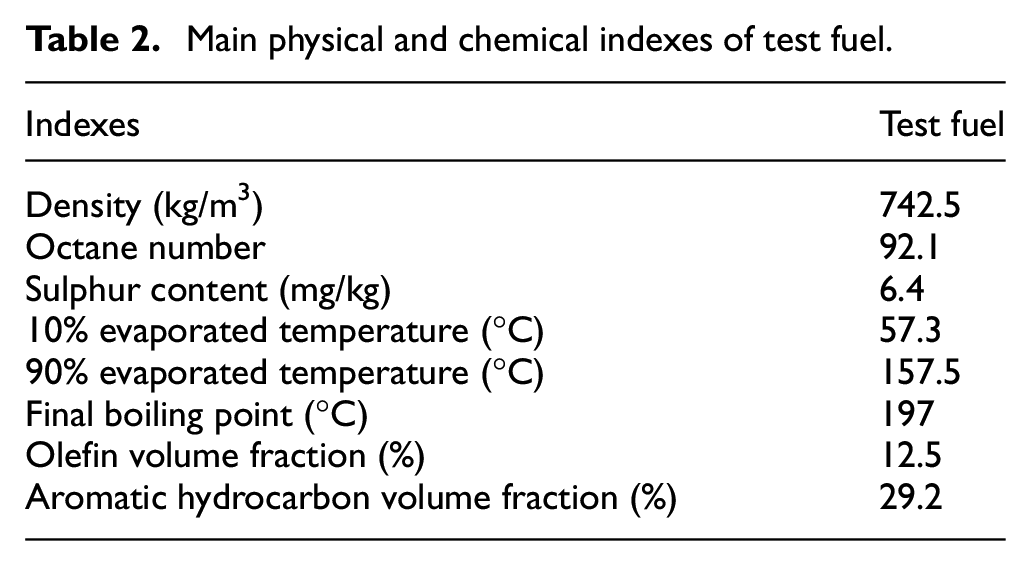
The test fuel is certified to meet the China VI fuel standard, and its specific physical and chemical indexes are listed in Table 2.
Main physical and chemical indexes of test fuel.
Experiment setup
The test equipment included an environment cabin (WEISS, WK399), chassis dynamometer (HORIBA, VULCAN EMSCD48), constant volume sampler system (HORIBA, CVS-ONE), engine exhaust gas analyzer (HORIBA, MEXA-7400 LE), PM measurement system, solid particle counting system (HORIBA, MEXA-2000SPCS), and engine exhaust particle size spectrometer (EEPS 3090). The SPCS was used to measure solid PN with diameter range from 23 nm to 2.5 μm, which was directly emitted from the exhaust tailpipe. The EEPS was installed at the end of the dilution tunnel to measure the total PN for particle sizes between 5.6 and 560 nm with a 1 s sampling interval, detecting not only the solid particles but also the volatile and semi volatile particles. Figure 1 shows a schematic view of the experimental setup. The specific technique parameters of the test equipment are listed in Supplemental Table S2.
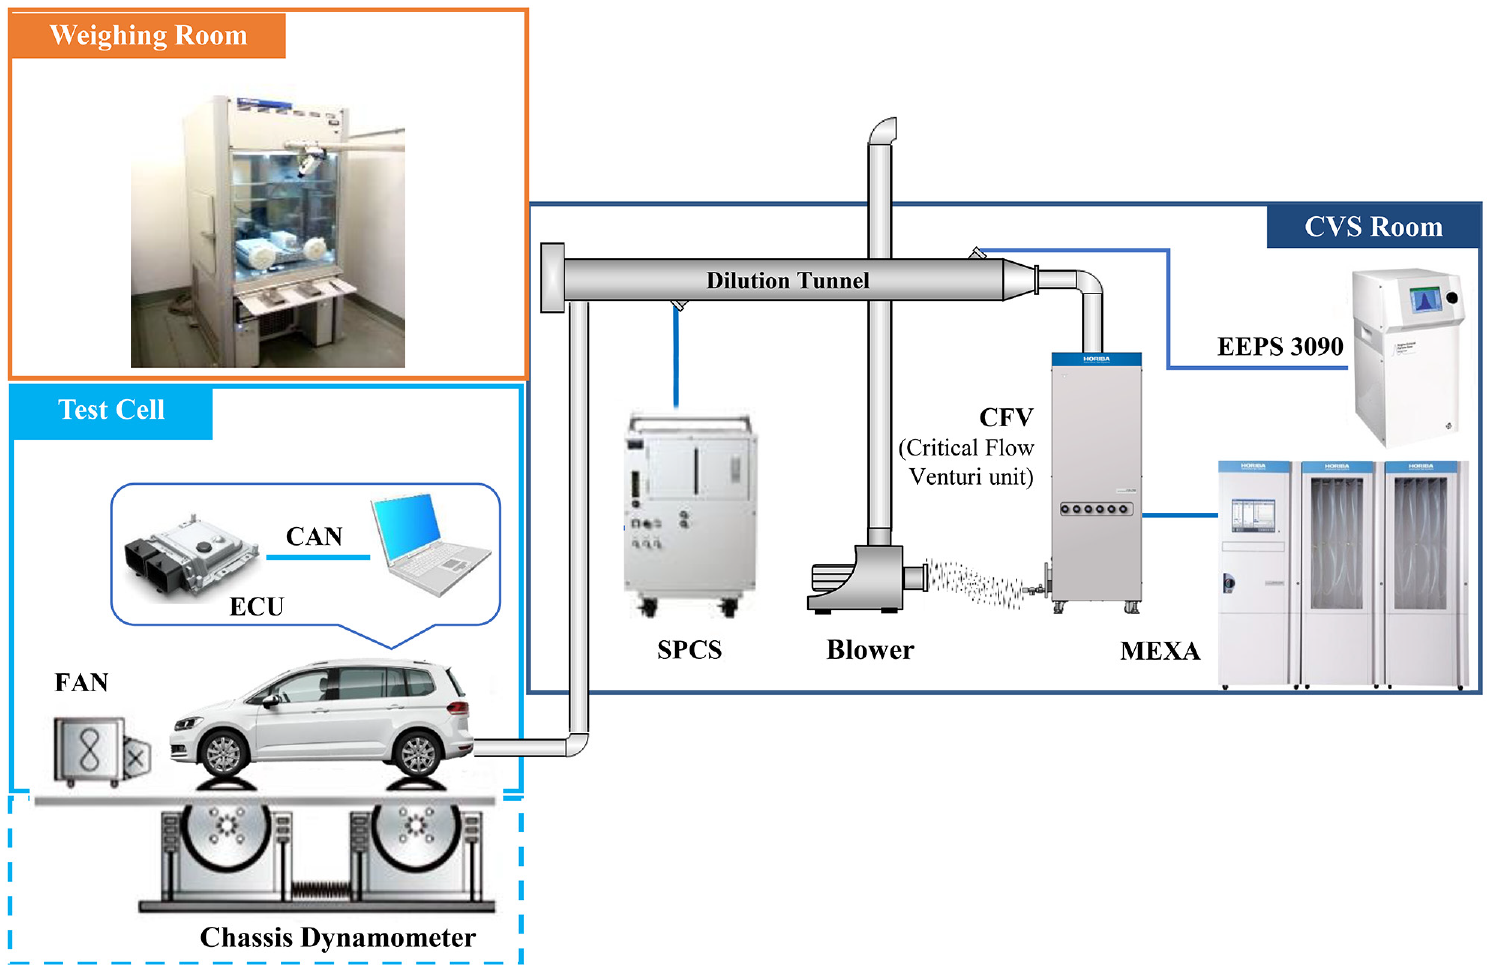
Schematic diagram of experiment setup.
In an effort to better understand ISG system operating conditions during testing, engine information (i.e. engine speed, coolant temperature, catalyst temperature, etc.) was collected by vehicle Controller Area Network (CAN). The fuel consumption was calculated with the carbon balance method following equation (1). 28
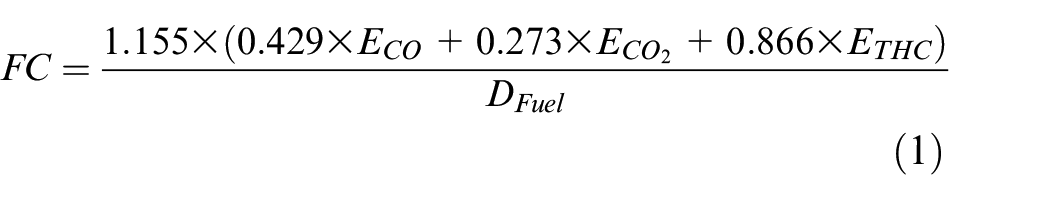
where
Test cycle
To make the laboratory results reflect the real-world driving conditions as much as possible, three cycles were applied in this study, namely, CLTC, WLTC, and FTP-75, and each test cycle was repeated three times. The three test cycles were developed based on abundant real driving conditions and can be in accordance with the actual situation well. Specifically, WLTC with aggressive transient conditions was developed based on 765,000 km of real driving behavior data collected from six regions, including the USA, Korea, Japan, India, the EU, and Switzerland. CLTC was promulgated by Chinese government in 2019, based on about 32 million kilometers of in-use driving behavior data, covering urban, rural, and motorway driving, while the acquisition times cover peak, off-peak, and weekend driving. 29 It can precisely represent the real road conditions in China. FTP-75 has more idling phases, which was developed using measured data from vehicles commuting to work in Los Angeles, CA, USA. The comparison of the main characteristic parameters is listed in Supplemental Table S3.
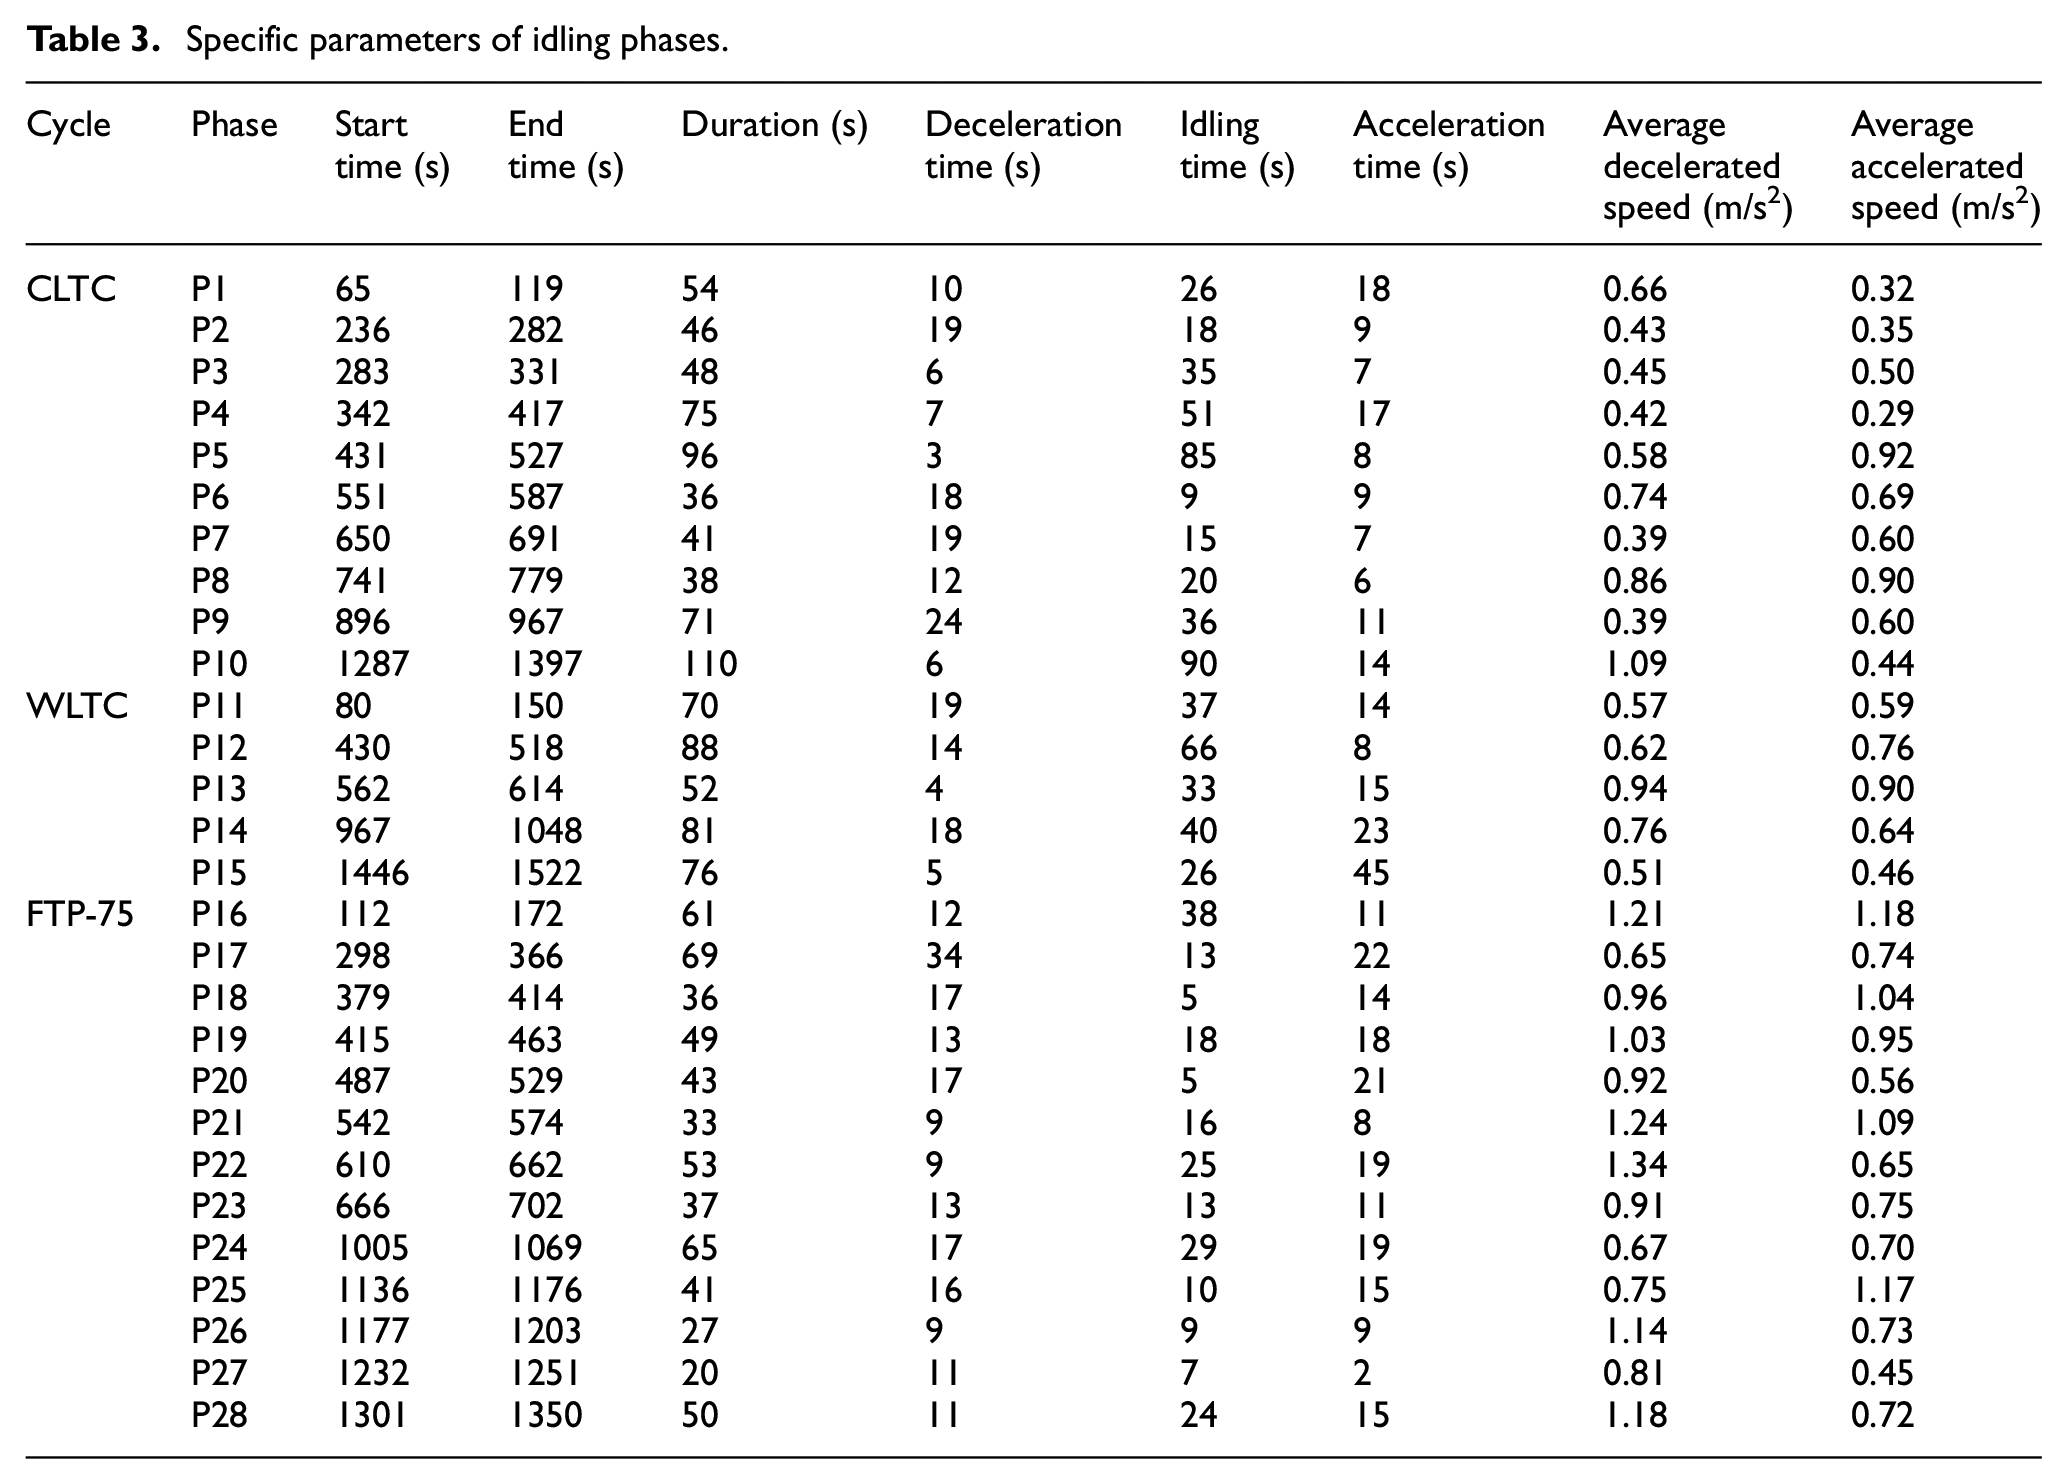
The concept of the idling phase is proposed in this paper. The influence of ISG system in acceleration process and deceleration process has not been considered in the previous studies. In fact, in the last deceleration process before idling, the engine speed of vehicle without ISG system changes from working speed to idle speed, but after employing ISG system, the engine speed changes from working speed to zero. A similar change of engine speed occurs during the first acceleration process after idling as well. The different work condition of engine in deceleration process and acceleration process would cause a variation of oxygen concentration in cylinder and pipe line, which may affect fuel consumption and emissions. Considering the impact of ISG system on fuel economy and emissions during deceleration process and acceleration process, each idling phase is composed of the last deceleration process before idling, the idling process and the first acceleration process after idling. Specifically, the last deceleration process before idling is a continuous deceleration process before vehicle speed is 0 km/h. The idling process is the period of vehicle speed is 0 km/h and the engine speed is idling speed (without ISG system) or 0 r/min (with ISG system). The acceleration process after idling represents a continuous acceleration after vehicle started. When vehicle speed no longer increases, the idling phase ends. Figure 2 shows 28 idling phases in three test cycles, which are likely to be observed in typical driving scenarios. The coolant temperature required to ensure ISG system enable is between 48°C and 105°C. To keep ISG system usable throughout the whole experiment, all test cycles were performed under hot start according to standard procedures. Therefore, the soak and hot start stages in FTP-75 were omitted herein, which can also cover all idling phases. The specific information of each phase is given in Table 3.
Specific parameters of idling phases.
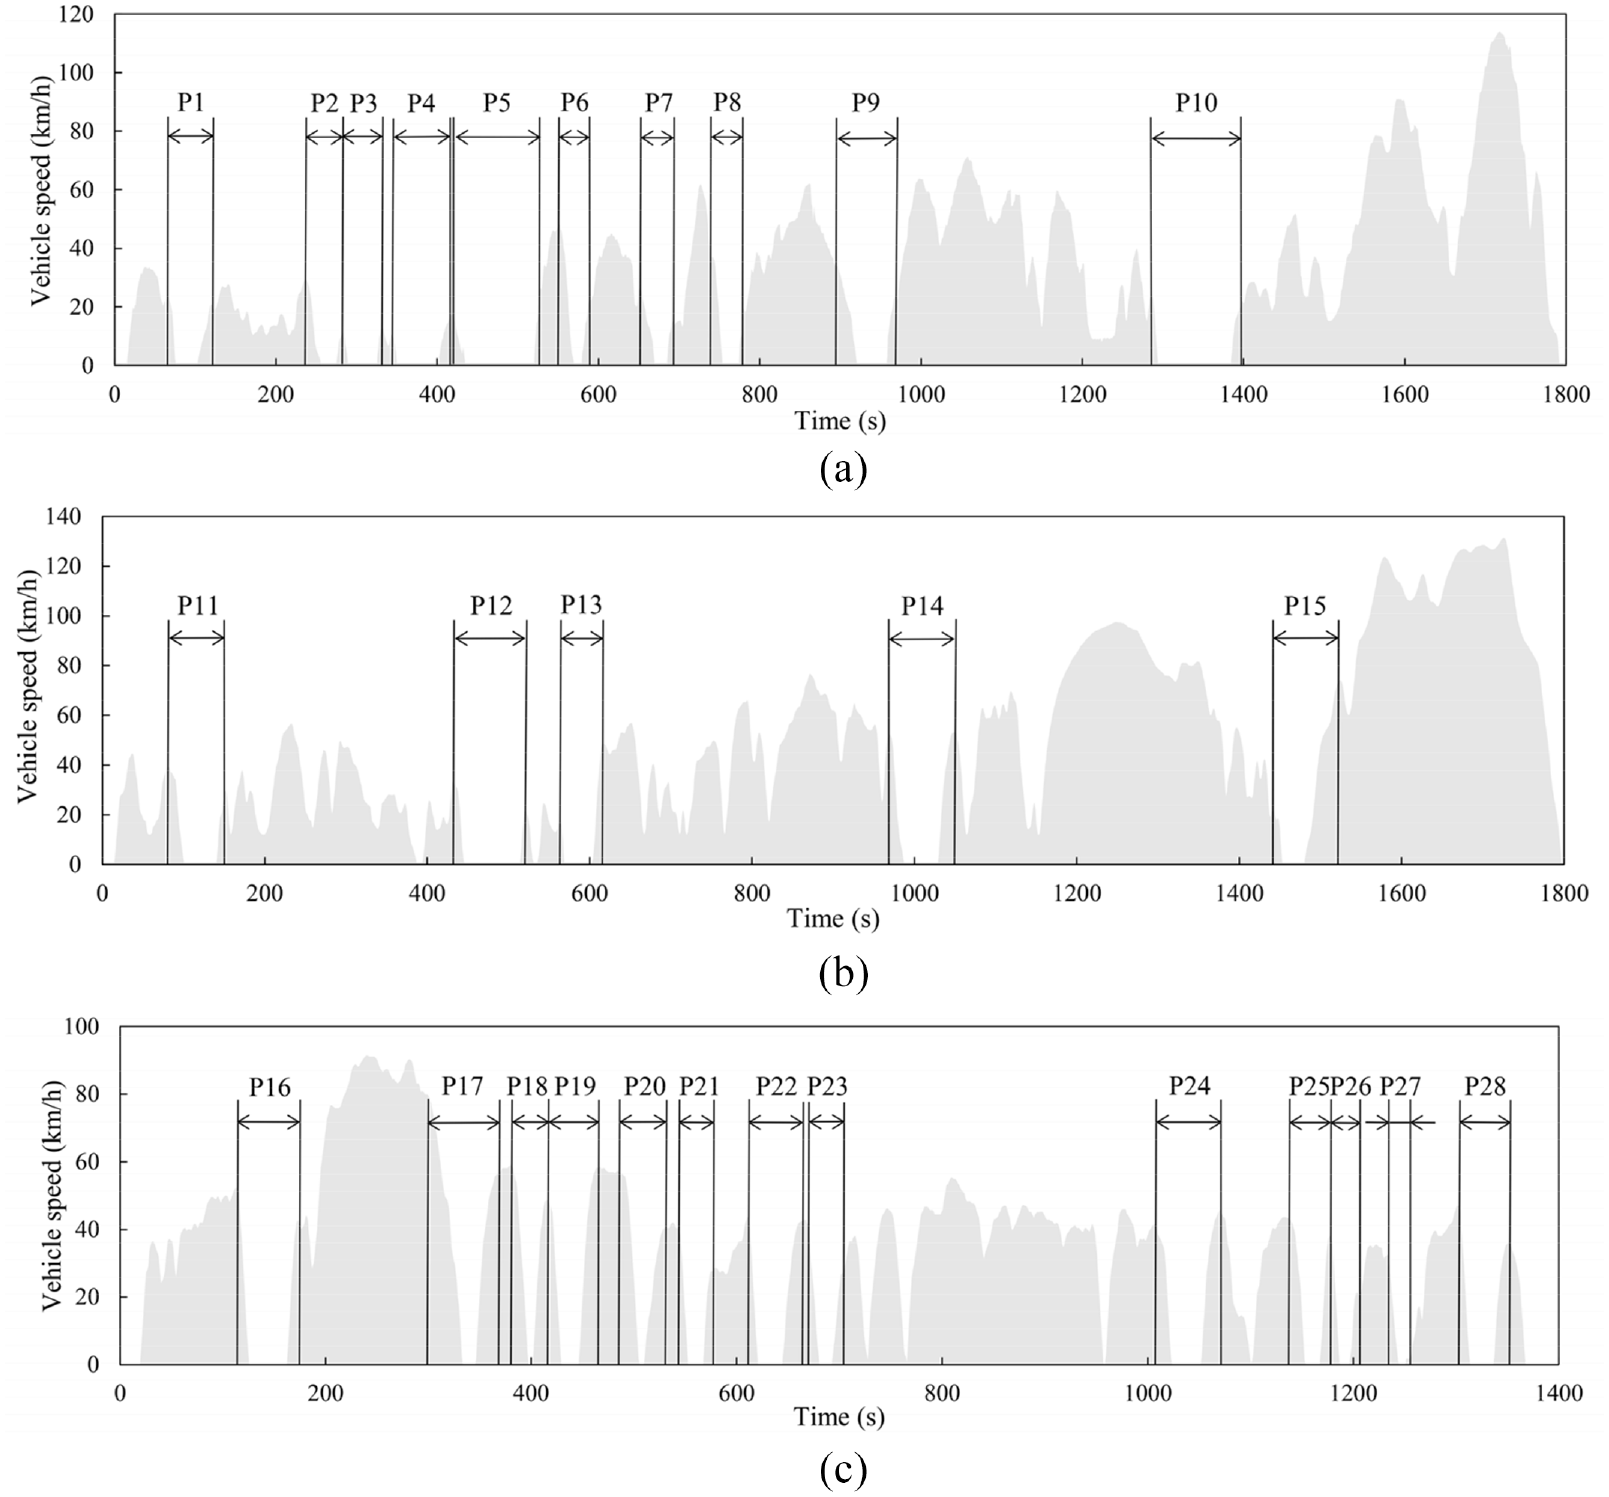
Profiles of three test cycles and idling phases: (a) CLTC, (b) WLTC, and (c) FTP-75.
Results and discussion
Fuel economy and emission characteristics
The overall fuel economy and emission results with and without ISG system are shown in Table 4, wherein each value represents the weighted result of three test cycles on the basis of distance. The “w ISG” and “w/o ISG” in Table 4 indicate ISG system on and off conditions, respectively. There is no distinct difference in the effect of ISG system between GDI-1 and GDI-2. The fuel consumption is reduced by 3%–4% after employing ISG system, which is consistent with previous studies.30,31
Effect of ISG system on fuel consumption and emissions.
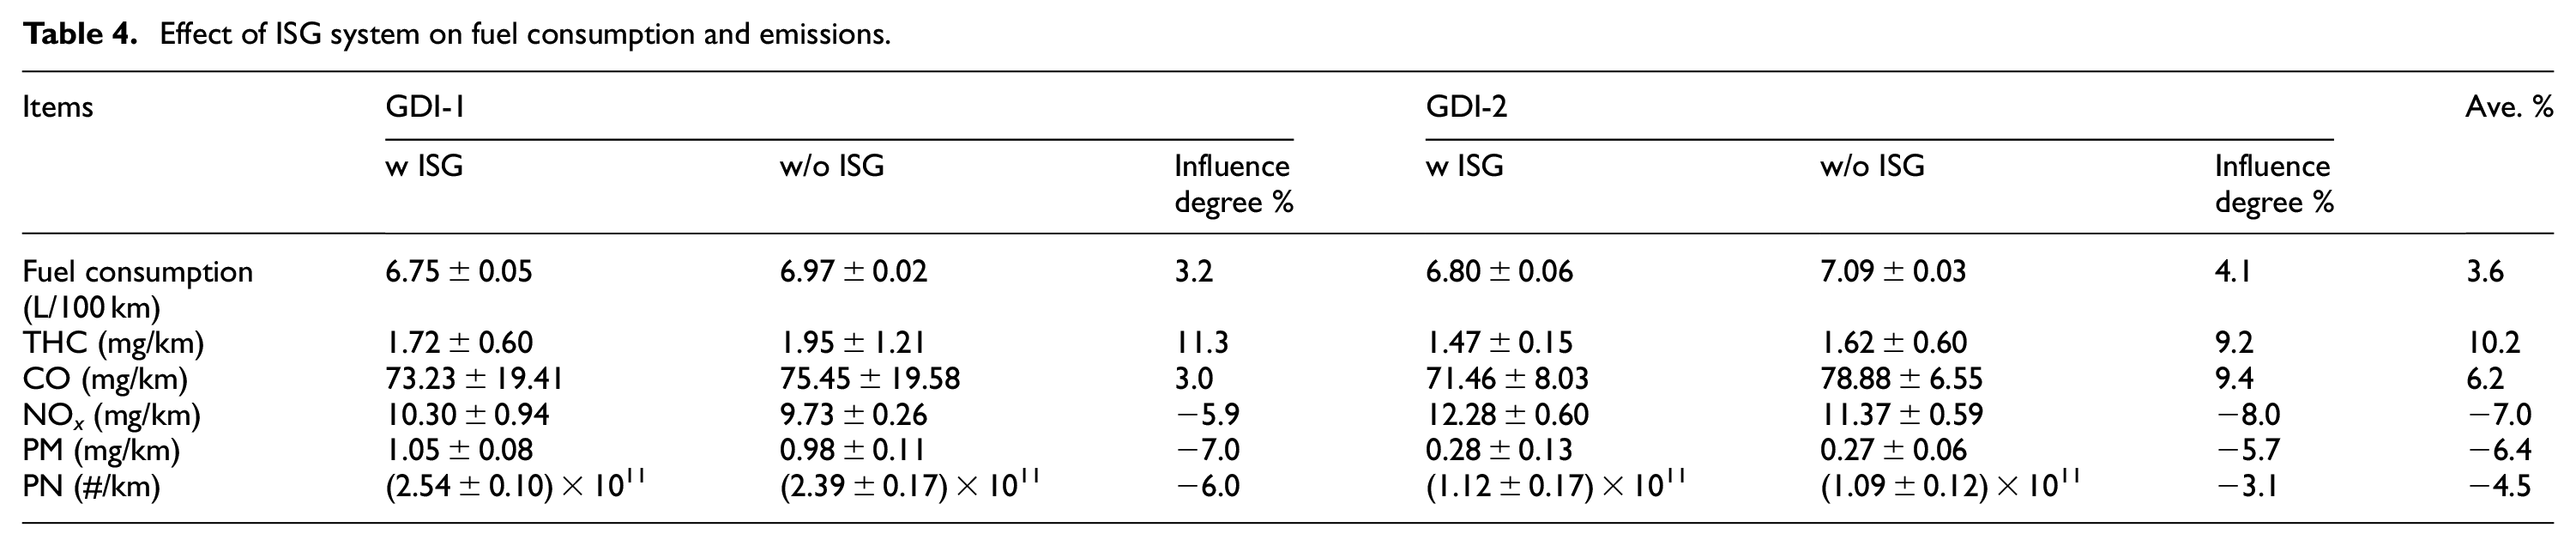
For the emission characteristics, it can be deduced that ISG system is conducive to decreasing THC and CO emissions but would increase NOx and solid PN emissions. Specifically, the emission factors of THC and CO are reduced by 11.3% and 3.0% for GDI-1, and for GDI-2, the numbers are 9.2% and 9.4%, respectively. While NOx and solid PN emissions with ISG are increased by approximately 5.9% and 6.0% for GDI-1%, 8.0%, and 3.1% for GDI-2. Phase 5 is taken as an example to analyze the impact of ISG system in Figure 3, which displays the average transient emissions histories before CVS of repeated experiments and part of the engine working parameters of GDI-1. First of all, it needs to be noted that due to the presence of background concentrations and residual emissions in the exhaust pipe, even in the “w ISG” condition, the pollutant emissions in the idling stage are not zero. It is obvious that THC and CO emissions are lower at the idling stage under the “w ISG” condition as a result of engine stop. Meanwhile, there are no significant increases in THC and CO emissions during the restart process. It has been reported that CO emissions are strongly correlated with oxygen concentration, 32 and both excess air coefficient and spark timing have vital impacts on THC emissions during engine restart. 25 According to the lambda curve in Figure 3, the excess air coefficient λ evaluated by oxygen sensor upstream of the TWC is stable around the stoichiometric ratio most of the time under the “w/o ISG” condition. ISG system which shortens idling time is helpful to store oxygen in the exhaust pipe, therefore the excess air coefficient under the “w ISG” condition is higher during the idling stage. During the restart process, the excess air coefficient is slightly less than 1, so the THC and CO emissions rise modestly. The curves of spark timing may imply that it will be deferred when the engine restarts, which is conducive to decreasing THC emissions by not only extending the fuel-air mixing time but also raising the exhaust temperature to promote the oxidation of unburned HC. 33 Regarding NOx emissions, ISG system promotes the formation of NOx during the restart process, which can be attributed to the combined action of high air fuel ratio (i.e. λ > 1) and high in-cylinder temperature. PN emissions are primarily related to the acceleration process. 34 Idling emission under “w/o ISG” conditions is not critical when considering the whole idling phase, especially in the warm state. 35 According to Figure 3, solid PN emission of the “w ISG” condition slightly increases at the beginning of the acceleration process.
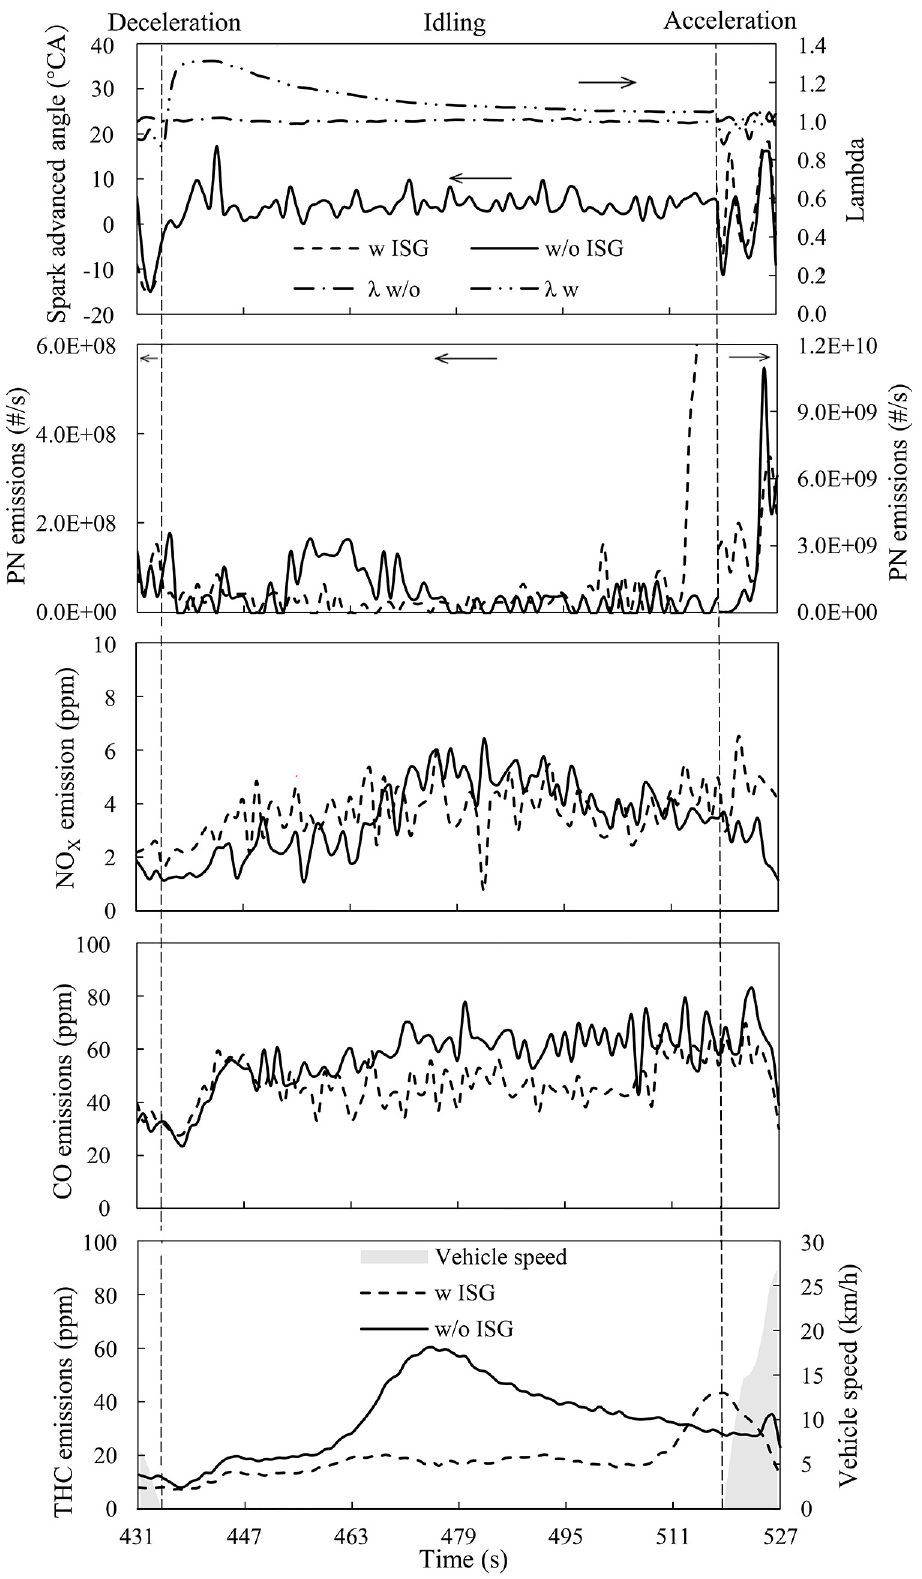
Histories of emissions and engine parameters in phase 5 of GDI-1.
The particle size distributions measured by EEPS with a measuring range of 5.6–560 nm are shown in Figure 4. It is obvious that all emission peaks are approximately 10 nm. The sub-23 nm particle emission under “w ISG” condition increased by 37.4% from 1.82 × 10¹³ to 2.50 × 10¹³#/cm3 compared with “w/o” ISG condition for GDI-1. And for GDI-2, the number increased by 90.7% from 2.36 × 10¹² to 4.50×10¹² #/cm3. This part of emission is not considered in the above results (i.e. 5.99% and 3.1% solid PN emissions changes), but it is noteworthy due to the probable severe impact. 36 In addition, the utilization of GPF reduces the particle emissions effectively, but there is no significant effect on particle size distribution. As shown in Figure 4, there exists no apparent difference in the particle size distribution between the two test vehicles.
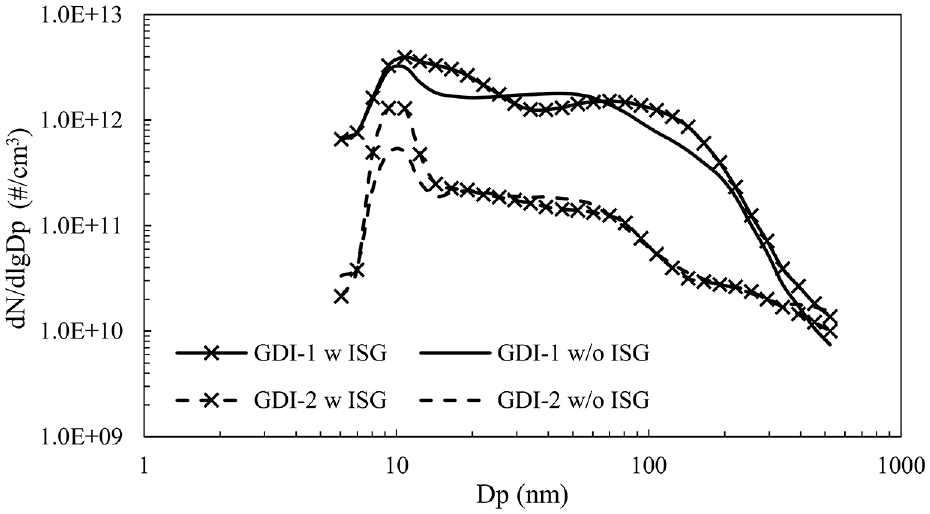
Particle size distributions of test vehicles under w, w/o ISG conditions.
The individual results of test cycle have been listed in Supplemental Table S4. CLTC is considered as a suitable cycle to evaluate the impact of ISG system than the other because of not only the higher idling ratio, but also wide ranges of idling time and accelerated speed in each idling phase.
Results of idling phases
To evaluate the effect of ISG system on different idling scenarios, 28 idling phases were selected from standard test cycles in this paper. For each idling phase, the influence degree is used to represent the magnitude of fuel consumption and emission variations after employing ISG system. It can be calculated as follows:

where E represents the average fuel consumption or emissions of the idling phase under w, w/o ISG conditions.
Fuel consumption
The ISG system can eliminate fuel consumption during the idling process to improve fuel economy, but an excessively short idling may in reverse increase fuel consumption. According to the research of Argonne National Laboratory, 37 idling for more than 10 s consumes more fuel than restarting the engine for a late-model mid-sized American car (2011 Ford Fusion). Idling time is testified to directly affect the fuel consumption after employing ISG system. Figure 5 displays the correlation between idling time and the reduction of fuel consumption, where each point represents the mean result of GDI-1 and GDI-2. The reduction in fuel consumption after employing ISG system increases with the extension of idling time, which can be fitted well by a quadratic curve. According to the fitting curve, it can be inferred that ISG system can improve the fuel economy of test vehicles when the idling time is more than 5.9 s, which is similar to the results of Lu et al. 12
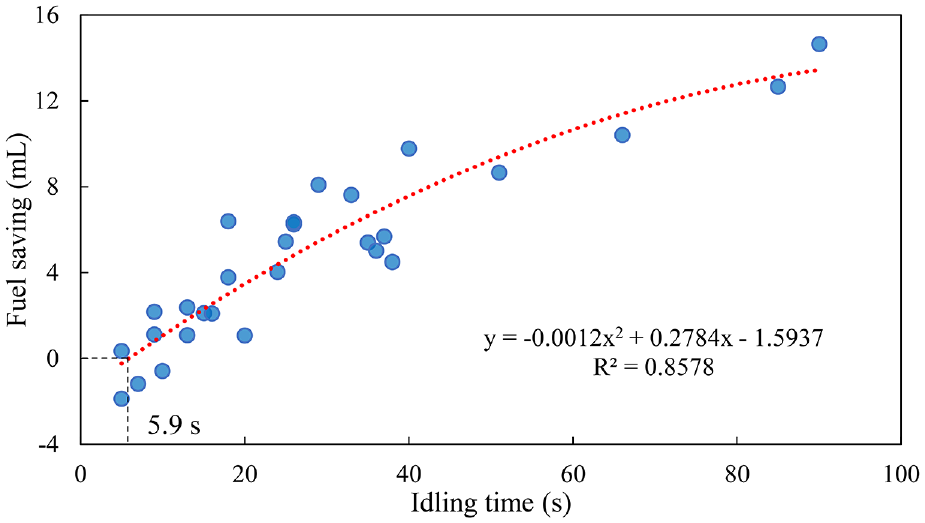
Relationship between idling time and reduction of fuel consumption.
Emission characteristics
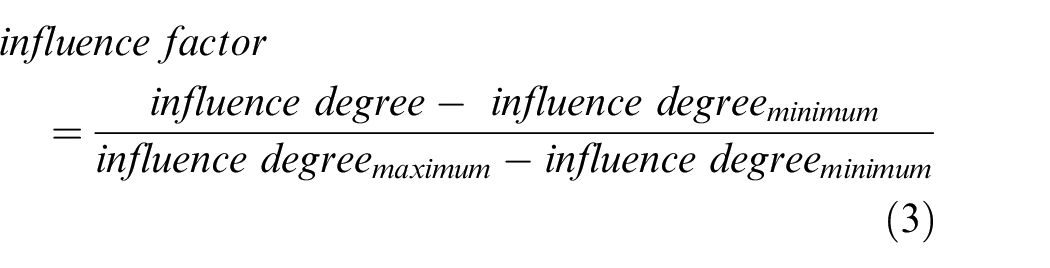
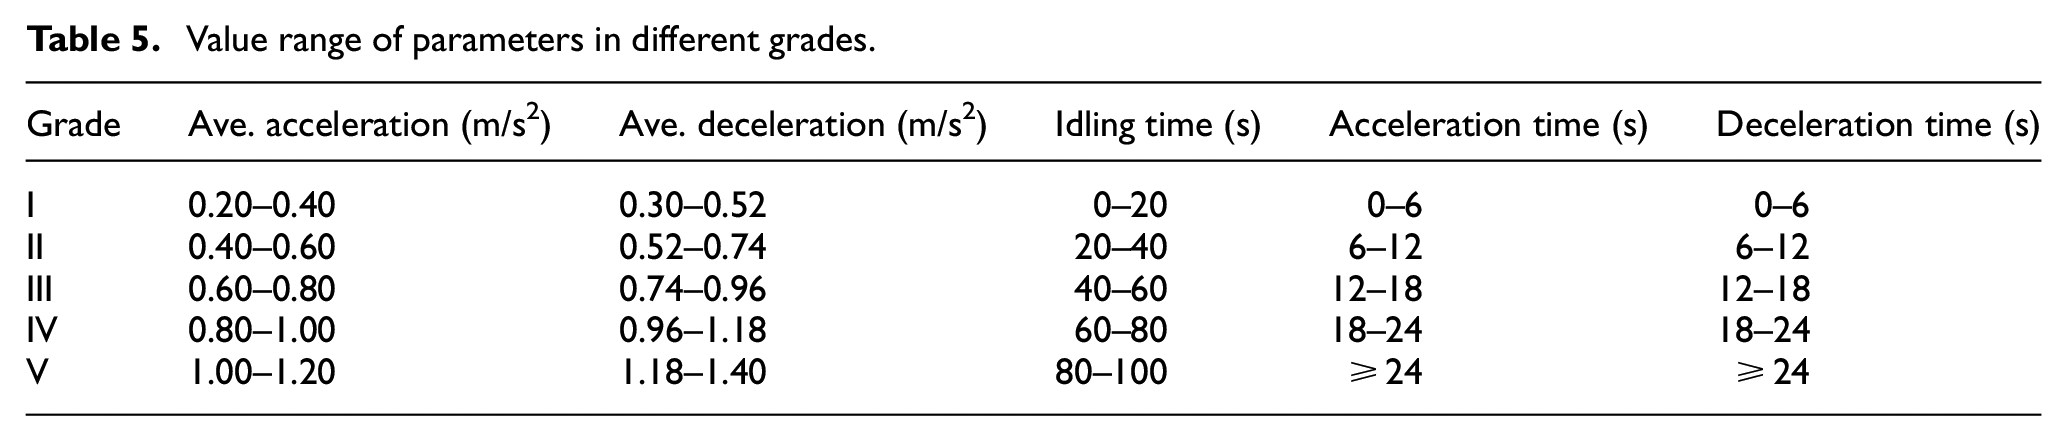
Considering the different generation mechanisms of THC, CO, NOx, and particulate matter, the effect of ISG system on emissions cannot be evaluated accurately only by idling time. Thus, five parameters were used to represent the characteristics of idling phases, namely, average accelerated speed, average decelerated speed, idling time, acceleration time, and deceleration time. Each parameter was classified into five grades on the basis of its value, as listed in Table 5, and the influence degree of ISG system among different parameters and grades was normalized by the following equation (3):
Value range of parameters in different grades.
where
Figure 6 shows the change in the normalized influence factor with the grades of idling phase parameters, where the normalized factors of THC, CO, and NOx are the mean value of two test vehicles, and that of solid PN is the respective result of GDI-1 and GDI-2, considering the impact of GPF on PN emissions. Figure 6(a) and (b) illustrate that the influence of ISG system on THC and CO emissions is mainly related to accelerated speed and idling time. With the increase in accelerated speed and reduction in idling time, ISG tends to increase THC and CO emissions, among which idling time has a more significant effect. There is no consistent trend between the normalization factor and idling time for NOx emissions according to Figure 6(c), but it is noted that the rise in both accelerated speed and decelerated speed would make the influence factor decrease at first and then increase. On the basis of Figure 6(d) and (e), for GDI-2, the change in phase parameters is more sensitive to the influence of ISG system on solid PN emissions compared with GDI-1. However, accelerated speed plays a critical role in the effect of ISG for both vehicles, even though they possess different after treatment devices.
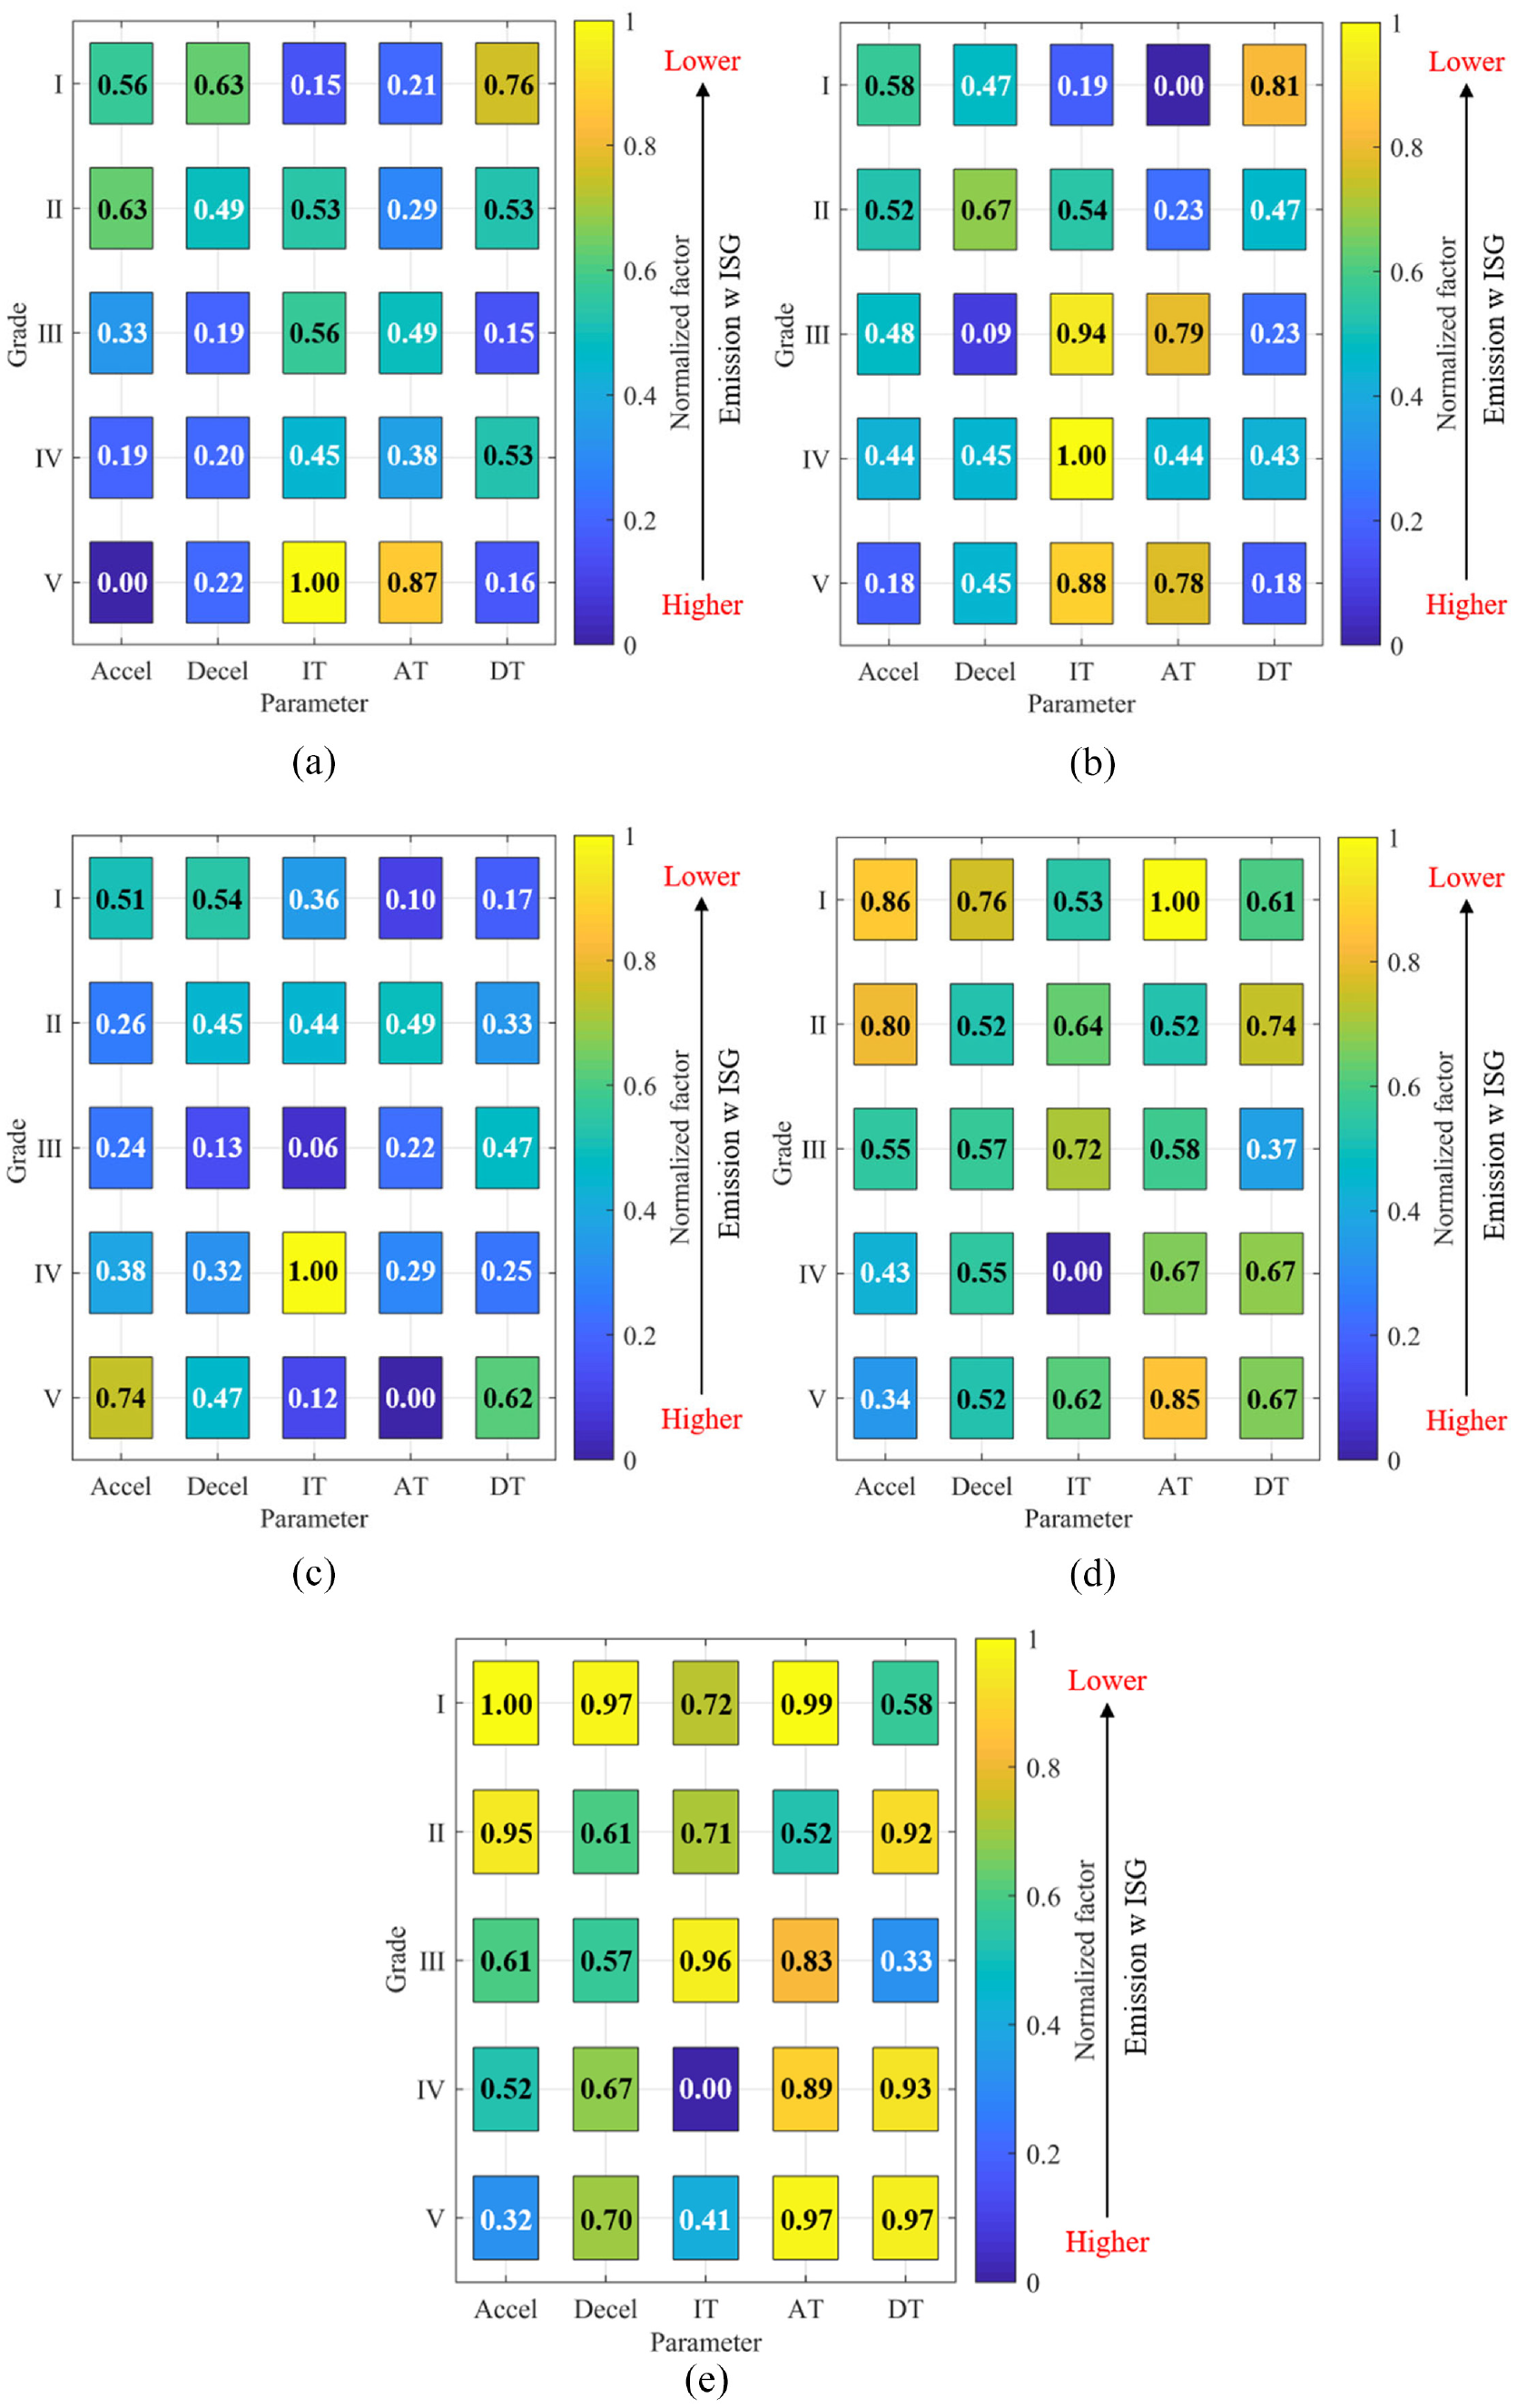
Changes in the normalized influence factor for different emissions: (a) THC, (b) CO, (c) NOX, (d) PN-GDI-1, and(e) PN-GDI-2.
Furthermore, to clarify the specific correlation between the influence of ISG and phase characteristics, the results of 28 idling phases are depicted in Figures 7 and 8, where only the typical phase parameters were analyzed (e.g. accelerated speed and idling time for THC and CO, accelerated speed for solid PN).
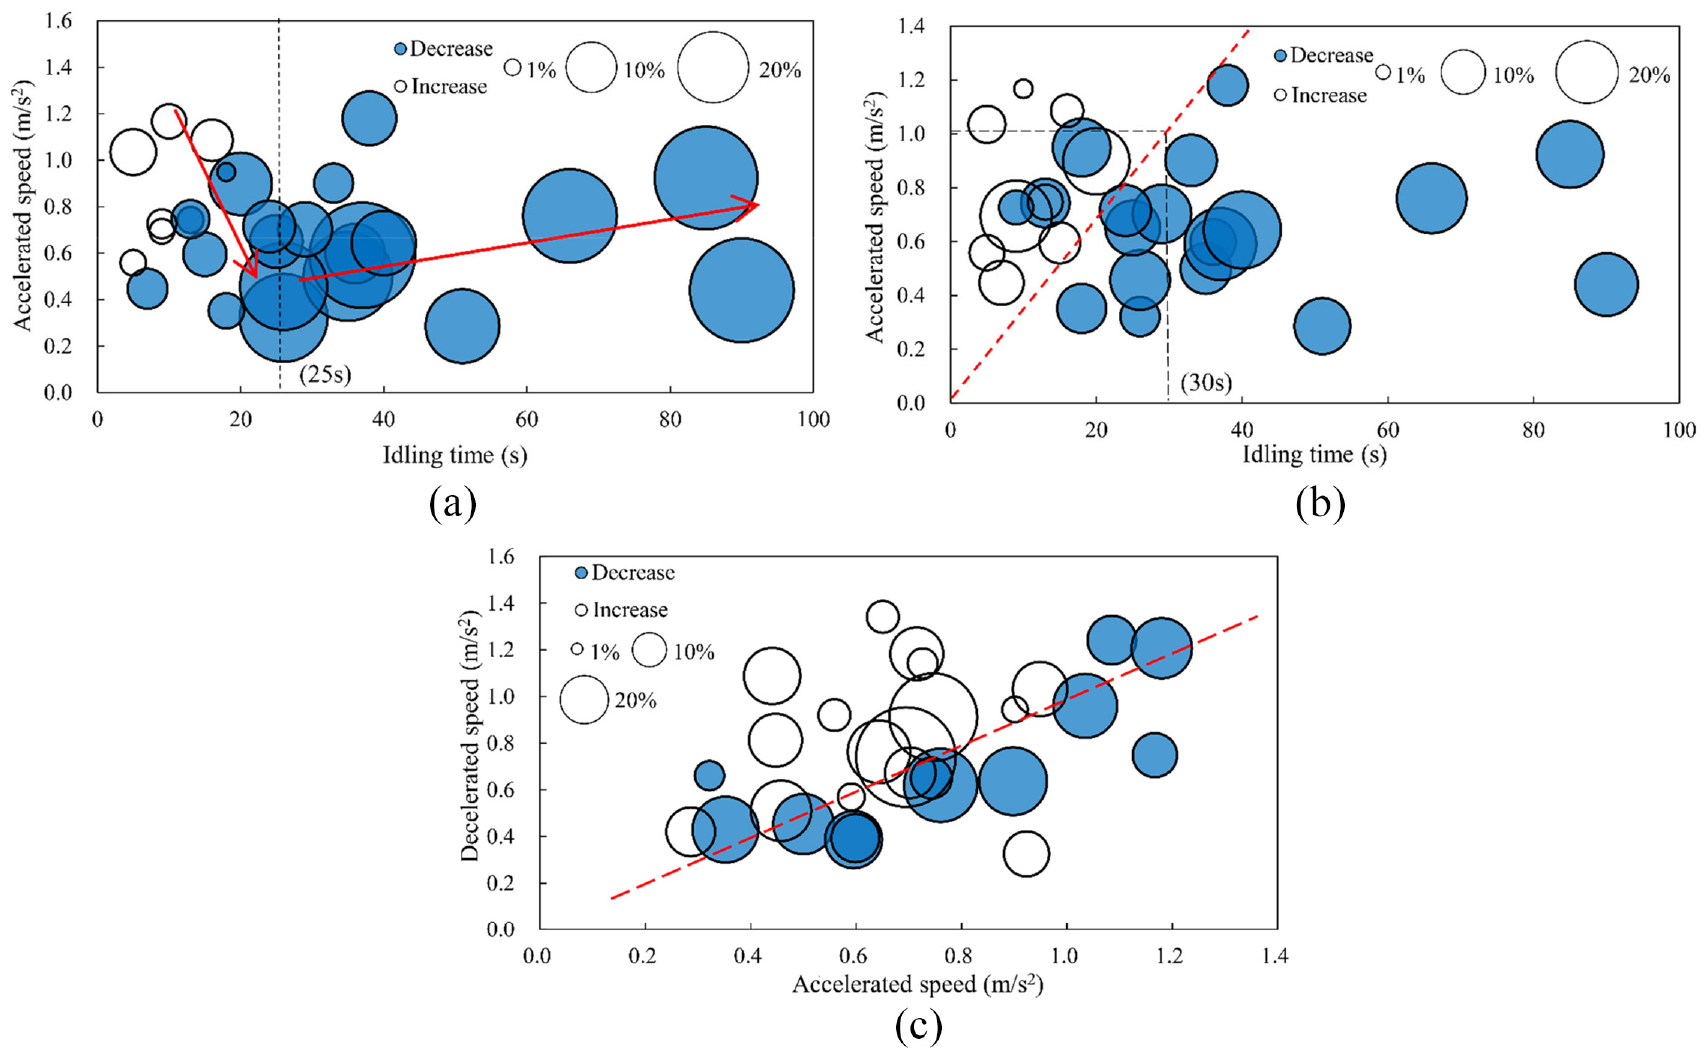
Relationship between changes in gaseous emissions and typical phase parameters: (a) THC, (b) CO, and (c) NOx.
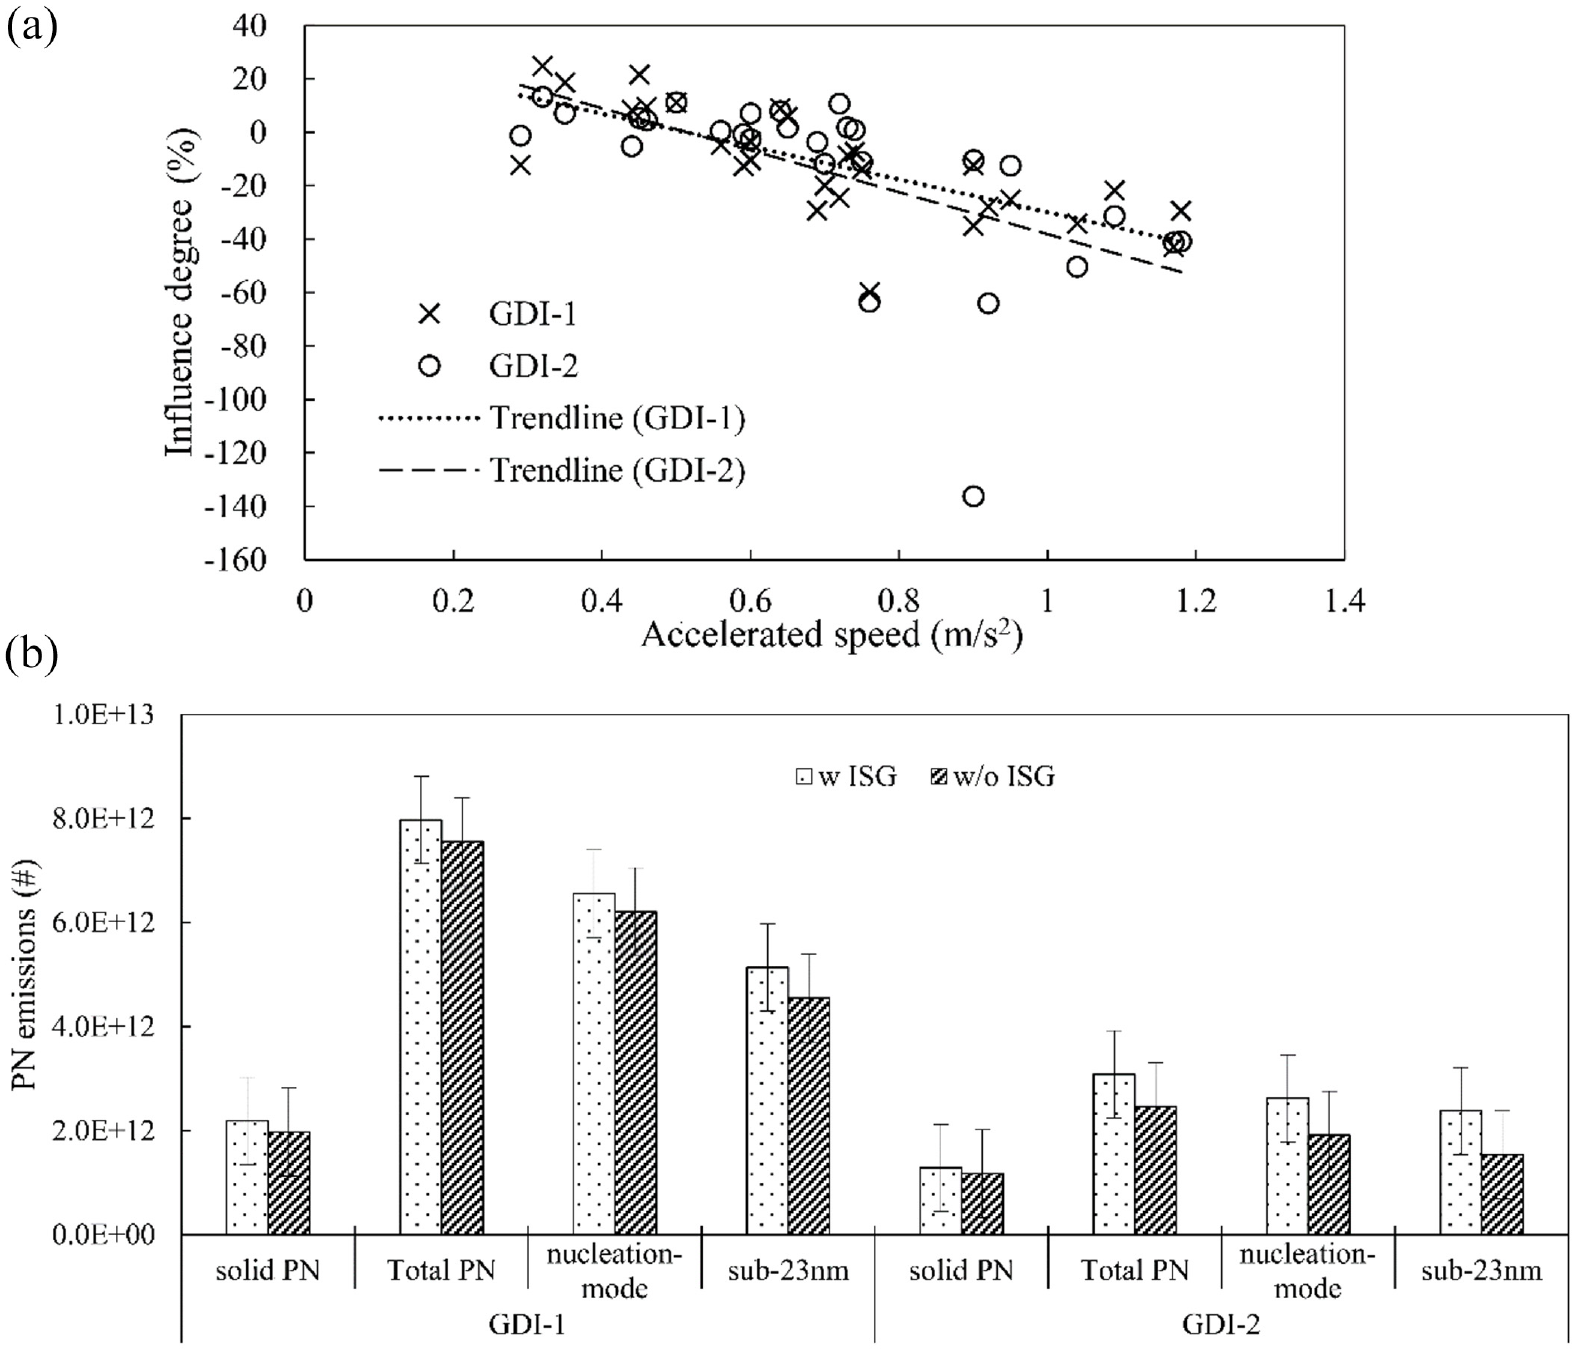
PN emissions under “w ISG” and “w/o ISG” conditions: (a) influence variation of ISG system on solid PN emissions with acceleration and (b) solid PN, total PN, nuclear-mode PN, and sub-23 nm PN emissions of test vehicles.
The influence degree of ISG system on THC, CO and NOx emissions is shown in Figure 7, in which each circle represents an idling phase and the blue circle means that ISG system is conducive to reducing emissions, while the hollow circle is the opposite. The size of the circle reflects the emission differences between the w and w/o ISG conditions; the larger the circle, the larger the difference. On the whole, the idling phases in this paper are mainly distributed in a range of idling time from 10 to 40 s and accelerated speed between 0.4 and 0.8 m/s2.
The influence degree of ISG system on THC emissions is shown in Figure 7(a), the average influence degrees of the two test vehicles vary from −6.8% to 44.4%, and it is obvious that the idling phases can be separated into two parts at idling time of 25 s. As the left arrow illustrates, accelerated speed plays a dominant role in the influence of ISG system when the idling time is less than 25 s. However, the effect of idling time seems to be more significant than accelerated speed on the right part. After employing ISG system, the THC emissions become better as the idling time exceeds 25 s and continues to increase, even though the accelerated speed increases, which is mainly because the oxygen stored in the exhaust pipe effectively promotes the oxidation of unburned THC.
Changes in CO emissions before and after using ISG are displayed in Figure 7(b), where the dotted red line divides these idling phases into two parts. In the upper part, ISG system is thought to more easily increase CO emissions, which has the worst result at approximately −26.2%, and the lower part is the opposite, with the best result at approximately 30.7%. Therefore, an intuitive conclusion could be drawn that ISG system can reduce CO emissions when its operation condition located in the lower part. For example, an engine stop is probably helpful to reduce CO emissions if idling time is more than 30 s when the accelerated speed is 1.0 m/s2. Notably, an idling time that is too long may lower the exhaust pipe temperature and then decrease the catalyst efficiency, 38 leading to the deterioration of emissions, but this was not observed in this study.
Figure 7(c) shows the influence degree of ISG system on NOx emissions with different accelerated speed and decelerated speed. In general, the in-cylinder temperature, air-fuel ratio and reaction time are deemed to be key factors affecting NOx emissions; therefore, the changes of influence degree at different accelerated speed can be explained as follows. At first, under “w ISG” conditions, a lower in-cylinder temperature inhibits the generation of NOx emissions when accelerated speed is low, which can also balance the low conversion efficiency of the catalytic converter. 39 Then, with the increase of accelerated speed, the extra fuel injection aiming to keep the engine starts normally, leads to a high in-cylinder temperature, and the effect of λ > 1 exacerbates NOx emissions. Finally, the fuel-rich resulting from high accelerated speed will offset the effect of λ > 1 during the idling process, and will reduce NOx emissions under “w ISG” conditions. The effect of decelerated speed is mainly related to λ > 1 caused by deceleration process. According to Figure 7(c), ISG system seems not to be conducive to reducing NOx emissions at the part above the red dotted line, but it shows the opposite trend below the line. In short, it can be concluded that NOx emissions under the “w ISG” condition tend to deteriorate with the reduction of accelerated speed and an increase in decelerated speed compared with those under the “w/o ISG” condition.
As illustrated in Figure 8(a), for both test vehicles, the influence degree of ISG system on solid PN emissions has a downward trend with increasing accelerated speed, and it seems to be more obvious for GDI-2. Specifically, the best influence degrees occurred in phase 1, with an accelerated speed of 0.32 m/s2, obtaining an approximately 24.8% and 13.2% reduction in solid PN emissions for GDI-1 and GDI-2. While the worst results occurred in phase 12 for GDI-1 and phase 8 for GDI-2, increasing solid PN emissions from 1.01 × 10¹¹ to 1.62 × 10¹¹ and 4.01 × 10¹¹ to 9.47 × 10¹¹, respectively. However, the extra solid PN emissions were at least an order of magnitude lower than those from a cold start. 40 Figure 8(b) depicts the variations in solid PN, total PN, nucleation-mode PN and sub-23 nm PN emissions after employing ISG system, considering all idling phases. It can obviously be seen that under the “w ISG” condition, the solid PN, total PN, nucleation-mode PN, and sub-23 nm PN increase by 10.7%, 5.5%, 5.6%, and 12.9% for GDI-1 and 9.4%, 25.0%, 37.0%, and 55.0% for GDI-2, respectively. The nucleation-mode PN accounts for a great scale of the total PN emissions measured by EEPS, which is similar to the results of Su et al. 41 After the application of ISG system, the proportion of nucleation-mode PN in the total PN emissions has no prominent change for GDI-1, but the change is noteworthy for GDI-2, increasing from 77.6% to 85.0%. The proportion of sub-23 nm in total PN emissions increases from 60.2% to 64.5% for GDI-1%, 62.2%, and 77.1% for GDI-2. It can be deduced that ISG system may increase the proportion of nucleation-mode PN, as well as sub-23 nm PN, which is more significant for vehicles equipped with GPF.
Conclusions
In this work, fuel consumption, CO, THC, NOx, and PN emission characteristics were measured on two GDI vehicles equipped with ISG system over WLTC, CLTC, and FTP-75 test cycle under hot start conditions. There are 28 idling phases selected to evaluate the influence of ISG system on fuel economy and emission performance specifically. The test cycle results revealed that ISG system can improve fuel economy by 3.6% and decrease THC, CO emissions by 10.2% and 6.2%, respectively, while NOx and solid PN emissions increase by approximately 7.0% and 4.5%, respectively. The idling phase results show that the influence of ISG system on fuel economy is mainly related to the idling time and ISG system is not providing a positive contribution on fuel consumption when idling time is below 5.9 s. Accelerated speed and idling time are considered as the key parameters affecting THC and CO emissions of idling phases. The influence of ISG on THC emissions primarily depends on accelerated speed when the idling time is less than 25 s. If the accelerated speed is 1 m/s2, it takes at least 30 s of an engine stop time to compensate for the extra CO emissions emitted during the restart process. The increase in accelerated speed and decrease in decelerated speed seem to be conducive to reducing NOx emissions. The solid PN emissions increase with the rise of accelerated speed. After employing ISG system, the sub-23 nm PN emissions of idling phases increase by 12.9% and 55.0% for GDI-1 and GDI-2, while the proportion of nucleation-mode PN and sub-23 nm PN also increase.
The findings of this study have great significance for automobile manufacturers and environmental departments. On the one hand, it can help developers complete the design of ISG system control strategies according to different aims, such as improving fuel economy or decreasing PN emissions. On the other hand, it can assist officers in refining the policy or recommended guidelines for controlling idling. However, this research has several limitations. We employ laboratory test cycles to reflect the real driving conditions as much as possible, and mainly obtained some qualitative conclusions. To perfect our findings and obtain more accurate quantitative results, road investigations and real driving emissions (RDE) tests must be performed in the future.
Supplemental Material
sj-docx-1-pid-10.1177_09544070221121868 – Supplemental material for Effect of idle-start-go on the economy and emissions of gasoline vehicles
Supplemental material, sj-docx-1-pid-10.1177_09544070221121868 for Effect of idle-start-go on the economy and emissions of gasoline vehicles by Zhiyuan Hu, Zhuo Wang, Zhangying Lu, Jiaming Fu and Yifeng Quan in Proceedings of the Institution of Mechanical Engineers, Part D: Journal of Automobile Engineering
Footnotes
Appendix
Declaration of conflicting interests
The author(s) declared no potential conflicts of interest with respect to the research, authorship, and/or publication of this article.
Funding
The author(s) disclosed receipt of the following financial support for the research, authorship, and/or publication of this article: This work was financially supported by National Key Research and Development Program of China (2017YFB0103405) and Project of Shanghai Automobile Industry Science and Technology Development Fund (1750).
Supplemental material
Supplemental material for this article is available online.
References
Supplementary Material
Please find the following supplemental material available below.
For Open Access articles published under a Creative Commons License, all supplemental material carries the same license as the article it is associated with.
For non-Open Access articles published, all supplemental material carries a non-exclusive license, and permission requests for re-use of supplemental material or any part of supplemental material shall be sent directly to the copyright owner as specified in the copyright notice associated with the article.