
Abstract
More than 90% of traffic accidents are caused by driver behavior, with lane change behavior being a major contributor. Recently, driving assistance systems are being introduced on vehicles to reduce traffic accidents, and a reliable vehicle lane change collision detection system is a key component of these systems. Besides, the foundation of the vehicle lane change detection system is the effective vehicle lane change detection model. In this paper, based on the support vector machine, we propose a model for detecting driver lane change maneuvers and take into account the real-time vehicle dynamic features transmitted via Vehicle to X (V2X) Communication. The accuracy is ideal for lane keep and lane change situations, and it is also robust for zigzag driving situations, according to tests conducted using the NGSIM real traffic dataset. The detection accuracy for left and right lane change maneuvers is 97.5% and 99.09%, respectively, while the false alarm rate is 8.56%. Additionally, the average advance detection time is 1.7 s, which is suitable for actual driving application scenarios.
Keywords
Introduction
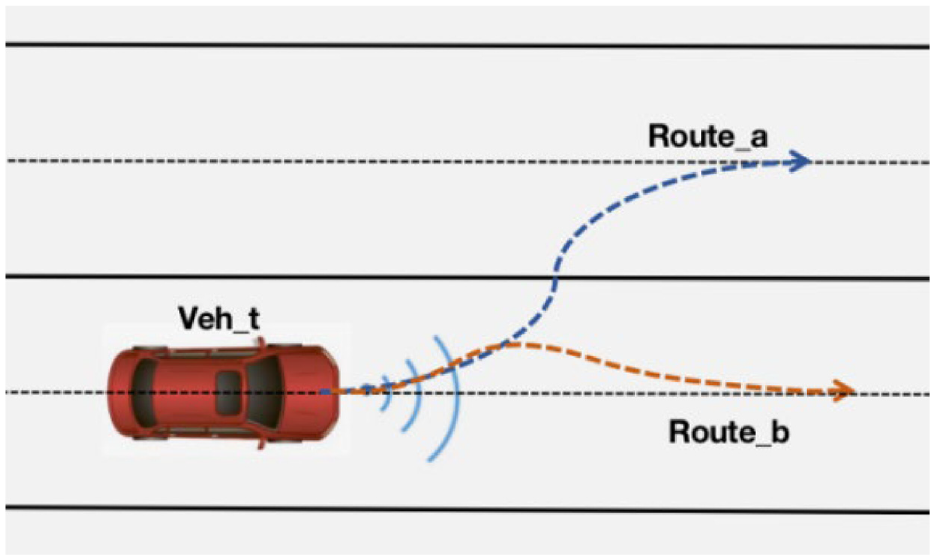
Lane change is one of the most common vehicle operations, and erroneous lane change behaviors are responsible for many traffic accidents. As shown in Figure 1, the lane change behavior of Veh_a or Veh_b could lead to a collision with Veh_t. To reduce lane change accidents, it’s necessary to evaluate the safety of the operation as early and accurate as possible before the driver carries out it, which necessitates the development of a driving assistance system. Moreover, the future Intelligent Transportation System (ITS) will depend heavily on driving assistance systems.
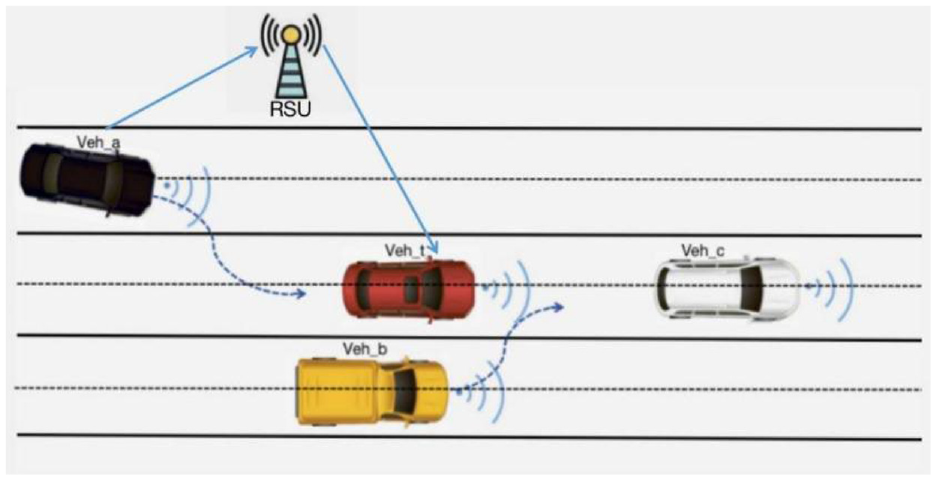
Vehicle lane change situation.
Driving assistance systems are currently being developed and researched widely. Making decisions about the current driving situation by detecting the driver’s lane change maneuver to assist the driver is one of the tasks. 1 Advanced Driver Assistance Systems (ADAS), for example, use various sensors installed on vehicles, such as camera, radar, laser, and other sensors, to collect data such as vehicle information and surrounding driving environment data, including static and dynamic objects, allowing drivers to make the best decision possible in a short amount of time while driving and reducing accidents.
However, predicting lane change maneuvers is extremely difficult due to the unknown factors of driver behavior and driving environment. For example, one main challenge faced by many experiments is how to accurately predict drivers’ maneuvers in the case of zigzag driving. As zigzag driving will lead to many false alarms, which will affect the driver’s driving experience and reduce their confidence in the system. However, as far as we know, most related works do not clearly point out this problem and put forward solutions.
In addition, in a highly dynamic environment, the earlier the maneuver is detected, which means that the driver is given more time to respond to the event and adjust the vehicle trajectory. Therefore, it is not difficult to see that the driving maneuver detection system has to meet the requirements of detection time and detection accuracy at the same time. However, there is a contradiction between detection time and detection accuracy. For example, if you want to pursue higher detection accuracy, you need to sacrifice detection time. Therefore, the difficulty in the field of lane change maneuver detection is how to reduce the false alarm rate on the premise of ensuring the detection time as much as possible, which is also the research key of our work.
From a safety perspective, this study aims to contribute to this growing field of research by predicting vehicle lane change maneuvers based on Basic Safety Messages (BSM) sent by vehicles via Dedicated Short Range Communication 2 (DSRC). Based on the traditional SVM multi classification theory, we introduce the Platt scaling theory to map the decision results of SVM into probability. By setting the threshold, we can reduce the false alarm rate on the premise of ensuring the detection time. We use real-time vehicle dynamic features related to lane change behaviors as a reference to calculate the probabilities of the following three maneuvers: left lane change (LLC), right lane change (RLC), and lane keep (LK).
The contributions of this paper can be summarized as follows: A probability-based method is used to estimate driving behavior which can effectively reduce the false alarm rate, at the same time, the detection time is guaranteed. Features from BSM are used. On the one hand, fewer features (only features of vehicle are required, lane features are not required). On the other hand, we can detect the driving maneuver of surrounding vehicles at the same time, based on V2X, which can realize information interaction.
The remainder of this paper is organized as follows. Section 2 describes related work, Section 3 describes the vehicle lane change maneuver detection model, Section 4 describes the NGSIM dataset and data processing method, Section 5 conducts experiments and analyzes the results, and Section 6 states the conclusions.
Related work
Vehicle lane change maneuver detection systems have been extensively researched as an important component of the driving assistance system. Considerable amount of research has focused on this issue. The detection of lane change maneuvers could be divided into two stages: data collection and maneuver detection.
Data collection
As numerous factors contribute to the uncertainty of driving behavior, it is necessary to collect and analyze data from a variety of sources, including vehicle dynamic characteristics, the driving environment, and even the driver’s behavior, to improve the detection rate of vehicle lane change behavior.
When a vehicle changes lanes, the dynamic characteristics of the vehicle change. Better detection results can be obtained by carefully selecting dynamic characteristics related to lane change behavior. Therefore, factors found to be influencing lane change have been explored in several studies. On-board sensors, such as speed sensors, GPS, and steering angle sensors, are commonly used to collect vehicle dynamic information. Daimler researchers Schlechtrieme 3 evaluated 22 lane change factors and found out the most representative three factors: speed, lateral displacement, and lateral speed. In Xu et al. ’s work, 4 Speed, acceleration, and the duration of peak acceleration are measured using an accelerometer, gyroscope, and GPS. Besides, Qiu 5 used the steering wheel angle sensor and speed sensor to get the steering wheel angle and speed.
Furthermore, some research recognizes the critical role played by the driving environment or the driving behavior of nearby vehicles. The emergency braking of the vehicle ahead, for example, causes the vehicle behind it to change lanes to avoid colliding. The vehicle is equipped with a long-range radar, two short-range radars, and two cameras. Besides, Schubert 6 used the camera to determine the vehicle’s position on the road and used the radar to determine the distance between the vehicle and the surrounding vehicles. In Mccall et al.’s work, 7 information about the vehicles’ surroundings is gathered using forward, rear, and side viewing rectilinear cameras, as well as an omnidirectional camera that provides a 360° view.
Currently, the information about the driving environment is collected by installing sensors on the vehicle as a method of collecting dynamic data (such as laser, millimeter-wave radar, etc.). However, using sensors in this situation has cost and coverage limitations, as it is both costly and impractical to install fixed sensors throughout the entire road network. As a result, data for areas where sensors are not installed cannot be collected.
What’s more, considering that the driver is the originator and executor of lane change behavior, compared with the vehicle dynamic features, the driver’s behavior features, such as swinging the head and turning the eyes, contains early information reflecting the driver’s intention to change lanes. Salvucci 8 introduced a simplification of a previously-validated computational model of driver behavior to simulate a set of possible driver intentions and their resulting behaviors. The driver’s foot actions were captured using a near-IR camera, while the driver’s face and hand movements were captured using a camera facing the driver. 7 Eye movement was used as the main feature to detect lane change maneuver.9,10 However, due to the limitations of the physical characteristics of the eyes, the small scale, it is difficult to accurately detect and track the eyes, and the robustness in practical applications is poor.
Maneuver detection
Many algorithms for detecting lane change maneuvers have been developed in recent years. Among them, the pattern-based method, which is based on vehicle dynamic information or driver behavior information collected in the sensor, has achieved outstanding results. It primarily uses the machine learning method to detect lane change events from data by observing their mode. As a result, there are two types of methods for detecting lane change behavior: traditional machine learning methods and deep learning methods.
As a small sample learning method, SVM is applied in the field of driving intention detection. Considering that lane changing is a continuous process, Mandalia 11 trained SVM for lane change detection using the variance of vehicle speed and steering angle. The detection precision is 97.9%. Izquierdo 12 trained SVM by using lateral position and lateral velocity as features, but the problem of false positives has not been solved effectively. In addition, Hou 13 modeled lane changes behavior using a Bayesian classifier and a decision tree method, the prediction accuracy of merge events is 79.3%. In Cheng et al. ’s work, 14 a K-ELM (kernel extreme learning machine) based decision-making method was proposed for mandatory lane changes, and simulation results show that it can generate the lane change decision with a 92.86% accuracy for merge events. Jin 15 used the continuous hidden Markov model to predict lane change behavior, the predicted accuracy of left and right lane changes are 84% and 88%, respectively.
In addition, image processing techniques for lane and vehicle detection are used to perceive the vehicle’s environment and assess the traffic situation, Naive Bayes model is used to predict the lane change behavior, 3 the accuracy rate is close to 90%. However, recognition accuracy cannot be used as the sole criterion for evaluating the model, because detection time is also an important factor in real-world applications, with higher detection accuracy expected sooner after the maneuver. The use of image processing techniques is limited by the environment; for example, in low visibility, its reliability is uncertain. We, on the other hand, communicate using V2X technology. V2X Communication delay can reach 100 ms in a complex electromagnetic environment, which is still acceptable for real-world traffic scenarios.
In recent years, with the development of image processing technology and computer hardware, the neural network has been widely used and made tremendous achievements in the deep learning area, such as image classification and object detection domains. Therefore, the neural network is also used to describe the complex relationship of factors affecting lane change behavior. Liu 16 used the Deep Neural Network (DNN), and results show that the model has excellent recognition accuracy, while requiring 0.77 s of detection time.
As lane change behavior is a continuous behavior, RNN is applied to study the timing information. In Jain et al.’s work, 17 the architecture consists of Recurrent Neural Networks (RNNs) that use Long Short-Term Memory (LSTM) units to capture long temporal dependencies, which can anticipate maneuvers 3.5 s before they occur with a precision and recall of 90.5% and 87.4%, respectively. Similarly, Ou 18 used deep recurrent neural networks were used to fuse the information regarding driver observation actions and the driving environment. Tang 19 proposed a method based on Multi-LSTM to predict lane change intention. The results show that the maximum prediction accuracy can reach 83.75%.
Based on the BSM from DSRC, this paper proposes an SVM-based vehicle lane change maneuver detection method that takes into account the vehicle’s real-time dynamic features. The model’s detection accuracy for left and right lane changing behavior is 97.5% and 99.09%, respectively, and the false alarm rate is 8.56%, according to experimental results using the NGSIM dataset, indicating that it has some robustness for zigzag driving situations. In addition, the average advance detection time of 380 vehicles is 1.7 s, which is consistent with real-world driving situations.
Vehicle lane change maneuver detection model
Evaluating the lane changing maneuver is a complex task, due to human subjective maneuver and differences in driving environments, how to effectively reduce the false alarm rate is an important problem in maneuver detection. Our vehicle lane change maneuver detection model considering real-time vehicle dynamic features from V2X communication is realized by the support vector machine. We formulate the lane change maneuver detection problem as a multi-class classification problem with the three following maneuvers: left lane change (LLC), right lane change (RLC), and lane keep (LK). Unlike the traditional SVM theory, in this work, we map the SVM classification result into possibility according to Platt scaling theory, which effectively reduces the false alarm.
V2X communication
V2X is an impressive platform. Vehicles, drivers, automatic driving systems, roadside sensors, traffic management, and other transportation entities can all be integrated. The information acquirer can understand a wider range of traffic conditions by sharing valuable traffic information among different traffic participants, which helps the driver or automatic driving system respond to the traffic situation earlier and faster.
We conduct experiments and modeling in this study using the DSRC, which includes two kinds of wireless communication units: on-board unit (OBU) and roadside unit (RSU). OBU is a vehicle-mounted communication device. It has a CAN interface that allows data to be sent to the in-vehicle network. RSU is a DSRC system that is installed near the road and has a high transmission power, allowing for a long transmission range and traffic broadcasting. DSRC has designated a 75 MHz bandwidth in the 5.9 GHz frequency band as its exclusive traffic safety spectrum. As shown in Figure 2, the 75 MHz bandwidth is divided into seven channels.
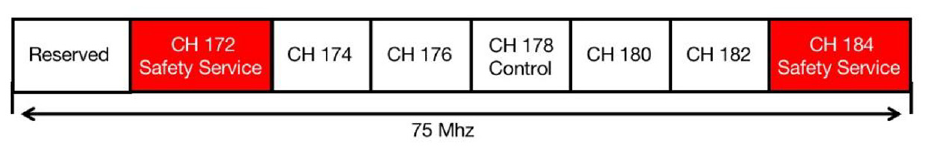
Division of DSRC channels.
At a frequency of 10 times per second, each vehicle will interact with DSRC basic safety messages (BSM) on channel 172. Each piece of basic safety information is divided into two parts. The first part of the data is required, and it includes the vehicle’s location, speed, direction, angle, acceleration, braking system status, and size. Optional information, such as anti-lock system status, historical path, sensor data, steering wheel status, and so on, is included in the second part. In addition to BSM, emergency information will be broadcast with a higher priority on channel 184. The data provided in BSM is the basis for our experiment.
Model training and classification
We presumed the vehicles are equipped with V2X communication technology capable of providing real-time dynamic data. Using the information in the BSM, a fair selection of feature parameters relevant to lane change maneuvers, such as lateral dynamic, yaw angle, turn signal, and other features can help the SVM have a better detection impact. In this work, we started from a variety of features related to lane change, using different feature combinations as feature vectors and conducting experiments to compare the classification performance. Finally, we chose vehicle lateral dynamic features and vehicle yaw angle as reference features to form a real-time feature vector
Based on the principle of minimizing structural risk, the support vector machine is a linear classifier that finds the largest interval in the feature space. Taking the linear binary classification problem as an example, as shown in Figure 3, “+” and “−” represents two types of samples. SVM needs to find a hyperplane (in two-dimensional space, it is a line) to separate the two types of samples, but there are many hyperplanes that can divide the training samples. Intuitively, we should find the hyperplane in the middle of the two samples, as the partition hyperplane has the best tolerance to the local disturbance of training samples. The mathematical expression is:
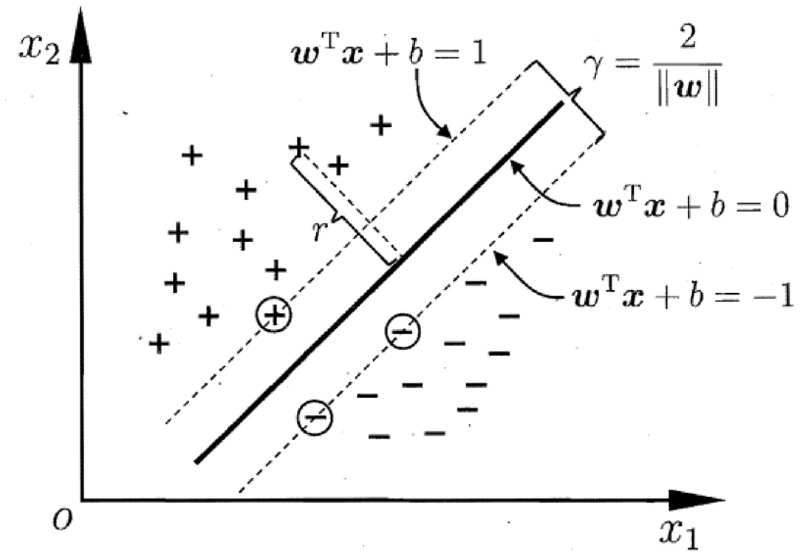
Hyperplane and interval.
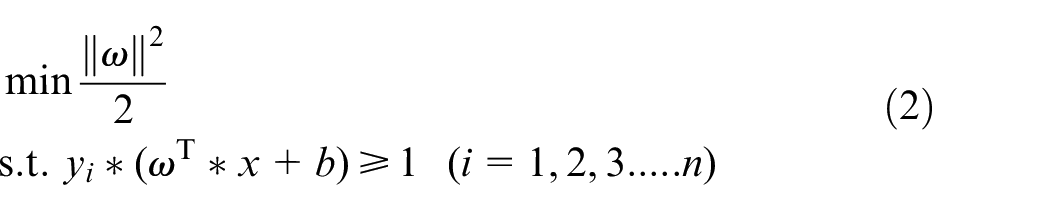
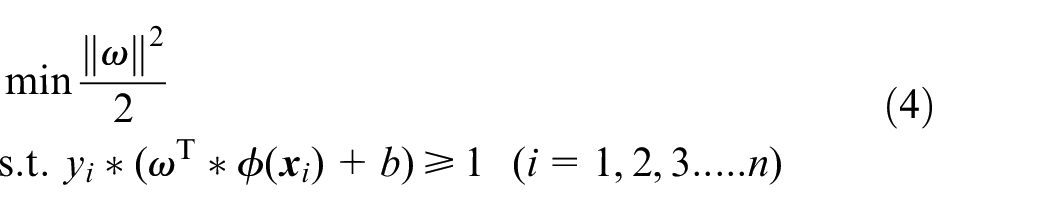
The learning strategy is to maximize the interval, so the problem of finding the optimal hyperplane can be transformed into a convex quadratic programming problem under the constraints of conditions shown in equation (2).

where
However, due to the influence of human factors and environmental factors, the changes of vehicle dynamic parameters will be complicated, which makes the samples non-linearly separable in the low space. Therefore, it is necessary to map features to a high-dimensional space to achieve linear separability by introducing the Lagrange multiplier and using the mapping function

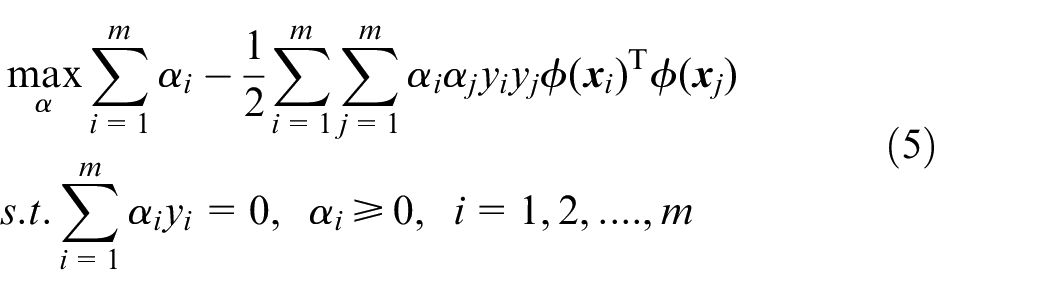
To solve the convex quadratic programming problem, the “dual problem” of equation (4) can be obtained by introducing the Lagrange multiplier to construct the Lagrange function. Through the partial derivative of ω and
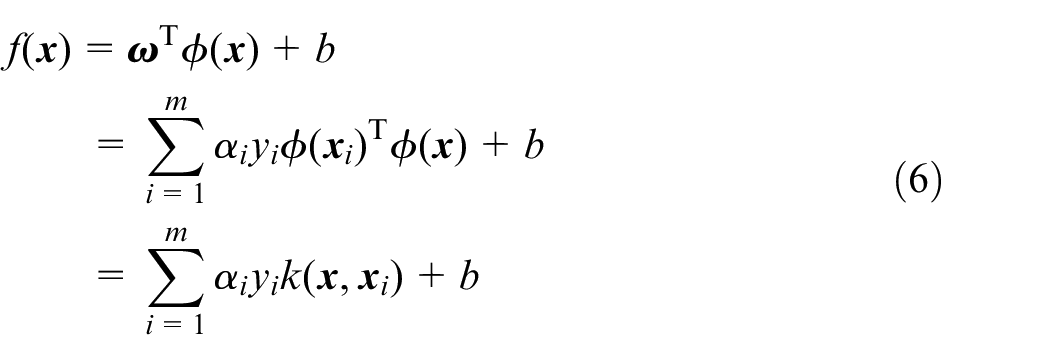
After solving the Lagrange multiplier in equation (5), calculate ω and b, and the model can be obtained, as shown in equation (6).
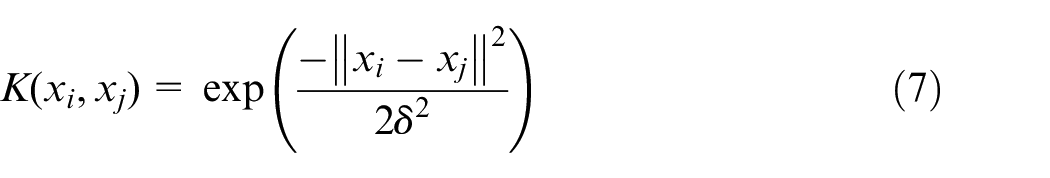
The kernel function
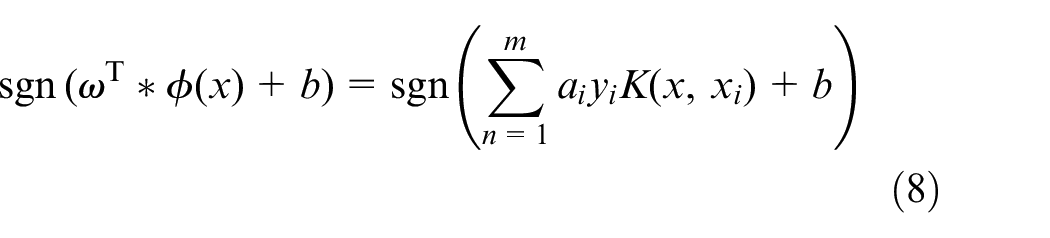
However, the results obtained by this method are not ideal as the traditional classification method deals with the output of SVM by sgn function as shown in equation (8), which only shows the target value for classification without probability information. The idea is that the closer the point is to the interface, the less likely it is to divide pairs; The farther away from the interface, the more likely it is to be paired. As a result, it has a high false alarm rate for lane change behavior. Therefore, we hope to reduce the false alarm rate by mapping the output result of SVM to probability.
Platt 20 uses the sigmoid fitting method to fit a logistic regression model to the classification score. We use this method to post-process the output results of the standard SVM and convert them into probability, as shown in equation (9).
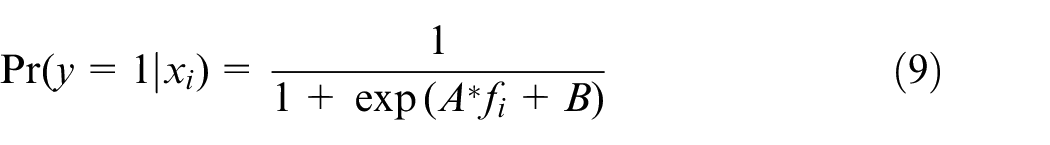
where
Dataset and data processing method
The data processing process is shown in Figure 4. The blue box shows the data categories contained in the original data of NGSIM. 21 Section 4.1 introduces NGSIM dataset. The data processing process is divided into two steps. One step is to calculate and extract relevant features to construct feature vectors. As shown in the orange box below, the feature comparison diagram before and after filtering is shown. Section 4.2 introduces the specific feature selection. The other step is to label samples according to the trajectory. As shown in the orange box above, it is the vehicle trajectory extracted from NGSIM dataset. e Section 4.3 introduces the specific label method.
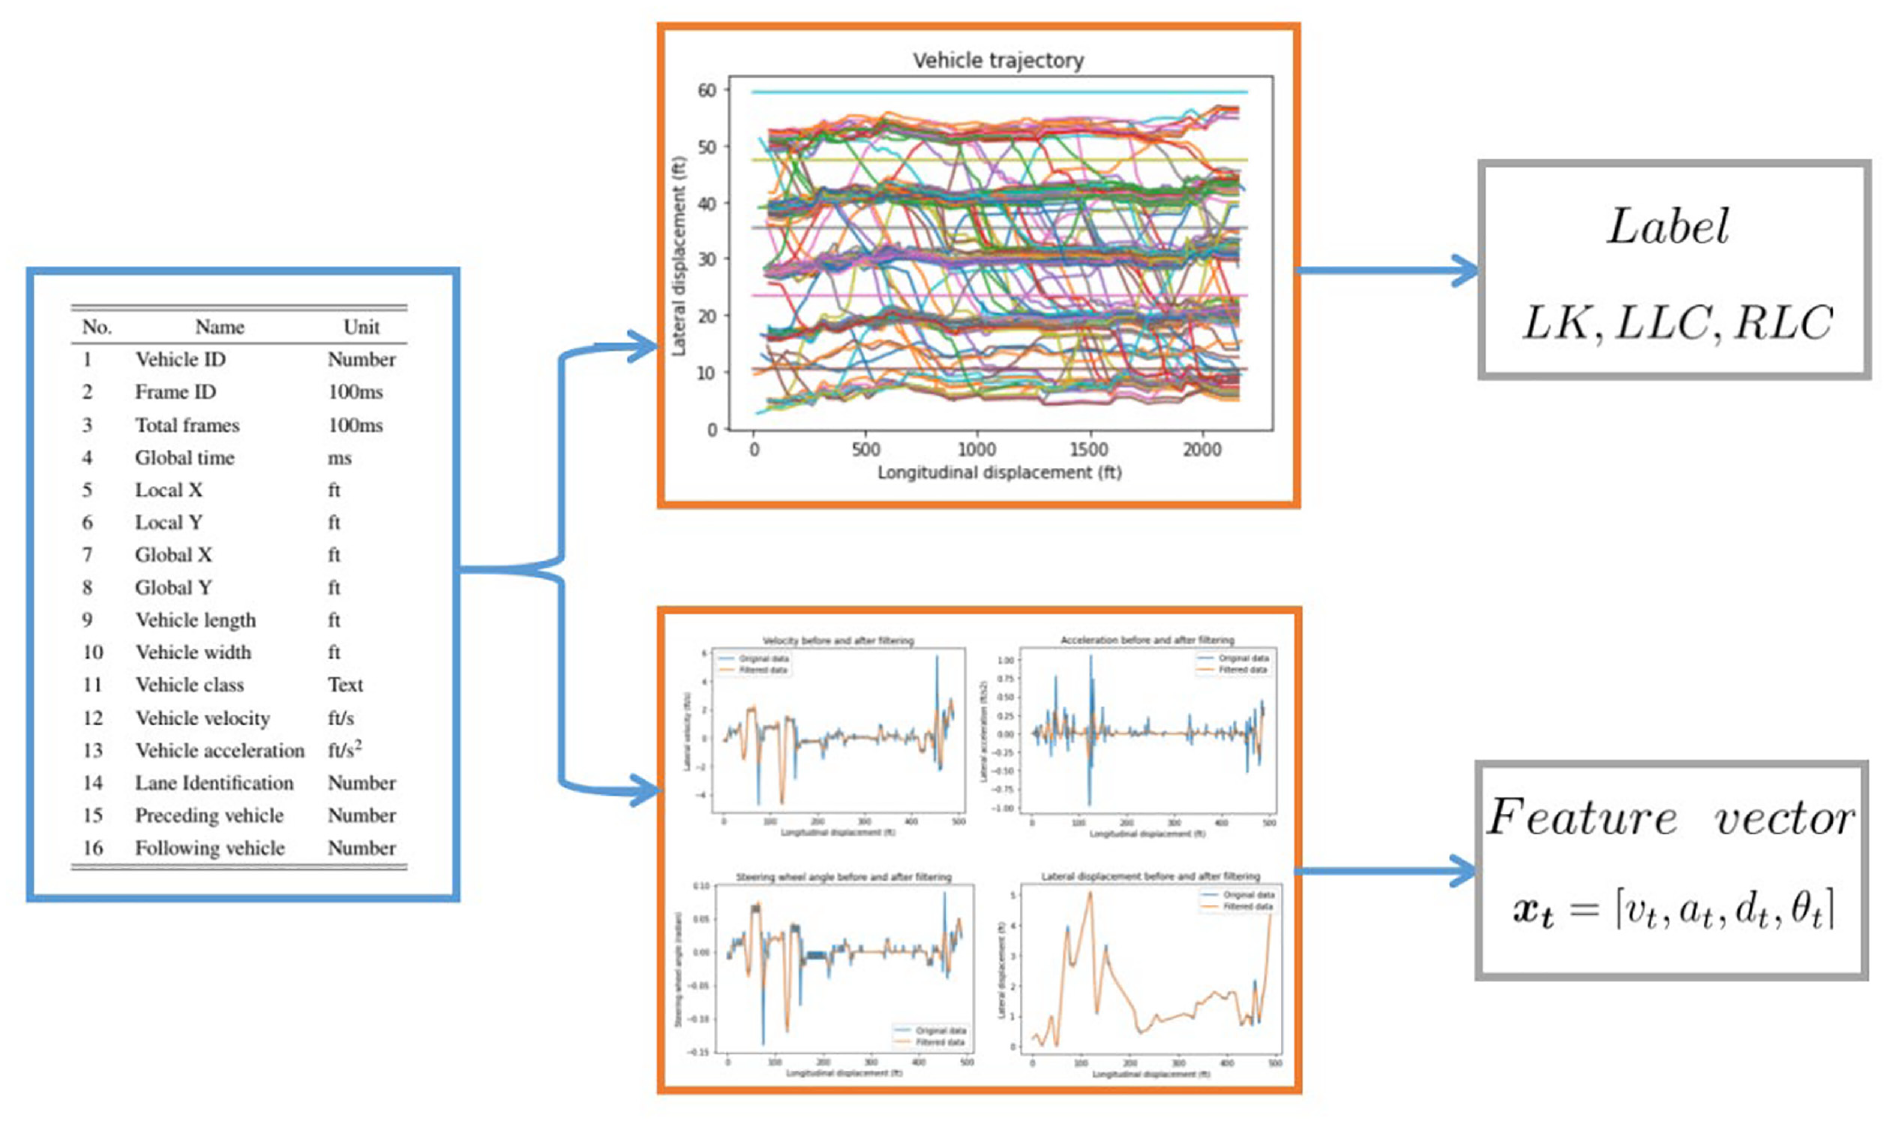
Data processing process.
NGSIM dataset
The SVM classifier is trained and tested using the NGSIM dataset, which contains detailed vehicle trajectory data, vehicle dynamic information, and other information and is widely used in the research, development, and verification of traffic and vehicle-related algorithms. The vehicle trajectory data and related information of the US-101 road section were used in this study, which is shown in Figure 5.
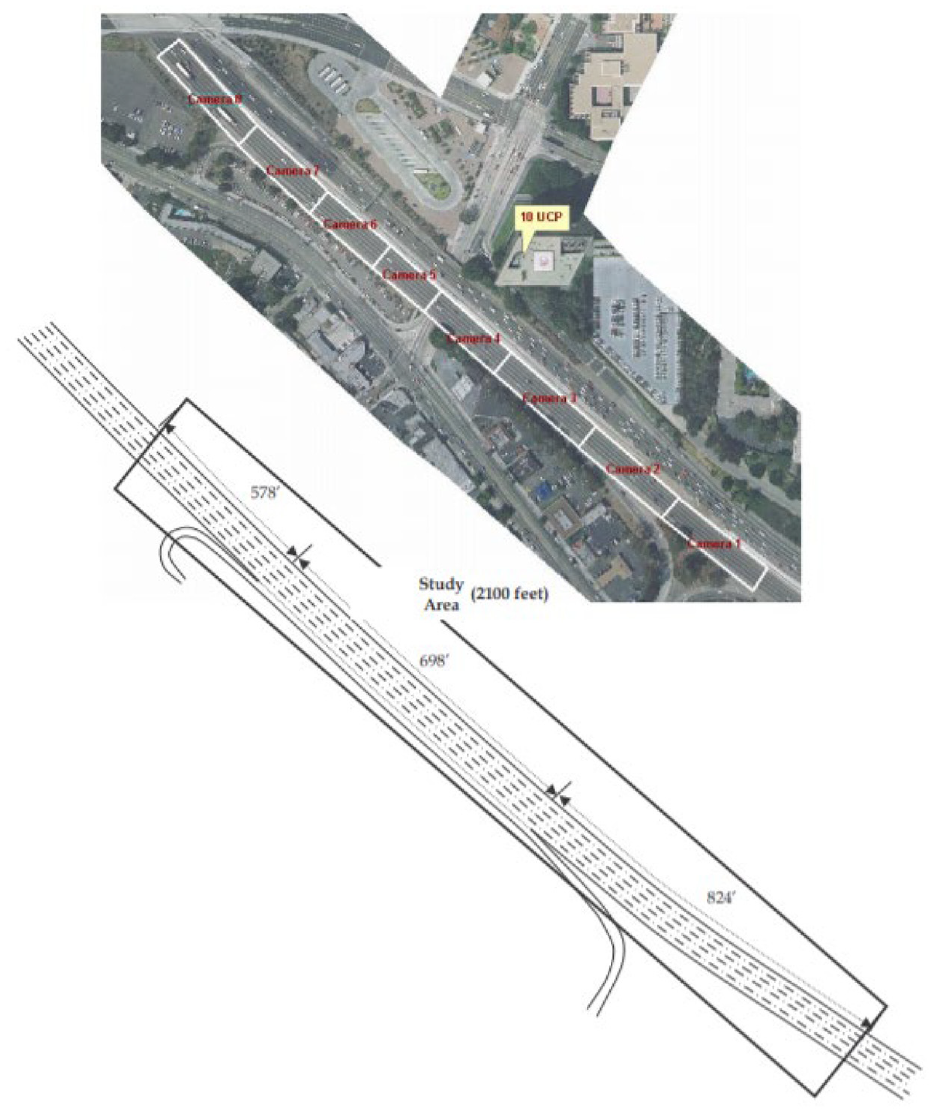
View of the US-101 road section.
Feature selection
We extracted features related to vehicle lane change maneuvers from the data set, some of which can be obtained directly, such as longitudinal velocity, etc.; others, such as lateral displacement, lateral acceleration, vehicle yaw angle, etc., must be reprocessed through the original data. Some of the features obtained by filtering and reprocessing the original data are as follows:
a. lateral dynamic: Before the lane change event occurs, the lateral dynamic provides a wealth of information. The closer the vehicle is to the lane boundary, the more obvious the lateral features related to lane change behavior become. Therefore, we calculated lateral velocity, lateral acceleration, and lateral displacement using local coordinates related to the road.
b. vehicle yaw angle
Data labeling
A better SVM classification effect can be achieved by using appropriate labels. We proposed the concept of a “lane change zone,” which reflects the process from the front of the vehicle contacting the lane boundary to the back of the vehicle leaving the lane boundary. The “lane change zone” with a width of D, which is related to the actual size of the vehicle, is located between the two red dotted lines in Figure 6. The blue dotted line is the vehicle trajectory, while the black solid line is the lane boundary. A lane change trajectory is Route A. The samples in segment bc in Figure 6 are labeled as LK, LLC, or RLC depending on the specific direction, while the others are labeled as LK. The training samples are labeled by this standard.
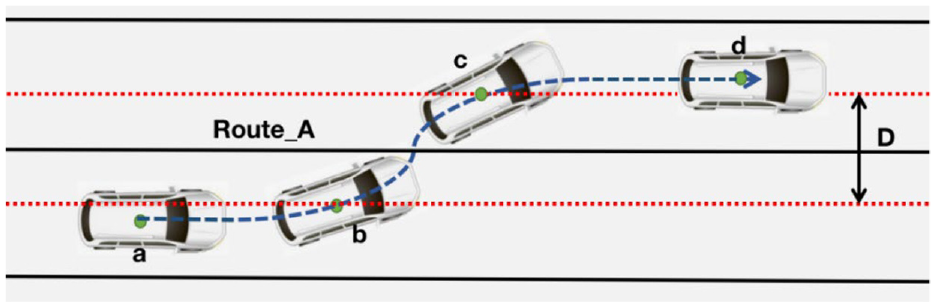
Driving maneuver classification considering “lane change zone.”
Experimental test and result analysis
There are two main evaluation indexes for the driving intention detection model: detection accuracy and average detection time. Unfortunately, most of the current lane change detection experiments only consider the detection accuracy and ignore the detection time. High detection accuracy is the most important requirement for a lane change behavior prediction model. If a system frequently generates false alarms, drivers will have a negative driving experience and be less likely to use lane change detection systems. Detection time is another important indicator, which describes how long the lane change behavior is detected before the vehicle crosses the lane dividing lane. Therefore, the longer the detection time, the better. It means that the driving behavior is detected earlier. Generally speaking, the detection rate and accuracy are mutually restricted. It is unreasonable to ignore the detection time and only pursue accuracy. Even if a system’s detection accuracy is high, the algorithm’s complexity necessitates a longer detection time, which is undesirable. A lane change detection algorithm should be simple, use the fewest resources possible, and have a high detection accuracy. In our perspective, a lane change detection algorithm, should be simple, require the least amount of resources, and have higher detection accuracy.
In the experiment, we select training and test data in the NGSIM dataset. We randomly selected the trajectory data of 2518 vehicles (including 1864 LK vehicles, 284 LLC vehicles, and 370 RLC vehicles) for model training. Besides, we selected 1993 vehicles in the NGSIM dataset for testing, including 160 vehicles that changed lanes left, 220 vehicles that changed lanes right, and 1613 vehicles that changed lanes. We calculated the features we needed after filtering the original trajectory data.
An important step in SVM model training is the selection of SVM hyperparameters (C and gamma). We use grid search method to combine different (C, gamma) combinations for model training, in which the value range of C and gamma is (
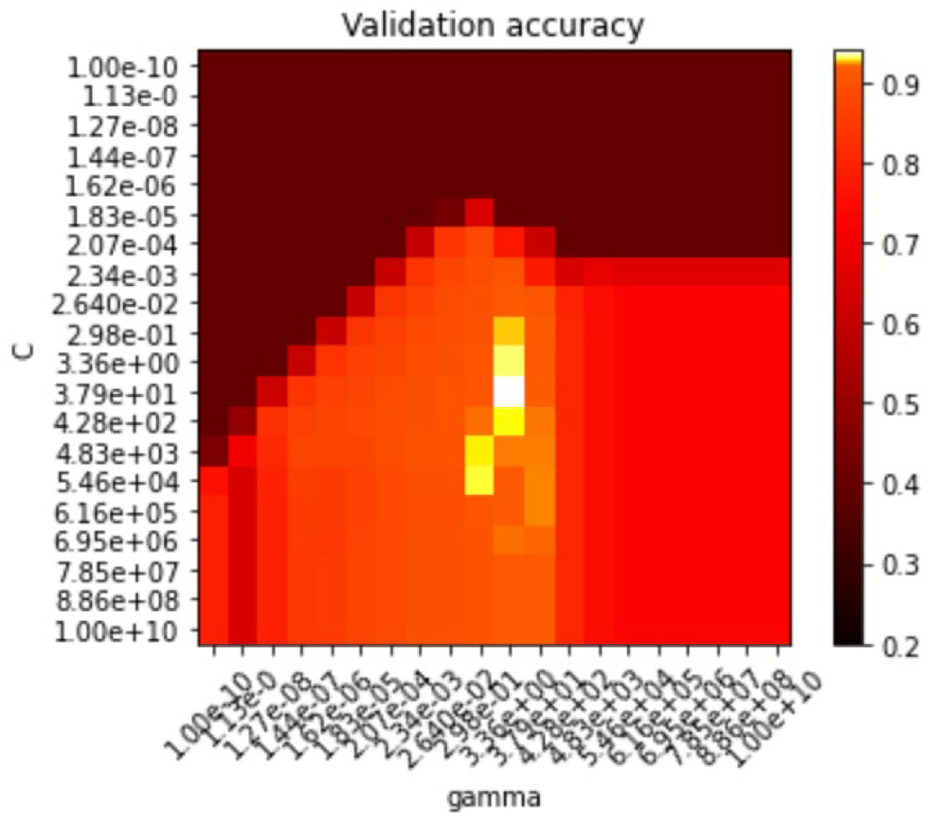
Validation accuracy under different hyperparameters combinations.
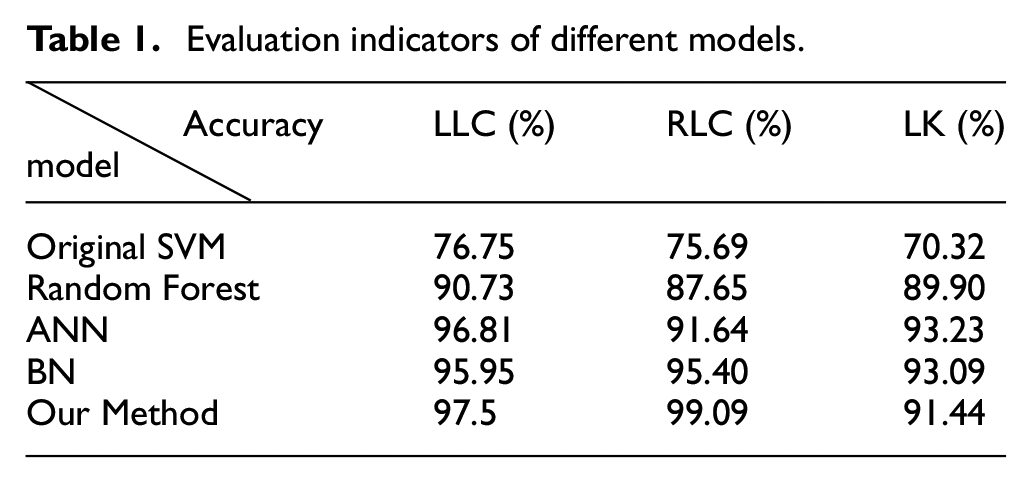
We believe that if the output probability of left (or right) lane change at a given time is greater than the threshold we set, the sample at that time is classified as left (or right) lane change behavior, otherwise, it is classified as lane keep behavior. The detection result is considered correct if the detection time of lane changing behavior coincides with the actual time of lane changing behavior; otherwise, the detection result is considered incorrect. In the experiment, we first use the original SVM classification method. After that, we use the sigmoid function to convert the model output value of the original support vector machine into the probability of three different driving maneuvers (LLC, RLC, LK), based on the Platt scaling theory. Figure 8 shows the Confusion matrix when the threshold is set to 0.85. When the threshold value is set to 0.85, the detection accuracy of the model for left and right lane changing behavior is 97.5% and 99.09%, respectively, while the false alarm rate is 8.56%. The ROC curve, as shown in Figure 9, is drawn based on the experimental results. For comparison, we compare our method to a traditional SVM model based on a time window and other machine learning algorithms, such as random forest, ANN and Bayesian network (BN). Results are shown in Table 1. Our model has better performance for lane change maneuver detection.
Evaluation indicators of different models.
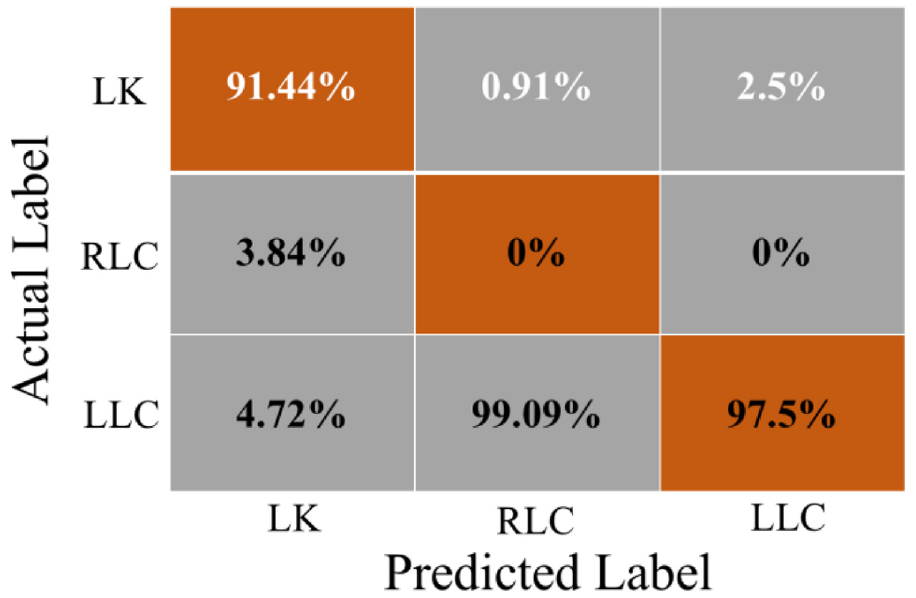
Confusion matrix of SVM when the threshold is 0.85.
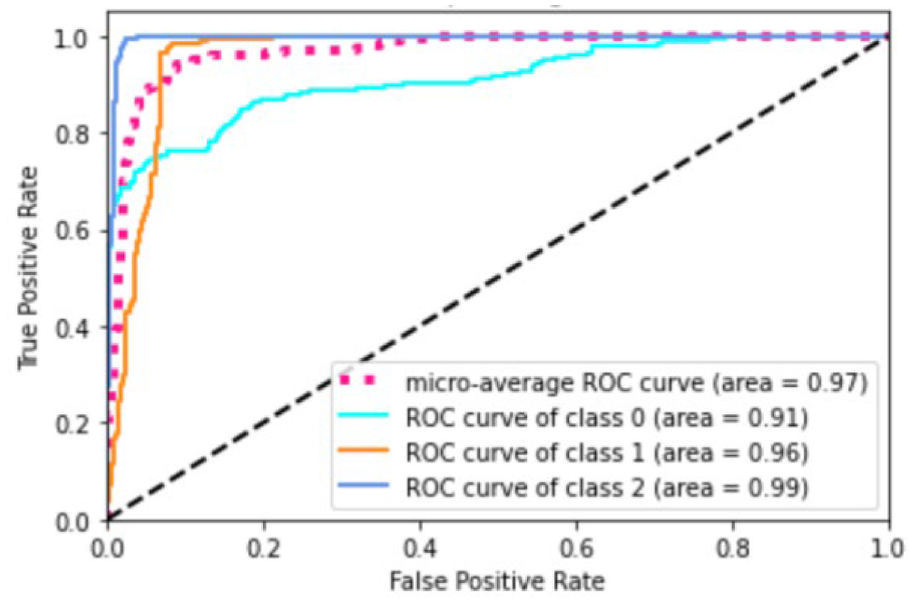
ROC curve of LK, LLC, RLC.
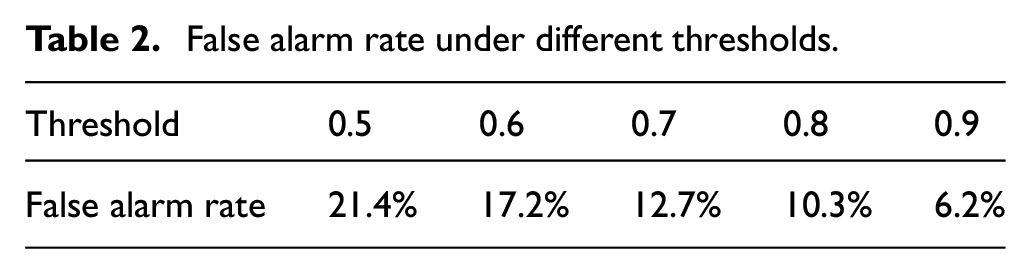
The following is an explanation for this finding: it is undeniable that the data features of zigzag driving and lane change behavior have a high degree of similarity at the outset, which is an important factor leading to false alarm, as can be seen in Figure 10. As the vehicles approach the lane boundary, however, the characteristics of lane change behavior become more apparent, and the similarities between them gradually fade. The greater the corresponding mapping probability, from the model’s perspective, the more obvious the features of lane change behavior are, that is, the farther the sample point is from the classification plane. As a result, increasing the threshold reduces the number of false alarms caused by zigzag driving. Table 2 shows various thresholds and their corresponding false alarm rates and Figure 11 shows classification accuracy under different thresholds. The threshold setting, on the other hand, cannot be infinite to 1. When it reaches a certain value, the model’s detection accuracy for normal lane change behavior decreases, and the rate of missed alarms rises. Experiments show that 0.8–0.9 is the best threshold value range.
False alarm rate under different thresholds.
Feature similar trajectories in reality.
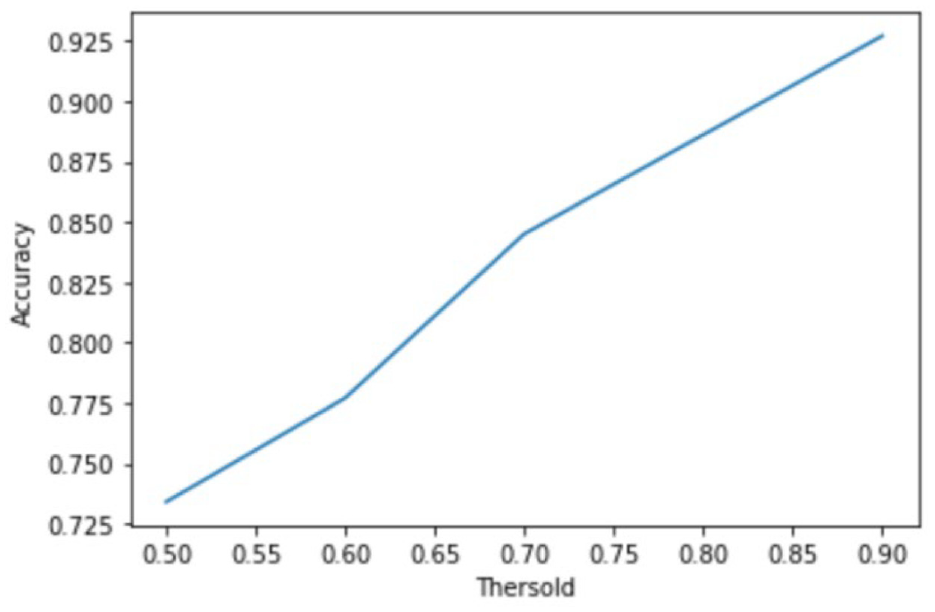
Classification accuracy under different thresholds.
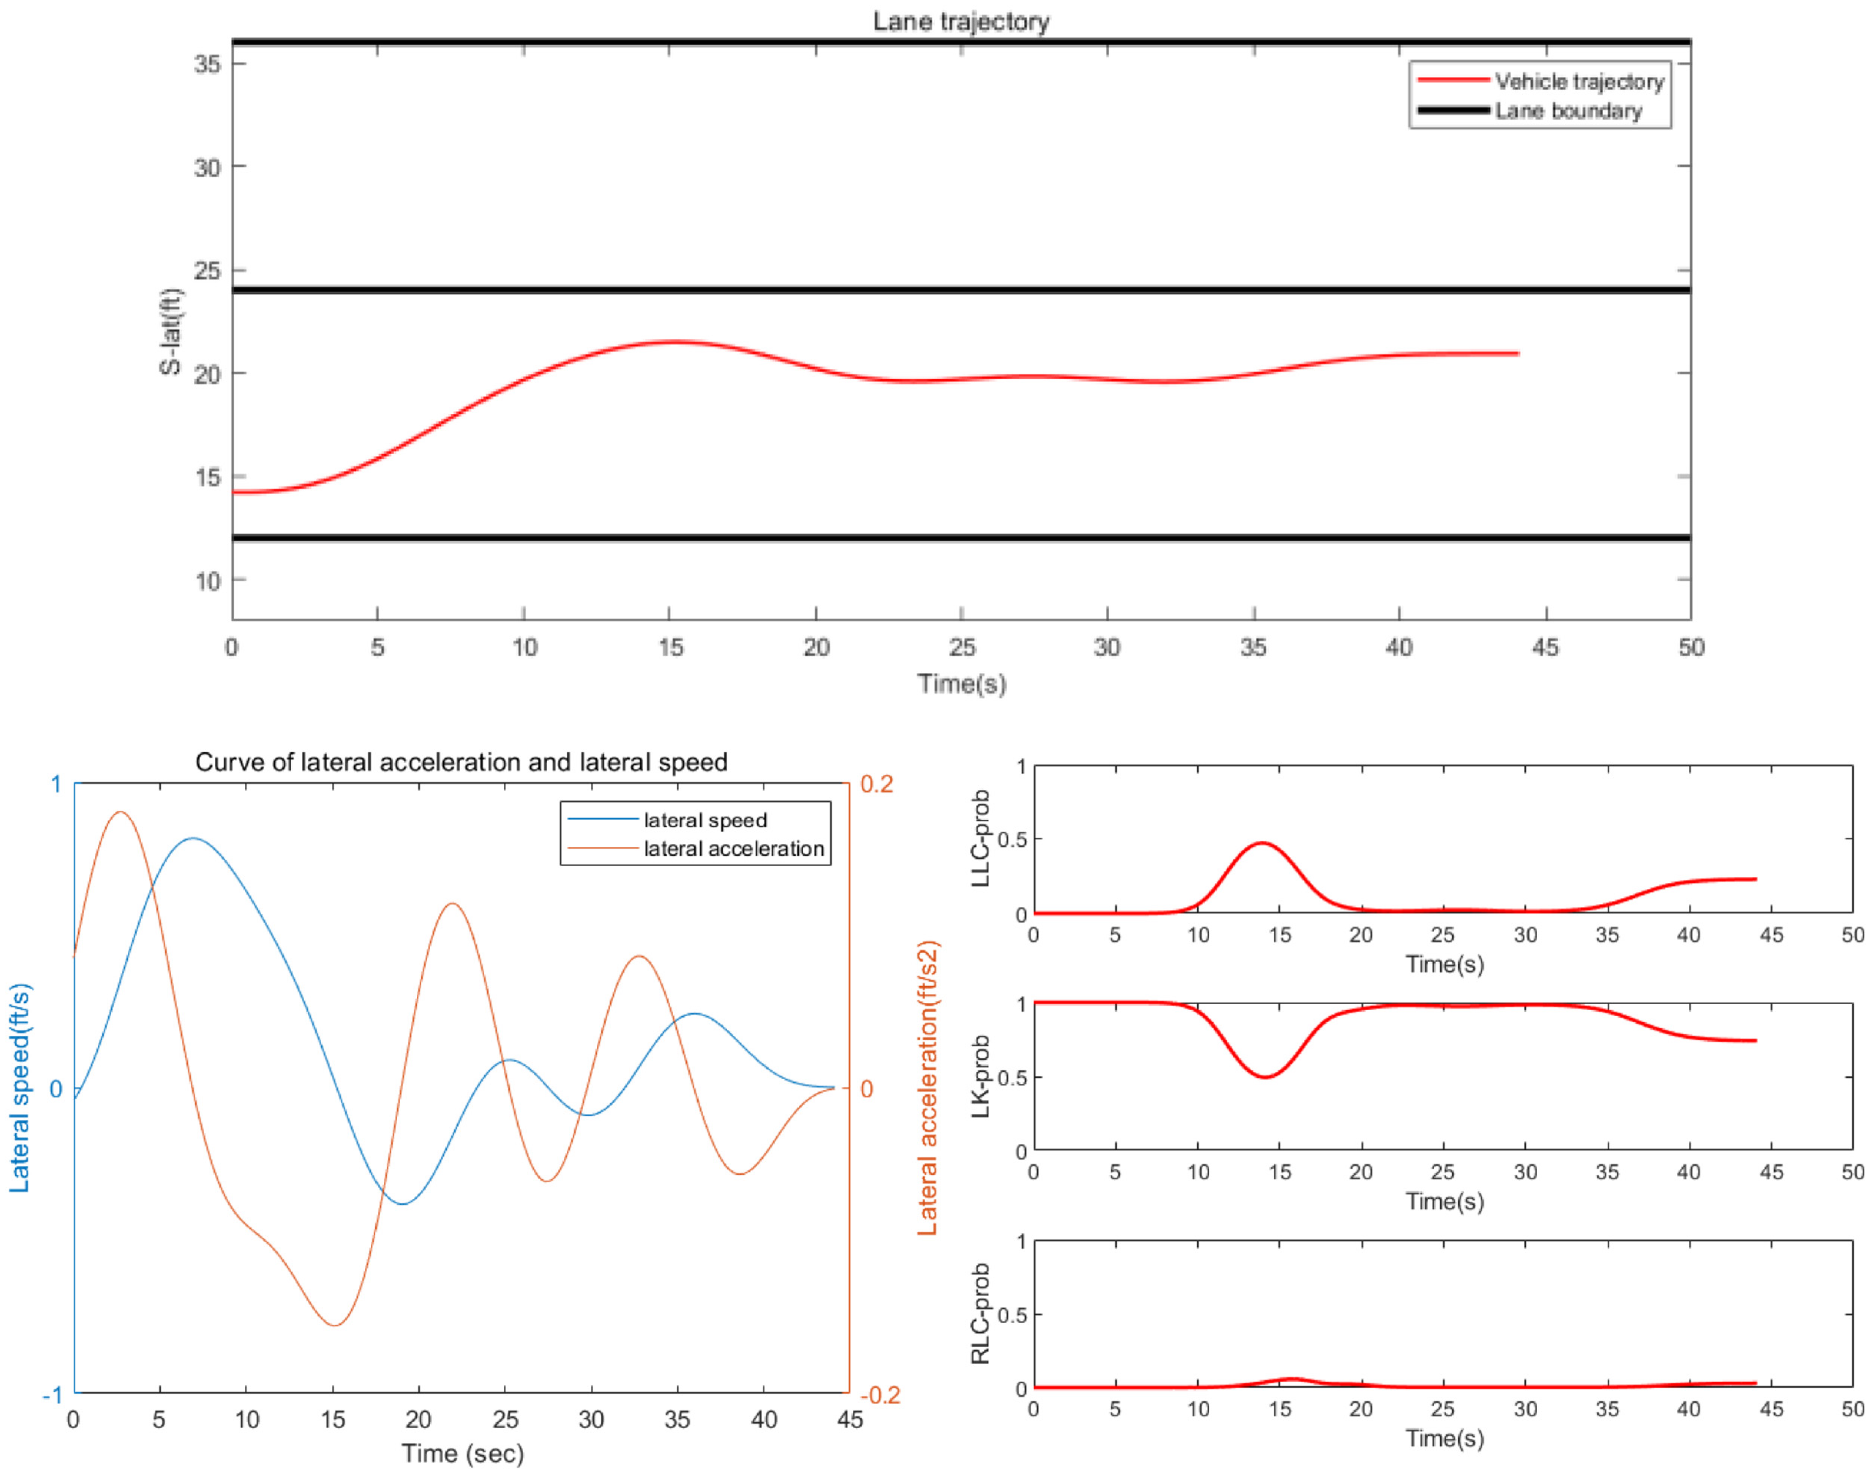
The experimental results of real data in three real situations, including lane keep, lane change, and zigzag driving, are shown in Figures 12 to 14. Our model has a good classification effect for normal straight and lane change behavior, as well as some robustness for the knotty zigzag driving problem, according to the results.
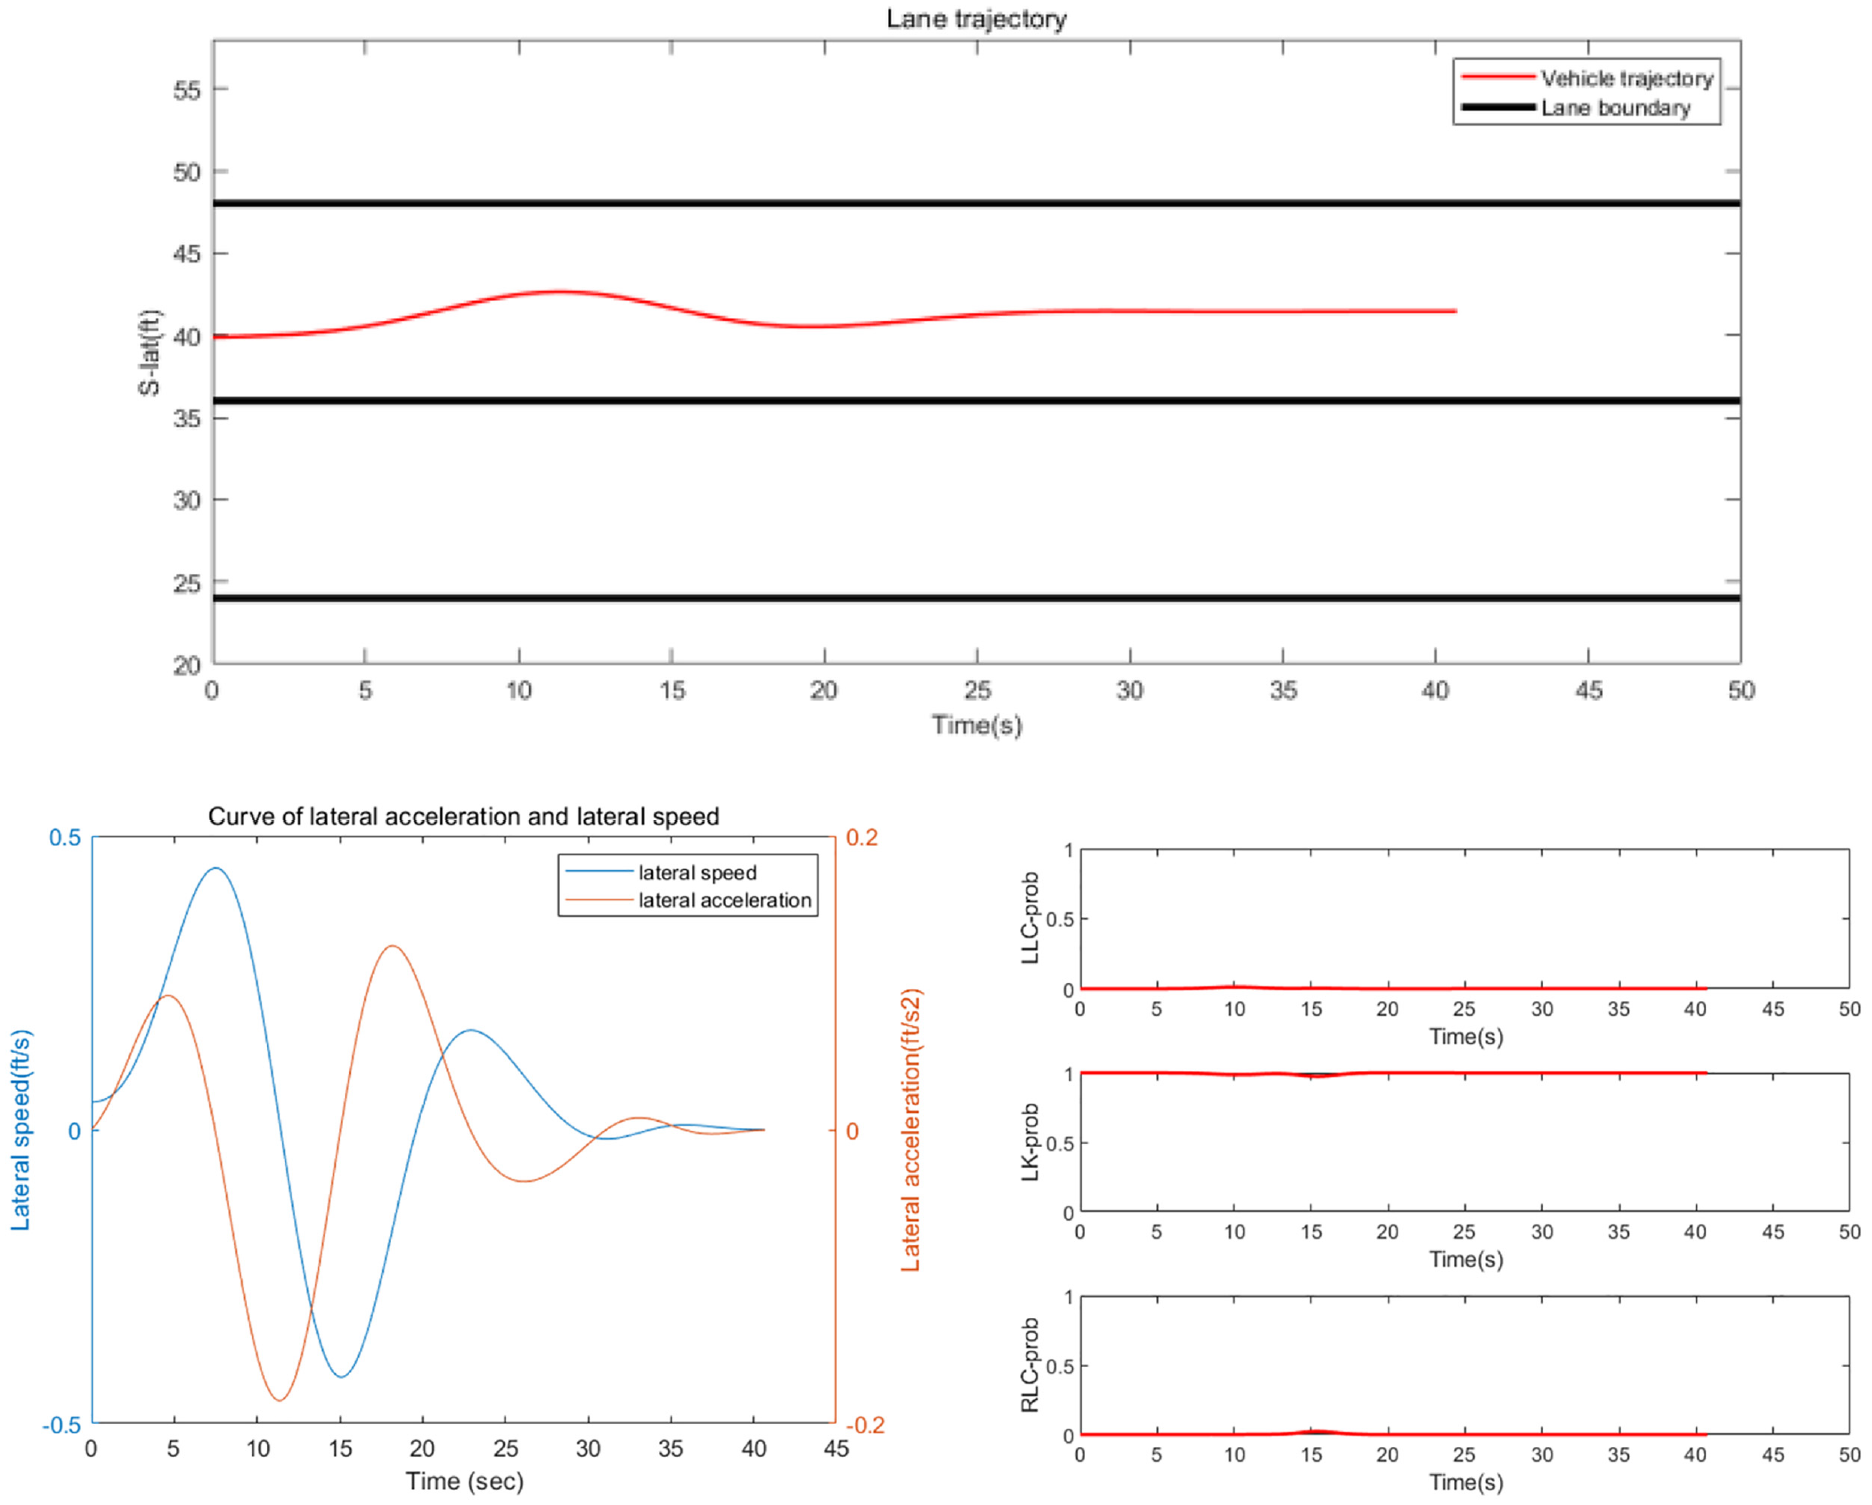
Trajectory, feature changes, and the detection result of the lane keep situation.
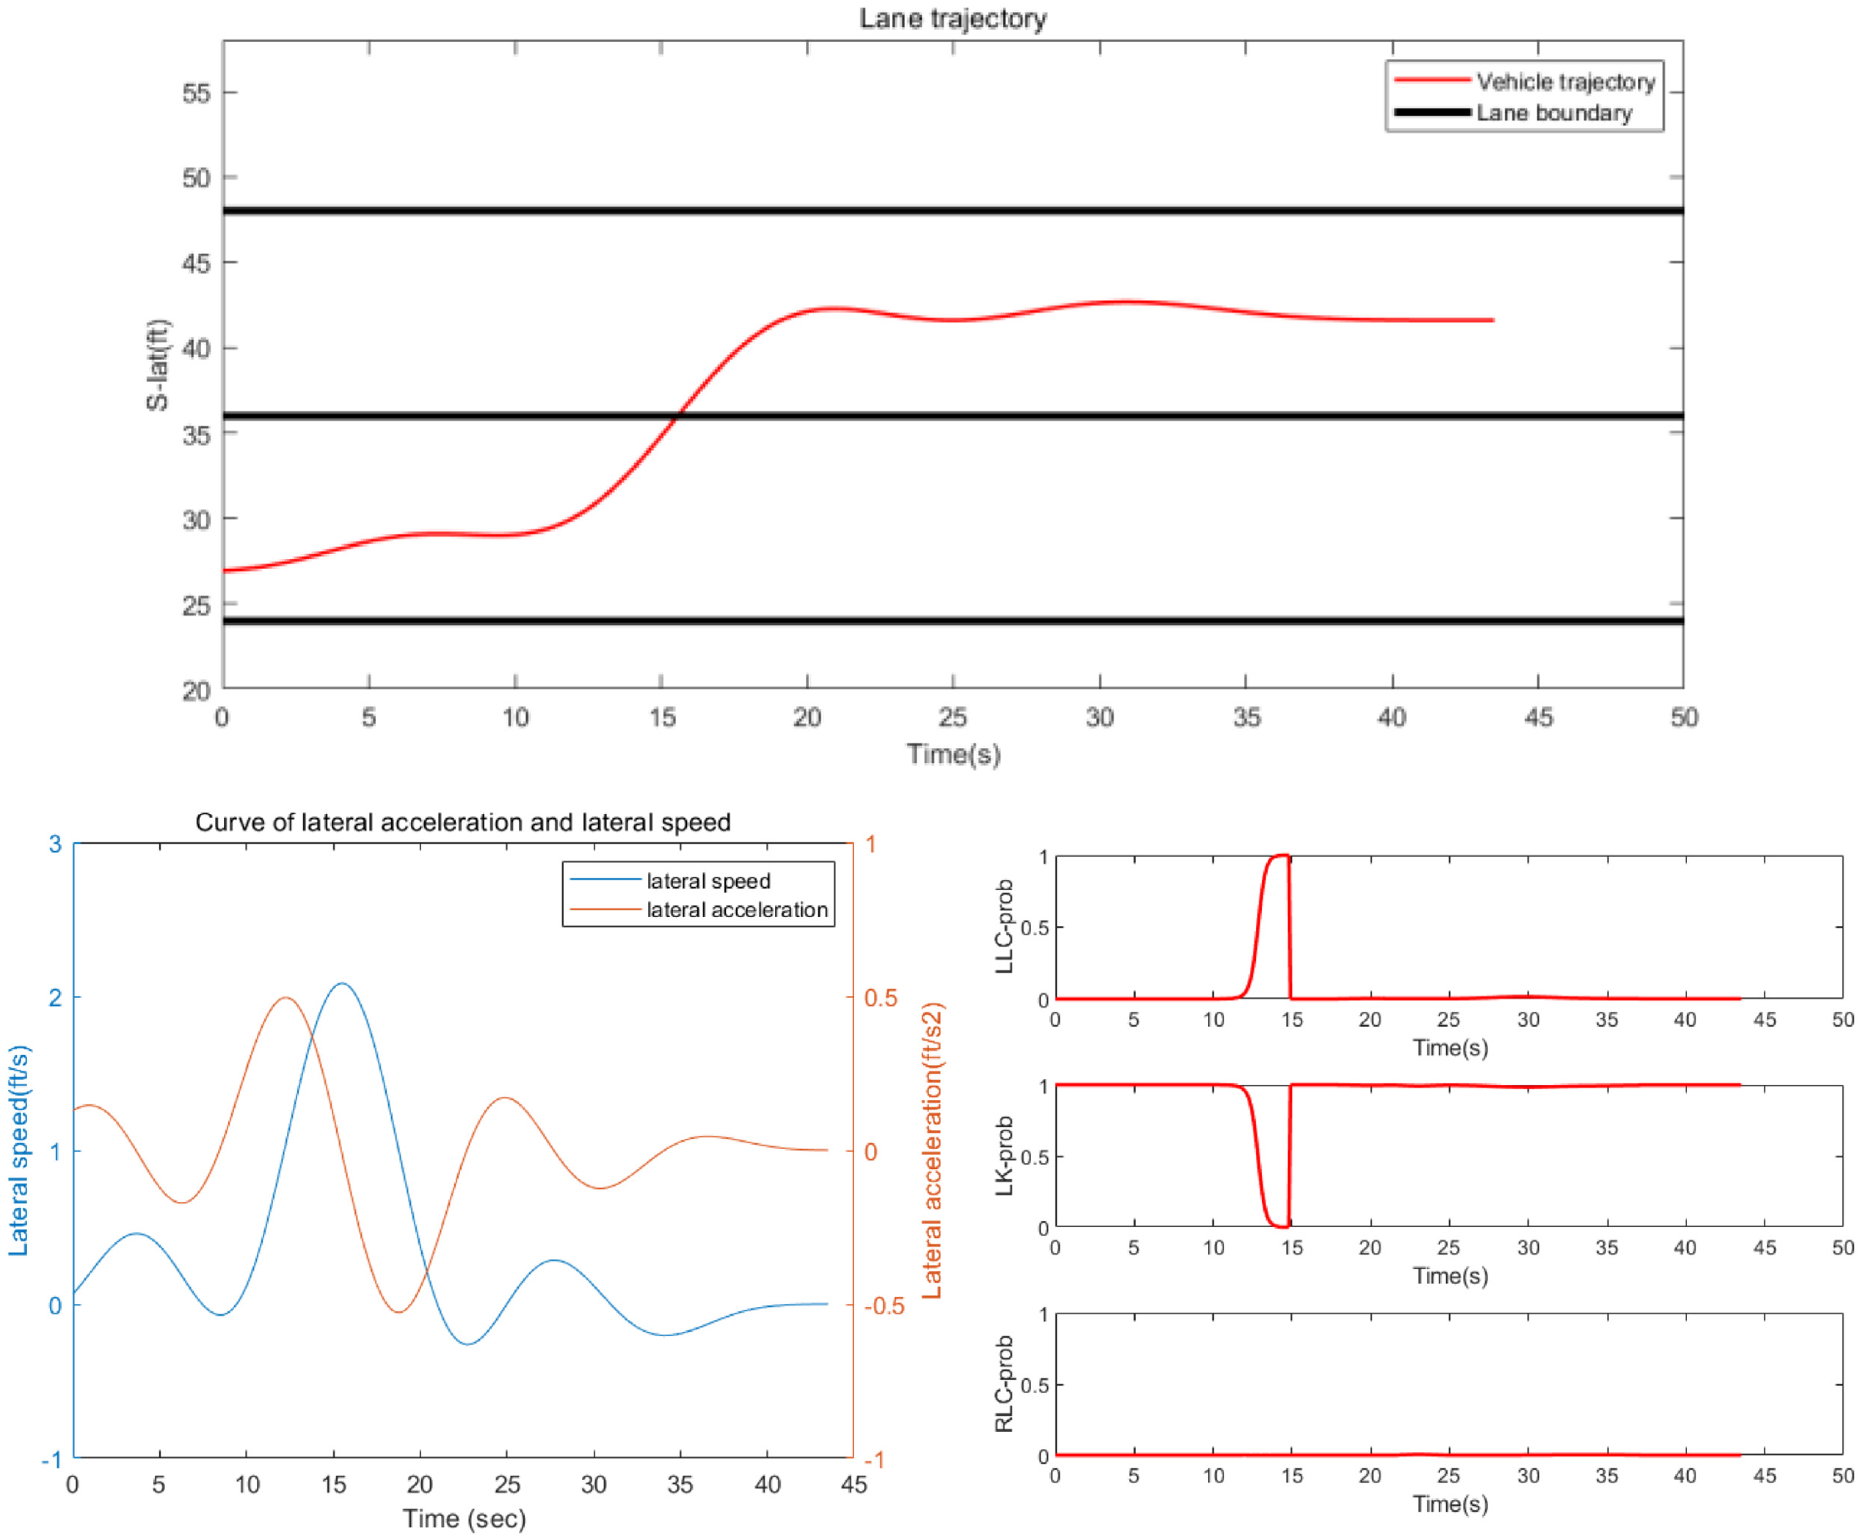
Trajectory, feature changes, and the detection result of lane change situation.
Trajectory, feature changes, and the detection result of zigzag driving situation.
In addition to classification accuracy, the advanced detection time is another evaluation metric for lane change maneuver detection models. Detecting lane change maneuvers earlier in the driving situation means giving drivers more reaction time and improving driving safety.
In this experiment, the actual lane change time

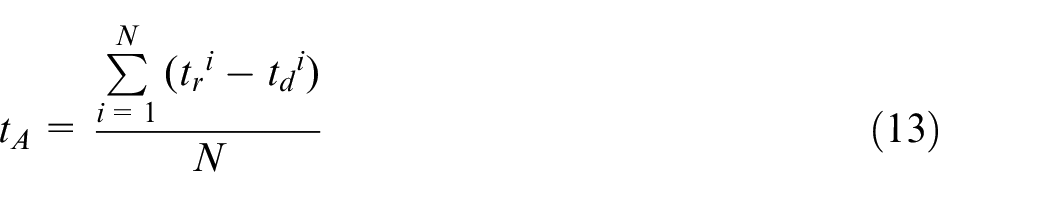
When the threshold is set to 0.85, the average advance detection time of 380 vehicles is 1.7 s, which is in line with the actual driving application situations.
Conclusion
Accurate and timely evaluation of lane change maneuvers can provide drivers more time to make decisions. In this paper, we propose a model that uses the SVM to detect lane change maneuvers using real-time vehicle dynamic features from BSM via DSRC. The model’s performance is evaluated using the NGISM dataset, and the results show that it is ideal for detecting accuracy in normal straight and lane changing situations, as well as being robust in extremely unusual situations. The model’s detection accuracy for left and right lane changing behavior is 97.5% and 99.09%, respectively, with an 8.56% false alarm rate. And with 380 vehicles, the average advance detection time is 1.7 s, which is in line with the actual driving application situations.
Footnotes
Declaration of conflicting interests
The author(s) declared no potential conflicts of interest with respect to the research, authorship, and/or publication of this article.
Funding
The author(s) disclosed receipt of the following financial support for the research, authorship, and/or publication of this article: This work was supported by the Qiu-shi Project of Hefei University of Technology [JZ2015QSJH0536]; and the Innovation and Entrepreneurship Project of Hefei University of Technology [X202010359119].