
Abstract
Vehicle road simulation test can simulate random service load spectrum fairly well in laboratory, and is currently a preferable way to fast verify vehicle fatigue properties. Applying a reasonable load spectrum editing technique is a crucial way to accelerate the test and reduce testing time and costs. The present study deals with the generation of test load spectrum for vehicle road simulation test by applying a load spectrum two-dimension time-domain-threshold editing method (STTE) to delete useless load-time segments with negligible fatigue damage to vehicle components. Additionally, a method of load spectrum connection by applying window function was proposed to smoothly connect retained load-time segments when the useless segments were deleted. Taking a vehicle four-post bench test as an example, the process of load spectra generation was discussed in detail. The generated accelerated spectra were reduced to 33% in length relative to the original spectra. The accelerated spectra showed good consistency with the original spectra in terms of amplitude and frequency characteristics. Finally, the accelerated spectra were applied as target spectra to conduct four-post bench test, and good load spectra simulation effect was realized. Therefore, the accelerated spectra can be served as a substitute of the original spectra to conduct the test. To conclude, the proposed load spectra generation methods are suggested as an alternative technique in automotive fatigue data editing.
Keywords
Introduction
The market competition of automotive industry is increasingly intense as more and more new energy vehicle types emerging in the market, which prompting vehicle producers exerting efforts to reduce time-to-market period to capture user market. However, at the same time, increasing product fatigue reliability is always a challenging task for automotive designers and producers,1,2 especially for the agile development model applied in the current automotive industry. The fatigue properties and performances of automotive components should be thoroughly considered during design process to avoid fatigue failure phenomena under user conditions. 3 For example, optimization design of a vehicle suspension arm while maintaining fatigue durability, 4 optimum design of automotive clutch diaphragm spring satisfying required clamp load and fatigue life, 5 and shape optimization of an automotive seat bracket considering its stress fatigue load based on a new hybrid Taguchi salp swarm algorithm. 6
Before releasing to market, the prototype of a new vehicle with all components assembled is required to perform durability testing to validate the fatigue and durability performance of the optimal designed components, and to verify that the vehicle possesses the strength and service life specified in the design.7,8 A complete prototype, with all its components, is necessary to perform tests on proving grounds (PG). 9 However, to test only the structural durability is possible with the use of a four-post bench, which is able to simulate the vehicle random service load spectra collected from PG or customer roads. 10
The service loads of automotive components are random and complex.11,12 As fast development of servo hydraulic test technique and machines, the random service load spectra can be simulated fairly well in laboratory by conducting road simulation test. 13 Road simulation test is the best way to fast verify vehicle fatigue properties because conducting field test needs substantial time and cost. 14 In addition, a prediction of fatigue life under such complex spectrum is not possible for any cumulative damage hypothesis, therefore large quantities of durability tests should be conducted in the component fatigue design period before market release. 15 However, durability tests of vehicle prototypes need substantial time and financial commitments. These requirements have led vehicle testing laboratories to seek ways of accelerating durability testing time and reducing testing costs. For the road simulation test, the service load spectra collected from PG are usually so long in time that the tests need substantial financial and time commitments, therefor finding ways to accelerate test to save time and cost is necessary, and applying load spectrum editing technique is an effective way to accelerate road simulation test. 16
Vehicle service loads can be described by the following properties: load amplitude, load frequency, load sequence, and multi-channels load phase. A load spectrum editing method applied to accelerate test should fully consider these properties. However, traditional spectrum compilation methods, such as peak-valley slice, generation of block-program spectrum, increasing frequency and amplitude amplification, were no longer suitable for the service simulation durability testing. 17 Therefore, the trends of fatigue data editing (FDE) technique have emerged in the field of accelerated durability testing. FDE is a technique used to remove small amplitude cycles that lead to minimal fatigue damage. In this approach, large amplitude events, which account for the majority of the damage, are retained to generate a shortened load spectrum. 18 Kadhim et al. 19 studied the development of accelerated fatigue design time based finite element analysis (FEA) through the combination of the FDE technique and FEA. Design time was saved based on the FDE technique associated with FEA. Mattetti et al. 20 applied the FDE technique to remove the non-damaging portions of the load signals to accelerate the four-post testing of tractors in the fatigue design period.
Abdullah et al. 21 presented the development of the Short-Time Fourier Transform (STFT) based FDE technique. This technique was performed by removing low amplitude cycles contained in the original signal to produce a shortened signal. In terms of the applicability of the shortened signal, this kind of signal can be normally used in laboratory scale durability fatigue test. Liu et al. 22 applied the STFT method for editing the measured uniaxial-head acceleration load spectrum in the road simulation test to speed up the reliability test process and reduce time costs. Wen et al. 23 applied the STFT approach to identify and extract high fatigue damage segments of original load signal and obtain reduced accelerated load spectrum of tractor components.
Another work by Pratumnopharat et al. 24 developed a method called wavelet transform (WT)-based fatigue damage part extracting method. Based on WT, this method extracts fatigue damage parts from the stress-time history and generates the edited stress-time history in a shorter time. Shangguan et al. 25 studied the WT-based spectrum editing method for editing load spectrum for accelerated durability testing of handling bushing of an automotive suspension control arm. The results also showed very good agreements between the proposed spectrum and traditional time-domain editing methods.
When applying the STFT or WT based FDE technique to edit load spectra, the parameters that influence spectra editing effects should be particularly considered, for example, the WT based FDE technique concerning the consideration of wavelet function type, vanishing moments, and decomposition layers that make the method complicated for engineering applications. In this paper, a load spectrum two-dimension time-domain-threshold editing method (STTE) that considers only small-load-omission threshold and time-duration-filtering threshold was proposed to edit load spectra. For the STTE method, small amplitude load-time sections whose time durations are longer than time-duration-filtering threshold are identified and omitted from original load spectrum. Moreover, a load spectrum concatenation and regeneration method based on signal window function was proposed in order to smoothly concatenate the load spectra after deleting the small amplitude load-time sections. Load spectra concatenation effects of different window functions were also studied to select a suitable window function. Finally, an accelerated load spectra were generated by applying the STTE technique associated with the window function method.
Since the purpose of road simulation test is to simulate vehicle service load conditions and replicate the characteristic fatigue damage and modes, it is necessary to study the accelerated spectra characteristics to ensure that the original spectra properties are well retained. Therefore, a set of multi-domain load spectra analyses method was used to validate the effectiveness of the accelerated spectra. Finally, the accelerated spectra were applied as target spectra to conduct the vehicle four-post bench test, and good load spectra simulation effect was realized. The accelerated spectra can be considered as a substitute of the original spectra in terms of loads spectra characteristics retention and test damage consistency.
The remainder of this paper is organized as follows. Section 2 discusses the process of load spectra editing and some key techniques, including the STTE and window function based signal concatenation methods. Section 3 presents detailed load spectra editing process. Section 4 analyzes the original spectra and accelerated spectra from multi-domain aspects. Section 5 provides a practical application to illustrate the effectiveness of the accelerated spectra by conducting road simulation test and finally Section 6 provides a summary and conclusions.
Load spectra editing process and key techniques discussion
Load spectra editing process
In this paper, the road simulation test was conducted using a four-post bench. For the four-post bench test in the present study, vertical acceleration signals of the four-wheel spindle noses were applied as target signals to calculate the driving profiles of the test rig’s four hydraulic actuators. Hence, for accelerated testing, the acceleration load-time histories should be edited to remove useless load-time segments that cause none or negligible damage to the vehicle. In the present study, the useless load-time segments were identified from strain load spectra of the chassis critical fatigue positions. The strain load spectra and the four-wheel acceleration spectra were synchronously collected and considered correlative. Hence, if a strain load-time segment was identified with no damage, the corresponding acceleration load-time segment could be sliced and deleted. The load-time segments with strain history range less than a certain threshold were identified and removed from both the strain and the acceleration spectra. Figure 1 shows the above load spectra editing process as following:
Record load spectra from PG roads and pre-process the recorded load spectra, for example, detecting and removing signal spikes and drift.
Set small-load-omission and time-duration-filtering thresholds. Apply the STTE method to identify non-damaging and useless load-time history segments of the strain load spectra.
Delete the identified useless load-time history segments from all load spectra.
Concatenate the load spectra by applying window function based signal concatenation method and output the accelerated spectra.
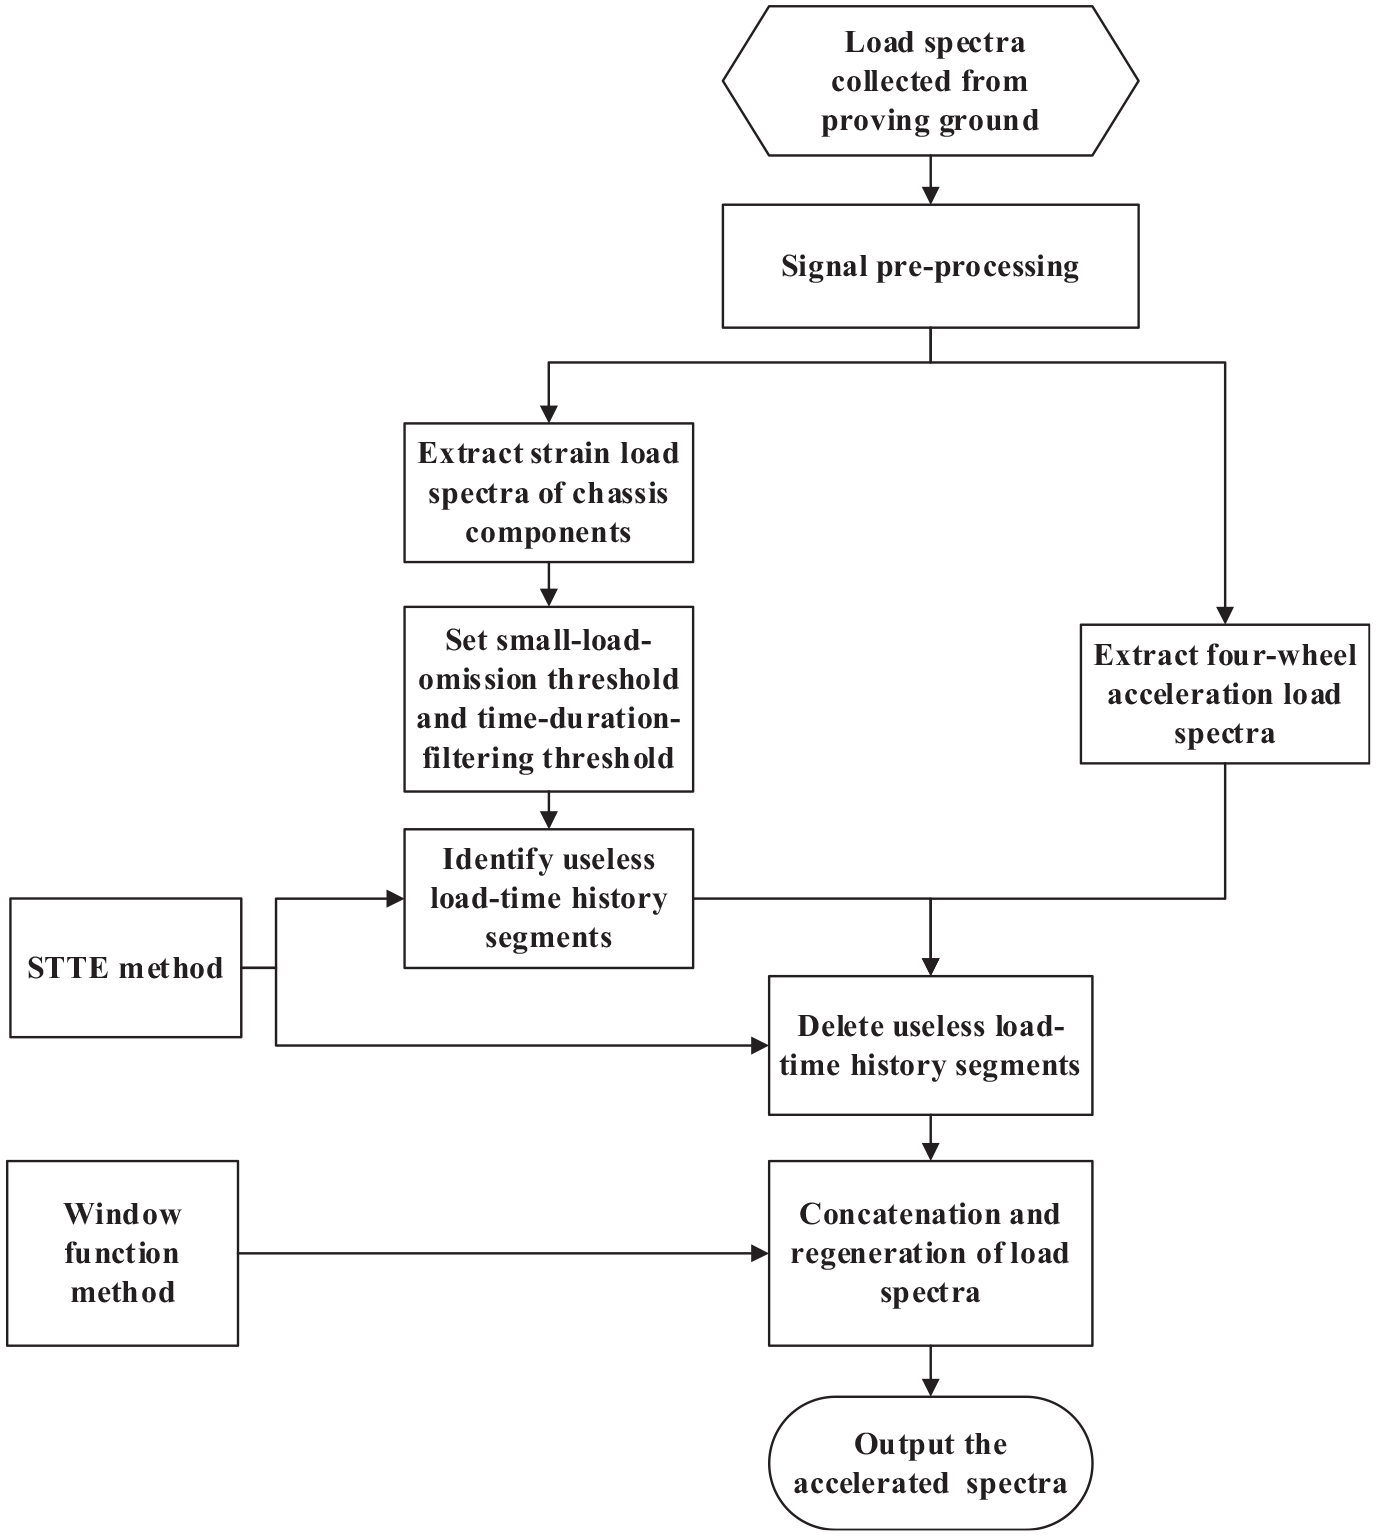
Accelerated spectra editing process for the road simulation test.
A load spectrum two-dimension time-domain-threshold editing method
In the present study, a load spectrum two-dimension time-domain-threshold editing method (STTE) was proposed to edit the load spectra. The STTE method was convenient for engineering application as only two parameters, small-load-omission threshold and time-duration-filtering threshold, were considered. A specific instruction showing how useless load-time segments are identified of the STTE method is shown in Figure 2. The two horizontal dashed lines represent the small-load-omission threshold. The load data points, which cross the two horizontal dashed lines, are marked with capital letters as A, B, C … L, M, and N. The load-time segments, AB, CD, EF, GH, IJ, KL, and MN, are small-amplitude-load segments that are identified within the threshold. Then, the time duration of each small-amplitude-load segment is calculated, and a judgment is conducted to identify whether the time duration of a segment is longer than the time-duration-filtering threshold or not. The small-load segments with time duration longer than the threshold are identified as useless load-time segments. In this example, the AB, CD, IJ, and MN segments are identified as useless segments, while the EF, GH, and KL segments, though also within the small-load-omission threshold, are retained because their time durations are shorter than the time-duration-filtering threshold. By slicing and removing the identified useless load-time segments and concatenating the non-contiguous segments, an edited load-time history is shown in Figure 3. A taper time of 0.2 s is added on the start and end time of the load-time history to ensure the fluency and continuity of the load spectra.
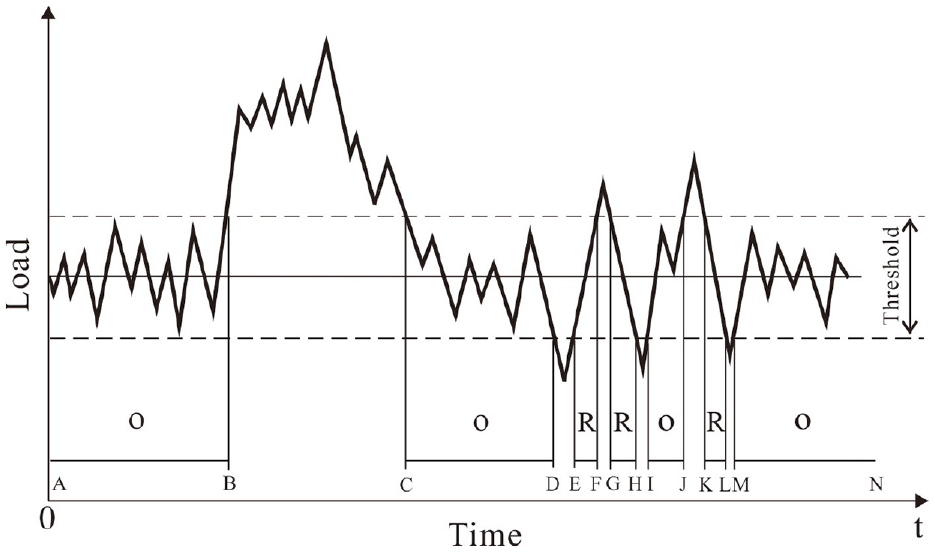
A specific instruction for identifying useless load-time segments (“O” represents a load-time segment that would be omitted; “R” represents a load-time segment that would be retained).
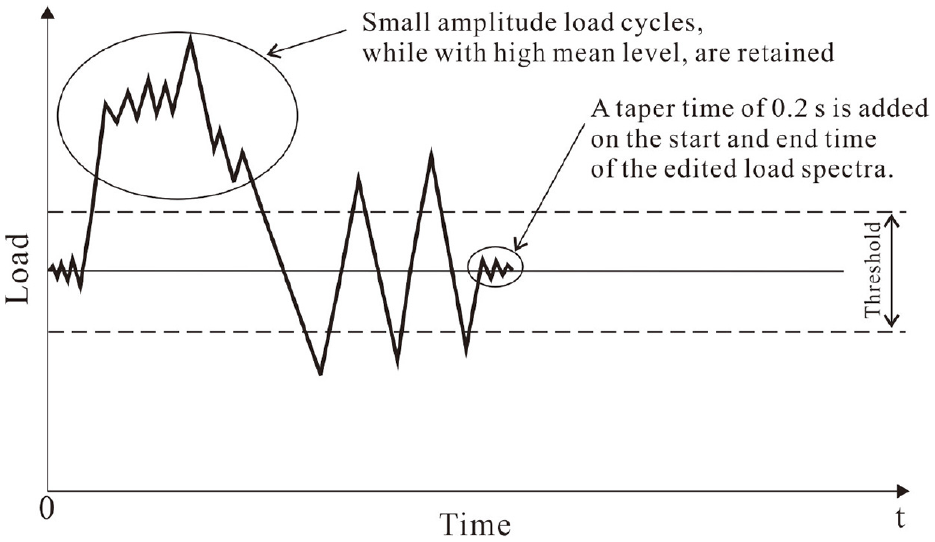
An edited load-time history by applying the STTE method.
For time domain spectrum editing purpose, the small-load-omission threshold was suggested as equation (1)
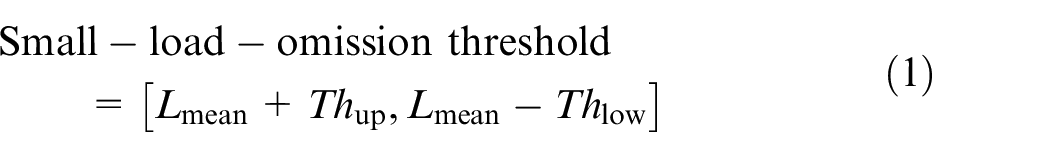
Where Lmean represents the mean value of a load spectrum, Thup and Thlow represent the upper and lower range of the threshold respectively, which can be determined by engineering experience. In the present study, the Thup and Thlow were calculated by introducing and considering the low load strengthening characteristics as discussed in Section 2.3.
After the above spectrum editing, the small-load-amplitude cycles, but with high mean level, were retained. Only the load-time segments with small-load-amplitude cycles, low mean level, and relatively longtime duration were identified as useless segments. Additionally, for the multi-channels case, to maintain the relative phases among multi-channel signals, a load-time segment could be removed only if the segment of all signal channels was below the small-load-omission threshold.
Small-load-omission and time-duration-filtering thresholds selection
Service load spectrum of automotive components usually contain a lot of small amplitude cycles, and the fatigue damage associated with such cycles is relatively small. How to deal with the cycles at small loads with high frequency is a problem often encountered in editing load spectra and evaluating fatigue reliability of structure elements.
In the present study, low load strengthening characteristic was introduced and considered when editing load spectrum.26,27 Zheng et al.28–30 conducted numerous experiments and found that low load strengthening characteristic was suitable for automotive components, such as front axle, drive shaft, and transmission gear. Based on their experiments, the optimal region of small-amplitude loads with strengthening effect for automotive components was from 0.65
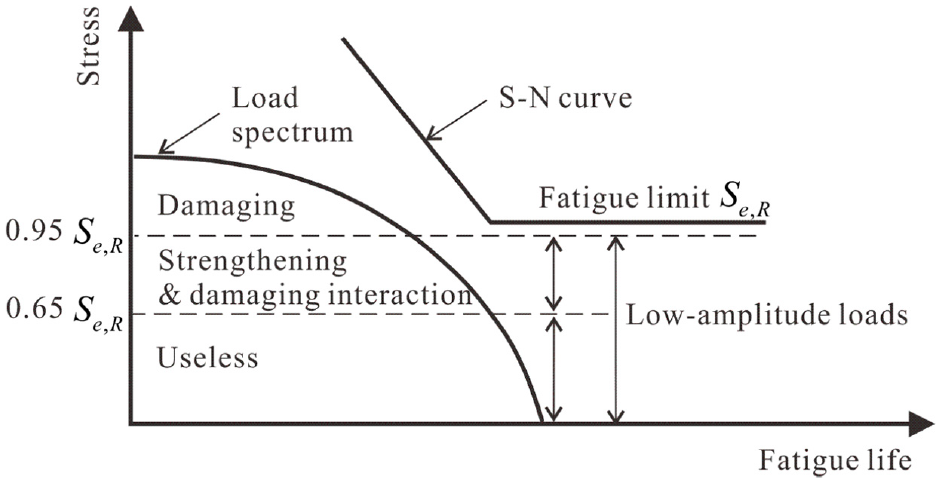
Service loads were defined as three regions by considering low load strengthening characteristic.
For time-duration-filtering threshold selection, 0.2 s was suitable for load spectrum editing for road simulation test according to engineering experience. 14
A load spectrum concatenation method based on window function
After omitting small-amplitude-load segments from load spectrum, the retained non-contiguous load segments need to be concatenated to generate accelerated spectrum. However, if directly concatenating the retained inconsecutive load segments without any processing, the concatenation points between two adjacent segments might create a severe step cycle, which may severely influence test rig’s performance and durability. Therefore, a signal concatenating technique should be used to smoothly regenerate the accelerated spectrum.
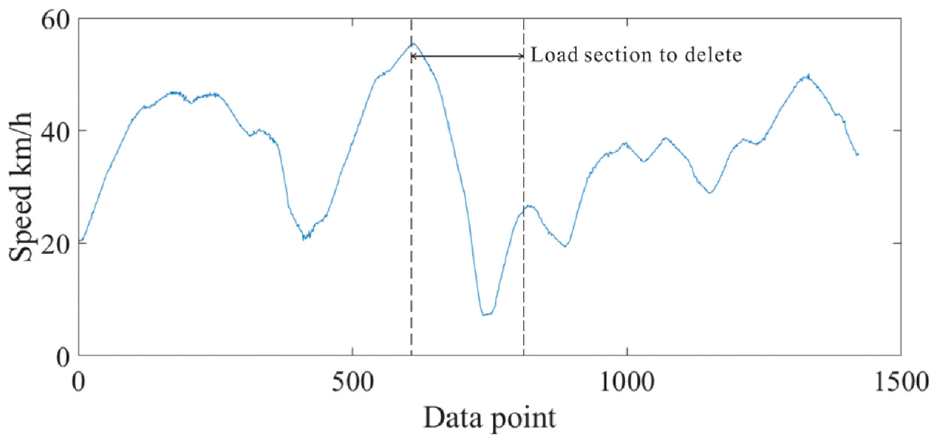
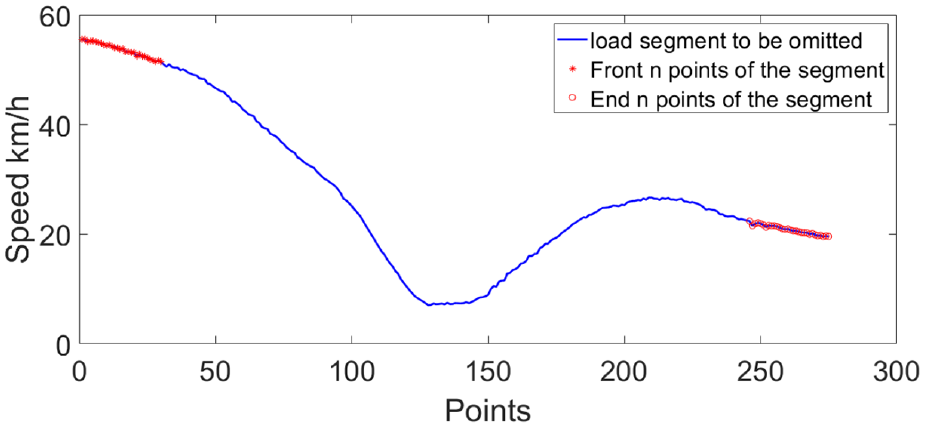
In this paper, a window function based signal concatenation method was proposed to smoothly concatenate the retained adjacent load-time segments. A sample was given to illustrate how this method works. A load segment that would be deleted in a speed spectrum is marked in Figure 5. The segment to be omitted is extracted and showed in Figure 6. The n data points from the front and end part of the segment were marked and extracted for further calculation. Therefore, the segment to be omitted was divided into three parts as following:
A load segment to be deleted in a speed spectrum.
The load segment to be omitted.

The front part of the segment to be omitted was denoted as
A window function, denoted as
(1) Taking point multiplication for

where
(2) Taking point multiplication for

where
(3) Adding
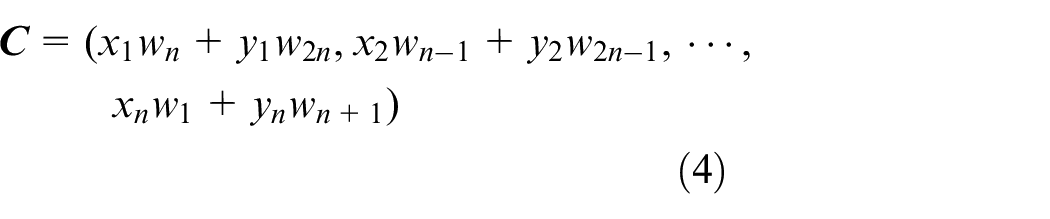
In order to select a proper window function for signal concatenation, five commonly used window functions, namely the Chebyshev window, Flat top weighted window, Gaussian window, Hamming window, and Hanning window, were used to generate the concatenation signals by applying functions (2)−(4). The generated concatenation signal points and overall concatenation effects are shown in Figure 7. For the Chebyshev and Flat top weighted window functions, the original signal limit was exceeded after applying window function, which should be avoided in terms of signal consistency. For the Gaussian and Hamming window functions, the concatenation was inconsecutive and rough at the start and end points of the concatenation signal. In contrast with the above window functions, the original signal was smoothly concatenated by applying the Hanning window function. Therefore, the Hanning window function was further applied to concatenate load spectrum. The Hanning window function is
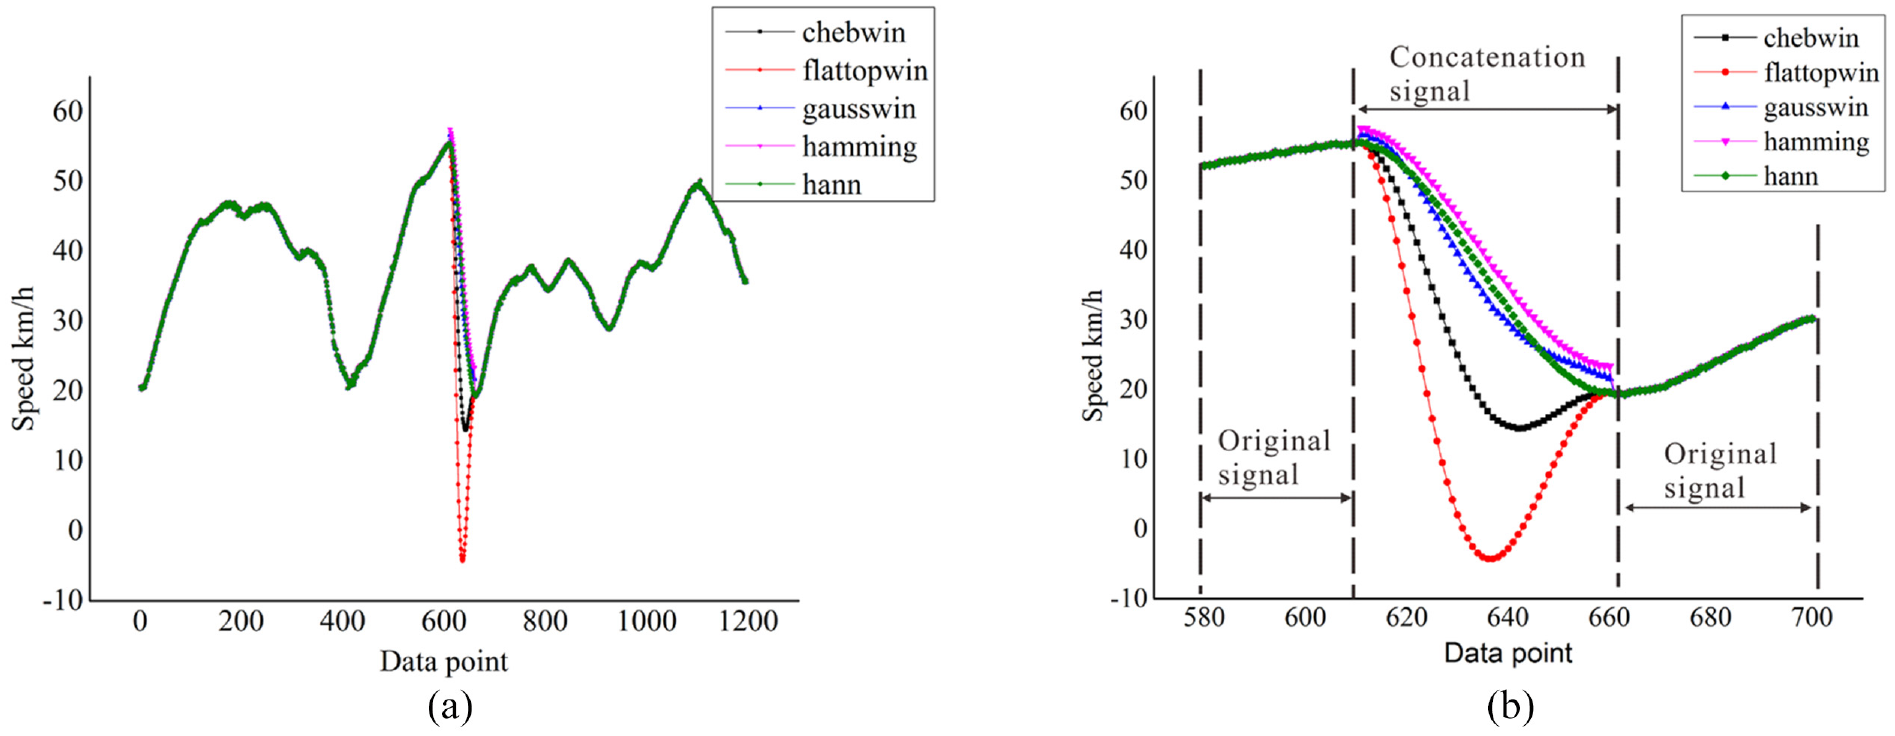
Signal concatenation effects of different window functions: (a) overall concatenation effects of different window functions and (b) the generated concatenation signal points of different window functions.
where the window length is L = N+1.
Accelerated load spectra generation
PG road test and signal acquisition
Service load spectra of the test vehicle were recorded from PG durability roads that include a series of characterized load events, such as railroad crossing, chuckhole, and chatter bump road, available for load spectra collection. The recorded load spectra types include strains of the chassis critical fatigue positions and accelerations of the four-wheel spindle noses. The load spectra were recorded by a DAQ signal acquisition system with sampling frequency set at 512 Hz for data accuracy. Figure 8 shows some strain gages pasted on the chassis fatigue critical positions. Taking the vertical acceleration signal of the right-front wheel spindle nose as an example, the recorded service load spectrum is shown in Figure 9, representing a whole cycle of the PG durability roads that contains 14 different characterized load events.
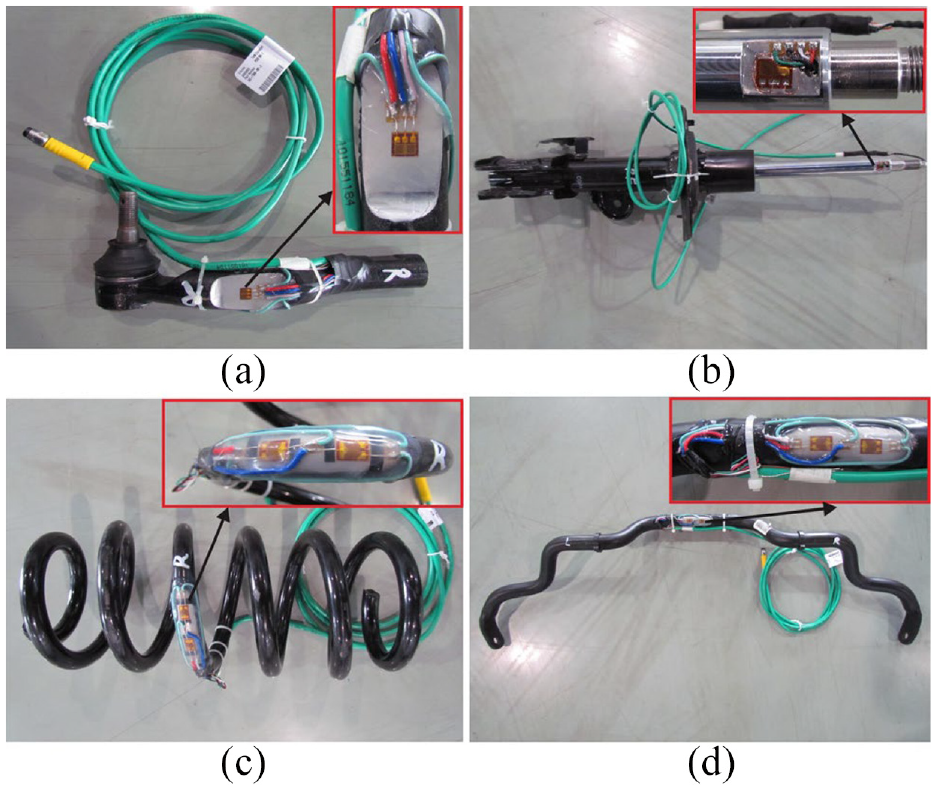
Some strain gages applied on chassis fatigue criticalpositions: (a) right front steering link, (b) right front shock absorber, (c) right rear spring, and (d) rear stabilizer bar.
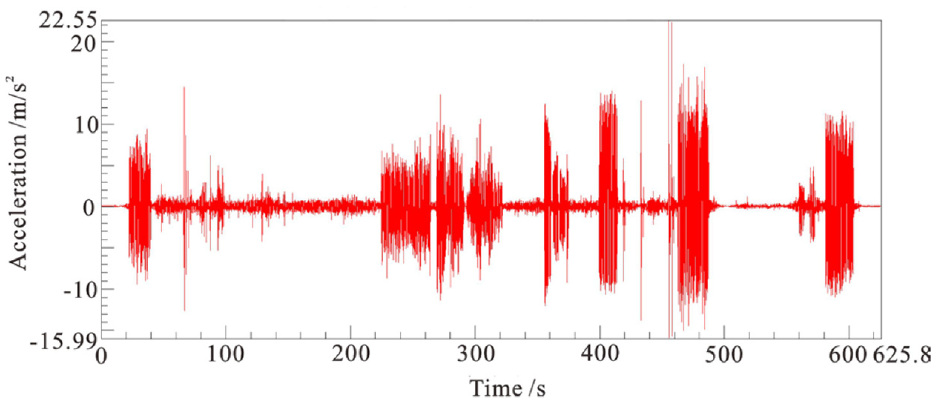
The recorded service load spectrum from PG durability roads (taking the vertical acceleration signal of the right-front wheel spindle nose as an example).
Small-load-omission threshold calculation
As shown in Figure 4, low-amplitude loads below 0.65
According to the literature,
32
the estimated fatigue limit,
The symmetrical bending fatigue limit (106 cycles) is given by

where

where
By calculating equations (6) and (7),
Reference strain channels selection
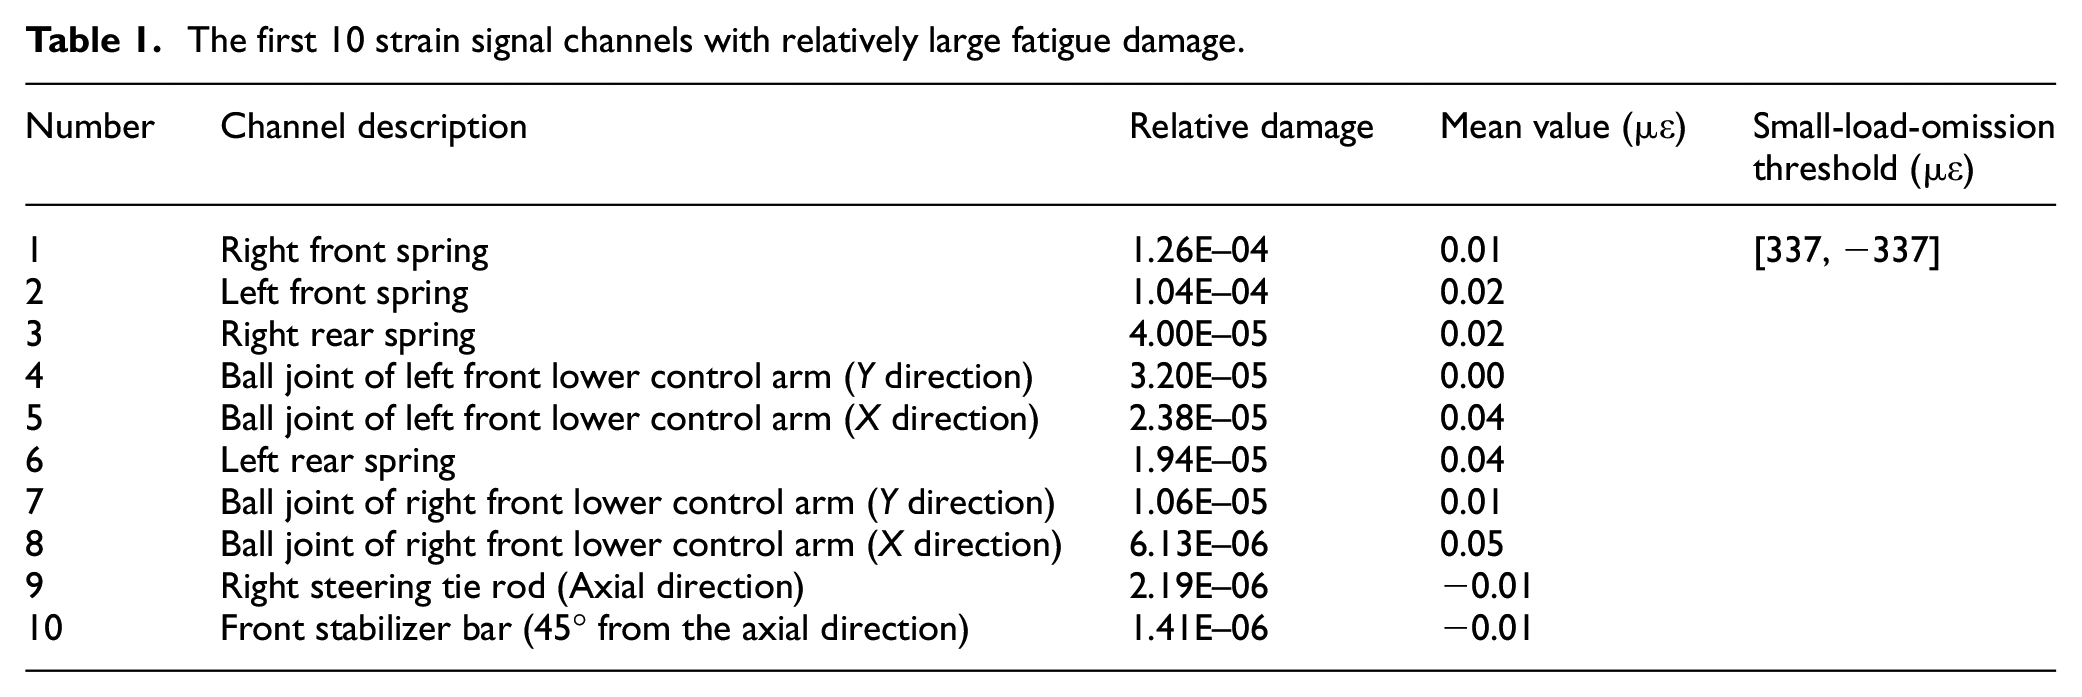
To reduce computation time, the first 10 strain signal channels with relative large fatigue damage were selected as the reference channels for identifying useless load-time segments. As the purpose was to compare fatigue damage potentials among different strain load spectra, a precise calculation of fatigue damage was unnecessary. Therefore, a standard S-N curve of the material, Carbon Steel SAE1050_189_CON (with an ultimate tensile strength of 637 MPa, yield strength of 475 MPa, Young’s modulus E of 210,000 MPa, S-N curve slope b of –0.0992, and S-N curve transition point NC1 of 1 × 10⁶ cycles), was used to calculate fatigue damage of the strain signals. The first 10 strain channels with relatively large fatigue damage are listed in Table 1. Before the damage calculation, the strain signals were transferred to stress by multiplying the Young’s modulus E. Table 1 also shows the mean value and the small-load-omission threshold of each reference strain channel. The same small-load-omission threshold, [337 με, −337 με], was set for all strain channels because the mean value of each channel was nearly the same and approximating zero.
The first 10 strain signal channels with relatively large fatigue damage.
Accelerated load spectra editing
As described in Section 2.1, firstly, the original load spectra including all load signal channels were input. After signal preprocessing, the reference strain channels and the four-wheel spindle noses vertical acceleration channels were separated. For the reference strain channels, firstly, the small-load-omission threshold and time-duration-filtering threshold were set, then useless strain load-time segments were identified and a feature list that contains the detailed time axis locations of the identified useless load-time segments was generated. Subsequently, the time axis locations of the useless load-time segments were marked on the strain and acceleration channels simultaneously, as shown in Figures 10 and 11. Then, the marked useless load-time segments were sliced and removed simultaneously from the original load spectra by applying the STTE method associated with the window function based signal concatenation method. Through the above steps, finally the accelerated load spectra were acquired. Load-time history comparisons between the original load spectra and the accelerated load spectra of strain and acceleration signals are shown in Figures 12 and 13 respectively. The accelerated load spectrum was 205 s in length, about 33% of the original load spectrum which was 625.8 s in length. Hence, the test time was significantly reduced by applying the STTE method while the load sequences and multi-channels phases were well retained.
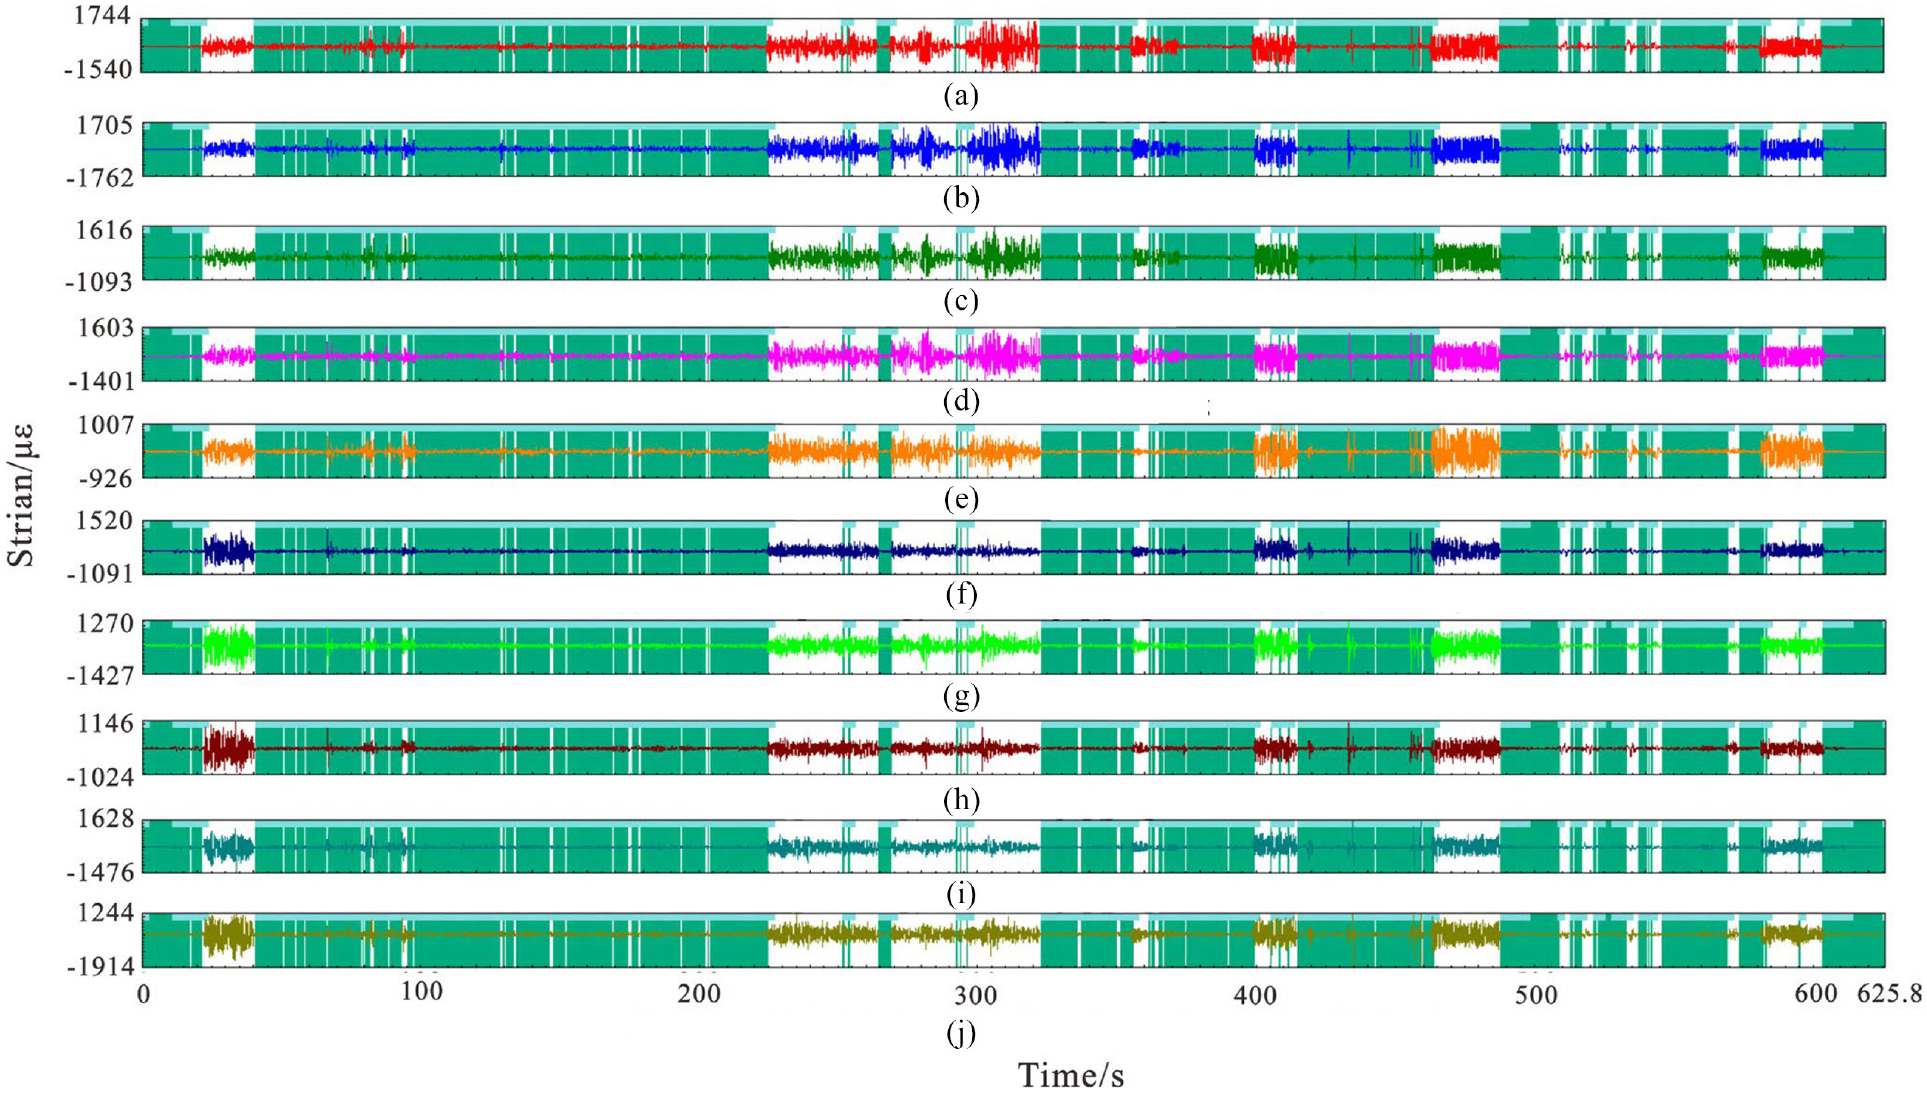
Useless load-time segments marked on the reference strain channels: (a) Channel 1: left front spring, (b) Channel 2: left front spring, (c) Channel 3: left rear spring, (d) Channel 4: right rear spring, (e) Channel 5: front stabilizer bar (45° from axial direction), (f) Channel 6: ball joint of right front lower control arm (X direction), (g) Channel 7: ball joint of right front lower control arm (Y direction), (h) Channel 8: right steering tie road (axial direction), (i) Channel 9: ball joint of left front lower control arm(X direction), and (j) Channel 10: ball joint of left front lower control arm (Y direction).
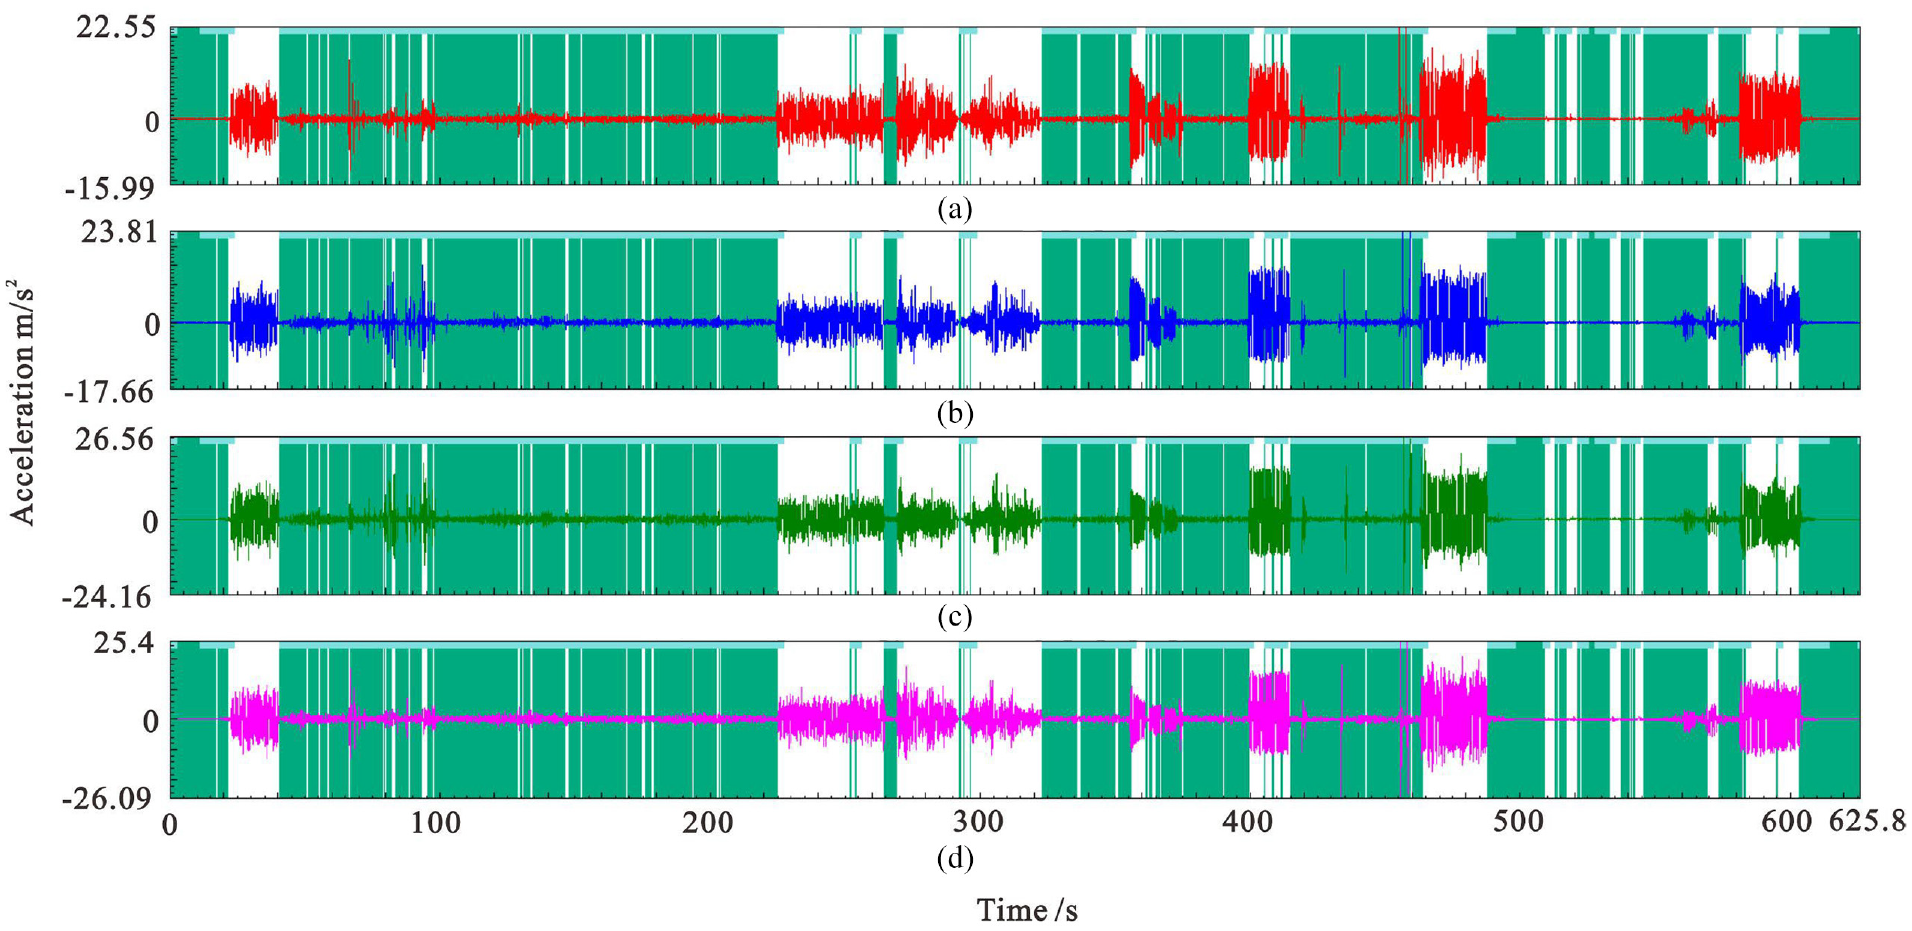
Useless load-time segments marked on the acceleration channels: (a) vertical acceleration of right-front wheel spindle nose, (b) vertical acceleration of left-front wheel spindle nose, (c) vertical acceleration of left-rear wheel spindle nose, and (d) vertical acceleration of right-rear wheel spindle nose.
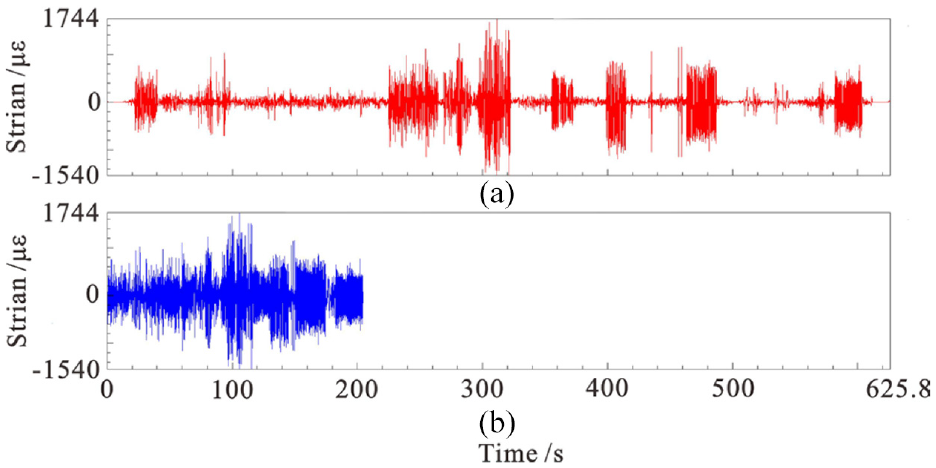
Load-time history comparison of the original and accelerated strain spectrum: (a) the original strain load-time history and (b) the edited strain load-time history.
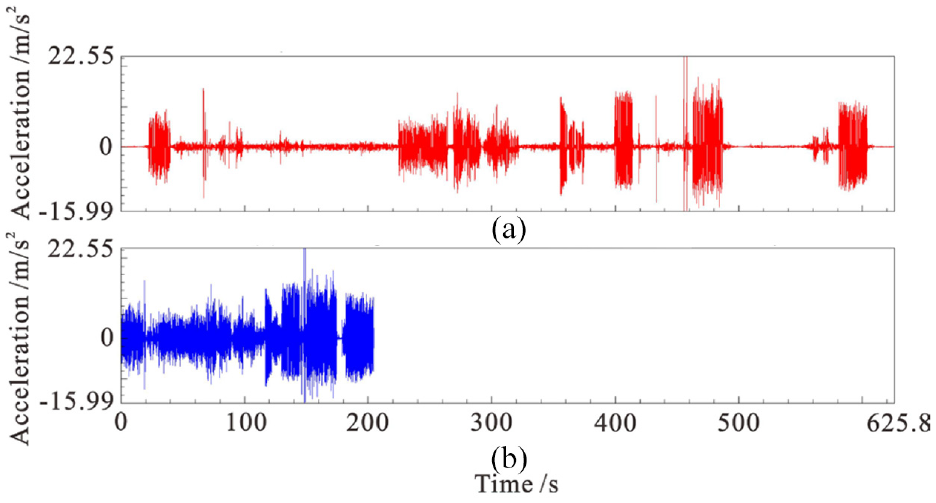
Load-time history comparison of the original and accelerated acceleration spectrum: (a) the original acceleration load-time history and (b) the edited acceleration load-time history.
Accelerated load spectra analyses
The purpose of a road simulation test is to reproduce vehicle service loads in laboratory. Before applying the accelerated spectra to conduct durability test, characteristics of the accelerated spectra should be thoroughly analyzed to make sure that it well retained the original spectra properties.
Amplitude domain analyses
Generally, amplitude domain properties of a load spectrum are dominant for fatigue. In the present study, level crossing counting and rain-flow cycle counting methods were applied to analyze the accelerated spectra characteristics. Through level crossing counting, load spectra are presented as numbers of peak values occurring above certain load levels. The counting results can give indications of the sizes of the positive and negative peak values and their frequency of occurrence. This information is instructive for comparing load spectra with different severities. For the level crossing counting, the reference levels were set as the mean values of the spectra, and the number of counting levels was set at 256. The counting results of the original spectrum and accelerated spectrum are shown in Figure 14, where the full line represents the original spectrum, and the dash line represents the accelerated spectrum. The result showed that a large number of small-amplitude-loads were omitted while large-amplitude-loads were well retained in the accelerated spectrum. Additionally, the distribution patterns of large peak loads of the original and accelerated spectrum were nearly the same.
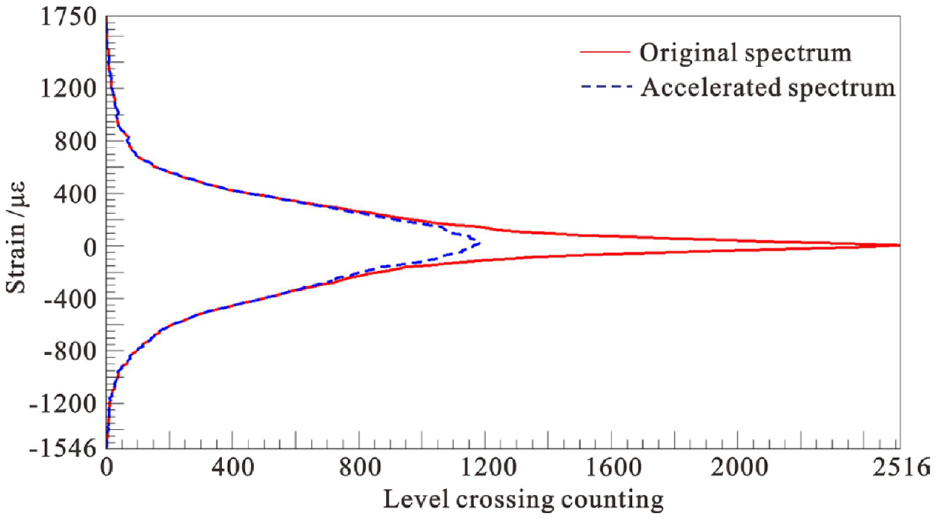
Level crossing counting of the original and accelerated load spectrum (taking the strain of the left-front spring as an example).
The rain-flow counting method developed by Matsuishi–Endo is regarded as the best procedure to recognize the damaging events in a complex loading history. The rain-flow cycle counting principle extracts hysteresis loops from the load signal. Closed hysteresis loops are registered in the stress-strain path, which governs metal fatigue. The rain-flow information is crucial for the differences of loading spectra in terms of fatigue damage. 33
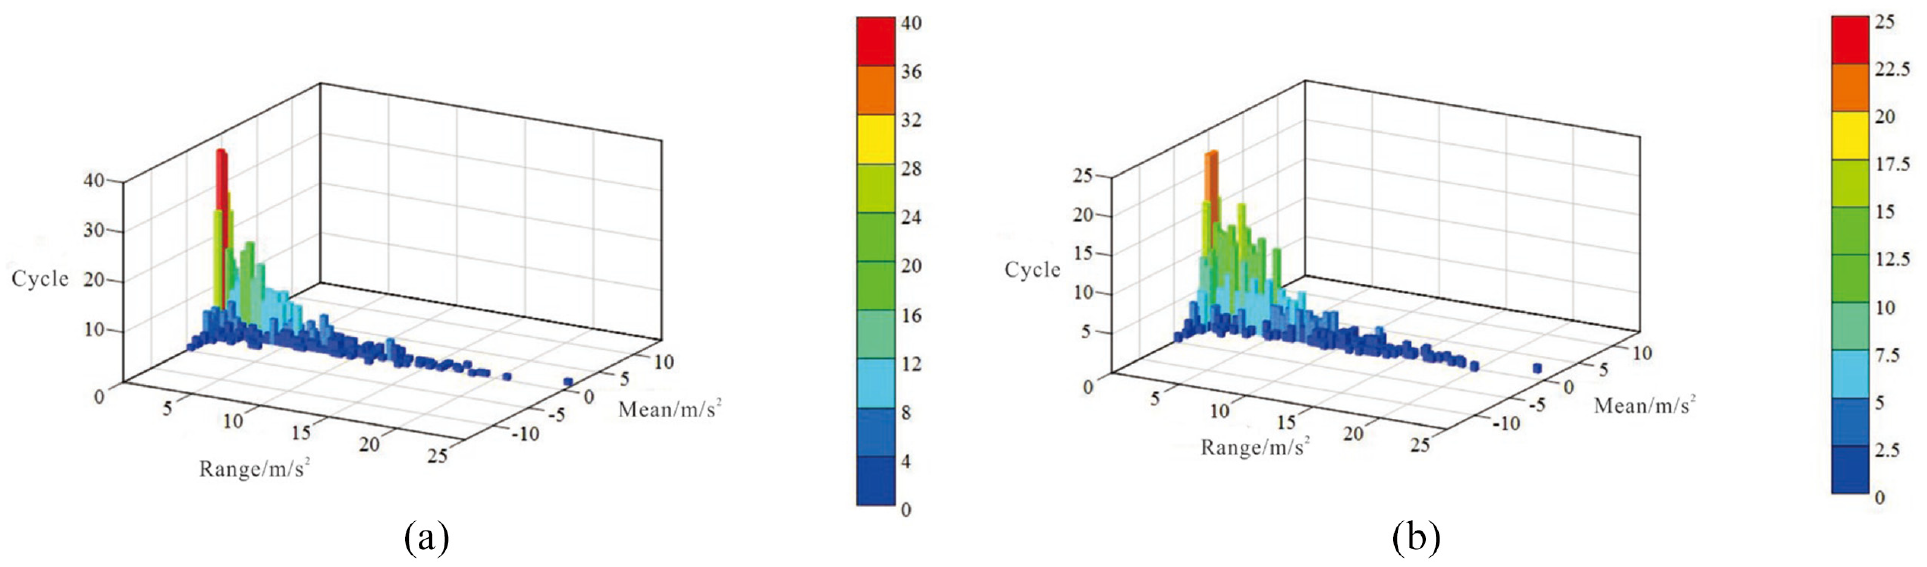
The rain-flow counting results, which are displayed in the “Range-Mean” histogram type, of the original and accelerated spectrum are shown in Figure 15, where the number of counting levels is set at 64. The two histograms were set at identical vertical axes scales for comparison convenience. The counting results showed that a large amount of small load cycles, which contribute to metal fatigue negligible, were omitted in the accelerated spectrum while the large amplitude loads were well retained.
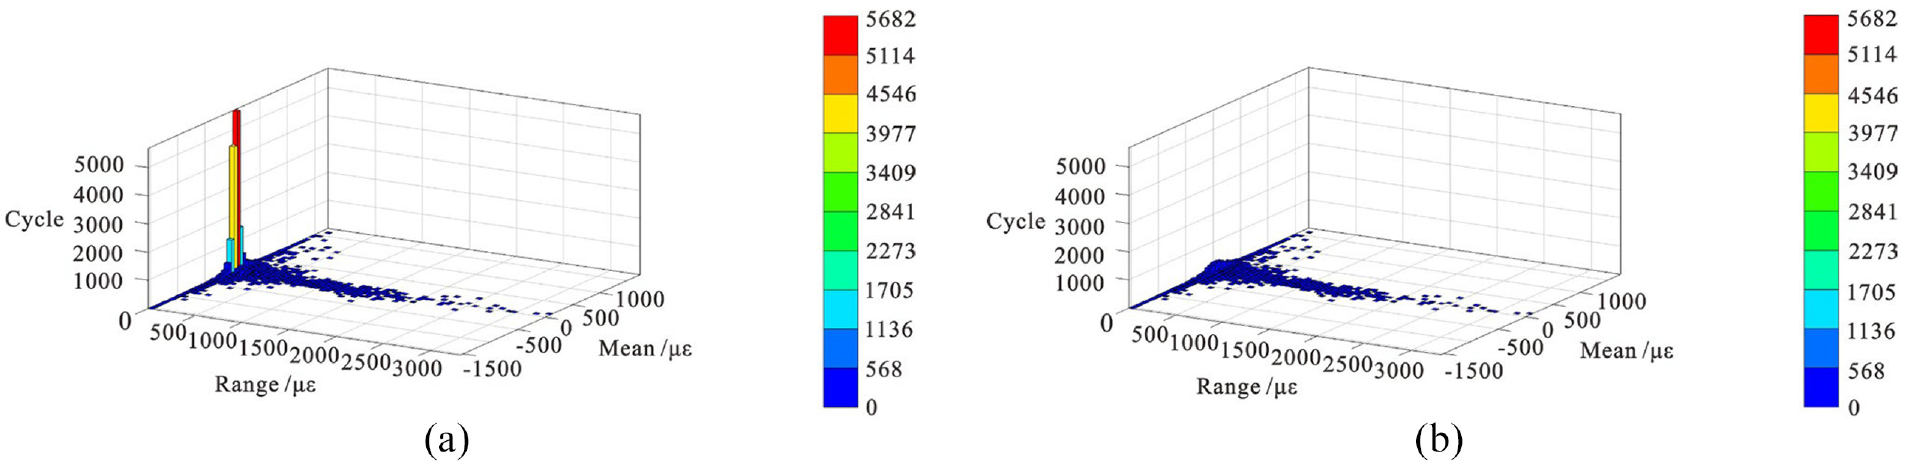
Rain-flow counting of the original and accelerated spectrum (taking the strain of the left-front spring as an example):(a) rain-flow counting of the original spectrum and (b) rain-flow counting of the accelerated spectrum.
Frequency domain analyses
Load spectrum analyses from the amplitude domain is necessary and important. However, acquiring the frequency properties of outer excitations, which also influence the component fatigue, is necessary. For the frequency domain analysis, power spectrum density (PSD) was suggested for analyzing the load spectra.
The original spectrum and accelerated spectrum are shown in the form of PSD in a bandwidth of 0–100 Hz in Figure 16, where the PSD amplitude is expressed in “(m/s2)2/Hz.” The PSD level of the accelerated spectrum was found to be higher than the original spectrum, while the distribution trends under different frequencies were similar, therefore, the same failure mechanism was guaranteed. During the process of load spectra editing, large amounts of small-amplitude-loads with relatively low powers were deleted from the original spectrum, therefore, the average power of the accelerated spectrum was higher than that of the original spectrum, which caused the PSD level increasing in the accelerated spectrum.
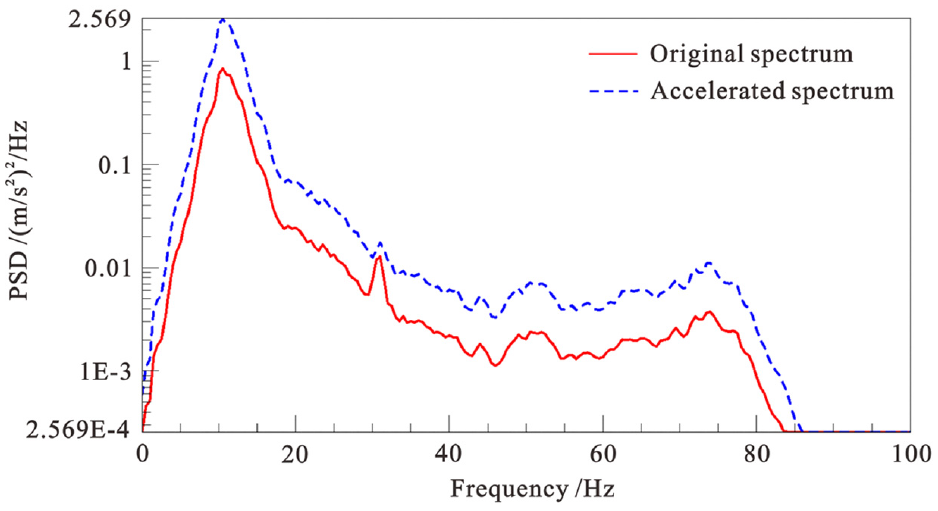
Comparisons of the PSDs of the original spectrum and accelerated spectrum (taking the vertical acceleration of the right-front wheel spindle nose as an example).
To conclude, the original spectrum and accelerated spectrum were also equivalent in terms of frequency characteristics. The accelerated spectra were shortened in time while the amplitude and frequency fatigue properties of the original spectra were well retained. Theoretically speaking, the fatigue properties of the accelerated spectrum showed good consistency with the original spectrum, and the accelerated spectrum can substitute the original spectrum to conduct durability test.
Vehicle road simulation test validation
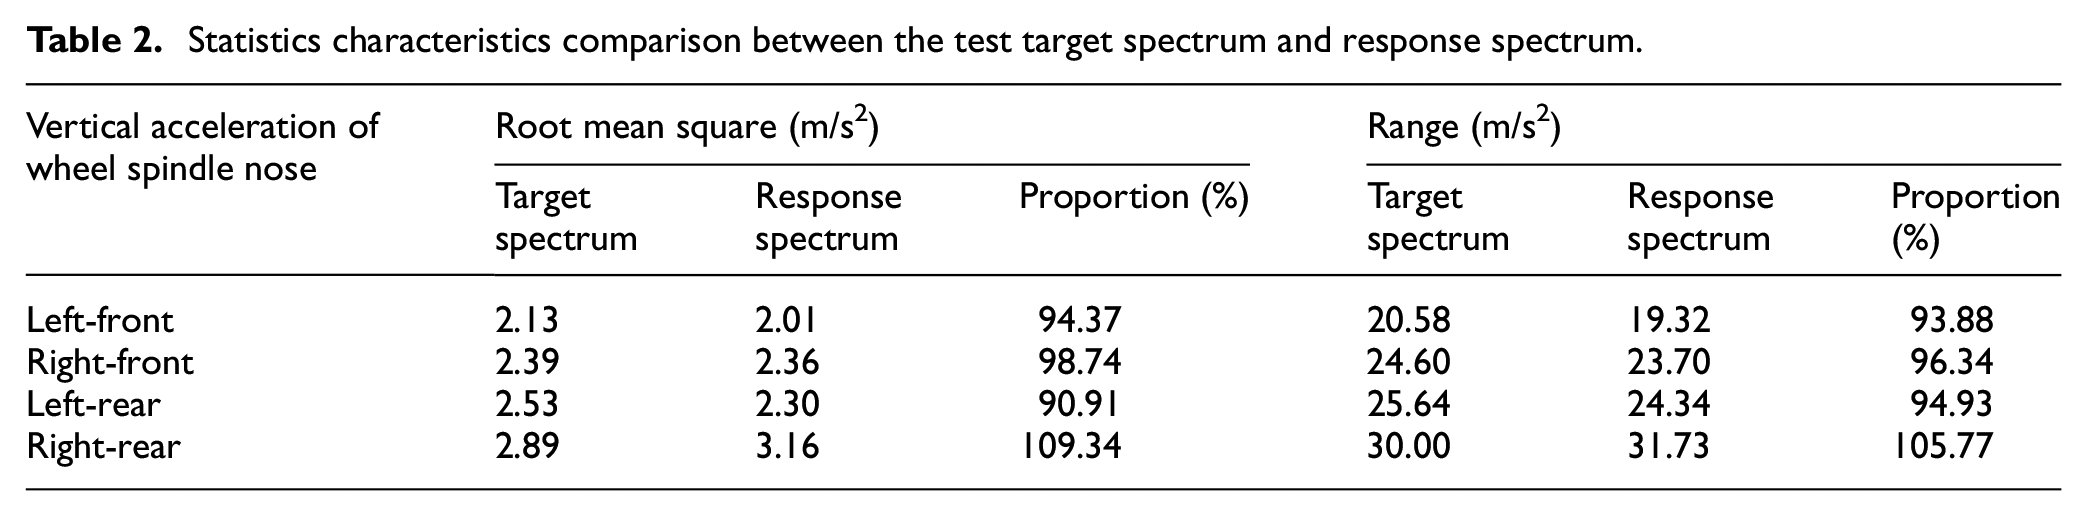
In order to study the effectiveness of the accelerated load spectra in terms of actual test application, a road simulation test was conducted by using a four-post bench, as shown in Figure 17. Before conducting the test, the same accelerometers applied at the same positions as those of PG road load spectra collection were set in order to acquire the test response spectra and monitor the test performance. At the beginning of the test, the accelerated load spectra were selected as the test target spectra. Then, the driving profiles of the four hydraulic actuators of the four-post bench were acquired by an iteration process. During the iteration process, the accelerated load spectra of vertical acceleration of the four-wheel spindle noses were selected as the iteration target, and the error threshold was set at 10%. By real-time observation of the difference between the test target spectrum and response spectrum, the iteration process was carried out systematically to acquire minimal iteration error. The load-time histories comparison between the test target spectrum and the final test response spectrum is shown in Figure 18. The load-time history of the target spectrum was simulated and reproduced fairly well in the response spectrum. The PSD levels comparison is shown in Figure 19, which also shows well load simulation effect. The rain-flow counts comparison is shown in Figure 20, showing that the rain-flow cycles distributions, especially for the large amplitude loads, were nearly identical for the target spectrum and response spectrum. Statistics characteristics comparison between the test target spectrum and response spectrum is listed in Table 2, which shows that the proportions of all statistics characteristics vary from 90% to 110% within an ideal range. The characteristics of the test response spectrum showed good consistency with the test target spectrum. Therefore, by conducting the iteration test, the validity and effectiveness of the accelerated spectra were verified.
Statistics characteristics comparison between the test target spectrum and response spectrum.
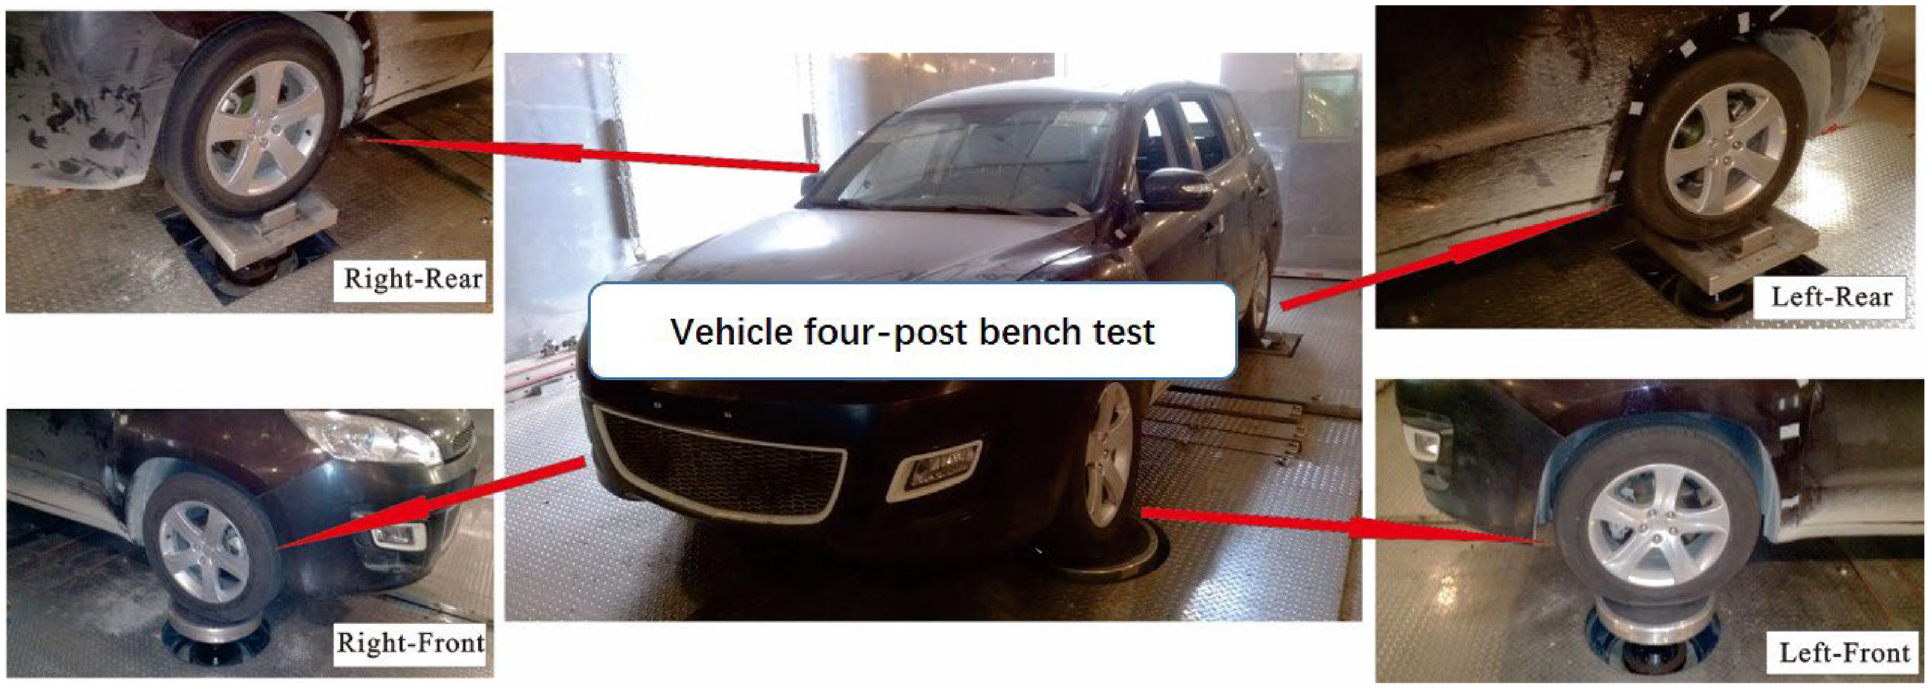
Four-post bench test of the test vehicle.
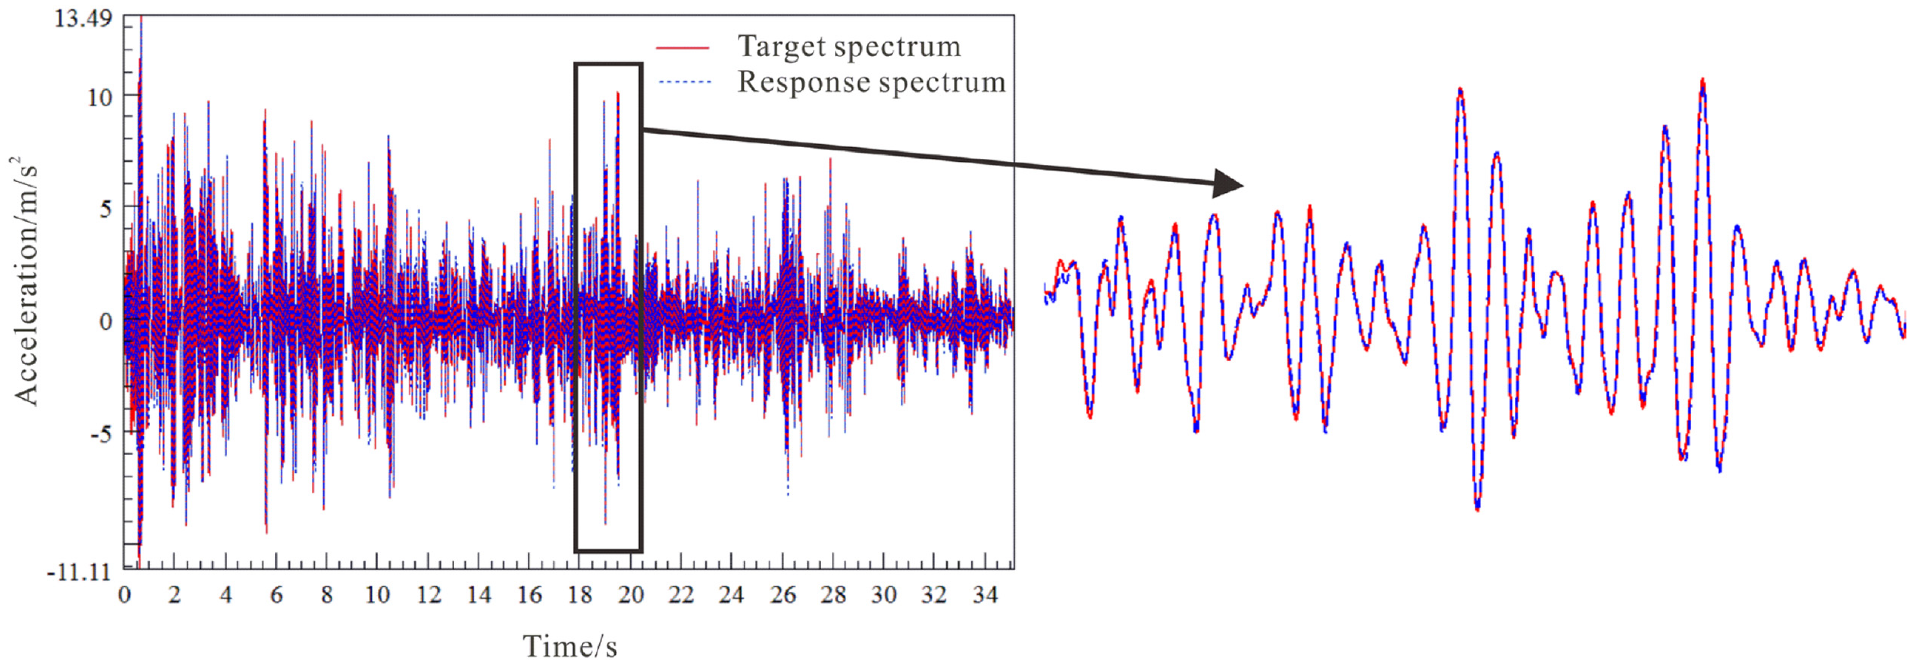
Load-time histories comparison between the test target spectrum and the final test response spectrum (taking the vertical acceleration of the right-front wheel spindle nose as an example).
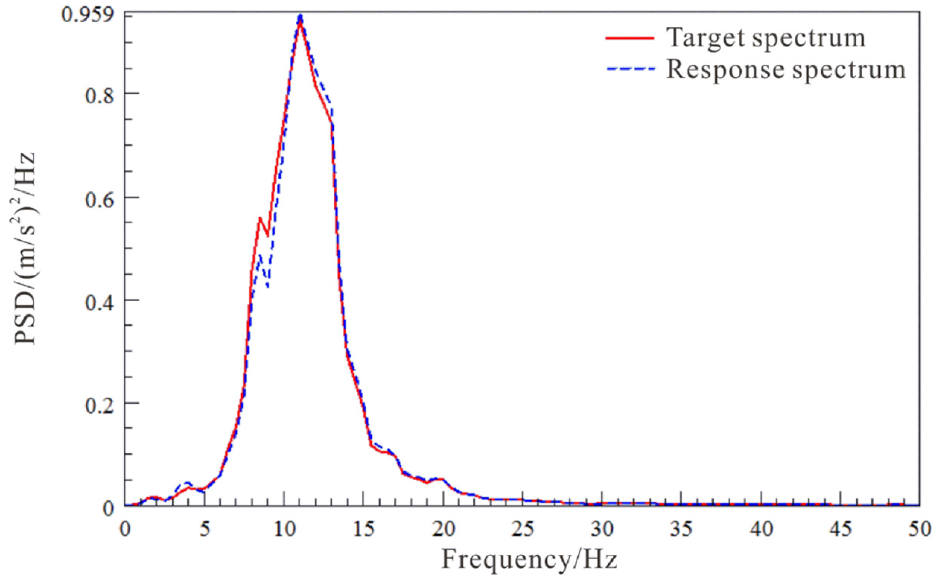
PSD levels comparison between the test target spectrum and the final test response spectrum (taking the vertical acceleration of the right-front wheel spindle nose as an example).
Rain-flow counting of the target spectrum and the response spectrum (taking the vertical acceleration of the right-front wheel spindle nose as an example): (a) rain-flow counting of the target spectrum and (b) rain-flow counting of the response spectrum.
Conclusion
An accelerated load spectra compilation technique and a window function based signal concatenation method were proposed for the load spectrum compilation of road simulation test. From the PG load spectra collection to the vehicle four-post bench test, the process of the accelerated load spectra generation and application was specifically discussed. The main points can be concluded as follows:
A load spectrum two-dimension time-domain-threshold editing method (STTE) was proposed to edit the load spectra for road simulation test. The STTE method was convenient for engineering application as only two parameters, small-load-omission threshold and time-duration-filtering threshold, were considered. The small-load-omission threshold was calculated according to low load strengthening characteristic. The time-duration-filtering threshold can be determined by engineering experience.
A window function based signal concatenation method was proposed to smoothly concatenate the adjacent retained load-time segments after deleting the identified small amplitude load-time segments. The signal concatenation effect of different window functions was studied, and the Hanning window function was found to be a proper choice for load spectrum smooth concatenation.
The accelerated spectra were reduced to 205 s in length, which was about 33% of the original spectra. Amplitude and frequency domains analyses showed that the large amplitude damage cycles were well-retained in the accelerated spectra while the test time was considerably reduced. The original spectra properties were well-retained by applying the proposed STTE technique and the window function based signal concatenation method.
Finally, the accelerated load spectra were applied as the test target spectra to conduct vehicle four-post bench test. The test response spectrum showed good consistency with the test target spectrum in terms of load-time history and PSD frequency level. Therefore, the effectiveness and validity of the proposed load spectra generation method were verified.
Footnotes
Appendix
Declaration of conflicting interests
The author(s) declared no potential conflicts of interest with respect to the research, authorship, and/or publication of this article.
Funding
The author(s) disclosed receipt of the following financial support for the research, authorship, and/or publication of this article: The authors would like to express their gratitude to the Natural Science Foundation of Shanghai (21ZR1428000), the Automobile Industry of Shanghai Science and Technology Development Foundation (1740) for supporting this research.