
Abstract
Trailing edge-integrated lobed-mixing geometries are proposed as a viable method for road vehicle aerodynamic drag reduction. Experiments are conducted on a 1/24th-scale model, representative of a Heavy Goods Vehicle, at a width-based Reynolds number of 2.8 × 10⁵. A broad range of pitches and penetration angle values is examined, with detailed comparisons also made to high-aspect-ratio rear tapering. Changes to mean drag coefficients and wake velocities are evaluated and assessed from both the time-independent and time-dependent perspectives. Results show significant drag reductions for lower pitches at higher penetration angles, where the performance of regular tapering is found substantially degraded. The mechanisms responsible for drag reduction are identified to be reductions in the wake size and a shift in the vertical wake balance. The former is shown to be a result of the enhancement in inboard momentum close to the trailing edges through the generation of pairs of counter-rotating streamwise vortices, with the latter attributed to the downstream evolution of the vortices. Overall, these results identify such geometries to be suitable for improving vehicle drag while minimising the losses in internal space.
Introduction
Drag reduction of road vehicles remains a key issue at the centre of action against climate change. Within the UK, the transport sector continues to be the largest contributor to greenhouse gas emissions, constituting 28% of all emissions in 2018. 1 Despite accounting for only 5% of total vehicle miles, 2 heavy goods vehicles (HGVs) produce up to 18% of the CO2 emitted by all road transport. 3 At motorway speeds, where these vehicles spend most of their time, as much as 50% of the consumed fuel is spent on overcoming the aerodynamic drag. 4 Understandably, drag reduction concepts are eagerly pursued by many researchers. For typical articulated HGVs the base region is of particular interest, accounting for 25%–35% of total aerodynamic drag.5–7 The wake generated locally by the flow separating from the blunt trailing edges produces low static pressure regions close to the base. Aside from having adverse effects on the vehicle’s forward motion, the specific dynamics of the wake often degrade the vehicle’s stability.
One of the early methods for base pressure drag reduction was a full-boat tail, offering benefits of up to 35%, 8 later replaced with a truncated version offering similar drag reductions at shorter streamwise lengths.8,9 Efforts to optimise the boat-tail led to the introduction of straight-walled cavities. Mason Jr and Beebe 10 reported up to 5% reduction in drag of a HGV model with such a device. The principal action of rear cavities was found to be an increase in the base pressure through a relative downstream shift of the low-pressure wake. Later arrangements included offset cavities, whereby the cavity panels are fixed inboard of the trailing edges.11–13 One of the effects of these configurations was the entrapment of vortices within the offset corners. 11 Khalighi et al. 13 reported drag reductions of up to 18%–20%, with Storms et al. 12 showing a similar benefit at 19%. The wake was shown stabilised through suppression of large-scale vortical structures, with the boat-tailing effect reflected in a generally narrower wake. 13 In the following years, many studies focused on boat-tailed cavities. Grover and Visser, 14 as well as Schaut and Sengupta 15 reported such configurations to result in fuel consumption improvements of up to 10% and 13%, respectively. Drag reductions of up to 12% were reported by van Raemdonck and van Tooren, 7 with Salati et al., 16 also measuring similar benefits (9%). Often, the drag reduction is dependent on the varying boat-tail angle (α), with most studies agreeing the optimum to be generally within 10° < α < 15°.7,14–19 Unfortunately, due to the European vehicle length restrictions, 20 these add-on devices remain somewhat more of a theoretical concept, with limited practical use.
Similar results may be achieved with body tapering, whereby the streamlining is attained with no added length. The main drawbacks, however, are the absence of a rear cavity and significant reductions in internal space. Hirz and Stadler 21 showed that there exists a limit to the drag reduction achieved with top surface tapering, whereby beyond it, further reductions in trailer payload space result in only marginal drag variations. One solution to this problem could be the use of high-aspect-ratio trailing edge tapers. In such cases, the modifications only affect small portions of the trailer’s dimensions, substantially reducing their impact on the overall volume. Littlewood and Passmore 22 reported that such tapers applied to the top trailing edge can reduce drag by up to 2.7% at α = 4° and 4.4% at α = 15°. Perry et al. 23 confirmed this trend, suggesting that extreme top edge tapers have no further effect on drag, with maximum benefit of approximately 5% achieved with inboard α = 16° and α = 6° along the top and bottom trailing edges, respectively. In contrast, the authors suggested that high-aspect-ratio tapers along the vertical edges may be more beneficial, with up to 7% drag reduction at α = 12° along the sides. 23 Similar conclusions were also drawn by Hirz and Stadler. 21
Another common drag reduction concept is the injection of streamwise vorticity aimed at energising the local flow. Vortex generators (VGs) have been used for this purpose in many applications. The vortices generated by these devices modify the local boundary layer to allow greater tolerance of adverse pressure gradients, ultimately delaying or suppressing the flow separation. Placed at a fixed separation point, VGs normally improve the mixing within the free mixing layer by enhancing flow entrainment. Park et al. 24 reported a 33% increase in base pressure of a two-dimensional bluff body with arrays of rectangular tab VGs at the trailing edges, resulting directly from the vortex dislocation generated by a non-uniform velocity distribution at separation. A reduction in the separation region of up to 20% was also shown by Duriez et al. 25 with the use of cylindrical VGs. Lav 26 reported reductions in drag of up to 9.1%, accompanied by a characteristically tapered wake. Similar results were also presented by Pujals et al. 27 with up to 10% reduction in drag, and Wood 5 with fuel economy improvement of 1%–5%. Other studies, however, noted either only marginal drag benefits (1.2%–1.7%)28,29 or overall increases in drag.28,30 The research suggests that while the supplementary vorticity results in increases in base pressure, the additional induced drag may outweigh the benefits. To better understand the significance of the various drag reduction studies discussed, Table A1 in the Appendix presents a summary of their key characteristics. It is clear that the resulting drag benefits vary not only for different devices, but also between the experimental setups, with smaller simplified bodies generally presenting higher reductions, albeit not in all cases. These trends show that the comparative performance may be more informative than the absolute values and emphasise the risks of making wide-ranging conclusions based on limited data.
Mixing enhancement can also be achieved with the use of a lobed mixer – a device common within the aerospace field – through an increase in the interface area and an introduction of strong streamwise vorticity. Streamwise vortices are generated through non-uniform aerodynamic loading along the mixer’s span, with the strength normally dependent on the specific lobe profile, pitch and penetration angle.31–34 Transverse structures typically shed from the trailing edges become deformed by the counter-rotating pairs of streamwise vortices, resulting in an early breakdown and a significant enhancement in mixing within short downstream distances.35–38 The lobed mixer was first applied for jet noise reduction. 39 Smith et al. 33 reported a 30% improvement in mixing with a lobed fuel injector relative to a straight edge, with similar results also achieved by Depuru Mohan et al. 40 who showed faster centreline velocity decay of the jet core. Hunter et al. 41 reported the secondary flow produced by lobes at the aerofoil trailing edge to be an effective means of wing-tip vortex dispersion for marine vehicles. The same physics have also been found to enhance heat transfer in heat exchanger devices. 42 Further applications include ejectors for infrared signature suppression in helicopters, 43 and reduction of reattachment length in transonic flows. 44 Lobed mixer configurations have also been shown to enhance mixing 45 and combustion performance 46 within supersonic mixing layers. Howard and Goodman 47 and Paterson et al. 48 suggested similar geometries to have the potential for drag reduction on a range of bluff bodies. More recently, Rejniak and Gatto 49 applied the lobed mixer geometries to the trailing edges of a boat-tailed HGV model. Reductions in drag coefficient of up to 10.2% were found, with the lobes demonstrated to generate pairs of counter-rotating streamwise vortices, as in the other applications. Enhanced mixing within short distances from the trailing edges was also evident in significant local increases in turbulent kinetic energy relative to the unmodified boat-tail. This study demonstrated the potential of lobed mixer geometries to enhance the performance of more extreme-angled boat-tails.
Following from the work of Rejniak and Gatto, 49 this study investigates the effects of integrating the lobed mixing geometries directly into the vehicle’s trailing edges. This design aims to provide a solution more readily adaptable to real vehicles. A wide range of lobe pitches and penetration angles is studied on a small-scale HGV model. To further strengthen the confidence in the results, the effects of a range of high-aspect-ratio tapers, a well-established concept, on the same model are also evaluated for comparison. Drag is measured for all configurations, with hot-wire anemometry used for evaluation of the flow-field at the model’s base. A detailed assessment of the flow directly behind the lobed mixer geometries is also presented. Additionally, unsteady aspects are evaluated to assess the impact on the time-dependent characteristics of the wake.
Experimental setup and apparatus
Baseline model
The baseline used (Figure 1) is a simplified 1/24th-scale model (width, W = 110 mm) representative of a HGV. This model is based on the one used by Rejniak and Gatto,49–51 but incorporates a more streamlined tractor profile to minimise frontal flow separation. Constructed from Perspex, the baseline consists of two primary components: a tractor and trailer bottom section, and a trailer. In this design, the trailer is allowed to “free-float,” contacting the other part at three points: through a load cell and connecting rod at the front face (rigidly fixed), and two sliding contacts further back. The trailer is constructed as a box, with the top, side and rear faces removable to allow changes between various configurations without altering the trailer position. The tractor-trailer gap is kept relatively small (0.09 W) to minimise any possible development of significant unsteadiness unrelated to the base wake, degrading signal quality of the load cell. The model is equipped with eight fully rotating aluminium wheels fitted with bearings and linked by steel axles.
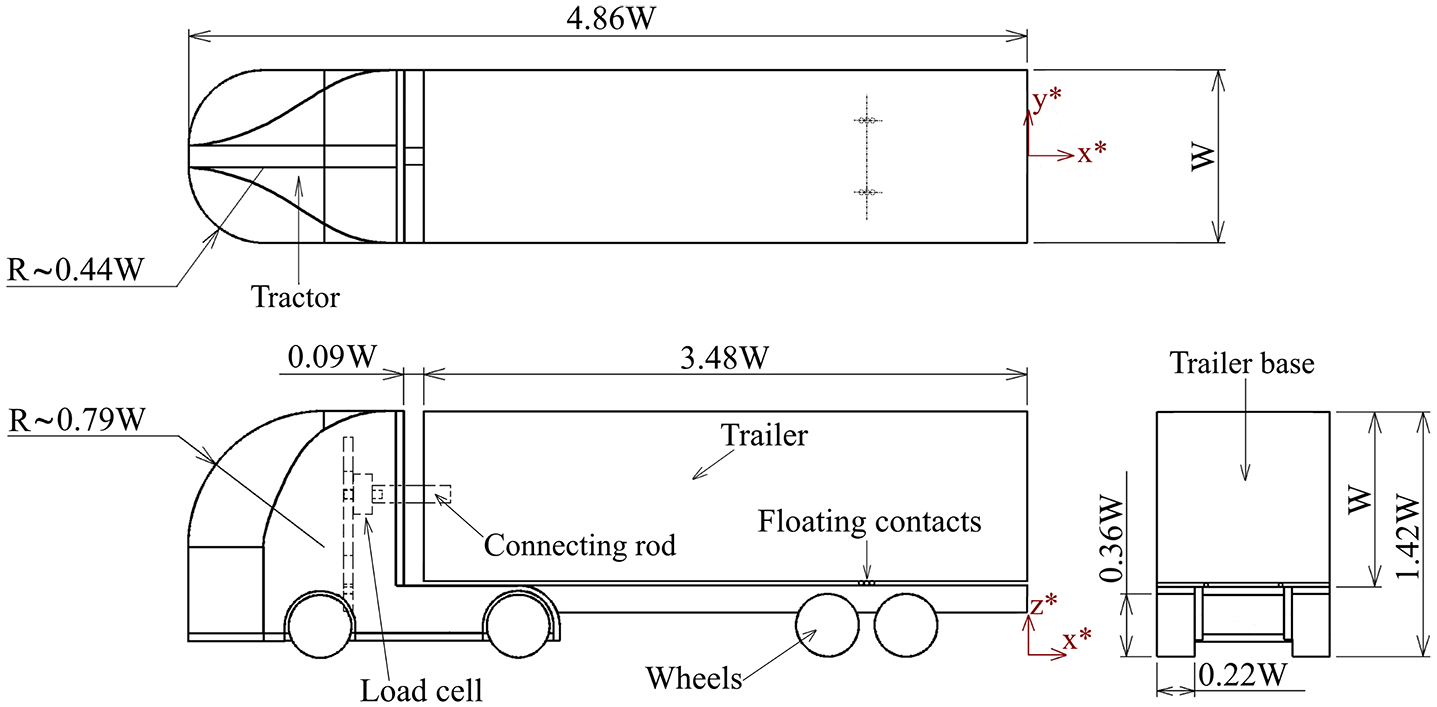
Schematic of baseline model.
Inside the test section, the model is installed via an L-shaped metal support of thickness 0.02 W attached to the tractor’s underside and extending upstream by 1.05 W, where it is fixed to the floor, as presented in Figure 2(a). The model is positioned along the wind tunnel centreline (y* = 0), with the nose Δx* = 3.3 downstream of the leading edge of a front flow splitter. The sting is located close to the ground (0.01 W), below the front stagnation position of the model, to minimise its overall impact. This technique has been previously studied 51 alongside more typical mounting from the sides or top on a similar model, showing improved base flow-field characteristics. The use of the upstream sting was found to produce little flow interference at the base, having also a weak influence on the overall wake dynamics. 51 Additionally, the front support setup showed little impact on the underbody exiting flow, retaining the effects of moving ground use observed with the top strut typically used for such applications. Based on these results, 51 the upstream sting support was favoured for the current study.
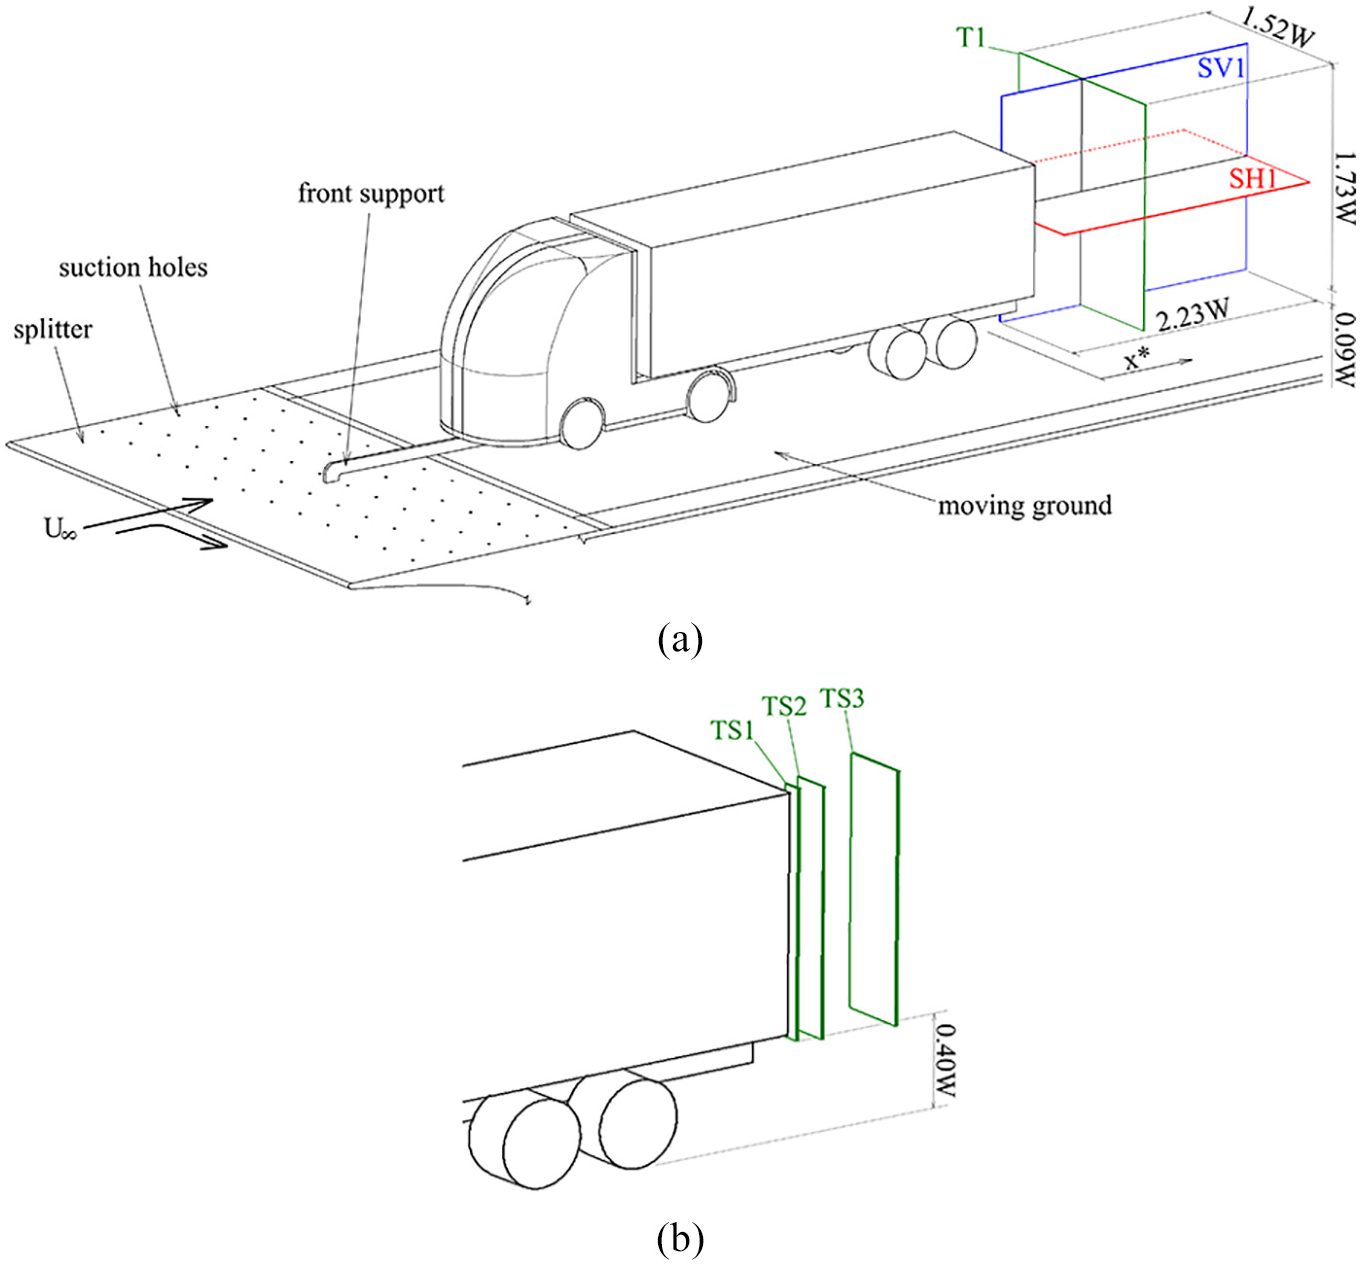
Schematic of the model setup and HWA measurement planes: (a) T1, SV1 and SH1; (b) TS1-3.
Trailing edge configurations
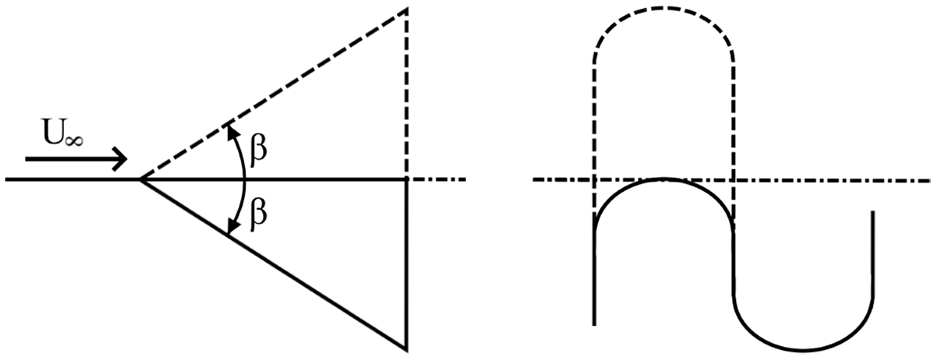
Integrating the lobed mixing geometries directly into the vehicle’s trailing edges aims to deliver a more practical solution likely to be suitable for real applications. Following from the work described by Rejniak and Gatto 49 on a boat-tailed vehicle, here the lobed profiling is achieved by cutting longitudinal grooves in the model’s trailing edges, each sloping inboard and generating a penetration angle (β) relative to the freestream. The profiling is such that the lobes which would normally protrude (outboard penetration angle relative to the axial flow) are reduced to β = 0°, as presented in Figure 3. This design is selected to prevent any changes in the overall model width and length.
Schematic of the studied lobe profiles.
Alongside the baseline (non-modified), 39 different lobed mixer configurations (LBT) are studied. Geometries vary in lobe pitch (p) in the range of 0.027 < p/W < 0.105 and penetration angle between 5° < β < 30°. Additionally, a series of conventional boat-tail tapers (BTT) are also assessed for comparison, with the taper angle (α) varying between 5° < α < 30°. Schematics of the trailing edge modifications are presented in Figure 4 ((a) – LBT, (b) – BTT). Such modifications, as presented in Figure 4, are applied to the top and side trailer faces with the bottom edge unaltered. All profiling (LBT and BTT) is applied to identical portions of the trailing edges, extending over 91% of the edge length, with the end portions kept unmodified to enable trailer assembly. The height h (Figure 4) remains identical for all configurations, with h = 0.045 W along the trailer sides and h = 0.027 W along the top. The small height is selected to create high aspect ratio modifications, ensuring the effect of the geometry on the trailer volume is minimised, with h less than 5% of the model width. All modifications are manufactured with identical smooth surface finish. For all configurations, both the isolated and combined effects of the top and sides are studied.
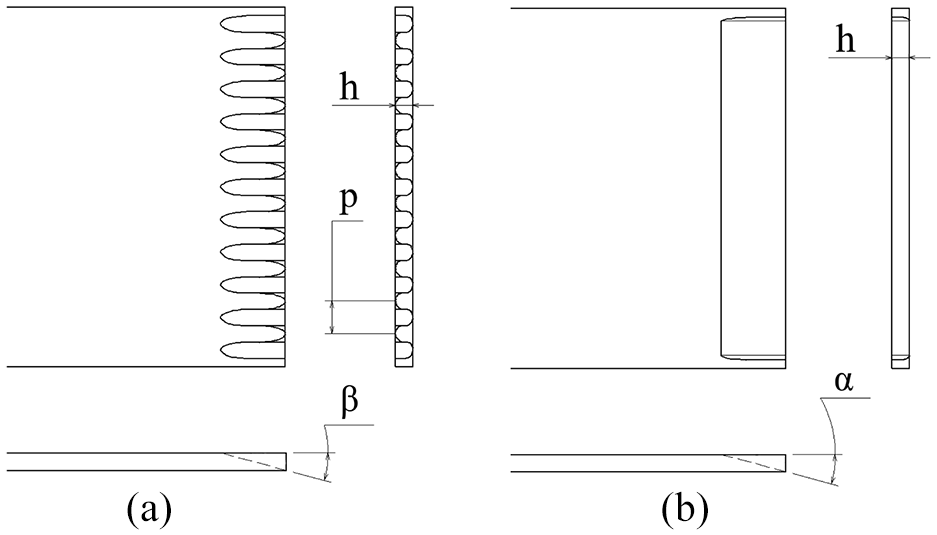
Schematics of lobed trailing edge LBT (a) and boat-tail taper BTT (b).
Wind tunnel
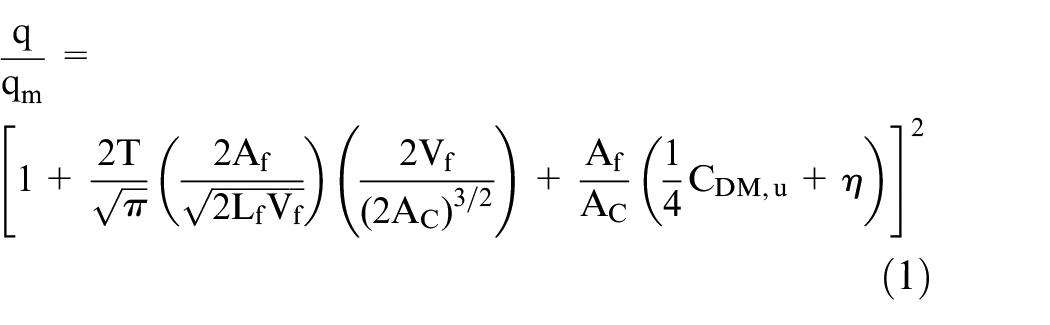
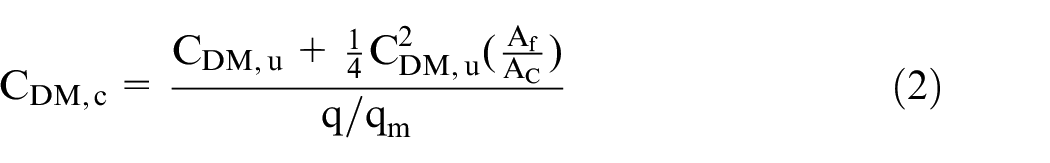
All experiments are conducted in an open-circuit wind tunnel with a closed test section measuring 1.3 m long, 0.46 m wide and 0.36 m high. The freestream velocity is U∞ = 37 m/s, resulting in a width-based Reynolds number of ReW = 2.8 × 10⁵ (ReL = 1.4 × 10⁶). Freestream uniformity, turbulence intensity and heightwise velocity consistency at a central test section (empty) position are ±1%, 0.5% and ±1%, respectively. Based on the model frontal area, the solid blockage ratio is 10%, being considerably below the 15% limit suggested in SAE J1252. 52 All data is corrected for blockage using Mercker’s method, 53 with dynamic pressure and drag coefficient corrected by equations (1) and (2), respectively. This method was chosen based on its suitability for other similar models.54,55 As recommended by Cooper, 56 all data is corrected with η = 0.41.
The wind tunnel includes a moving ground with a centrally mounted belt, Δy* = 3.27 wide and Δx* = 7.5 long. The belt speed is matched to freestream velocity within ±1 m/s and monitored using LabVIEW software. Its motion precipitates wheel rotation. Suction is applied to the underside of the belt to prevent lifting during operation, with cooling water circulated through the floor to aid heat rejection. When operating, the freestream velocity profile is within 0.9 < u* < 1 a distance z* ≥ 0.045 above the floor, with a front splitter incorporating suction holes installed to further reduce boundary layer development (Figure 2(a)).
Load measurements
The load cell used in all tests is an RDP Electronics Model 31 single axis tension/compression load cell of full-scale output of 44 N. The mounting position, load cell, and rod used to connect tractor and trailer are shown in Figure 1. This arrangement allows the measurement of isolated drag of the “free-floating” trailer (CDT) for all considered configurations. Additionally, the same load cell is also used to measure the drag of the tractor and trailer bottom section by supporting the model via a rear sting fixed to the trailer base, with the load cell compression in such a setup equivalent to the force exerted on the tractor. Total model drag (CDM) is the sum of the forces acting on the two model components.
The load cell is calibrated in situ for a maximum load of up to 10 N. To assess trailer drag, 11 equally spaced calibration steps up to 1.2 N are used, with a further 10 equal steps up to 10 N for the tractor section drag. These calibration ranges are chosen based on expectations. All points are sampled at 20 kHz and averaged over 40 s with this process repeated three times to assess variability. Uncertainty estimates, encompassing overall repeatability, thermal drift and non-linearity, are less than ΔCDM = ±0.017 and ΔCDT = ±0.004 for the total model and trailer drag, respectively. Drag results for all configurations are presented as a change in total model drag as measured on the trailer relative to the baseline, with uncertainty of ΔCDM = ±1.4%. The effects of selected trailing edge modifications (BTT and LBT) on the drag of the tractor and trailer bottom section are measured separately and found to be within experimental uncertainty (ΔCDM = ±0.007), providing confidence in this approach. The drag is sampled at up to 25 kHz for 20 s and averaged from up to four measurements. The initial “wind-off” load measurement (moving ground on) is used for data correction as recommended in SAE J1252. 52
Prior to testing, the sensitivity of total model and trailer drag coefficients (CDM and CDT) to Reynolds number is evaluated. These results are presented in Figure 5 with only a weak dependence evident for CDT and marginally more significant variations, albeit still low, observed for CDM. Storms et al. 12 investigated the effects of Reynolds number on the drag coefficient of a scaled road vehicle representative of a HGV, showing analogous variations in total drag up to ReW ≈ 1 × 10⁶. Across the same range however, the authors 12 observed only minimal (<2%) variations in the base pressure, indicating that the discrepancy in drag measurements between higher and lower Reynolds number studies is mostly caused by varying flow conditions at the forebody, that is, separation/reattachment at the front corners, and that Reynolds number has little effect on the flow characteristics at the base. Similar results have also been reported by Khalighi et al., 13 showing base pressure coefficient to be independent of freestream velocity. The trends in Figure 5 support these findings. This provides confidence in the presented results as the effects on drag of the various configurations are measured on the trailer, with the related base wake characteristics expected to be less sensitive to Reynolds number and comparisons made between setups evaluated under identical experimental conditions. Additionally, base drag reduction studies of equivalent Reynolds number magnitudes are relatively common, with other similar investigations17,22,23,27 reporting well-correlated results.
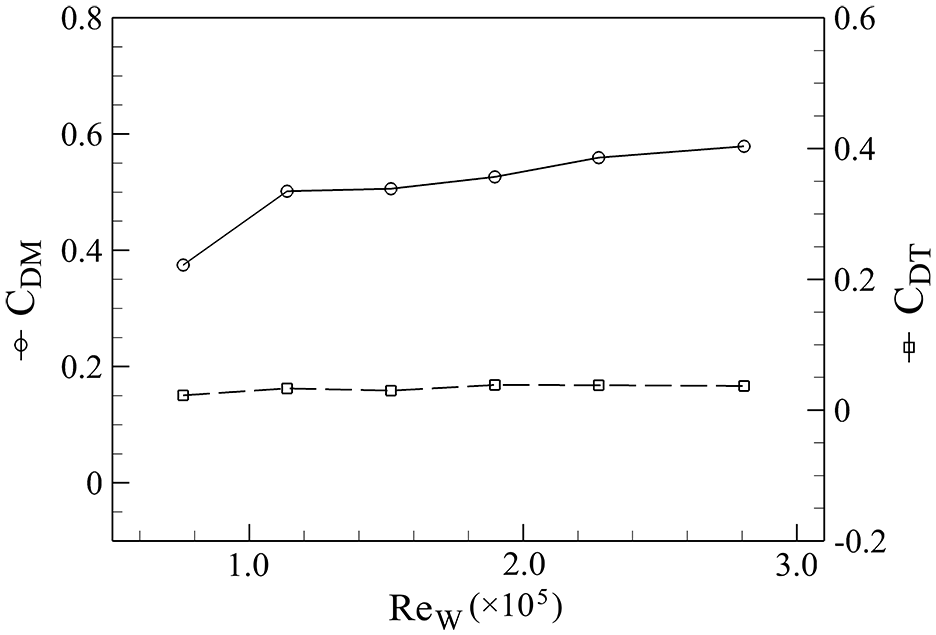
Variation of drag coefficient with Reynolds number; CDM (solid), CDT (dashed).
Hot-wire anemometry
The flow-field is assessed using hot-wire anemometry (HWA). A dual sensor x-wire probe is used in conjunction with an automated 3D traverse system (resolution 0.01 mm). The probe is calibrated in the velocity range from 0.5 to 45 m/s, with polynomial coefficients determined by 20-point curve-fitting. A separate directional calibration, with the probe axis varying between −40° and 40° (5° increments), is also performed to determine the probe yaw factors. The probe overheat ratio is set to 0.8, 57 with all results corrected for ambient temperature changes. The maximum velocity uncertainty within the obtained range is approximately ±1 m/s (Δu* = ±0.027).
Hot-wire anemometry was chosen as the main analysis tool for its ability to provide high frequency spectral content to small spatial resolution at reasonable cost. This technique does not allow accurate determination of direction within reversed flow regions (recirculating wake, etc.), however, general inference in terms of velocity magnitude and spectral content is offered where appropriate.13,58–60 Outside these areas, all data lie well within the maximum limits (urms* < 0.3, urms/u < 0.5) specified by Chandrsuda and Bradshaw. 61
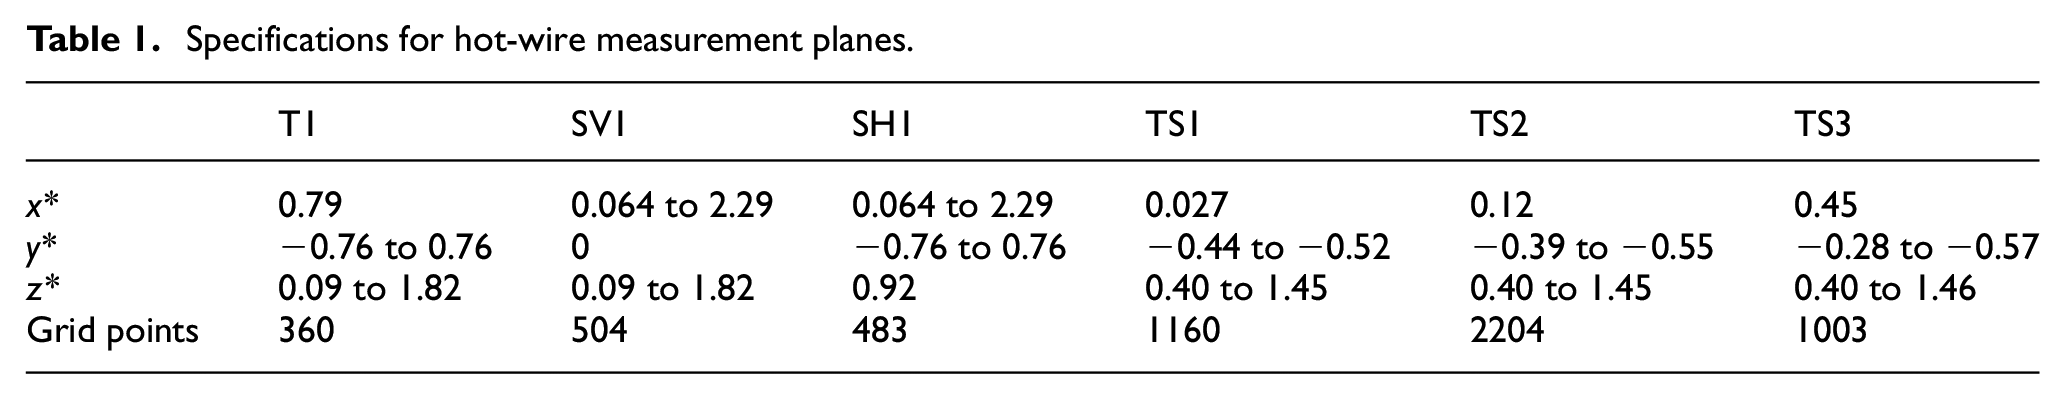
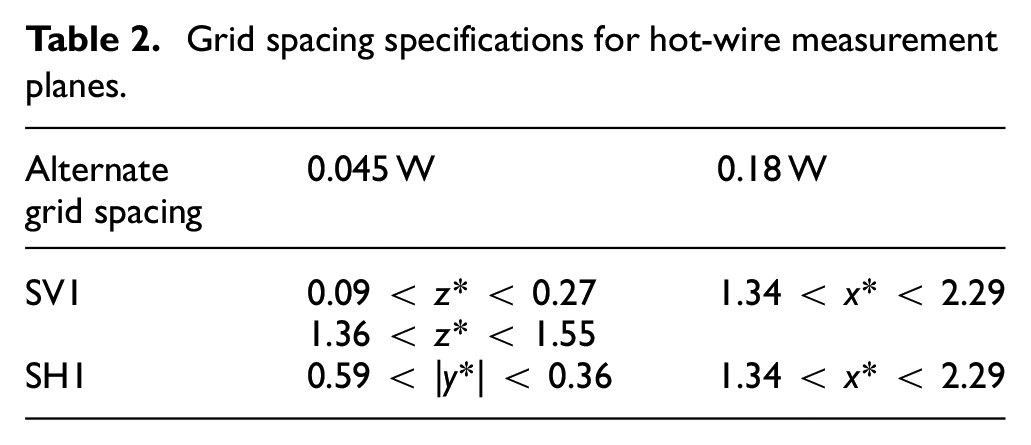
Overall wake flow is assessed from measurements taken in three different planes: transverse plane T1, streamwise vertical plane SV1 and streamwise horizontal plane SH1. A further three transverse planes are also used for detailed measurements directly downstream of the side (TS1–3) trailing edge. The flow-field showed good vertical symmetry, thus, only the left trailing edge (TS1–3) is considered for brevity. The size and positions of all planes are described in Figure 2 and Table 1. For planes T1, SV1 and SH1, measurement points were selected equally spaced throughout (0.091 W), with a finer resolution (0.045 W) applied in areas of specific interest (i.e. separated shear layers, etc.) to allow a more detailed interrogation. Grid spacing is also increased (0.18 W) in other areas to reduce test duration where possible. These point distributions are summarised in Table 2. With the edge planes intended for a more detailed assessment, the spacing is uniform throughout and significantly reduced to 0.009 W for TS1–2 and 0.018 W for TS3. To minimise the risk of probe damage, a lower limit of z* = 0.091 is set for the full-size planes T1, SV1 and SH1, with the sensor wires located Δx* = 0.73 upstream of the probe vertical support strut. All hot-wire data is sampled at up to 25 kHz for periods of 20 s (T1, SV1, SH1) and 5 s (TS1-3). The results are presented interpolated by a factor of two (using Gaussian process regression) to enhance feature detail.
Specifications for hot-wire measurement planes.
Grid spacing specifications for hot-wire measurement planes.
Results and discussion
Drag results
The total drag coefficient for the baseline model (non-modified) measured and corrected for blockage is CDM ≈ 0.579 (±0.017), in good agreement with similar model configurations in other studies, in particular Salati et al. 16 (CDM ≈ 0.586) and Wood 5 (CDM ≈ 0.5). The effects of edge tapering (BTT) are discussed first, with Figure 6 presenting the reduction in the drag coefficient (−ΔCDM) with respect to the drag measured in baseline configuration (CDM ≈ 0.579) for the range of taper angles 5° < α < 30°. One immediate observation is that throughout this range, the best drag benefits are achieved with all (side and top) edges tapered relative to sides or top alone. This is particularly evident within 5° < α < 15° where tapering is most effective. Within this range, the drag reduction obtained with tapering at the sides is significantly lower, with this trend decreasing further when only the top edge is tapered. This is in general agreement with Perry et al. 23 as well as Hirz and Stadler. 21 Considering solely the results for all three edges tapered, for the lower angles, the drag reduction increases gradually with the angle up to α = 15°, where the maximum benefit is achieved. Past α = 15° however, a sharp drop is observed, with further increases approaching the results of the baseline. This is in excellent agreement with the trend found by Yi. 62 Overall, the best drag reduction of 10.8% is achieved with BTT α = 15°, in general agreement with van Raemdonck and van Tooren, 7 and Salati et al. 16
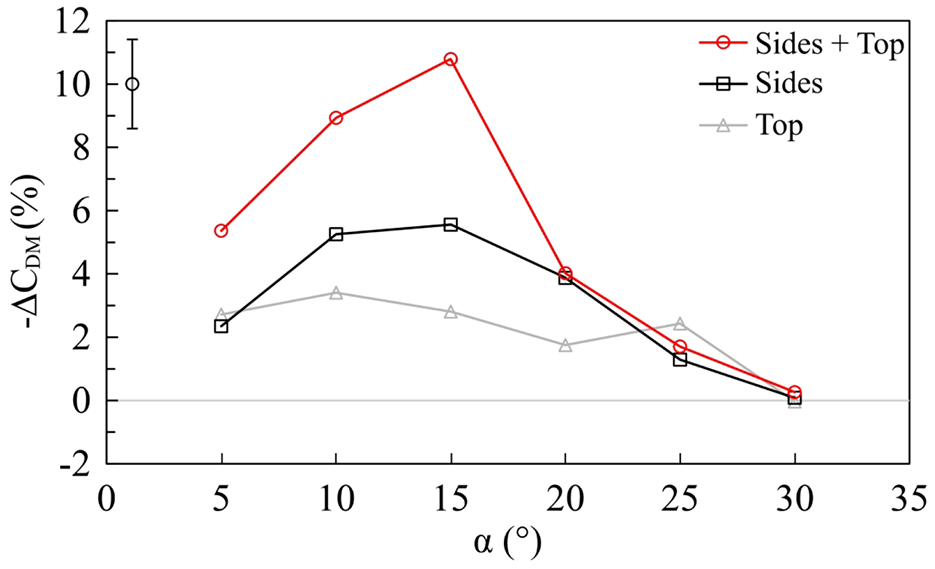
Drag reduction with tapered edges (BTT) for angles 5° < α < 30°.
Results obtained for the various LBT configurations are now considered in detail, with Figure 7 presenting the reduction in the drag coefficient (−ΔCDM; relative to baseline) for the different pitches tested. For each pitch, the effect of varying penetration angle is also captured. At first inspection, most configurations can be seen to reduce drag, with only a few cases of drag increase, found mainly at the extremes of the 5° < β < 30° range. Figure 7 shows most LBT configurations perform best with all sides and top modified, with the benefit reducing with decreasing number of affected edges. This trend is similar to that observed for the BTT, suggesting some similarities in the drag reduction processes exist between these configurations. Considering only the results of all three base edges modified, for each presented pitch (Figure 7(a)–(f)) there exists a β which produces the best drag benefit; β = 20° for p = 0.027 W, β = 15° for p = 0.044 W, β = 7.5° for p = 0.055 W, β = 5° for p = 0.067 W, β = 12.5° for p = 0.086 W, β = 15° for p = 0.105 W. Therefore, for higher aspect ratio modifications, characterised by higher β, the trend suggests smaller pitches to be more suitable. Further inspections also reveal that, unlike the BTT, for the LBT configurations (sides and top), the drag variations with changing β are significantly more moderate, mostly devoid of severe increases/decreases such as that seen between BTT α = 15° and α = 20°. This is especially the case for p = 0.044 W, p = 0.055 W and p = 0.067 W (Figure 7(b)–(d)). Consequently, most LBT configurations continue to exhibit significant drag reductions at higher angles past β = 15°. LBT p = 0.044 W (Figure 7(b)) presents a particularly good trend, with drag reductions of up to 7.0% at β = 20°, 5.5% at β = 25° and 2.8% at β = 30°. Overall, these results suggest that the drag reduction may be proportional to the streamwise vorticity generated by the lobes, with smaller pitches tending to produce higher average vorticity per lobe. 63 Additionally, the upper limit for the penetration angle is typically between 20° < β < 30°,64–66 with further increases normally having negative impact on the circulation strength.
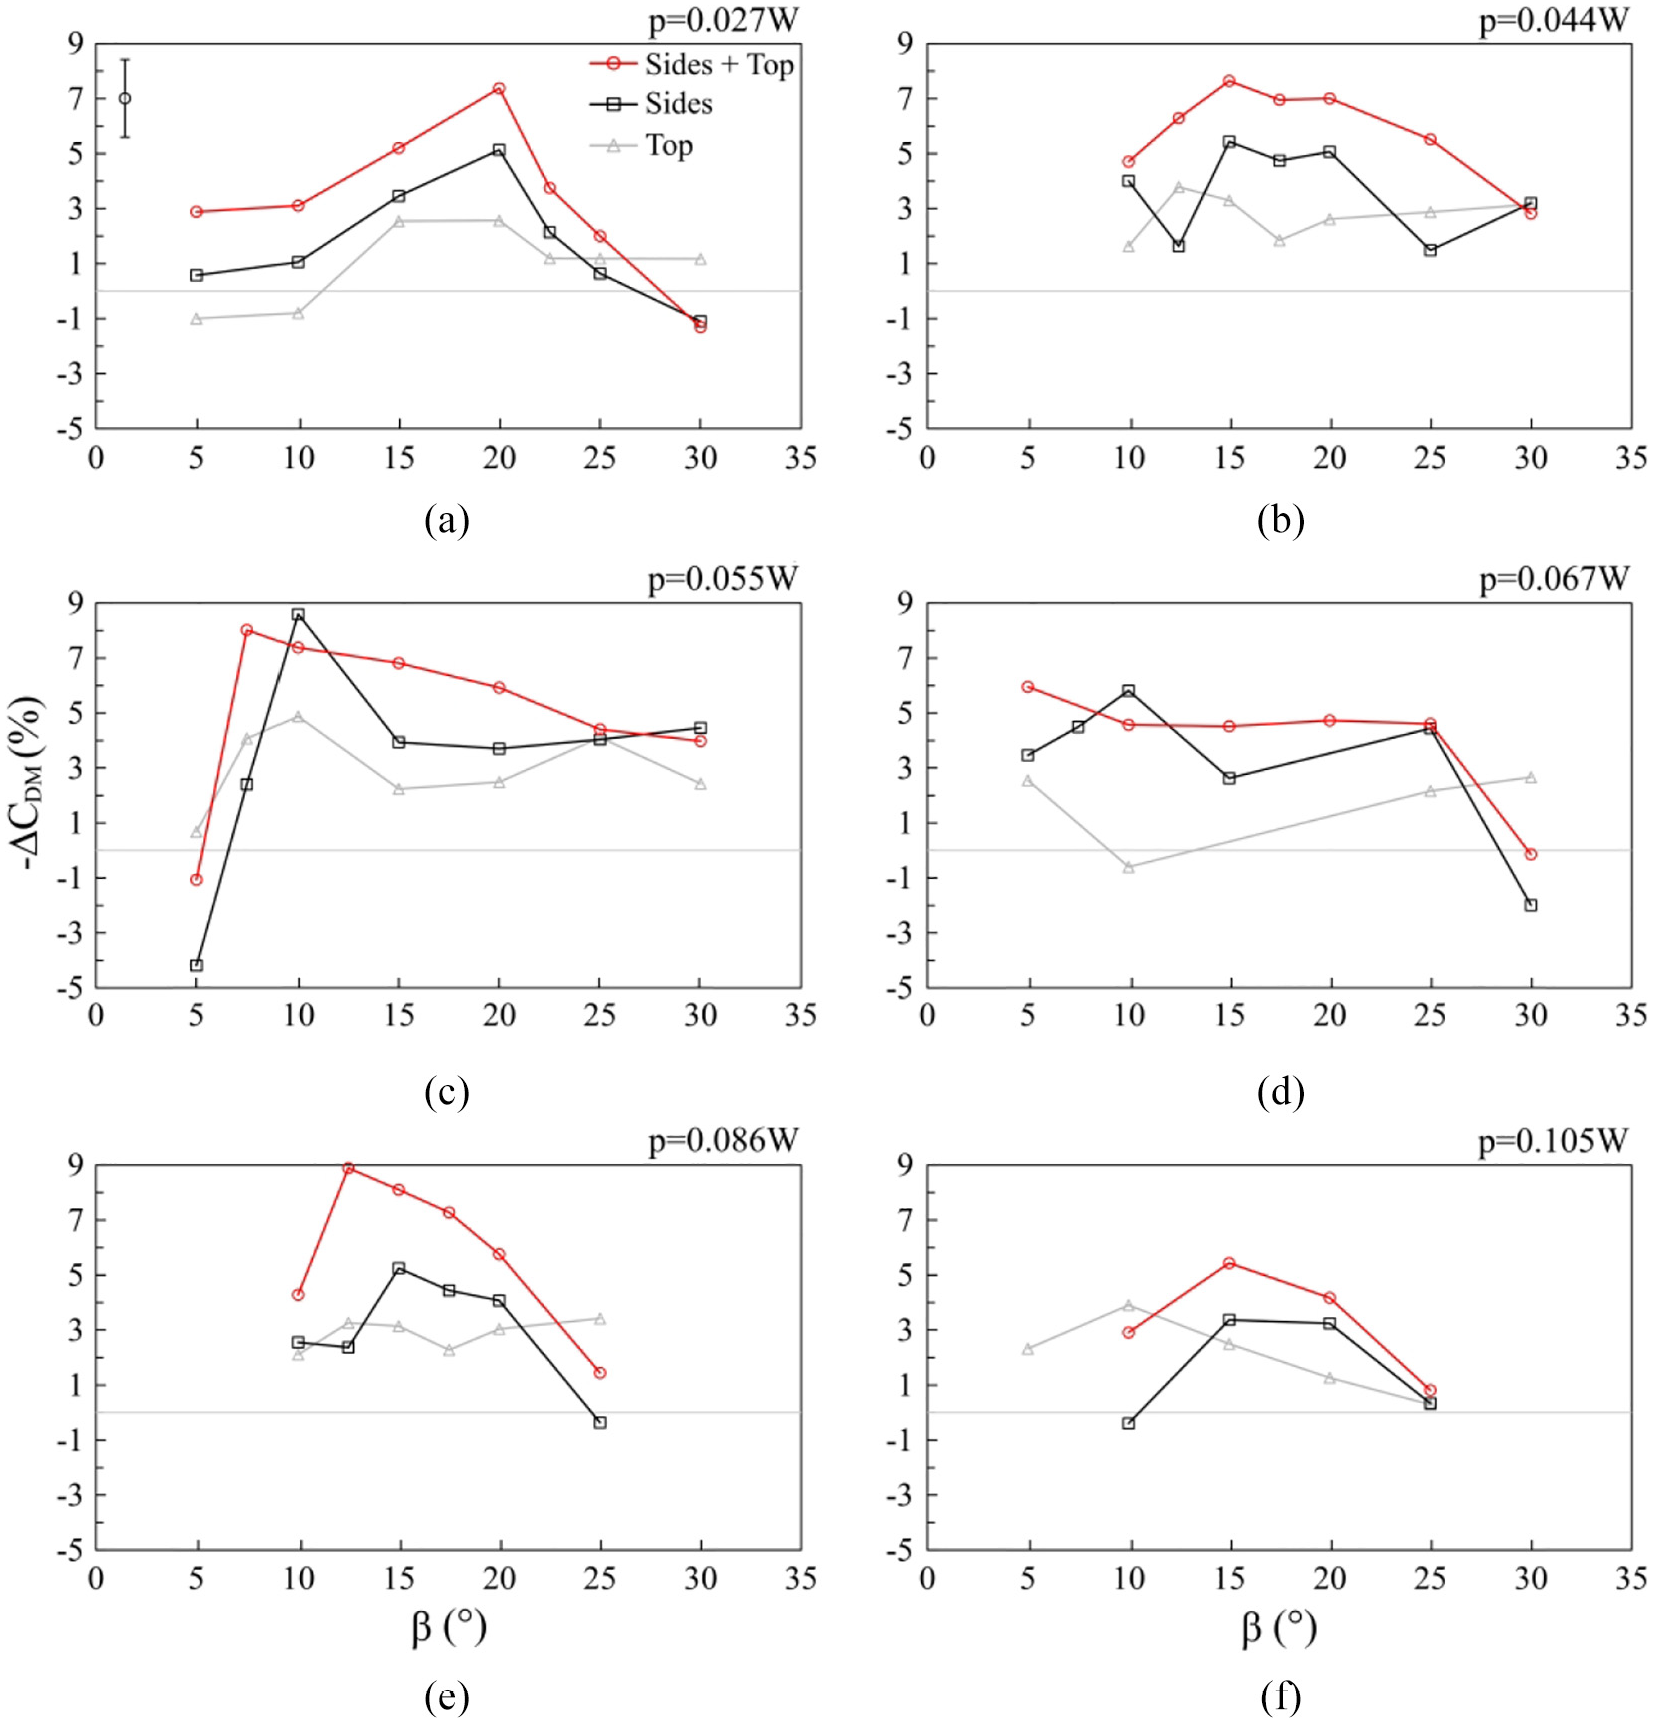
Drag reduction for the LBT configurations at penetration angle within 5° < β < 30° and various pitches: (a) p = 0.027W, (b) p = 0.044 W, (c) p = 0.055 W, (d) p = 0.067 W, (e) p = 0.086 W, (f) p = 0.105 W.
Further insight is gained by comparing the results of LBTs at selected β with the BTT at equivalent α = β. This allows comparisons between all configurations of identical aspect ratio modifications. These results are presented in Figure 8 and include only the instances where all, side and top, edges are modified, as the results in Figures 6 and 7 show these to generally produce the highest drag benefits. Figure 8(a) and (b) shows that at β = 10° and β = 15°, while all LBTs reduce drag across the pitch range, the reductions are generally lower in comparison with the BTT at equivalent α. The worst relative performance is found at β = 15°, the angle of the optimum taper BTT (Figure 6). At the same angle (Figure 8(b)), the LBT results show an interesting, almost symmetric pattern, with the ΔCDM for p = 0.044 W and p = 0.086 W near-identical. The implications of this trend are explored further in the following sections. Interesting results are discovered at higher angles exceeding β = α = 15° (Figure 8(c)–(e)). These trends show that as the angle increases and BTT’s drag reduction capability reduces radically, most LBT configurations continue to exhibit substantial drag reductions persisting up to β = 30°. These results suggest that with the addition of lobes, significant drag reductions can be achieved at much higher angles and thus, higher aspect ratios, significantly decreasing the impact on the vehicle’s internal space.
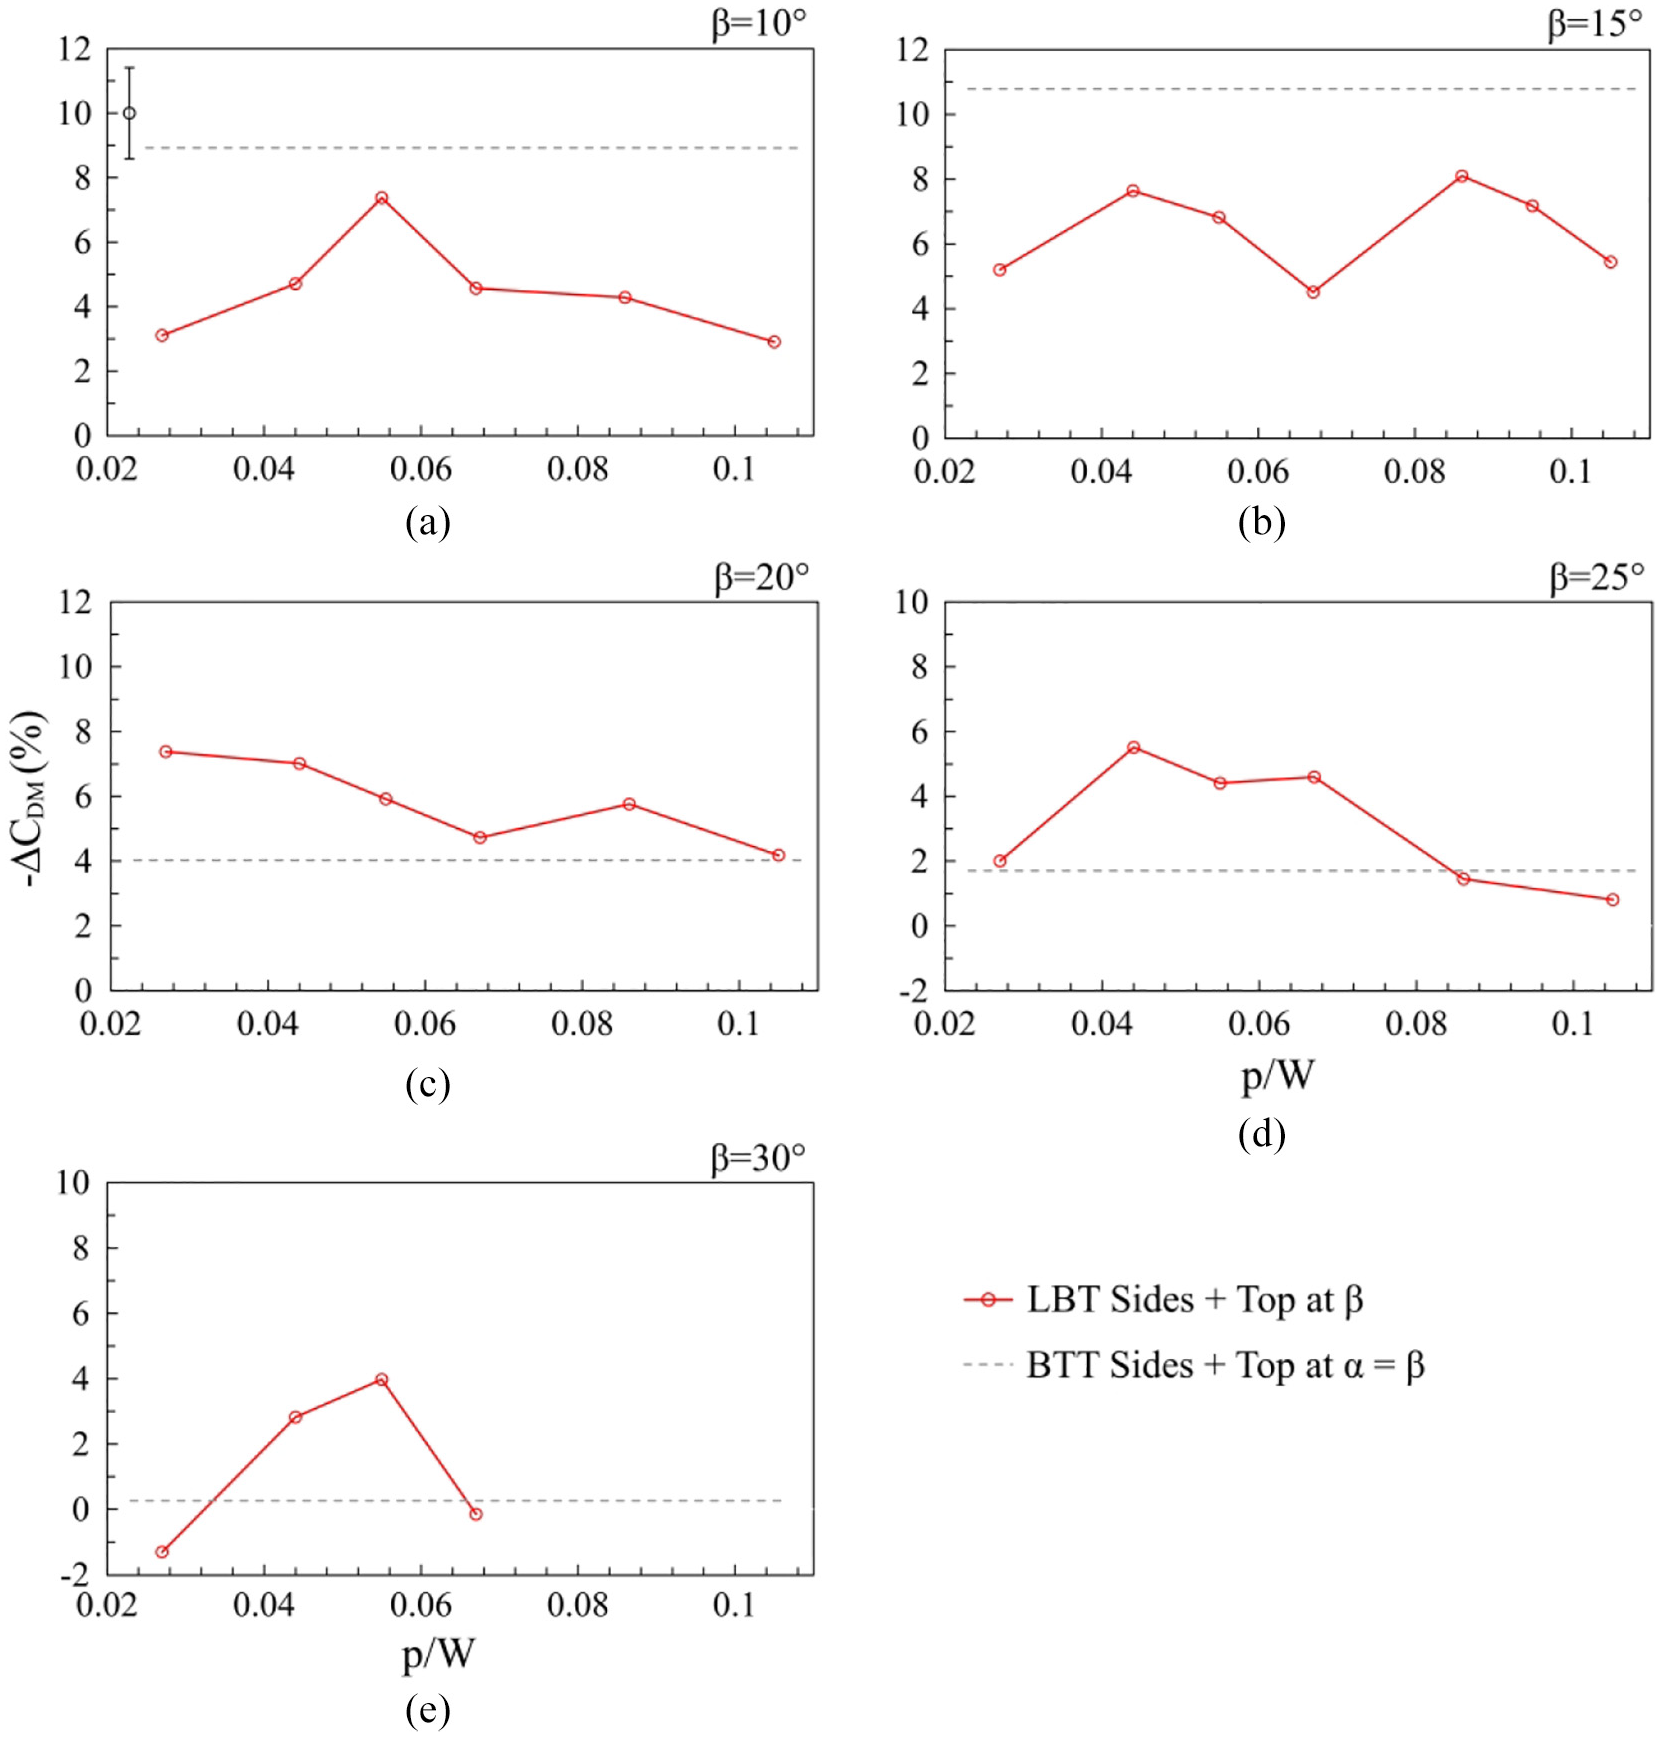
Drag reduction for LBT configurations of pitches within 0.027 W < p < 0.105 W at a constant β compared with BTT at equivalent α = β: (a) β = α = 10°, (b) β = α = 15°, (c) β =α = 20°, (d) β = α = 25°, (e) β = α = 30°.
Time-averaged wake flow-field
Characteristics of the time-averaged wake are now considered. First, the baseline flow-field is evaluated, with the effects of tapering (BTT) assessed thereafter. Finally, detailed interrogation of the influence of the lobed mixer configurations (LBT) is presented thereafter.
Baseline flow
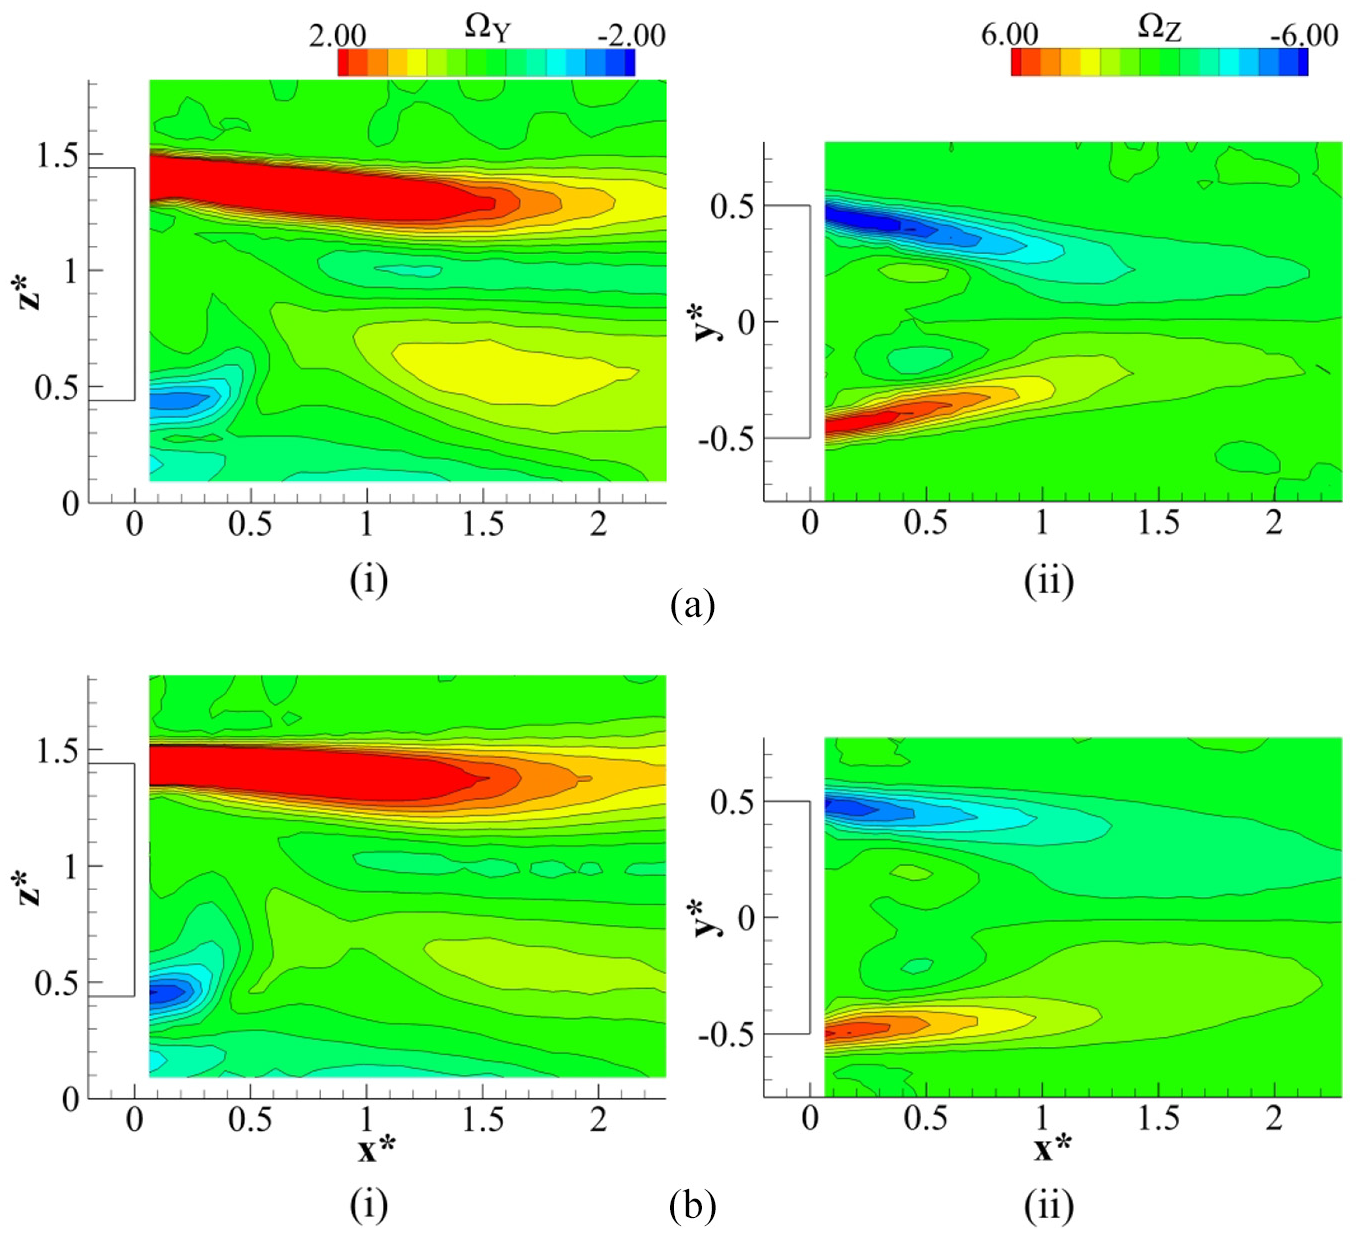
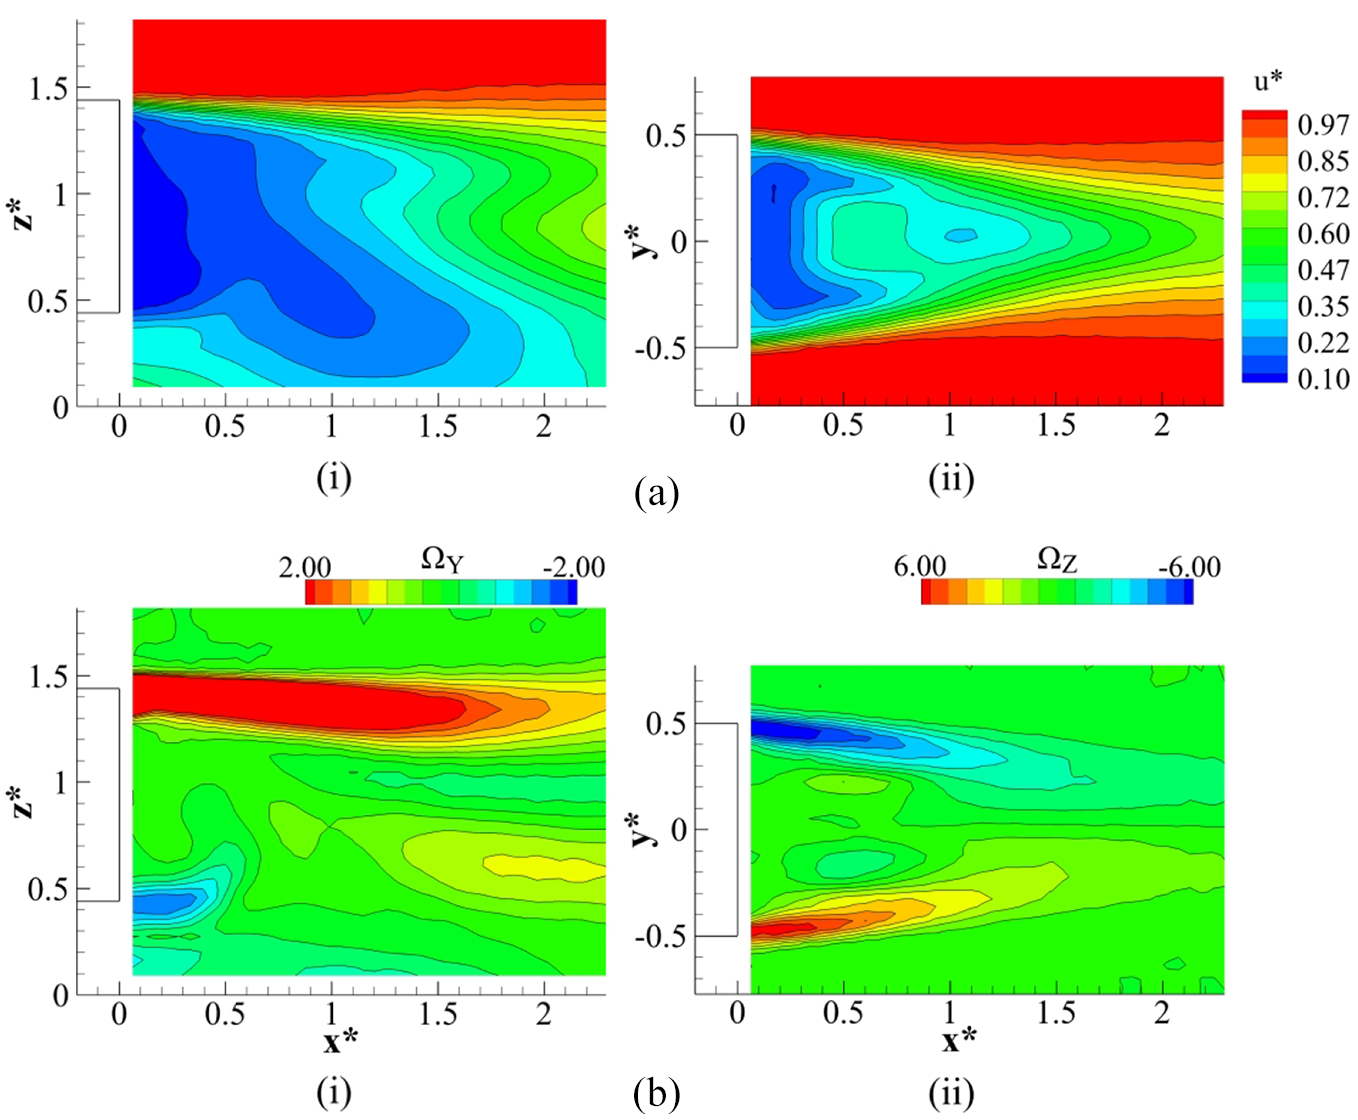
Presented in Figure 9(a) are the contours of streamwise velocity u* in planes SV1 (i) and SH1 (ii) for the baseline case. The wake is represented by the lower u* magnitudes directly behind the base, with Figure 9(a)(i) showing the recirculation region contained within x* < 1.5 and surrounded by undisturbed freestream flow (z* > 1.5 in Figure 9(a)(i) and |y*| > 0.5 in Figure 9(a)(ii)). From the vertical perspective (Figure 9(a)(i)), the wake height is seen coincident with the model height. Minimum u* (Figure 9(a)(i)) is positioned close to the model (0.2 < x* < 0.4) within the bottom base half (0.7 < z* < 0.9), commensurate with the position of the lower wake vortex.58,67,68 Horizontally, Figure 9(a)(ii) presents excellent symmetry around y* ≈ 0 and wake width being initially coincident with model width, with subtle inboard tapering evident further downstream.
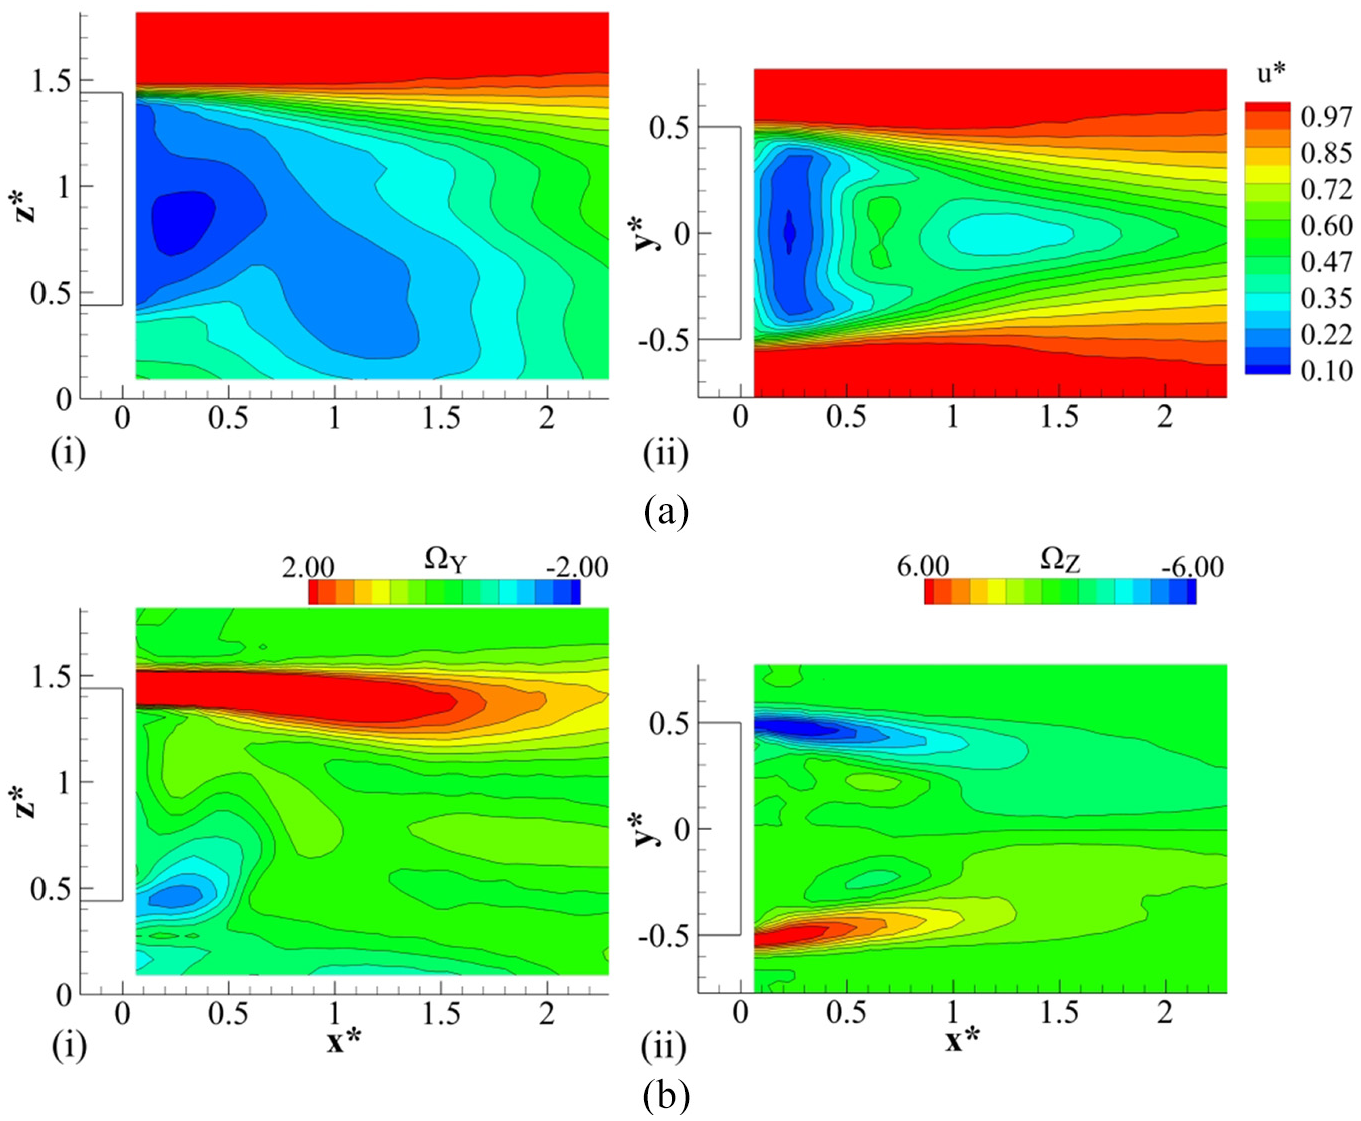
Baseline wake: (a) streamwise velocity u* and (b) in-plane vorticity (ΩY and ΩZ); (i) SV1 (ΩY), (ii) SH1 (ΩZ).
Further insight into the nature of the separated wake is provided in Figure 9(b) presenting the distribution of the in-plane vorticity (ΩY– crosswise, ΩZ– heightwise) for SV1 (i) and SH1 (ii). As would be expected, highest ΩY and ΩZ coincide with the separated top and side shear layers, respectively, reflective of the wake tending to achieve closure and in line with the gradual downstream tapering of the region observed in Figure 9(a). Elevated ΩY is also evident in the portion of the flow exiting the underbody (Figure 9(b)(i)), representative of the local upwash generated by the flow being entrained into the lower wake vortex. Small counter-rotating structures are also evident inboard of the side shear layers (0.5 < x* < 0.7, 0.2 < |y*| < 0.3 –Figure 9(b)(ii)).
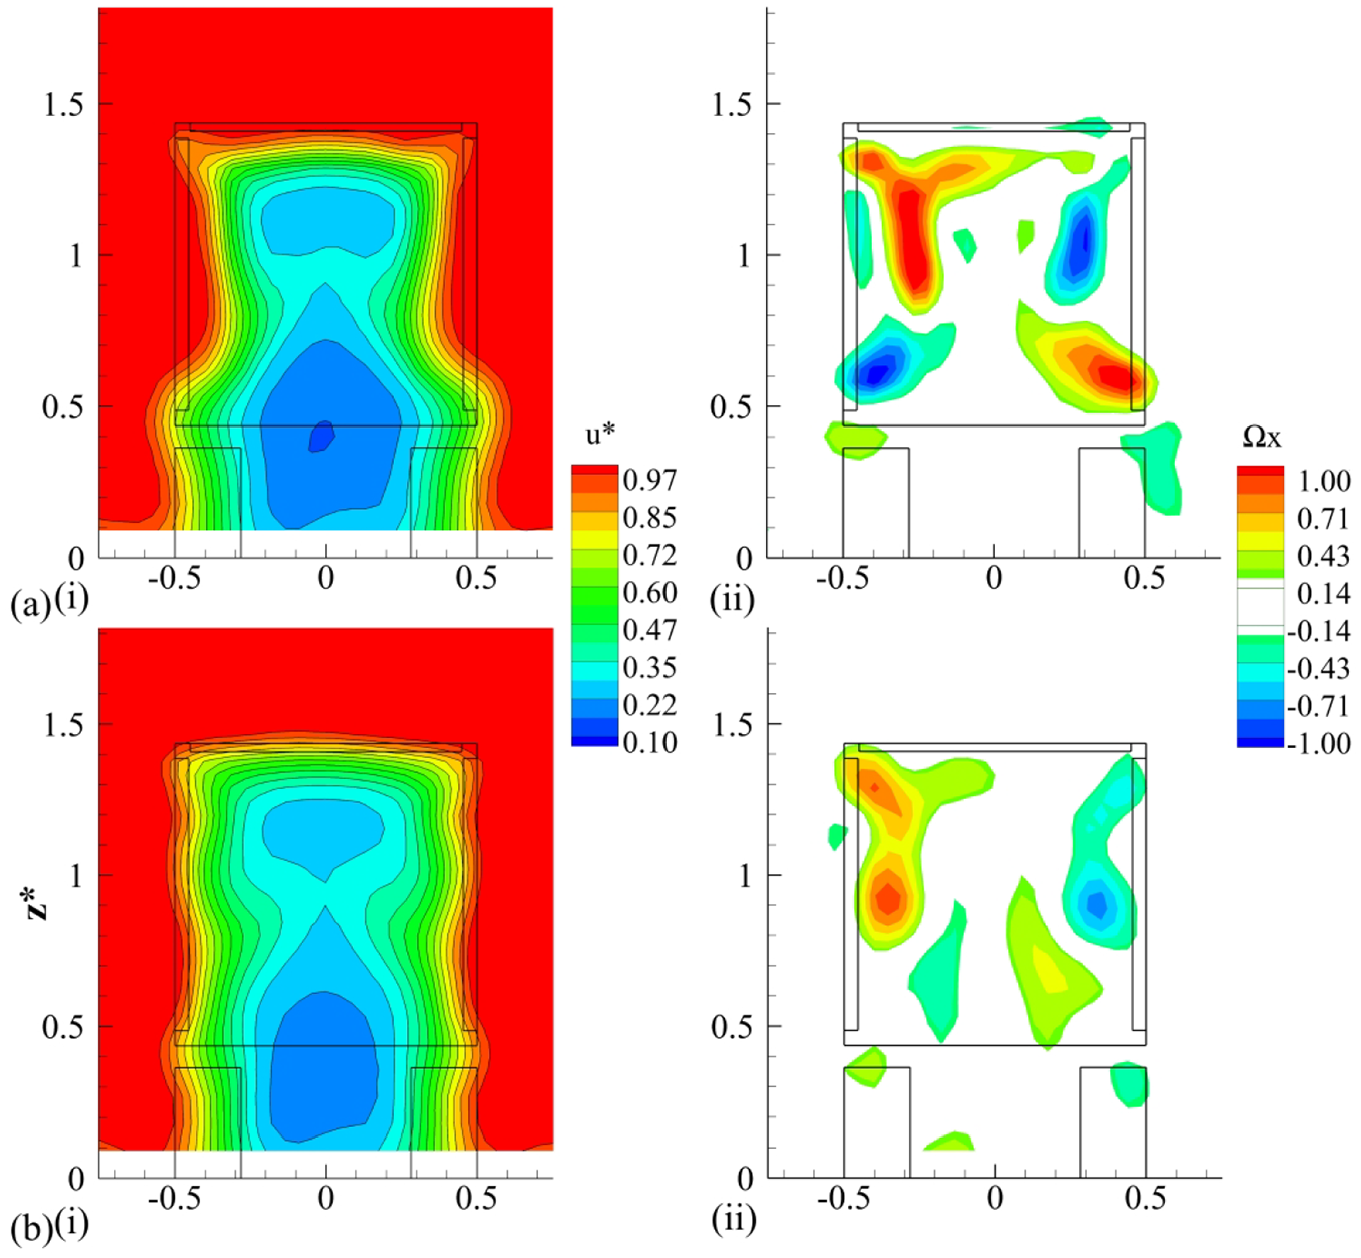
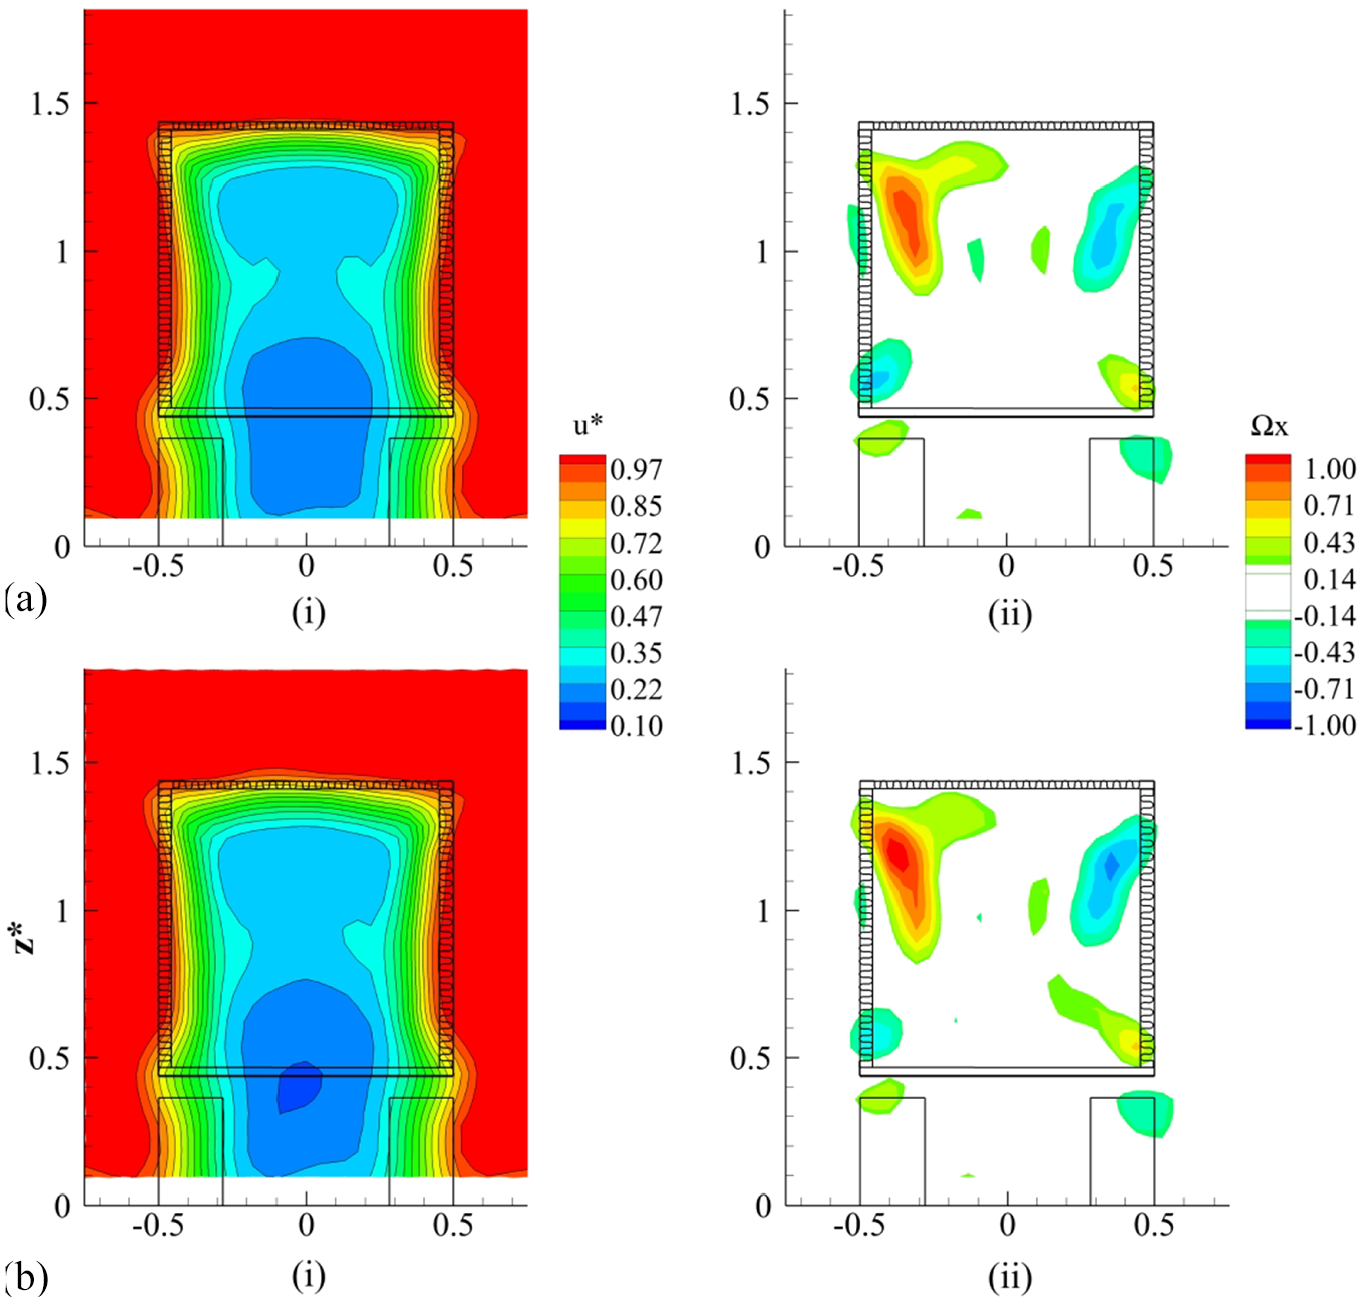
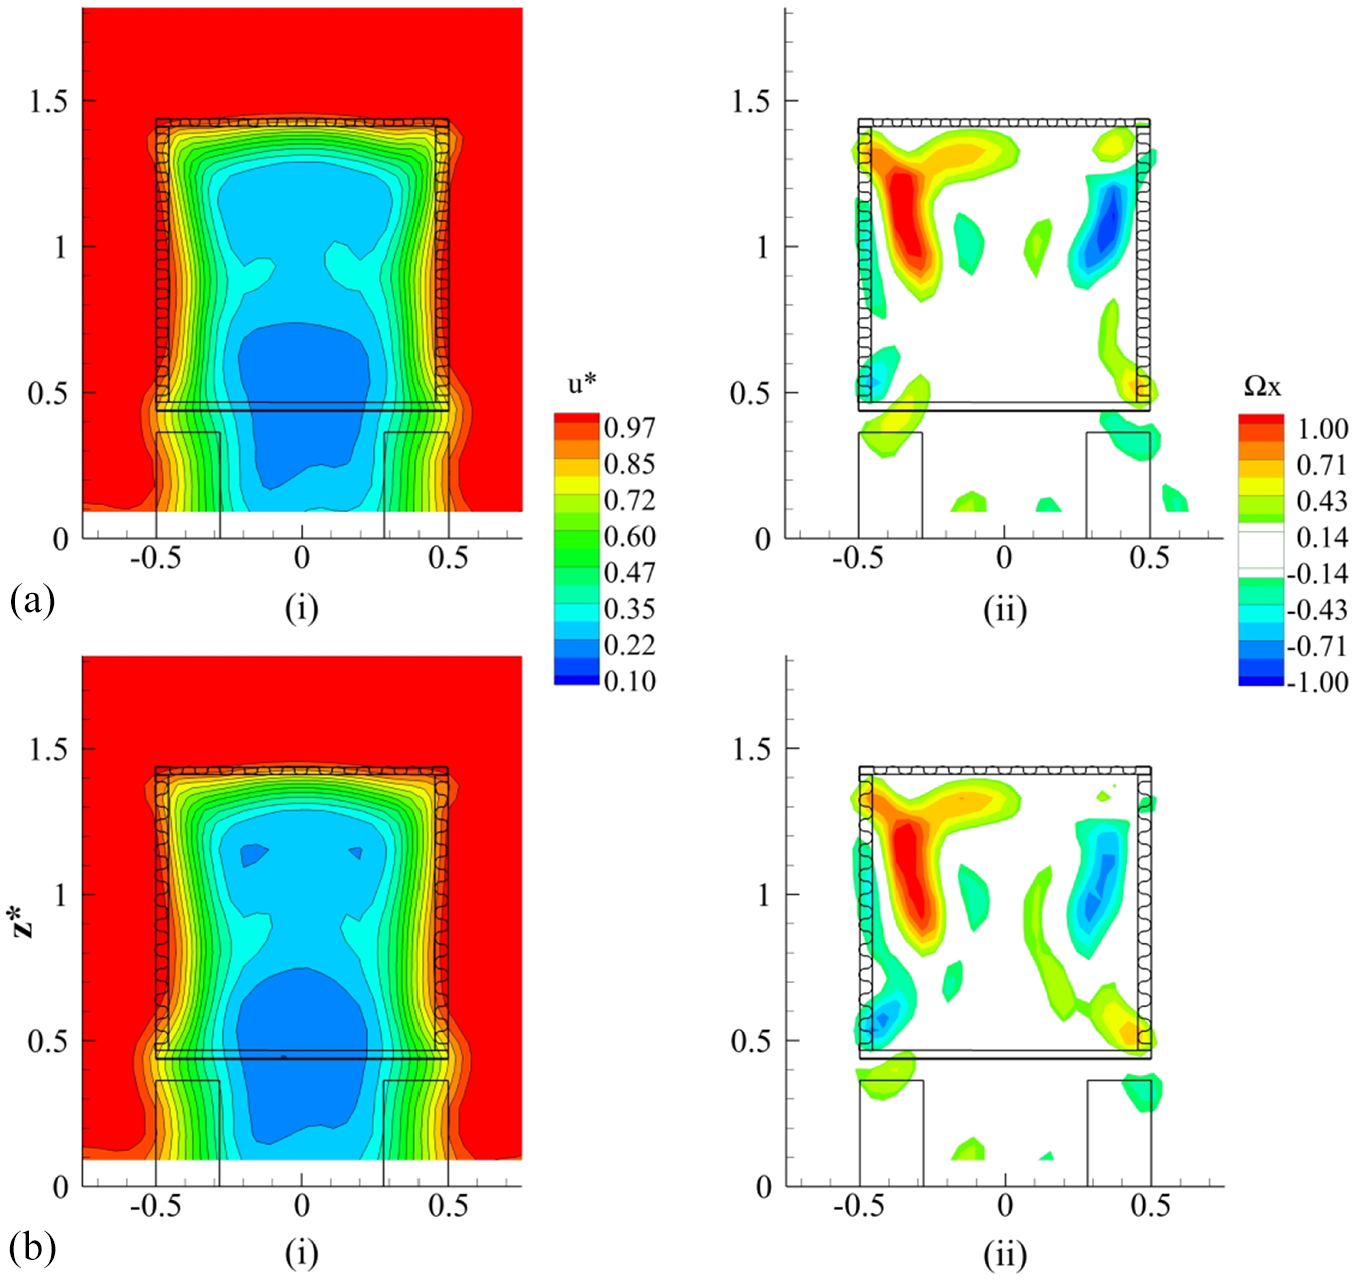
Figure 10 presents u* and streamwise vorticity ΩX contours in plane T1. At this position, the wake, represented by lower u* magnitudes, is seen to coincide with the model profile and extend to the ground level, with the minimum u* located within |y*| < 0.2, 0.2 < z* < 0.4. The wake width appears largely consistent with height, with weak crosswise contractions evident around z* ≈ 0.2 and z* ≈ 0.8. These contractions appear to result from the localised enhancement in the crosswise flow generated by the vorticity positioned directly above, as presented in Figure 10(b). This topology (Figure 10(b)) presents two sets of counter-rotating structures positioned near-symmetrically around y* ≈ 0. The vortices originate from the four base corners, generated by the differences in flow direction upon separation from the trailing edges. Rouméas et al. 69 have also shown similar bottom base corner vortices. Where the flow along the trailer sides would typically be characterised by a subtle downwash, 70 these vortices are generated such that on each side the vorticity is co-rotating.
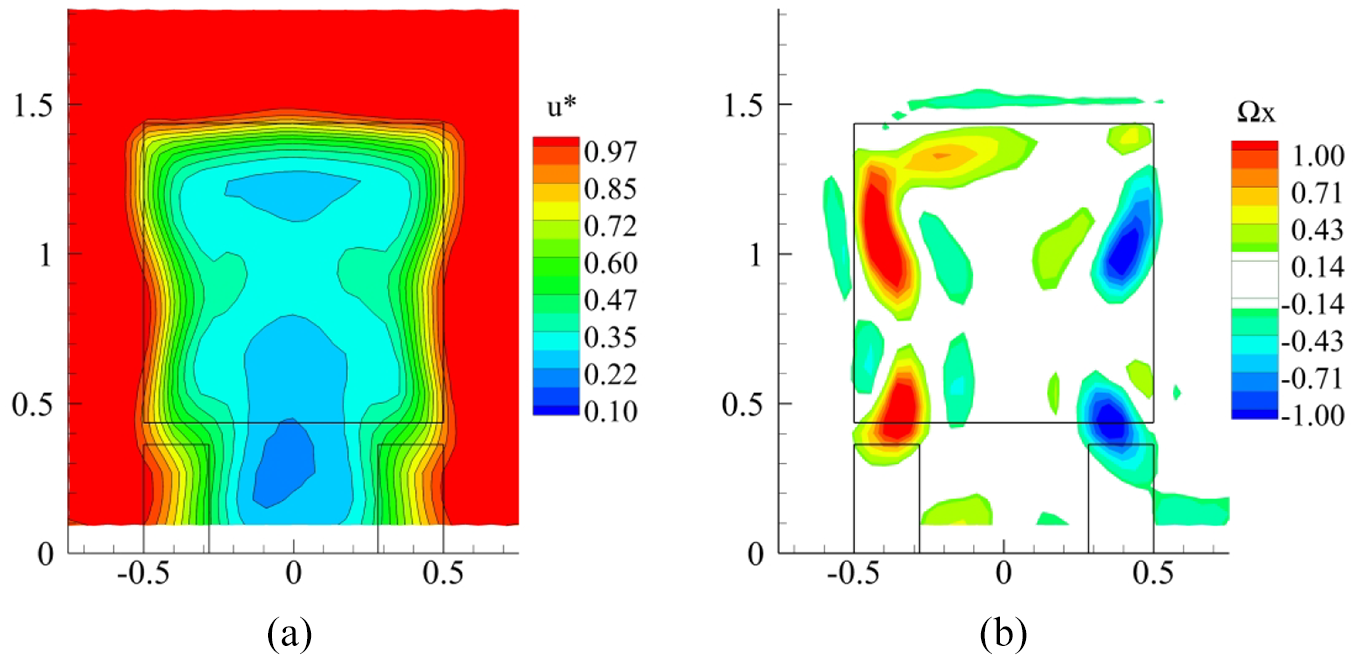
Baseline wake at T1: (a) streamwise velocity u*, (b) streamwise vorticity ΩX (−0.25 < ΩX < 0.25 omitted for clarity).
Effects of trailing edge tapering
Figure 11 presents u* distribution in the wake of the low-drag taper configuration, with α = 15° on both sides and top. The results for BTT α = 20° are also included to provide insight into the differences responsible for the sharp rise in drag. Firstly, in SV1 (Figure 11(a)(i)), BTT α = 15° can be seen to produce a wake which is markedly more tapered from the top in comparison with the baseline (Figure 9(a)(i)), suggesting significant increases in downward momentum upon separation. This is an expected result as the flow separates at the trailing edge of the tapered surface, and agrees with the results of Perry et al. 68 and Grandemange et al. 71 One consequence of this can be seen in the upper wake portions (z* > 0.9), where the downstream evolution of u* for BTT α = 15° shows a more rapid increase in magnitudes, suggesting these portions to close more quickly relative to the baseline. Below this level (z* < 0.9) the opposite is evident, with lower u* magnitudes extending relatively further downstream to x* ≈ 1.4. As a result, the overall wake topology from this perspective appears shifted towards the ground. One possible reason for this observation is a change in the vertical wake balance with BTT α = 15°, precipitated by the growth of the top recirculating vortex and downward shift of the saddle point; both a consequence of the increase in downward momentum in the flow leaving the top tapered edge, in agreement with Perry et al. 68 This is considered further in the remainder of this section. The lowest u* magnitudes within the wake are now located close to the base and extending its entire height. Considering Figure 11(b)(i), the increase in the taper angle to α = 20° is seen to produce a significantly less tapered wake in comparison with α = 15°. The upper portions (z* > 0.9) no longer show faster closure, with the overall trend approaching that of the baseline (Figure 9(a)(i)). These differences in wake height are highlighted further in Figure 12(a), with this figure (Figure 12(a)) also emphasising the substantial reduction in the u* deficit at z* > 0.9 for BTT α = 15° discussed earlier.
Streamwise velocity contours (u*) for (a) BTT α = 15° (sides and top) and (b) BTT α = 20° (sides and top); (i) SV1, (ii) SH1.
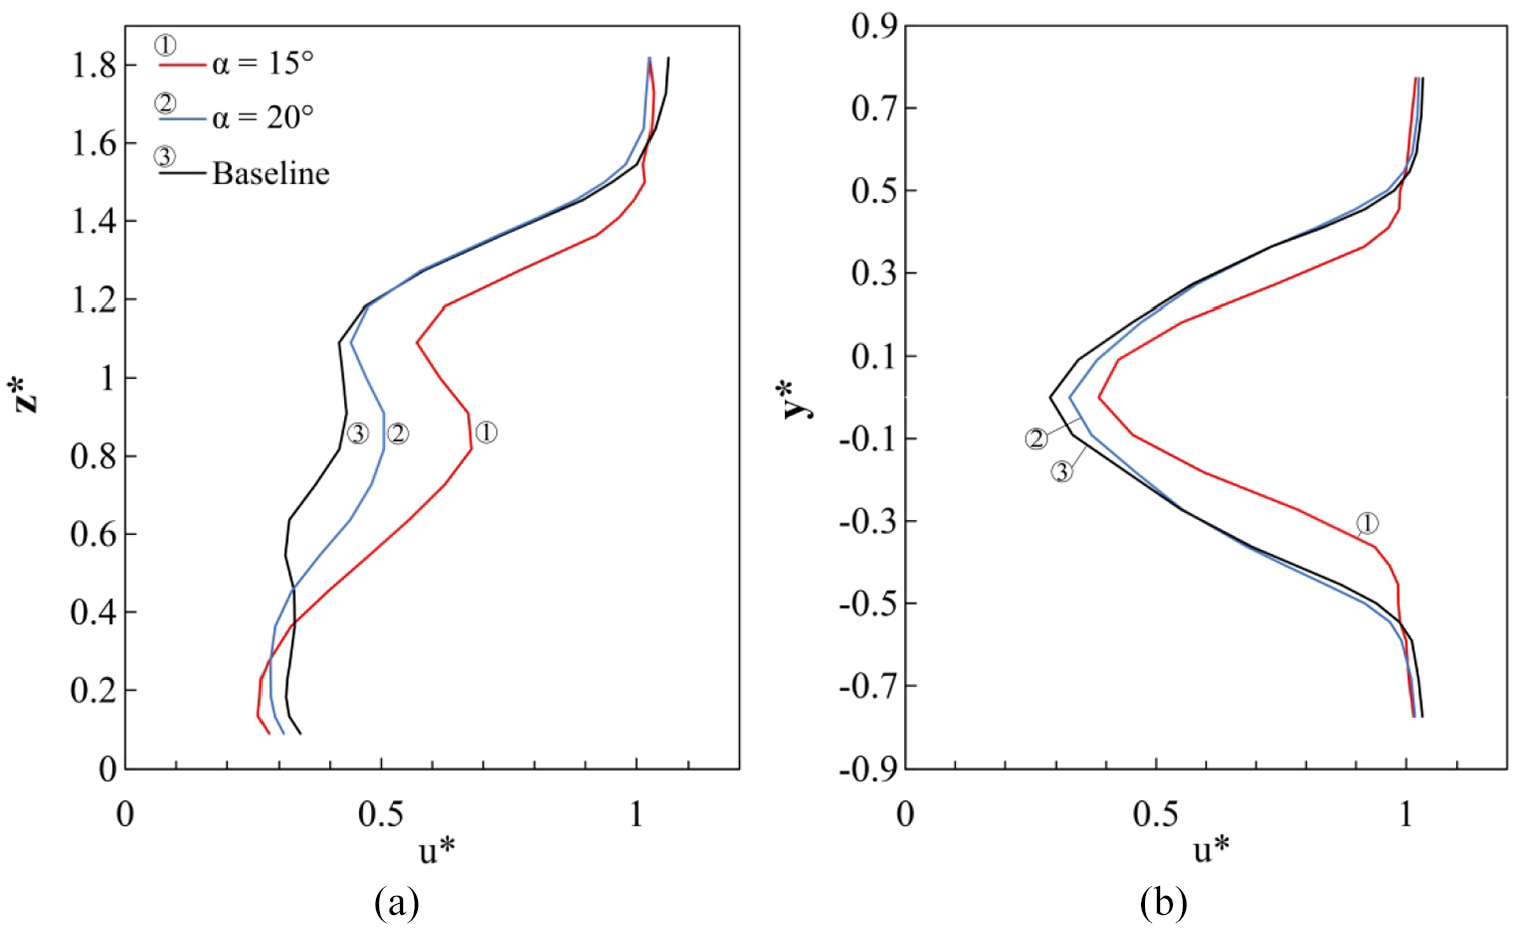
Profiles of u* for Baseline, BTT α = 15° and BTT α = 20° (sides and top for both): (a) x* ≈ 1.8, y* ≈ 0 (SV1), (b) x* ≈ 1.25, z* ≈ 0.92 (SH1).
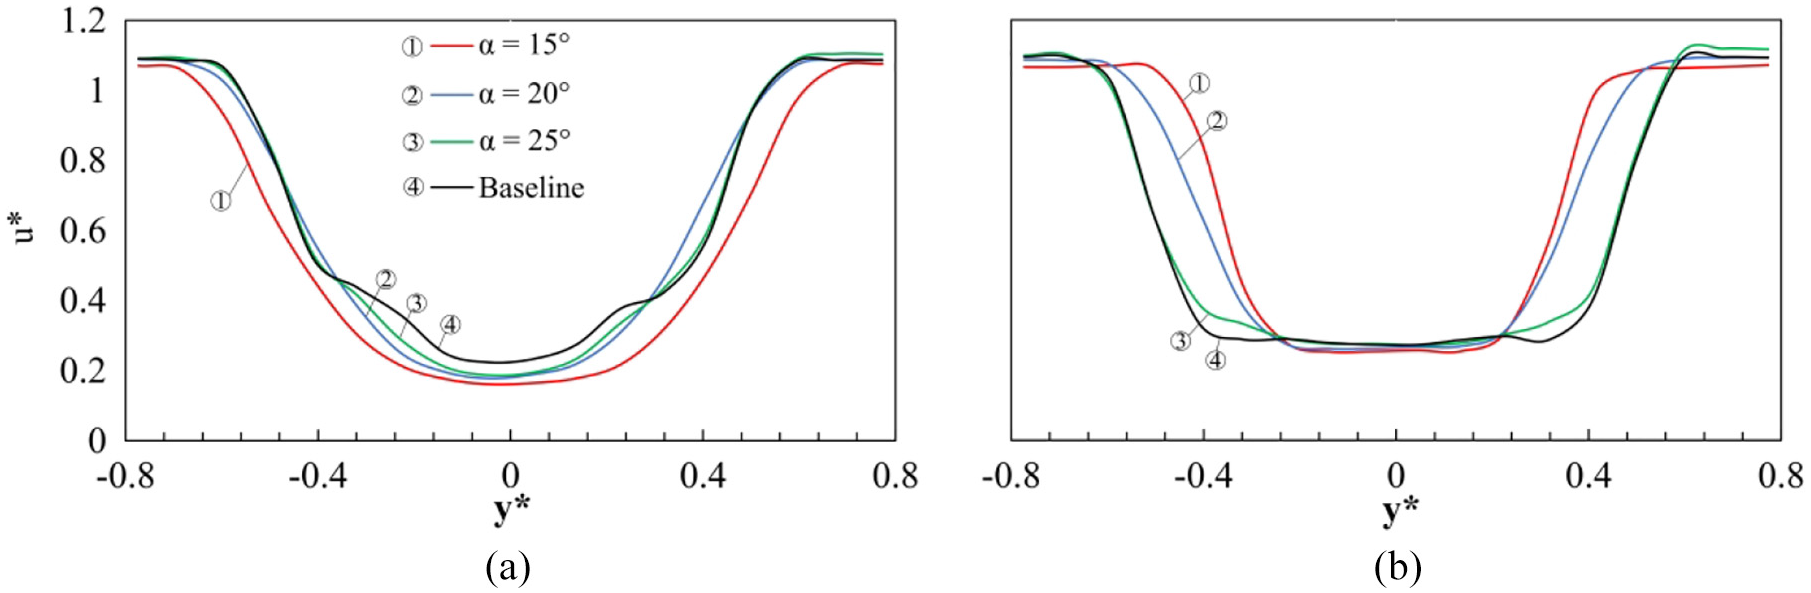
Further insight is gained from the horizontal perspective (SH1). Figure 11(a)(ii) (BTT α = 15°) shows a substantial reduction in the wake width relative to the baseline (Figure 9(a)(ii)), which is expected to be a result of the increase in inboard momentum generated by the tapered sides. In this position (z* ≈ 0.92 – SH1), the lower u* contours also suggest reduced wake length for BTT α = 15°, consistent with a quicker local closure. Figure 11(b)(ii) (BTT α = 20°) again exhibits similarities to the baseline topology, with a local increase in the wake width relative to BTT α = 15°. This is further highlighted in Figure 12(b), showing a reduction in wake width for BTT α = 15° from |y*| < 0.5 (baseline and BTT α = 20°) to |y*| < 0.4, and Δu* ≈ 0.1 increase at y* ≈ 0, supporting the alleged enhancement in crosswise flow. In the same plane (SH1), the lowest velocity magnitudes (u* < 0.2) for BTT α = 15° are seen to extend downstream to x* ≈ 0.55 within 0.1 < |y*| < 0.35 (Figure 11(a)(ii)). In contrast, in Figure 11(b)(ii) (BTT α = 20°) these are seen limited in both the spanwise and streamwise directions, to x* < 0.35, 0.2 < |y*| < 0.35. This trend is likely reflective of an increase in the size of the side portions of the toroidal wake vortex, or side wake vortices, for BTT α = 15°. Perry et al. 23 report this as one of the results of effective trailing edge tapering, producing improved base pressure recovery. Results in Figure 6 support these findings.
Figure 13 presents crosswise and heightwise vorticity trends in the same planes, SV1 and SH1. In SV1, ΩY magnitudes generated along the top shear layer remain similar for both tapered configurations and the baseline. For BTT α = 15° however, this region of high positive ΩY appears to arch subtly towards the wake centre, consistent with lower positions of the developing top shear layer, and reductions in wake height (Figure 12(a)). Additionally, the area of upwash generated from the exiting underbody flow appears to extend further downstream to x* ≈ 0.4 for BTT α = 15° relative to x* ≈ 0.3 for BTT α = 20°. For the latter, this portion of the flow also appears to be angled more significantly towards the wake centre, similar to the baseline case (Figure 9(b)(i)), suggesting the average position of the lower wake vortex to be closer to the base. This observation further supports the inferred shift in vertical wake balance for BTT α = 15°.
Wake vorticity for: (a) BTT α = 15° (sides and top) and (b) BTT α = 20° (sides and top); (i) ΩY in SV1, (ii) ΩZ in SH1.
In SH1, ΩZ results for the BTT α = 15° (Figure 13(a)(ii)) show stronger heightwise vorticity, consistent with enhanced inboard momentum. The regions of elevated vorticity are also shown located marginally closer to y* ≈ 0, supporting the reduction in the wake width for this configuration (Figure 12(b)). Similarly, for BTT α = 20° (Figure 13(b)(ii)), ΩZ topology closely resembles that of the baseline (Figure 9(b)(ii)), confirming degradation in performance with increasing α.
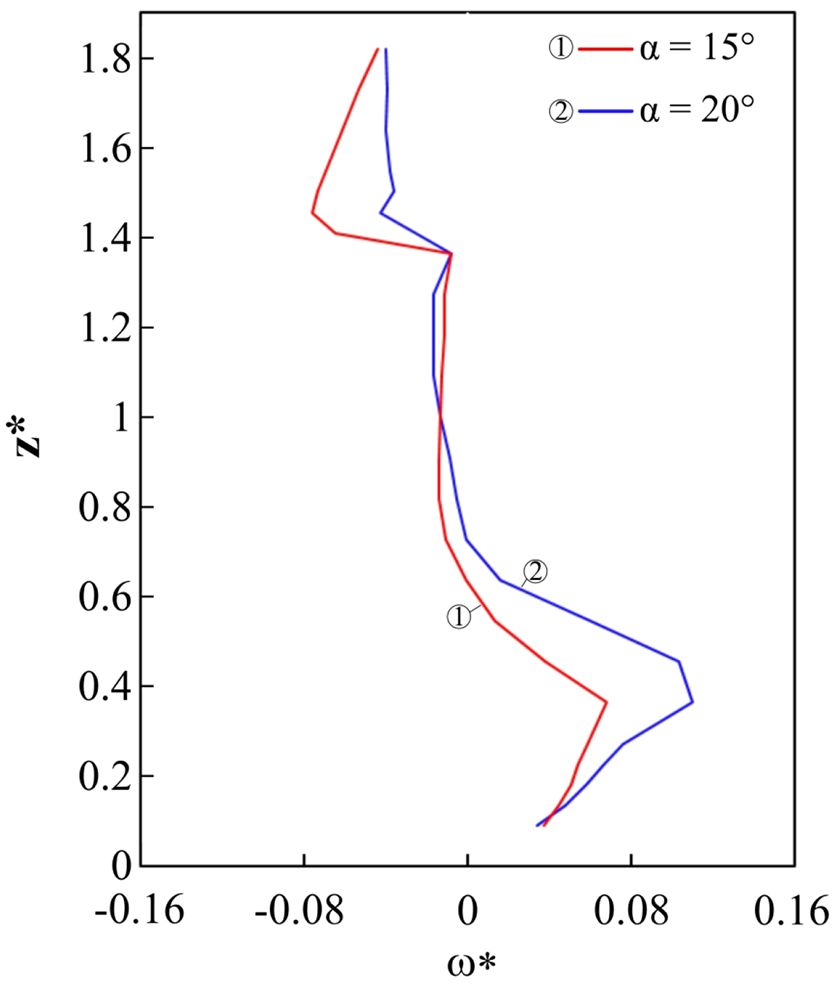
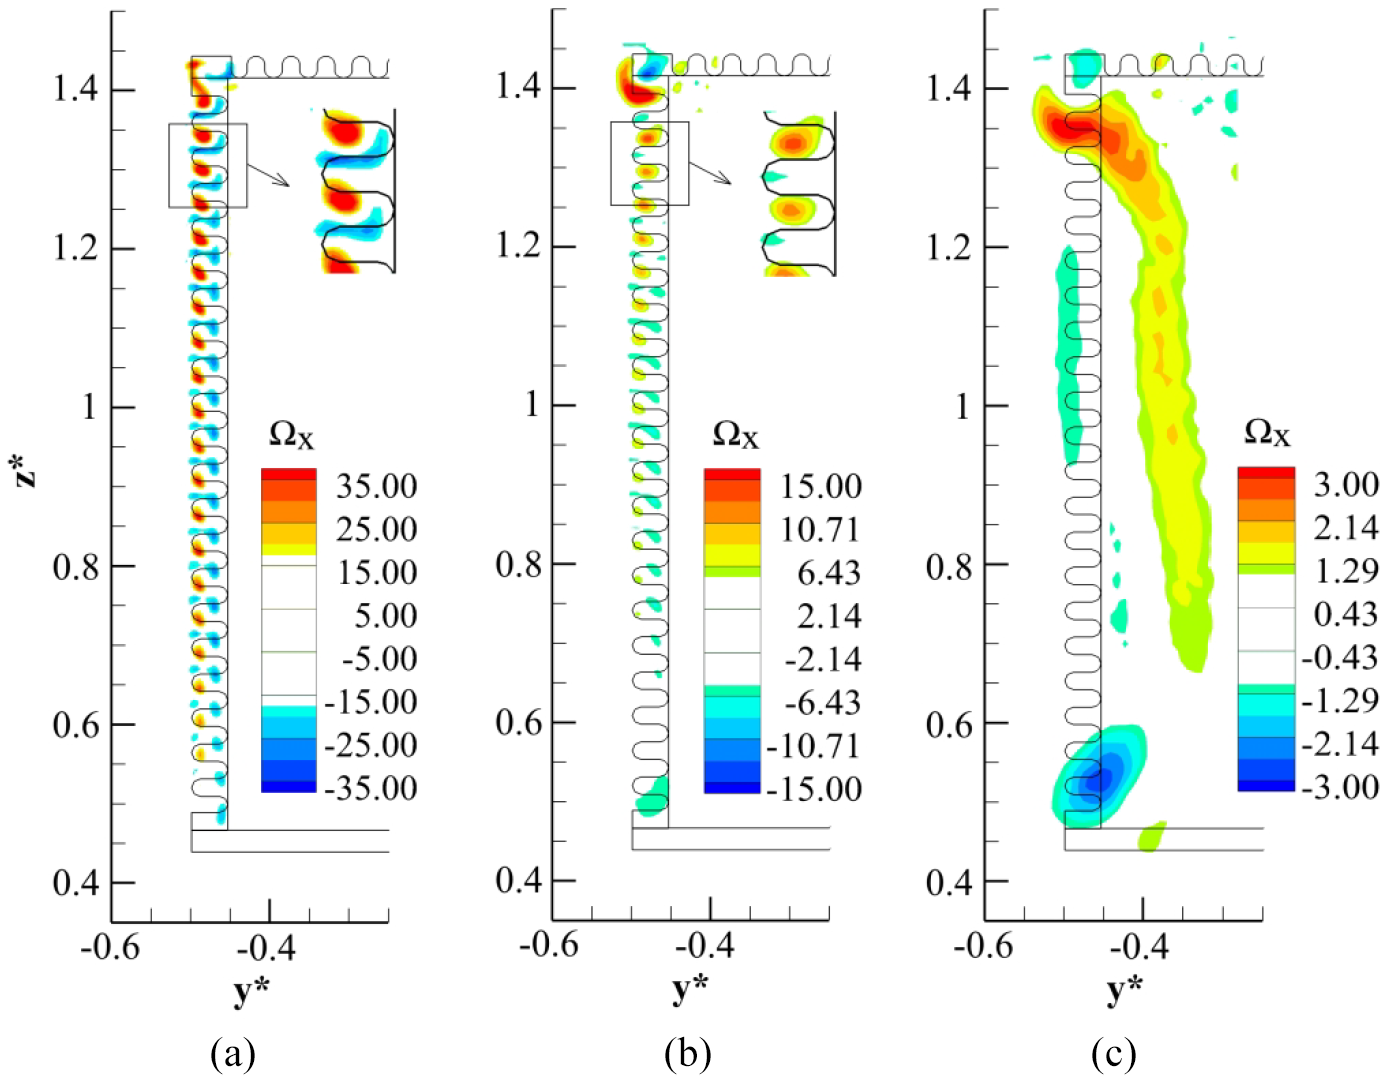
Figure 14(a)(i) and (b)(i) presents u* contours for BTTs α = 15° and α = 20° from the transverse perspective (T1). From Figure 14(a)(i), it is evident that the taper α = 15° reduces the size of the wake downstream of the trailer base, providing support for the presented drag results (Figure 6), as Grandemange et al. 71 indicate reductions in wake size as a factor contributing to drag decrease. Additional insights are gained from Figure 14(a)(ii) presenting the streamwise vorticity (ΩX) in the same plane. These results show two pairs of counter-rotating structures centred around the middle of the base. The nature of these vortices is such that the pairs are counter-rotating horizontally, but also vertically along each side (all adjacent vortices are counter-rotating), resembling the topology produced by the lobed boat-tails described by Rejniak and Gatto. 49 The vortices originate from the four base corners, with Grandemange et al. 71 suggesting the optimum drag reduction is achieved when all adjacent structures are counter-rotating, as is the case here. As described by Rejniak and Gatto, 49 the principal action of these vortices is to contract the wake around the middle (z* ≈ 0.8) with subsequent stretching occurring in the lower parts (z* < 0.6). This is indeed the case for BTT α = 15°, as presented in Figure 14(a)(i), with a maximum increase in the local wake width relative to baseline (Figure 10(a)) of Δy* ≈ 0.2 at z* ≈ 0.4. Additionally, though the upper pair appears subtly elongated spatially (a result most likely of the downstream distance from the base), the maximum vorticity within each of the four structures is found near-identical being approximately |ΩX| ≈ 1.1–1.2. One consequence of this balance is reflected in Figure 15, showing near-symmetric upwash and downwash around z* ≈ 0.9, with maxima of ω* ≈ 0.068 and ω* ≈ −0.076 at z* ≈ 0.36 and z* ≈ 1.45, respectively. This distribution of vertical velocity is in excellent agreement with Pavia et al., 72 who associate such a balance in the upwash/downwash with the overall vertical wake balance and optimum drag conditions. These results, therefore, provide further support for the alleged shift in the vertical wake balance and the subsequent high drag reduction obtained with BTT α = 15°.
Contours of streamwise velocity (i) and vorticity (ii) in T1 for: (a) BTT α = 15° (sides and top), (b) BTT α = 20° (sides and top) (−0.25 < ΩX < 0.25 omitted for clarity).
Plots of vertical velocity ω* in SV1 at x* ≈ 0.25 for BTT α = 15° and BTT α = 20° (sides and top for both).
For the BTT α = 20°, the balance in ΩX is lost as can be seen in Figure 14(b)(ii), with only one dominating pair of counter-rotating vortices now evident. A subtle lateral asymmetry is also captured in these results, resulting from the weaker structures being filtered out by omitting |ΩX| < 0.25, and highlighting the inability of HWA to capture the finest variations in velocity direction. Nevertheless, these magnitude deviations around y* ≈ 0 are generally weak, limited to ΔΩX < 0.2. From the direction of the dominant central vortices, the principal action of these structures is inferred to result in a subtle contraction at z* ≈ 0.7, as can be seen in Figure 14(b)(i), as well as a relative enhancement in upwash, with increases in wake height (relative to BTT α = 15°) in agreement with Figure 12(a). The characteristics presented in Figure 14(b)(ii) are similar to those of the boat-tail (BT) studied by Rejniak and Gatto, 49 however, the vorticity direction and consequently the effects on the wake formation are opposite. This difference is suggested to stem from the disparity in the origin of the two vortices. While for the BTT α = 20°, the vortices are seen to originate from the top corners, in the boat-tail case discussed by Rejniak and Gatto, 49 the dominating structures were shown to originate from the bottom corners. This is suggested to be the result of the inherent differences in the configurations, with the boat-tail 49 constructed from four panels inclined inboard at a constant angle (here bottom edge is straight). With the bottom base edge sloped inboard, 49 the exiting underbody flow is typically characterised by higher local upwash,23,68,71 offering an explanation for the stronger flow circulation around the bottom corners. Furthermore, Perry et al. 23 show that for side taper angles of α > 16°, the lower portions of the sides are more prone to unsteady separation, explaining the sudden reduction, or loss, of the bottom corner vortices. The results presented in Figure 14(b)(ii) (|y*| ≈ 0.4, z* ≈ 0.5) support these findings. Ultimately, the top vortex pair presented in Figure 14(b)(ii) results in a wake which is wider at z* > 0.9 and narrower at z* < 0.6 (Figure 14 (b)(i)) relative to BTT α = 15° (Figure 14(a)(i)). Additionally, Figure 15 reflects the growing vertical imbalance associated with the imbalance in ΩX, showing an increase in upwash and reduction in downwash relative to BTT α = 15°, with local maxima of ω* ≈ 0.110 and ω* ≈ −0.043 at z* ≈ 0.36 and z* ≈ 1.45, respectively. These results support the degradation in performance for BTT α = 20°. 72 The trend of changing wake width with increasing α is further highlighted in Figure 16, also including the results for BTT α = 25°, largely resembling the trends of the baseline, in agreement with the measured drag (Figure 6). These results (Figures 15 and 16) support the progressive shift in the vertical wake balance.
Plots of u* in T1 for Baseline, BTT α = 15° (sides and top), BTT α = 20° (sides and top) and BTT α = 25° (sides and top) at: (a) z* ≈ 0.45, (b) z* ≈ 1.18.
Effects of lobed-mixing geometries
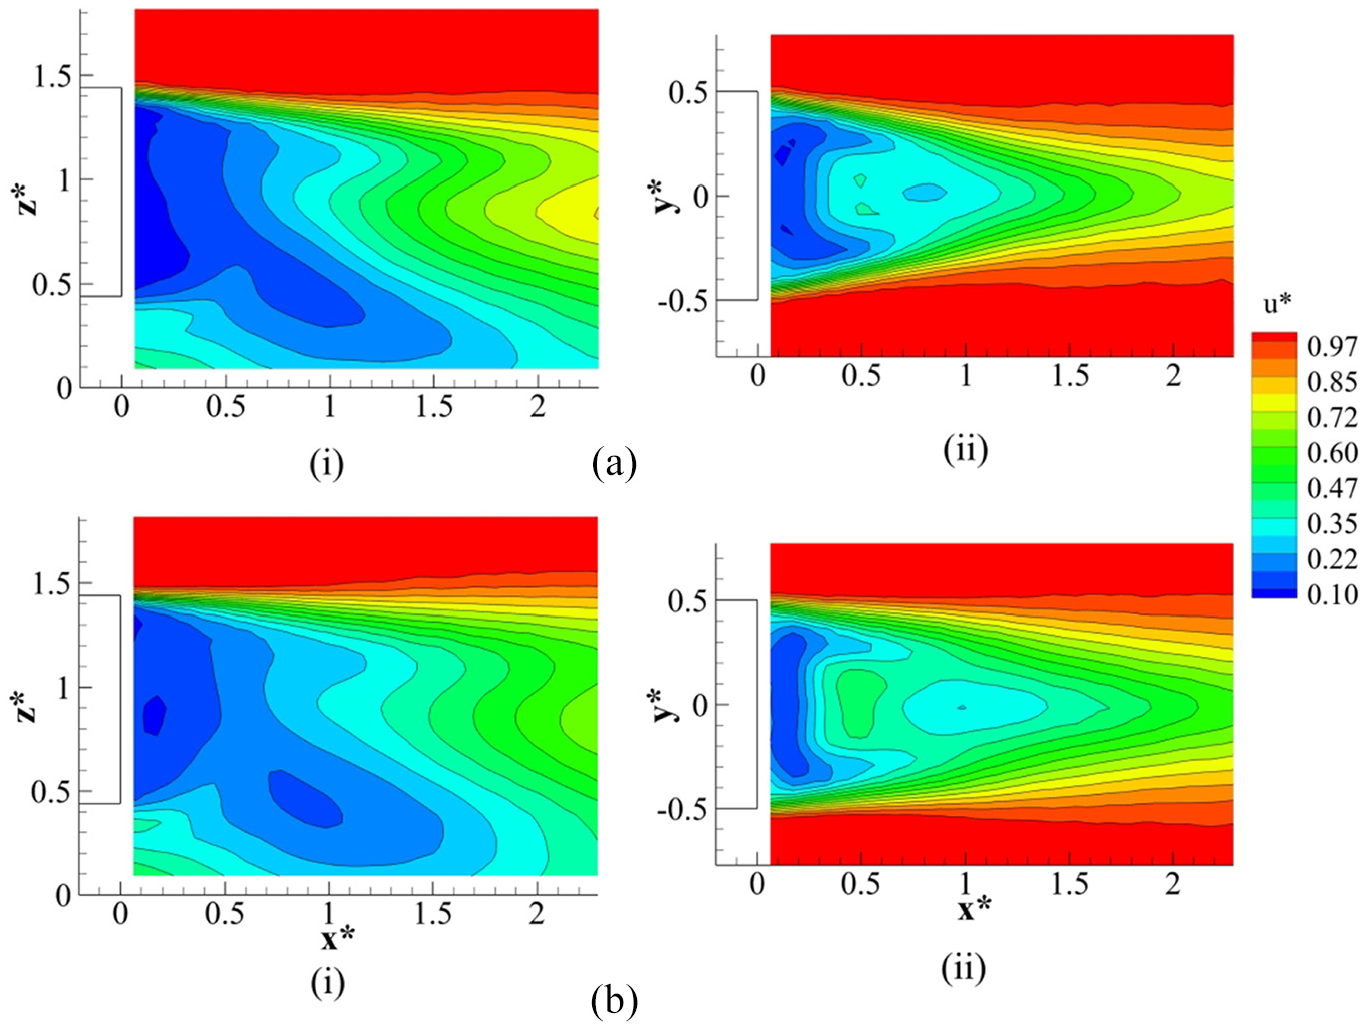
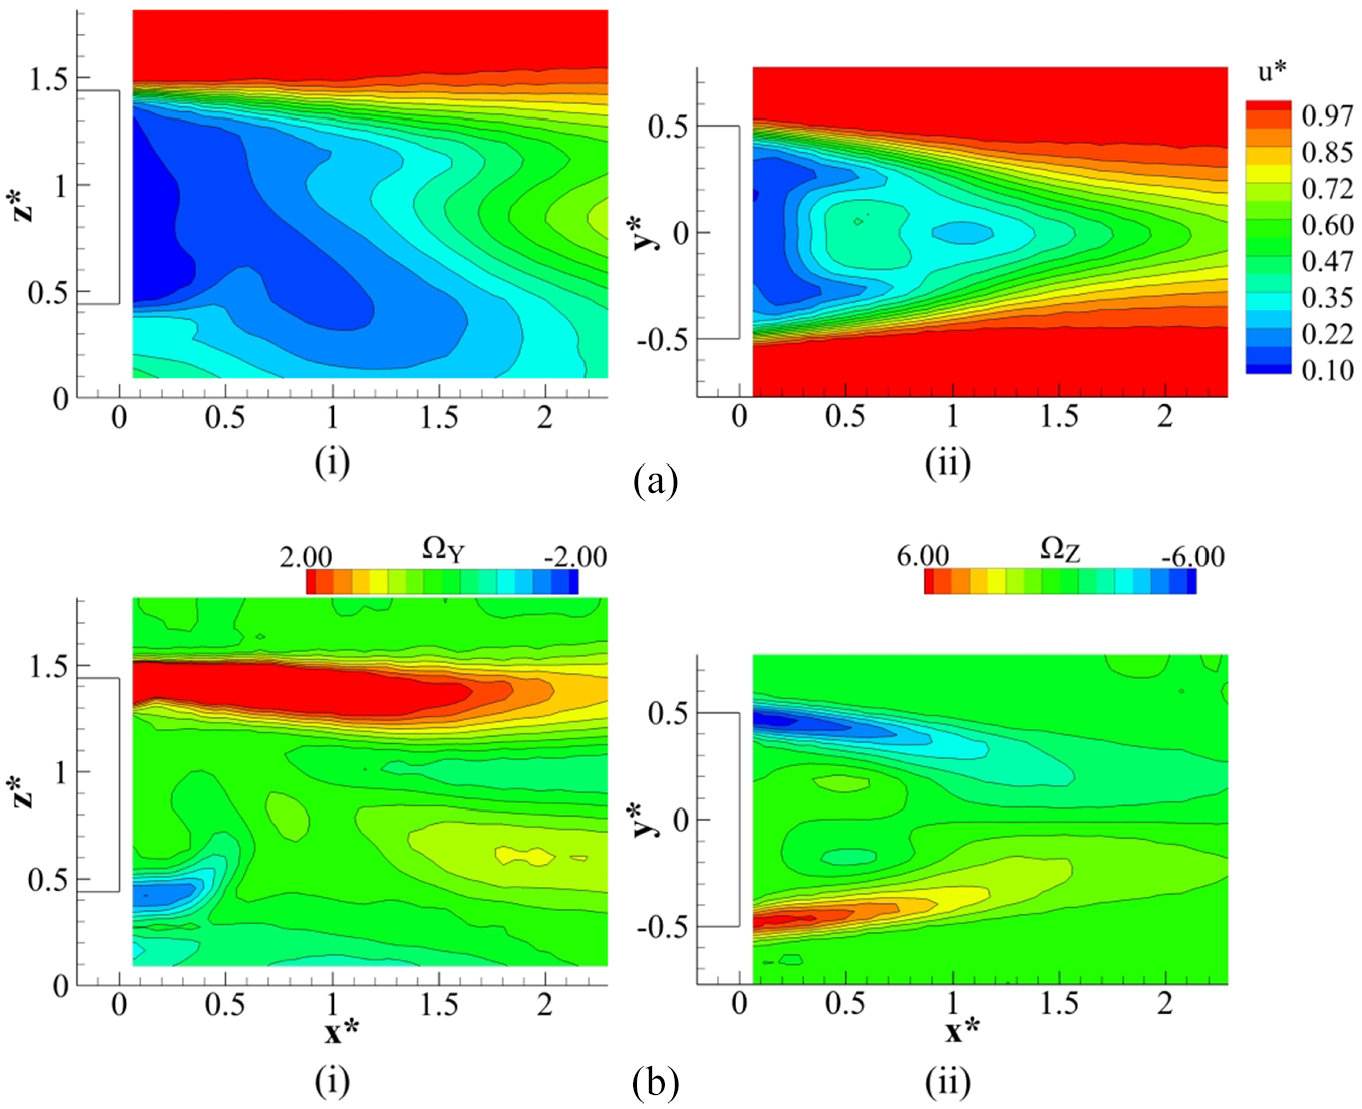
The lobed mixer configuration selected for the flow-field evaluation is the LBT p = 0.044 W for its ability to produce significant drag reductions across the range of angles 15° < β < 25° (Figure 7(b)). The configuration LBT p = 0.044 W–β = 15° is considered first, with u* topologies in SV1 and SH1 presented in Figure 17(a). In SV1 (Figure 17(a)(i)), the overall wake topology is similar to that of BTT α = 15°, with the lowest u* magnitudes residing close to the base. One exception is the weaker tapering from the top, suggesting relatively lower downward momentum locally. This is also evident in the velocity deficit in the upper parts (z* > 0.9) extending further downstream, with u* < 0.3 at x* < 1.3 in comparison with x* < 1 for BTT α = 15° (Figure 11(a)(i)). From the horizontal perspective (SH1 –Figure 17(a)(ii)), the wake is seen narrower than the baseline (Figure 9(a)(ii)), indicating a relative enhancement in the crosswise flow. In comparison with BTT α = 15° however, the reductions in wake width are less significant, suggesting relatively weaker inboard momentum; this is most evident in Figure 18(a). The lowest velocity magnitudes (u* < 0.2) are again seen to extend further downstream to x* ≈ 0.6 within 0.1 < |y*| < 0.35 (Figure 17(a)(ii)), similar to BTT α = 15° (Figure 11(a)(ii)), suggesting a comparable increase in the size of the side wake vortices.
LBT p = 0.044 W-β = 15° (sides and top) wake: (a) streamwise velocity u* and (b) in-plane vorticity (ΩY and ΩZ); (i) SV1 (ΩY), (ii) SH1 (ΩZ).
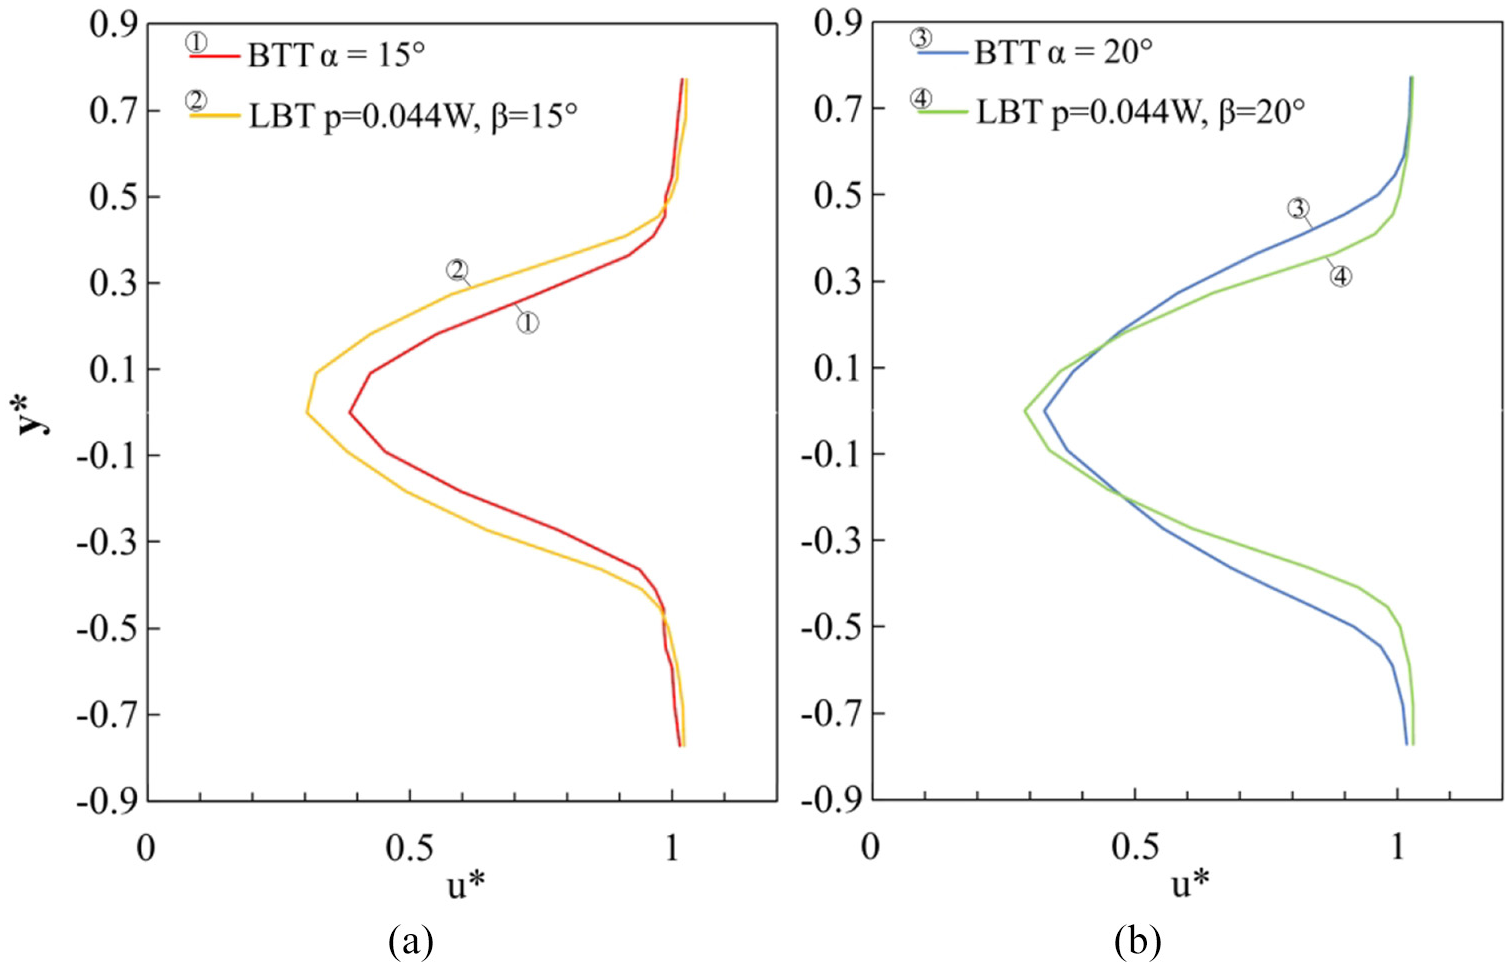
Profiles of u* at x* ≈ 1.25, z* ≈ 0.92 (SH1) for: (a) BTT α = 15° and LBT p = 0.044 W–β = 15°, (b) BTT α = 20° and LBT p = 0.044 W–β = 20° (sides and top for all).
The in-plane vorticity (Figure 17(b)) shows analogous trends. In SV1 (Figure 17(b)(i)) the topology remains similar to that of the BTT α = 15° (Figure 13(a)(i)), except along the top shear layer (1.3 < z* < 1.5), which does not exhibit the same arching towards the wake centre as is seen in Figure 13(a)(i); consistent with weaker downward momentum. Close to the underbody region (0.3 < z* < 0.5), the area of strong upwash appears near identical to that of the BTT α = 15° (Figure 13(a)(i)), extending to x* ≈ 0.4. From these results, a similar shift in the vertical wake balance may be inferred, with the position of the lower wake vortex moved away from the base relative to the baseline case (Figure 9(b)(i)). This is explored further in the remainder of this section. From the horizontal perspective (SH1 –Figure 17(b)(ii)), ΩZ supports a subtly wider wake for LBT p = 0.044 W–β = 15° relative to BTT α = 15°, with similar magnitudes, but less severe arching towards y* ≈ 0. Overall, these findings support the drag results for these configurations, showing the tendency for smaller wakes to produce lower drag. 71
Further insight is gained considering the LBT p = 0.044 W–β = 20° wake topology presented in Figure 19. Figure 19(a) and (b) show near-identical trends in u* and in-plane vorticity to those in Figure 17, suggesting that the increase from β = 15° to β = 20° makes little difference to the overall wake size and distribution. These results imply that within this β range, strong flow entrainment from the sides and top trailing edges is sustained, despite the increase in penetration angle. This finding supports the small variation in drag reduction between these configurations, changing from 7.6% (LBT p = 0.044 W–β = 15°) to 7.0% (LBT p = 0.044 W–β = 20°) (within experimental uncertainty; Figure 7(b)). Furthermore, comparisons to the BTT α = 20° (Figures 11(b) and 13(b)), whose trends approach those of the baseline, suggest that LBT p = 0.044 W–β = 20° generates stronger inboard momentum from the sides. This is most evident in the relative reduction in the wake width indicated in Figure 18(b). This again supports the drag reduction trends, with the benefit measured for the BTT α = 20° at approximately 4% (Figure 6).
LBT p = 0.044 W–β = 20° (sides and top) wake: (a) streamwise velocity u* and (b) in-plane vorticity (ΩY and ΩZ); (i) SV1 (ΩY), (ii) SH1 (ΩZ).
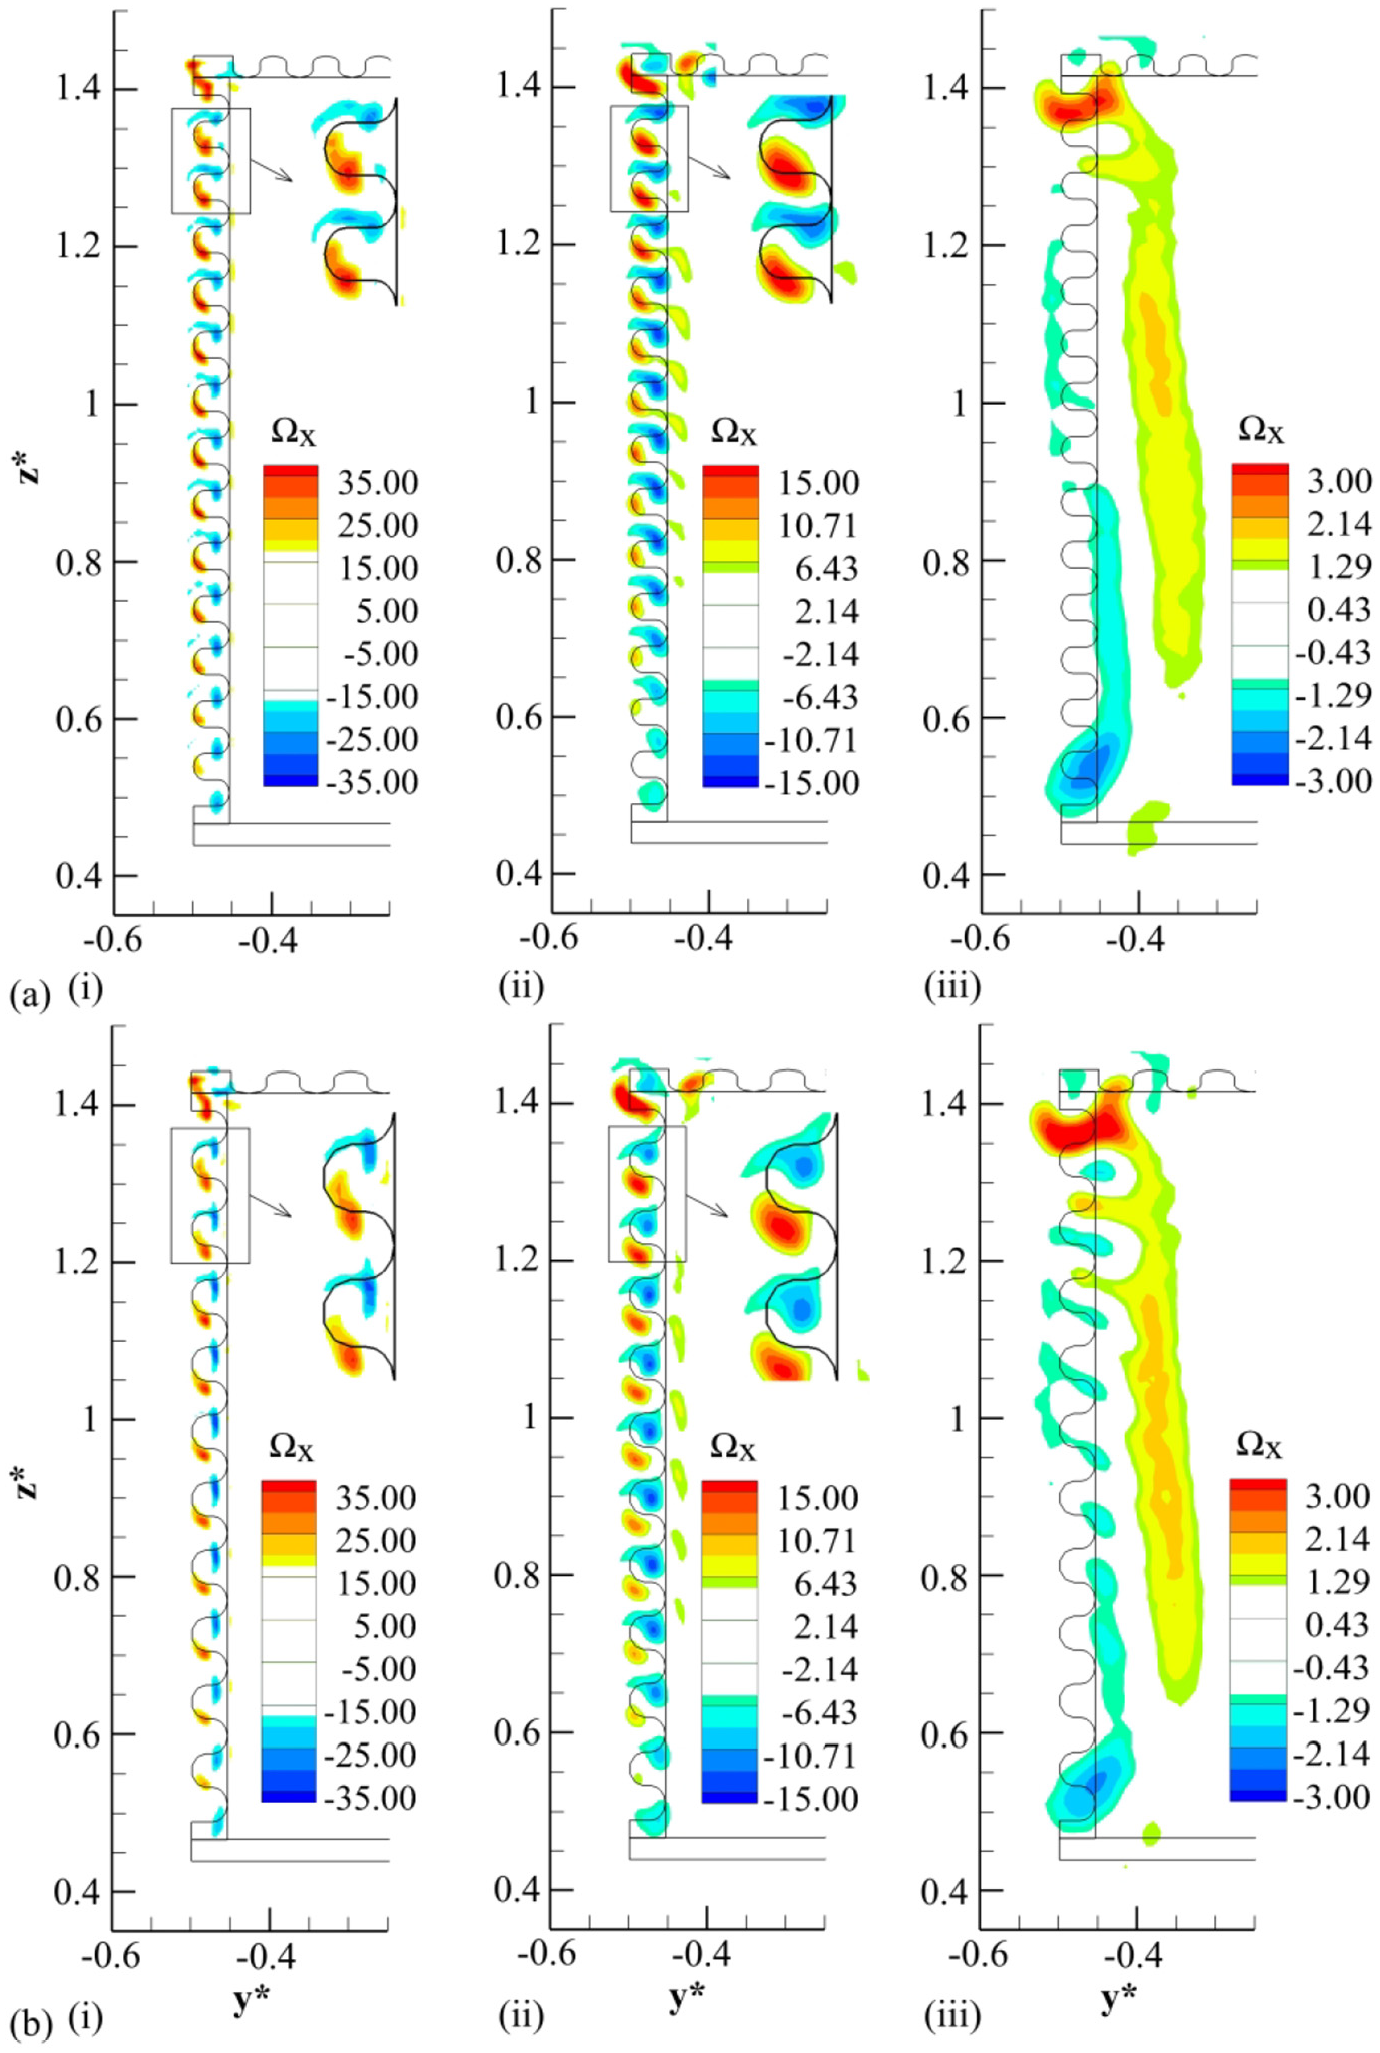
Figure 20 considers the configurations LBT p = 0.044 W at β = 15°, 20° in the transverse plane T1. The u* topology for the LBT p = 0.044 W–β = 15° (Figure 20(a)(i)) confirms reductions in wake size downstream of the trailer base (z* > 0.5) and increases in the lower portions (z* < 0.5), relative to the baseline (Figure 10(a)). The lowest velocity magnitudes are contained within |y*| < 0.3, z* < 1.25, and the shape of the wake is seen to generally reflect the shape of the base, with small spanwise contractions visible around z* ≈ 0.8. In comparison with the BTT α = 15° (Figure 14(a)(i)), the wake size reductions are evidently less significant, further supporting the variation in drag results for these two configurations. In the same plane, the topology of ΩX (Figure 20(a)(ii)) shows two pairs of counter-rotating structures around the base centre, similar to the trend observed for the BTT α = 15° (Figure 14(a)(ii)). For LBT p = 0.044W–β = 15°, the overall magnitudes are found subtly weaker (|ΩX| ≈ 0.6–1.0) and the magnitude disparity between the individual structures higher, albeit limited to |ΔΩX| ≈ 0.4. These results are reflected in Figure 21, showing only marginal reductions in the upwash and downwash around z* ≈ 0.9 (in comparison with the analogous trend for BTT α = 15° in Figure 15) and excellent retention of the vertical balance, with the local maxima of ω* ≈ 0.058 and ω* ≈ −0.057 at z* ≈ 0.36 and z* ≈ 1.45, respectively. These findings provide further support for the correlation between the vertical wake balance and drag benefit.71,72
Contours of streamwise velocity (i) and vorticity (ii) in T1 for LBT p = 0.044 W (sides and top) at: (a) β = 15°, (b) β = 20° (−0.25 < ΩX < 0.25 omitted for clarity).
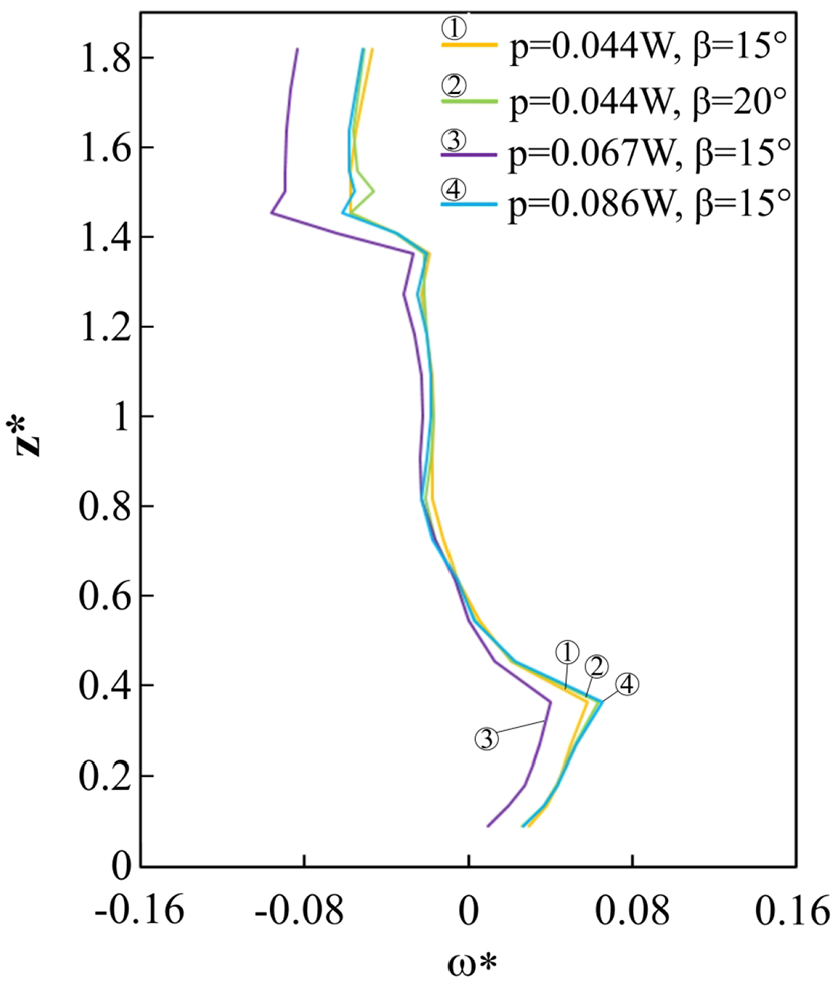
Plots of vertical velocity ω* in SV1 at x* ≈ 0.25 for LBT p = 0.044 W–β = 15° and β = 20°, p = 0.067–β = 15° and p = 0.086–β = 15° (sides and top for all).
The effects of increasing penetration angle are evident by considering the results of LBT p = 0.044 W–β = 20° (Figure 20(b)). From this perspective, the u* topology (Figure 20(b)(i)) is seen nearly unaffected, being near-identical to Figure 20(a)(i). One exception is the minimum magnitude of u* ≈ 0.16 at |y*| < 0.1, 0.3 < z* < 0.45 in comparison with u* ≈ 0.17 (within experimental uncertainty) in Figure 20(a)(i). These results agree with the trends presented in Figures 17 and 19, showing analogous similarities in planes SV1 and SH1. Correspondingly, the ΩX topology (Figure 20(b)(ii)) also continues to exhibit the four counter-rotating structures discussed previously. For LBT p = 0.044 W–β = 20°, the upper pair (z* ≈ 1.2 –Figure 20(b)(ii)) can be seen subtly stronger, with the maximum magnitudes now within |ΩX| ≈ 0.6–1.1 and a marginal increase in the magnitude disparity to |ΔΩX| ≈ 0.5. These trends support the variations in the drag reduction for these two configurations being within experimental uncertainty (Figure 7(b)). More importantly, however, comparisons between Figure 20(b) and BTT α = 20° (Figure 14(b)) reveal that for the same aspect ratio modification (β = α = 20°), the addition of lobed mixers continues to produce significant wake size reductions as well as the lower pair of streamwise vortices (0.5 < z* < 0.6). Consequently, the vertical wake balance is also seen retained in Figure 21, in contrast with the overwhelming upwash found for the BTT α = 20° in Figure 15. These results support the significantly better drag reduction measured for the LBT configurations of β = 20° relative to BTT α = 20° (Figure 8(c)).
Overall, these results (Figure 20) suggest that one effect of increasing β is a gradual loss in balance between the counter-rotating vortex pairs, explaining the steady degradation in drag reduction. Additionally, with increasing α, the redistribution of ΩX appears very sudden, with a complete loss of the lower vortex pair from BTT α = 15° to α = 20°, supporting the severe increase in drag between the two. With the addition of lobed mixers however, this change can be seen to be more progressive, with both upper and lower vortex pairs sustained for higher aspect ratios.
Effects of various pitches are evaluated considering the results for LBT p = 0.067 W and p = 0.086 W at β = 15° (Figure 22). In both cases, u* topology (Figure 22(a)(i) and (b)(i)) closely resembles that of LBT p = 0.044 W–β = 15° presented in Figure 20(a)(i), with observable reductions in wake size downstream of the trailer base and the lowest magnitudes contained within |y*| < 0.3, z* < 1.25. More distinct differences, albeit still subtle, are found in the ΩX distributions at T1 (Figure 22(a) and (b)(ii)). Firstly, a subtle lateral asymmetry favouring the left-hand side can be observed within these results, highlighting again the inability of HWA to resolve very fine velocity direction variations. This, however, is not expected to preclude comparisons between the respective upper and lower structures, with the effects on vertical wake balance ultimately validated with velocity trends in Figure 21. In comparison with LBT p = 0.044 W–β = 15° (Figure 20(a)(ii)), LBT p = 0.067 W–β = 15° (Figure 22(a)(ii)) shows an increase in vorticity strength. While the four counter-rotating structures are still evident, the maximum magnitudes are now within |ΩX| ≈ 0.7–1.3, representing a growth in magnitude disparity between the adjacent vortices of up to |ΔΩX| ≈ 0.6. Further increases in pitch to p = 0.086 W (Figure 22(b)(ii)) also result in stronger vorticity relative to p = 0.044 W, with maximum magnitudes of |ΩX| ≈ 0.8–1.2. In this instance however, the relative increase in the strength of the upper and lower structures is identical, resulting in a similar magnitude disparity (|ΔΩX| ≈ 0.4) as that found for p = 0.044 W. Considering these results in conjunction with the drag trends presented in Figure 8(b) offers further support for the increasing drag with growing vortex imbalance, despite all of the configurations providing reductions in wake size. This is also reflected in the vertical velocity trends in Figure 21, showing a retention of the vertical wake balance for p = 0.086 W along with an increase in downwash and a subtle reduction in upwash for p = 0.067W (ω* ≈ −0.096 at z* ≈ 1.45 and ω* ≈ 0.040 at z* ≈ 0.36).
Contours of streamwise velocity (i) and vorticity (ii) in T1 for: (a) LBT p = 0.067 W–β = 15° (sides and top), (b) LBT p = 0.086 W–β = 15° (sides and top) (−0.25 < ΩX < 0.25 omitted for clarity).
Lobe vorticity
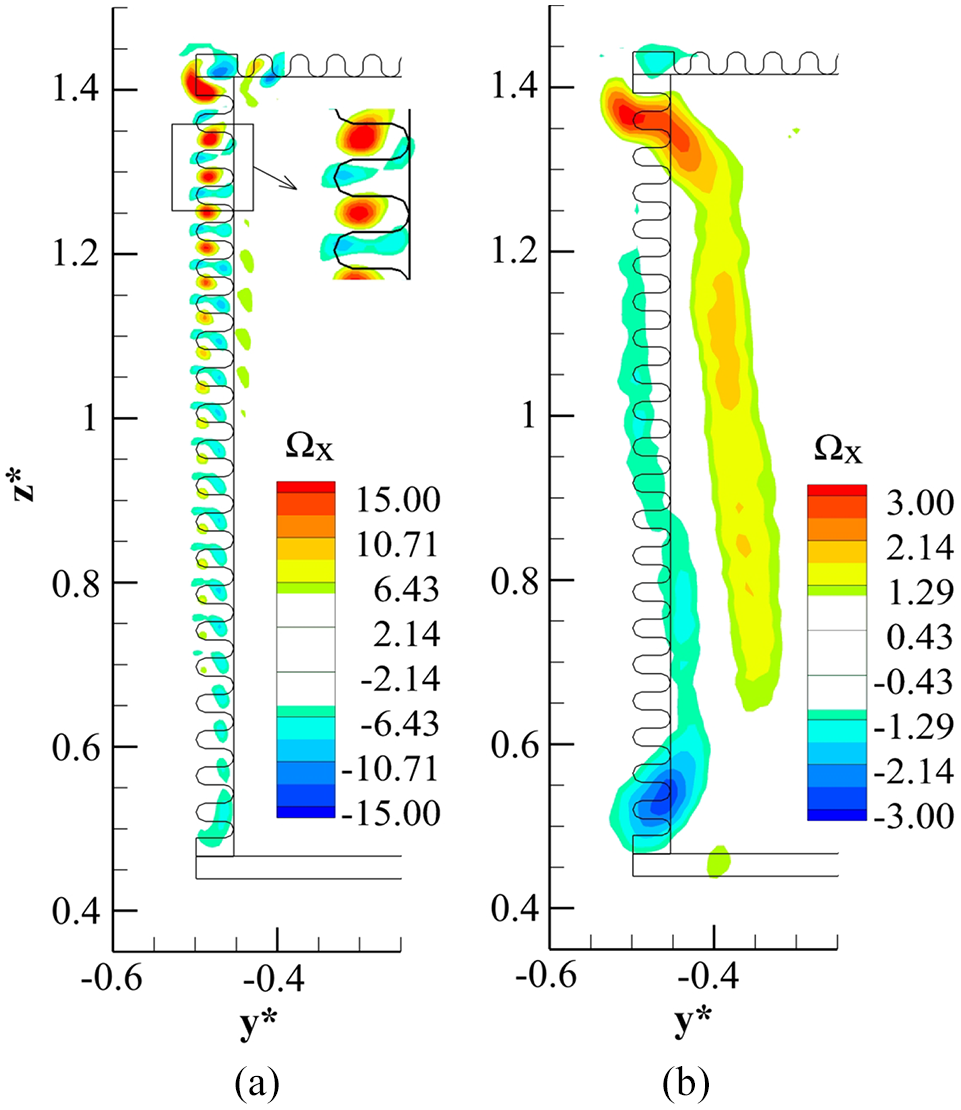
To assess the flow-field characteristics close to the trailing edge, the LBT p = 0.044 W–β = 15° is considered in plane TS1, as presented in Figure 23. In Figure 23(a), the u* topology can be seen to be characteristically non-uniform, closely resembling the lobed profile. This non-uniformity is a key condition for the production of streamwise vorticity at each lobe31,64 and suggests that the geometries studied here fulfil this requirement. Subtle deformation of the velocity field downstream of each lobe can also be observed, with small increases in magnitude around the middle of the lobe relative to the position closer to the peak. This trend is typical and reflective of the deformation caused by the streamwise vorticity presented in Figure 23(b).35–38 In Figure 23(b), the pairs of counter-rotating vortices are evident, as expected, with each pair centred around the lobe’s profile. From this perspective, each clockwise vortex (blue) is located close to the upper lobe side, with the anticlockwise (red) vortex positioned beneath, consistent with the high-speed freestream flow entering the profile from the left-hand side. Additionally, the former can be seen (Figure 23(b)) to be more elongated, with the maximum vorticity position nearer the trough, whereas the latter is found to be rounder and located towards the peak. This asymmetry is inferred to stem from the inherent asymmetry in the flow over the model sides. For a road vehicle model with moving ground use, the flow over the sides is expected to experience subtle downwash 70 and thus, result in the fluid entering the lobe profile at an angle as opposed to parallel. This is expected to shift the line of maximum pressure from the peak to a position marginally higher along the lobe’s profile, as presented in the schematic in Figure 24. As a result, the fluid is unable to reach the “underside” of the lobe and the anticlockwise vortex is formed closer to the crest.
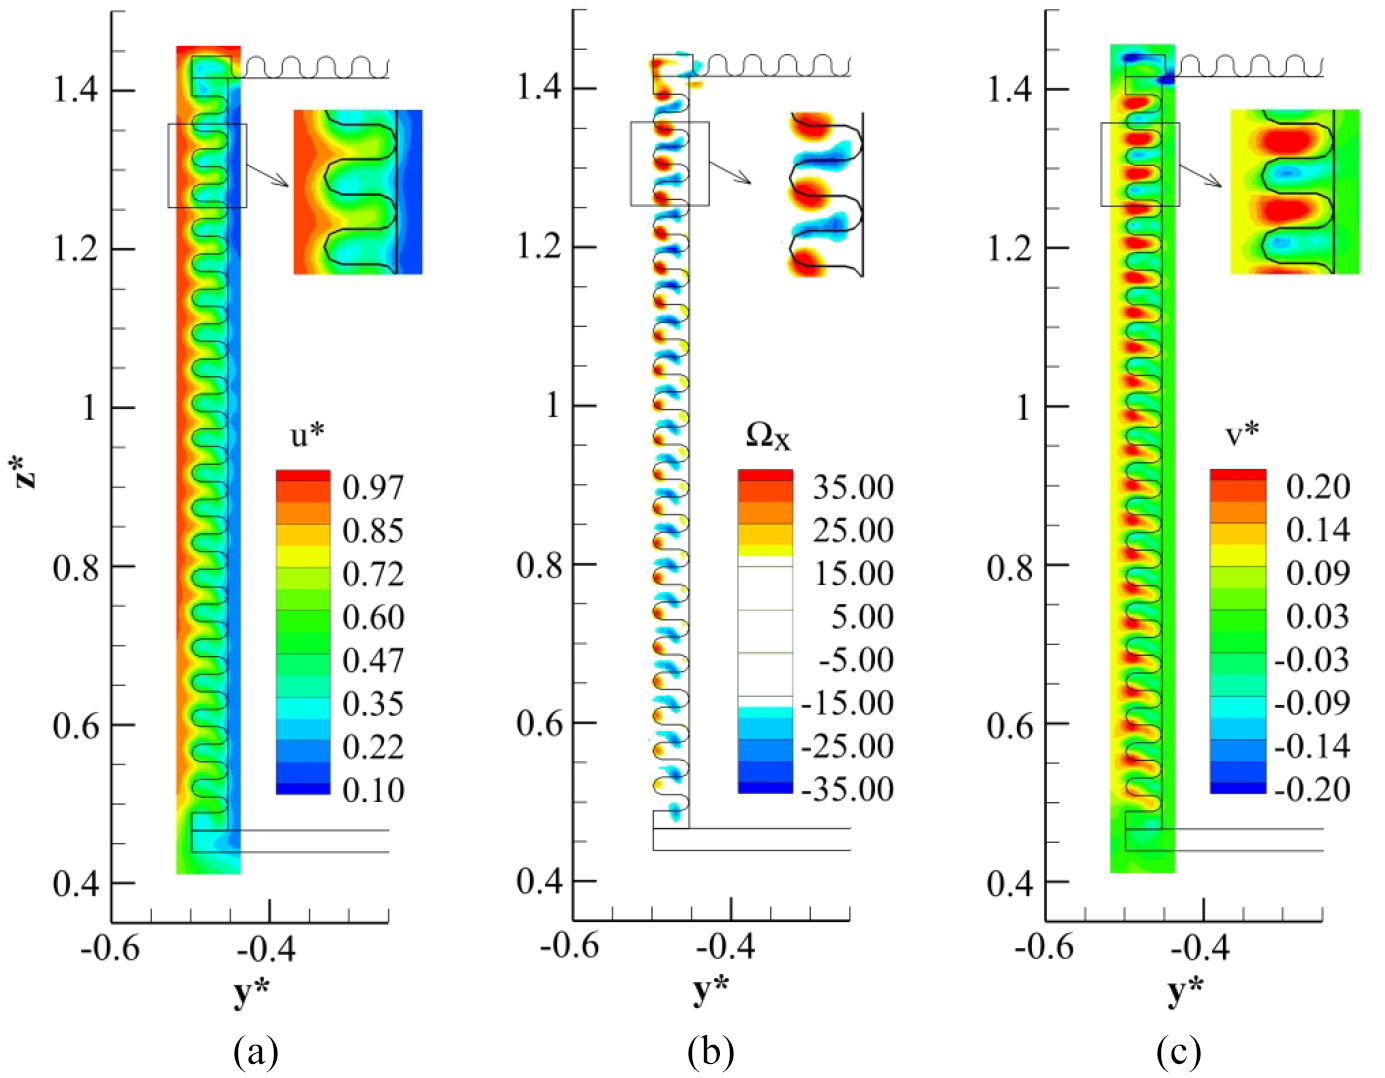
Contours within plane TS1 for LBT p = 0.044 W–β = 15° of: (a) streamwise velocity, (b) streamwise vorticity, (c) crosswise velocity (−15 < ΩX < 15 omitted for clarity).
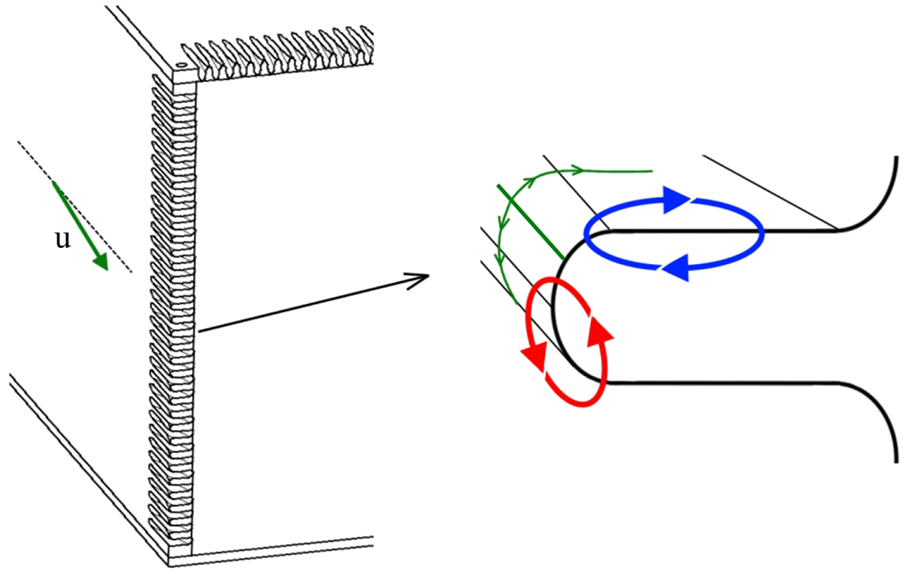
Schematic of the vortex formation over the lobes located along the model’s side trailing edges.
Another result of this asymmetry is reflected in the variable strength of the adjacent vortices. As the line of maximum pressure moves upwards, the pressure gradients over the upper lobe surface are expected to become less severe in comparison with the peak, as the effective slope reduces. Consequently, the anticlockwise vortex is expected to be stronger (higher pressure gradients). Within the upper base half (Figure 23(b)), the maximum vorticity is found to be ΩXmax ≈ 49.5 and ΩXmax ≈ −39.1 for the anticlockwise and clockwise structures, respectively, supporting this hypothesis, with a similar asymmetry in the vortex strength also observed by Eckerle et al. 73 Furthermore, towards the ground, where the local downwash becomes more significant due to moving ground proximity, the line of maximum pressure is expected to shift progressively closer to the upper lobe side. This would continue to reduce the local pressure gradients, weakening the clockwise structures further, as indeed seen in Figure 23(b). Simultaneously, on the other side of the line, the pressure gradients become so severe that the anticlockwise structures are formed increasingly closer to the peak and weaker, as they form over a shorter effective height (smaller surface). This is reflected in the gradual weakening of the vorticity towards the base bottom, with the clockwise structures also seen larger and better defined.
Figure 23(c) also presents the contours of crosswise velocity, v*, in the same position (TS1). One important effect of the counter-rotating vortex pairs is observed at each trough of the profile, with pockets of strong inboard crossflow generated locally, consistent with the reductions in the wake width found for the LBT configurations (Figures 17 and 20). Behind each lobe a small area of outboard crossflow is also induced, in agreement with the direction of the adjacent vortices. The latter, however, are considerably weaker, which is expected due to the overall stronger inboard entrainment produced by the low-pressure wake.
Further insight is gained from the streamwise vorticity data in the planes TS2 and TS3 (Figure 25). In TS2 (Figure 25(a)) the distinct cells of counter-rotating vorticity are still discernible. One immediate observation however, is the significant reduction in magnitudes, with ΩXmax ≈ 27.1 and ΩXmax ≈ −10, consistent with a downstream vortex breakdown.37,38 Hu et al.37,38 show that as the streamwise vortices travel downstream, they tend to break down rapidly into increasingly smaller structures occupying random positions. Although instantaneous results reveal the strength of the smaller vortices to be consistent with the upstream locations, within the time-averaged results the distribution remains more organised with the mean strength reduced.37,38 The results here support these findings (Figure 25(a)). Additionally, the vortices which are originally (at the trailing edge) smaller and weaker are typically found to diffuse more rapidly.32,73 Results in Figure 25(a) again agree, with the weak anticlockwise vortices seen in Figure 23(b) in the lower base half now almost indiscernible at z* < 0.8 (Figure 25(a)). This region (z* < 0.8 –Figure 25(a)) is now dominated by the clockwise structures. Similarly, in the upper base half (z* > 1.1) the anticlockwise cells are observed to be dominant, consistent with the trend in Figure 23(b).
Streamwise vorticity contours for LBT p = 0.044 W–β = 15° in: (a) TS2 (−5 < ΩX < 5 omitted for clarity), (b) TS3 (−1 < ΩX < 1 omitted for clarity).
As the vortices evolve further, they continue to diffuse, with the maximum vorticity in TS3 (Figure 25(b)) at ΩXmax ≈ 3.5 and ΩXmax ≈ −2.8 for the anticlockwise and clockwise structures, respectively. Additionally, only two distinct regions of counter-rotating vorticity are observed at this position. For the anticlockwise structure, the highest magnitudes are located in the upper base half (z* > 1 –Figure 25(b)), whereas the most elevated clockwise magnitudes are positioned at z* < 0.8. This trend is consistent with the upstream planes (TS1 –Figure 23(b), TS2 –Figure 25(a)), whereby the former was found dominant in the upper base half, with the latter, dominating the lower portions. Hu et al. 37 show that the adjacent vortices of the same sign tend to spread around their counter-rotating neighbours and merge together as they travel downstream, producing larger areas of like-sign circulation. Results in Figure 25 are reflective of a similar behaviour. Additionally, Hu et al. 37 also show that through the downstream diffusion, vortices have the tendency to spread towards the low-velocity region, which is evident in Figure 25(b) with the structures found to shift towards the wake centreline. Finally, further downstream diffusion of these structures is observed to produce the previously discussed topology within T1 (Figure 20(a)(ii)), with the elevated magnitudes of anticlockwise and clockwise circulation found at −0.4 < y* < −0.3, 1 < z* < 1.2 and −0.5 < y* < −0.4, 0.5 < z* < 0.7, respectively. Overall, these results indicate the evolution of the streamwise vorticity (from TS1 to T1) to contribute to the production of the vertical wake balance discussed previously (Figure 21), resulting in enhanced drag reductions.
Additional detail regarding the downstream decay of the maximum streamwise vorticity magnitude for the LBT p = 0.044 W–β = 15° is presented in Figure 26. Close to the trailing edges (X/h < 1), the ΩXmax is high, as would be expected with a small pitch and high-speed upstream flow. Further downstream, the vorticity diffuses rapidly, reducing by almost 50% within the distance equivalent to approximately 3 h. This trend (Figure 26) is in general agreement with that reported by Hu et al. 37 for larger lobes at lower Reynolds numbers, and indicates that the breakdown of large-scale streamwise vortices into smaller structures occurs within short distances from the trailing edges.
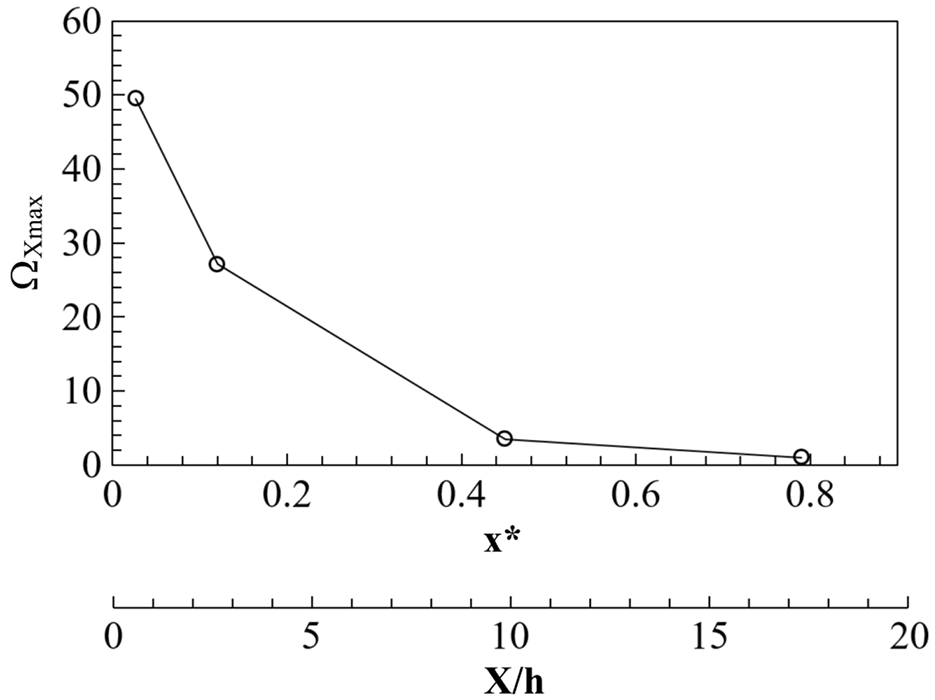
The Downstream decay of the maximum streamwise vorticity magnitude for the LBT p = 0.044 W–β = 15°.
The effects of penetration angle on the vorticity production and evolution are considered with the results of LBT p = 0.044 W–β = 20° (Figure 27). One immediate observation in Figure 27(a) is a similar asymmetric generation of vorticity as explained previously for LBT p = 0.044 W–β = 15° (Figure 24). Correspondingly, the vorticity is also found to be strongest in the upper base half and weakening towards the floor. Further inspections reveal that the initial maximum vorticity within the anticlockwise structures is subtly higher (ΩXmax ≈ 52.4) for this configuration (Figure 27(a)) in comparison with Figure 23(b). This finding is in general agreement with the hypothesis that higher penetration angles generate stronger circulation. 63 In contrast, the clockwise vortices in Figure 27(a) are observed to be weaker, with ΩXmax ≈ −36.4. The relative reduction in the latter is near-equivalent to the increase found for the anticlockwise structures, suggesting perhaps that a link exists between the imbalance and increasing penetration angle. The growing disparity in strength of the counter-rotating vortices is also somewhat consistent with the trend observed previously at T1 (Figure 20(a) and (b)(ii)).
Streamwise vorticity contours for LBT p = 0.044 W–β = 20° in: (a) TS1 (−15 < ΩX < 15 omitted for clarity), (b) TS2 (−5 < ΩX < 5 omitted for clarity), (c) TS3 (−1 < ΩX < 1 omitted for clarity).
Further downstream through TS2 and TS3, similar trends of vortex diffusion (TS2 –Figure 27(b)) and merging (TS3 –Figure 27(c)) are also observed. Interestingly, in Figure 27(b) the vorticity is found weaker relative to Figure 25(a), which is reflective of a higher initial maximum vorticity decay rate, with the magnitude reducing by 55% over Δx* < 0.09 (TS1 to TS2), in comparison with the 45% found for LBT p = 0.044 W–β = 15°. This suggests that with higher penetration angles, the initial vorticity is stronger and breaks down more rapidly. At TS3 (Figure 27(c)) the trends are similar to Figure 25(b), with the maximum vorticity within the anticlockwise structures once again subtly higher at ΩXmax ≈ 3.7.
Further insight is gained by considering the higher pitch configurations LBT p = 0.067 W–β = 15° and LBT p = 0.086 W–β = 15° (Figure 28). Firstly, in the closest plane TS1, the asymmetry in the vorticity production is again evident for both (Figure 28(a)(i) and (b)(i)). Considering all presented results from TS1 for varying penetration angle and pitch, these trends support the hypothesis that the asymmetry is a result of the inherent upstream flow conditions (Figure 24) rather than any modifications of the lobe profile, with all exhibiting a similar behaviour. Another consistency between all presented geometries is the overall reduction in vorticity strength from the top towards the floor (Figure 28(a)(i) and (b)(i)). With increasing pitch (p = 0.067 W –Figure 28(a)(i), p = 0.086 W –Figure 28(b)(i)) the relative spacing between the adjacent vortices shed from the lobes is seen to increase, as would be expected. Additionally, the initial maximum vorticity magnitudes are also found weaker in comparison with LBT p = 0.044 W–β = 15° (Figure 23(b)), with ΩXmax ≈ 41.7 and ΩXmax ≈ −32.1 for p = 0.067 W and ΩXmax ≈ 45.1 and ΩXmax ≈ −35.8 for p = 0.086 W. These results (Figure 28(a) and (b)(i)) suggest that the average vorticity per lobe segment reduces with increasing pitch, in agreement with Barber et al. 63 Interestingly however, unlike the trend for increasing penetration angle, which showed growing disparity between anticlockwise and clockwise structures’ strength, increasing the pitch appears to reduce the magnitude of all structures, with the disparity remaining near-identical, further supporting the relationship between the asymmetry and penetration angle.
Streamwise vorticity contours for LBT p = 0.067 W–β = 15° (a) and LBT p = 0.086 W–β = 15° (b) in: (i) TS1 (−15 < ΩX < 15 omitted for clarity), (ii) TS2 (−5 < ΩX < 5 omitted for clarity), (iii) TS3 (−1 < ΩX < 1 omitted for clarity).
Further downstream at TS2 (Figure 28(a)(ii) and (b)(ii)), the overall vorticity magnitudes reduce in comparison with TS1 for both pitches, as expected. For these two configurations however, the vortices are also seen to expand spatially (Figure 28(a)(ii) and (b)(ii)), which is not observed for the p = 0.044 W profiles. Waitz et al. 32 explain that after being shed from the trailing edges, the streamwise vortices grow spatially as they diffuse, eventually beginning to cancel each other out as the distance between adjacent structures reduces. Considering this in conjunction with the results presented here, the following can be inferred. For the smaller pitches (p = 0.044 W), the vortices are packed more tightly, and their outermost sections begin to interact relatively rapidly, which is reflected in the higher rates of ΩXmax decay. With the higher pitches (p = 0.067 W, p = 0.086 W) however, the larger spacing between the adjacent vortices allows them to expand initially as they begin to diffuse. This again is supported by the relatively lower initial ΩXmax decay rates, showing reductions of 39% (p = 0.067 W) and 41% (p = 0.086 W) within the Δx* < 0.09 from TS1 to TS2.
Slower vorticity diffusion for the higher pitches is also evident at TS3 (Figure 28(a)(iii) and (b)(iii)). In this position, the merging of like-sign structures is again observed for both p = 0.067 W and p = 0.086 W, suggesting this process to take place irrespective of pitch and penetration angle values. With the higher pitches however, some signatures of the distinct vortices are still distinguishable this far downstream, particularly for p = 0.086 W between 0.7 < z* < 1.35 (Figure 28(b)(iii)).
Time-dependent wake characteristics
The effects of the different configurations on the time-dependent aspects of the wake flow-field are now considered. Velocity spectra are averaged from 39 and 9 time-segments (0.5 s duration) for the 20 s and 5 s measurements, respectively, with a 50% overlap. Bin widths are ΔStW ≈ 0.0042 for both. Selected results are presented with offset magnitudes to aid interpretation.
General wake dynamics
Velocity spectra at selected locations within the base wake for the baseline as well as the lower-drag configurations previously discussed from the time-averaged perspective are presented in Figure 29. Figure 29(a) presents the streamwise velocity spectra (Eu) within the side shear layer. For the baseline, these signals capture the characteristic bubble pumping frequency, with a subtle broad peak observed at StW ≈ 0.105, in good agreement to Duell and George 60 (StW ≈ 0.069), Khalighi et al. 13 (StW ≈ 0.098), Volpe et al. 74 (StW ≈ 0.11), McArthur et al. 75 (StW ≈ 0.08), Pavia et al. 67 (StW ≈ 0.094) and Rejniak and Gatto 51 (StW ≈ 0.107). With BTT α = 15°, Figure 29(a) shows the pumping peak to be fully suppressed, accompanied by a reduction in magnitudes for StW > 0.2, with the former also observed for BTT α = 20°. This is in good agreement with the reports of Khalighi et al. 13 and Martín-Alcántara et al. 76 who demonstrated a similar bubble pumping suppression for straight cavities contributing to drag reduction. Similar behaviour is also found for the LBT configurations; all observed to suppress the bubble pumping peak in a similar manner to the tapering. These trends, therefore, generally support the measured reductions in drag and suggest the low-drag configurations act to stabilise the wake by weakening the global streamwise oscillation.
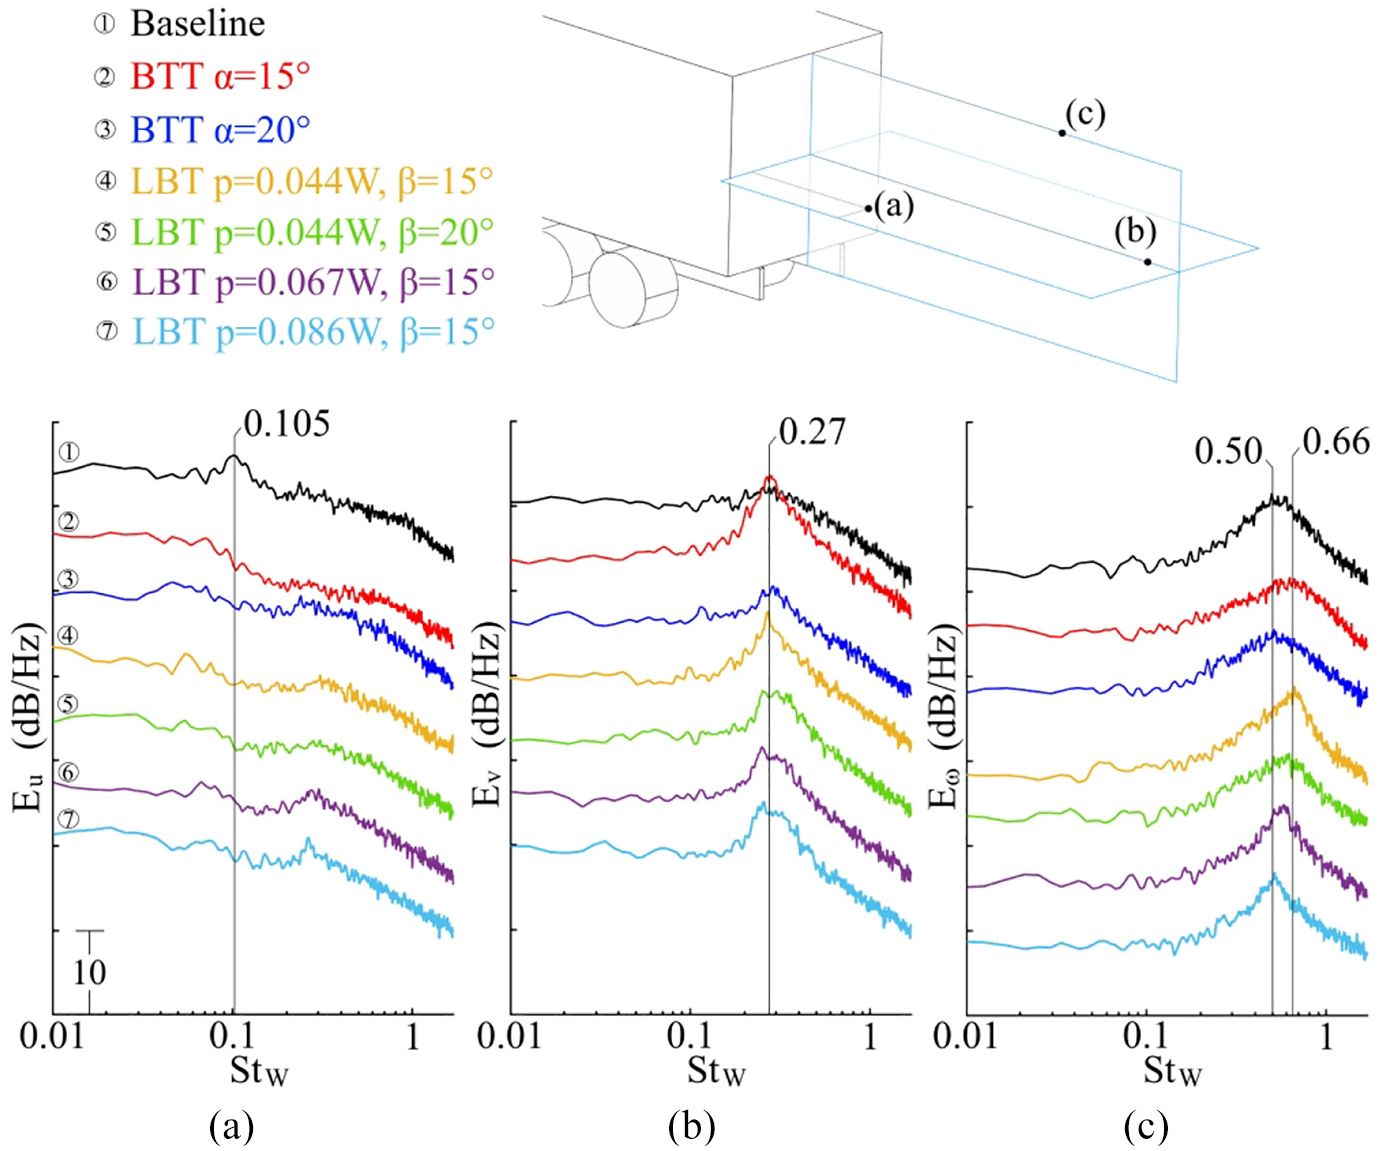
Velocity spectra in the wake: (a) Eu at x* ≈ 0.70, y* ≈ −0.36, z* ≈ 0.92; (b) Ev at x* ≈ 2.06, y* ≈ 0, z* ≈ 0.92; (c) Eω at x* ≈ 1.34, y* ≈ 0, z* ≈ 1.41 (relative offset of Δ7 dB/Hz).
The lateral shedding (flapping) mode is also captured within Ev at a central wake position for all configurations (Figure 29(b)). For the baseline, a broad weak peak centred around StW ≈ 0.27 is evident, reflective of the low levels of energy and coherence which exist for the crosswise shedding mode, in general agreement with Grandemange et al., 77 Volpe et al., 74 McArthur et al., 75 and Rejniak and Gatto. 51 This frequency remains insensitive to the inclusion of BTT α = 15° (Figure 29(b)), however, a considerably narrower and higher peak is observed instead, suggesting lateral shedding to be significantly more coherent and energetic for this case. This is likely a result of the enhancement in inboard momentum upon separation from the trailing edges, acting to strengthen the side wake vortices and local shear layers. 23 Increasing the taper angle (BTT α = 20°–Figure 29(b)) results in characteristics similar to those of the baseline, with only a marginally more defined peak. With the use of LBT p = 0.044 W–β = 15°, a trend similar to BTT α = 15° is again evident, with a strong distinct peak at StW ≈ 0.27. With increasing penetration angle (LBT p = 0.044 W–β = 20°), this peak becomes subtly less defined, being broader and weaker, albeit continuing to exhibit higher energies in comparison with the corresponding BTT α = 20°. Analogous changes are also observed for increasing pitch (LBT p = 0.067 W–β = 15° and p = 0.086 W–β = 15°), with all LBT configurations showing similar trends. For the LBT configurations, the lateral shedding mode is also captured in Figure 29(a) with subtle broad peaks within 0.26 < StW < 0.30. Overall, the results (Figure 29(b)) show that the use of the BTT α = 15° as well as the lobed mixers does not affect the characteristic frequency of lateral shedding, but instead has a marked impact on the nature of this mode, which becomes more energetic and coherent.
Figure 29(c) also captures the vertical shedding mode within Eω for all presented configurations, with the baseline results showing broadband behaviour with a peak centred around StW ≈ 0.50. The heightwise shedding characteristics can be seen subtly more energetic and better defined relative to lateral shedding, indicating this to be the dominant asymmetric shedding mode. With the inclusion of BTT α = 15°, a similar broad peak is observed at a higher frequency of StW ≈ 0.66, reflective of an increase in the vertical shedding characteristic frequency, likely generated by the reduction in the distance between the opposing shear layers, consequent to the inboard shift of the top shear layer.77,78 Increasing the taper angle results in characteristics largely similar to the baseline, with BTT α = 20° (Figure 29(c)) exhibiting, again, a broad peak centred around StW ≈ 0.50. Further interrogation shows similar peaks for the LBT configurations to be generally subtly narrower relative to the baseline and both BTTs, suggesting further increases in the coherence of this mode with the use of lobed mixers. For LBT p = 0.044 W–β = 15°, the peak is centred around StW ≈ 0.66, indicating a similar increase in the vertical shedding frequency as that observed for BTT α = 15°. This frequency marginally reduces with increasing penetration angle, with LBT p = 0.044 W–β = 20° showing StW ≈ 0.62. Similarly, increases in pitch also result in further reductions in the characteristic frequency, with StW ≈ 0.55 for LBT p = 0.067 W–β = 15° and StW ≈ 0.52 for LBT p = 0.086 W–β = 15°.
Considering the results in Figure 29 holistically, the inclusion of drag-reducing techniques is observed to suppress the streamwise wake oscillation, while enhancing, to differing degrees, the asymmetric shedding modes. Additionally, for the baseline, vertical shedding is shown stronger relative to lateral shedding. For the BTT α = 15° and the LBTs however, lateral shedding appears to be the dominant one among the two asymmetric shedding modes, reflecting a marked influence of these configurations on the general wake dynamic processes.
Local influence of lobed mixers
Local effects of the lobed mixing geometries are now considered, with Figure 30(a) presenting the Ev at selected locations downstream of the lobed trailing edge (TS1) for LBT p = 0.044 W–β = 15°. At position (i) behind a trough, Ev shows an increase in the low-frequency (StW < 0.1) activity with a distinct peak found at StW ≈ 0.092. The same trend is also observed downstream of the adjacent trough at (iii), with little defined oscillatory behaviour and a general reduction in magnitudes (up to 10 dB/Hz) at (ii) coincident with the lobe. Positions (i) and (iii) correspond to the locations of increased inboard momentum, as shown in Figure 23(c), being a direct result of the generated streamwise vorticity (Figure 23(b)). These well-defined peaks (StW ≈ 0.092) therefore, suggest a coherent vortex-induced crosswise oscillation, likely reflecting the shedding frequency of the structures. Analogously, the Ev trend at (ii) is consistent with the weaker local crossflow observed in Figure 23(c). Further down towards the floor, the trends downstream of a trough in the lower base half ((iv)) again exhibit similar characteristics to (i) and (iii), with the exception of the peak at StW ≈ 0.092 being marginally weaker and less defined through the overall increase in magnitudes (up to 5 dB/Hz) at StW < 0.1. This trend reflects the non-uniform flow characteristics along the side trailing edge, previously observed in the time-averaged results with streamwise vortices as well as inboard momentum weakening from the top towards the floor (Figure 23(b) and (c)).
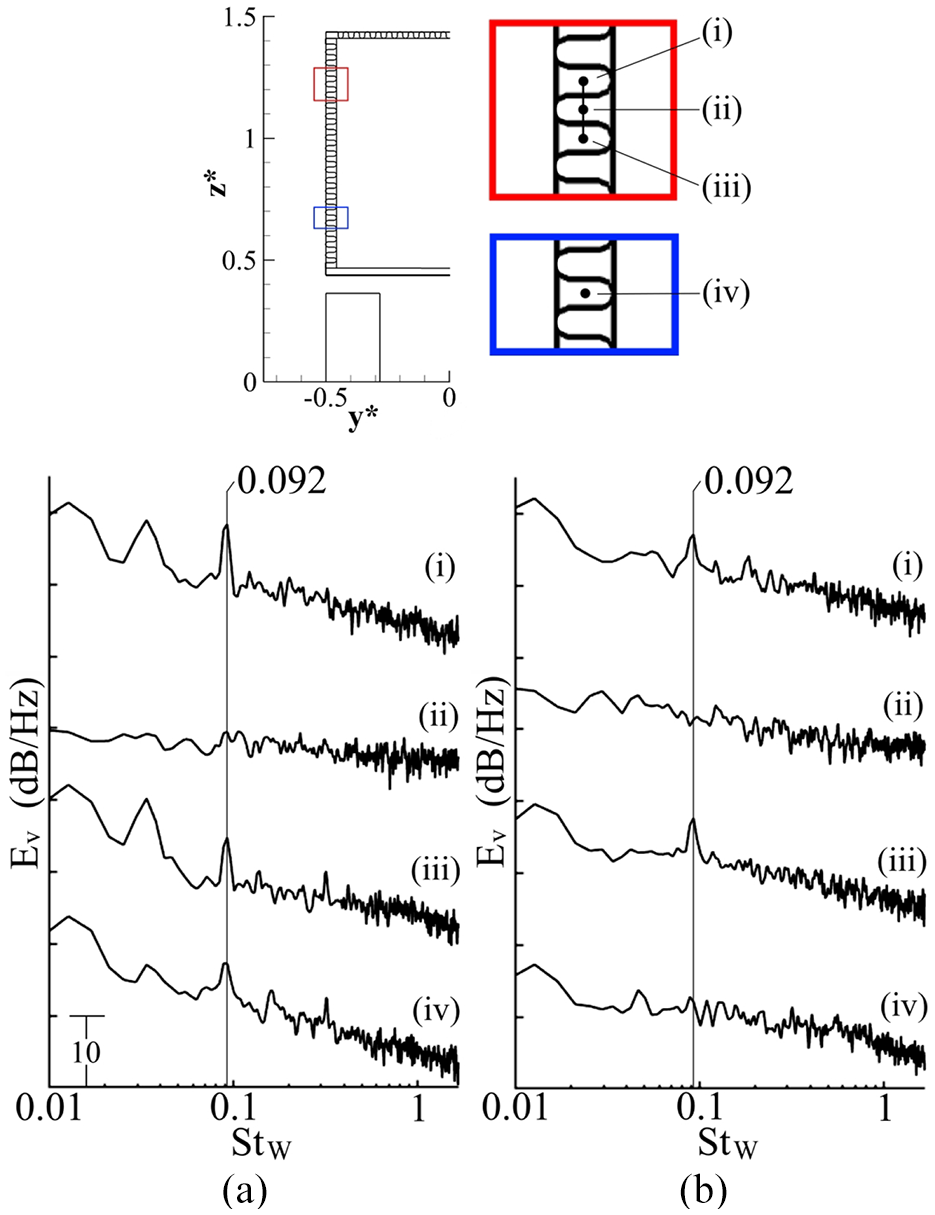
Velocity spectra (Ev) in TS1 along y* ≈ −0.47 between 0.67 < z* < 1.25 for: (a) LBT p = 0.044 W–β = 15°, (b) LBT p = 0.044 W–β = 20°.
Velocity spectra in the same positions are also presented for LBT p = 0.044 W–β = 20° in Figure 30(b). In the upper base half ((i)–(iii)) the trends are generally similar to the corresponding positions in Figure 30(a), with the same peaks at StW ≈ 0.092 again captured downstream of the troughs ((i) and (iii)) and no distinct oscillatory characteristics behind the lobe ((ii)). With increasing penetration angle (Figure 30(b)) however, the peaks at StW ≈ 0.092 appear subtly less defined with an overall increase in the lower-frequency magnitudes (≈2 dB/Hz; StW < 0.1). This is somewhat consistent with the growing disparity in strength of the adjacent streamwise vortices, as shown in Figure 27(a), generating less coherent crosswise oscillations. In the bottom base half ((iv) –Figure 30(b)), the same peak (StW ≈ 0.092) is observed almost entirely inhibited, again in agreement with the trends presented in Figure 27(a). Overall, Figure 30 shows that with increasing penetration angle the oscillations in the crossflow become less coherent at all locations, with the transition from the upper to lower edge positions remaining largely similar. Considering this in conjunction with Figure 21, a correlation between the side edge flow characteristics and vertical wake balance can be inferred, offering further support for the little difference observed between these two configurations.
Figure 31 presents Ev at analogous positions for configurations LBT p = 0.067 W–β = 15° and p = 0.086 W–β = 15°. Figure 31(a) shows the same peaks at StW ≈ 0.092 exist for p = 0.067 W, as in Figure 30, downstream of the troughs in the upper base half ((i) and (iii)), indicating the frequency of vortex-induced crosswise oscillations is insensitive to lobe pitch. Considered holistically, this is in general agreement with Mao et al., 34 who show vortex shedding frequency to vary with the flow Reynolds number; here constant for all configurations. Position (ii) (Figure 31(a)) again shows no defined oscillatory behaviour with more general increases in magnitudes (up to 10 dB/Hz) for StW < 0.2 evident instead, suggesting less coherent characteristics exist locally. Moving towards the floor, position (iv) (Figure 31(a)) shows diminishing crosswise oscillations with magnitude reductions of up to 5 dB/Hz and a significant suppression of the energy around StW ≈ 0.092. Comparisons to LBT p = 0.044 W–β = 15° (Figure 30(a)) reveal that with LBT p = 0.067 W–β = 15° the oscillations at the upper edge positions ((i–iii)) are stronger by up to 10 dB/Hz, with the signals closer to the floor ((iv)) showing reductions of up to 20 dB/Hz. Considering this in conjunction with the time-averaged results suggests the growing non-uniformity in the flow characteristics along the side trailing edge to be related to the degrading vertical wake balance (Figure 21).
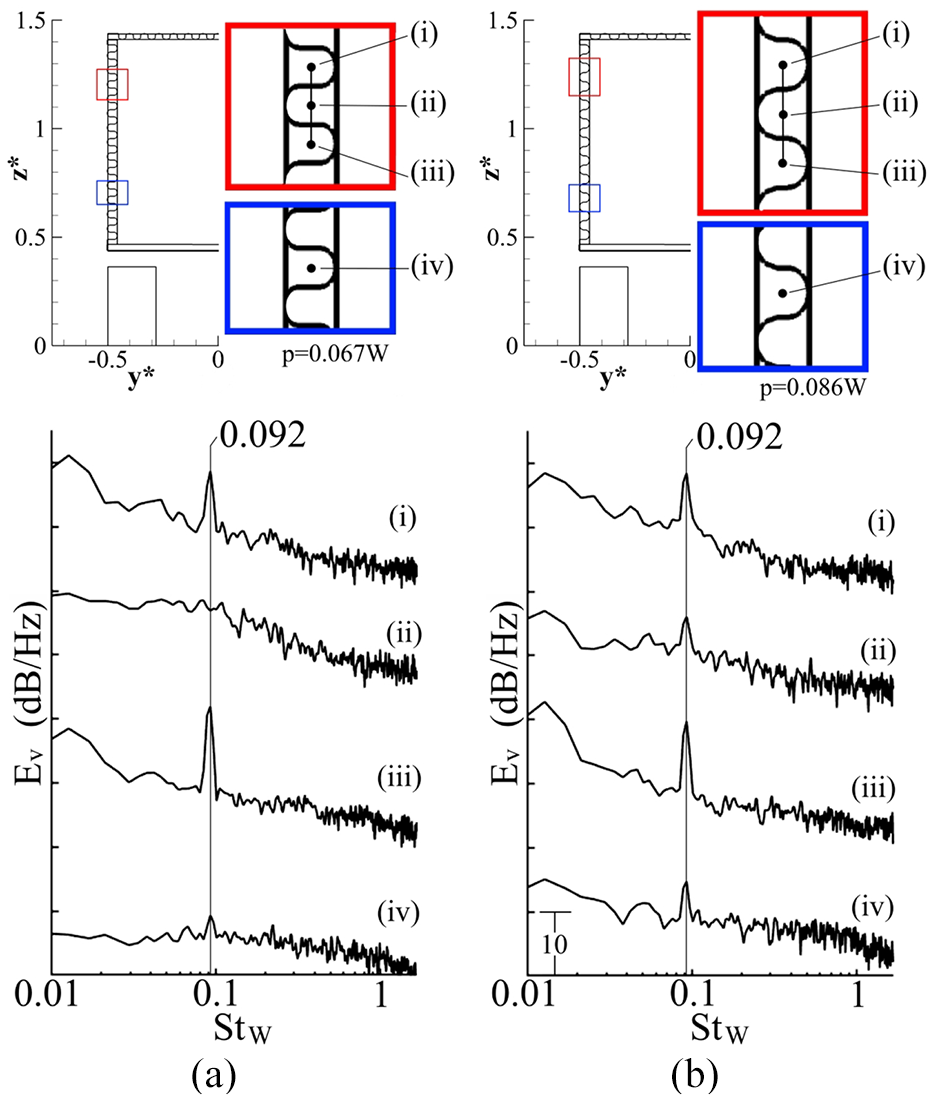
Velocity spectra (Ev) in TS1 along y* ≈ −0.47 for: (a) LBT p = 0.067 W–β = 15° between 0.70 < z* < 1.25, (b) LBT p = 0.086 W–β = 15° between 0.68 < z* < 1.19.
Further increases in pitch to LBT p = 0.086 W–β = 15° (Figure 31(b)) again show similar characteristics in positions (i)–(iii) with the distinct peak at StW ≈ 0.092. One exception is position (ii) downstream of the lobe, where the StW ≈ 0.092 peak is also captured. Closer to the floor, higher magnitudes for StW < 0.1 can be seen re-established (relative to LBT p = 0.067 W–β = 15°), with a defined peak at StW ≈ 0.092. Overall, the trends in Figure 31(b) show similar characteristics and transition from the upper to lower edge portions to those found for LBT p = 0.044 W–β = 15° (Figure 30(a)), further supporting the similarities in vertical wake balance between the two configurations (Figure 21).
Velocity spectra (Ev) further downstream are also presented in Figure 32 (TS2). No defined oscillatory behaviour is found at any of the positions (i)–(iv) from the top towards the bottom of the base, with all four LBT configurations exhibiting similar characteristics and the peak at StW ≈ 0.092 no longer observable. These results are consistent with a significant vortex breakdown occurring within short distances from the trailing edges, as indicated in Figure 26. Towards the bottom of the base, at position (iv), all configurations show increases in higher-frequency activity (StW > 0.2), likely reflective of the proximity to the moving ground and rotating wheel. Overall, these results suggest the strongest impact of the lobed mixers on the inboard flow at the model base to be limited to within x* < 0.1.
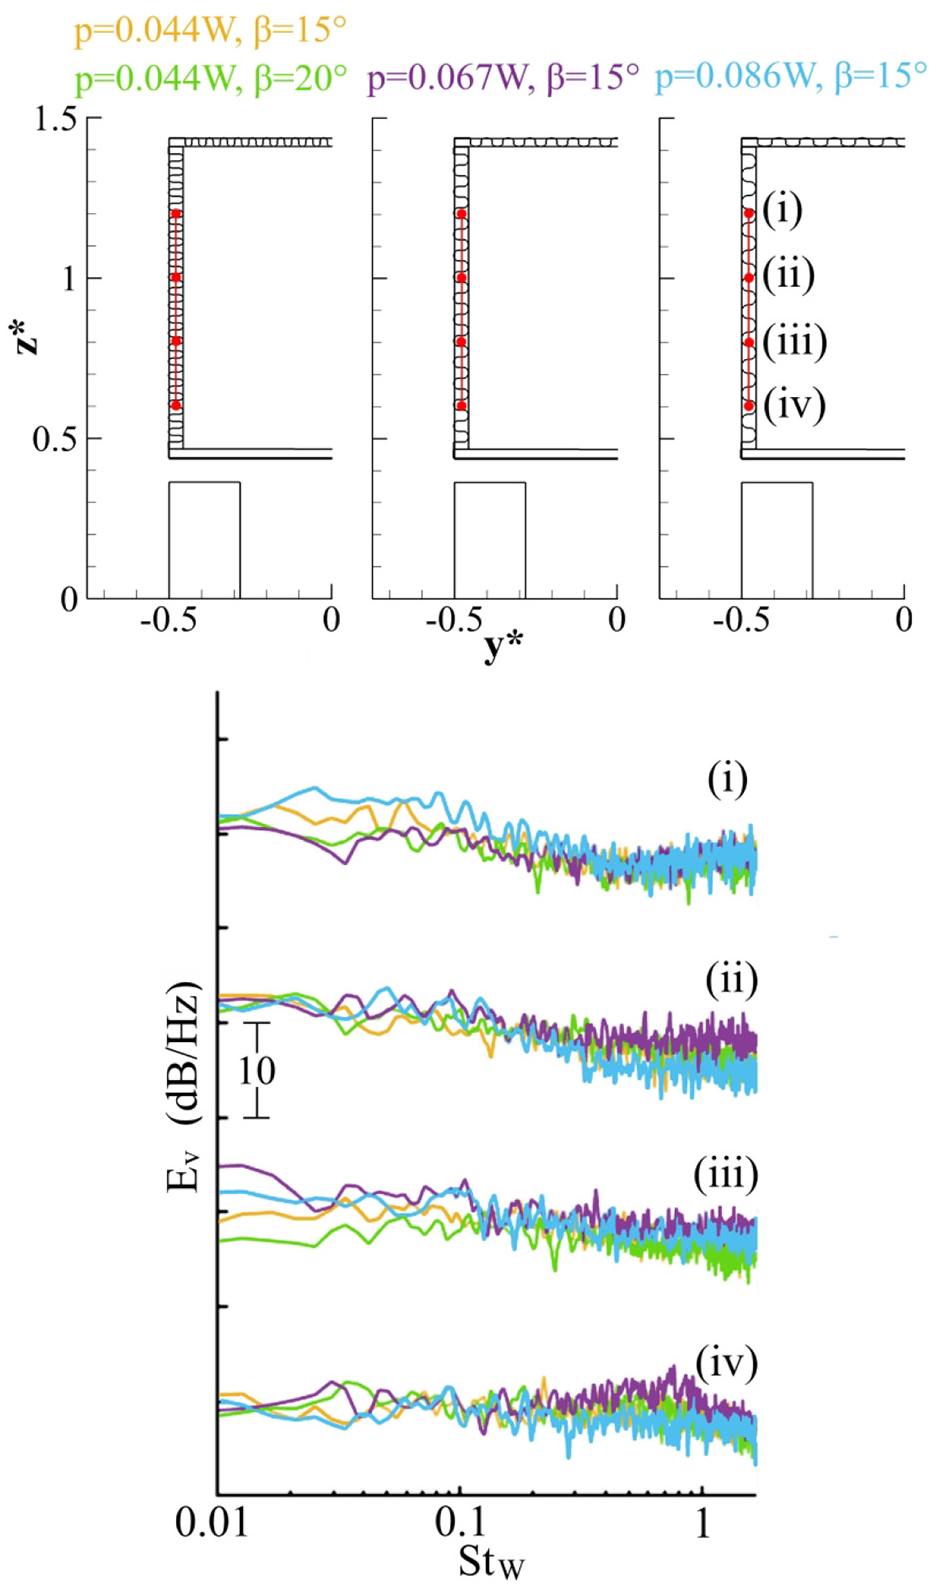
Velocity spectra (Ev) in TS2 along y* ≈ −0.47 between 0.60 < z* < 1.20 for LBT p = 0.044 W–β = 15°, p = 0.044 W–β = 20°, p = 0.067 W–β = 15° and p = 0.086 W–β = 15°.
Conclusion
An experimental study investigating the effects of trailing edge-integrated lobe-mixing geometries on the drag of a road vehicle was conducted on a 1/24th-scale model representative of a HGV, at ReW = 2.8 × 10⁵. Various lobe configurations with the pitch and penetration angle values within 0.027 < p/W < 0.105 and 5° < β < 30°, respectively, were evaluated and compared to the baseline (no modification) as well as high-aspect-ratio rear tapering.
For rear tapering, the measured drag reduction trends were found to be in good agreement with literature, showing the highest benefits with the side and top edges tapered, with the optimum taper angle of α = 15° reducing drag by up to 10.8%. Beyond this angle, the performance was observed to degrade rapidly with a drag reduction of approximately 4.0% at α = 20° and no further benefit thereafter. With the use of lobed mixing geometries, drag was also observed to reduce, with the smallest pitches producing the best trends, resulting in drag reductions of up to 7.4% for p = 0.027 W and 7.6% for p = 0.044 W. Importantly, for the lobed mixer configurations, significant drag reductions were found to persist with increasing penetration angle up to β = 30°. A particularly good trend was found for the configuration of p = 0.044 W, with drag reductions of up to 7.0% at β = 20°, 5.5% at β = 25° and 2.8% at β = 30°.
The time-averaged results revealed the drag reduction obtained with the optimum tapering was a result of reductions in the wake size through enhanced inboard momentum and a shift in the vertical wake balance; the latter reflected in the symmetry of the longitudinal vorticity and balance in the generated upwash and downwash. Increasing the taper angle was observed to produce less significant wake size reductions and degrade the vertical wake balance.
The results for the lobed mixer configurations showed the mechanisms responsible for the drag reduction to be analogous to those observed for tapering, that is, reductions in wake size and shift in vertical wake balance. For these configurations, however, these effects on the base wake were found retained at higher penetration angles, with the changes observed to be more subtle compared with tapering. The lobes were shown to produce pairs of counter-rotating streamwise vortices, which produced enhanced inboard crossflow responsible for the reductions in base wake size. The streamwise vortices were found to break down with downstream evolution, weakening and coalescing with neighbouring structures of the same sign. At a distance equivalent to half-model-width downstream of the base, the individual structures were found no longer discernible, with the formation of larger and weaker counter-rotating structures centred around the middle of the base evident instead. The results showed the balance between these structures to be associated with the retention of the overall vertical wake balance and consequently higher drag reductions. Increasing the penetration angle was observed to degrade the magnitude symmetry within the counter-rotating vortex pairs shed from the lobes, with increases in pitch resulting in overall reductions in vorticity magnitudes locally. Additionally, for the former, the initial rate of vorticity decay was found to be higher, with the opposite observed for increasing pitch.
Evaluation of the time-dependent results showed the low-drag configurations to suppress the bubble pumping mode. In contrast, the lateral shedding mode was found to be stronger and more coherent, with the characteristic frequency insensitive to varying configurations. The vertical shedding frequency, however, was found to increase with both the optimum tapering and lobed mixer configurations. Increasing both pitch and penetration angle was also observed to marginally reduce the heightwise shedding frequency. Additionally, the inclusion of lobed mixers was shown to produce more coherent heightwise oscillations compared with both the baseline and tapering. Overall, the configurations associated with highest drag reductions were found to have a marked impact on the wake dynamics, with lateral shedding found to be the dominant one among the two asymmetric shedding modes.
A detailed interrogation of the velocity spectra closer to the lobed trailing edges showed the streamwise vortices to induce a coherent crosswise oscillation at StW ≈ 0.092 within short downstream distances from the base, with the energy reducing from the top towards the floor along the side trailing edge. No clearly defined oscillatory behaviour was found at further downstream positions, reflective of rapid vortex breakdown and indicating the strongest impact of these configurations on the inboard flow at the model base to be limited to within x* < 0.1.
Overall, results presented in this work show the trailing edge-integrated lobe mixers to be effective for road vehicle drag reduction, with significant benefits achieved at higher aspect ratios, where regular tapering’s performance is found substantially degraded. These qualities indicate the possibility that such geometries may be suitable for improving fuel consumption while minimising the losses in internal space. Further studies at larger scales and higher Reynolds numbers would be of interest to the field.
Footnotes
Appendix
Declaration of conflicting interests
The author(s) declared no potential conflicts of interest with respect to the research, authorship, and/or publication of this article.
Funding
The author(s) disclosed receipt of the following financial support for the research, authorship, and/or publication of this article: This work was supported by the Engineering and Physical Sciences Research Council (Doctoral Training Program).