
Abstract
The potential aerodynamic benefits of operating full-scale electric vehicles in platoons of 2 and 3 vehicles have been investigated. Since drag reduction has a direct impact on vehicle range, power consumption was measured directly and surface pressure measurements were made to characterise the changes in pressure field that influence the power required to overcome aerodynamic drag. CFD simulations were validated against the track measurements to assess the limitations of using a practical, limited number of pressure tappings to measure drag. The overall power consumption for the whole platoon was found to reduce proportionally with the reduction of vehicle spacing and it was also observed that increasing the number of vehicles in the platoon from 2 to 3 further increased the power savings from 33.4% to 39.1%. These power savings were attributed primarily to changes in surface pressure acting on the base of the leading vehicle and the forebody of the trailing vehicle.
Introduction
The aerodynamic benefits associated with vehicle platooning are of considerable interest in the drive to reduce emissions and fuel consumption. Over the past two decades research has centred on identifying the drag and fuel economy benefits on different vehicles shapes, sizes and arrangements with a focus on vehicle spacing.1–3 Most concluded that platoon operations yield drag reduction when the spacing between the vehicles is decreased as a result of increasing the base pressure of the leading vehicle and decreasing the forebody pressure of the trailing vehicle. It was also observed that increasing the number of vehicles in platoon reduced the overall platoon drag as the “shielding” effect increased. Despite these promising findings, a better understanding of the wake topology and dynamics and their relation to the pressure changes on the vehicles is vital to maximise the benefits of platooning. 4
In general, experimental investigations in wind tunnels have been compromised by the reduced model scale required to accommodate multiple vehicles within the confines of the test section, which limits the aerodynamic resolution and further reduces the Reynolds number. A method to improve the model scale was proposed by Ebrahim et al. 5 through the use of bluff body wake generators in an attempt to reduce the Reynolds number deficit and improve the aerodynamic resolution particularly for platoon investigations. Full scale wind tunnels are usually even more restrictive and it is rare to be able to accommodate two passenger vehicles with more than half a vehicle length between them. On-track and road investigations remain the most representative method of testing for platoons as they couple the measurement of aerodynamic drag to power consumption. It is recognised that on-road measurements are difficult as a consequence of changing environmental variations, but very little test data is available in the literature. This study addresses that issue.
On-track platoon aerodynamics and power consumption
Hong et al. 6 replicated the “PATH” wind tunnel investigations 7 on a desert lakebed by using two full-scale Ford Windstar vans and measured the drag forces using a tow bar that connected the two vehicles. They demonstrated that at close spacings (i.e. inter-vehicle spacings of less than one vehicle length) both vehicles show lower drag than in isolation supporting the observations made in their wind tunnel studies. Following such promising conclusions, Bonnet and Fritz 8 used a similar tow bar between two trucks and analysed the fuel consumption based on the information obtained from a fuel flow meter and the actual velocity. The aim was to quantify the fuel consumption savings that result from the reduction of drag. It was shown that the trailing vehicle has a drag reduction above 40% with a reduction of up to 13% for the leading vehicle. The fuel consumption savings followed a similar trend with the trailing truck showing reductions of up to 28% in comparison to the leading truck with 9%. These percentages are taken from the closest spacings tested (i.e. roughly 0.5 L–1 L spacing) and typically drop as the spacing increases. Similar studies of trucks in platoon discuss in common the potential of higher fuel savings as the vehicle cascades down the platoon.9–11
Tadakuma et al. 12 focused on developing an analytical approach to estimate the drag reduction rates of vehicles in platoon using full-scale testing. The drag was estimated using the common integration technique of sparsely distributed pressure tappings on the front and base of the vehicle. However, no uncertainty analysis was performed to verify the accuracy of these measurements. Aly 13 highlighted that the accuracy of calculating wind loading on bluff bodies with discretely distributed pressure tappings is directly related to the number of pressure tappings used and the surface area associated with each pressure tap. For a complex geometry with concave and convex surfaces the problem is further complicated by regions of separated flows and zones of high and low pressure gradients. In platoons, additional flow interferences caused by back-pressure and flow impingement between the vehicles results in a different surface pressure map that is important to quantify to make an accurate prediction of the drag force. Therefore, a large number of pressure sensors are required on the surface of a full-scale vehicle that increases the cost, time and complexity of the experiment significantly.
The present work aims to quantify the changes of the surface pressure and relate them to the measured power savings achieved by full-scale electric vehicles on a test track. The data are further analysed using Computational Fluid Dynamics (CFD) to breakdown the contributions of aerodynamic drag in various platoon configurations and evaluate the error margins of predicting the drag force with a discrete number of pressure taps.
Methodology
The Nissan Leaf
The entire study focused on the 2016 hatchback Nissan Leaf electric vehicle with the dimensions specified in Figure 1. The main aerodynamic features of this vehicle can be summarised as the airflow-control headlamps that are designed to channel the flow away from the side mirrors for aeroacoustic purposes, sharply designed front fender, rear lamps and fenders, a large rear spoiler and clean underbody with a diffuser, which were all introduced to control the flow around the vehicle. 20
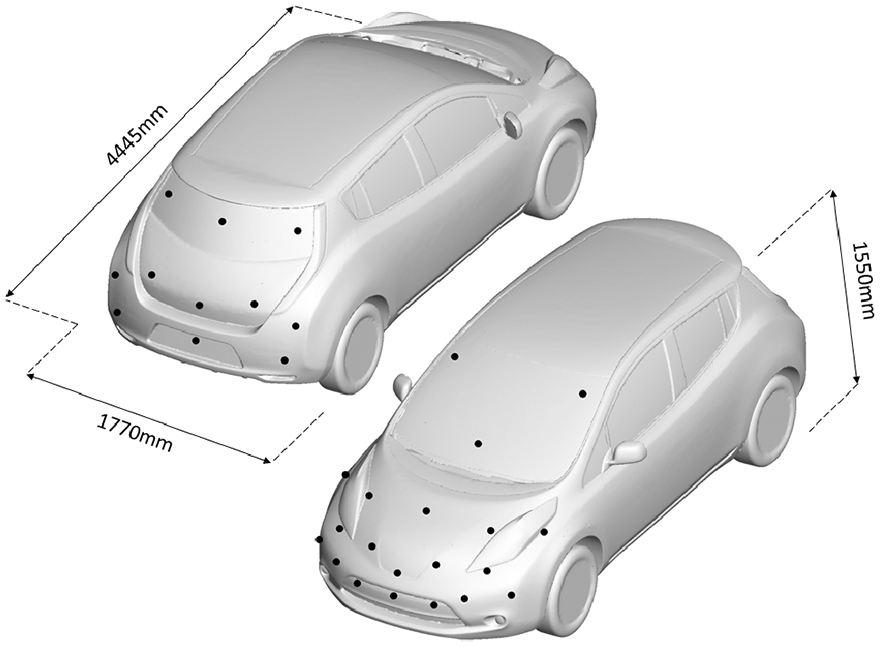
Nissan Leaf 2016 model with 31 pressure tappings distributed on the forebody and base of the car.
The Track
The track tests took place at the Millbrook Proving Ground in the UK along the two mile circumference banked oval and the mile straight smooth asphalt tracks depicted in Figure 2. The back-to-back tests were held over the course of 1 day under relatively constant wind velocities and angularity at constant altitude. The weather conditions including the temperature, pressure and humidity were obtained from Millbrook Proving Ground track facilities located less than one kilometre away from the mile straight and the local wind direction and speed were recorded with a five-hole probe. The air density was noted at the beginning of each run and the average density of all tests was calculated as
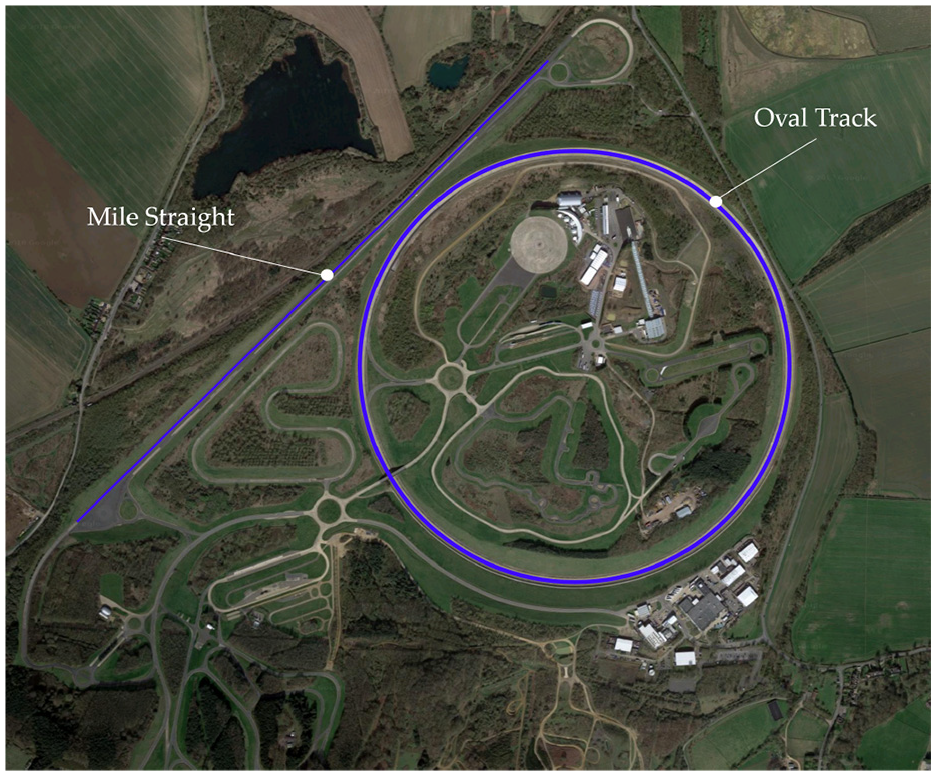
Satellite view of Millbrook Proving Ground.
Summary of run configurations.
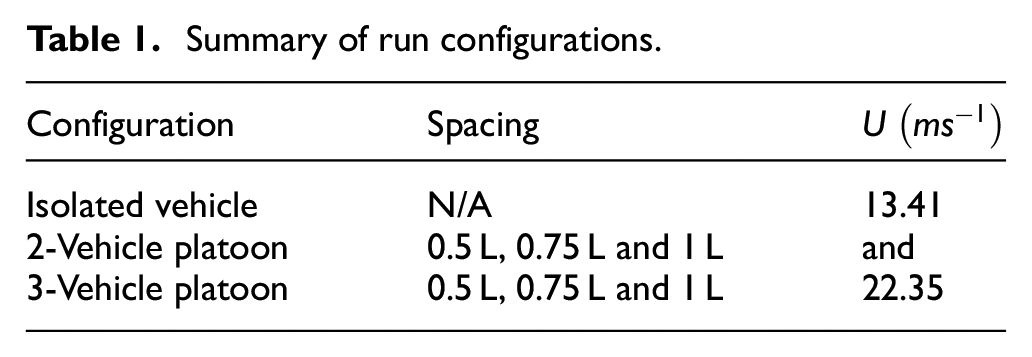
The oval track was primarily used to verify that the 38 s data sampling period for the mile straight, from which the majority of the platoon investigations were conducted, was adequate to reach statistical convergence of the means and standard deviations. Initial results showed that the higher vehicle speed had no significant effect on the flow structure, and therefore the evaluation of the on-track tests was focused on the lower velocity of 13.41 ms−1, at which it was easier to maintain constant vehicle spacing and speed.
Pressure measurement
The primary aerodynamic characteristics of vehicles driving in platoon may be broadly defined by static pressure distribution changes on the front and rear surfaces of the car, therefore the pressure acting on the Nissan Leaf forebody and base surfaces was recorded by populating the zones with 31 disc probes each having a centralised pressure tapping as shown in Figure 3. The discs were 2 mm thick, 20 mm in diameter and 3D printed in-house from resin to ensure a smooth finish. Self-adhesive circular patches with a central hole were used to attach the probe discs onto the car surface, which also created a smooth transition from the vehicle surface to the 2 mm thick discs. The locations of the discs was determined from CFD simulations and the regions with the highest pressure variations during platoon operations were chosen as shown in Figure 1. The discs were connected via 1 mm (internal diameter) flexible tubes to a 64-ports miniature pressure scanner. The scanner is capable of measuring pressure range of 1.0 kPa with a manufacturer quoted accuracy of
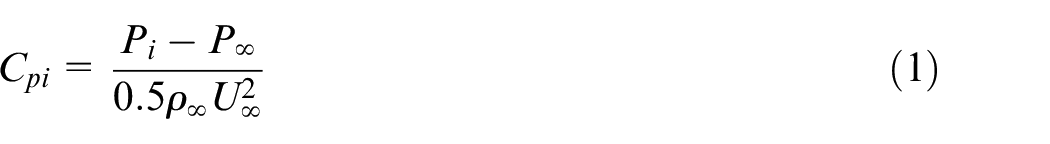
Where,
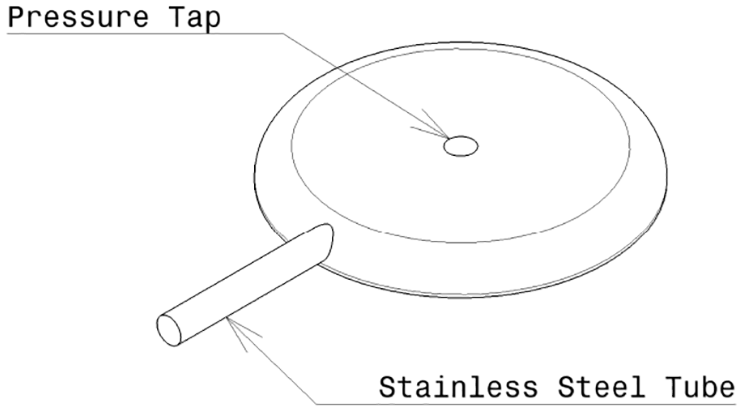
Disc probe to measure the surface static pressure.
The pressure measurements obtained from the disc probe locations shown in Figure 1 were interpolated using the inverse distance method to construct pressure maps as demonstrated in the Results section of this manuscript.
Power measurement
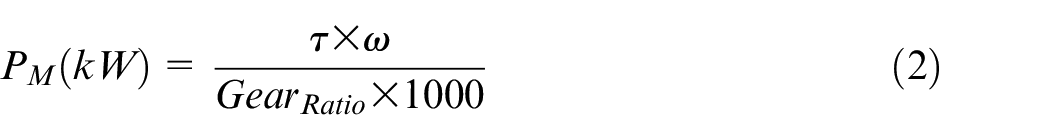
A Controller Area Network (CAN) Bus Analyzer was used to communicate with the Nissan Leaf(s) ECU networks to evaluate the power consumption of individual vehicles. Data were monitored at 100 Hz including the motor torque, motor revolutions per minute (RPM), battery current and voltage. The output data obtained from the battery were synchronised as the components share a common sensor, while the motor RPM and torque were asynchronous by approximately 1 millisecond, which was assumed negligible. To calculate the power consumption from the motor and battery; equations (2) and (3) were used respectively.
Where
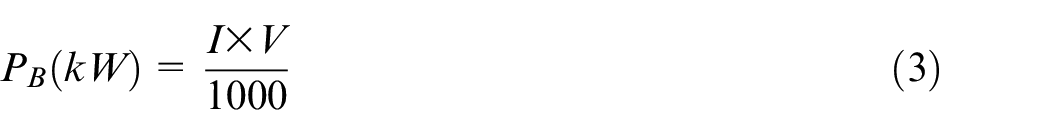
Powertrain efficiency of a Nissan Leaf motor. 14
The power output measured from the motor had a percentage difference deficit that ranged between 10% and 15% in comparison to the power output from the battery. This deviation in absolute power can be attributed to the overall efficiency of the powertrain, which corresponded to 92.5%. This was derived from Figure 4 by calculating the averaged motor RPM and motor torque measured from the CANalyzer that equated to 3400 RPM and 80 Nm, respectively. The remaining source of power lost is unknown, and therefore to avoid any discrepancies in the power estimation a combined average was taken from the motor and battery power outputs. In general, the chosen approach to average the power has no influence on the power consumption conclusions as the results were taken relative to the baseline (i.e. isolated case) according to equation (4). The baseline power consumption measurements were established through a series of four tests each with a span of 120 s. These tests were then repeated on the mile straight using a shorter time interval to ensure consistent power consumption measurements. The averaged power consumption of each platoon spacing was based on multiple runs, which makes a total of 19 runs for all the configurations tested on the day.
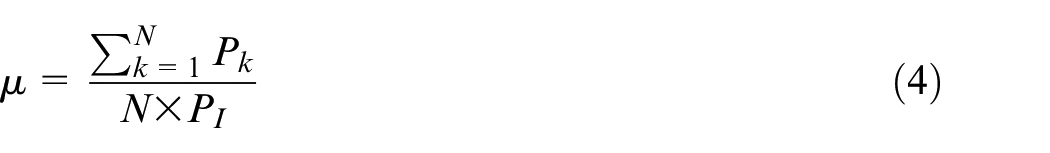
Where,
Other variables such as the vehicle speed and steering wheel angle were monitored to verify the information obtained from GPS. These also serve as means to eliminate any data that is out of range when the vehicles are either misaligned or drift by more than 10% of the instantaneous desired platoon separation.
Atmospheric conditions
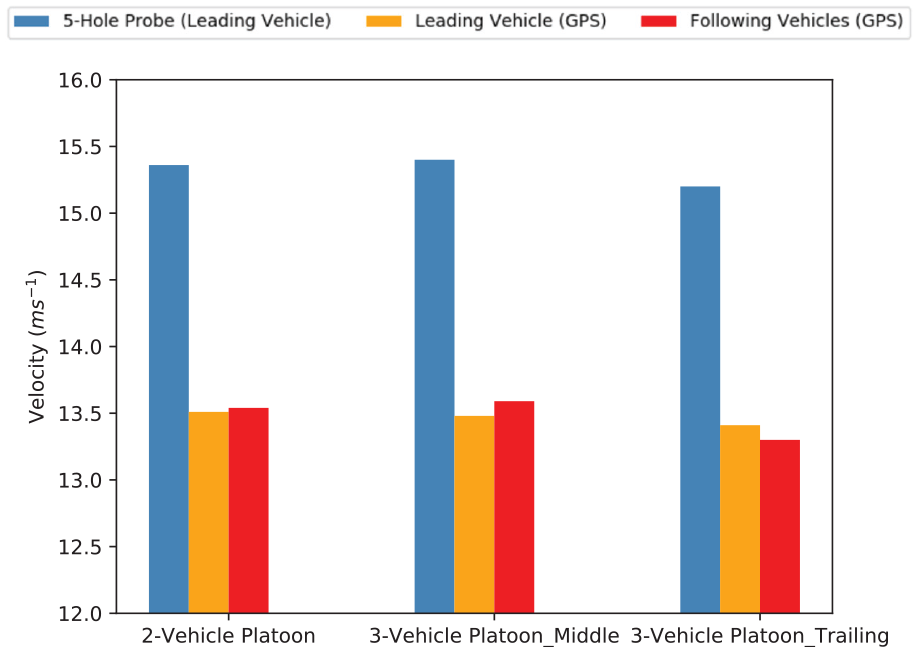
A roof mounted five-hole pressure probe was used to determine the three-dimensional oncoming flow characteristics. The probe was supported by a NACA 0020 profile that extends from a base that houses two rare-earth magnets used to fix the base onto the surface. This configuration is known to be reliable based on the experiments conducted by Oettle et al. 15 Initial tests were conducted to investigate the blockage effects induced by the proximity of the five-hole probe to the vehicle roof surface, and it was found that the velocity measured by the probe is consistently 18% higher than the vehicle’s “true velocity” measured by the GPS. Despite this increment in measured velocity by the five-hole probe, this arrangement was originally optimised for a single vehicle driving in the unsteady road environment, undisturbed by the presence of other vehicles driving in close proximity. It was thus necessary to study the influence of closely spaced platoon on the probe location and analyse the interference effect on the measured flow velocity. Figure 5 quantifies the velocity deficit experienced by the probe when placed on different vehicles in platoon relative to the isolated case. It is clear that positioning the probe on the leading vehicle yields the least deficit in velocity that consistently equates to 5%. Conversely, placing it on the following vehicle(s) has a larger effect on velocity that varies depending on the platoon distance and choice of vehicle. It is likely that the probe position will also have an influence on the yaw measurements, and it was therefore fitted on the leading vehicle throughout the entire on-track investigations.
The effect of probe location on the velocity magnitude obtained from CFD simulations.
The 5% deficit in velocity induced by the presence of following vehicles in platoon reduced the 18% velocity increase measured by the five-hole probe due to blockage to 12% as shown in Figure 6 which is consistent with the predictions made using CFD.
The wind speeds measured at the weather station on the day were on average below 2 ms−1 with a maximum wind speed recorded as 2.7 ms−1. The wind direction was south-westerly and in line with the mile straight, therefore on average the nominal yaw angle measured was 3°. Large dense planting on either side of the mile straight reduced the cross-wind further at the track side. It should also be noted that early studies conducted by PATH on platoons operating in cross-winds indicated that the influence of the yaw angle has a very small effect on the overall beneficits and drag reductions found in platoon. 16
For this study, the data were only used when the natural wind velocity was less than 5 ms−1 and yaw angularity below 3°. The entire data set of 19 runs obtained from the five-hole probe showed an average of 1.433° in Figure 7.
Comparison between the velocity measured using a five-hole probe against the true velocity of the vehicle measured using a GPS.
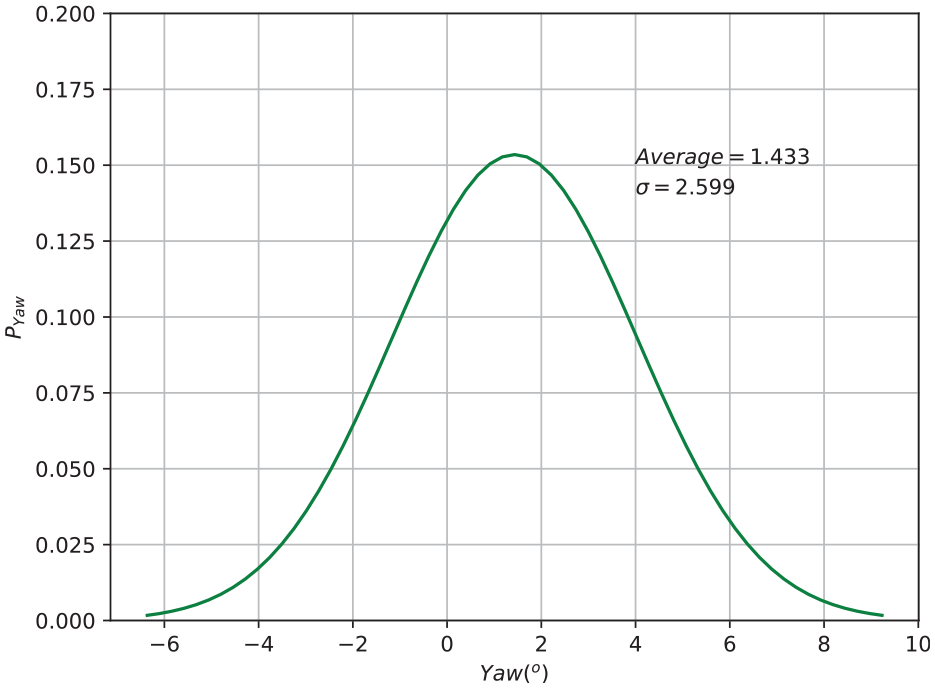
Gaussian distribution of yaw angle of on-track flow conditions of the leading vehicle in platoon.
Distance measurement
To measure the inter-vehicle spacing, an ultrasonic ranging device was used. This system displayed the distance from the front vehicle to the driver in real-time to maintain the following vehicle’s position during the sampling period. It was located below the stagnation point of the car on the bumper to avoid disturbing the disc probes and to have a clear flat surface on the leading vehicle for the wave to reflect. The high distance range of the HRXL-MaxSonar ultrasonic sensor (MB7363) was selected to allow platoon investigations of up to two vehicle lengths with an accuracy of
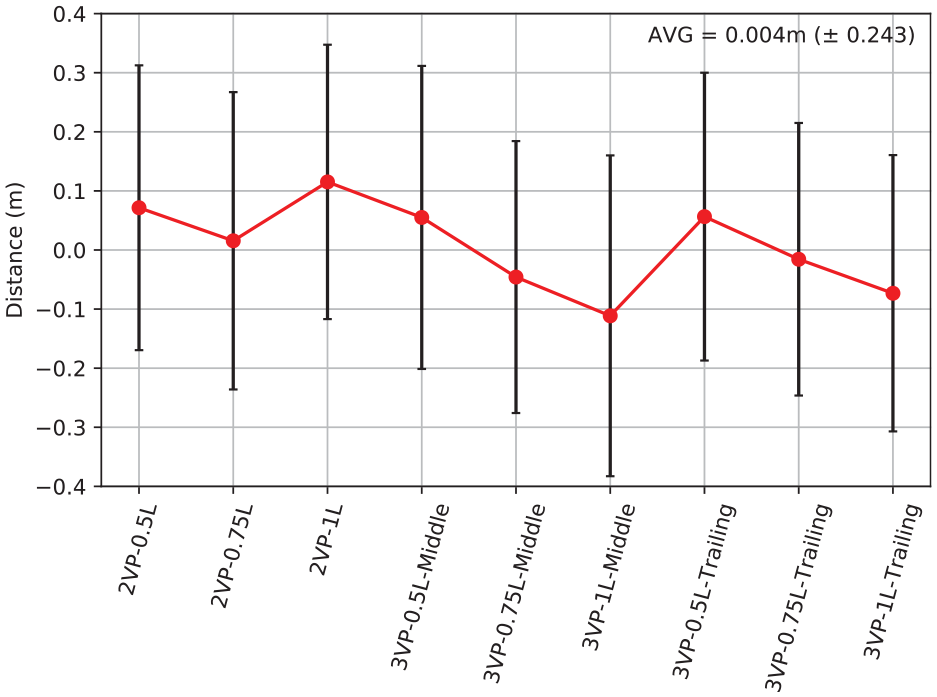
The average longitudinal distance measurements from the ultrasonic sensor for different platoon configurations.
CFD
CFD simulations were carried out using Star-CCM+ with a hexahedrally discretised domain and a prism layer refinement adjacent to the walls finely tuned to measure a
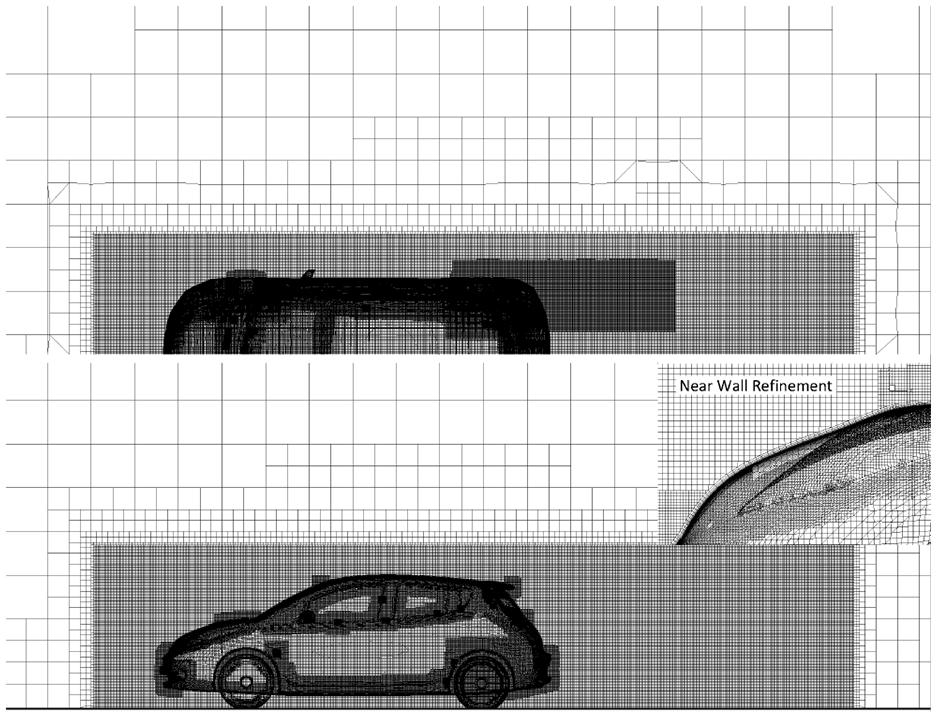
Nissan Leaf mesh topology.
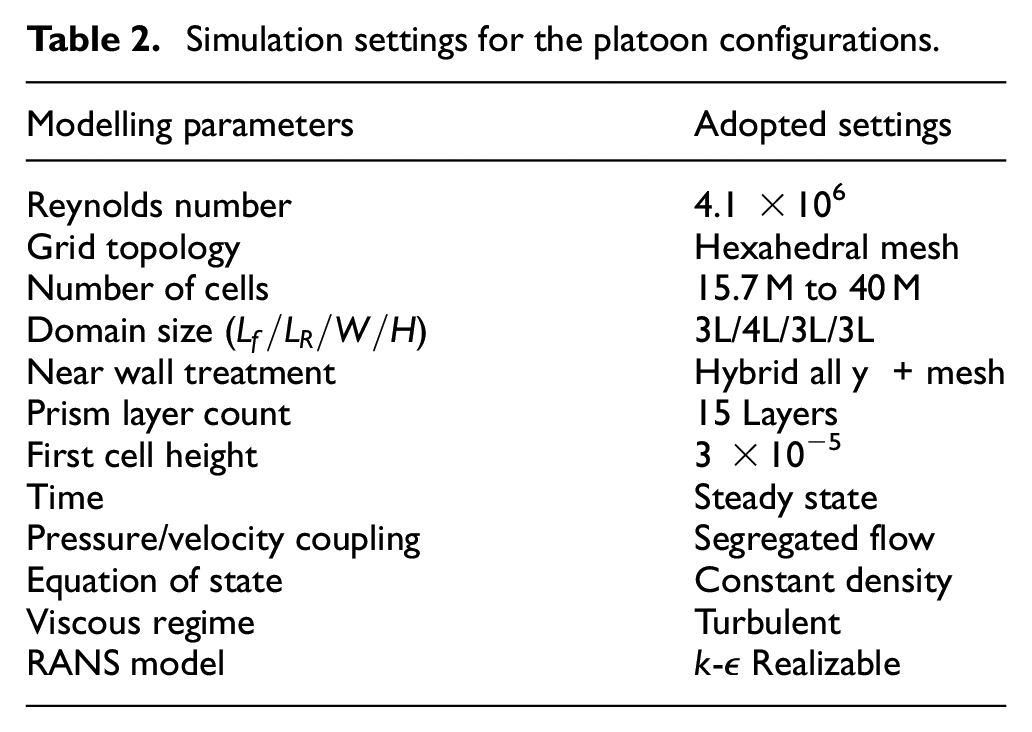
The simulation test environment was set with the boundaries far from the region of interest as recommended by CD-Adapco. 18 Traditionally, a velocity inlet and a static pressure outlet are used for incompressible flows to specify the wind velocity entry to exit direction. Stationary wall boundaries with “slip” conditions were applied to the top and side walls to inhibit shear stress calculations, whilst a moving ground plane was used to replicate the conditions experienced on the road. Several investigations on full sized domains with vehicles in isolation and in platoon indicated that the averaged wake is symmetrical about the vehicle axis and therefore a symmetry plane was chosen to halve the computational domain. Following a mesh sensitivity analysis that indicated a negligible reduction of 0.6% of the drag after doubling the mesh size of 16 million cells, the adopted CFD settings to mimic the track investigations are summarised in Table 2.
Simulation settings for the platoon configurations.
The adopted CFD settings were previously validated and proven to correlate with experimental measurements of vehicles in platoon.4,5 The platoon configurations including the inter-vehicle spacing and Reynolds number were identical for the CFD and track measurements to allow for a direct comparison, although, the vehicle geometry was simplified in CFD by enclosing the front grill, wheelhouse, wheels and smoothing the underbody. Enclosure of the front grill is known to reduce the drag of the vehicle as the internal flows are neglected. Cooling drag is known to widely vary depending on the front end geometry of the vehicle and would typically have a magnitude of 20 drag counts (i.e.
In general, the flow field around vehicles operating in a platoon is dictated by three-dimensional unsteady wake features that are caused by flow interference and high turbulence. The intensity of both parameters increase as the inter-vehicle spacing is reduced and therefore to capture the time-dependent flow dynamics accurately the use of unsteady simulation approaches is vital. However, for drag estimations and general surface pressure trends,4,5 showed that the Reynolds Averaged Navier-Stokes (RANS) is capable of producing reasonable results.
Drag estimation method
The pressure drag associated with the forebody and base surfaces of the Nissan Leaf was estimated by using the experimental pressure integration technique 21 as described by equation (5):
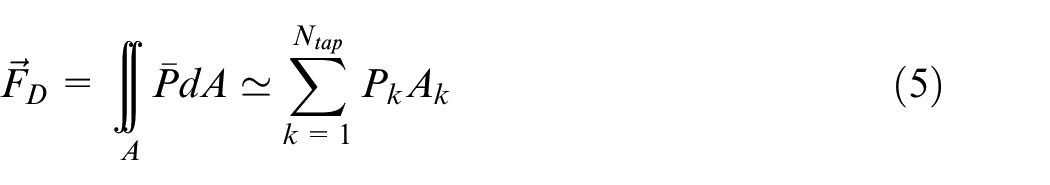
Where,
Methods of area discretisation: (a) uniform grid distribution, and (b) Voronoi distribution.
The uniform grid approach was chosen for this investigation due to its simplicity, as it uses a similar area to define the discretised cells on the surface. To accurately predict the drag, a fine distribution of pressure taps is required, which is difficult to achieve for car geometries with localised and abrupt changes in pressure gradients, reversed flows and areas that are difficult to tap with moving parts such as the wheelhouse. Melton et al. 22 investigated the discretisation error introduced by sparsely populating a simple aerofoil surface with pressure taps and comparing the lift and drag measurements to a force balance. The results obtained from the surface integration showed large deviations in the force estimation, and hence they used CFD to create a correction factor for these deviations. This reflects the complexity of distributing a small number of pressure sensors on the surface and estimating the drag force without appropriate examination of the error magnitude that may be produced. Arguably, researchers tend to distribute the pressure tappings based on their experience and the physical phenomena that would be expected. However, for cases similar to vehicles in platoon, where parametric changes such as the inter-vehicle spacing is being tested; the pressure map is continuously changing and no single pressure distribution is tailored to accurately predict the pressure drag for all testing scenarios. Location optimisation methods (for example using evolutionary algorithms) could reduce the error margins of the force prediction.
To calculate the force error introduced by discretising the surface with pressure tappings can be approximated using equation (6):
Initially, a discrete number of pressure points is selected and the squared difference of the predicted pressure drag (from these points) to the actual pressure drag (measured from an infinitesimally small area) is calculated. This is done for a number of different configurations including vehicle in isolation, 2 and 3 vehicles in platoon with different inter-vehicle spacings. Changing the configurations allows for the evaluation of a particular distribution’s ability in predicting the drag for a number of testing scenarios, which is essential for studying vehicles in platoon. The mean force error is then computed by averaging all the squared differences from the various configurations. This process is repeated with increasing number of points, which results in an asymptotic relationship as the mean force error reduces with increasing number of pressure points on the surface as would be expected. A theoretical representation of such method is shown in Figure 11.
The theoretical force error produced by discretisation of the surface using a finite number of pressure tappings.
This approach was implemented for a discrete distribution of pressure points to calculate an error margin that can be quantified relative to a known error value approximated by the use of a uniform distribution or an optimum distribution of pressure taps. For this study, 31 pressure taps were used on the road investigation, which possibly will introduce a discretisation error to the force estimation. This error will be quantified using CFD as it offers a quick turn-around time in terms of distributing points onto a converged solution and readily obtain the pressure values of these points. The uniform grid approach was applied and the surface was discretised with pressure points ranging from 24 to 1716 including the 31 pressure taps with the exact locations used on the track investigations.
Figure 12 shows that the averaged error estimation from the sparsely distributed 31 pressure taps is as high as
Comparison of the error margin from a uniformly distributed pressure tappings against the 31 sparsely distributed pressure tappings on the Nissan Leaf body.
Results and discussion
CFD validation
From the surface pressure measurements on the Nissan Leaf driving in isolation in Figure 13, a drag coefficient of
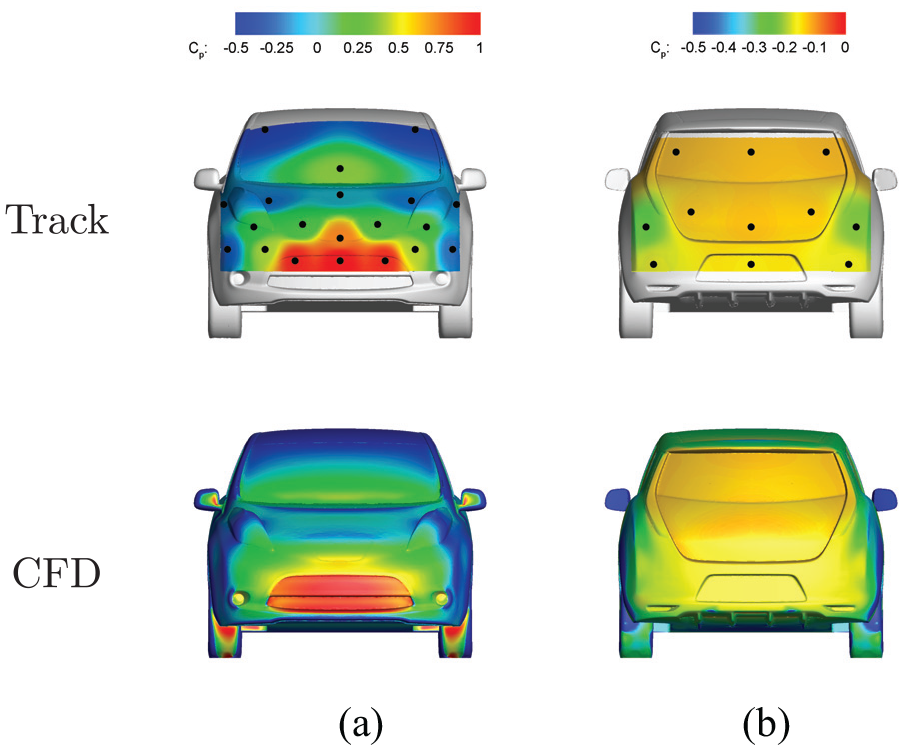
Surface pressure comparison between on-track measurements and CFD simulations for the isolated vehicle: (a) forebody surface, and (b) base surface.
The highest pressure was concentrated around the stagnation point of the car with a rapid pressure drop as the flow accelerates around the sharp corners of the front fenders, hood, and A-pillars. For the base surface, the peak pressure was localised just below the spoiler across the span of the rear screen where the dominant flow recirculation bubble occurs, and along the centreline of the car boot above the rear bumper. The other sensors close to the rear fenders recorded a lower pressure suggesting that the flow is accelerating around the sharp edges and diffuser. Similarly the pressure trend of the CFD simulations corresponded to that seen on the road measurements, despite some minor differences in absolute values. The high spatial resolution of the simulation characterises a continuous pressure field that is more representative of the vehicle’s surface pressure, in comparison to the discretised pressure field interpolated by the finite number of pressure sensors.
In a 2-vehicle platoon, the surface pressure of the trailing vehicle forebody varies with the presence of a leading vehicle as shown in Figure 14. It indicates that the peak pressure magnitude has decreased in all spacing configurations. For 0.5 L spacing, three distinct peaks occur on the leading edge of the bumper, two beneath the headlights and one at the stagnation point. This indicates that the flow separating from the leading vehicle rear fenders and diffuser is impinging at those locations before accelerating along the vehicle front fenders and hood. As the spacing between the vehicles increases toward 1 L spacing, these noticeable variations begin to dissipate and the high pressure region converges to cover the span of the vehicle bumper. In addition, the base pressure appears to increase in comparison to the isolated baseline case, with no significant variation to the pressure field as the platoon spacings is increased. This corroborates with the findings findings of Zabat et al. 1 such that the pressure changes are localised around the forebody of the trailing vehicle and exhibit lower pressure peak. However, this does not immediately suggest the decrease of drag on the following vehicle as higher pressure acts on a larger area of the forebody in comparison to isolated driving. For these scenarios, CFD was able to predict with high precision the location of pressure changes on both the forebody and base of the trailing vehicle. Any variation between the two methods was likely to be related to the interpolation method and the distribution of limited number of pressure probes.
Comparison between the surface pressure obtained from the track and CFD for a 2-vehicle platoon at various spacings.
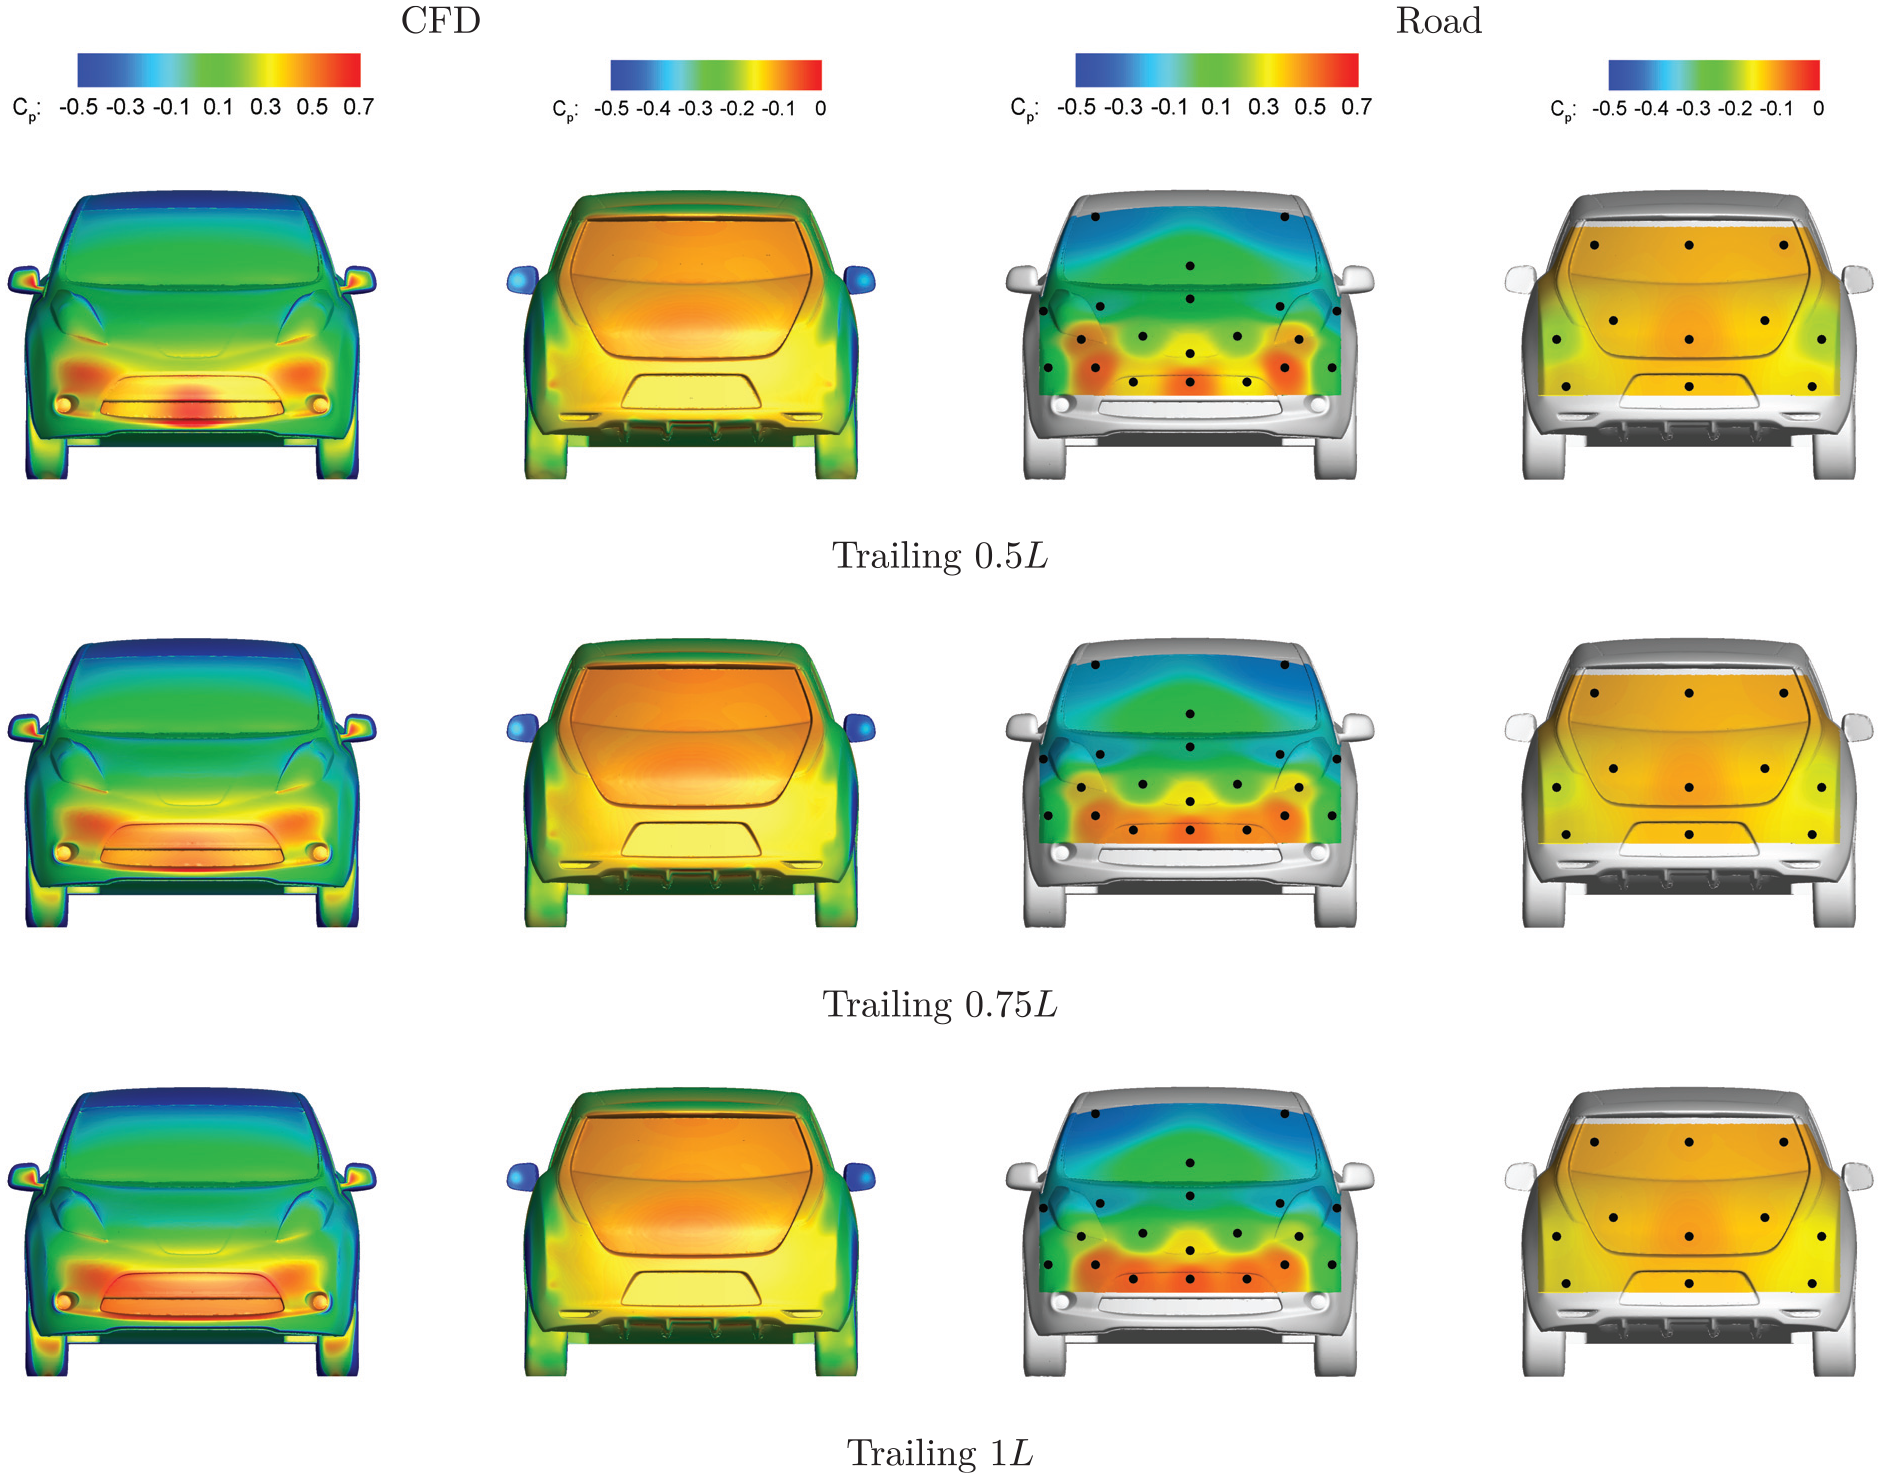
In a 3-vehicle platoon (presented in Figure 15), the pressure topology acting on the middle vehicle forebody remains similar to a 2-vehicle platoon. This would indicate that the presence of a trailing vehicle (behind the middle vehicle) has a negligible influence on the pressure field between the two forward cars. A pronounced increase was however observed on the middle vehicle base due to the presence of a trailing vehicle. This causes a pressure build up as the wake is “trapped” between the two vehicles before it convects downstream along the following vehicles in line with observations made by. 12 At 0.5 L the base pressure as a whole has increased with a peak recorded at the centre of the boot above the rear bumper, which is found at the impingement point of the lower recirculation. This pressure increase drops with higher platoon spacing and it is likely to be similar for the leading vehicle, although unseen as no pressure probes occupied the leading vehicle base. The trailing vehicle forebody was found to exhibit the least pressure magnitude within the 3-vehicle platoon. The peak pressure increased with spacing and continued to cluster beneath the headlights even at the largest spacing tested (i.e. 1 L). This is expected as the vehicle is characterised by an up-washed wake induced by the diffuser, which reduces the flow directed under the vehicle. 4 Negligible pressure variation was observed on the trailing vehicle base with spacing, although it appeared marginally higher than the isolated case.
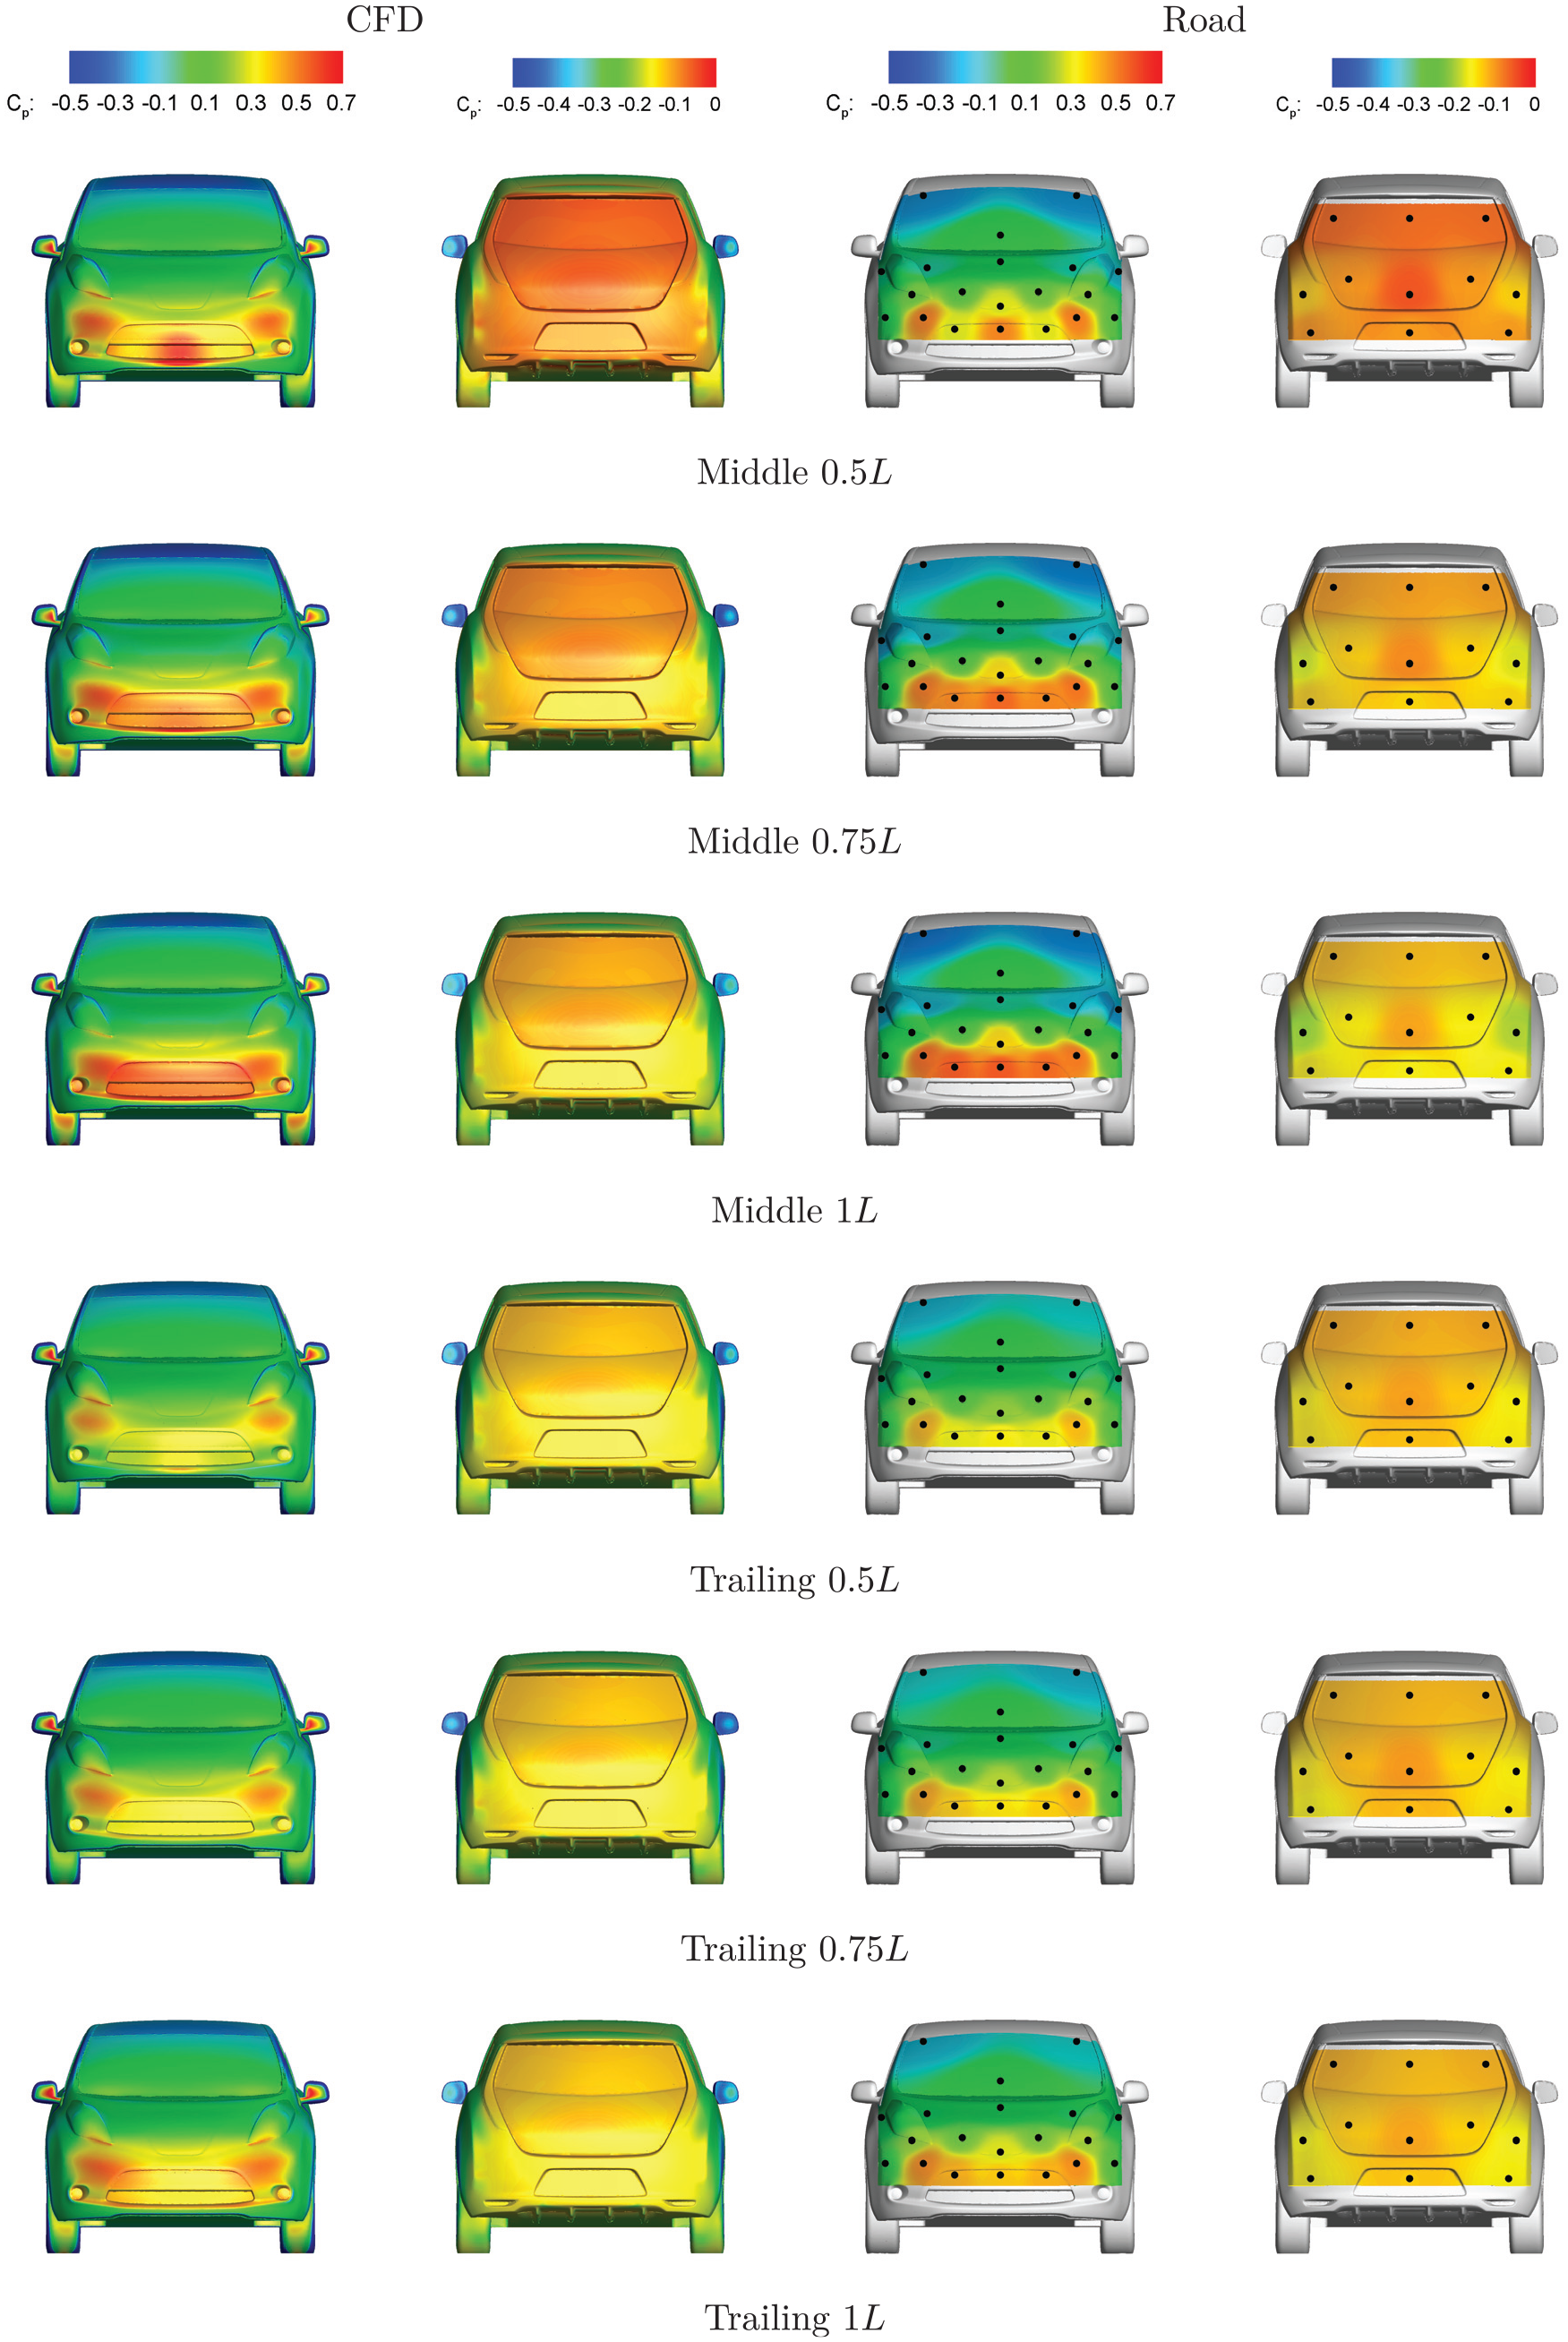
Comparison between the surface pressure obtained from the track and CFD for a 3-vehicle platoon at various spacings
To further validate this analysis and convert the pressure magnitude to force, equation (5) was used. A similar reference area for each pressure tap was used to compute the
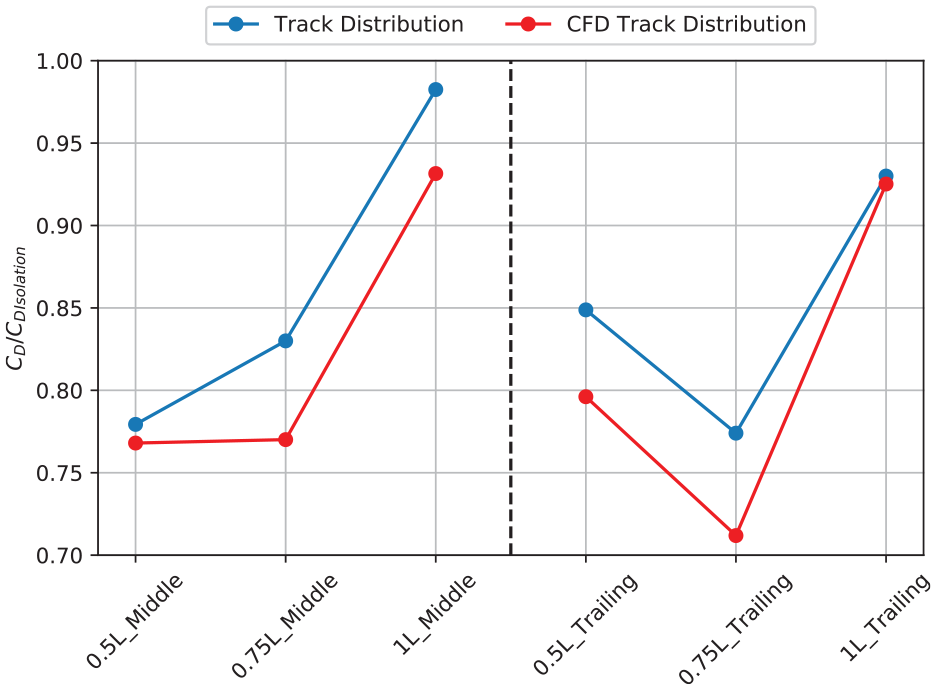
A comparison of the drag measured from a sparsely distributed 31 pressure tappings between the track measurements and CFD simulations for a 3-vehicle platoon at different spacing
It is evident that a reduction in relative drag was observed for all configurations using both numerical and track measurements. For the middle vehicle, a reduction in drag was noticed when the spacing was decreased, which corresponds with the pressure magnitudes of the 0.5 L and 1 L spacings, whilst the drag trend seemed to fluctuate with variable spacings for the trailing vehicle, although remained lower than isolated driving. In all the tested cases, the pressure drag prediction was consistently higher for the track measurements. Nonetheless, the correlation in trend between the track measurements and CFD suggests the capability of CFD in detecting the drag force variation even when the pressure is interpolated from a limited number of points matching the distribution used experimentally. It is difficult however, to agree on the degree of accuracy of these measurements especially since they were made on a sparse sensor distribution. The predicted drag force is likely to have an error margin in comparison to the “actual” drag value. Pressure sensor distribution plays a vital role in this prediction specifically if a greater number of sensors occupied regions of positive or negative pressure, which may bias the solution to over or under-predict the force. To quantify the error margin of the force prediction by these limited tappings in relation to a uniformly distributed grid, would have required an excessive number of pressure tappings, so it was therefore decided that the CFD data set would offer a much quicker and more practical return given its high spatial resolution and readily available information on the entire surface.
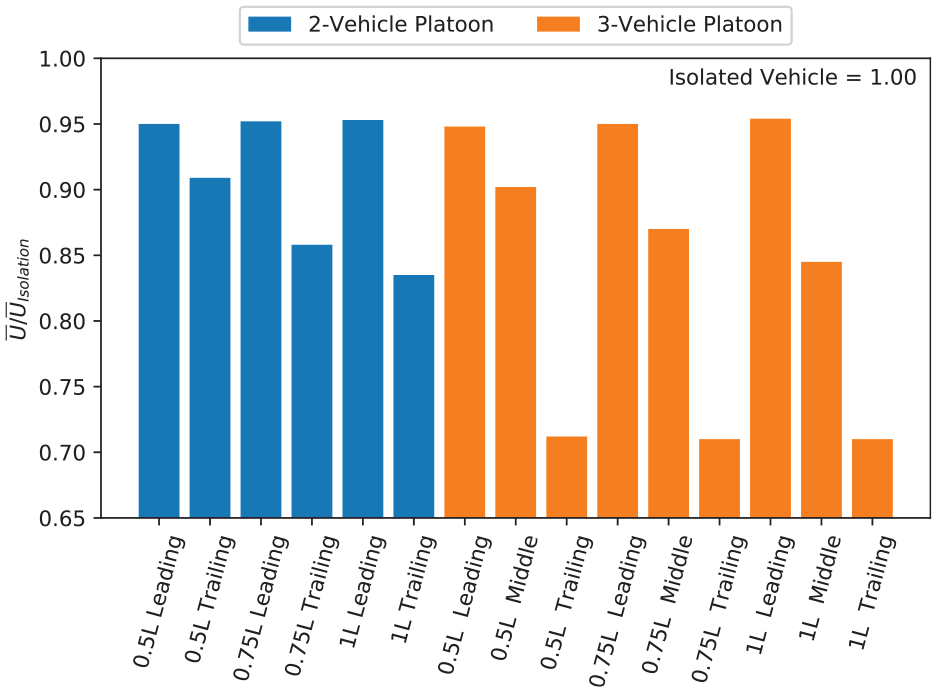
For a more accurate representation of the drag savings accomplished through platooning, the power efficiency described by equation (4) was used to correlate the power consumption measured from the track to that calculated using the full time-averaged drag from CFD. Figure 17 indicates that for 2-vehicle and 3-vehicle platoons the power consumption increases with spacing, while, increasing the number of vehicles in the platoon decreases the overall power consumption for each configuration similar to the observations made previously. 12 As a whole, power savings were achieved for the range of inter-vehicle spacings tested, and it is clear that the CFD approximations agree with the road measurements of power consumption. Note that the numerical power calculations were made through the multiplication of the drag force and free-stream velocity.
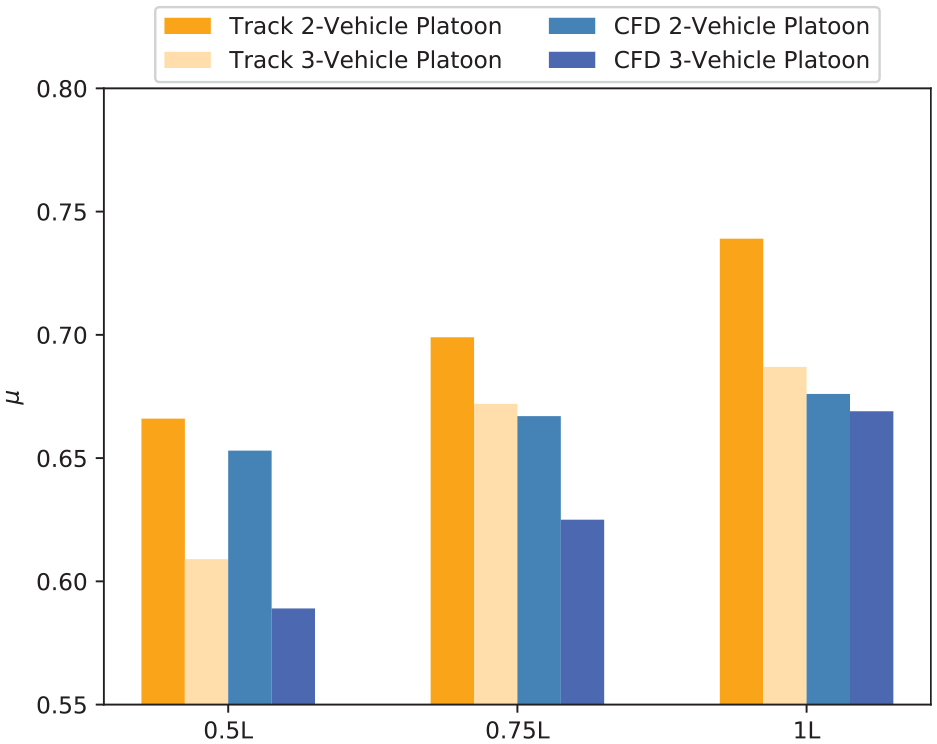
Comparison of the power savings for 2 and 3 vehicles in platoon between on-track measurements and CFD relative to the isolated vehicle
Breakdown of the sources of drag in platoon
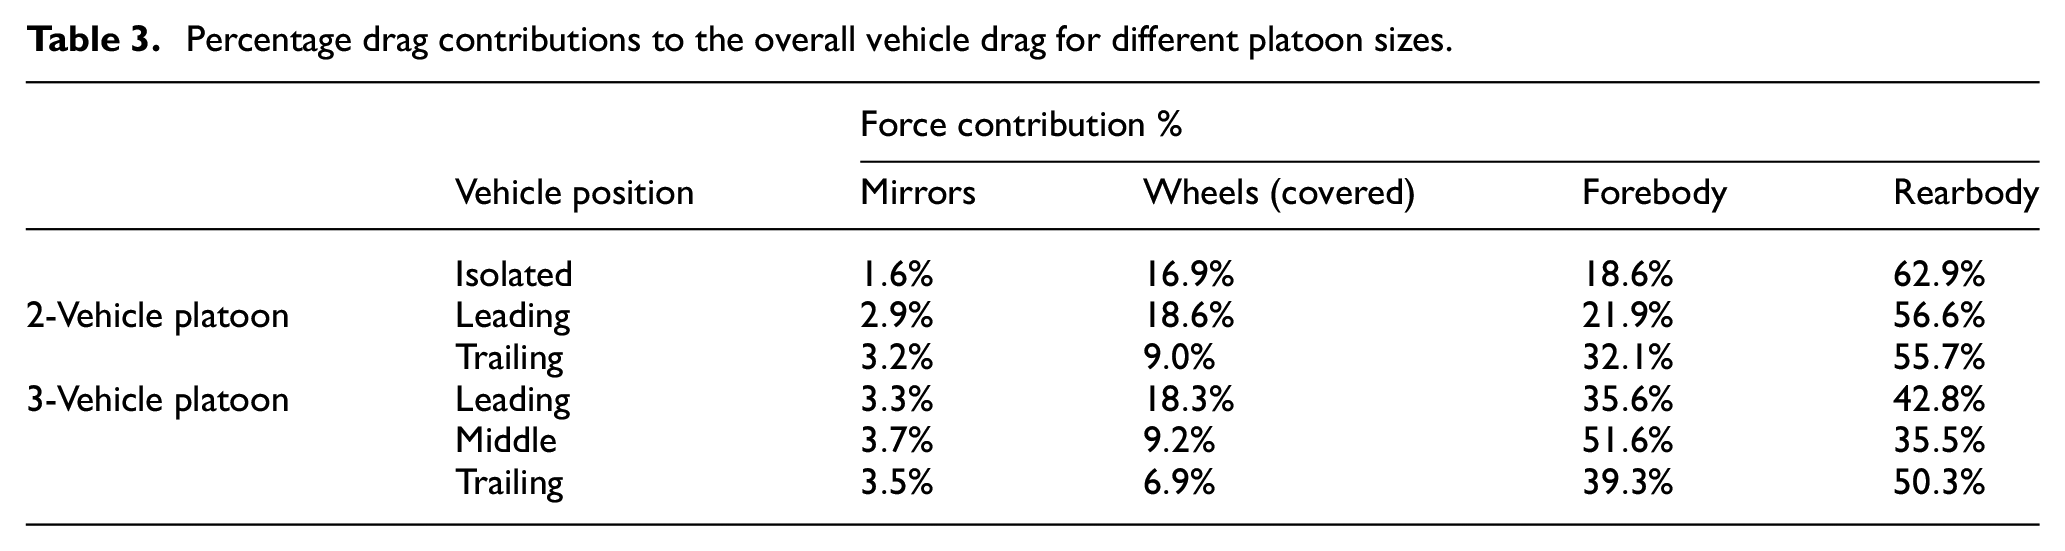
From CFD, the car components that contribute to pressure and shear drag were exported and summarised in Table 3. It is clear that regardless of the platoon size, the vehicle’s body remains the dominant contributor to the overall drag force. In addition, the wheel drag percentage appears to drop as the vehicle cascades down the platoon formation. This is because the flow is shielded by the upstream vehicle(s), which minimises the amount of flow in contact with the wheels. Finally, the mirrors have a relatively low drag contribution (i.e.
Percentage drag contributions to the overall vehicle drag for different platoon sizes.
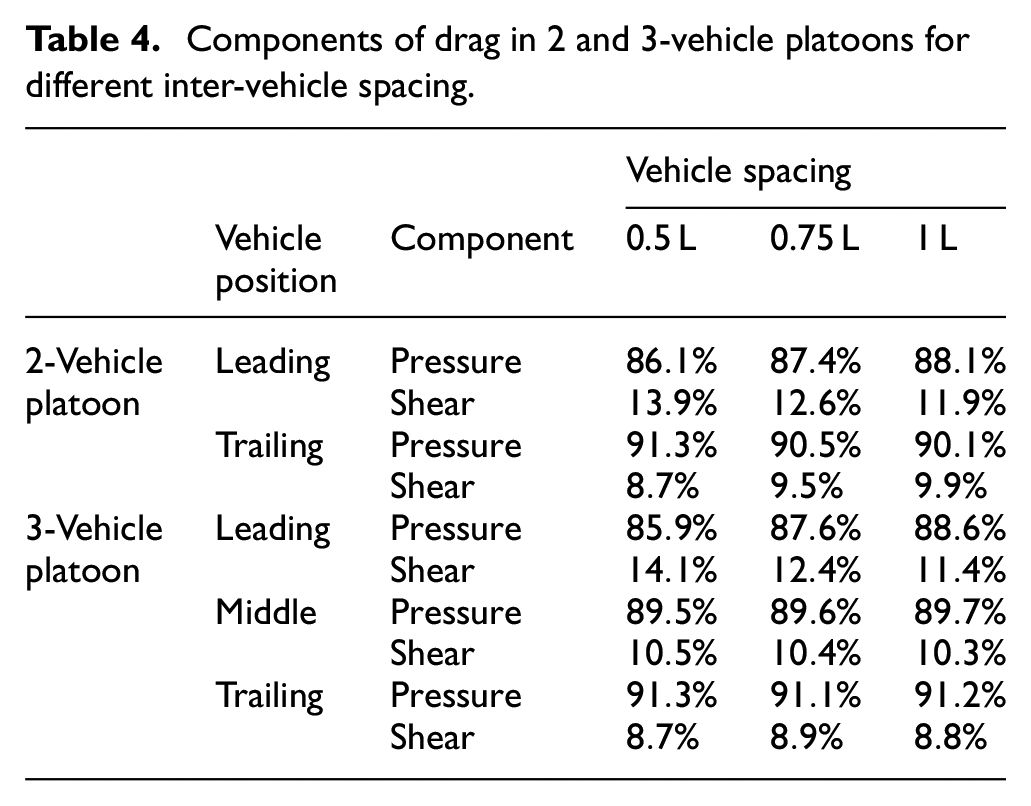
The drag is made up of two components that is pressure and shear stress. Examination of the drag components of the body alone as shown in Table 4 illustrates the magnitude of pressure drag in comparison to the surface shear stress. In both 2-vehicle and 3-vehicle platoons, the pressure drag accounts for the majority of the drag from 91.3% to 85.9% as expected from bluff body geometries. The percentage of shear stress appears to decrease for the leading vehicle with increased inter-vehicle spacing for both 2-vehicle and 3-vehicle platoons. This occurs due to changes in the boundary layer along the vehicle rear fenders and spoiler, which begin to dissipate as the spacing is increased. For the trailing vehicles in both 2-vehicle and 3-vehicle platoons; a drop in shear stress was noticed and was attributed to the reduced wall shear stress in areas such as the vehicle forebody bumper, hood and windscreen due to the leading vehicle shielding effect. In general, the contribution of shear stress for each vehicle in the platoon remains relatively small and constant for different inter-vehicle spacings. It is therefore possible to simply estimate the shear stress of individual vehicles and add it to the overall drag calculations obtained from track testing.
Components of drag in 2 and 3-vehicle platoons for different inter-vehicle spacing.
To visualise the regions of the surface that contribute to pressure drag; the force (using equation (5)) acting on individual cells in the stream-wise component alone was plotted on the surface as depicted in Figure 18. The produced contour map is defined into three distinct components of neutral, positive and negative force. Concentrations of positive drag are focused around the leading edge of the vehicle and above the cowl on the windscreen, which correspond to the areas characterised by high pressure gradients. Whilst a big region of positive drag force is seen on the base of the vehicle; with the highest concentrations localised around the centre of the base and rear window, both of which are impingement points of the two transverse counter-rotating vortices. The magnitude of force, although small, acts over a large area of the base, which makes it the largest drag component of the vehicle. Other areas such as the front wheel wells and underbody (near the diffuser) also contribute to the overall drag. Quantitatively, the surfaces of the vehicle that contribute the majority of drag are those seen in Figure 18(a) and (b). They account for
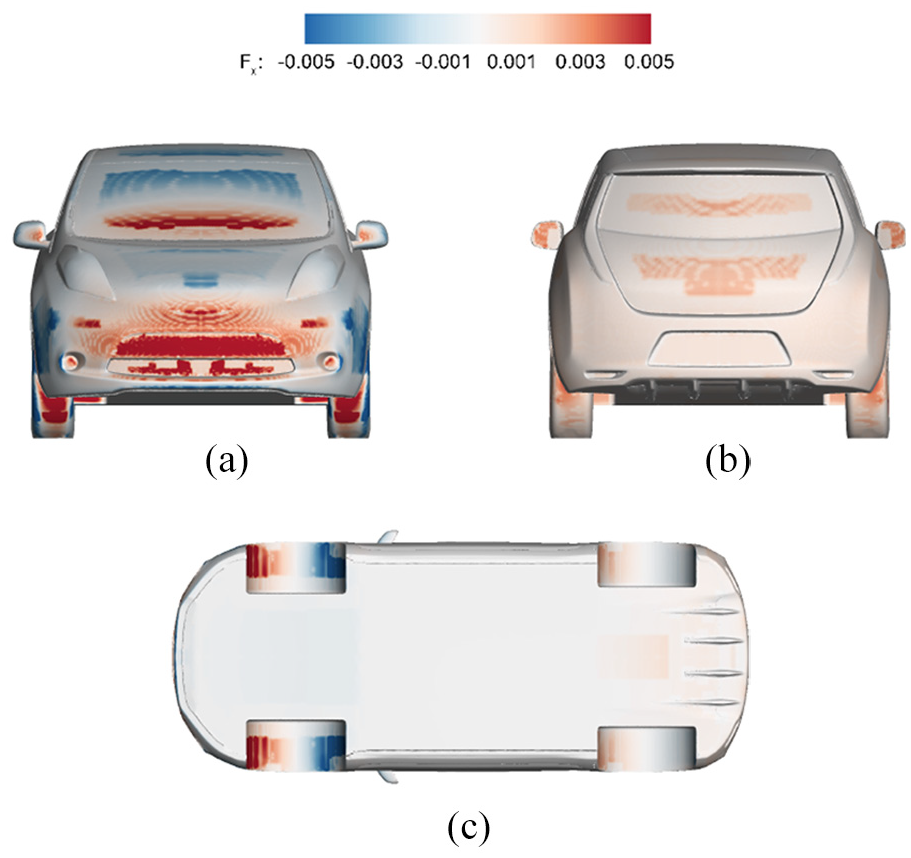
Nissan Leaf surfaces that contribute to drag in isolation: (a) frontbody, (b) base, and (c) front wheel arches.
Conclusion
The aerodynamic performance of vehicles in platoon has been investigated using both track measurements and CFD. The surface pressure trends measured on track have successfully validated the CFD analysis and showed distinct features on the middle and trailing vehicles. Zones of high pressure acting on the forebody appeared to stretch laterally with a lower magnitude as a result of the leading vehicle shielding effect, whilst the base pressure increased as the spacing between the vehicles reduced in comparison to vehicle-in-isolation. These pressure changes are reflected positively by the platoon power savings that ranged from 39.1% to 33.4%. In general, the power reduction was found to be proportional to the inter-vehicle spacing and its magnitude related to the number of vehicles in the platoon. Increasing the number of vehicles and decreasing the inter-vehicle spacing between them caused an overall drag reduction.
In addition, CFD offered a large data set that allowed a thorough investigation of the sources of drag for each vehicle. For different platoon configurations and sizes, the vehicle’s body remained the dominant contributor to drag with percentages ranging from 78.6% up to 89.6%. The wheel contribution varied depending on the vehicle’s position within the platoon and dropped asymptotically as the vehicle cascaded further down the formation. The mirrors showed an influence below 4% of the overall drag percentages measured. Pressure drag was considered the highest source of drag as expected, whilst the shear stress remained constant and dependant on the vehicle position within the platoon.
This breakdown of the drag confirms the complexity of estimating the drag using a sparse distribution of pressure sensors that only covers a partial region of the entire vehicle. From the track analysis an error margin of
From the results obtained in this investigation, it is evident that vehicles operating in platoon have great benefits in terms of power savings that potentially improves the range of electric vehicles.
Footnotes
Acknowledgements
The authors would like to acknowledge the support of Nissan Technical Centre Europe for providing the vehicles, test facilities and staff support to conduct these investigations.
Declaration of conflicting interests
The author(s) declared no potential conflicts of interest with respect to the research, authorship, and/or publication of this article.
Funding
The author(s) received no financial support for the research, authorship, and/or publication of this article.