
Abstract
The paper outlines a computationally efficient analytical method for evaluating the fuel consumption and the nitrogen oxide emissions during manoeuvres pertaining to the New European Driving Cycle. An integrated optimisation procedure is also included in the analyses with minimisation of the brake specific fuel consumption and minimisation of the nitrogen oxide emissions as objective functions. A set of optimum gear ratios are determined for a four-speed transmission, a five-speed transmission and six-speed transmission as the governing parameters in the optimisation process. The analysis highlights the determination of gear-shifting objective-driven strategies based on the minimisation of either of the declared objective functions. A reduction of 7.5% in the brake specific fuel consumption and a reduction of 6.75% in nitrogen oxide emissions are attainable in the best-case scenario for a six-speed transmission and a gear-shifting strategy based on the lowest brake specific fuel consumption for the case of an engine. The novel integrated analytical simulations and multi-objective optimisation have not been hitherto reported in literature. It provides the opportunity for an objective intelligent-based approach to the use of gear shift indicator technology. The results of this study also show that transmission optimisation can act as an effective and inexpensive mean to enhance the fuel efficiency and to reduce the emissions.
Keywords
Introduction
The exhaust emissions associated with burning fossil fuels in internal-combustion engines is a growing environmental concern. Many of the constituents of these emissions contribute to greenhouse gases, which absorb heat in the atmosphere, leading to increased temperatures and thus global warming. 1 The increase in environmental greenhouse gases can result in flooding, droughts, population displacement and significant damage to the ecosystem. 2 The exhaust emissions also affect the quality of air with health-related implications, particularly an increase in the incidence of respiratory diseases. 3
Burning fossil fuels such as petrol and diesel not only affect the environment but also lead to their depletion. There are significant difficulties in estimating how long reserves of fossil fuels will last. 4
For road transport, alternatives for fossil fuel as a source of energy are emerging rapidly, such as hybrid or electrical propulsion systems. However, for the foreseeable future and at least until the middle of the twenty-first century, internal-combustion energy is expected to play the major role as the means of propulsion for road transport. Therefore, improved fuel efficiency and reduced emissions from internal-combustion engines and powertrain systems remain important research activities.
Legislation and directives regarding levels of emissions are progressively becoming more stringent as the automotive manufacturers strive for improved fuel efficiency with new innovative solutions or practical palliations. There have been many emergent technologies to reduce the brake specific fuel consumption (BSFC). 5 They include downsizing of powertrain systems, improved output power-to-weight ratio, turbocharging, cylinder deactivation and stop–start in congested urban driving.
Fraser et al. 6 carried out driving-cycle simulations with a class D vehicle to investigate the fuel consumption benefits that can be accrued through downsizing. The original vehicle engine was a 2.0. It turbocharged gasoline direct-injection engine and the ‘aggressively’ downsized selected engine was the 1.2 l MAHLE downsized engine. The simulations reported by Fraser et al. 6 showed a fuel saving of almost 15%.
Douglas et al. 7 investigated the effects of cylinder deactivation (CDA) the air controlled autoignition (CAI) on the fuel consumption and the emissions. CDA is used during low-load conditions. When a number of cylinders are deactivated, this constitutes an effective engine downsizing. To maintain the engine torque with fewer cylinders, the fuel and the air supply need to be increased by using an increased throttle. Therefore, the combustion pressure in the active cylinders is increased, resulting in more efficient combustion. The closed valves of the deactivated cylinders reduce the pumping losses of the engine, thus increasing its overall efficiency. Additional fuel savings can also be accrued with a reduction in the effective surface area of the cylinders. Therefore, less heat is lost through conduction.
CAI is a combustion strategy in which fuel and air are premixed and ignited through air–fuel compression. Ignition occurs at multiple points, resulting in a rapid burn rate. This controlled ignition leads to lower cylinder temperatures owing to internal exhaust gas recirculation. The benefits of CAI are increased efficiencies, lower nitrogen oxide (NO x ) emissions, lower carbon dioxide (CO2) emissions and lower particulate emissions. The results from driving-cycle simulations on engines using both CDA and CAI showed a fuel consumption saving of 10% and a reduction of 28% in the NO x emissions during the New European Driving Cycle (NEDC) 8 (which consists of four repeated Economic Commission for Europe R15 (ECE R15) urban driving cycles and one Extra-Urban Driving Cycle (EUDC)).
Hybrid powertrains are an alternative approach. They also make use of energy recovery systems to store some of the otherwise parasitic energy loss and to recover the same for useful purposes, including for propulsion. Three different hybrid systems with stored energy in a battery, or a flywheel or as high-pressure fluid in a hydraulic system were analysed by Dingel et al. 9 The simulation results showed decreases in the fuel consumption for the three systems during the NEDC of approximately 31%, 33% and 27.5% respectively. 9
Gear shift indicators are devices which are designed to indicate to the driver when a gear shift should be made. The on-board computer calculates the fuel consumption when in any gear and suggests a shift in accordance with the lowest attainable fuel consumption and emissions. Vagg et al. 10 showed through simulations that the vehicle fuel consumption can be reduced by 4.3% following this approach. The CO2 emissions can also be reduced by 4.5% during the NEDC. 10 Norris et al. 11 showed that the gear shift indicator is able to reduce the fuel consumption by 4% and 7% for a Mini Cooper and a Ford Transit van respectively. However, the Volkswagen Golf tested in the same paper showed little improvement. 11 The fuel savings depend greatly on the vehicle and the gear-shifting strategy. The use of shift indicators does not require any significant modifications to the vehicle or engine. Thus, they make a simple, inexpensive and effective way to reduce the fuel consumption and the emissions.
This paper investigates the gear ratios and the gear-shifting strategy in a simultaneous manner in order to obtain an optimum design, which has not hitherto been studied in combination. These factors can shift the engine operating point to a more efficient region, reducing the fuel consumption and the NO x emissions. A numerical method is developed to calculate the first-gear ratio to provide adequate gradeability and a top-gear ratio to reduce the fuel consumption in highway driving. The intervening gear ratios are initially equally spaced. Subsequently, a range of new gear ratios instead of the initial intervening values are calculated. The fuel consumption, the NO x emissions and the 0–60 mile/h acceleration times are calculated for each gear ratio combination. A multi-objective optimisation approach is used to find the optimum gearbox configuration for the specified range of gear ratios. The optimum gearbox design can provide the lowest fuel consumption, the lowest NO x emissions or a trade-off between these objective functions. The 0–60 mile/h acceleration times are intended to show how the vehicle performances are affected by the optimum gearbox configurations, as this is an important driveability metric. The optimum gearbox concepts do not consider any design constraints. Therefore, they are intended to be used as a target and a starting point for transmission designers.
Simulations are carried out using the NEDC, and the savings made are compared with the original gearbox fitted to the studied vehicle. The results show that, with the addition of another gear pair, optimisation of the gear ratios and changes to the gear-shifting strategy, the fuel consumption and the NO x emissions can potentially be reduced by up to 7.52% and 7.6% respectively. The 0–60 mile/h acceleration times remain almost unchanged, and so the vehicle transient performance can be maintained with the optimum designs. The results reveal that optimisation of the transmission can be considered as an effective and inexpensive alternative approach to reduce the fuel consumption and the emissions.
Model description
Longitudinal dynamics
The equation of motion is derived from a longitudinal force balance 12 (Figure 1).
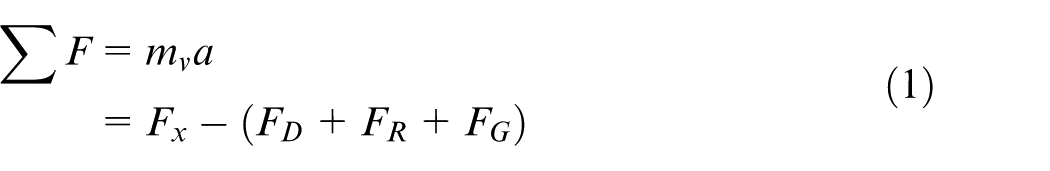
Free-body diagram.
where Fx is the tractive (motive) force, F is the aerodynamic drag, FR is the rolling resistance and FG is any gradient loading.
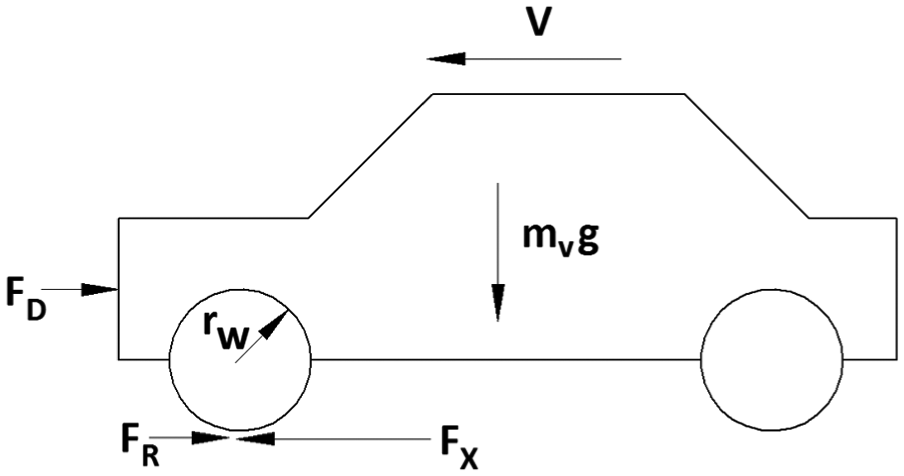
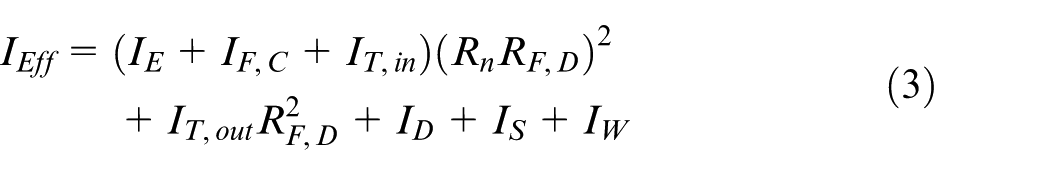
The vehicle traction force 12 includes the effects of the inertias of the drivetrain components. As the vehicle accelerates, the drivetrain components also need to accelerate which leads to a lower acceleration value as given by
A transaxle front-wheel-drive vehicle is considered (Figure 2). For this configuration, the effective inertia is 12
The aerodynamic drag acting on the front projected area Af of the vehicle at the forward speed v is 12

The rolling resistance and the coefficient of friction are calculated as 12

where μ = 0.01(1 + 2.236 94v/147) and where positive angles correspond to uphill travel and negative angles represent downhill manoeuvres. 13
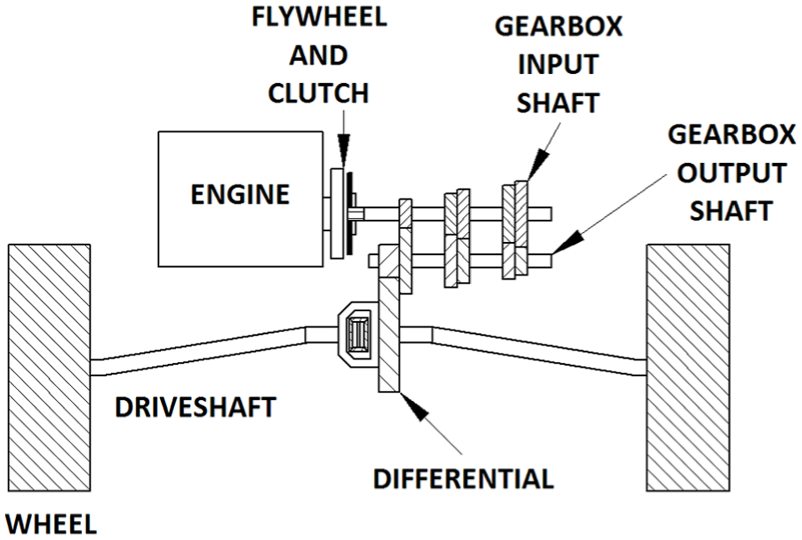
Transaxle powertrain layout (front-wheel-drive vehicle).
The gradient force is

Selection of first gear ratio
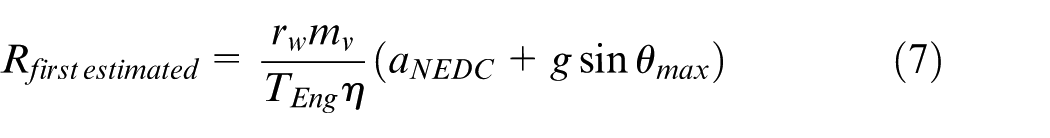
The first-gear ratio is selected in order to ensure an adequate vehicle hill start capability. It is also selected to provide a low creeping speed to avoid excessive clutch use in congested traffic. 14 For these reasons the first gear ratio is fixed and no further optimisation is carried out. A hill with a 1-in-3 gradient (33%) is usually used to test the vehicle hill start capabilities, which is the approach adopted here. In hill climb, the applied wheel torque to maintain the required acceleration and to overcome the resistive forces is determined. The acceleration of the vehicle is assumed to be constant with its value taken as the lowest starting acceleration 8 in NEDC conditions (0.534 m/s2). The initial engine speed is assumed to be 1000 r/min (by the clutch) with the engine torque at full load. Initially no drag, rolling resistance or inertia effects are taken into account, with iterations undertaken thereafter according to 12
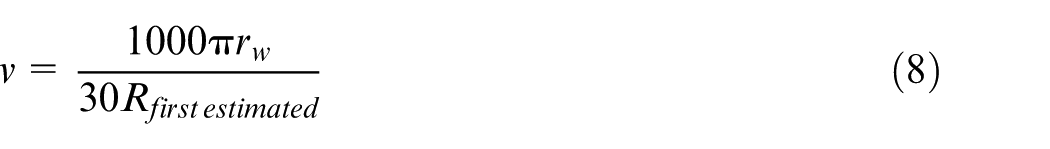
The velocity of the vehicle is calculated with this gear ratio at 1000 r/min, so that the maximum resistive force at the start of the manoeuvre is
The resistive and inertial forces are thus obtained as 12
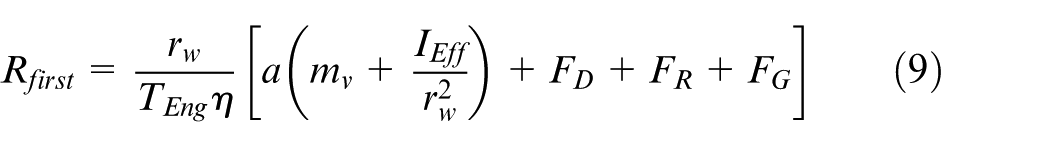
This process is repeated iteratively until the first-gear ratio converges to within an error tolerance of 10–4.
Selection of the top-gear ratio
Traditionally, the top-gear ratio for a vehicle is selected to provide the maximum speed. This is limited by the engine power and the resistive forces, predominantly the aerodynamic drag, when travelling at high speeds. 14 The aim of optimisation is to reduce the fuel consumption and the NO x emissions. Therefore, the selection criteria for the selection of the top-gear ratio are changed to achieve these aims, noting the maximum legislated speed limit. Here, the top-gear ratio is selected so that it provides the maximum efficiency at the maximum motorway legal speed. For the UK, the legal speed limit is 70 mile/h (31.3 m/s). Generally, the maximum efficiency region (the lowest BSFC) for an engine is for engine speeds between 2000 r/min and 3000 r/min. Therefore, the top-gear ratio can be selected as
Intervening-gear ratios
After the first-gear ratio and the top-gear ratio are determined, it is possible to estimate a set of intervening gears, followed by an optimisation process. These ratios are initially set at discrete equal spacings between the first-gear ratio and the top-gear ratio. A range of intervening-gear ratios can then be initially calculated. For each of these ratios, a range is defined as a percentage above and below the initially estimated range.
Gear-shifting strategies
Fixed engine speed
In this gear-shifting strategy, the gear is changed once the engine has reached a defined speed. The defined speeds are different for different situations. For city and highway driving, most drivers aim to keep the engine speed relatively low (below 2500 r/min) as this generally attains a better fuel consumption by early upshifting. 16 This type of fixed-speed gear change is ideal for driving-cycle simulations, where the fuel consumption and the emissions are the most important. For situations where an increased acceleration is required, such as overtaking or joining a highway, drivers tend to allow the engine to reach higher speeds before upshifting (greater than 3000) as this results in a higher output at the wheels. This type of fixed-speed gear changing is ideal for simulations of an accelerative manoeuvre.
Minimum fuel consumption and minimum NO x emissions (driving cycle)
To ensure the minimum fuel consumption or the minimum NO x emissions, a gear should be selected to achieve these outcomes. Each potential gear should be analysed to predict the repercussions for the fuel consumption and/or the NO x emissions according to the instantaneous prevailing conditions. The optimum prediction should also keep the engine speed between the idle and the maximum with the engine torque not exceeding the full load.
In practice, the driver does not know the required gear selection for the lowest fuel consumption or the lowest NO x emissions a priori. Therefore, the vehicle needs to be fitted with a gear shift indicator device or an automated shifting system. Gear shift indicator devices are already in use in some road vehicles in order to reduce the fuel consumption and to achieve lower emissions. The vehicle’s on-board computer is used to calculate the best gear, depending on the current speed, load and throttle position. Then, the most suitable gear is indicated on the indicator. 11 For simulation purposes, it is assumed that the driver follows the gear shift indicator or that an automatic shifting system is employed.
Acceleration manoeuvre
A model for the acceleration of the vehicle is needed in order to analyse the effects of each set of gear ratio combinations on the performance of the vehicle. An acceleration manoeuvre consists of a vehicle driven at full throttle along a straight flat road until a certain criterion is encountered. Most manufacturers quote a 0–60 mile/h acceleration time. This is the criterion used in the current study.
A vehicle start model is used with the vehicle travelling at its lowest forward velocity in first gear with an engine speed of 1000 r/min. The first-gear ratio is fixed at this speed with an adequate hill-start capability, as already mentioned. Therefore, the same starting procedure is used in all the reported simulations.
Simulation methodology
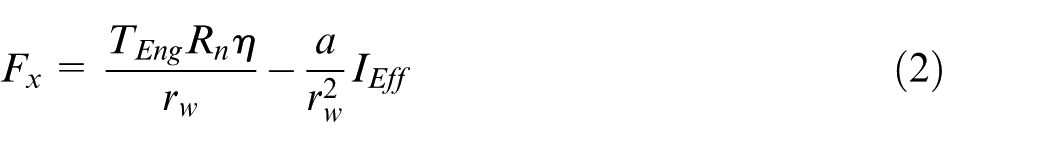
The accelerative manoeuvre is carried out at full throttle, taking the engine torque from the full-load torque curve. The time histories of the acceleration, the velocity, the displacement and the traction force are obtained by successive integrations of the equation of motion (equation (1)).
During the simulations, the gear-shifting strategy should be monitored to ascertain whether the gear needs to be changed. For the maximum engine torque gear-shifting strategy, the engine torque at the next gear is calculated. If the calculated torque exceeds the current torque, then a change in gear is required. For a fixed-engine-speed gear-shifting strategy, a gear change is necessary, if the engine speed is greater than that defined.
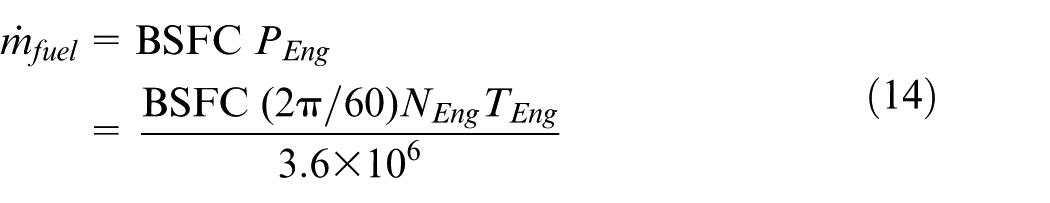
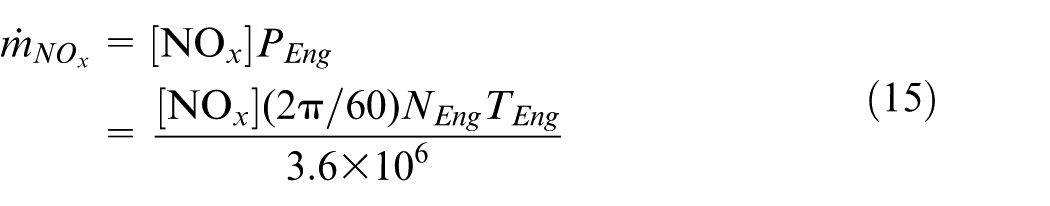
Having calculated the time histories of the engine speed and torque, the BSFC and the NO x values corresponding to these conditions can be obtained from three-dimensional engine maps. The mass of burned fuel and the mass of NO x produced during the specified manoeuvre can be calculated as
Driving-cycle analysis
Driving cycles are a set of vehicle conditions which attempt to replicate actual road driving conditions. They are used to compare the fuel consumption and the emissions for various road vehicles. All vehicles destined for the European market must adhere to the Euro legislation on emissions. The emissions measurements are taken from an NEDC test (Figure 3). The testing is usually carried out on a chassis dynamometer, because it is difficult to achieve consistent results in a road test although, from 2017, new testing rules require that a road test is also carried out, using a new driving cycle called the World Harmonised Light Vehicles Test Cycle (WLTC). 17
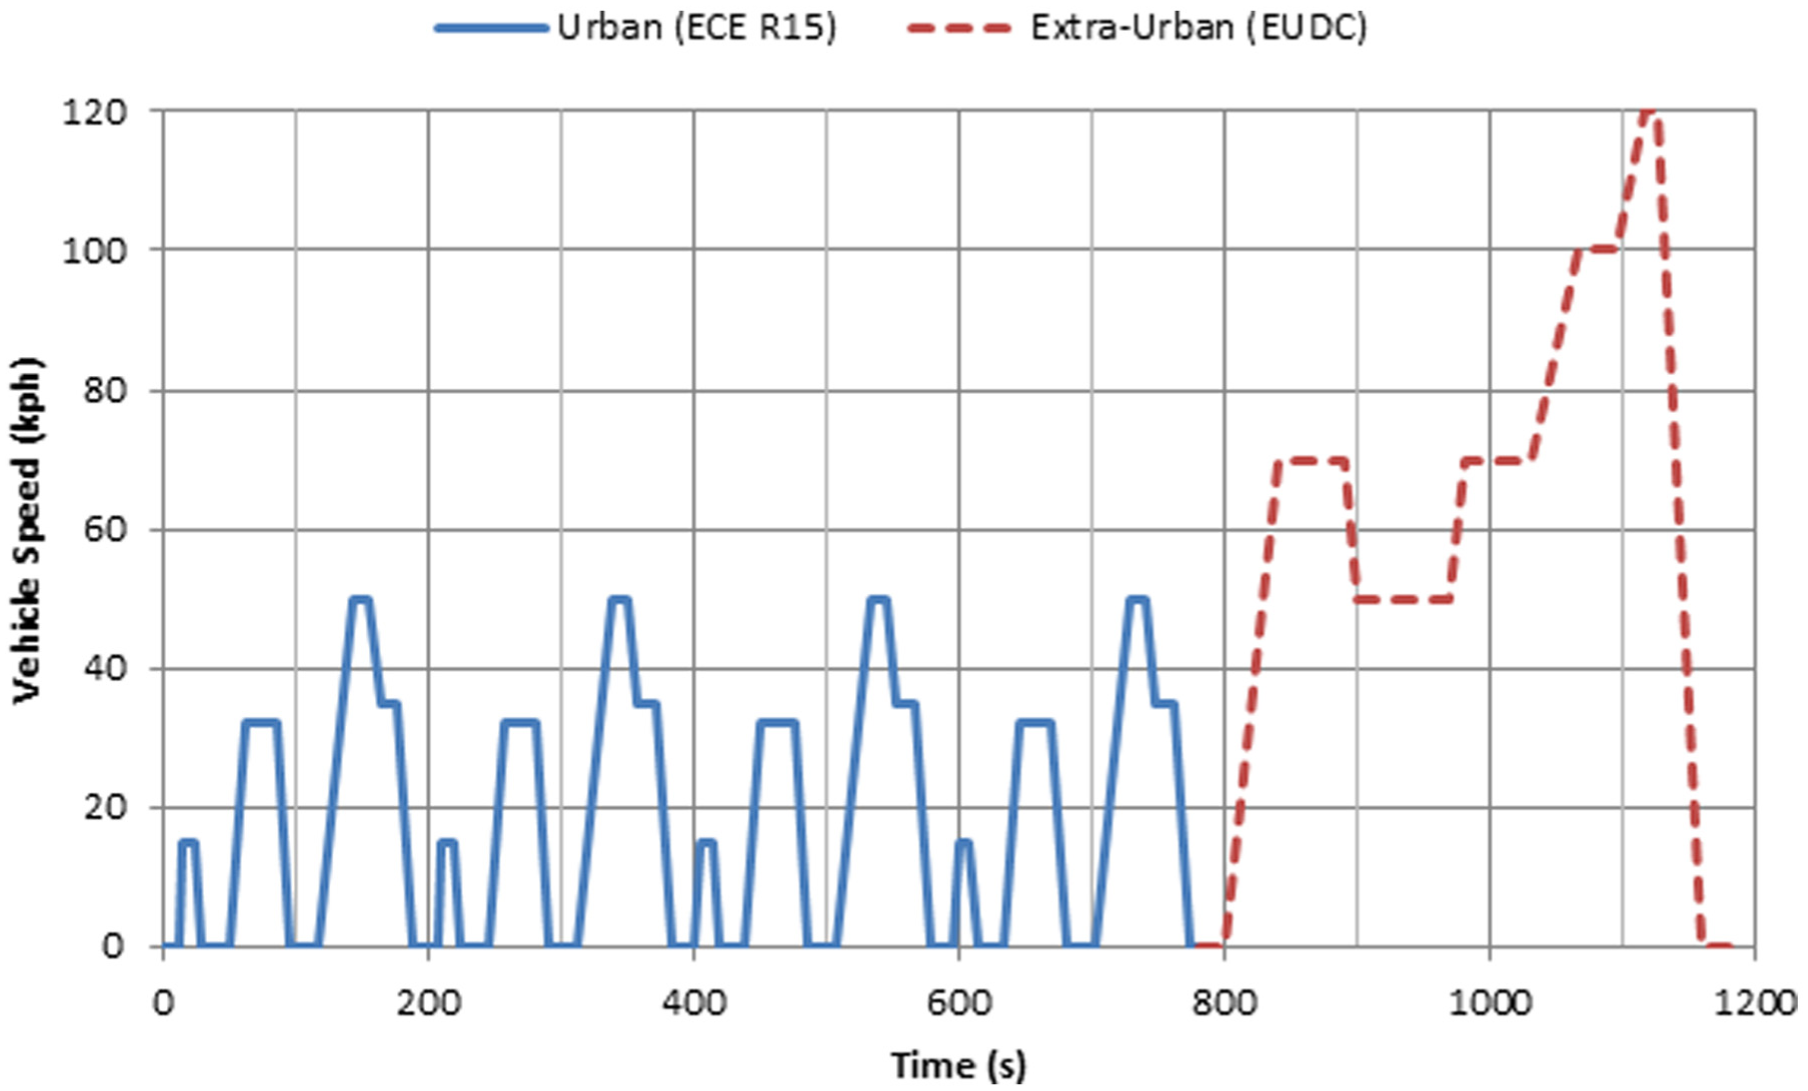
The NEDC. 8
During simulations, it is assumed that the vehicle follows the driving cycle exactly and that the throttle response is instantaneous. The fuel consumption and the NO x emissions produced during the cycle are calculated. These values are used in the optimisation process in order to find the optimum gear ratios for best fuel economy or the lowest NO x emissions.
Simulation methodology
As the driving cycle needs to be followed precisely, the vehicle velocity is known a priori at each step of the simulations. Therefore, the required acceleration can be found simply as
The required engine torque to propel the vehicle at the required velocity and acceleration can simply be calculated by rearranging the equation of motion (equation (1)).
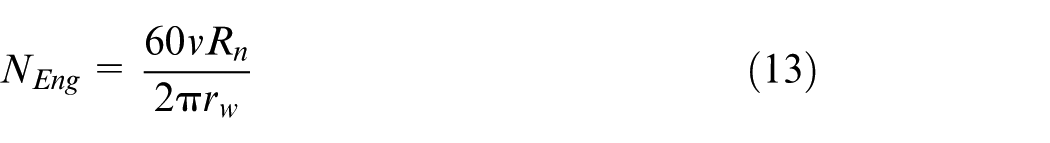
The engine speed at any prevailing gear is obtained as
For the minimum fuel consumption and/or the minimum NO x emissions, the gear-shifting strategy needs to predict the upcoming conditions in all potential gears at a point in the driving cycle. It is important to select the lowest gear ratio, but one which maintains the engine speed with the lowest torque. This forms the basis of the approach highlighted here. However, it will be necessary in the future to ensure that no sudden change in the torque surge or fade occurs as this can lead to impulsive action, inducing a plethora of drivetrain noise, vibration and harshness issues such as driveline clonk or exacerbated gear rattle.18–20
With the engine speed and torque evaluated, the corresponding BSFC and NO x level can be obtained by using two-dimensional interpolation of the engine map. The burned mass of fuel and the mass of NO x produced during the time history can be calculated, using equations (11) and (12).
Results and discussion
Vehicle and engine data
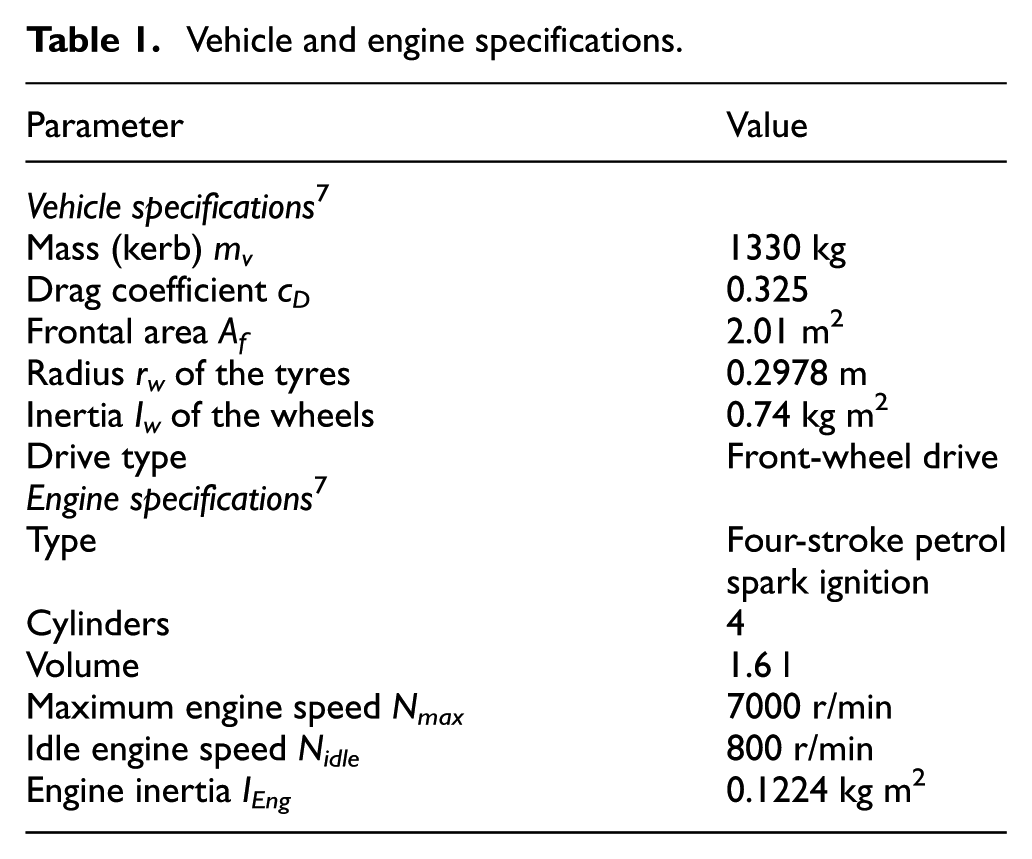
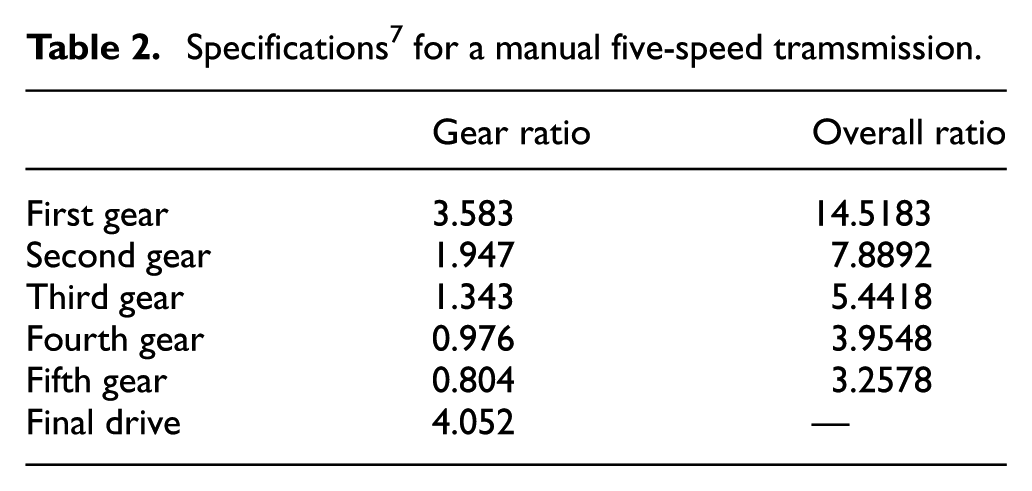
The vehicle considered in this study is a front-wheel-drive five-speed manual transmission C-segment 1.6 l vehicle with a four-cylinder petrol engine. The pertinent data are listed in Tables 1 and 2. 7 The appropriate maps are also presented in Figures 4 and 5. The vehicle was released in 2005 and thus was subjected to Euro 4 emissions legislation (for all Euro emissions directives see the article by the Society of Motor Manufacturers and Traders 21 ).
Vehicle and engine specifications.
Specifications 7 for a manual five-speed tramsmission.
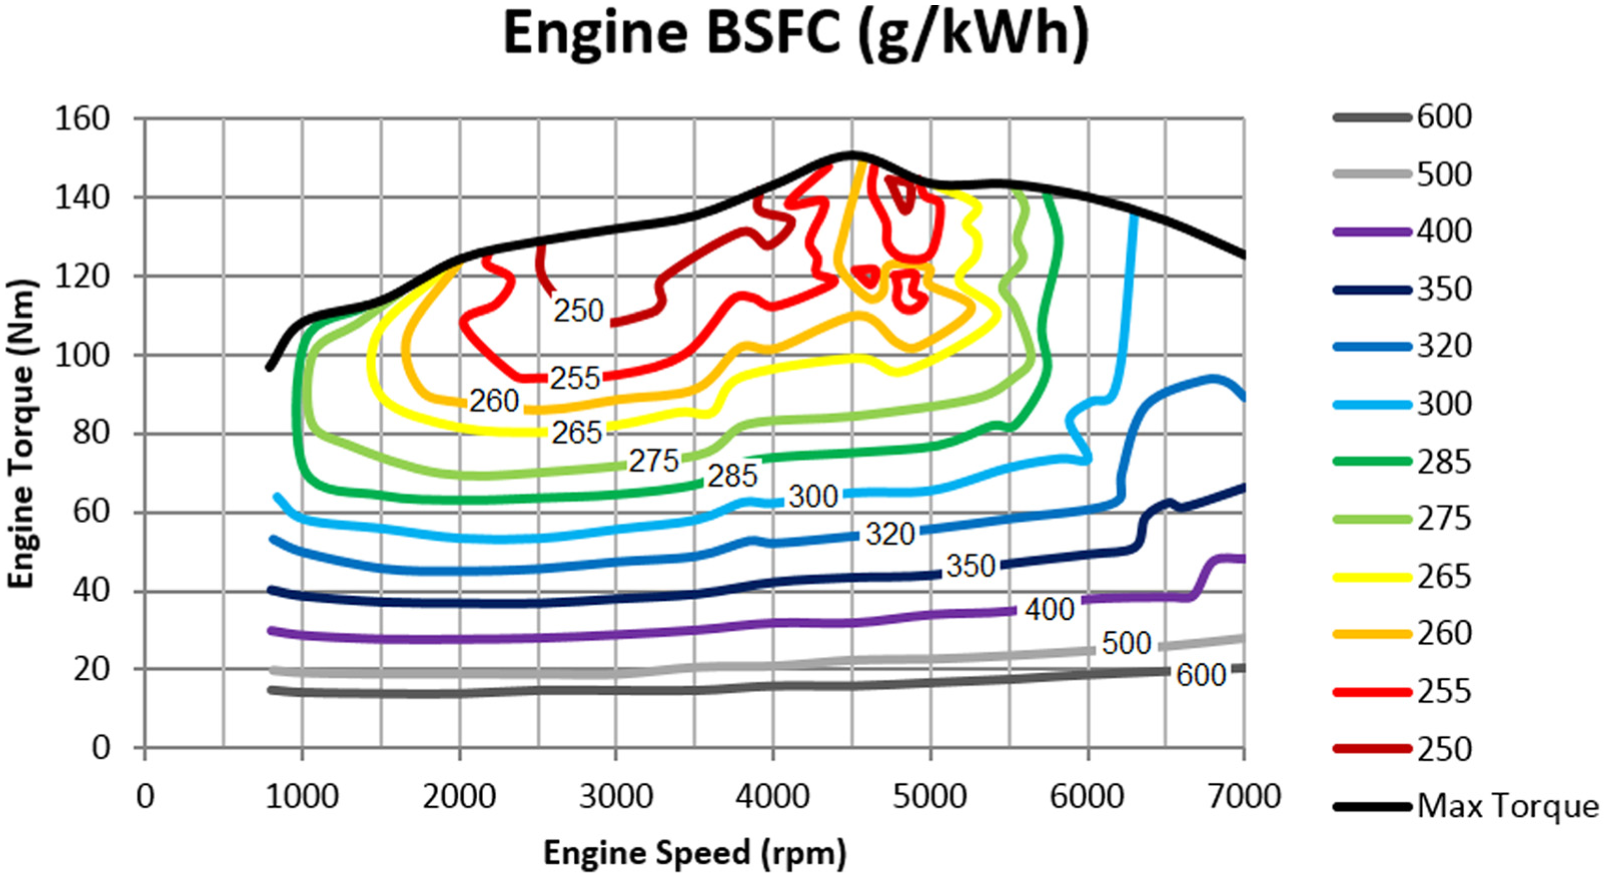
BSFC map of the engine. 7
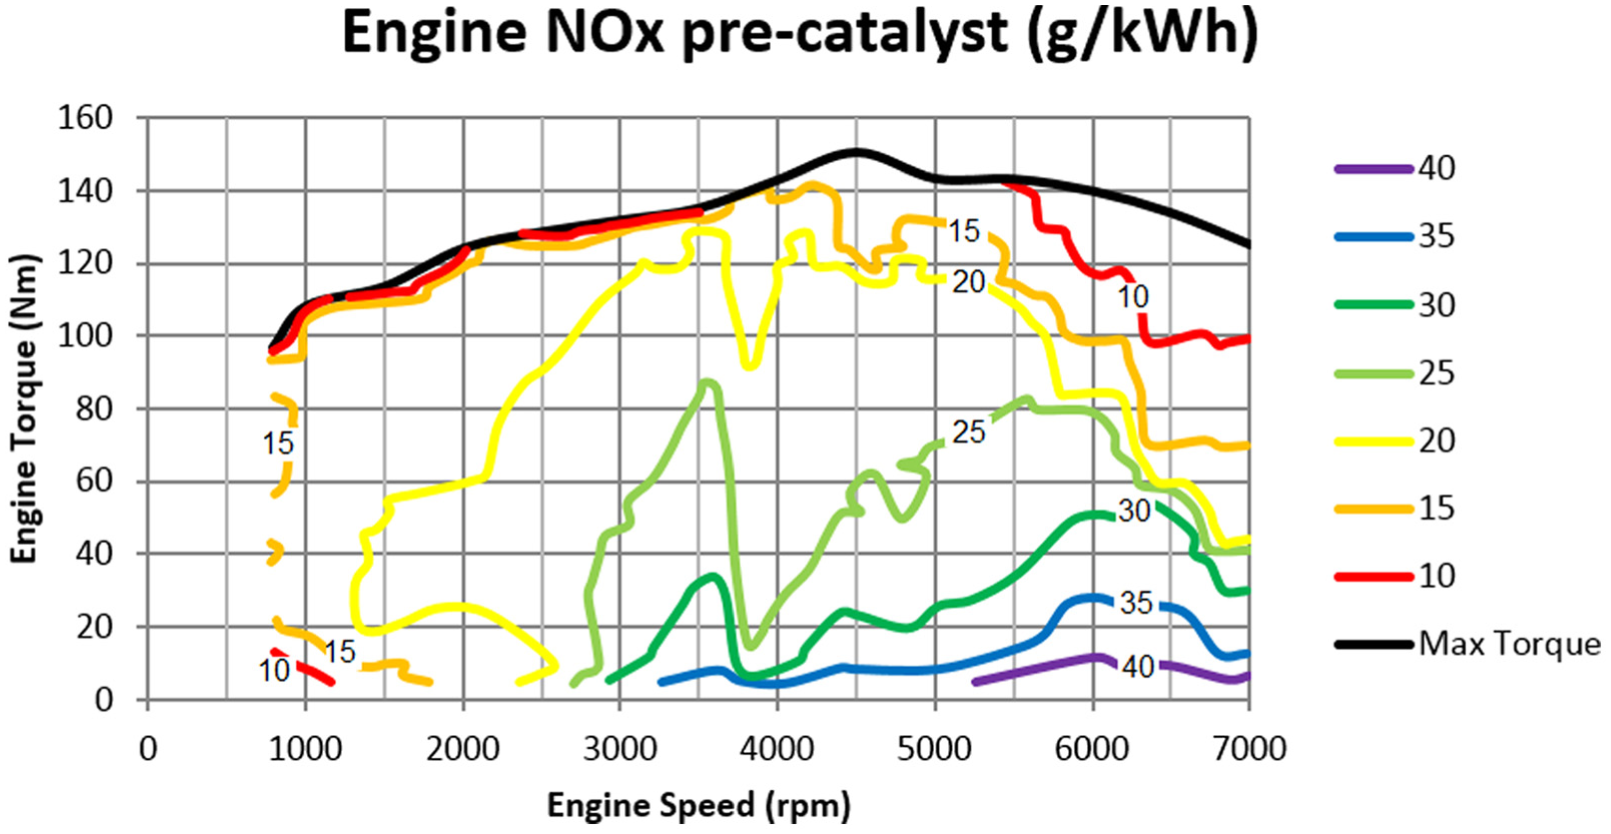
NO x map of the engine (pre-catalyst).
The maps of the BSFC and the NO x emissions can be used to calculate the fuel consumption at any given engine speed and torque. The values are given in the units grams per kilowatt hour (g/kW h), which can be converted to the more useful form of grams per second (g/s) by multiplying by the prevailing instantaneous engine power according to 22
Validation against measurements
Validation for acceleration manoeuvre
Experimental data for a 0–60 mile/h acceleration test presented by Douglas et al. 7 are used to validate the simulation model, with gear changes up to an engine speed of 6700 r/min, with each gear change duration of 0.5 s. Both these criteria were used in the simulation study.
Figure 6 shows the velocity–time graph comparison between the measured (experimental) results and the simulated results. The 0–60 mile/h acceleration time for the experiment was reported 7 as 10.89 s and that for the simulation study is 10.27 s. The results show good correlation with a 5.7% deviation from the measured data.
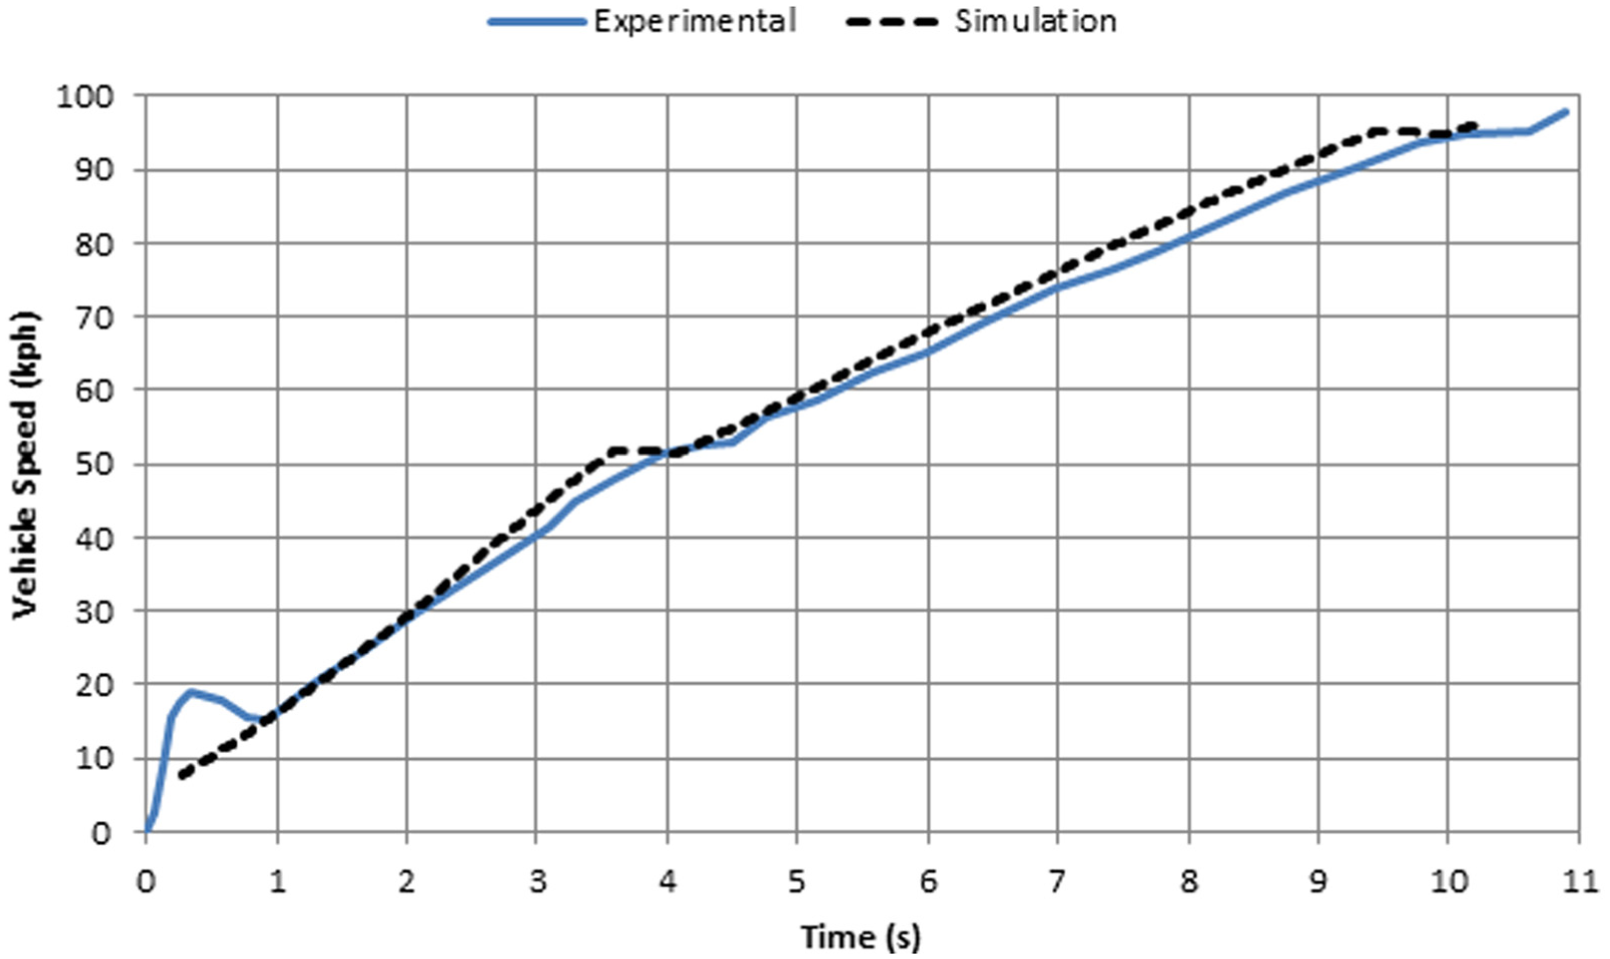
0–60 mile/h acceleration time history (measured versus predicted).
Validation for the NEDC (the fuel consumption and the NO x emissions)
An NEDC measurement was also presented by Douglas et al. 7 This is used to validate the model predictions for the fuel consumption and the NO x emissions. In this baseline experimental test, 7 the fixed-engine-speed gear-shifting strategy was used in the NEDC experimental test with a gear upshift when an engine speed of 2450 r/min was reached.
The testing of an NEDC requires a cold start. The engine is not running at its optimum temperature, which leads to increased friction and thus increased fuel consumption. The tests used for producing the engine maps are normally carried out on a ‘hot’ engine operating at its optimum temperature. Therefore, a difference in the results is expected in the cold-start region of the NEDC. To tackle this problem, Douglas et al. 7 calibrated the NEDC simulations to an experimental test using the conditions


It should be noted that this is only an approximation of the higher fuel consumption in order to compensate for the deviation in the results due to the cold start. A more precise calibration equation or use of specifically designed engine maps can be employed in order to obtain closer values. Temperature calibration was not applied to the NO x model as the results were quite similar.
The flow rate of fuel and the produced NO x at idle are estimated using the experimental graphs obtained by Douglas et al. 7 The average fuel flow rate at idle is 0.156 g/s, and the average rate of NO x generation is 0.001 264 g/s.
Figure 7 shows the comparison of the predicted fuel consumption with the aforementioned experimental data, both instantaneous and in the accumulative form. The measured value 7 of the cumulative fuel consumed was 711 g, whereas the predicted value from the current analysis is 641.2 g. There is a difference of 10%, which constitutes an acceptable degree of predicted accuracy. The difference is probably due to certain simplifying assumptions in the model, such as the quasi-static tyre model, as well as engine maps which are constructed from steady-state test conditions, rather than in the transient conditions of the driving cycle. These transient conditions result in lower efficiencies which cause an increase in the fuel consumption. 23
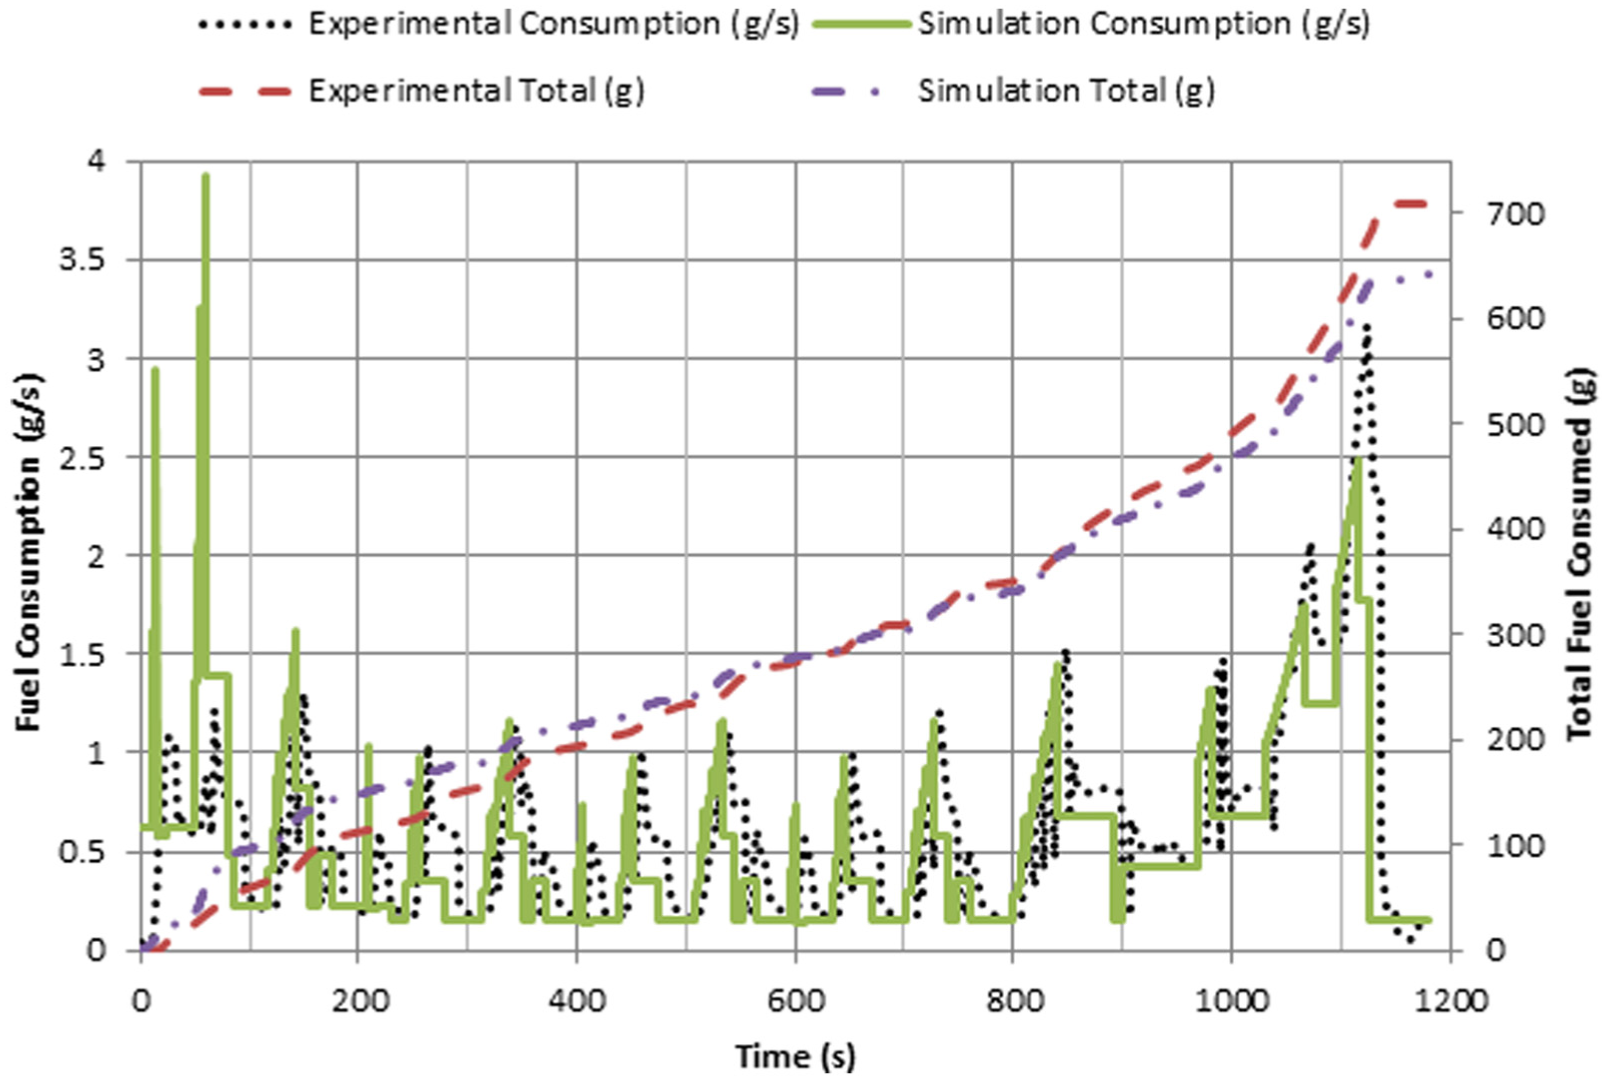
Fuel consumption (measured versus predicted) over the NEDC.
Figure 8 shows a comparison between the NO x emissions (pre-catalyst) predicted here and the measured values 7 for the instantaneous amounts and the total cumulative amounts over the NEDC. The measured total NO x emissions are 28.3 g, whereas the predicted value is obtained as 29.3 g, which is a difference of 3.5% (a higher predicted level). Again the correlation is acceptable and the difference is expected to be due to the use of a steady-state NO x map.
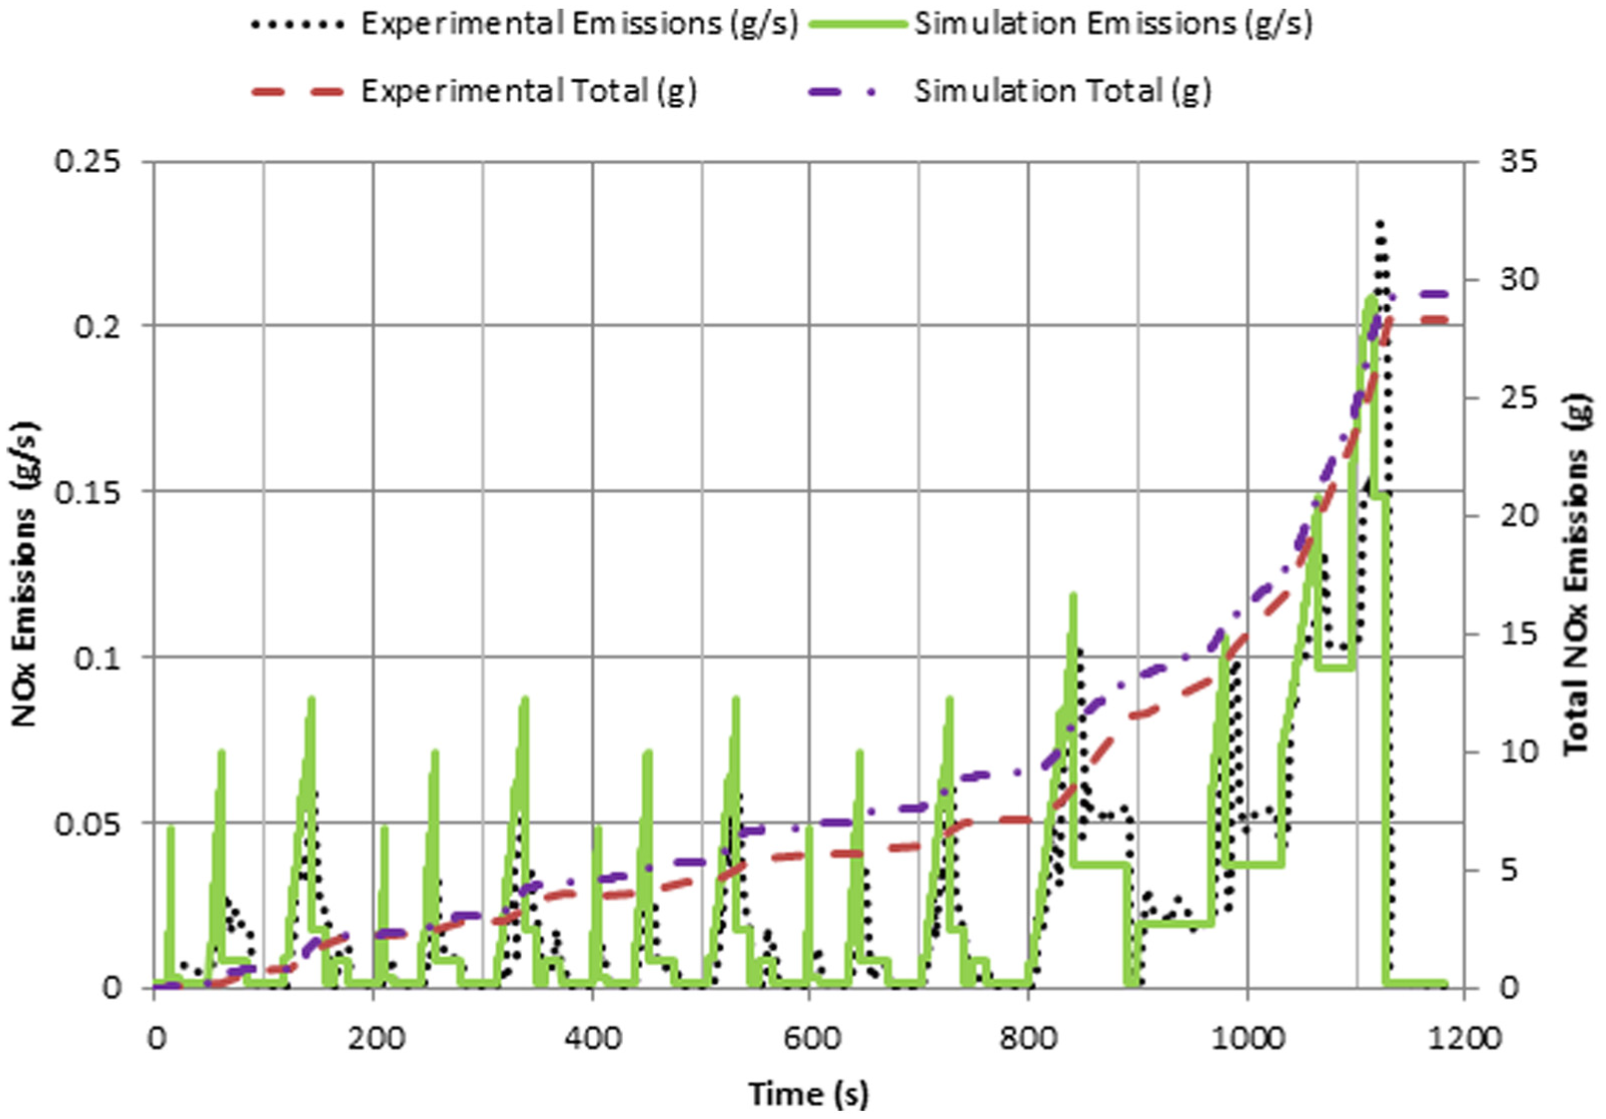
NO x emissions (measured versus predicted) over the NEDC.
Optimisation process
The first task in the optimisation process is to determine an optimum set of gear ratios which reduces the fuel consumption and the NO x emissions, while still maintaining the vehicle acceleration performance.
In addition, the number of gear stages in the transmission system is also altered to ascertain whether any additional reductions in the fuel consumption or the NO x can be accrued by considering an additional gear pair. As the number of gears increases, the gearbox cost, the compactness, the weight and the complexity also increase. A four-speed gearbox was tested to see whether removal of one set provides any tangible benefit. A six-speed gearbox was also tested to see whether sufficient reductions in the fuel consumption and in the NO x emissions occur to justify the disadvantages arising from the aforementioned issues of the cost and the compact light weight.
The first-gear ratio and the top-gear ratio are fixed as the values based on the hill-start capability and efficient motorway driving (previously noted). The intervening-gear ratios are initially assumed to be equally interspaced. The optimisation process is applied to these intervening-gear ratios. A spread of these ratios of ±10% of their equally spaced values is used (five increments for a six-speed transmission). The percentage difference between the performances (for the BSFC and the NO x emissions) of any combination of the chosen intervening-gear ratios and the performances of the initial set is used as the optimisation objective function(s).
The accuracy of predictions is dependent on the time step which is used in the analysis. To keep the simulation time to a minimum, while still maintaining a good degree of accuracy, a conservative time step of 0.5 s is used. A time-step sensitivity analysis is carried out, the outcome of which shows that changing the time step near the selected value had little effect on the final outcome of the optimum set of gear ratios. With these optimal configuration(s) (depending on the set objective functions of the BSFC and the NO x emissions), acceleration manoeuvres were carried out in order to show how much compromise is made in terms of the acceleration to optimise the fuel consumption and the NO x emissions. All the acceleration simulations used a fixed-engine-speed gear-shifting strategy. The gears were shifted once the engine speed reached 6700 r/min.
Fixed-speed gear-shifting strategy
A number of driving-cycle simulations using the NEDC are carried out. A fixed-speed gear-shifting strategy, similar to that presented by Douglas et al., 7 is employed in order to compare the results with the results obtained from the original transmission configuration. A gear-shifting speed of 2450 r/min was used. Simulations were carried out to find the optimum number of gear pairs. Additionally, the intervening-gear ratios are allowed to alter in the prespecified range to obtain the most optimal configuration. Two optimum sets of selected ratios correspond to the minimum fuel consumption and the minimum NO x emissions.
The purpose of this is to ascertain whether the fuel consumption and the NO x emissions can be reduced by using a four-speed gearbox, a five-speed gearbox or a six-speed gearbox.
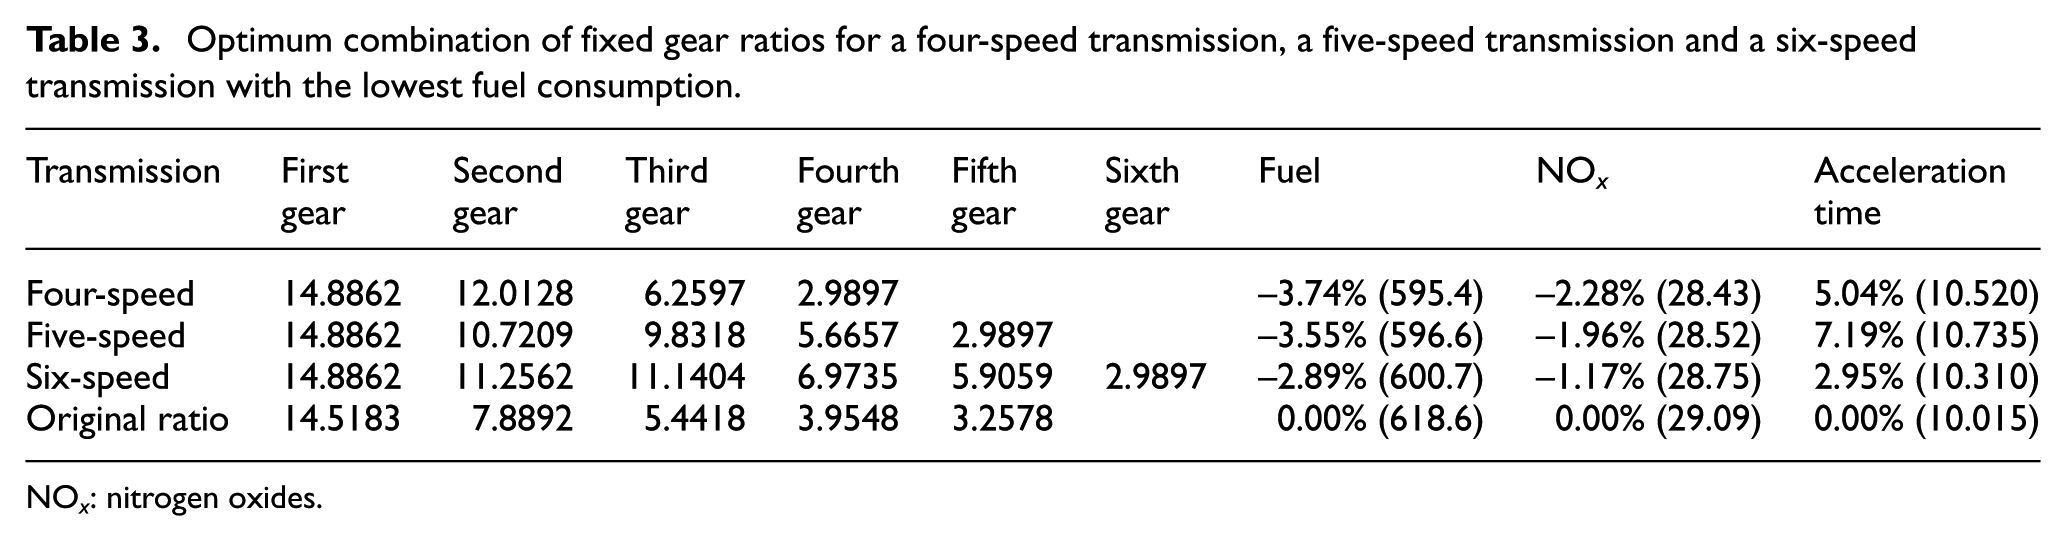
The results in Table 3 show the optimum combination of gear ratios for a four-speed transmission, a five-speed transmission and a six-speed transmission yielding the lowest BSFC. All these transmission configurations reduce the fuel consumption and the NO x emissions during the NEDC in comparison with those of the original configuration of the vehicle. The four-speed gearbox gives the greatest reductions in the BSFC and the NO x emissions, namely 3.74% and 2.28% respectively.
Optimum combination of fixed gear ratios for a four-speed transmission, a five-speed transmission and a six-speed transmission with the lowest fuel consumption.
NO x : nitrogen oxides.
The results also show that the 0–60 mile/h acceleration time is increased for all the optimum gearbox configurations. Therefore, there is a trade-off between the acceleration performance and the improved BSFC and NO x emissions. However, the percentage deterioration in the acceleration performance is negligible, with the worst case adding a mere 0.5 s to the current installed vehicle configuration.
The optimum second-gear ratio and third-gear ratio for the six-speed transmission and five-speed transmission are very close. This suggests that one of these gear pairs should ideally be removed to reduce the manufacturing and assembly costs.
The European emissions legislation is becoming more stringent on NO x emissions. As an approach, the transmissions may be redesigned to reduce these emissions and to meet the requirements of the directives. The results in Table 4 show the optimum combination of gear ratios for a four-speed transmission system, a five-speed transmission system and a six-speed transmission system with the lowest NO x emissions. The results show that all the optimum alternatives can significantly improve on the current vehicle transmission and all have reduced fuel consumption values. The four-speed alternative shows the greatest improvement in reducing the NO x emissions and improving the BSFC by 3.03% and 2.89% respectively.
Optimum combination of fixed gear ratios for a four-speed transmission, a five-speed transmission and a six-speed transmission with the lowest NO x emissions.
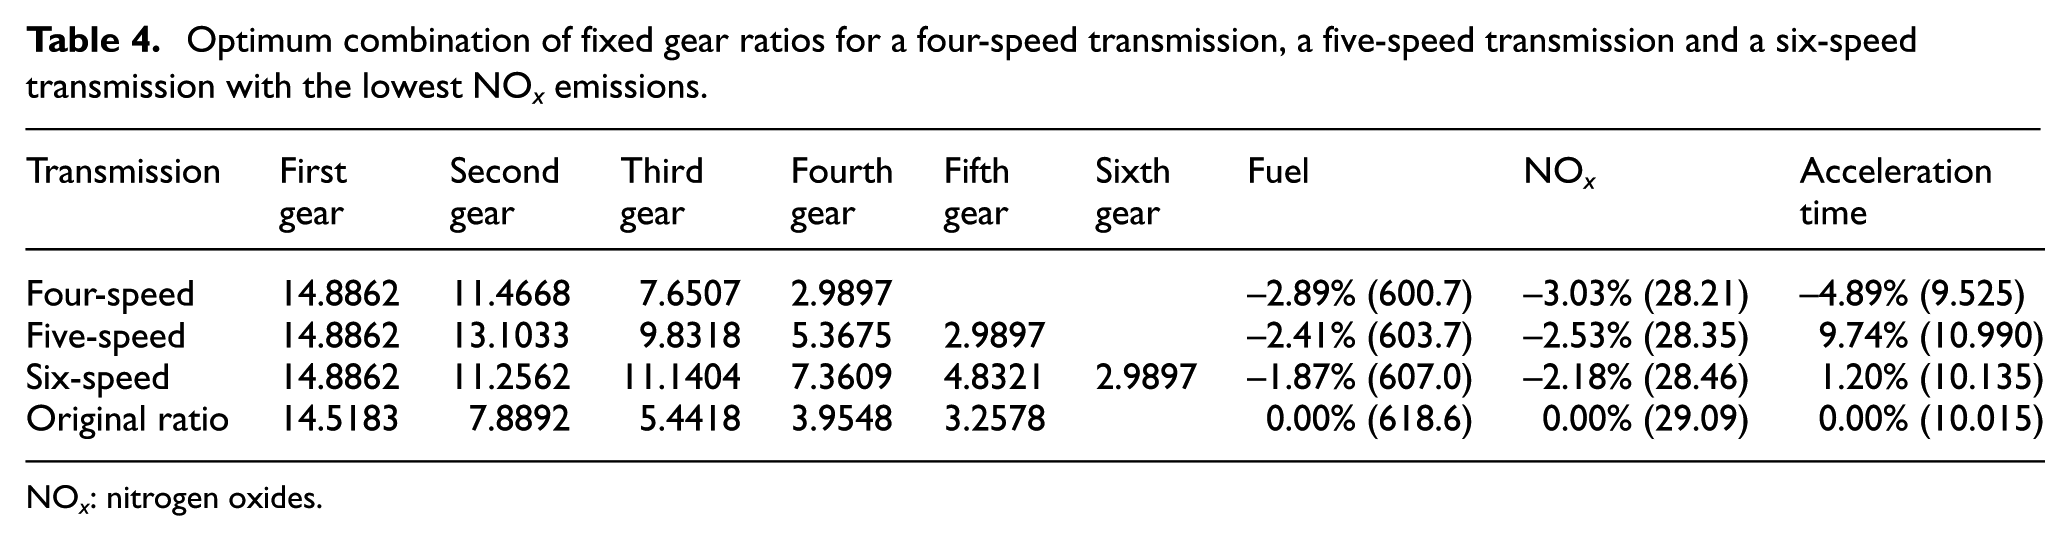
NO x : nitrogen oxides.
The acceleration performance (0–60 mile/h) has increased in time, when compared with the current configuration, for the five-speed transmission and the six-speed transmission, but the optimum four-speed version in fact shows an improved acceleration performance.
Although various four-speed configurations show the lowest fuel consumption and the lowest NO x emissions (based on the fixed-speed gear-shifting strategy), they can have other disadvantages from the viewpoints of driveability and comfort. With widely apart gear ratios, large variations in the performance can ensue, which makes timely and smooth gear shifting difficult, somewhat putting the onus on the driver of a manual system.
Metric-based gear-shifting strategies
The previous section dealt with alternative transmission configurations (i.e. fixed-ratio gear shifting of n-speed transmissions, n = 4, 5 or 6). Two different four-speed gearboxes were found to provide an optimum performance based on fixed gear-shifting strategies. These two alternatives are not necessarily the most optimum, since other shifting strategies such as that based on the metric of minimum fuel consumption or on the metric of minimum NO x emissions should be investigated.
Case (i): optimising for minimum fuel consumption
The approach adopted here is to determine a new gearbox configuration which yields the lowest BSFC.
Driving-cycle simulations are carried out using the minimum BSFC as the adopted performance metric for the gear-shifting strategy rather than upshifting according to a predetermined vehicle or engine speed.
The results are shown in Table 5, indicating that the six-speed transmission achieves the lowest BSFC during the NEDC. Therefore, the gear ratio optimisation process is carried out for the six-speed transmission system.
Lowest-fuel-consumption gear ratios for a four-speed transmission, a five-speed transmission and a six-speed transmission with the lowest BSFC transmissions (i.e. the minimum-BSFC gear-shifting strategy).
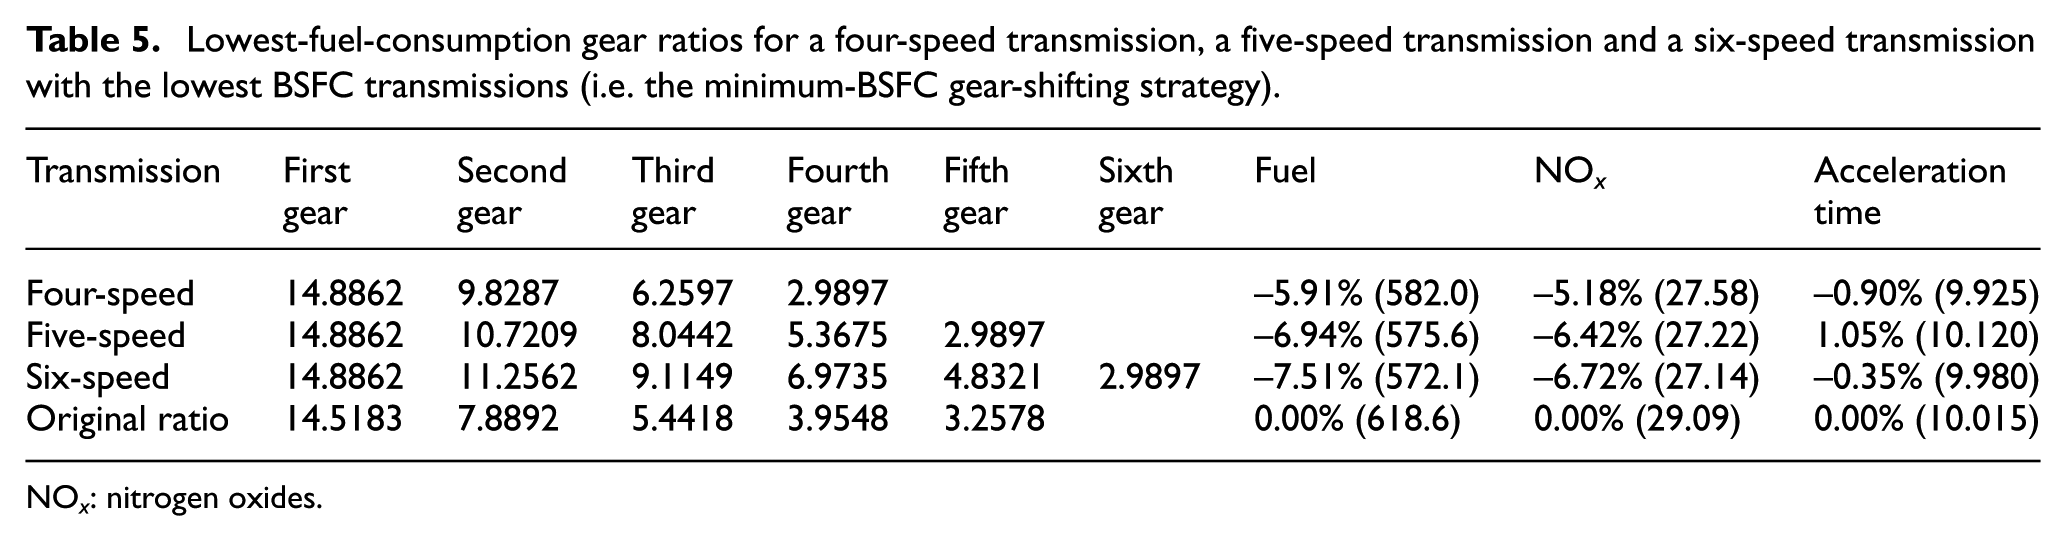
NO x : nitrogen oxides.
Thus far, all the simulation studies have used a discrete set of gear ratios and combinations. The simulation results in this section can be used in an optimisation process for a continuous range of gear ratios. AVL CAMEO was selected as the optimisation tool. 24 It is a multi-objective optimisation tool and thus suitable for the current study. It is based on a genetic algorithm. 24
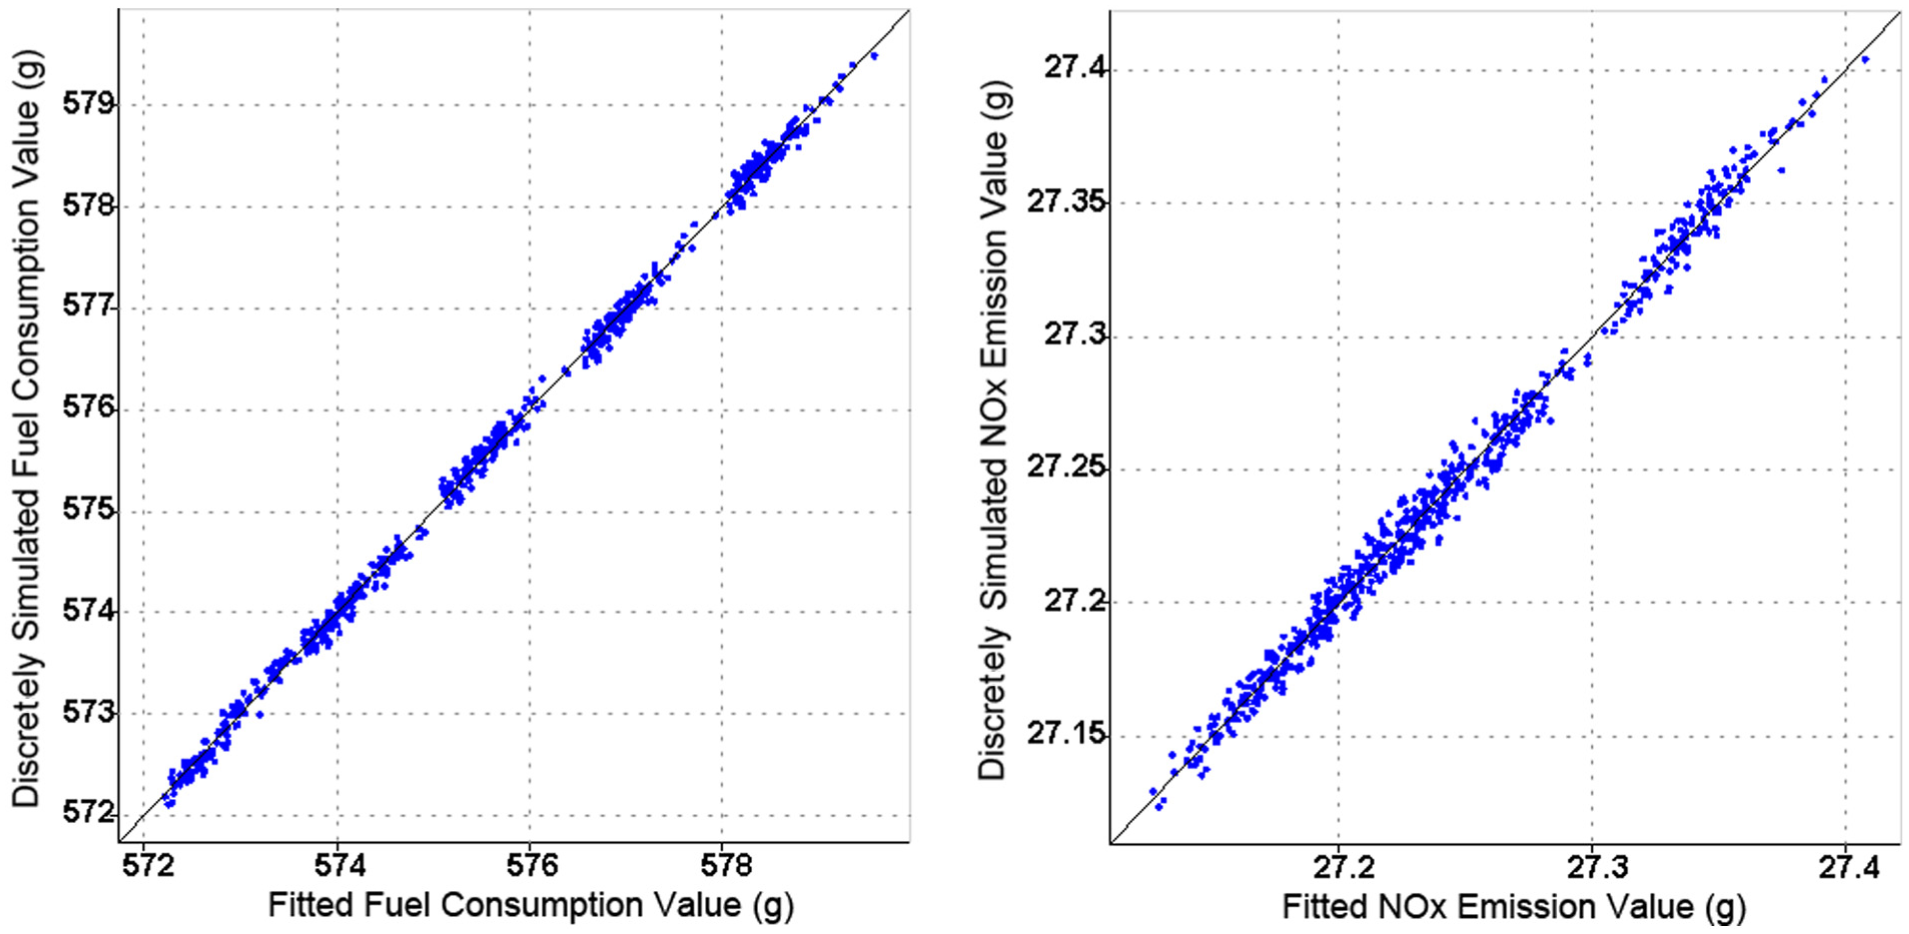
The matrix of the results for all the gear ratios and combinations from the driving-cycle simulations are imported into CAMEO, which fits the data to a continuous range of variables. An accurate data fit is essential for the quality of the optimisation process as these fitted values are used within the optimisation itself. Figure 9 shows the fitted results versus the discretely obtained simulation results. A goodness of fit is achieved.
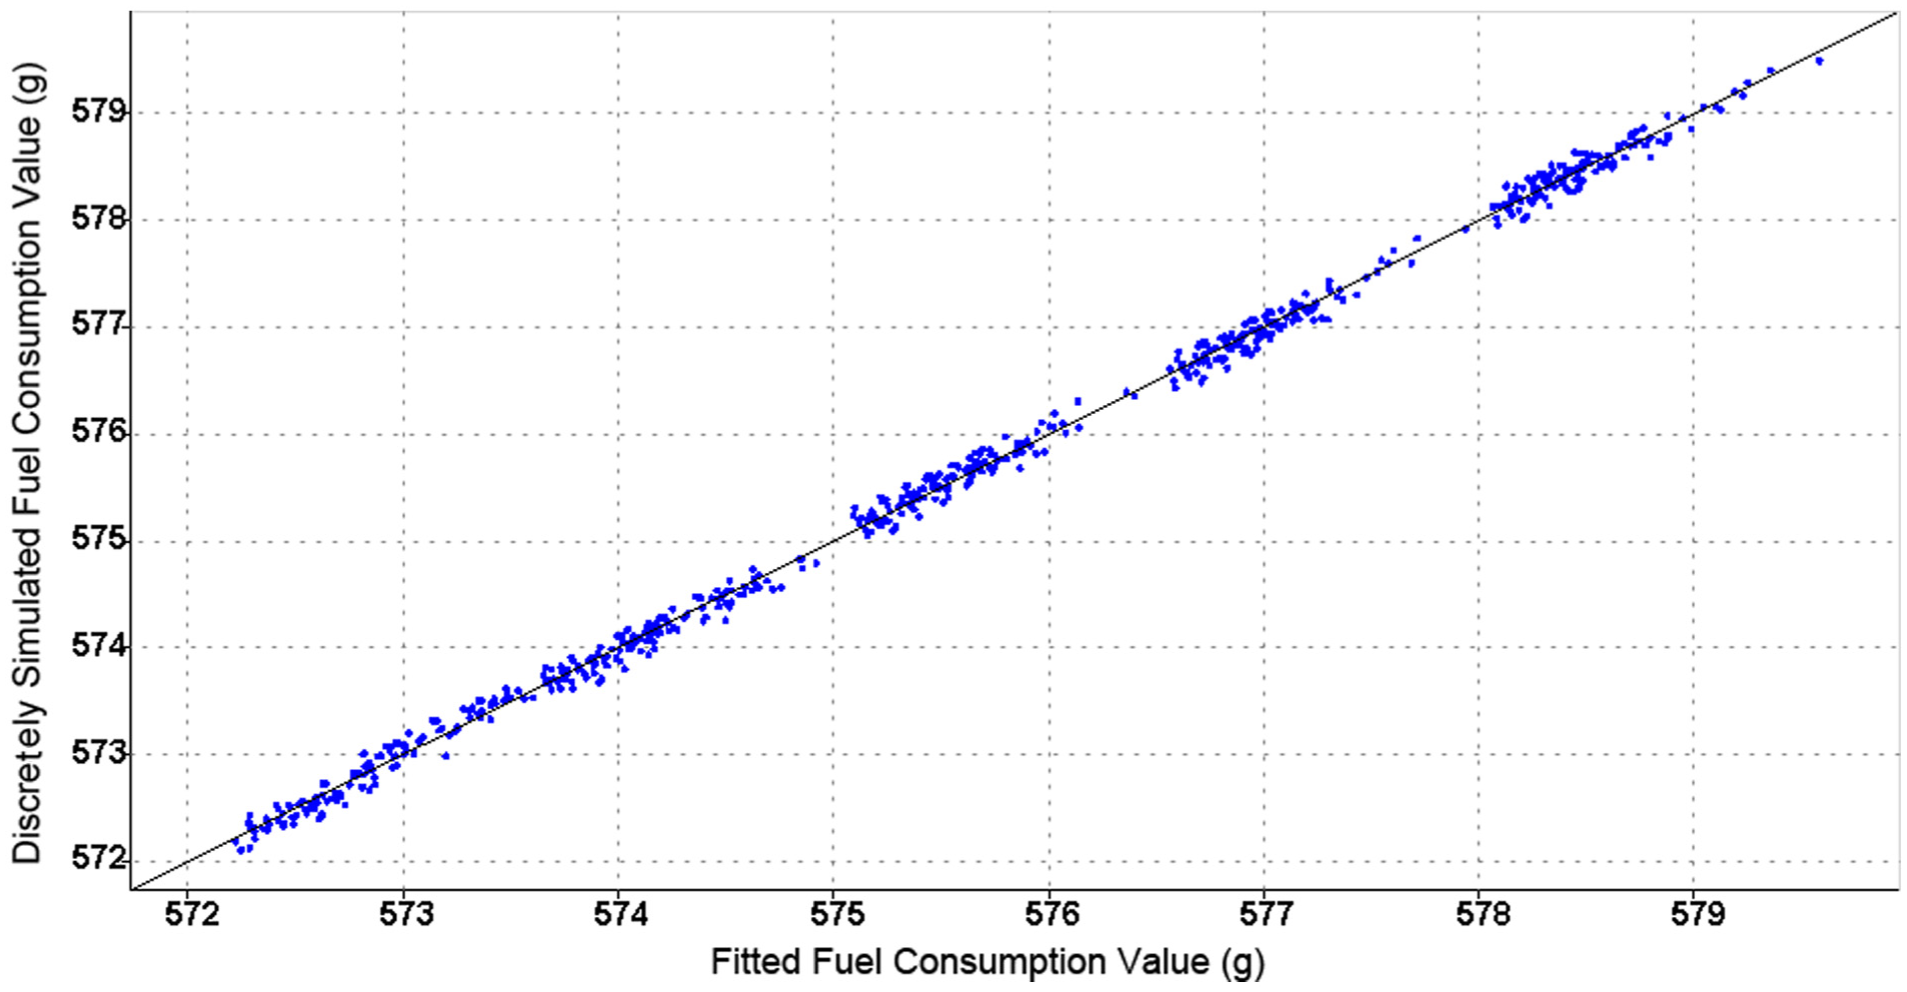
Fuel consumption measured and predicted data obtained using AVL CAMEO.
A single-objective optimisation was carried out with AVL CAMEO to find the gear ratio set with the lowest fuel consumption. An optimum set of gear ratios is found as presented in Table 6.
Optimised gear ratios for the minimum BSFC.
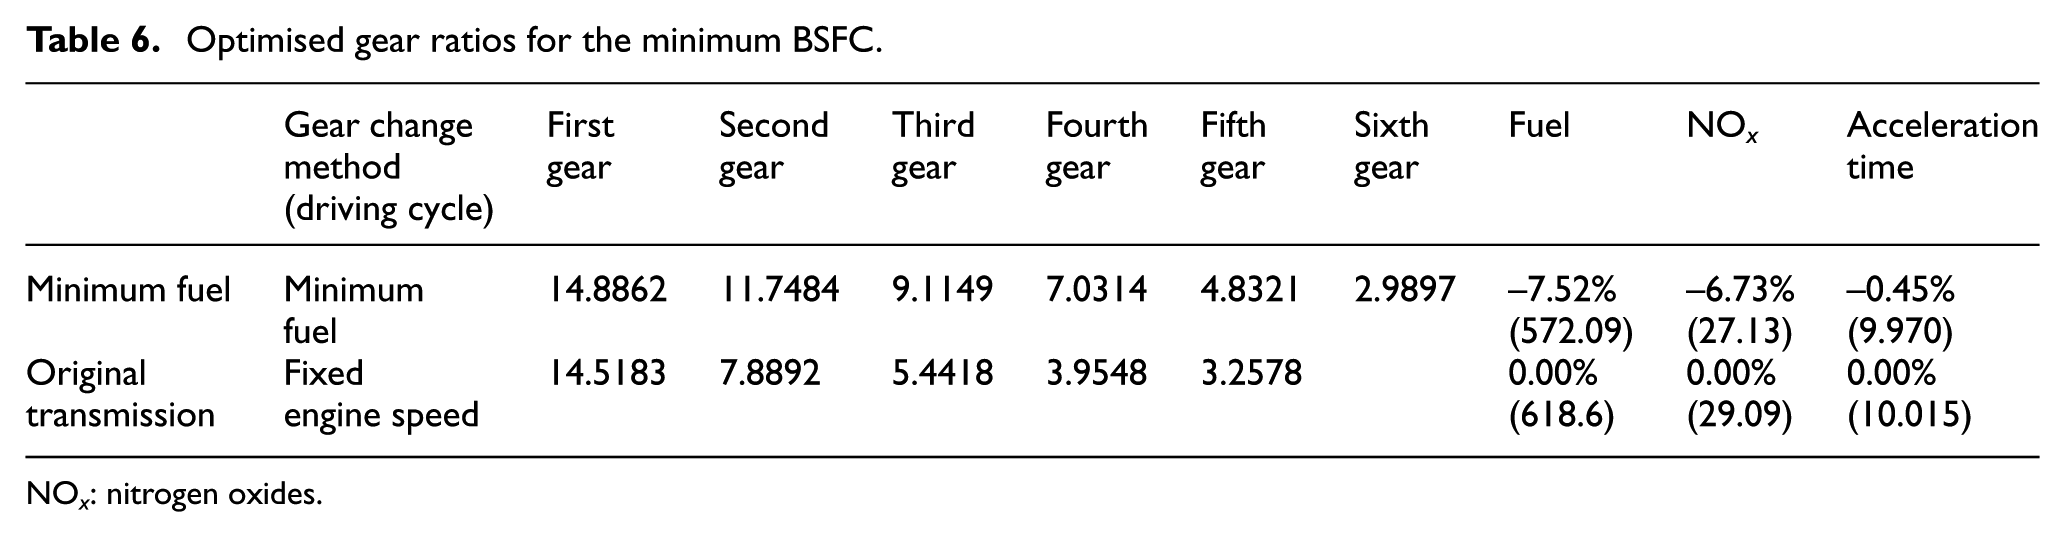
NO x : nitrogen oxides.
The results show that a further improvement in the BSFC can be achieved when the gear-shifting strategy is based on metric-based gear ratios rather than merely on the vehicle speed. The fuel consumption can be further reduced by 7.52%. The NO x emissions can also be reduced by 6.73%, and the vehicle acceleration performance deteriorates only slightly by 0.45% in comparison with the values for the original vehicle transmission and the original gear-shifting strategy. As a six-speed transmission is more expensive to design and manufacture than the four-speed alternatives are (described in the previous section), then any reductions in the BSFC and reductions in the NO x emissions should justify the increased costs.
Figure 10 shows the fuel consumption (g/s) map and a comparison of the engine operating points during the NEDC for the original gearbox configuration and the optimum six-speed gearbox with the gear-shifting strategy based on the lowest BSFC. It can be seen that the optimum gearbox configuration shifts the engine operating points to a more efficient region of the map.
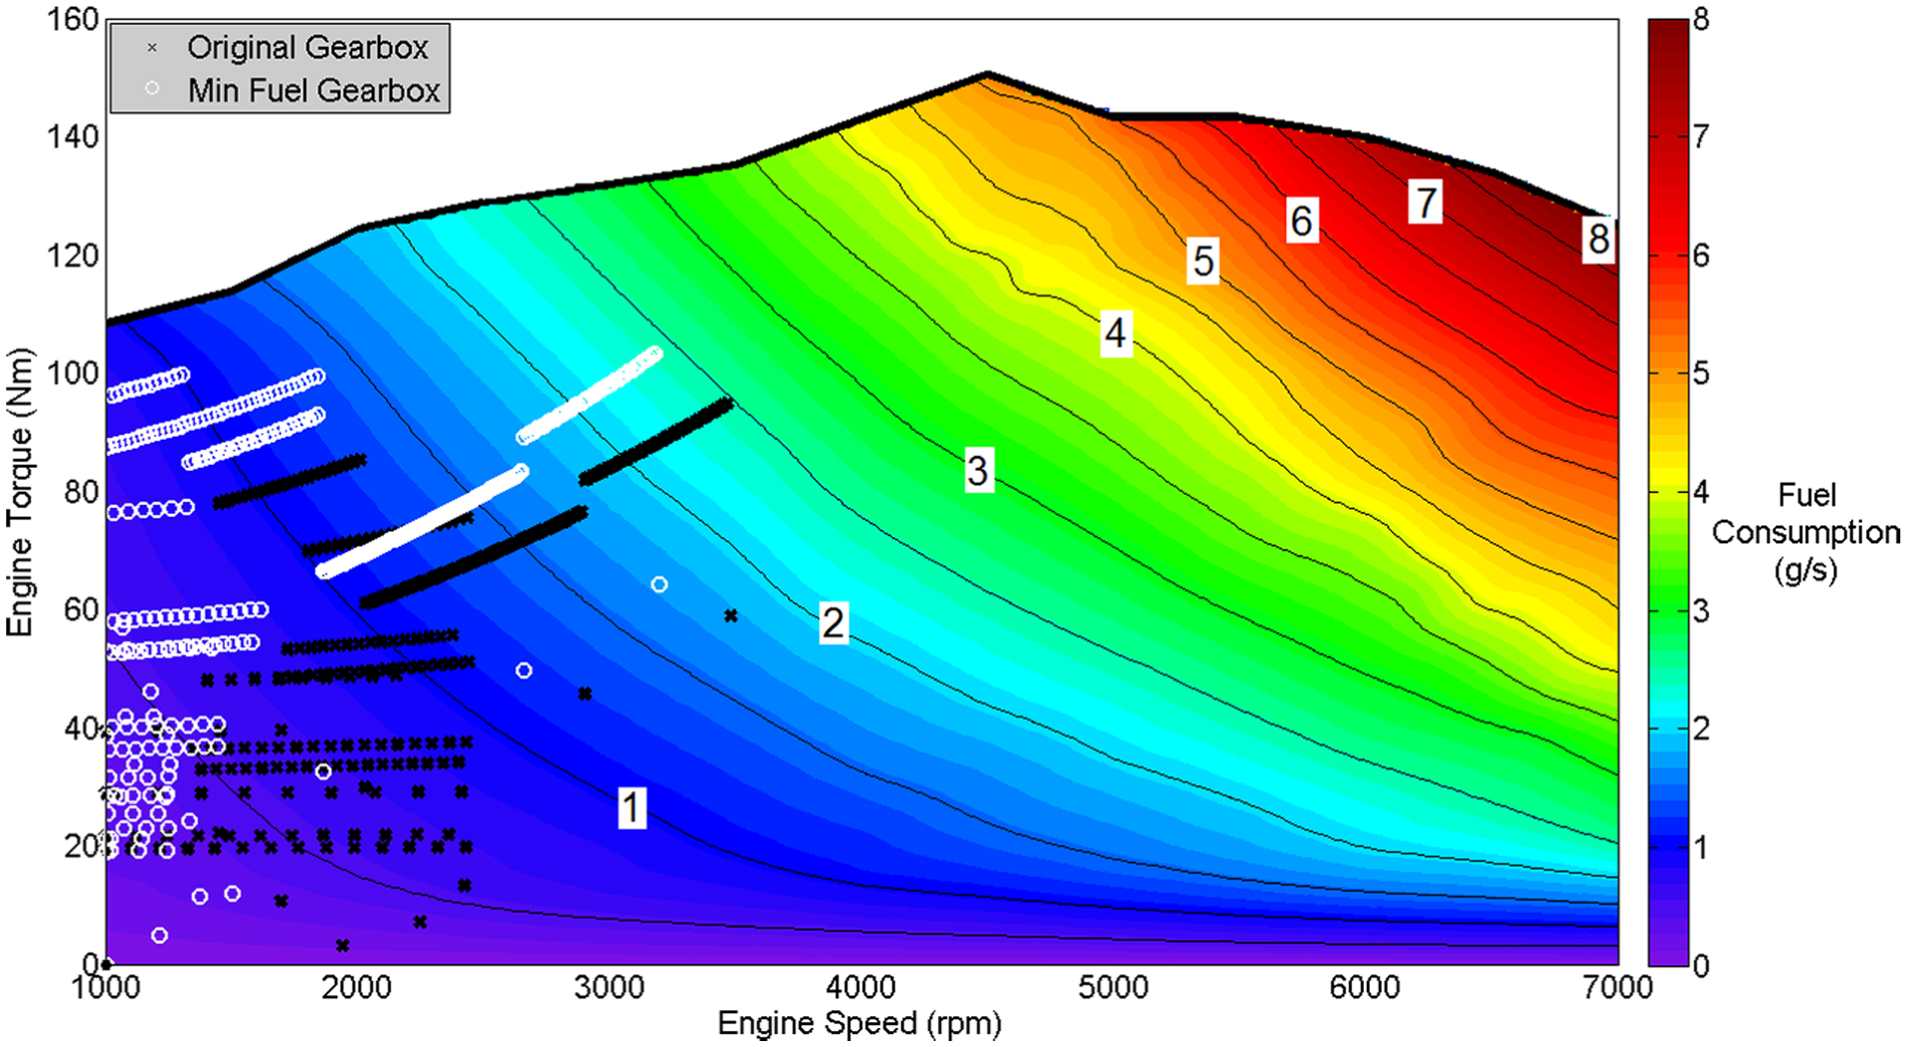
Fuel consumption map and comparison of the engine operating points during the NEDC.
Case (ii): optimising for the minimum NOx emissions
For this optimisation the selected metric is the minimised NO x emissions. This is a desired outcome for meeting the stringent European emissions legislation. NEDC simulations are carried out using the minimum NO x emissions to determine the new gear-shifting strategy for various speed transmissions.
Table 7 shows that the lowest NO x emissions during the NEDC can be achieved with a six-speed transmission using the minimum-NO x -emissions gear-shifting strategy. Therefore, gear ratio optimisation is carried out for the six-speed transmission.
Lowest NO x emissions for a four-speed transmission, a five-speed transmission and a six-speed transmission.
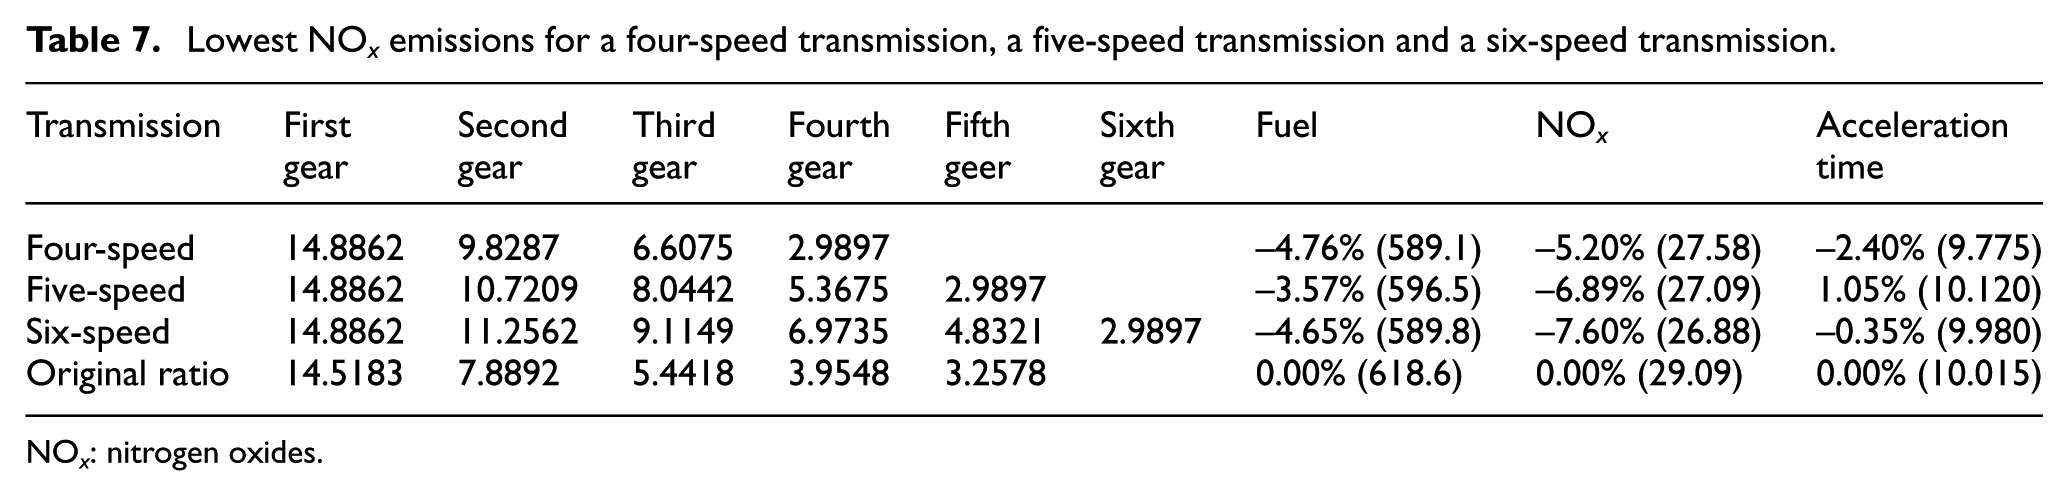
NO x : nitrogen oxides.
The matrix of discrete results for all the gear ratios and combinations from the driving-cycle simulations are imported into AVL CAMEO so that an optimum result can be determined. CAMEO is then used to model and fit the simulation-based data. Figure 11 shows the satisfactory goodness of fit to the discrete simulation results.
NO x emissions measured and predicted data obtained using AVL CAMEO.
NO x emissions rate map and comparison of the engine operating points during the NEDC.
A single-objective optimisation based on the lowest NO x emissions is carried out to find the optimum set of gear ratios. The results are presented in Table 8.
Optimum minimum-NO x -emissions gear ratios for a four-speed transmission, a five-speed transmission and a six-speed transmission.
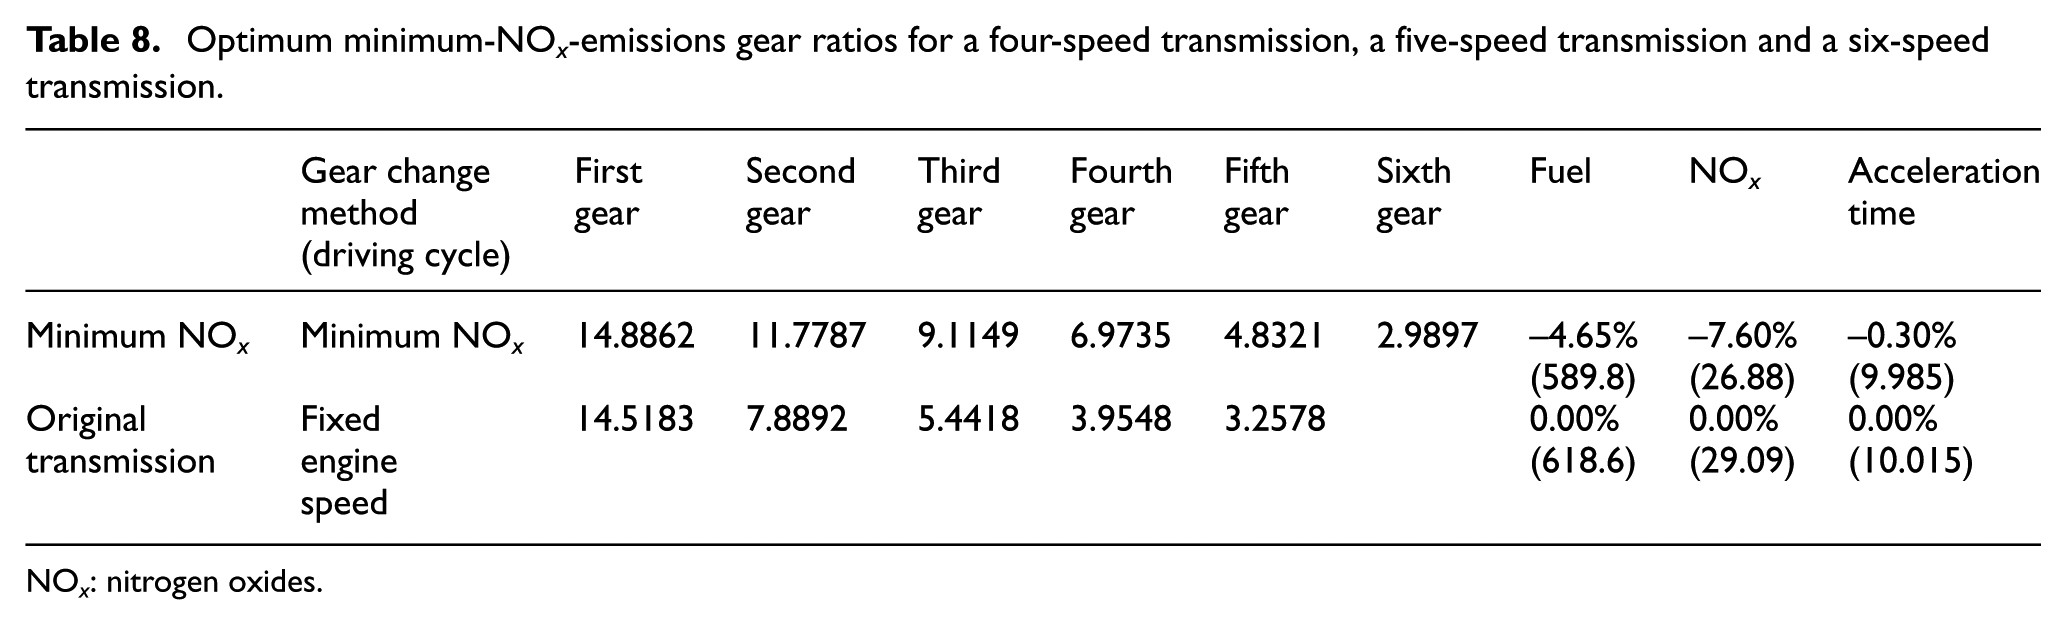
NO x : nitrogen oxides.
The results show that the NO x emissions can be reduced by 7.6% and the fuel consumption by 4.65% in this case, as well as the acceleration performance by 0.3%.
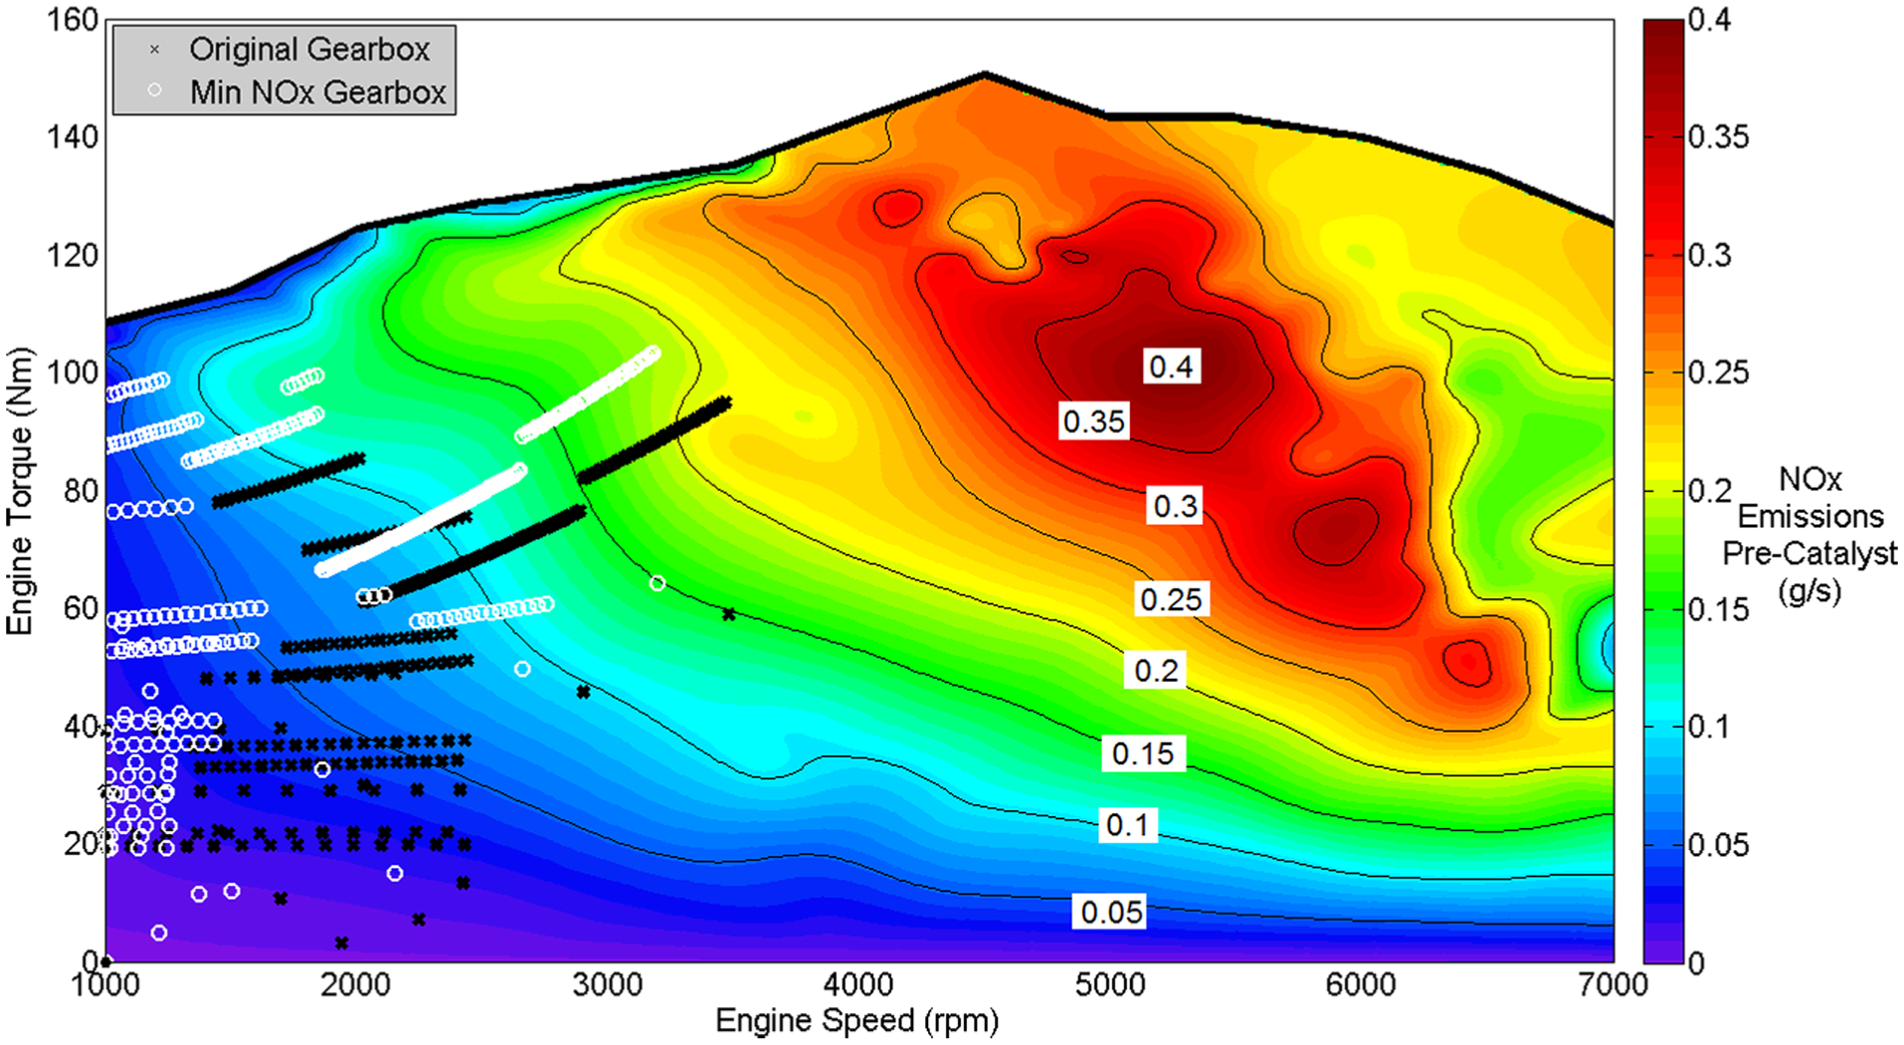
Figure 12 shows the engine NO x emissions rate (g/s) map and a comparison of the engine operating points during the NEDC for the original gearbox configuration and the optimum six-speed gearbox. It can be seen that the optimum gearbox configuration shifts the engine operating point to more efficient regions of the map with lower NO x emissions (g/s).
Case (iii): trade-off between the minimum fuel consumption and the minimum NOx emissions
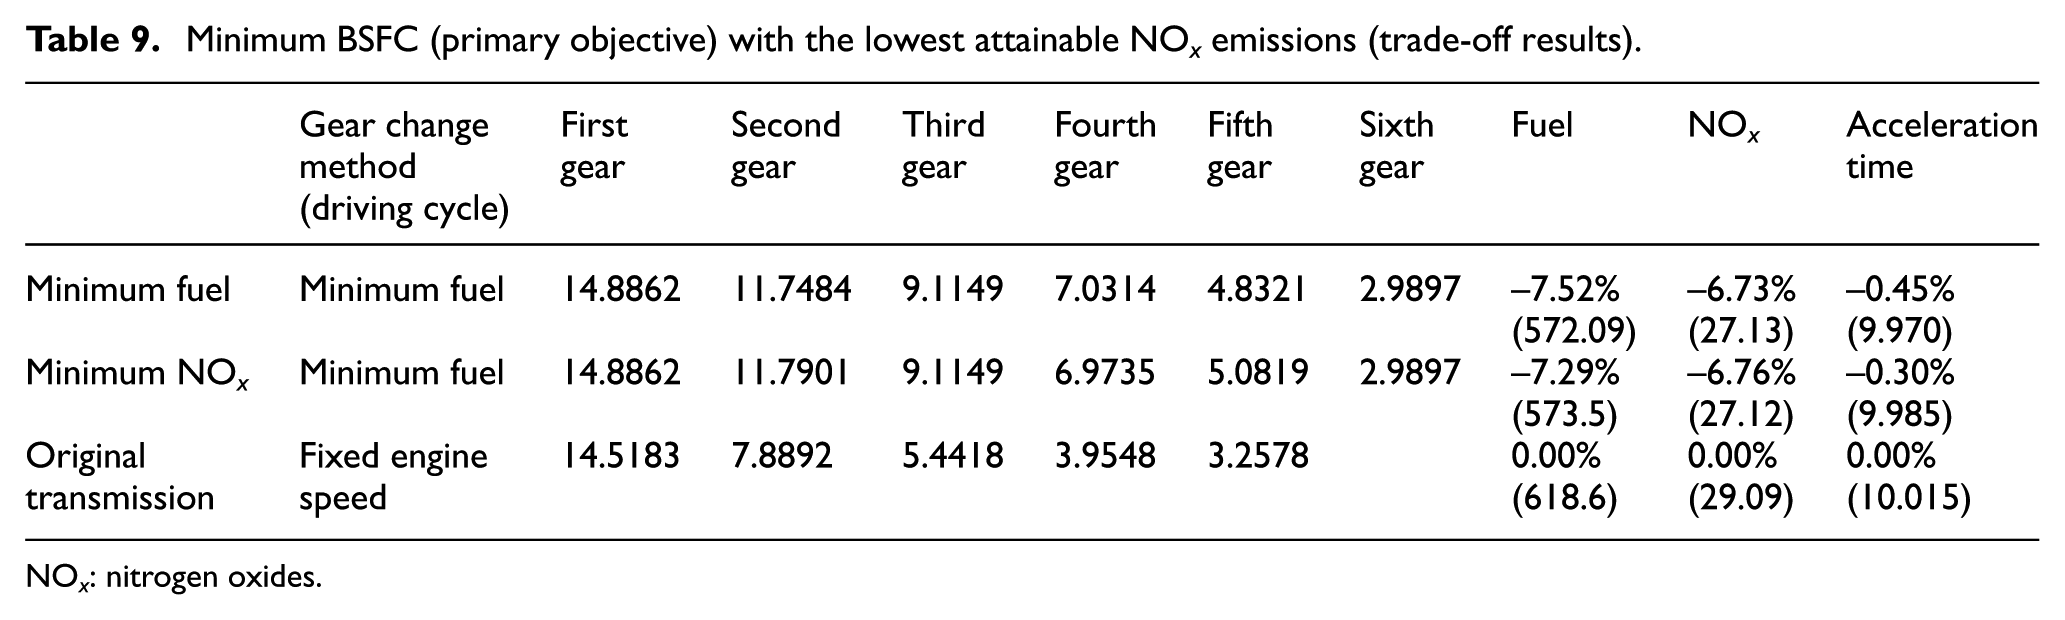
Both the BSFC and the NO x emissions are clearly important from a commercial viewpoint as well as a legal perspective. Therefore, multi-objective optimisation is the ideal approach, in this case with both these metrics as objective functions. The results of case (i) and case (ii) clearly show that, with a unitary objective function and a given transmission configuration, an appropriate gear shift indicator can be developed. In the case of multi-objective problems, clearly a degree of trade-off or priority weighting should be used between the intended outcomes. In the case studied here, Tables 6 and 8 yield two sets of gear ratio outcomes. However, the car can be driven with only a unique gear-shifting strategy. In this case, the minimum-BSFC objective is chosen as the primary objective because larger reductions in both the fuel consumption and the NO x emissions can be attained.
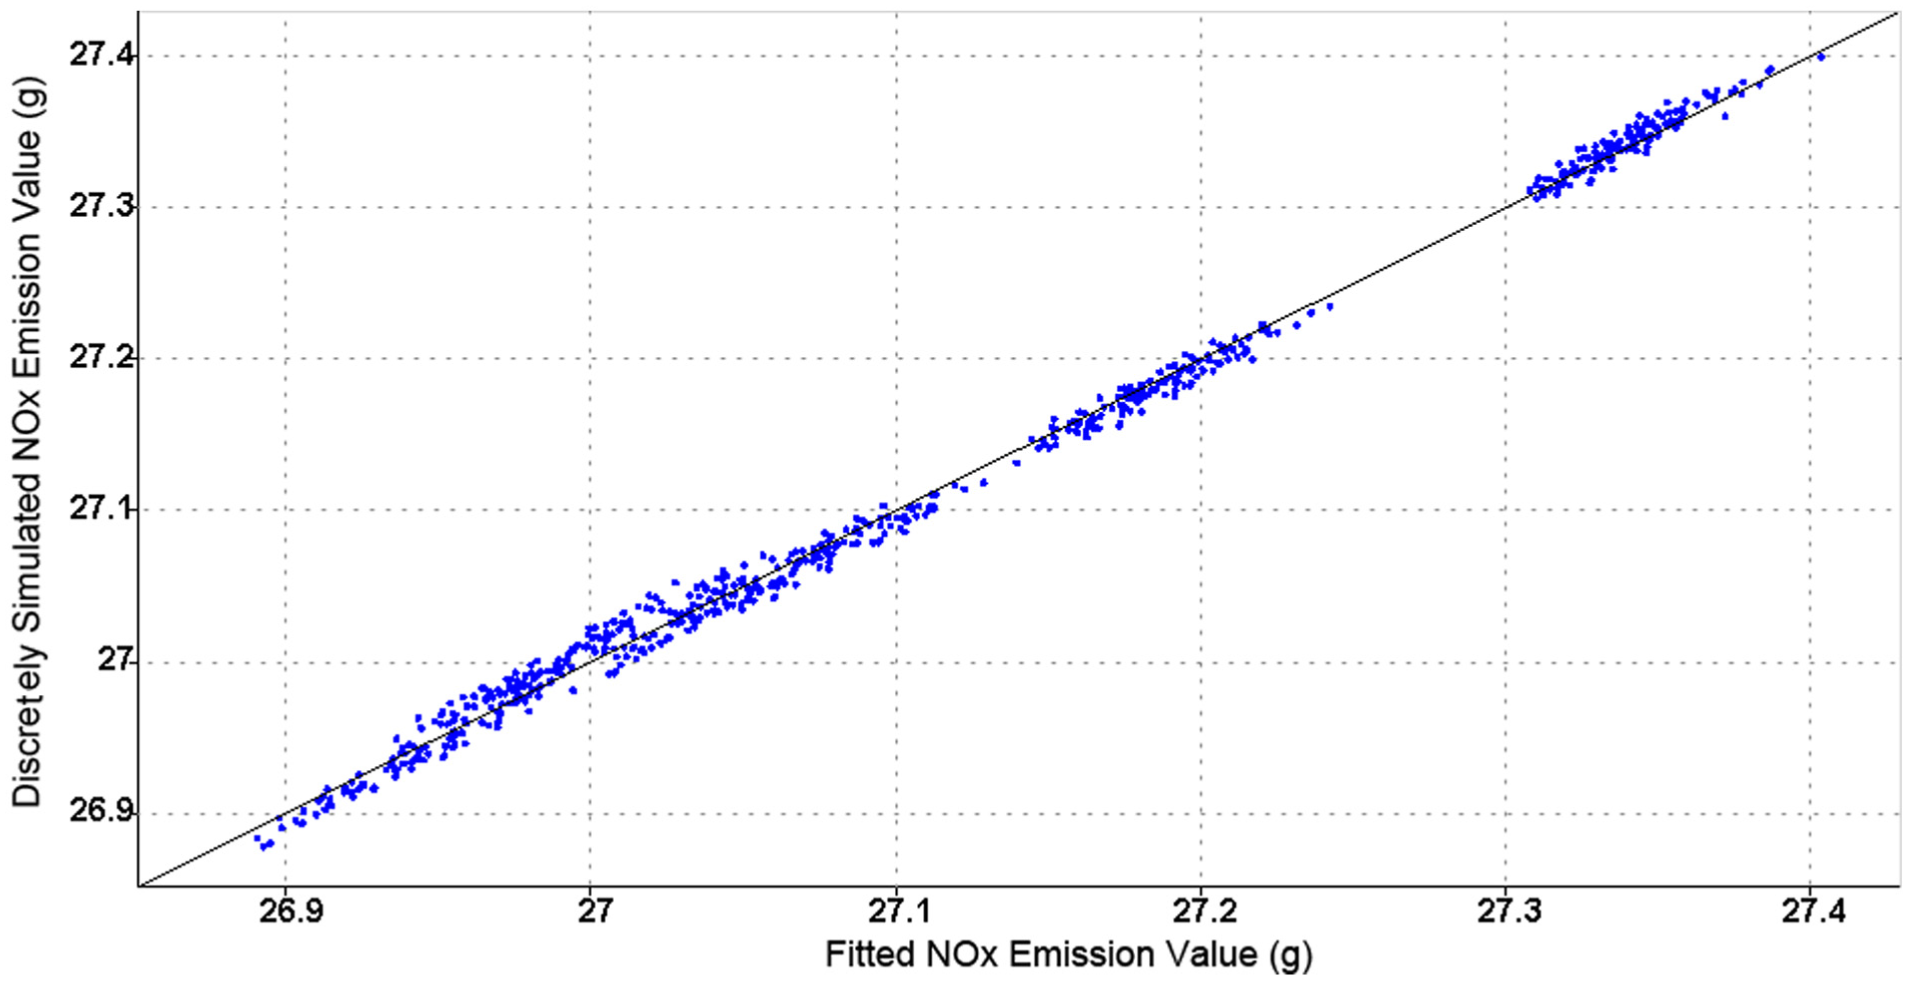
The previous results have shown that the lowest fuel consumption and the lowest NO x emissions during the NEDC are achieved with a six-speed transmission for the vehicle under consideration. The matrix of all the NEDC simulation results for all the gear ratios are imported into the optimisation process. The software is then able to model and fit the fuel consumption and the NO x emissions data. Predictions are made for both the fuel consumption and the NO x emissions for any set of gear ratios with a high degree of confidence. This is shown for both set of results fitted by the optimisation routine against the discrete simulated values in Figure 13, showing high degrees of conformance.
Fitted fuel and NO x trends versus discretely simulated results.
A multi-objective optimisation is then carried out using CAMEO to find the optimal gear ratios with the lowest fuel consumption and the best attainable NO x emissions as both criteria cannot be fully optimized. A ‘Pareto front’ graph is shown in Figure 14. All the predicted fuel consumption levels and the corresponding NO x emissions for the various determined gear ratios are shown in the figure. The dark curve at the bottom highlights the Pareto front outcome.
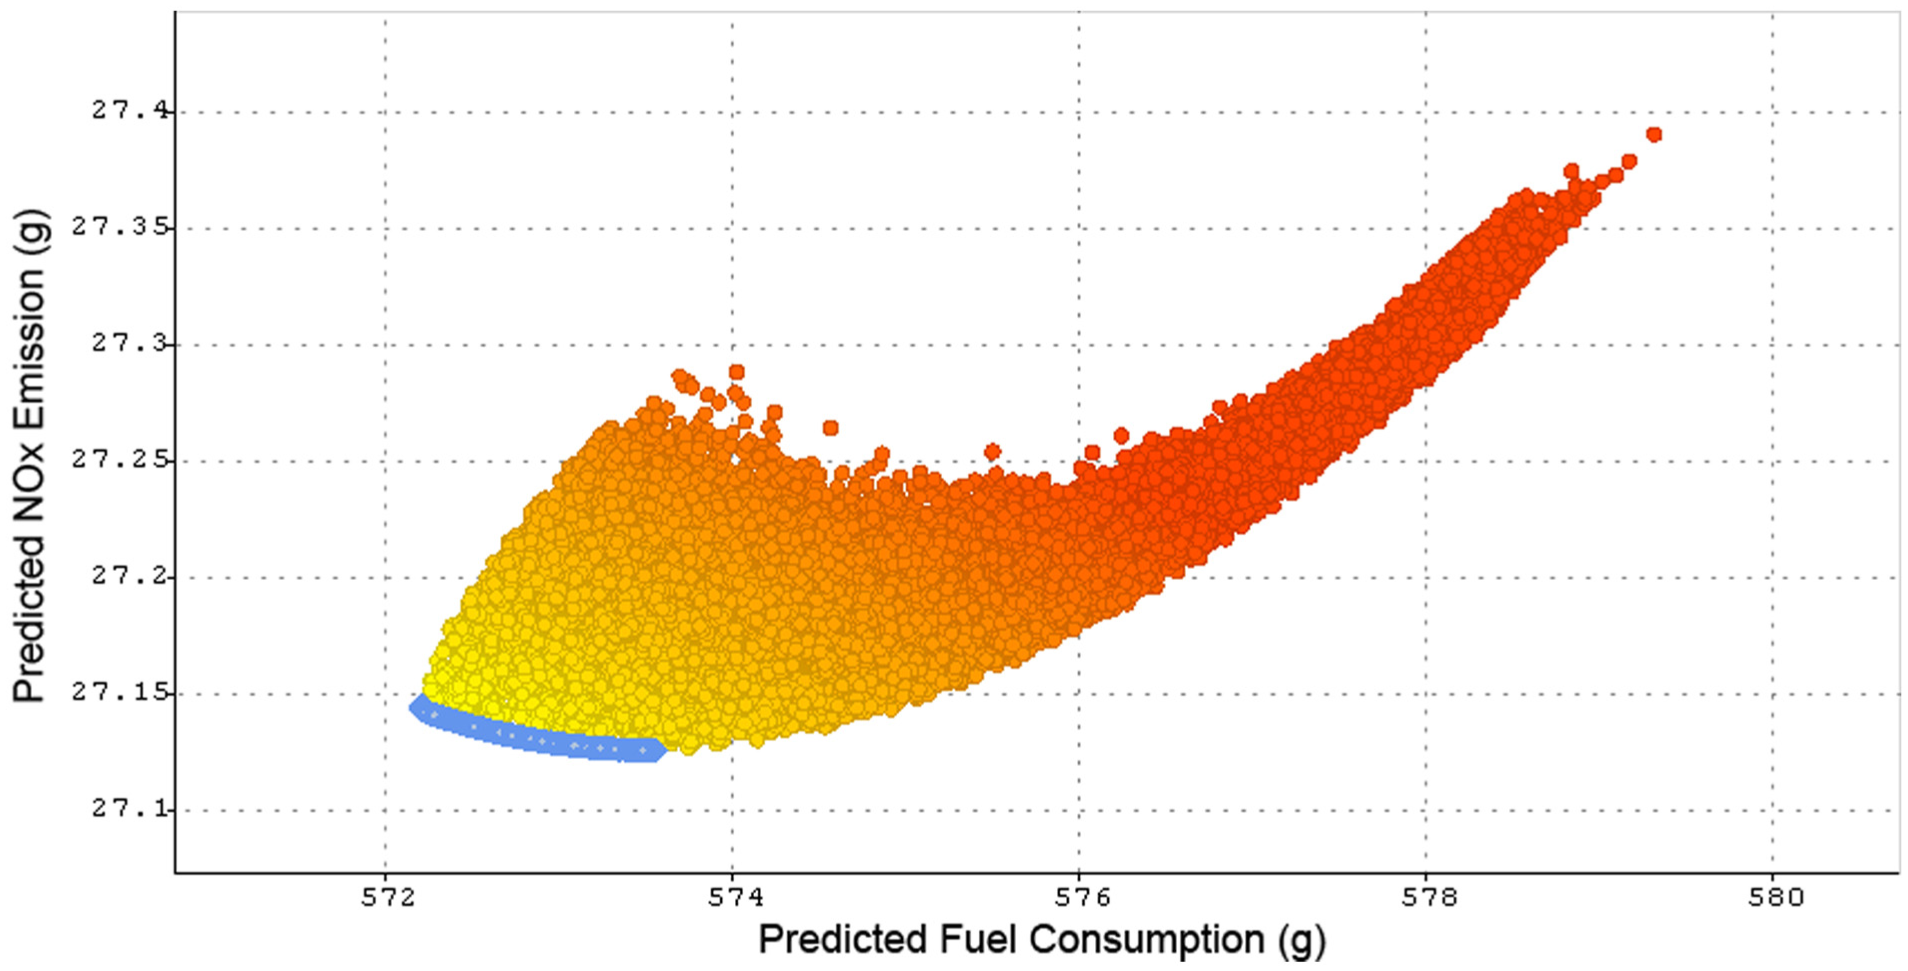
Pareto front of the minimum fuel consumption and the minimum NO x emissions.
The two optimum gear ratio sets with the minimum BSFC and the lowest simultaneous NO x emissions are presented in Table 9.
Minimum BSFC (primary objective) with the lowest attainable NO x emissions (trade-off results).
NO x : nitrogen oxides.
The results show that, for the minimum fuel consumption and the lowest NO x emissions on the Pareto front, there is a difference of 0.25% in the fuel consumption and 0.037% in the NO x emissions. The optimum gear ratio set depends on the importance attached to these criteria in the optimisation process. However, there is only a small reduction in the NO x emissions compared with the possible reduction in the fuel consumption, meaning that the gear ratio set corresponding to the minimum BSFC yields the best outcome in the case studied.
Conclusion
The paper outlines a novel computationally efficient analytical method to evaluate the fuel consumption and the NO x emissions during simulations of the driving cycle. It also provides a good test of the vehicle acceleration performance. The vehicle performance during an NEDC is assessed and verified against measured experimental tests reported elsewhere. 7
The method sets the first-gear ratio based on an adequate vehicle hill climb performance. The top-gear ratio is selected for the lowest BSFC in highway driving conditions. The intervening-gear ratios for various four-speed, five-speed and six-speed transmission configurations are calculated on the basis of the optimal BSFC or NO x emissions and optimised using a genetic-algorithm-based optimisation routine CAMEO.
It is shown that with the minimum BSFC as the primary objective function, choosing a determined set of optimum gear ratios and altering the gear-shifting strategy results in a reduction in the BSFC of 7.52% and a reduction in the NO x emissions of 6.73% relative to the original fixed-speed gear shifts. With the NO x emissions level as the primary objective, optimisation of gear ratios leads to a reduction of 7.6% in the NO x emissions with a decrease of 4.65%in the BSFC. In the optimised cases a six-speed transmission shows the best outcome in comparison with those for the four-speed transmissions and five-speed transmission, but clearly with increased manufacturing costs.
The computationally efficient analytical simulation as well as rapid scenario-building optimisation enable application of the methodology to gear shift indicator technology, thus embedding a certain degree of inherent intelligent feedback to the drivers of manual transmission. For other transmissions, this action can be automated.
The current study concentrated on the fuel consumption and the NO x emissions. In order to show the ultimate potential, maximum flexibility and fewer constraints were considered in the model. In reality, the efficiency and the emissions may show contradictory behaviour to the ride comfort of the vehicle. For example, the optimum gear ratios for the best fuel economy and emissions may cause the driveability or the shifting quality to deteriorate. The shifting quality can be mitigated by using technologies such as an automated manual transmission in order to reduce the side effects of the performed optimisation.
The presented model and conclusions are based on the overall drivetrain ratios as shown in Tables 3 to 8. Therefore, engineers will have the flexibility to optimise further the specific ratio of the transmission and the final drive to achieve a desired configuration such as a direct-drive transmission or an overdrive transmission. This is important since the direct-drive configuration provides a potentially simpler and lighter design.
Considering the importance of implementing real-world driving cycles such as the WLTC, the same model can be used to optimise the transmission on these new driving cycles in the future.
Footnotes
Appendix 1
Acknowledgements
The authors would like to express their gratitude to AVL for allowing access to the optimisation software CAMEO.
Declaration of conflicting interests
The author(s) declared no potential conflicts of interest with respect to the research, authorship, and/or publication of this article.
Funding
The author(s) received no financial support for the research, authorship, and/or publication of this article.