
Abstract
The optimal design of driveline components in passenger vehicles requires detailed knowledge of the effects that load case scenarios introduce into the system. In many cases the latter are difficult to obtain, since a large number of tested cases are required experimentally. Excessive torque loading often occurs during driveline ‘clutch abuse’ events, where the clutch is suddenly engaged and a transient power wave is transmitted across the driveline. This work details the development and validation of a numerical tool, which can be used to simulate such abuse scenarios. The scenario examined consists of a sudden clutch engagement in first gear in a stationary vehicle. The numerical model is validated against experimentally measured torque data, showing fairly good agreement. A set of parametric studies is also carried out using a numerical tool in order to determine the driveline parameters of interest, which affect the generated torque amplitudes.
Introduction
The design of automotive drivetrains introduces factors which influence the performance of modern vehicles, including energy efficiency, noise, vibration and harshness (NVH), durability, weight and cost. Targets, such as the requirement for a vehicle driving life of 240,000 km tend to become standards, affecting the durability perception. The strength requirements for drivetrain components are determined by considering the worst possible loading scenarios (widely known in industry as ‘clutch abuse’ cases), which arise when high torque demands are applied to the driveline because of sudden clutch engagements. The ability to describe accurately these drivetrain abuse scenarios allows the design of more energy-efficient and cost-efficient components. The above fundamental understanding of driveline behaviour also streamlines the entire design process, as the needs for prototype manufacture and testing are then significantly reduced. The majority of research studies available in the literature have focused on the NVH characteristics of drivetrains. This has become an increasingly important topic, since it directly relates to the comfort of the passengers and their perception about vehicle quality. Many of the methods already employed are directly transferrable to the current work.
In 1998, lumped-parameter drivetrain models were proposed by Rahnejat 1 to study clutch judder and whoop, as well as driveline shuffle and clonk. These phenomena are a mixture of low-frequency events (coupled clutch judder torsional vibrations and drivetrain shuffle longitudinal oscillations) and medium-frequency to higher-frequency events (clutch whoop translational vibrations and clonk transient driveline vibration impacts). Also, Couderc et al. 2 developed models to predict the driveline response of a front-wheel-drive (FWD) vehicle using linear elements while taking into account the non-linear effects of the gear backlash and the multi-stage dry friction clutch. The mode shapes and natural frequencies of the system were extracted, and the driveline time histories caused by different torque input data were produced. A bespoke experimental arrangement was constructed and the measurements using torque meters and accelerometers were in good agreement with the numerical results.
Crowther et al. 3 investigated the factors influencing clutch engagement judder and stick–slip motion. Of particular interest is their demonstration that the torsional vibrations incurred during clutch engagement are dependent on the slope of the friction coefficient used. Detailed equations were also derived, which describe the motion of the system under the two different scenarios of sticking and slipping. This has been discussed in greater detail by Karnopp, 4 who presented a method for simulating stick–slip friction, which is extensively employed in driveline simulations. The approach overcomes the occurring numerical issues when the slip velocity between two surfaces approaches zero, which introduces strong non-linearities. Serrarens et al. 5 developed a detailed clutch model using principles from the work by Karnopp 4 and a method to link the motion of the clutch and the motion of the flywheel without changing the total number of degrees of freedom in the model. This method is followed in the present work. Centea et al. 6 investigated the effects of the clutch frictional characteristics on judder. Many factors contributing to judder were found, and good correlation was seen between simulated and experimental results.
The modelling of gear meshing attributes in manual transmissions has been investigated by a number of researchers, including Omar et al. 7 and Tangasawi et al., 8 who developed gearbox models with torsional and translational degrees of freedom. Techniques involving linear and/or time-varying spring–damper elements have been employed, and the numerical results were verified experimentally both quantitatively (frequency domain) and qualitatively (time domain). Similarly, Singh et al. 9 developed mathematical models of driveline systems (both non-linear and linear) to study gear rattle. They used a piecewise linear representation of the teeth stiffness with backlash. Gnanakumarr et al. 10 and Theodossiades et al. 11 conducted theoretical and experimental investigations of transient torsional oscillations (clutch-induced driveline clonk) in a long-wheelbase rear-wheel-drive truck with a three-piece driveline. Good correlation was found between the predicted vibration frequency spectra and the experimental measurements. Further studies, such as those by Farshidianfar et al. 12 on clonk and shuffle simulations using a lumped-parameter model and by Farshidianfar et al. 13 on the parametric optimisation of the driveline NVH characteristics, have also been reported.
The novelty of this paper is in the study of automotive driveline transient abuse events (the vehicle’s impact start in this case) by simulating the system’s torsional oscillations. This is reinforced by the dearth of available literature on the examined topic, as well as the complexity of the presented model of a modern FWD driveline (as well as that of the physical system). The model was validated against experimental measurements taken from a vehicle equipped with a similar driveline, and it can be used as a platform for parametric studies of the driveline’s behaviour during similar events, such as the vehicle’s impact forward stop and impact reverse. Emphasis was placed on investigating the torque transferred through drivetrain components of interest while taking into account the effects of numerous backlash zones across the driveline. Initially, the modelling approach is presented for the formulation of the equations of motion, as well as some brief information about the procedure of the experimental measurements. A linearised driveline model is used to calculate the natural frequencies and the damping content of the system. Simulations of the full non-linear model were also carried out, allowing direct comparisons between the model and the actual tests taken from the studied FWD drivetrain to validate the accuracy of the simulations and the set of hypotheses employed when developing the proposed computer-aided engineering tool. The main conclusions and suggestions for future work are presented at the end of the paper.
Methodology
The subject of this work is the transient oscillations of FWD automotive drivetrains. The latter typically consist of a diaphragm spring manual clutch, a six-speed manual gearbox, a differential and driveshafts. A schematic diagram of this configuration is shown in Figure 1(a).
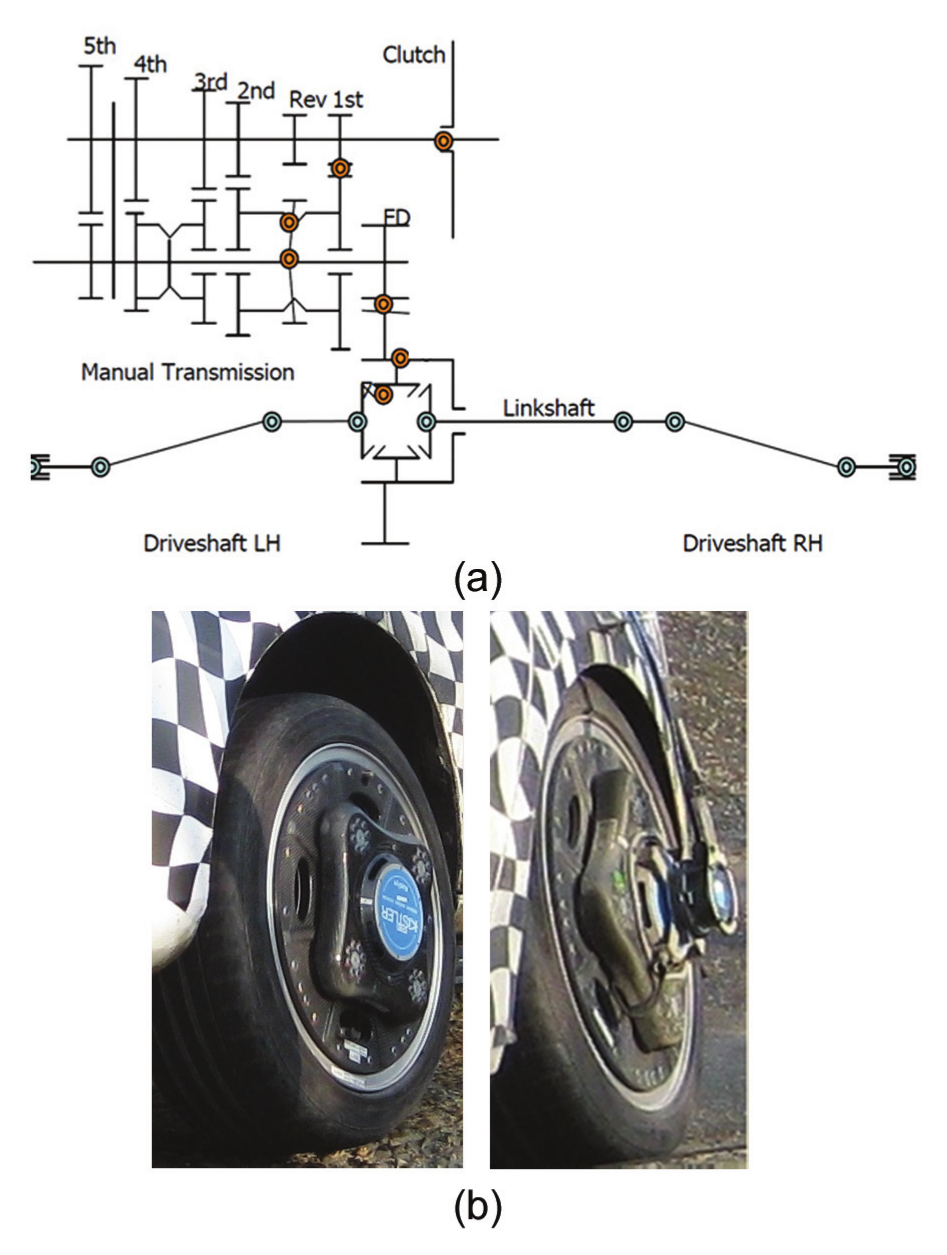
(a) The examined drivetrain configuration; (b) typical experimental set-up for wheel torque measurements.
Driveline abuse cases occur as a result of sudden clutch engagement in various driving conditions, introducing severe torque fluctuations in the collaborating components. The case when driveline impacts occur at the vehicle’s start-up motion is examined by employing the following operating conditions in the model simulations:
(a) vehicle at rest with the lowest gear selected;
(b) engine acceleration and abrupt clutch engagement with the throttle kept at a constant position (thus, it is considered that the clamping force on the clutch plates increases linearly from zero to its maximum value within 0.1 s).
The model results are compared with the experimental measurements obtained using a vehicle equipped with a similar FWD driveline during a manoeuvre that corresponds to the vehicle’s impact start in first gear as follows (following industry’s experimental protocol):
The vehicle is initially at rest; the brakes are released; then the first gear is selected and the clutch is disengaged.
The engine is accelerated to 2400 r/min.
The driver’s foot slips sideways from the clutch pedal.
Torque data are recorded during the above event using Kistler Roadyn wheel force transducers (mounted on the wheels as shown in Figure 1(b)) and the relevant direct data acquisition software for post-processing purposes. Thus, the applied forces are measured on the four load cells (as well as the vehicle coordinates) and are transformed into wheel torques.
Modelling the system dynamics
Since the main focus is on the transient torsional oscillations of the drivetrain, then only the rotational degrees of freedom of the interacting components are considered to describe the physics of the problem. Thus, the system is essentially divided into a number of main discrete inertia elements (lumped-parameter model), connected by the material rigidity and the hysteretic behaviour. The equations of motion are expressed in the matrix form (see Appendix 1 for the meanings of the symbols)
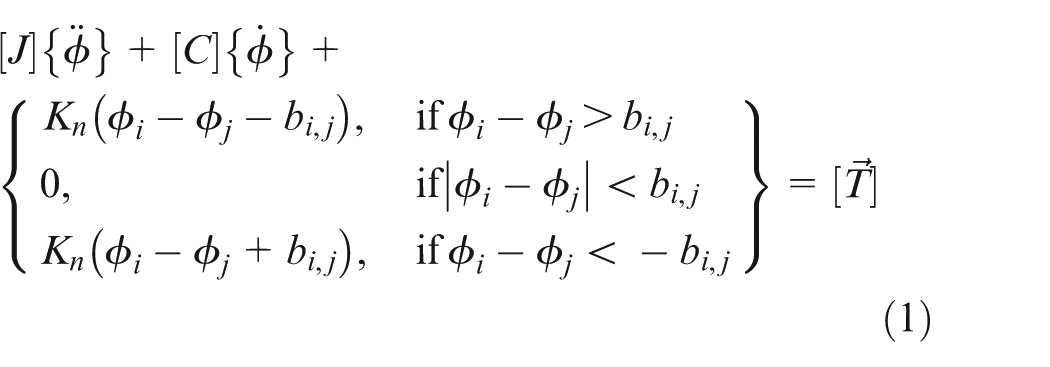
where [J] is the mass matrix, [C] is the damping matrix, Kn is the stiffness coefficient of the nth spring element (participating in the stiffness matrix [K]), [T] is the external excitation vector {ϕ} is the vector of the system’s independent degrees of freedom and bi,j is half the amount of backlash between the mating components i and j. The backlash zones introduce local non-linearities in the system and they can be modelled by employing piecewise linear functions, as shown in Figure 2 and in the paper by Singh et al. 9 The slopes on both sides of the graph are constant, corresponding to the torsional stiffnesses when the mating components are in contact. The gear teeth action was modelled by considering constant properties of the teeth meshing stiffness; this simplified approach was followed because of the limited time duration of the transient events of the drivetrain.
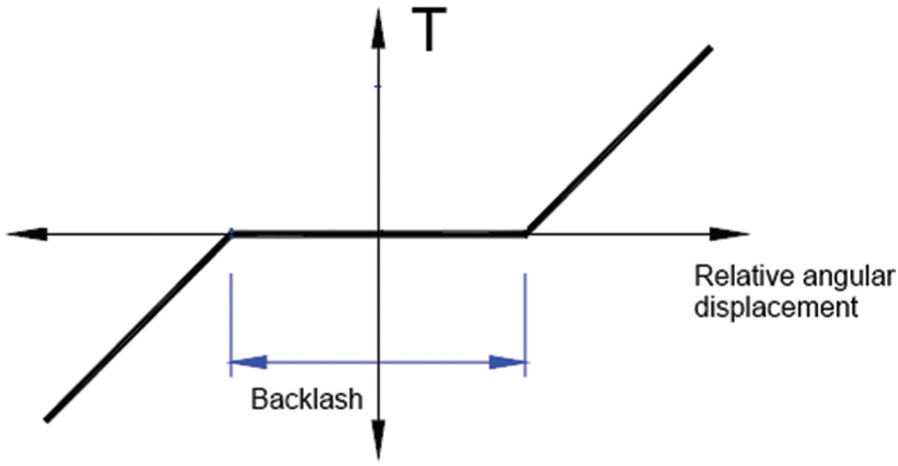
Piecewise linear model of the transmitted torque through a lash zone.
The multi-stage clutch torsional springs (with stiffness characteristics depending on the occurring deflection), which are located in the friction plate, absorb the sharp changes in the transferred torque. This action can also be represented as a piecewise linear function, as used by Couderc et al. 2 The torque capacity of a dry diaphragm spring clutch is the maximum torque that it can transmit via friction and it can be calculated using the function given by Shaver 14 according to
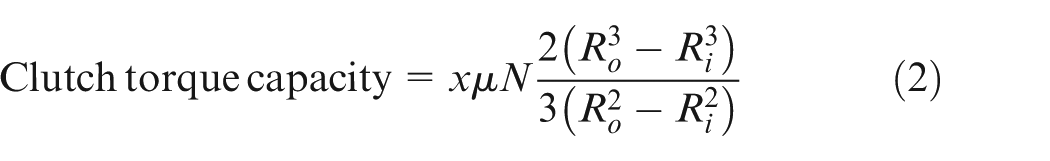
where x is the number of contacting faces, μ is the friction coefficient (dependent on the slip speed), N is the clamp load, Ro is the outer radius of the friction plate and Ri is the inner radius of the friction plate.
During clutch engagement, there are two possible scenarios. The first scenario is that there is relative speed between the clutch and the flywheel, prompting the use of the kinematic friction coefficient (slipping action). The second scenario is that of sticking action (i.e. when there is no relative speed at the friction interface, indicating that the static friction coefficient can be used). In this latter mode of operation, only as much torque as required to keep the two components moving with the same velocity can be transferred; if more torque is applied, then the surfaces will simply revert to slipping. The complexity increases when modelling the above-mentioned stick–slip behaviour (instantaneous interchange between these two states). The approach utilised by Karnopp 4 , shown in Figure 3, is used to simulate the stick–slip action.
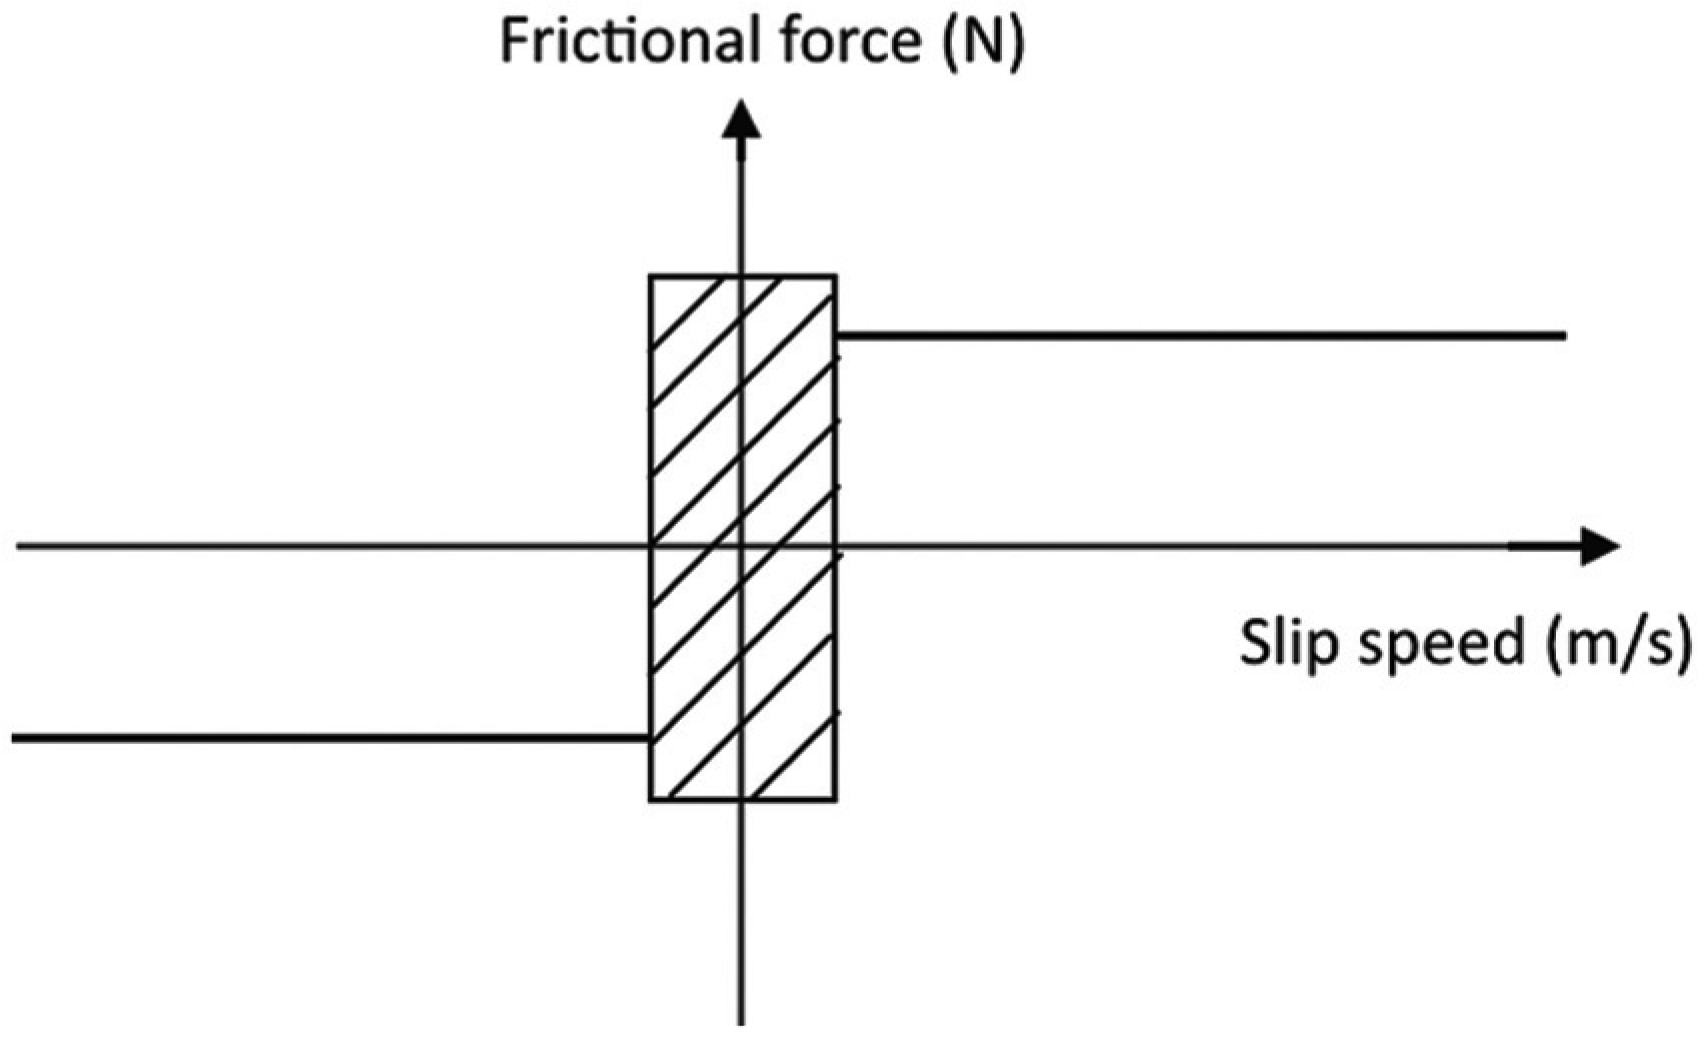
Karnopp model used for stick–slip action.
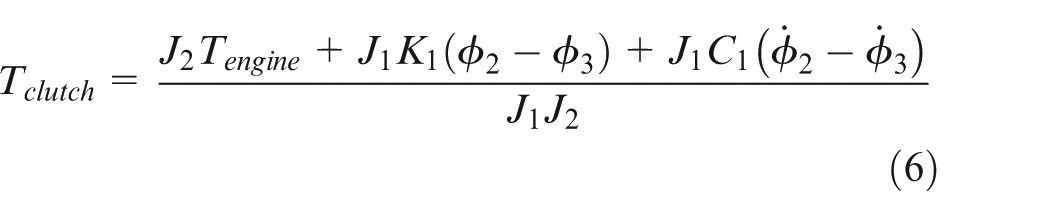
A small region is established around the sticking action (where the slip speed is zero). Within this region the frictional force is limited by the value required to cause slippage. Thus, the torque transmitted within this region can be calculated using the equations of motion for the flywheel and the clutch friction plate and setting the acceleration values to be equal, an approach used by Serrarens et al. 5 If the corresponding backlash is neglected, then, for the rotation ϕ1 of the flywheel and the rotation ϕ2 of the friction plate,


where J1 is the inertia of the flywheel, J2 is the inertia of the clutch friction plate, Tengine is the torque supplied by the engine, Tclutch is the torque transmitted by the clutch, ϕn is the angular displacement of inertia n (= 2, 3),
Rearranging the above equations for the acceleration terms and setting these equal give
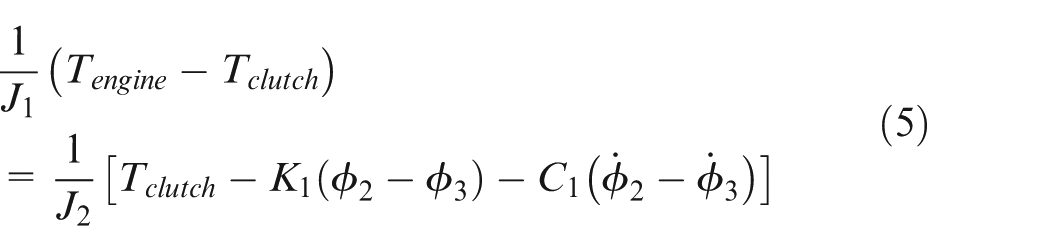
Solving equation (5) for Tclutch determines the required torque that is transmitted through the friction interface in order to keep the two inertias moving at the same speed according to
Therefore, if the relative velocity between the flywheel and the friction plate is within a prescribed limit (a slip velocity limit of 0.01 rad/s was employed in this investigation, based on the work by Rahnejat 1 ), then equation (6) gives the amount of torque that is transmitted unless this value exceeds the clutch torque capacity, which can be calculated using the static coefficient of friction; in the latter case the two surfaces begin to slip. If the relative velocity is not within the defined limit, then the transmitted torque is equal to the engine torque but again limited to the clutch torque capacity. In the latter case the torque capacity is calculated using the kinematic coefficient of friction (thus, its limit value is much lower than in the previous case).
The resistance applied on an automobile in linear motion is generally the summation of the rolling resistance, the aerodynamic drag force and climbing resistance. 15 The rolling resistance Frolling is the result of deformations occurring at the point of contact between the tyre and the road and is given by

where f is the coefficient of rolling resistance, m is the mass supported by the wheel, g is the acceleration due to gravity and α is the angle of the incline. The aerodynamic drag force Faero is determined as

where ρ is the density of air, Cw is the drag coefficient, A is the frontal area of the vehicle, v is the velocity of the vehicle and v0 is the velocity of the wind. The climbing resistance Fclimb is determined by the formula

Finally, the effect of the mass inertia of the vehicle was considered by ‘transferring’ the vehicle mass to the rear-wheel assembly as carried out by Gnanakumarr et al., 10 according to
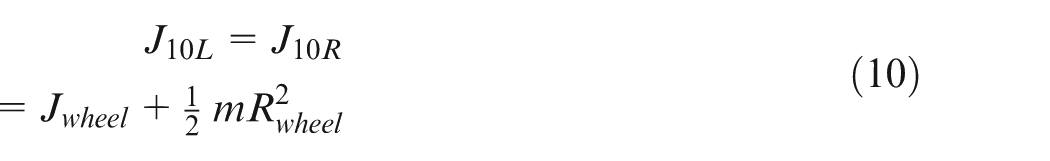
where Jwheel is the inertia of one wheel, m is the mass of the vehicle and Rwheel is the radius of the wheel. In this work it is assumed that the only resistive force of significant magnitude is the rolling resistance, since the vehicle speed during the examined manoeuvre remains fairly low (about 15 mile/h), and thus the air resistance is very small in comparison.
Equations of motion
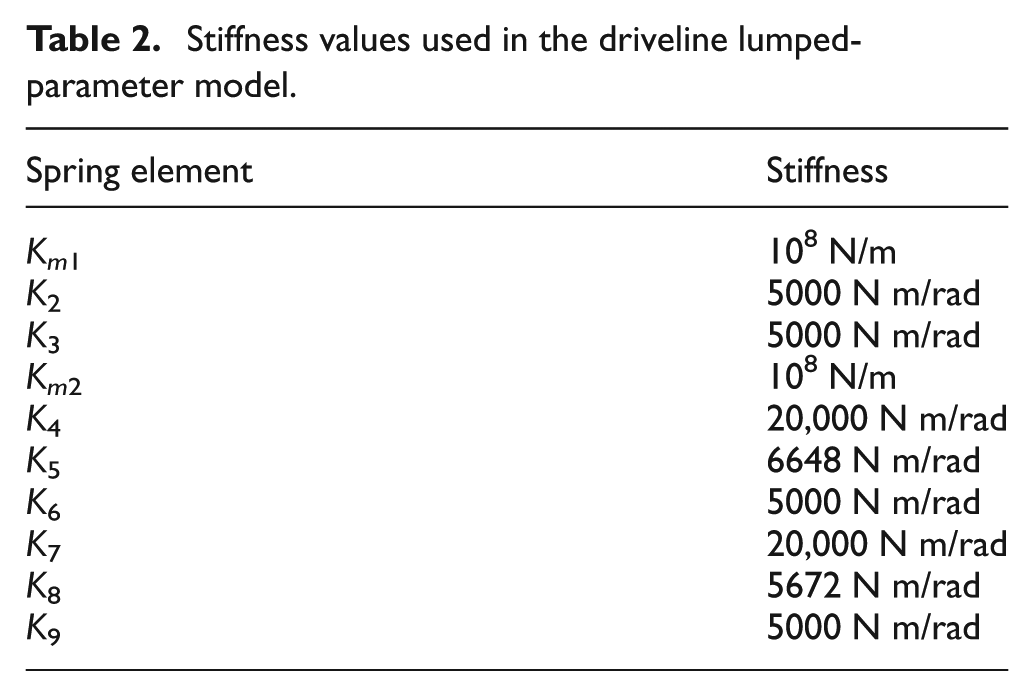
The complete drivetrain model presented in Figure 4 is used to derive the corresponding free-body diagrams and the equations of motion. The corresponding inertia and stiffness values were obtained from the manufacturer and the available literature and are shown in Table 1 and Table 2 respectively.
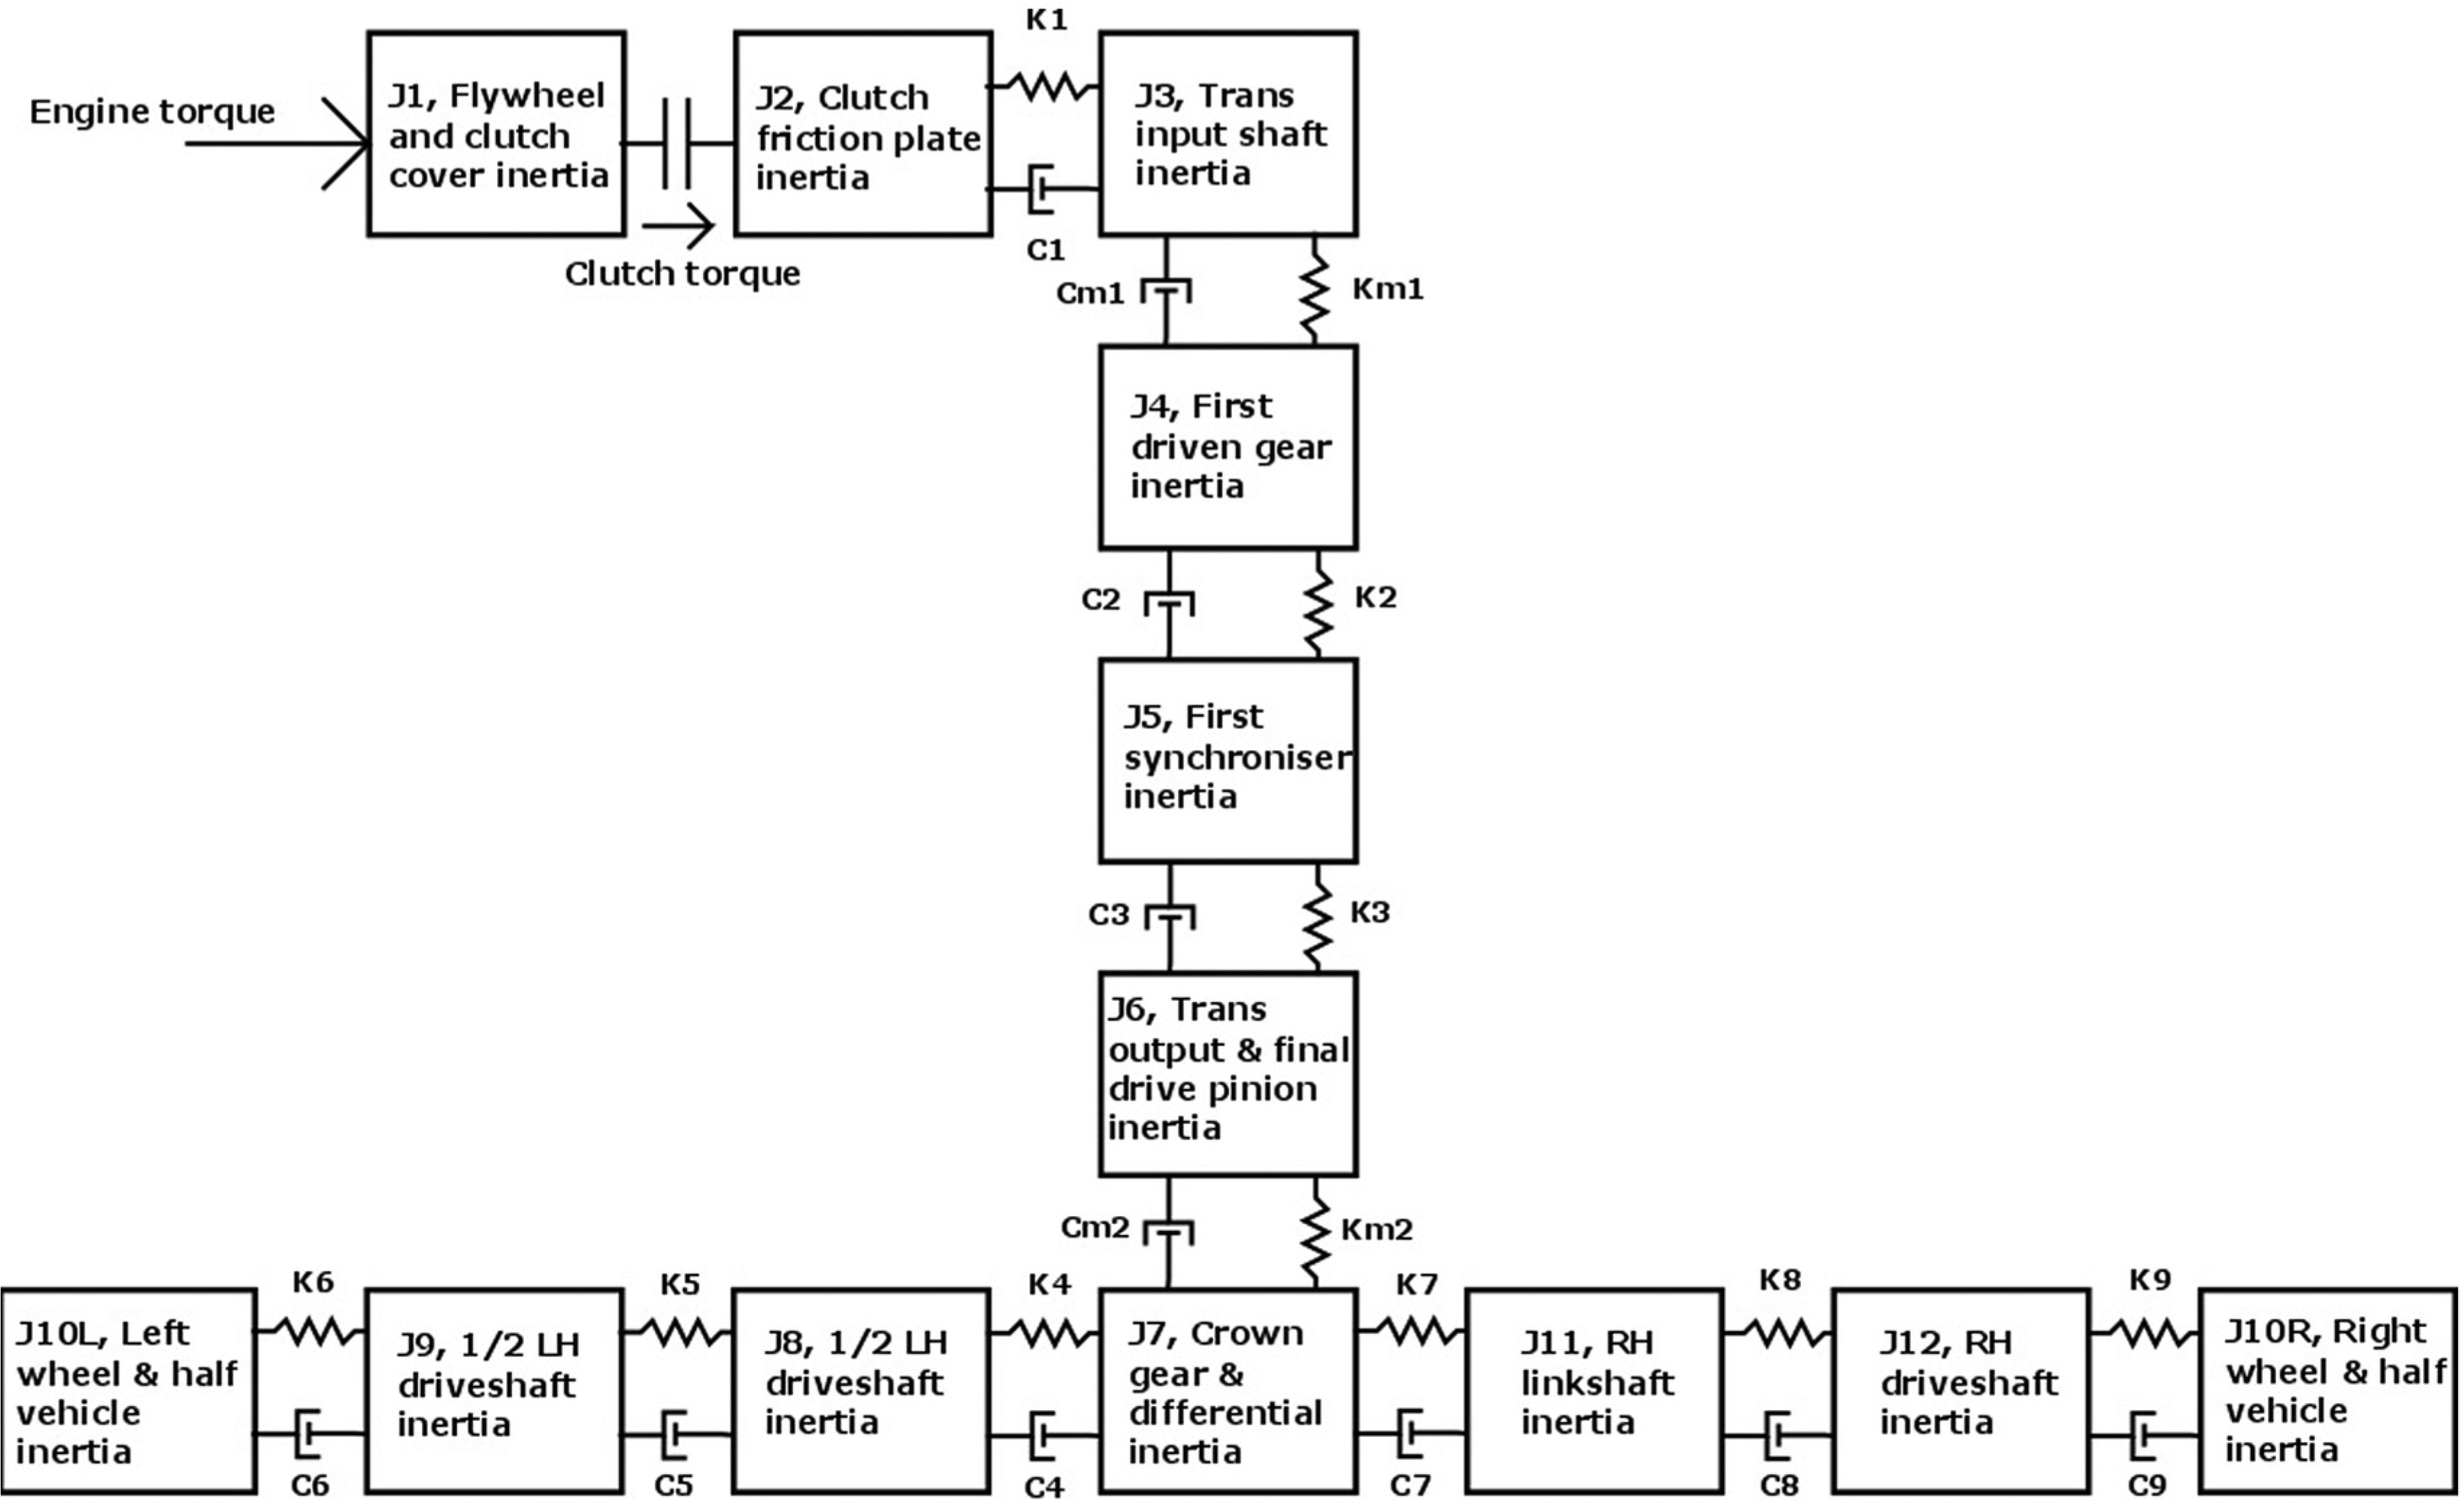
The complete examined drivetrain model.
Inertia values of the driveline components.
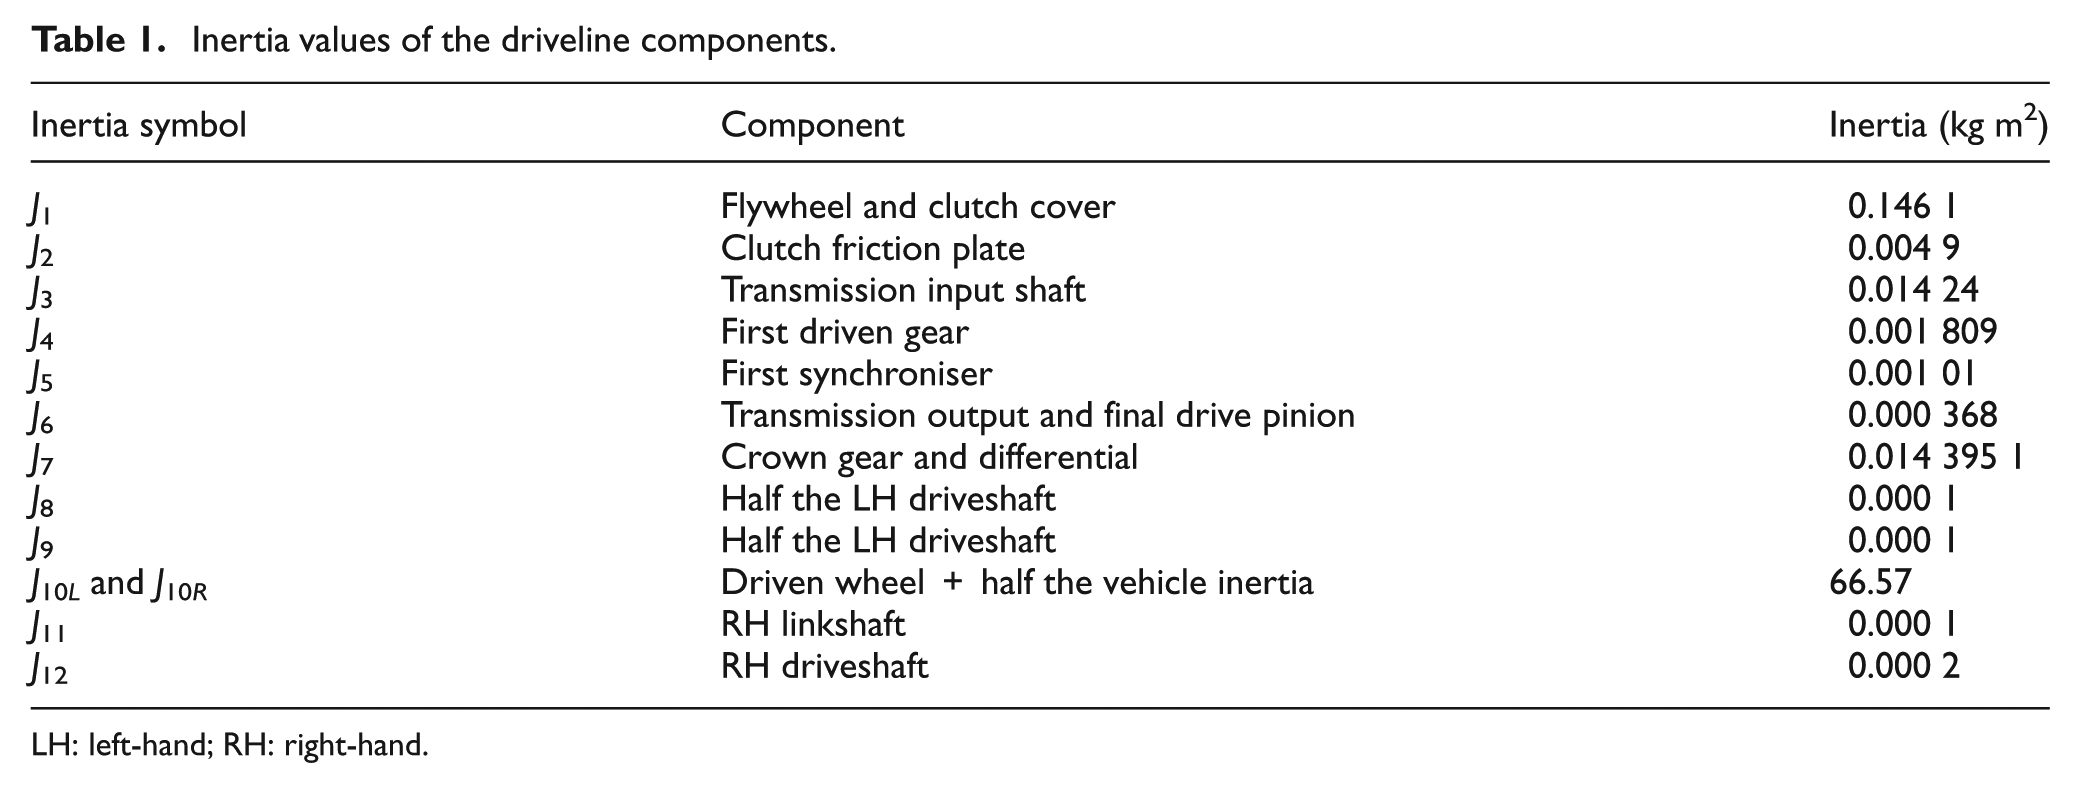
LH: left-hand; RH: right-hand.
Stiffness values used in the driveline lumped-parameter model.
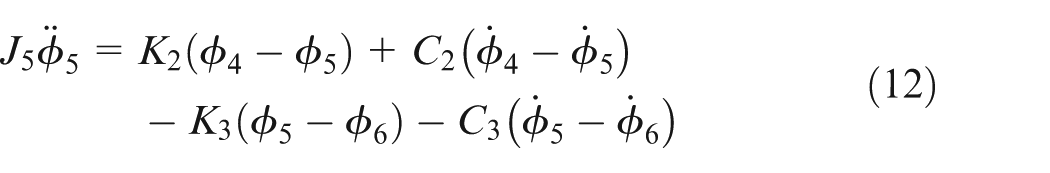
As an example, Figure 5 shows the torque reactions acting on inertia J5 (first synchroniser), assuming that the local lash was taken up. The equation of motion including the lash non-linearity has the form (this process is repeated for each of the system inertias to produce the full set of non-linear equations)
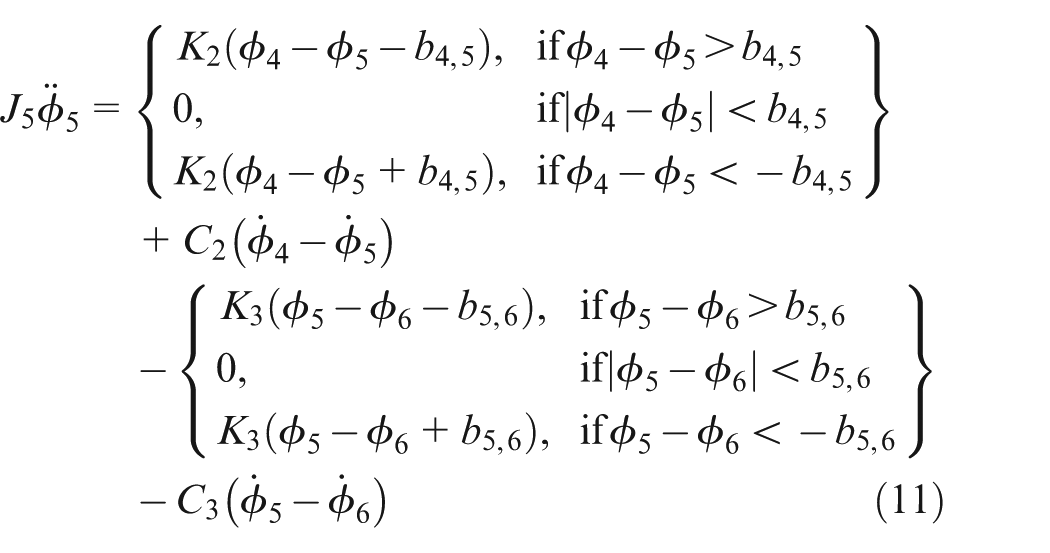
where Jn is the inertia of the nth component, Kn is the stiffness coefficient of the nth spring element, Cn is the damping coefficient of the nth damping element, bi,
j
is half the amount of total angular backlash between inertia i and inertia j, ϕn is the displacement of inertia n,
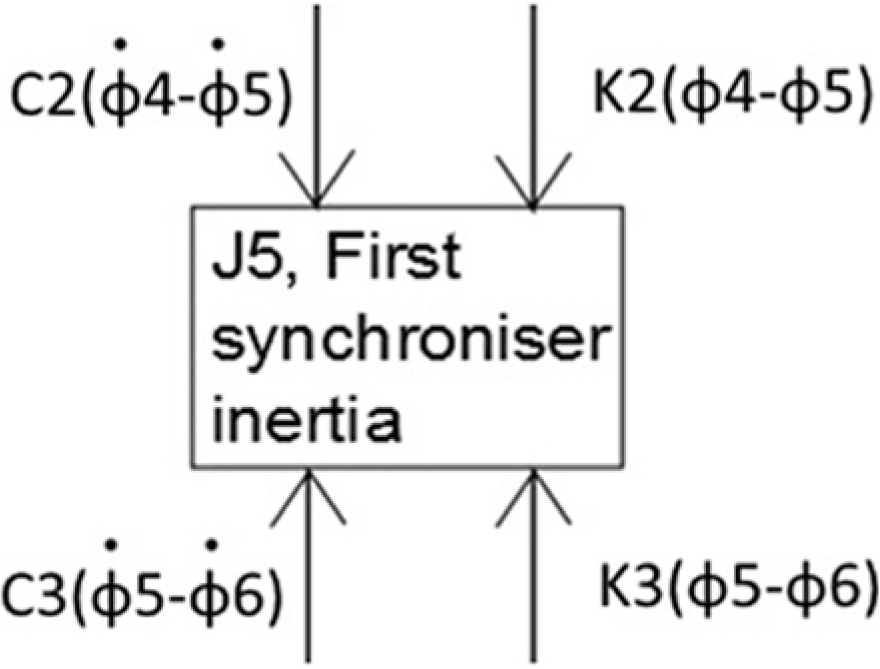
Free-body diagram of the first synchroniser.
To linearise the set of equations of motion (for calculation of the natural frequencies of the system), it is assumed that the lash is taken up (i.e. there is always contact between the interacting parts and, therefore, torque transmission). Thus, the linearised version of the equation of motion for the first synchroniser is
where the variables have the same meanings as in equation (11).
System damping
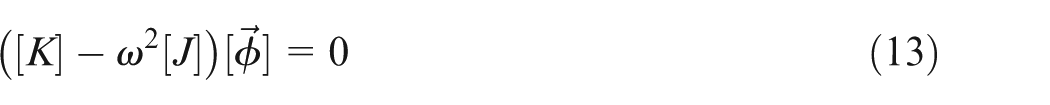
For estimation of the damping coefficients, the natural frequencies and the corresponding eigenvectors are required. Thus, the eigenproblem is solved as
Structural viscous damping was assumed to introduce the energy loss mechanism within the short transient abuse event (parasitic frictional damping at the various interfaces between the bearing surfaces at the clutch, the transmission and the driveshafts). For the driveline metallic structure, the modal damping ratios ζ generally were 16 between 0.01 and 0.07. Following some preliminary simulations, the results suggested that a damping ratio value of 0.03 is a reasonable approximation for the system in question. In order to represent more accurately the flexible structure of the tyre, a damping ratio of 0.125 was employed, as used by Guzzomi et al. 17 By combining the orthonormalised eigenvectors into a matrix [X], the damping coefficients are calculated using the expression resulting from the transformation of the uncoupled modal equations of motion to physical coordinates (as in Inman 18 ) according to

where [Z] is the modal damping matrix given by
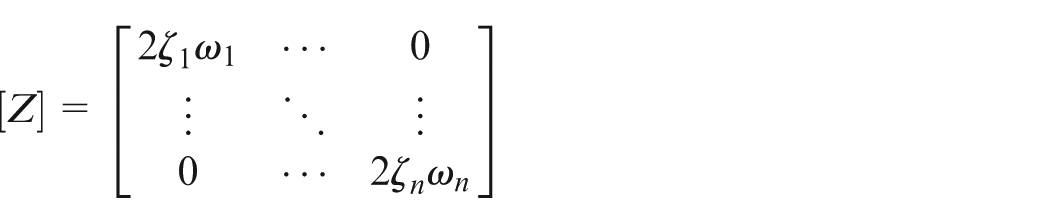
which is diagonal with each element (i, i) equal to 2ζiωi. Using equation (14) and the form of the damping matrix [C] obtained from the derived equations of motion, the unknown damping coefficients are found.
Results and discussion
Modal analysis
Initially the linearised set of the equations of motion is used to determine the natural frequencies and the mode shapes by solving the eigenproblem stated by equation (13). The clutch friction interface is not considered in this analysis (because of the non-linear nature of this contact); thus, the matrix form of the equations of motion from the clutch friction plate inertia J2 onwards is treated as a free undamped system. The natural frequencies are provided in Table 3.
Natural frequencies of the driveline.
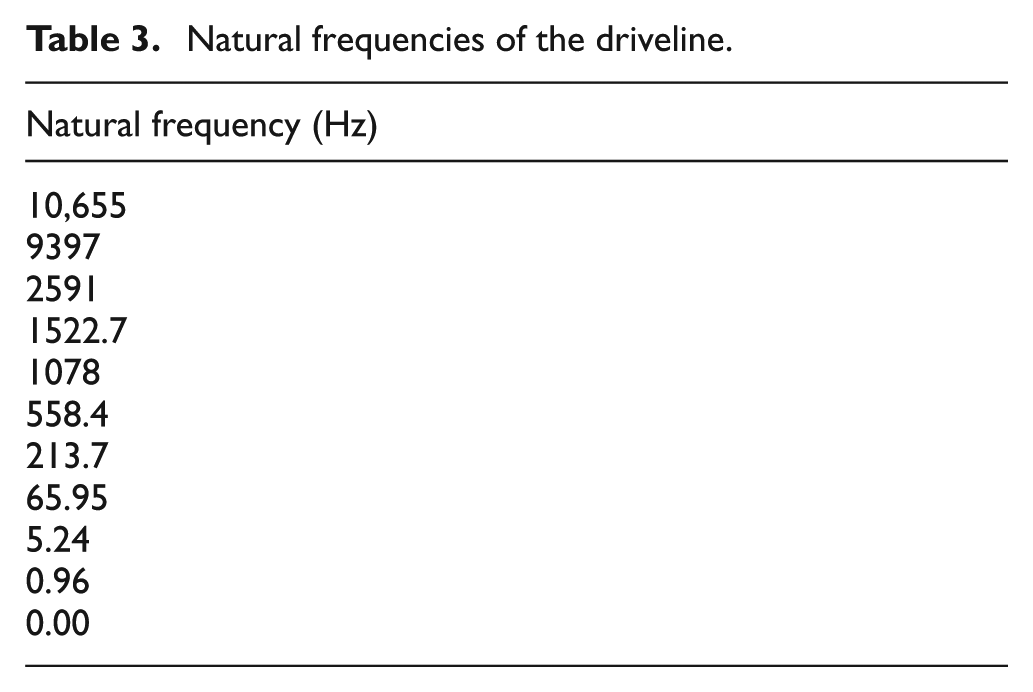
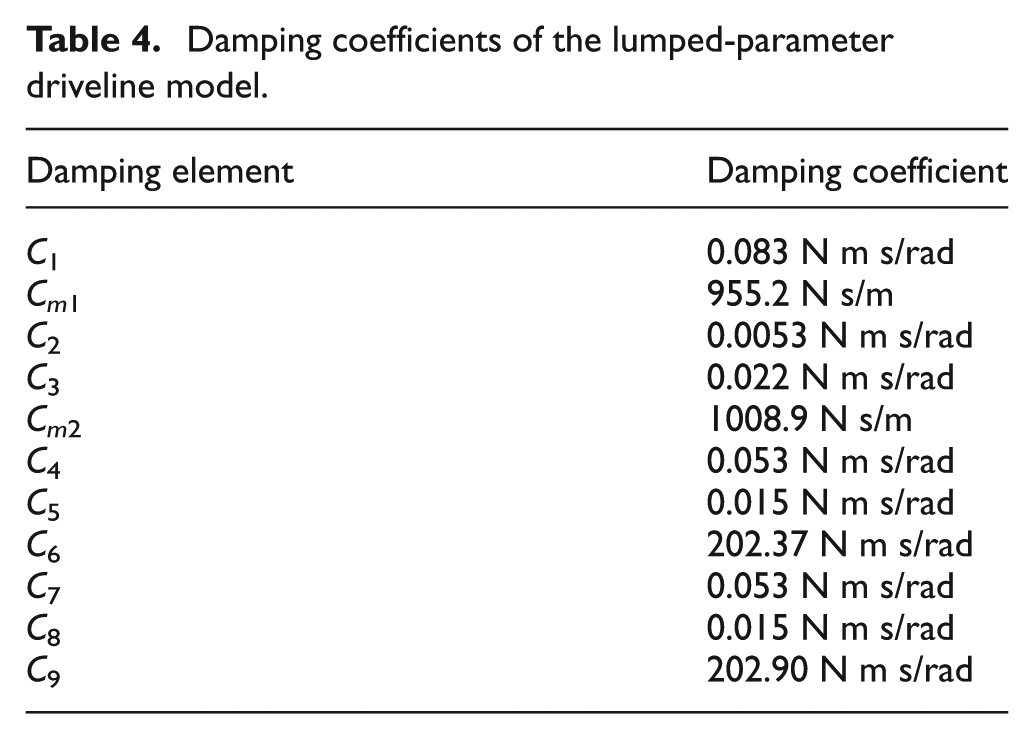
The zero natural frequency indicates a rigid body mode (unconstrained system). It can be seen that none of the natural frequencies is close to the engine frequency of 40 Hz (thus, no resonant effects should be expected). Figure 6 depicts the second mode shape of the system, in which the inertias J10L and J10R (corresponding to the left-hand (LH) wheels and the right-hand (RH) wheels respectively) present the highest oscillation amplitudes (out of phase, though). Interestingly, the system behaves as a rigid body up to (and including) inertia J7 (the differential). Thereafter, the driveline splits into two separate ‘branches’ that oscillate out of phase with respect to each other. The coefficients of the damping matrix are shown in Table 4.
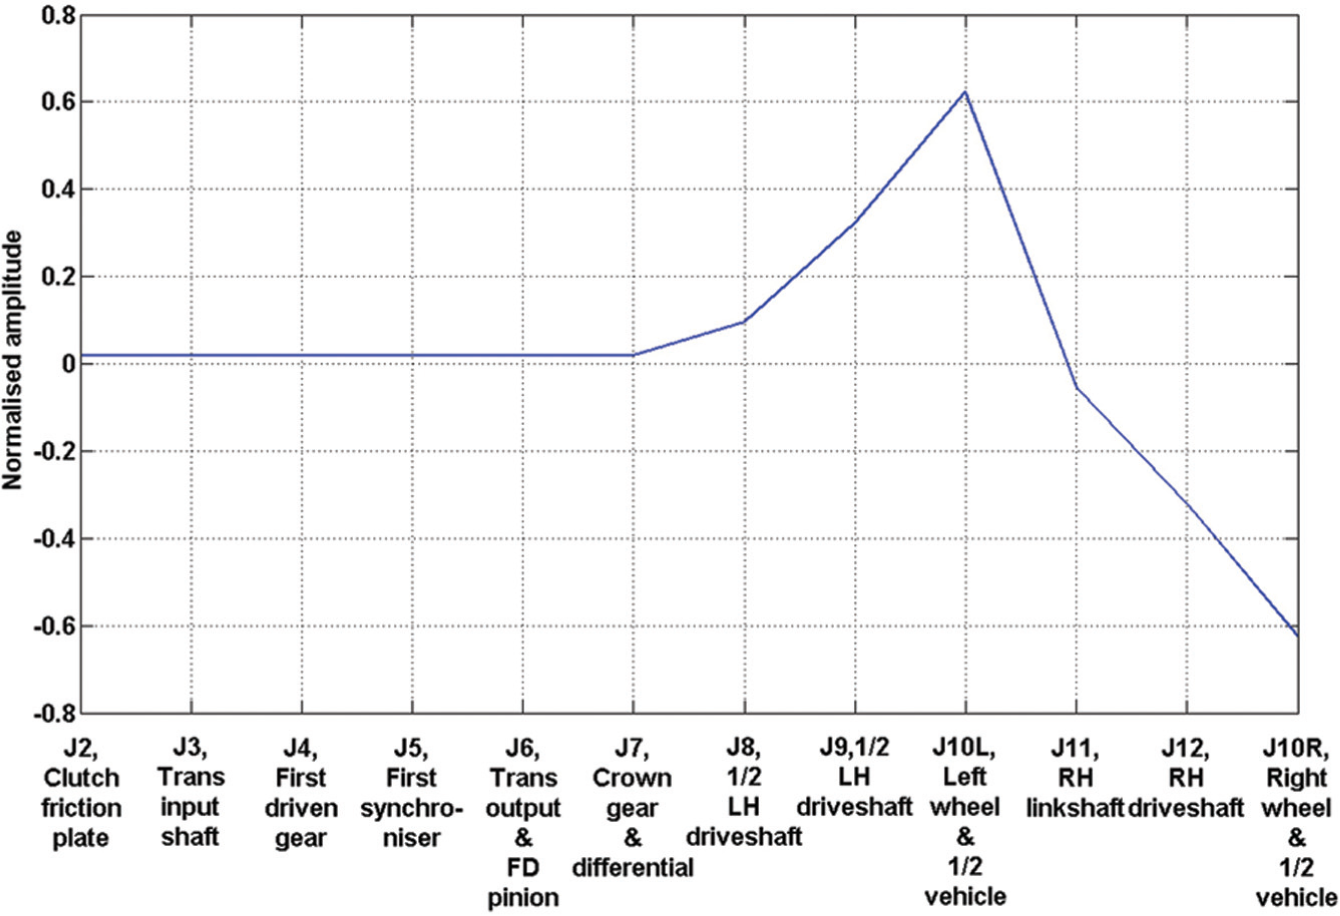
Typical mode shape of the linearised system.
Damping coefficients of the lumped-parameter driveline model.
Numerical simulations and parametric studies
Following the addition of the damping matrix, the non-linear model can be simulated. A Runge–Kutta numerical integration scheme was used within MATLAB software to solve the non-linear second-order differential equations of motion. An important consideration is the time step chosen in order to represent accurately the transient events; a time step of 10 µs will be used for a simulation with total duration of 5 s. Figure 7(a) shows the velocity–time history of the RH wheels (and hence the vehicle velocity) and those of the flywheel and the clutch friction disc.
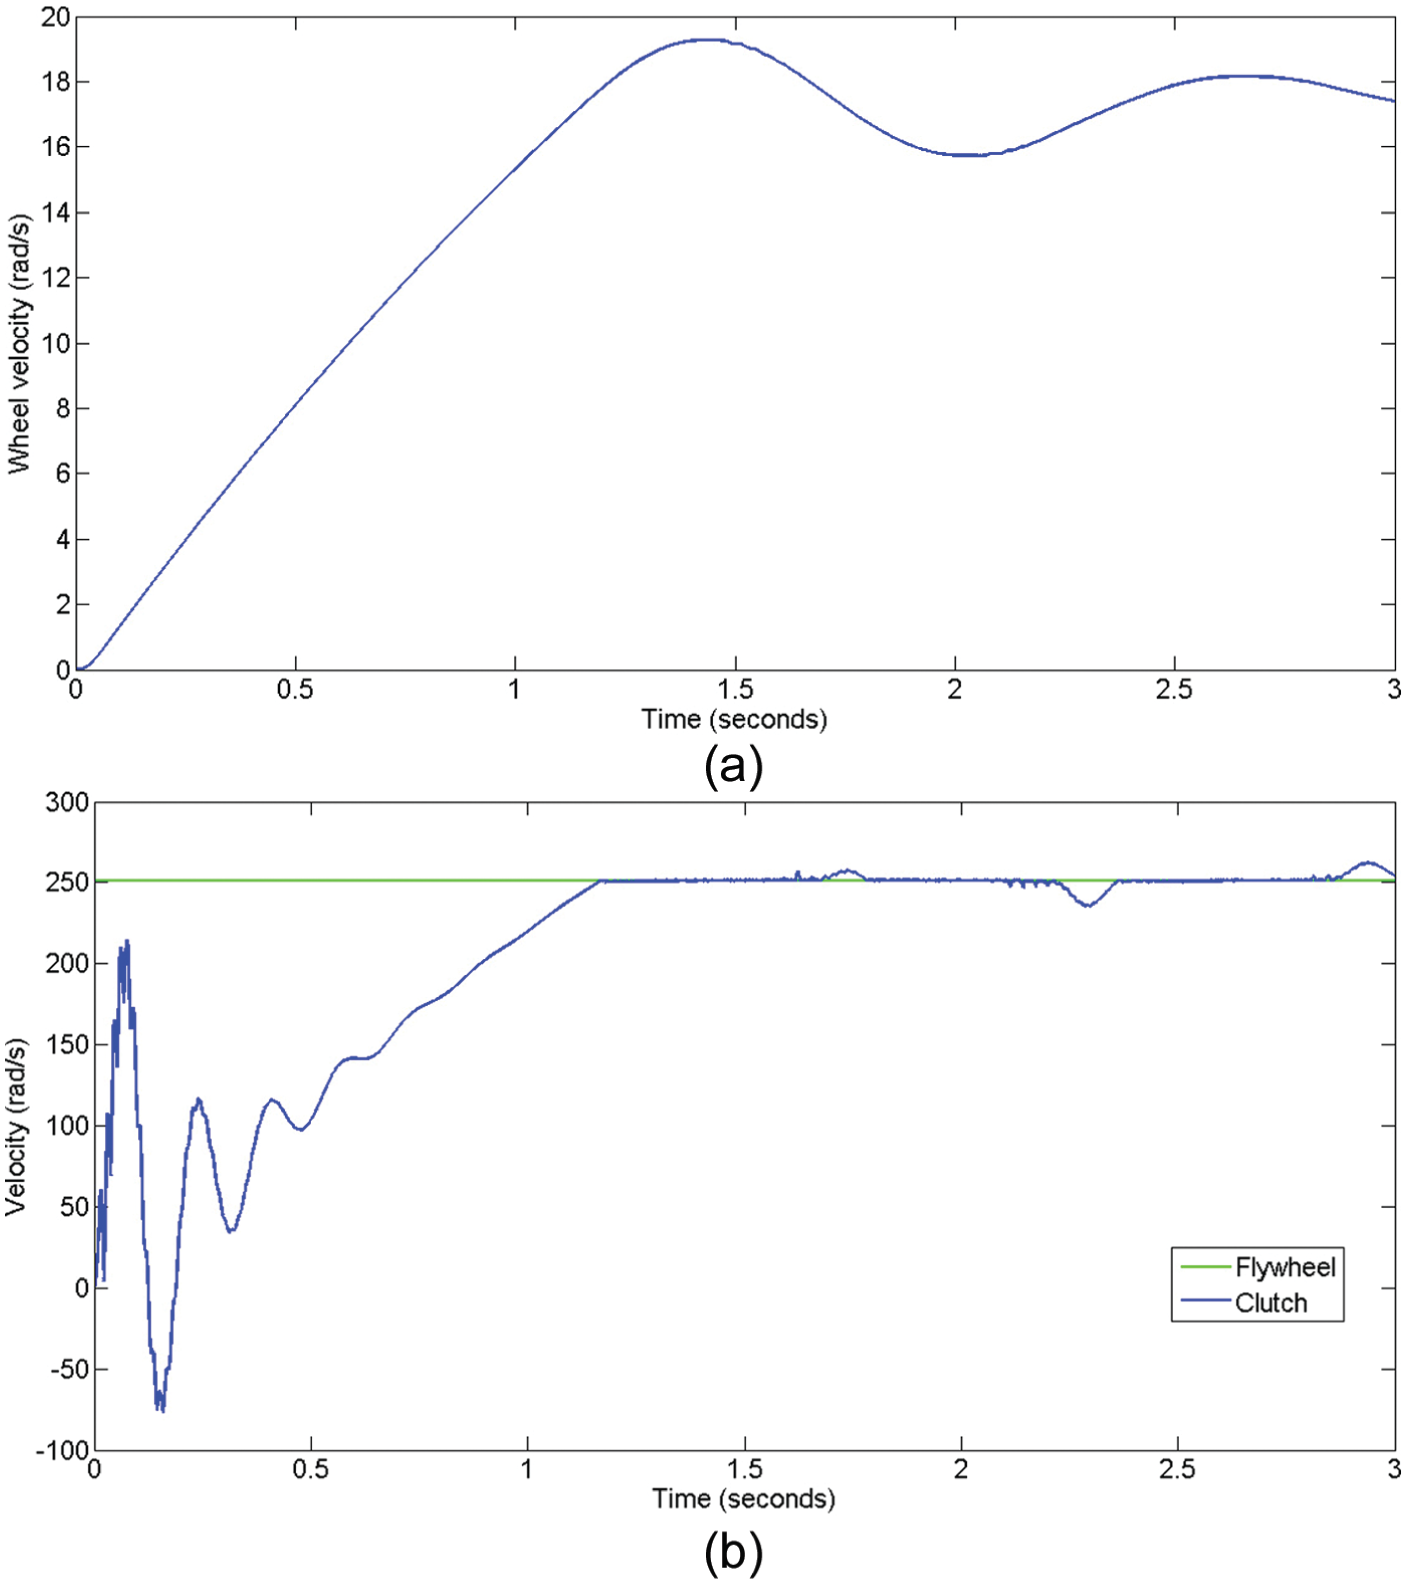
Time histories of (a) the velocity of the wheel and (b)the velocity of the flywheel and clutch friction disc.
It can be seen that the wheel (vehicle) velocity increases rapidly to approximately 17.3 rad/s, matching the engine speed of 2400 r/min. The velocity then oscillates slightly around this value. Figure 7(b) shows that the friction disc of the clutch is slipping against the flywheel until it reaches the same speed, at which point they stick together. The aspects of the system’s physics presented in the above-mentioned figures are in accordance with the expected behaviour in the drivetrain, which is evidence of the correct functioning of the model.
Plotting the relative displacement between two neighbouring inertias can provide useful information of the events occurring in the corresponding lash zone. Figure 8 shows the relative motion between the inertia J4 (first driven gear) and the inertia J5 (first synchroniser). The horizontal lines represent the upper limit and the lower limit of the backlash zone (defined on the basis of the actual component backlash). As can be seen, there is an abrupt deflection of the spring element until the vehicle reaches its maximum speed, at which point the deflection decreases and smoother oscillations take place around the backlash zone. In our analysis, we assumed that all the stiffnesses and compliances in the connections between the first-driven-gear–synchroniser–transmission output and the final-drive pinion are concentrated on lumped-parameter elements. However, in comparison with the behaviour of the real system, this is a (rather simplistic) approximation, since the interactions between the components’ contact forces, the generated friction and the thermal effects in particular at the synchroniser’s interface lead to the combination of different deflections influenced by thermal expansion of the material in this region. A larger deflection is currently seen because of the exclusion of these phenomena; nevertheless, the overall torque transferred is not expected to change.
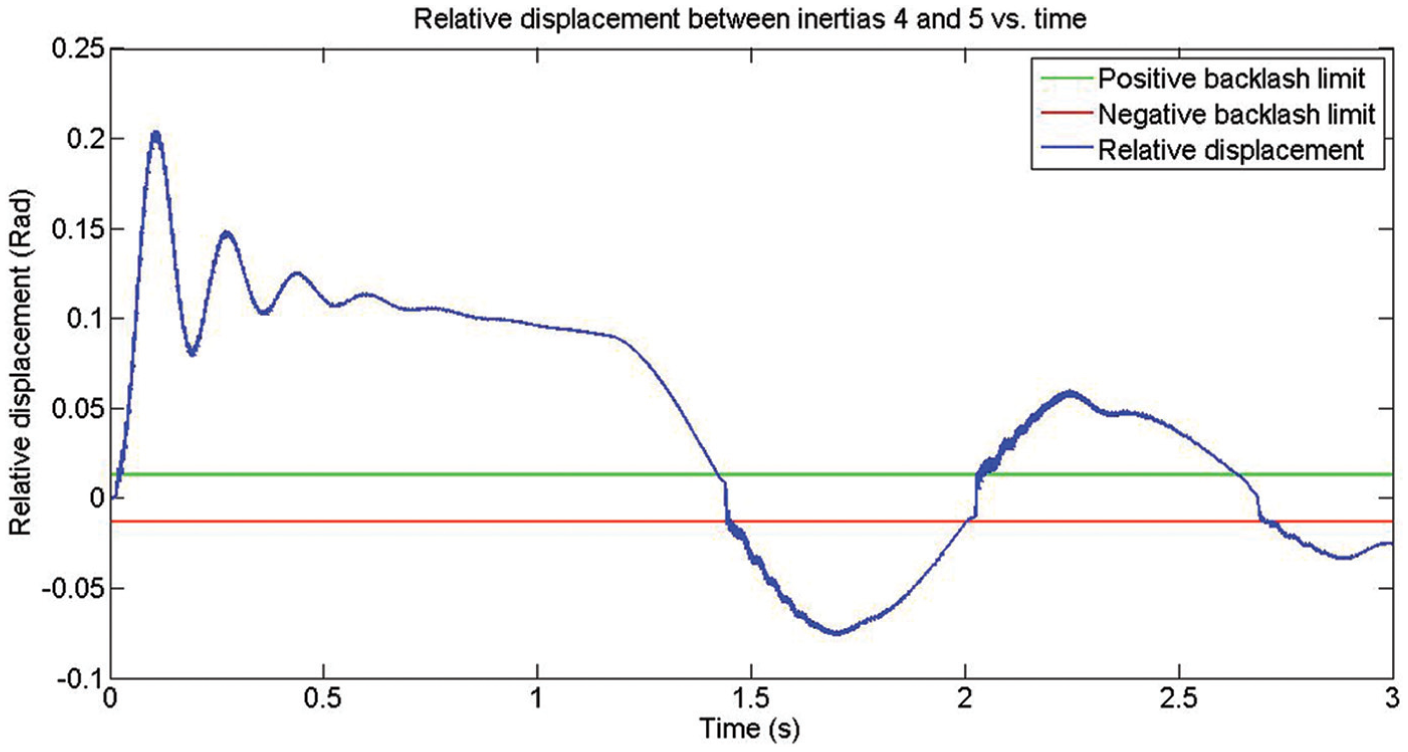
Time history of the relative motion between the first driven gear and the first synchroniser.
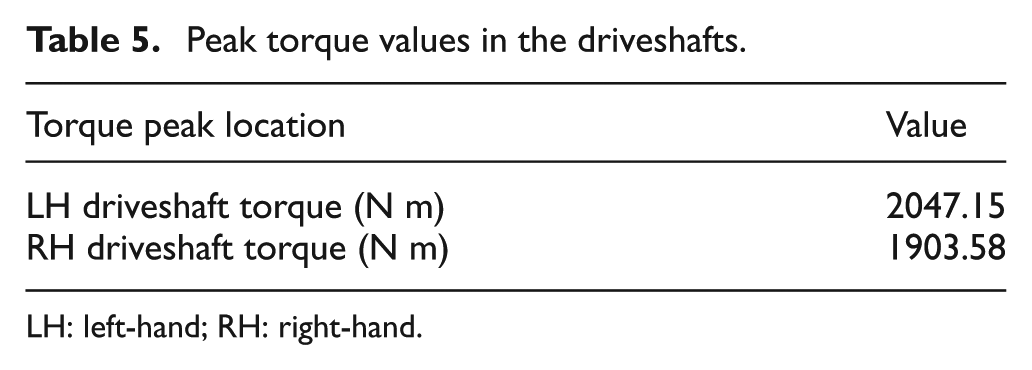
The generated torque fluctuations across the driveline are of particular interest from the NVH and durability perspectives. These can be calculated using the relative motion of the neighbouring inertias in conjunction with the stiffness and damping values at that particular connecting element. Figure 9 shows the time history of the transmitted torque between the first driven gear and the first synchroniser. As expected, the graph follows a very similar shape to that of the corresponding relative motion. The maximum torque predicted by the simulations occurs very close to the initiation of the motion; once the vehicle has reached its maximum speed, the torque oscillates around a value slightly above zero. The torque–time histories developed in the drivetrain components during the manoeuvre are determined, and the corresponding maximum values for the driveshafts are shown in Table 5.
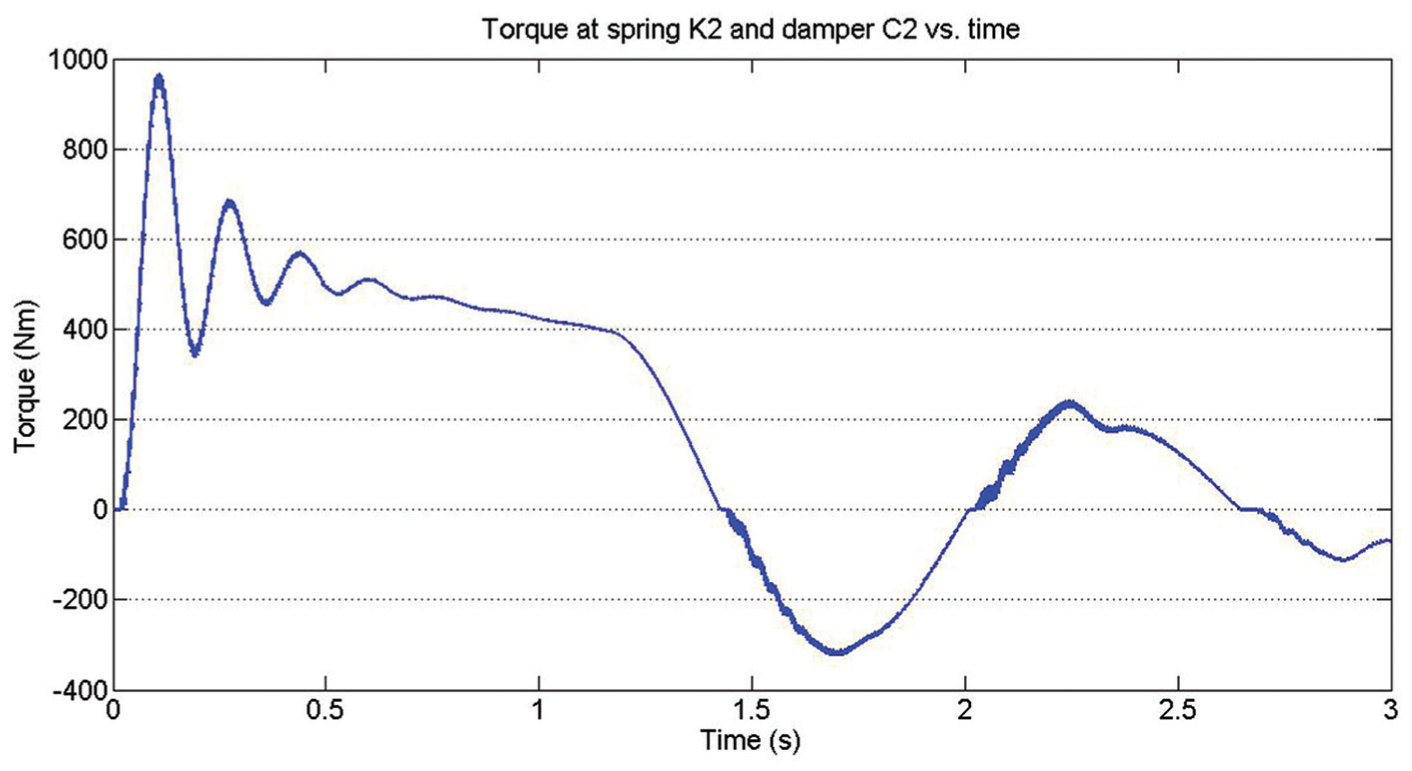
Time history of the transmitted torque between the first driven gear and the first synchroniser.
Peak torque values in the driveshafts.
LH: left-hand; RH: right-hand.
To validate the methodology and the simulation results, the latter are compared with the experimental data collected using wheel force transducers mounted on both front wheels of a test car equipped with a similar drivetrain. The ‘snap-start’ clutch engagement abuse event studied was conducted with the car on level ground, the clutch disengaged and first gear selected. The engine’s throttle position is then held at 2400 r/min and the driver side steps the clutch in a way that the complete vehicle lurches forwards. The load–time history is captured across the duration of the event with the manoeuvre repeated several times in order to represent accurately the maximum minimum and average peak loads. Figure 10 shows that the measured peak torque values for the two half-shafts are very similar (1885 N m and 1911 N m for the LH shaft and the RH shaft respectively). Comparing these with the numerically obtained values shown in Figure 10 and Table 5 (2047 N m and 1903 N m respectively), we can conclude that there is good agreement between the simulations and the experiments; nevertheless, the experiments exhibit a higher torque in the RH driveshaft while the simulations predict a higher torque in the LH driveshaft.
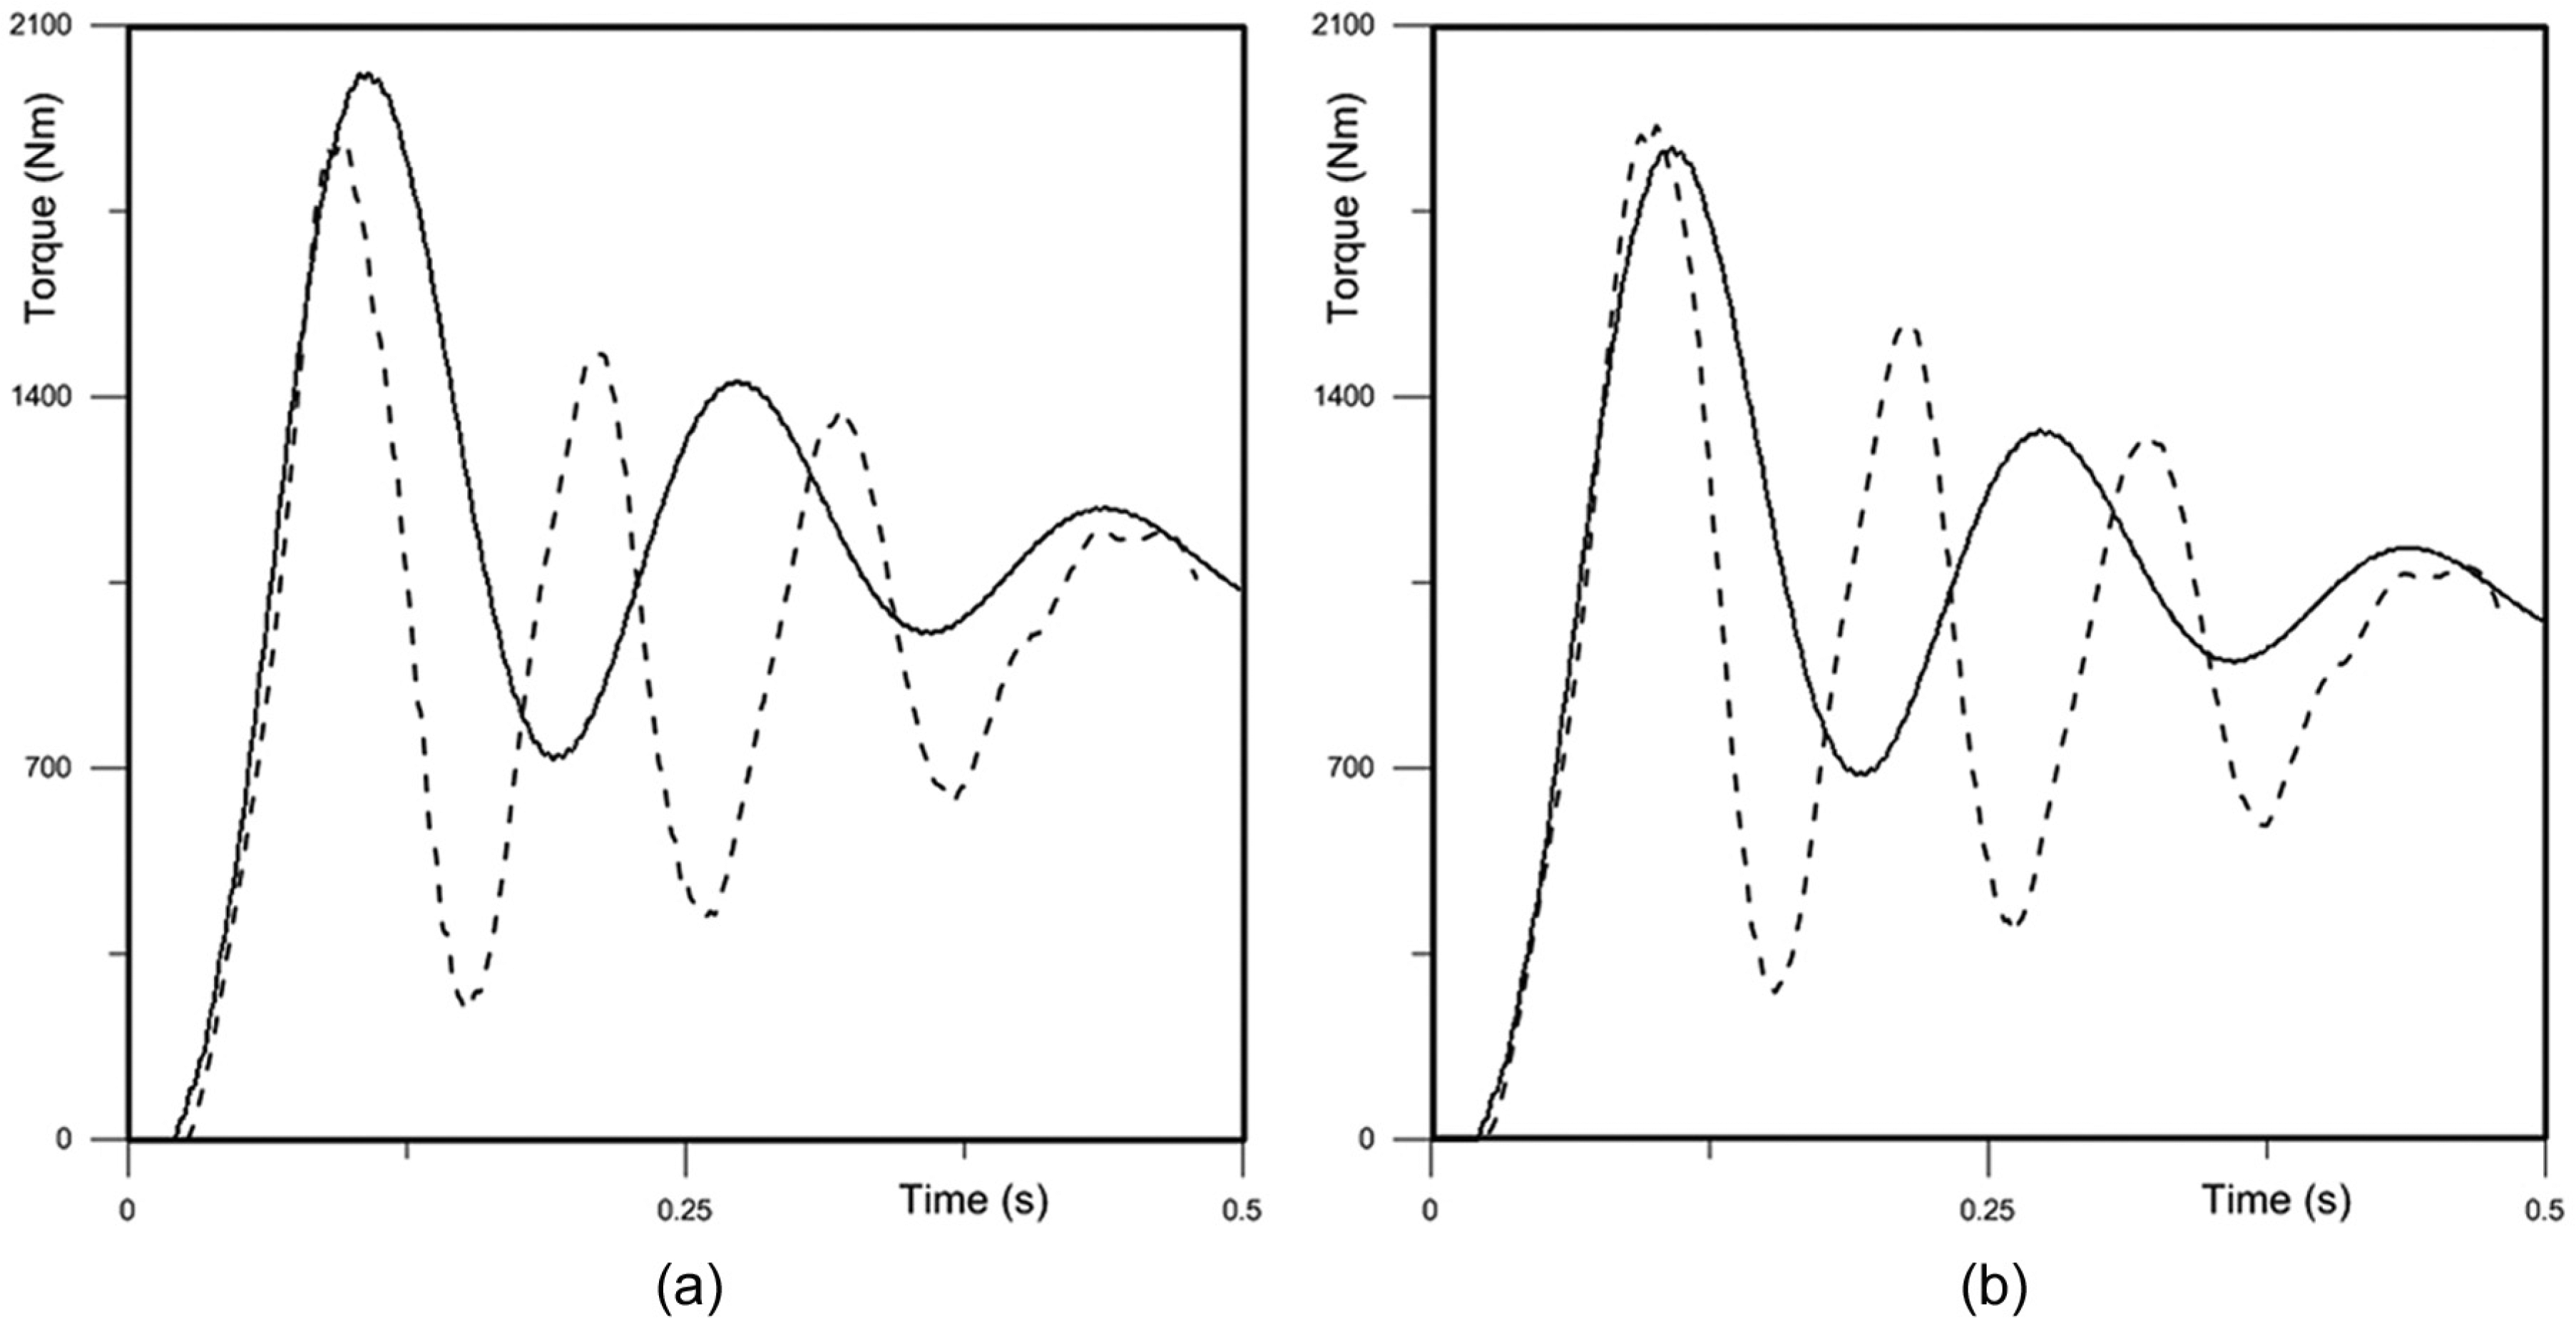
Measured time histories (dashed curves) and predicted time histories (solid curves) of the transmitted torques at (a) the LH wheel hubs and (b) the RH wheel hubs.
Another difference that can be clearly seen in Figure 10 is the frequency of the oscillations. The experimental data contain a frequency of 9 Hz, whereas the simulations predict a frequency of 6 Hz, which is fairly close to the third natural frequency of the system (at 5.24 Hz). The differences between the experimental frequencies and the predicted frequencies are most probably because the assumed stiffness, damping and inertia values are not exactly equal to the actual values. Another potential cause for the discrepancy in the results is that for snap-start tests of this type there can be tyre slip at the contact patch, which is expected to be more pronounced for the LH driveshaft (which is stiffer than the RH driveshaft). These differences can also explain the disparity between the predicted peak torques. Although it is to be expected that from a quantitative perspective the numerical results do not completely agree with the experimental data owing to the assumptions employed and the estimated system variables, the simulations predict results that are fairly reasonable from a qualitative perspective. In addition, the general shape of the predicted time histories is in good agreement with the experimental measurements, which encourages a further study into the important driveline parameters for the transient behaviour.
The first parametric study relates to the friction coefficient of the clutch friction interface. In the nominal case the kinematic friction coefficient value was assumed to be constant at 0.27 (based on manufacturer’s data). However, in reality the coefficient of friction is a function of external factors, such as the temperature and the lubrication conditions. To determine the sensitivity of the results to the variation in the friction coefficient, a selection of friction gradients is applied so that the kinematic friction coefficient μk changes with the slip speed between the flywheel and the friction plate. The effect on the peak torque values is then analysed. Two functions are used: one with a positive gradient (increasing coefficient of friction with increasing slip speed Vs (m/s)) and one with a negative gradient according to


The gradient values are similar to those used by Centea et al. 6 in their study on the effect of the friction coefficient on clutch judder. The rest of the model remains identical with the nominal case, and the only change implemented is in the calculation of the clutch capacity during the slipping stage. In order to find Vs, we need to take into account the speed difference between the clutch and the flywheel and to multiply this by the effective radius of the clutch facing. The peak torque values predicted are shown in Table 6. It can be seen that for a positive friction gradient the peak torque values predicted in the driveshafts increase by around 50 N m, which is a reasonable behaviour, since the peak torque values appear closer to the initiation of motion when there is large speed difference between the clutch and the flywheel (causing an increased kinematic friction coefficient). Equation (6) (the clutch torque capacity) shows that higher kinematic friction coefficients allow more torque to be transferred and also that the torque built up in the driveline during clutch engagement is limited by the clutch torque capacity.
Peak torque values: clutch kinematic friction coefficient study.
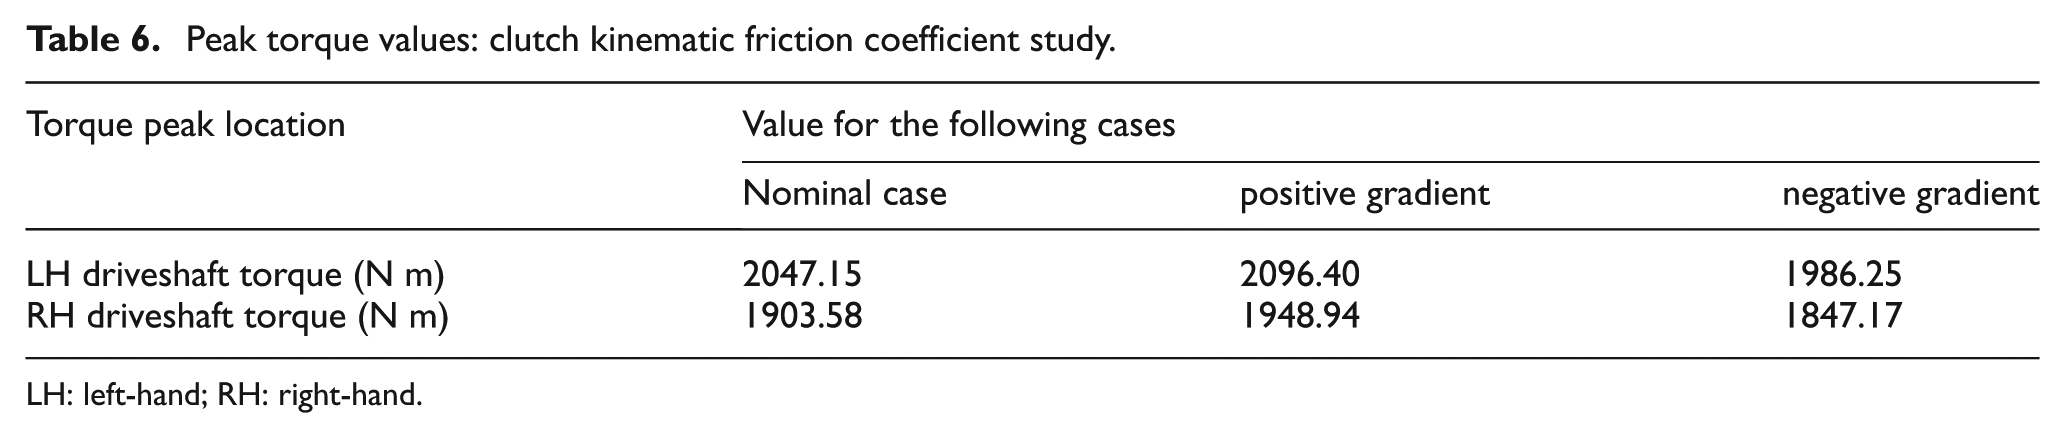
LH: left-hand; RH: right-hand.
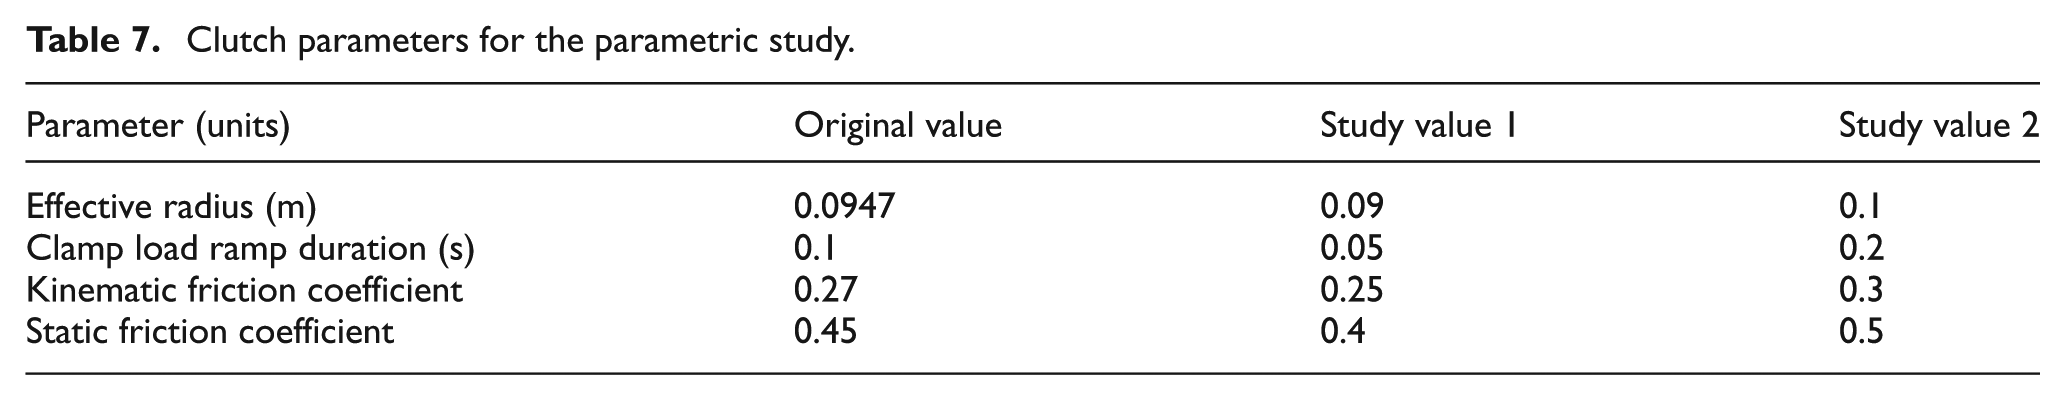
A preliminary assessment of the effect that certain clutch parameters (such as the effective radius of the friction facing, the clamp load profile and the static and kinematic coefficients of friction at the friction interface) have on the peak torque values is also provided. Each of these parameters is altered in turn to determine their effect on the peak torque values predicted. Table 7 summarises the main parameters to be altered and their new and original values. The ranges of values of the studied parameters of interest signify potential realistic modifications in the driveline that can be assessed in order to investigate the trends occurring in the behaviour of the system.
Clutch parameters for the parametric study.
In Table 8 we can see that, by decreasing the clutch effective radius to 0.09 m, the maximum torque in the driveshafts decreases by approximately 20 N m; increasing the radius to 0.1 m causes an increase in the maximum torque by approximately 17 N m. The frequency of oscillations in the system remains relatively unchanged when compared with the nominal case. The change in the torque follows the expected trend as the torque capacity of the clutch is proportional to the effective radius and, thus, decreasing the radius decreases the torque capacity and vice versa. Since the effective radius is not a time-dependent variable, then it is not expected to have an effect on the frequency characteristics of the drivetrain response.
Peak torque values: clutch friction radius study.
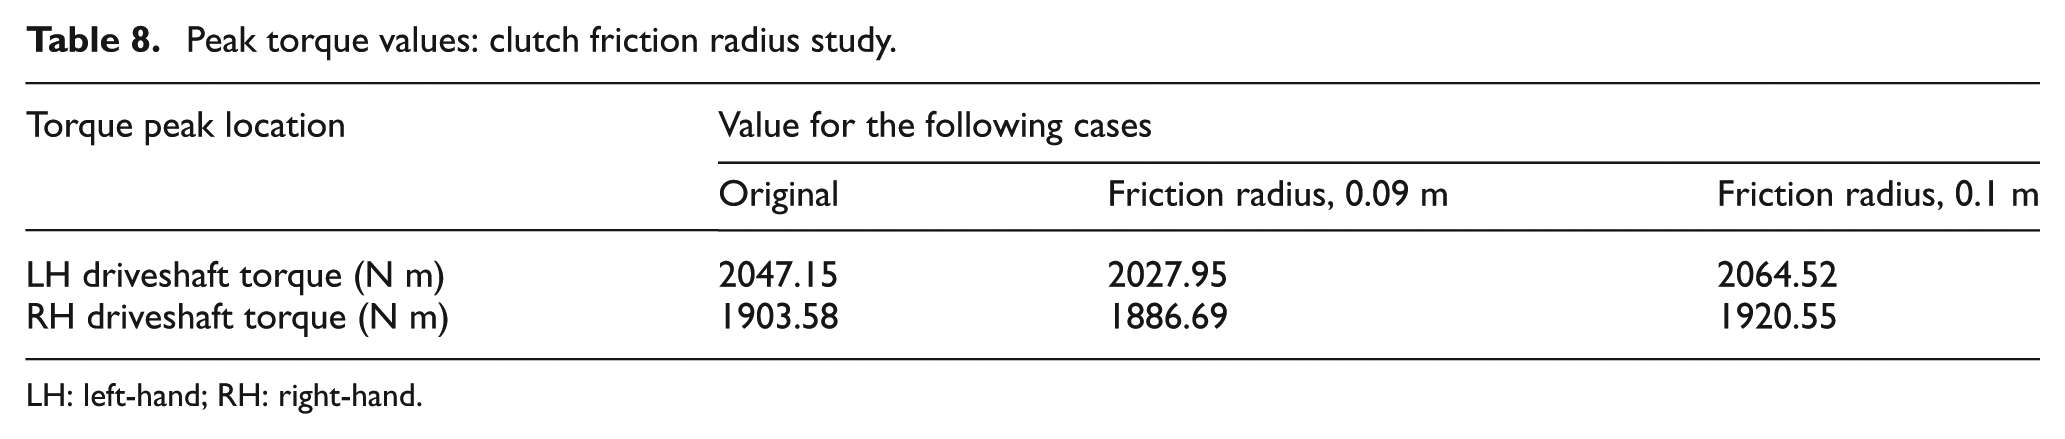
LH: left-hand; RH: right-hand.
For reduced clamp load duration (0.05 s, which is half the duration of the nominal simulations), an increase in the LH shaft torque amplitude of approximately 80 N m is observed and a corresponding increase of 70 N m in the RH shaft (as can be seen in the values in Table 9 and in the response in Figure 11). Although the maximum clutch capacity is not altered, the gradient is steeper and the maximum capacity is reached in a shorter time. This confirms that the engine torque is higher than the clutch capacity during the initial engagement of the clutch. Another interesting feature is that the peak torque occurs earlier than in the nominal case (not by 0.05 s as may be expected but by only 0.02 s). For a clamp load duration of 0.2 s (twice the nominal case value), a more pronounced reduction is observed in the system torque with amplitude reductions of 360 N m and 330 N m for the LH shaft and the RH shaft respectively. In contrast with the previous case of shorter clamp load duration, the clutch torque capacity now presents a less steep gradient during the engagement period. Finally, although the torque–time history at the RH driveshaft exhibits oscillations at the same frequency as in the nominal case, there is a torque peak phase delay by approximately 0.04 s.
Peak torque values: clamp load ramp duration effect.
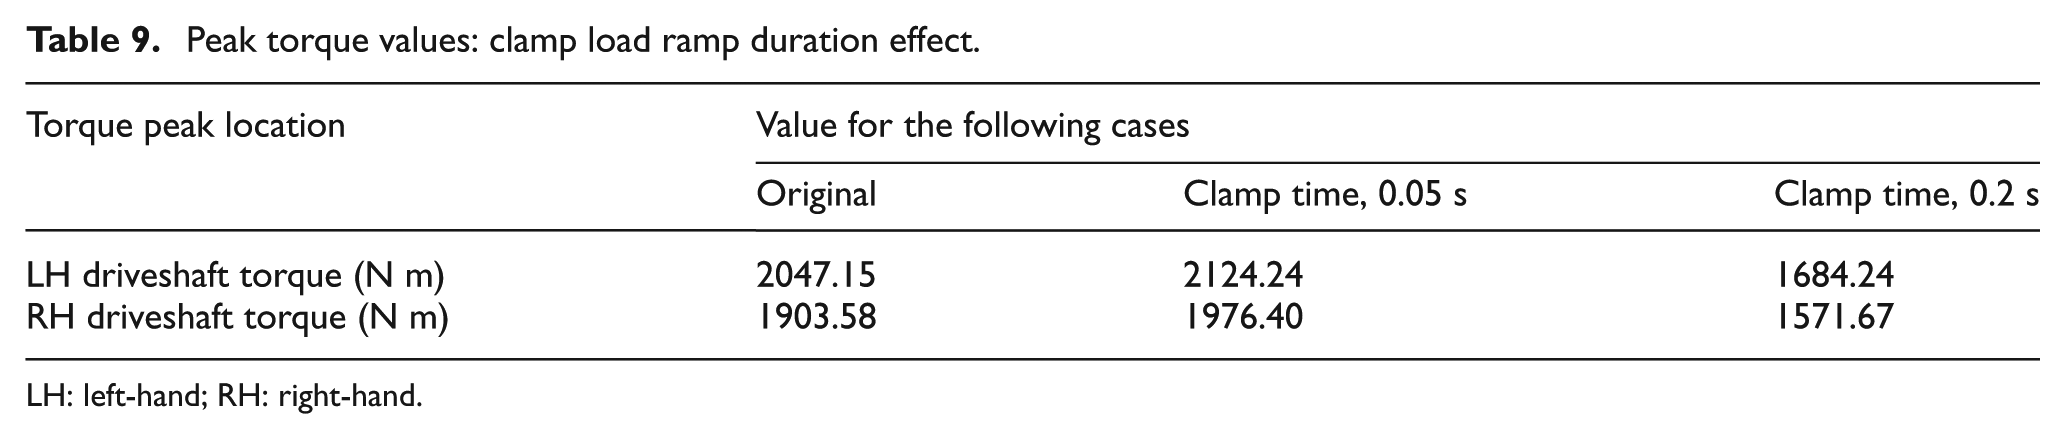
LH: left-hand; RH: right-hand.
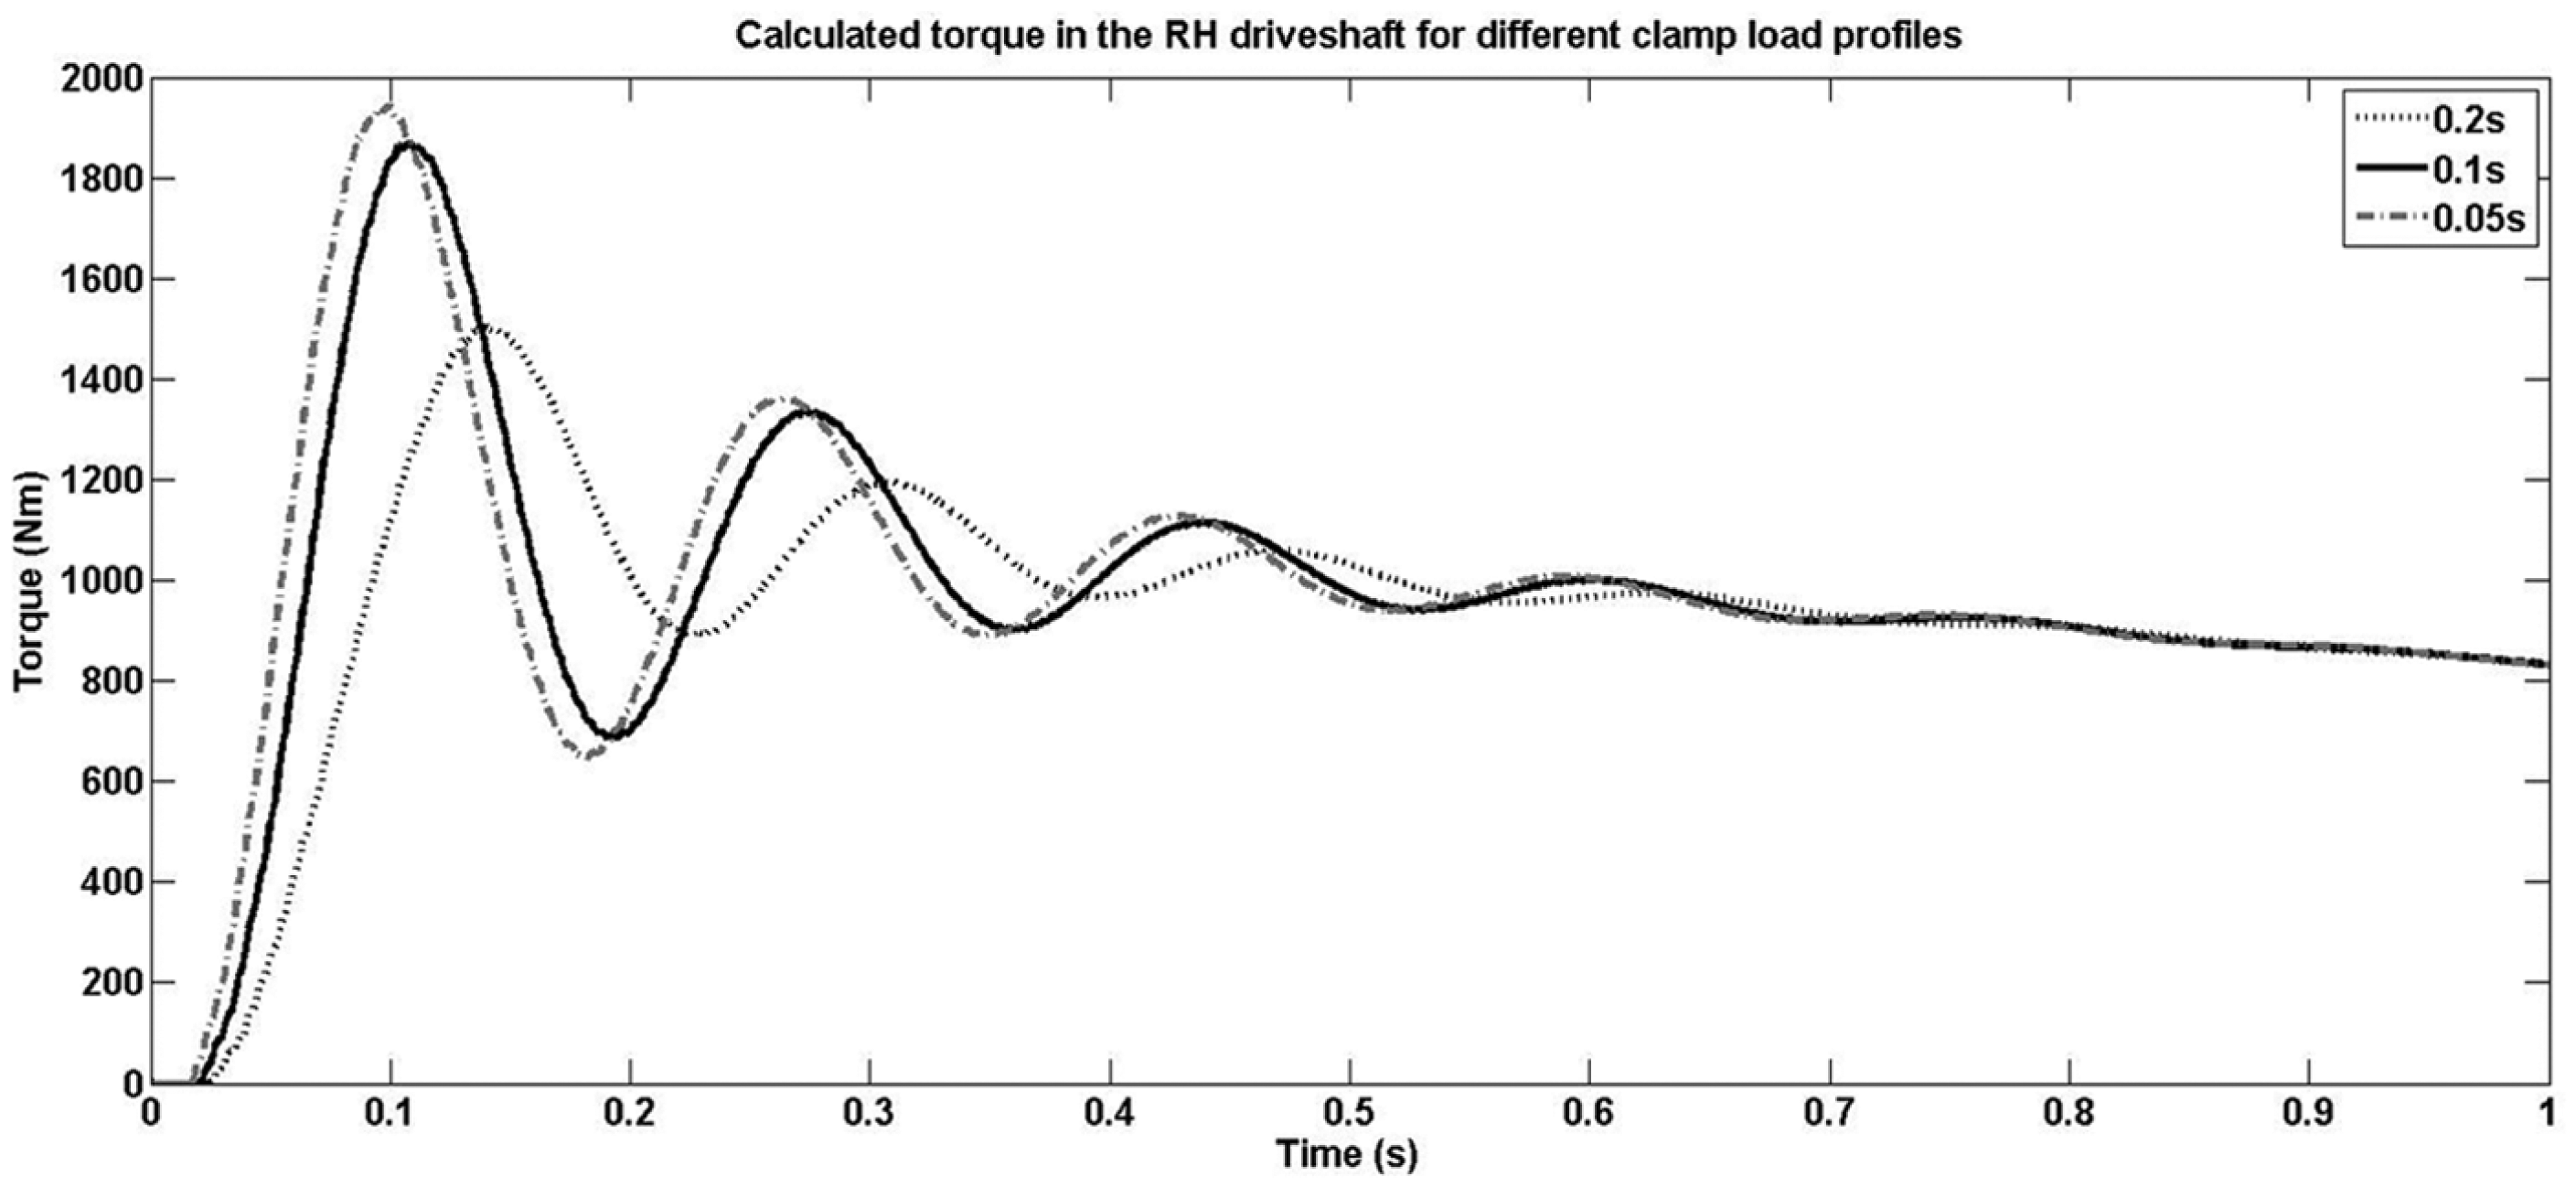
Time histories of the clamp load duration parametric study (RH driveshaft).
The predicted loads for slightly altered kinematic friction coefficient values are presented in Table 10. When lowering the coefficient to 0.25, a very small (approximately 8 N m) reduction is observed in the torque on both driveshafts. For a higher coefficient value (0.3), increases of 53 N m and 47 N m are noted in the LH shaft and the RH shaft respectively. These trends are in line with the outcome of the previous study (decreasing the clutch capacity during the engagement stage causes a decrease in the maximum predicted torque and vice versa). It does seem that the system is more sensitive to increases in the torque capacity, since a 0.02 decrease in the friction coefficient caused a reduction in the peak torque of 8 N m, while a 0.03 increase in the friction coefficient caused an increase in the peak torque of about 50 N m. The frequency content of the response is again unaltered (although the peak torque values are slightly shifted following the trend seen previously for the clutch clamping load). The final study involves altering the static coefficient of friction. The results for the two new coefficient values and the nominal case are almost identical, and so they were omitted. This is because, during the time frame studied, the clutch behaves under the slipping phase and, once the sticking phase is reached, the torque being applied to the system is fairly small. Thus, it does not induce significant variations in the loads on the system components.
Peak torque values: kinematic friction coefficient study.
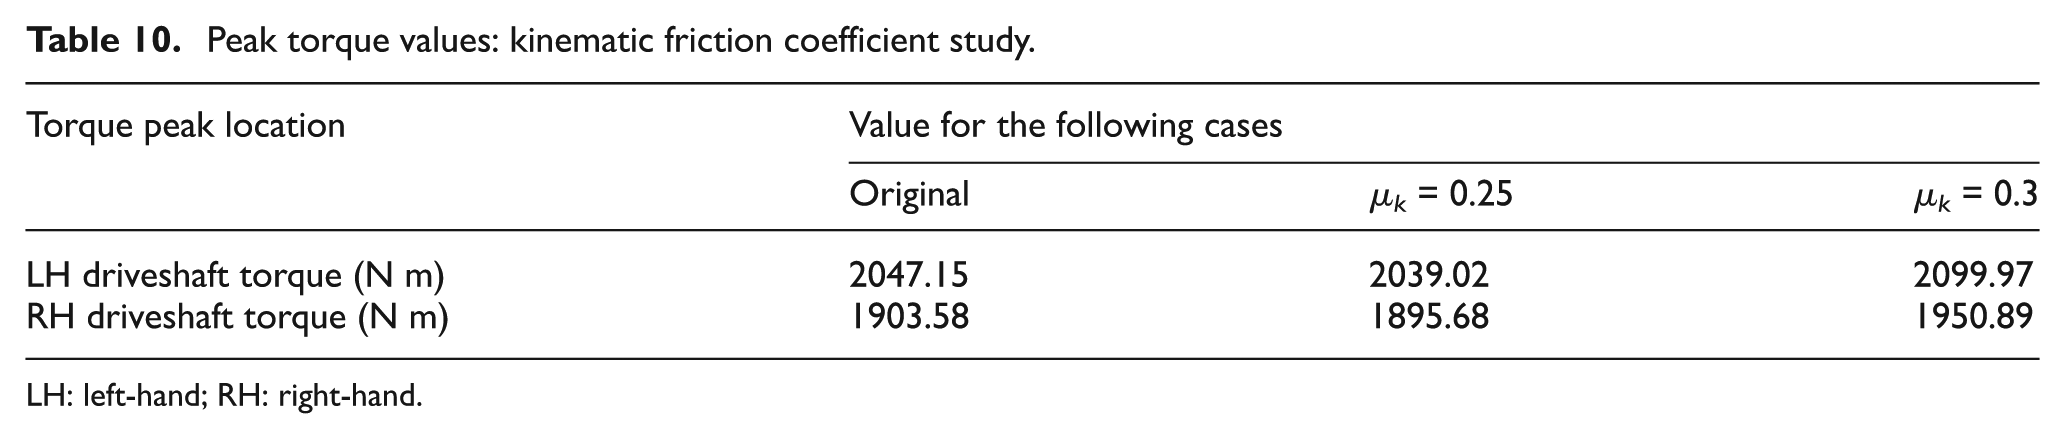
LH: left-hand; RH: right-hand.
Conclusions and future work
The transient vibrations of an FWD drivetrain were studied by developing a lumped-parameter model of the examined system. Non-linear effects of the various lash zones present in the system were considered (splined joints and gear teeth mesh). Using a Karnopp-based approach a simplified clutch model was integrated with the driveline model. Conditions of driveline impact start were imposed to determine the load–time history occurring across the drivetrain. The comparison of the numerical results with the experimental data obtained from a similar FWD system (for the same manoeuvre) confirmed the validity of the proposed approach, although some quantitative discrepancies appear for the reasons already mentioned. However, there was very good qualitative agreement between the model and the experiments.
A preliminary parametric study was conducted involving the main clutch parameters to determine their effects on the peak torque values. It was generally observed that a decrease in the clutch torque capacity during the initial stages of the manoeuvre causes a decrease in the maximum torque values in the driveshafts, increasing the time that it takes for this peak value to be reached and vice versa. The parameter that seems to have the largest effect on the system is the clamp load profile. An increase in the clutch clamping time (twice that of the nominal case examined) decreased the maximum torque by almost 17%. Although it may seem that extending the clutch clamp load engagement time is beneficial to a vehicle in terms of protecting the driveline components from excessive loading during abusive driving scenarios, this may have detrimental effects to the clutch disc life because of the increase in the engagement slip times and the thermal build-up.
A further conclusion that can be extracted from the parametric studies is that the kinematic coefficient of friction needs to be accurately modelled, as it can have a significant effect on the vehicle response. The kinematic friction coefficient was varied in the analysis as a function of the slip speed between the flywheel and the friction facing of the clutch; in reality, however, it depends on a number of variables, such as the temperature, the humidity, the wear and the surface roughness characteristics of the friction material. The above constitutes one of the main areas for future work. Overall, it can be seen that the generation of impact-induced vibrations in the driveline during system abuse events may lead to excessive loading in the driveshafts and potential teeth crashing phenomena in the transmission and differential. These operating conditions are alarming indications for the necessity of modern palliatives to control excessive system oscillations, such as implementing targeted energy transfer techniques, where auxiliary components can be fitted in the drivetrain to act as sinks for the excess of energy that is flowing in a transient manner. The latter is a key area for future investigations.
Footnotes
Appendix 1
Acknowledgements
Thanks are due to the Transmission and Driveline Team at the Ford Motor Company for its technical support.
Declaration of conflicting interests
The author(s) declared no potential conflicts of interest with respect to the research, authorship, and/or publication of this article.
Funding
The author(s) disclosed receipt of the following financial support for the research, authorship, and/or publication of this article: The authors wish to express their gratitude to the EPSRC for the financial support extended to the Targeted energy transfer in powertrains to reduce vibration-induced energy losses Grant (EP/L019426/1), under which this research was carried out. Research data for this paper are available on request from Stephanos Theodossiades.