
Abstract
The tricuspid valve (TV) separates the right ventricle from the right atrium, and biomechanical analysis of the tricuspid valve is a major topic in the biomechanics of the cardiovascular system. It provides insight into the prevention and curing of heart diseases related to tricuspid. In this study, we introduced an advanced three-dimensional model for investigating the mechanical behavior and hemodynamic efficiency of the tricuspid valve under physiological conditions using the fluid-structure interaction method (FSI). The geometry of the valve was reconstructed from CT and anatomical data to provide a precise leaflet and chordae tendineae representation. We used three models to characterize the complex nonlinear mechanical response of the valve soft tissue: the isotropic elastic model, the third-order Ogden model, and the visco-hyperelastic model. The results, including the shear stresses and the leaflet deformations, were presented and validated. Our model is a pioneer in analyzing the tricuspid (TR) biomechanics.
Introduction
The tricuspid valve (TV) separates the right ventricle from the right atrium.TV is responsible for letting the deoxygenated blood flow from the right atrium into the right ventricle during diastole and not allowing the blood to flow into the atrium during systole. The TV prevents backflow into the atrium by the closure of the leaflets. The valve consists of three leaflets: anterior, posterior, and septal. The leaflets are attached to a fibrous annulus and connected via the chordae tendineae to three papillary muscles as a part of the right ventricular wall. Many clinical investigations have shown the main role of TR in many existing heart diseases, including tricuspid regurgitation (TR).1–3 There are some methods for curing the malfunction of the TR, including surgical repair or replacement.4–6 In computational modeling, the investigation of TR gives better insight into the differences between its biomechanical and pure mechanical. Therefore, we used finite element (FE) analysis to study the motion of the leaflets during a cardiac cycle and the regions of stress concentrations in the valvular structure. However, the existing methods have uncertain efficiency, and the exact mechanism of the valve functions has remained.7,8 To reach an insured method of valve treatment, we need a better understanding of the valve’s physiological behavior using biomechanical data. Therefore, an advanced finite element model could be a useful tool that enables investigators to study complex structures and geometries using existing computational software for both aortic and mitral valves.9–11 Several simulation studies have studied the TR hemodynamics, where Stevanella et al. 12 introduced a finite element model for TR as a simplified model. Feng et al. 13 investigated whole heart modeling with TR in a fluid-structure interaction framework. In another study, Kong et al. 14 investigated the deformation of TR using the finite element method. The clinical studies have also investigated the mechanical behavior of TR, a review of pathology, Imaging, and Current Treatment Options.15–18 Kong et al. 14 modeled the deformation of tricuspid valves using CT images, where they developed a finite element model of TVs from multi-slice computed tomography (MSCT) images to investigate chordal forces and leaflet stresses and strains. Singh et al. 19 also introduced a computational model for the investigation of TR dynamics and simulated changes in closure dynamics. Johnson et al 20 presented a model for TR leaflets and the chordae tendineae to capture the cusp deformation. In another study, Mathur et al. 21 studied the remodeling-induced variations regarding the mechanics of the TR valve using a reverse-engineered model of the human TR.
Regarding the fluid-structure interaction models, To the best of our knowledge, only minor models have incorporated fluid-structure interaction with physiologically detailed TR. 22 Davey et al. 23 aimed to establish a model for cardiac fluid dynamics, and Zingaro et al. 22 simplified valve structures through resistive immersed implicit surface methods. In another attempt, Feng et al. 13 investigated the hemodynamics of the whole heart valves using the FSI method. They presented a computational model for the heart and all valves using a hyperelastic material and fluid-structure interaction. Le et al. 24 introduced an FSI model of heart valves in patient-specific left heart anatomy. Finally, Dabiri et al. 25 examined the effects of the MitraClip position on TR using the FSI method. As mentioned above, there are rare models for studying the biomechanics of TR. Moreover, no model compared the different material properties of TR. Therefore, this study aims to develop a comprehensive fluid-structure interaction (FSI) model for investigating the mechanical behavior and TR hemodynamic efficiency under physiological conditions. The geometry of the valve was reconstructed from CT and anatomical data to provide a precise leaflet and chordae tendineae representation. We used three models to characterize the complex nonlinear mechanical response of the valve soft tissue: the isotropic elastic model, the third-order Ogden model, and the visco-hyperelastic model. The k-ε turbulence model was used to model the blood flow through the valve and it well characterizes the turbulent nature of the pulsatile flow. Appropriate boundary conditions were implemented to mimic the physiological conditions, like flow and pressure profiles at the inlet and outlet, and the interaction forces between the fluid and the valve structure. All these elements will be elaborated on in detail in the following sections and form a solid foundation for evaluating the biomechanical and hemodynamic behavior of the valve.
Materials and methods
Geometry
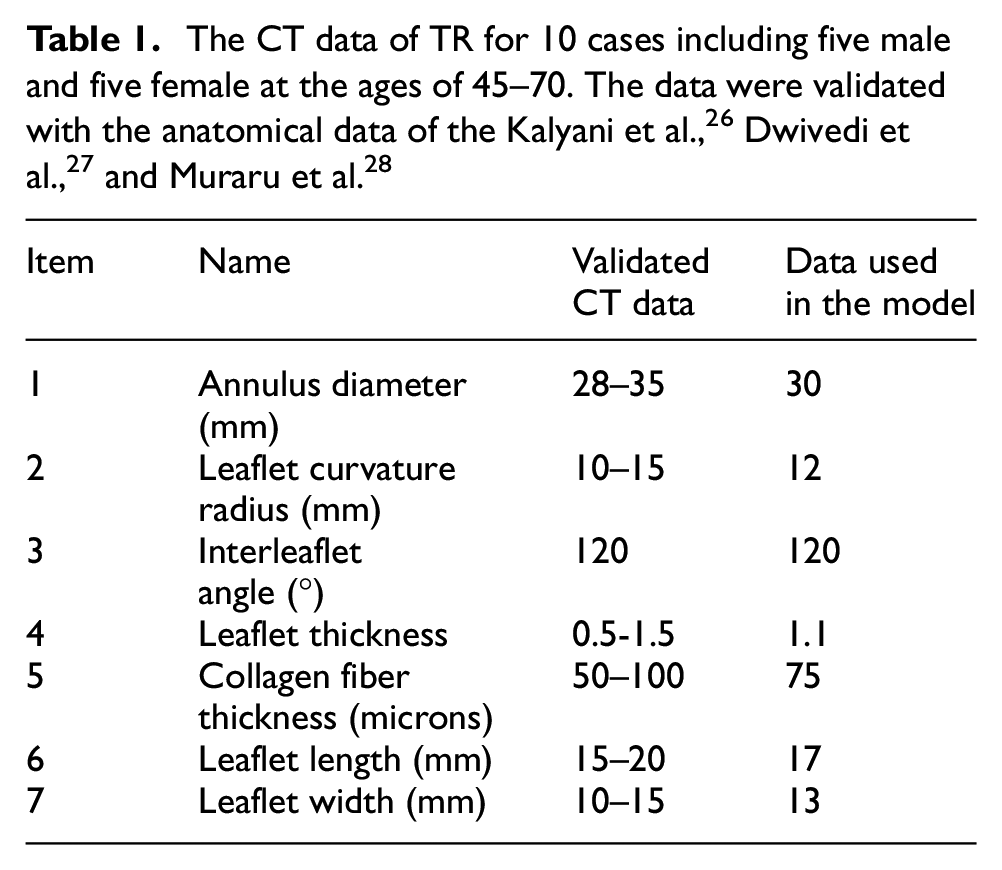
The aortic geometry was patient-specific where the CT scan of 10 adults with a normal tricuspid valve geometry was extracted. The samples were five males and five females and their ages varied between 45 and 70 years old. We compared our dimensions with existing Morphometry of different dimensions of the tricuspid valve26–28 to validate the obtained dimensions and build an accurate geometry. The confirmed anatomical data of the valves are shown in Table 1. Figure 1 illustrates the anatomy of the tricuspid valve. It shows the 3D tricuspid valve structure and the chordae tendineae. It comprises three cusps that are separated from each other by 120°. It describes the cusp size in terms of its 17 mm height and 13 mm width which defines anatomical features of the valve. 29 The chordae tendineae, which allow for coordinated movement of the cusps, are well demonstrated at the base of the valve. The cylindrical channel of the blood flow 33 mm in diameter is shown. The position of the tricuspid valve within the channel is highlighted.
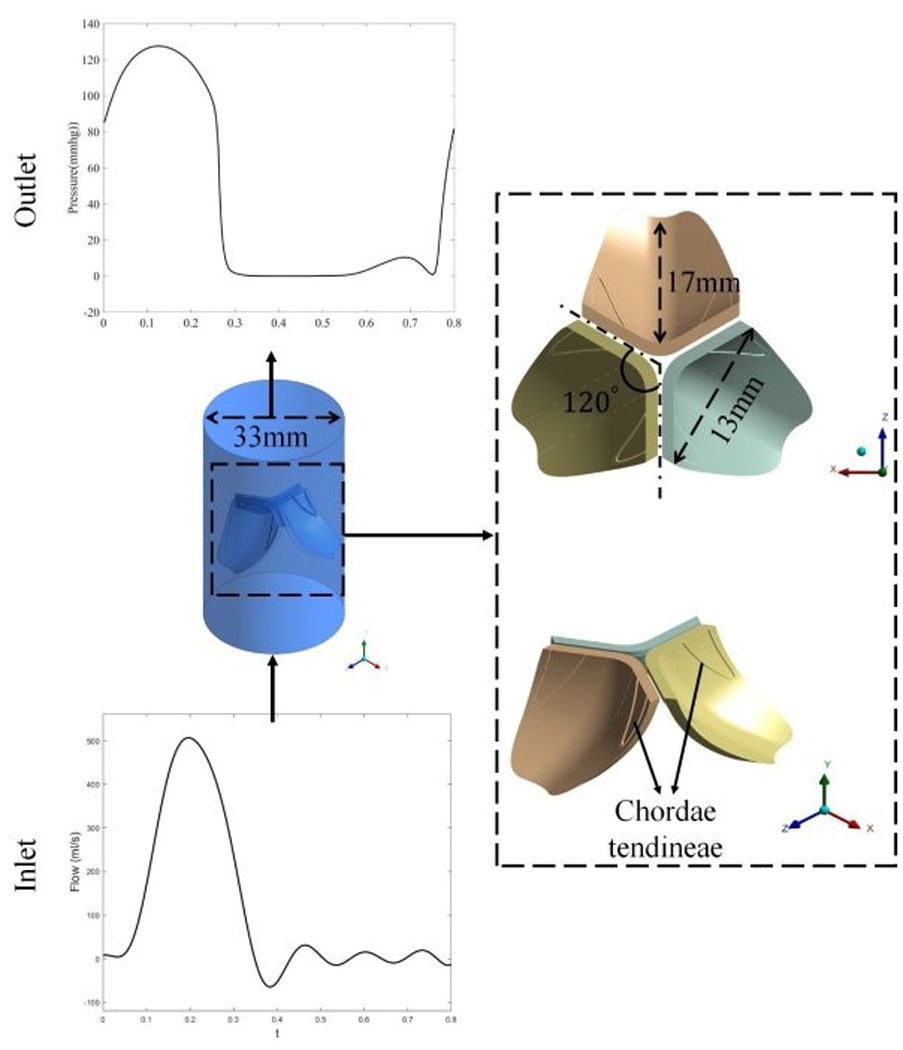
Tricuspid valve geometry and the boundary conditions applied. The right panel shows the 3D tricuspid valve geometry made up of three cusps separated by 120° and chordae tendineae. The left panel shows the 33 mm diameter cylindrical blood flow. The inlet and outlet waveforms 2 represent the pulsatile nature of the blood flow, with well-defined flow and pressure changes with time. These boundary conditions are necessary for FSI modeling.
FSI modeling
In FSI simulations, computational fluid dynamics (CFD) and structural solvers are coupled and synchronized to obtain a global answer. On the solid-fluid interface, the pressure data are transferred from CFD to the structural solver and the displacements from the structural solver to CFD in each iteration. FSI models provide a promising tool for modeling cardiovascular biomechanics because they are located at the interface of cardiac tissue and blood flow. Ansys and fluent and transient structural (Ansys, Inc., USA) were used for two-way FSI simulation. FSI modeling is a major method to accurately model the complex interaction of the blood flow and dynamic valve motion of the tricuspid valve. The coupling between the deformable leaflets of the valve and the pulsatile flow was simulated in this work by utilizing a fully coupled FSI approach. The blood was simulated as an incompressible, viscous fluid under the Navier-Stokes equations. The mechanical response of the valve leaflets was modeled using hyperelastic and viscoelastic material models. Specifically, three models were applied: the isotropic elastic model, the third-order Ogden model, and the visco-hyperelastic model with the viscoelastic response modeled by Prony series formulation. In the fluid field, the k-ε turbulence model was employed to simulate the intricate flow patterns along the valve.
Fluid modeling
In this research, the tricuspid valve blood flow was modeled using the k-ε turbulence model. The k-ε model is widely employed in computational fluid dynamics to simulate turbulent flow because it provides a good compromise between computational expense and accuracy. As the blood flow is complex and pulsatile in nature and there are vortices close to the valve leaflets, the k-ε model is a convenient approach to simulate the turbulent character of the fluid domain.
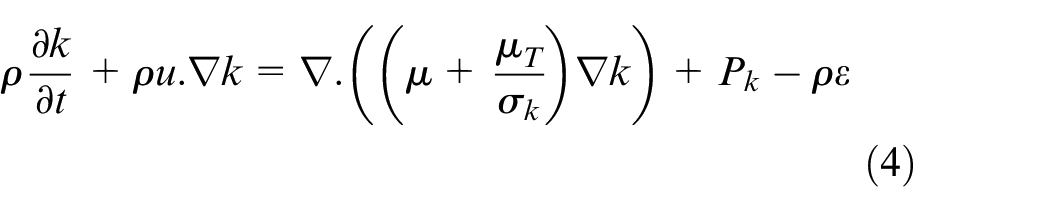
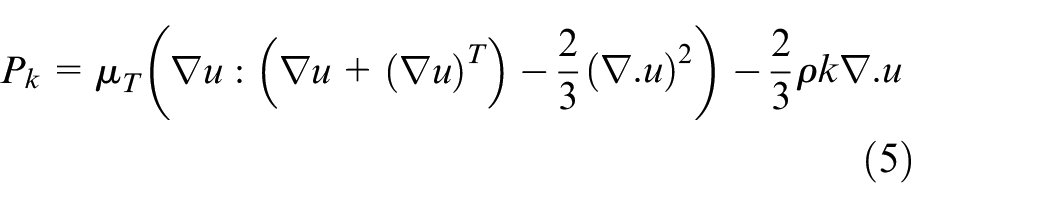
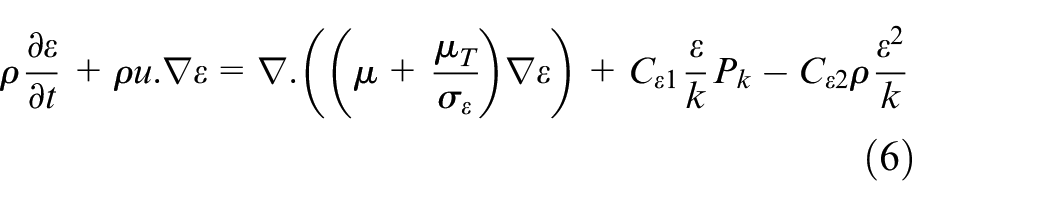
The k-ε model introduces two additional transport equations to account for the turbulent kinetic energy (k) and the dissipation rate of turbulent kinetic energy (ε). To describe the fluid flow, we used the Navier–Stokes equations and an incompressibility equation 31 :


where
which
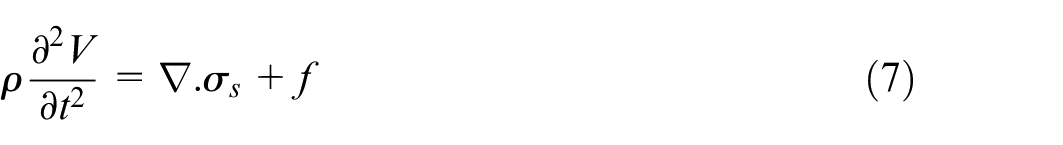
where
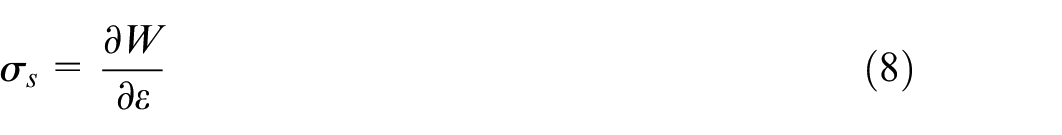
which W is the strain energy density.
For the present simulation, blood was treated as an incompressible Newtonian fluid with a constant density of 1050 kg/m3 and a dynamic viscosity of 0.004 Pa·s. 13
Structure modeling
Isotropic linear elastic
The isotropic elastic model was employed to simulate the mechanical behavior of the soft tissue of the tricuspid valve. This model was used because it is simple and capable of representing the elastic behavior of biological tissues within small to moderate deformations. The isotropic assumption implies that the material properties are the same in every direction, so the model is particularly computationally cheap when directional dependency of mechanical behavior is of secondary interest. 30 The stress-strain behavior of an isotropic elastic material is governed by Hooke’s law, which is expressed as follows:
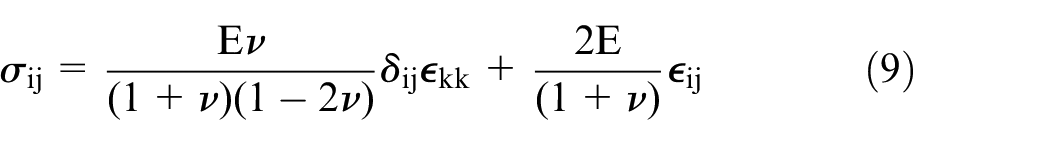
where
In this study, the material properties of the tricuspid valve’s soft tissue were assumed to be
The isotropic elastic model provides a comparison basis for the more sophisticated hyperelastic and viscoelastic models so that the influence of the material behavior assumptions can be evaluated on the mechanical response of the valve.
Third-order Ogden model
In this study, the mechanical response of the tricuspid valve soft tissue was modeled using the third-order Ogden hyperelastic model. The model is considered to capture the complex, nonlinear elastic response of soft biological tissues, particularly in states of large deformation. The third-order Ogden model provides a versatile representation of material response according to its dependency on principal stretches and material constants determined by fitting with experimental data. The third-order Ogden model’s strain energy density function is presented as:
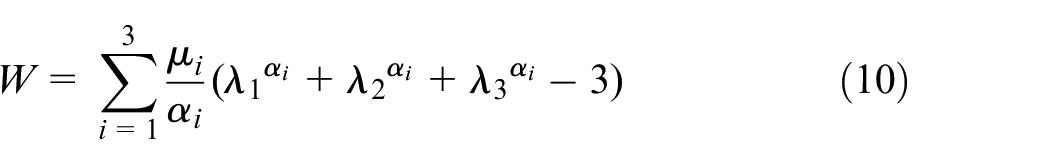
where
For the healthy tricuspid valve, the material constants were adopted,
31
which fitted these parameters to experimental equibiaxial test data. The coefficients are
Visco-hyperelastic
The hyperelastic response of material was modeled by the Mooney-Rivlin formulation, well-established for defining large deformation behavior of incompressible, nonlinear elastic materials. The Mooney-Rivlin model is phenomenological strain energy potential-based with the definition for the material being a function of the material invariants. This model is also best suited for defining biological tissue and soft material because of its ability to exhibit nonlinearity and large strains.
The two-parameter Mooney-Rivlin model strain energy density function is expressed as follows:
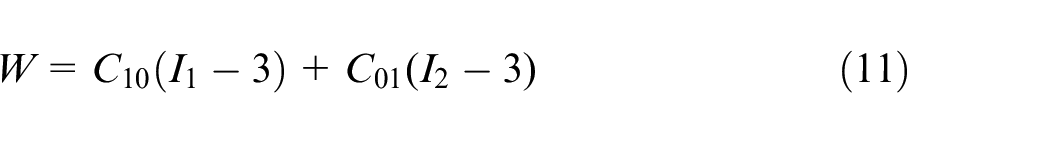
where
The material constants were determined through experimental data fitting.
32
The coefficients used in this study were
This model was integrated with a viscoelastic Prony series to account for the time-dependent behavior, providing a comprehensive representation of the material’s mechanical response under large deformations and varying strain rates. The Prony series parameters were defined as
Boundary conditions
The boundary conditions applied in this study were chosen to emulate the physiological condition of the tricuspid valve and ensure accurate FSI simulation. As shown in Figure 1, the outlet and inlet waveforms also adhere to the pulsatile nature of blood flow. On the inlet, a flow profile was imposed and on the outlet, a pressure waveform comprising well-defined pressure drops and rises was imposed.33,34 Chordae tendineae were modeled as elastic, which supports simulating the function of providing the tricuspid valve leaflets with proper function and stability. During this work, the condition of an elastic support with a stiffness coefficient of 0.0001 N/mm in the region of the chordae was applied. This approach ensures that the chordae provide adequate restraining force while allowing the leaflets to deform realistically under blood flow and pressure.
Mesh sensitivity analysis
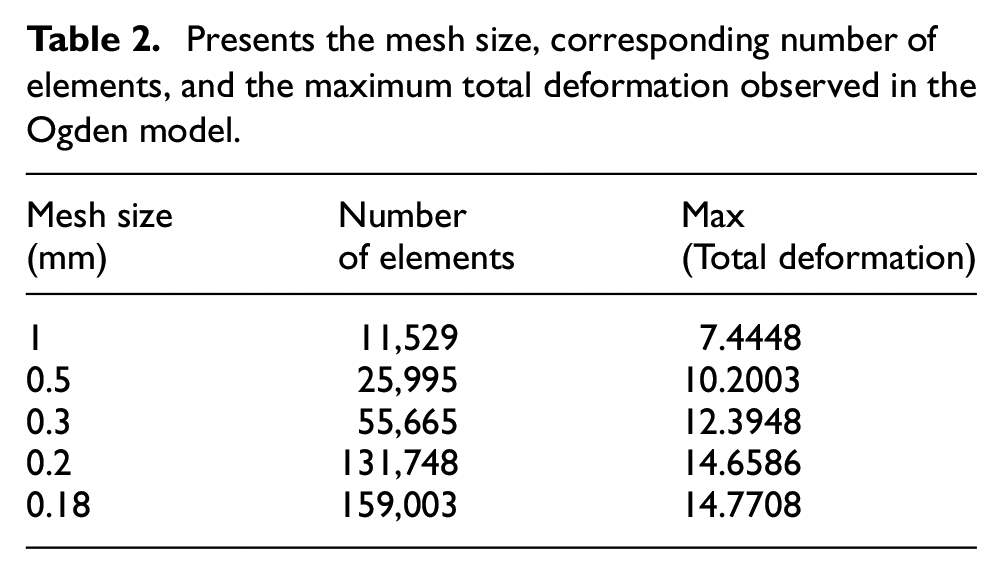
To properly solve the governing equations, we discretized the valve geometry using a finite element mesh. The mesh (tetrahedral elements) needed to be fine enough to provide an accurate answer but not very coarse as to compromise computational efficiency. A mesh sensitivity analysis was conducted, gradually decreasing the mesh until the error criterion (EC) was lowered below 1%. The error criterion, described in Table 2 of element number and mesh sizes, was used to determine the optimal mesh resolution. The method ensured that the simulation result was independent of the mesh size (0.2 mm) and provided accuracy for computational cost.

Presents the mesh size, corresponding number of elements, and the maximum total deformation observed in the Ogden model.
To examine the mechanical behavior of the tricuspid valve during physiological loading conditions, we considered two significant parameters: wall shear stress (WSS) and deformation components in the X, Y, and Z directions. WSS is significant because it provides information regarding how the blood flow interacts with the valve leaflets, describing the effect of the fluid on the valve surface. Simultaneously, deformation observation in different directions allowed us to comprehend the anisotropic mechanical behavior of the valve and the specific leaflet motion during the cardiac cycle.
Results
The results focus on evaluating the mechanical behavior of the tricuspid valve using three different material models: the elastic model, the Ogden hyperelastic model, and the visco-hyperelastic model. The outcomes are presented at two distinct time points, t = 0.15 and 0.6 s, corresponding to the peak valve opening and a later closure phase. The total deformation, deformation components along the X, Y, and Z axes, and WSS distribution were analyzed and compared for each model.
Wall shear stress (WSS)
Here, we present the WSS distribution on the leaflets of the tricuspid valve with three different material models: linear elastic, Ogden hyperelastic, and visco-hyperelastic models (Figure 2). The WSS was compared at two-time points: t = 0.15 s, which is the peak of valve opening, and t = 0.6 s, which is the subsequent phase of the closure cycle of the valve.
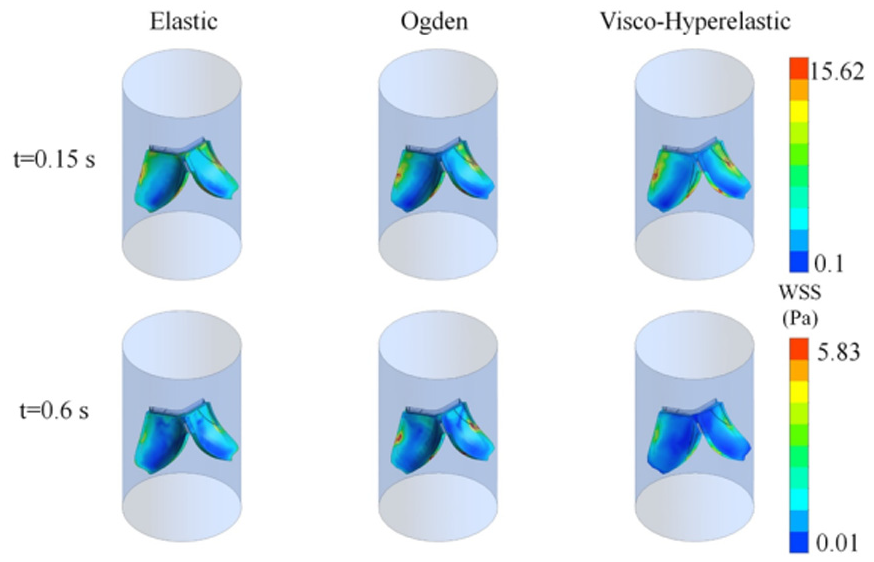
Comparison of WSS distributions across the tricuspid valve leaflets for three different material models: elastic (left column), Ogden hyperelastic (middle column), and visco-hyperelastic (right column). Results are plotted at two different time points: t = 0.15 s (top row) and t = 0.6 s (bottom row).
As shown in the figure, the visco-hyperelastic and Ogden models yield the most realistic and non-uniform WSS distribution across the leaflets, accounting for the material’s ability to better capture time-dependent and nonlinear deformations. At t = 0.15 s, the WSS is at its peakdue to the rapid valve opening and the resulting high-velocity blood flow interacting with the valve leaflets. The peak WSS values at the visco-hyperelastic model are about 15.62 Pa, concentrated in the leaflet tips, as a sign of intense fluid-structure interaction. Lower peak values with more diffuse stress patterns exist in the elastic model, with the possibility of simplifying the valve’s dynamic mechanical function. In t = 0.6 s, when the valve is closed, the WSS magnitude decreases. The visco-hyperelastic and Ogden models still have a more heterogeneous stress distribution, while the Elastic model has more smoothed and decreased stress concentrations. It was shown that the visco-hyperelastic and Ogden models could simulate the time-dependent relaxation and viscous properties of biological tissues.
Deformation
Figure 3 shows the dynamic valve leaflet motion under physiological loading simulated using a linear elastic isotropic constitutive material model. The left contour at t = 0.15 s shows highly deformed configurations with regions of maximum displacement (up to 9.513 mm) concentrated near the leaflet edges and indicative of high flexibility and motion. The right contour at t = 0.6 s indicates a more stable condition with less deformation because the valve leaflets are closing. This kind of deformation defines the critical operation of the valve in maintaining blood flow in one direction and preventing regurgitation.
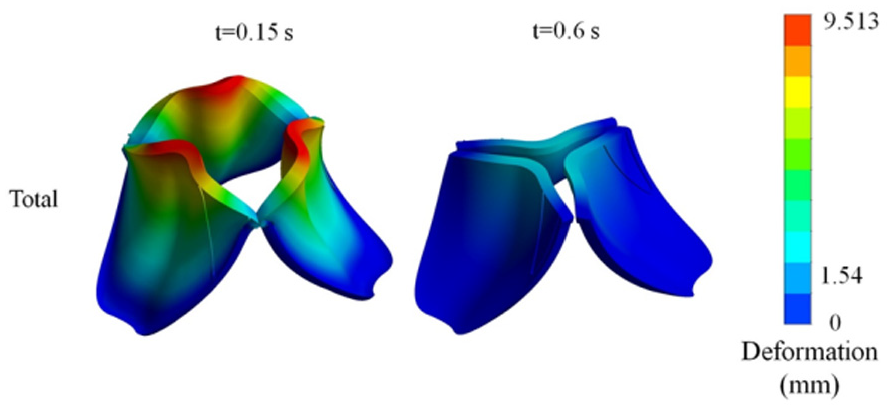
Total deformation of the tricuspid valve leaflets modeled with a linear elastic isotropic material model at two time points: t = 0.15 s (left) and t = 0.6 s (right). The color map indicates the displacement magnitude in millimeters, with the red regions showing maximum deformation and blue regions showing minimal movement. At t = 0.15 s, the valve undergoes significant deformation during the opening phase, while at t = 0.6 s, the structure stabilizes as the valve moves toward closure.
Figure 4 shows the deformation result for the tricuspid valve by the Ogden hyperelastic model at two different time instances: t = 0.15 and 0.6 s. The overall deformation and the components of deformation along X, Y, and Z directions are represented in color-scale form to indicate the dynamic valve motion during the cardiac cycle.
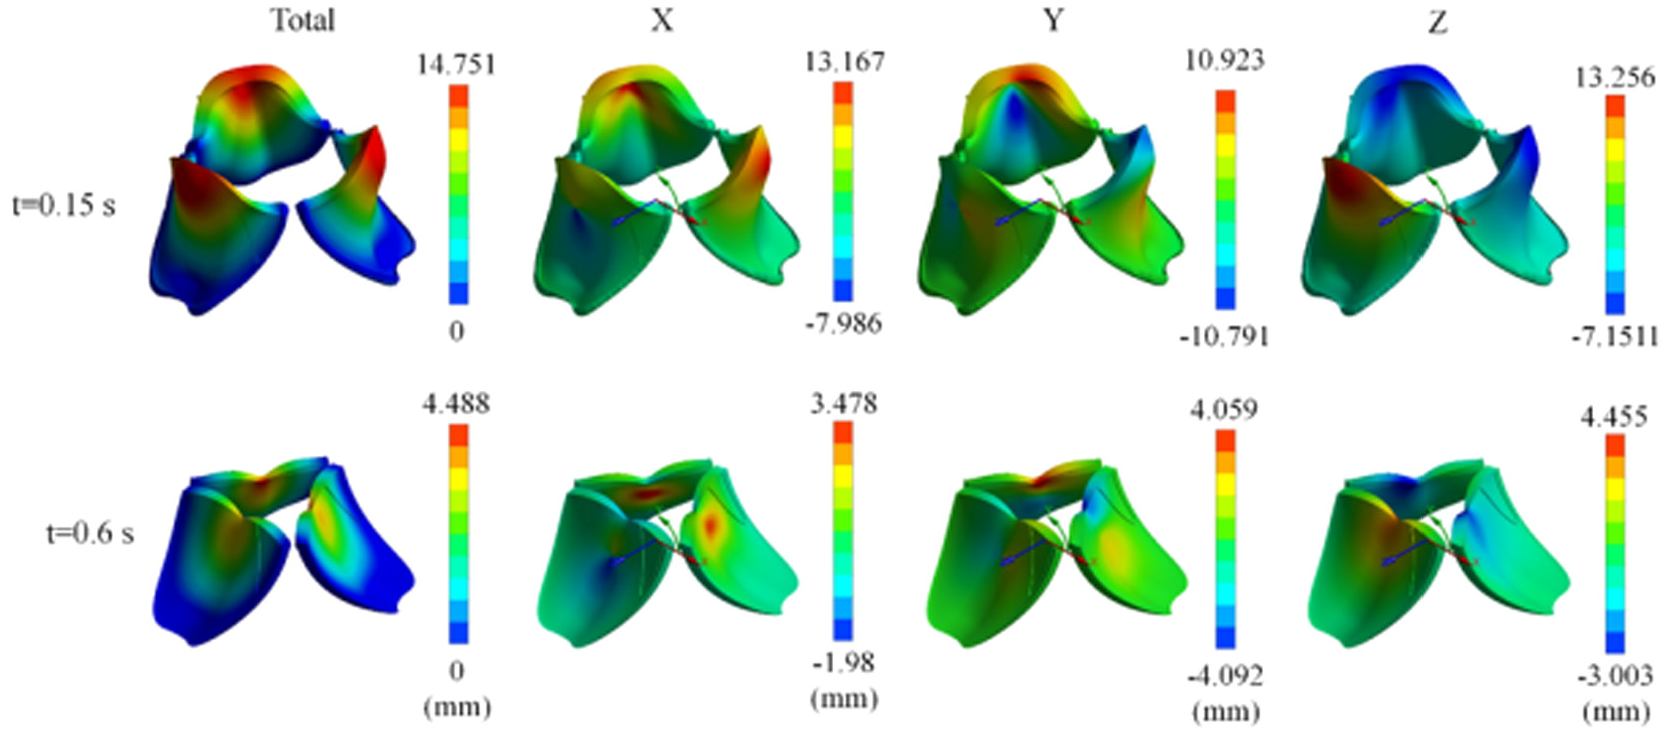
Deformation of the tricuspid valve leaflets using the Ogden material model at two time points (t = 0.15 and 0.6 s). The total deformation and its components along the X, Y, and Z axes are presented, with color maps representing the magnitude of the displacement (in mm). At t = 0.15 s, the valve is heavily deformed, particularly in the X and Z directions, indicating high movement at the beginning of the valve opening. At t = 0.6 s, the deformation decreased, indicating a more stabilized shape as the valve was close to being closed.
At t = 0.15 s, in the initial phase of the valve motion, total deformation is maximum with the maximum displacement of almost 14.75 mm. Deformation occurs at a maximum intensity along lines near free edges of valve leaflets and represents regions where deformation is maximum, and flexibility is maximum. X-axis deformation varies between −7.98 and 13.17 mm and shows large displacements along the transverse direction. The Y-axis deformation, which ranges from −10.79 to 10.92 mm, refers to the motion in the up-and-down direction of the valve structure. The deformation in the Z-axis ranges from −7.15 to 13.26 mm, which refers to the out-of-plane displacement of the leaflets.
At t = 0.6 s, that is toward the latter half of the cardiac cycle, deformation of the valve reduces drastically as the valve approaches a position of stability. The total deformation fell to an upper limit of 4.49 mm, indicating the falling forces on the valve leaflets. X-direction deformation ranges between −1.98 and 3.48 mm, indicating reduced lateral movement. The Y-movement decreases from −4.09 to 4.06 mm, while the reduction on the Z-axis is 3.00–4.45 mm.
The deformation of the tricuspid valve simulated using the visco-hyperelastic material model is shown in the figure at two points: t = 0.15 and 0.6 s (Figure 5). The results clearly indicate the dynamic behavior of the valve under physiological loading conditions, illustrating the complex interaction between the material properties and mechanical loads.
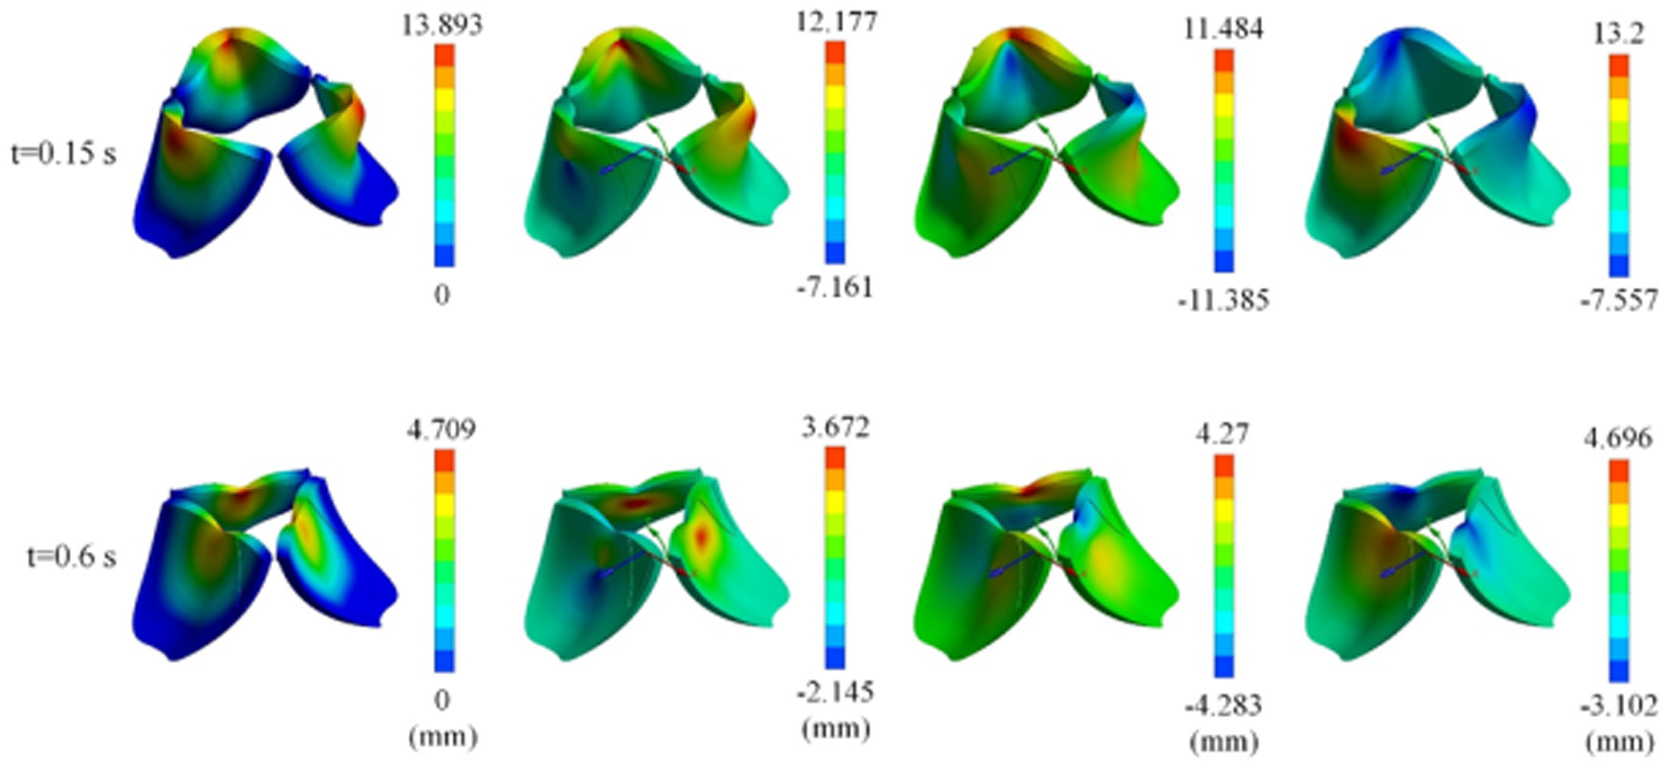
Simulated visco-hyperelastic deformation analysis of the tricuspid valve. The first row depicts t = 0.15 s deformation, where the maximum displacement is 13.89 mm, with extensive non-uniform motion of the leaflets. The second row depicts t = 0.6 s deformation, where the displacement drops to a maximum of 4.7 mm, as an indication of material relaxation and a more stable valve configuration.
The valve deforms heavily at t = 0.15 s, with zones of high displacement confined to the tip and edges of the leaflets, which are indicated by the red and yellow regions on the deformation map. The maximum displacement reached up to 13.893 mm, which suggests extensive bending and stretching under the forces applied. The central parts of the leaflets have comparatively low displacement, while the blue regions indicate little or no movement.
With further passage of time to t = 0.6 s, the magnitude of the net deformation falls considerably. The displacement values declined, with maximum recorded deformation approaching 4.709 mm. This reduction in displacement reflects the viscoelastic characteristics of the valve material, leading to a more stable structure as time passes. The deformation pattern was also more uniformly distributed and has less stress concentration at the tips of the leaflets.
The results validate the visco-hyperelastic model, which predicts the time-dependent mechanical properties of the tricuspid valve. The deformation patterns are in accordance with physiological expectations and serve as significant markers of the valve response to cyclic load conditions.
Discussions
In this study, we used an FSI framework to predict the biomechanical function of TV. We performed a comparative analysis among three different models of mechanical behavior of the tricuspid valve: the elastic model, the Ogden hyperelastic model, and the visco-hyperelastic model. A few studies performed FSI or CFD simulations for the biomechanics of TV compared with the aortic and mitral valves. Analyzing the deformations and mechanics of the TV leaflets has shown that the leaflets are like thin membranes and their mechanical responses are modeled by Laplace’s Law.35–37 Other investigations have assumed a parametric spline representation for the leaflets, and they proposed an inverse modeling approach to present the leaflets’ mechanical responses.38–41 These studies have indicated that TV leaflets experience large deformations under low stresses, which agrees with our results for all three models.
A comparison of the results of the three different material models revealed significant differences in the tricuspid valve’s mechanical performance, particularly regarding deformation and distribution of WSS. The findings highlight the importance of using a suitable material model to accurately simulate the dynamic response of the valve.
The Ogden hyperelastic and visco-hyperelastic models both had more realistic and non-linear deformation compared to the elastic model. At the maximum opening time (t = 0.15 s), both the Ogden and visco-hyperelastic models were able to indicate high deformations of the valve leaflets, where the visco-hyperelastic model showed marginally higher values of deformation values reaching approximately 13.89 mm. At the latter portion of the cardiac cycle (t = 0.6 s), the visco-hyperelastic model had shown further relaxation as it reduced the level of displacement to around 4.7 mm that reflects time-dependent behaviors in soft tissues. The Ogden model did observe a large deformation but without the time-dependent relaxation behavior exhibited by the visco-hyperelastic model.
An examination of the deformation components along the X, Y, and Z axes underscores the advantages of both the Ogden and visco-hyperelastic models. Both models better simulated the anisotropic and non-uniform patterns of deformation compared to the elastic model, reflecting the complex mechanical behavior of the valve’s soft tissue. The Ogden model provided a description of nonlinearity, but the visco-hyperelastic model provided the advantage of time-dependent response as well, making it more effective at simulating the real valve response under life conditions.
The WSS distribution was quite different between the three models, with both the Ogden and visco-hyperelastic models showing physiologically realistic results. At t = 0.15 s, the visco-hyperelastic model exhibited maximum WSS values of approximately 15.62 Pa, especially at the leaflet tips, where the fluid-structure interaction is strongest. The Ogden model also exhibited high WSS values, albeit with slightly reduced magnitudes and a more uniform distribution than the visco-hyperelastic model. At t = 0.6 s, both models showed a reduction in WSS, with the visco-hyperelastic model showing more relaxation. The WSS obtained in this study is consistent with previous studies.42,43
Our findings are in agreement with those of previous research emphasizing the importance of hyperelastic and viscoelastic behaviors in modeling heart valve tissues. Studies have confirmed that.14,44,45 The included time-dependent term of the visco-hyperelastic model offers an even more realistic simulation of the mechanical response observed in real.46–48
Conclusion
We performed a finite element model of the tricuspid valve using FSI based on real CT data from human valves. This study has already been able to study the biomechanical behavior of TR. We tried to show that clinical relevance could be achieved when the computational model is advanced and validated. Our model is a pioneer in analyzing TR biomechanics.
Footnotes
Declaration of conflicting interests
The authors declared no potential conflicts of interest with respect to the research, authorship, and/or publication of this article.
Funding
The authors received no financial support for the research, authorship, and/or publication of this article.