
Abstract
As the wind energy sector grows, offshore wind turbines (OWTs) have been pushed to have higher power outputs. This has led to large-diameter OWT support structures that are capable of withstanding aerodynamic and hydrodynamic loads as well as corrosion. This research analyses a 15-megawatt (MW) OWT support structure using analytical and numerical models. The analytical model was applied based on the Euler-Bernoulli beam theory. Static and modal finite element models were also applied. The structural stability implications of uniform corrosion on the stress evolution of the monopile and tower at different corrosion zones were discussed. Analytical and numerical (finite element analysis) predictions of stress evolution for different wind velocities and uniform corrosion material loss showed an agreement. The analyses showed that material loss due to corrosion increased the stress levels in the support structure. The location of the maximum tensile stress changed from the submerged to the splash zone, indicating that the splash zone may accumulate more damage over time due to the reduction of the monopile thickness and generation of local pits. Predicting the stress evolution due to uniform corrosion could be instrumental in the future designs of OWTs. It can be integral to fatigue assessments for enabling more detailed and accurate life predictions.
Keywords
Introduction
As the world transitions to renewable energy, which is considered as a key energy source, offshore wind energy has the potential to reduce carbon-based energy supplies. Improving the structural design and integrity of OWTs can bring further reductions in the levelised cost of offshore wind energy. Efforts towards these improvements have to be explored with increased attention to expanding offshore wind energy globally. In UK, fixed-bottom supported OWTs are the most commercially available, and monopiles sustain most of them due to their pragmatic installation. 1 With an average design life of 20 years, the serviceability of existing wind turbine structures in marine conditions is critical. In 2021, it was reported that 196 OWTs were put in operation, while 90 of them were installed using monopiles. 2 Thus, the life assessment of already installed monopiles will be needed. Furthermore, with the growth of renewable energy, high-rated capacity OWTs are installed deeper into the sea, 3 necessitating the use of large-diameter monopiles.
It is apparent that the rotor diameter and hub height will rise in tandem with the power capacity of future OWTs. As a result, the overturning moment of the monopile will increase. This means that a thorough understanding of the stresses in the support structure and the impact of the environment on OWTs will be essential. Loads acting on the OWTs consist of weight of the rotor-nacelle assembly, wind load on the tower and the sea wave with currents. These aerodynamic and hydrodynamic loads and soil-structure interactions must be considered in the OWT analysis and design.4,5 Corrosion must be considered due to the structure’s placement in seawater, as this represents the genuine conditions that OWTs face.
Due to lateral loads, bending stresses develop in the wind turbine monopiles. The location and magnitude of these stresses are needed to understand the risks of potential mechanical and environmental damage. When the OWT is in operational mode, the thrust force at the tower top is the most significant force acting on the structure because its design allows maximum power production. However, more insight is needed for parked (stationary) conditions under corrosion loss in the monopile region, which can create hazardous situations. Between 2000 and 2016, most wind turbine tower collapse accidents reported worldwide were due to storms. 6 Also, fatigue caused by the cyclic effects of the wind, quality control, and maintenance challenges were seen as significant contributors to these collapses. If addressed, it could reduce the frequency of wind turbine tower collapses. This consolidates the need to consider the effect of wind velocity on the stresses generated in the OWT support structure. Previous research works have mainly focussed on researching the soil-pile interaction of wind turbine support structures,7–14 fatigue assessments, design and performance,3,14–20 induced stresses in welds and connections and their performance21–25 and recently, corrosion26,27 while applying finite element analysis.28,29 Although key findings involved optimised design parameters, stress concentrations and corrosion mechanisms, missing gaps include integrating these factors, mainly how corrosion and stresses interact in the support structure.
Uniform corrosion, pitting corrosion and corrosion fatigue are detrimental forms of corrosion in support structures of OWT. The use of protective coatings and advanced design techniques to understand better corrosive environments to improve OWTs durability has been researched. 30 With pitting being the most damaging kind of corrosion, it was discovered that pit coalescence happens over time due to several pits combining and generating consistent volume loss over time, 31 which can affect the structural integrity. Due to the material loss, the wall thickness of the cross-section reduces. Pitting increases nominal stresses, where premature material failure can be observed if the material’s ultimate strength is reached. 32 This shows the importance of the local stresses that occur from the combination of uniform and pitting corrosion, with the former having a long-term impact. The increase in the seawater velocity has been shown to have a non-linear impact on the corrosion rate in marine environments. 33
Despite the conducted research, understanding how the stresses in the overall support structure change due to load variation is not fully developed, especially the estimated thrust force at the hub which is the main contributor to the total load in operation. In addition, there is a scarcity of research on using finite element analyses (FEA) to estimate general corrosion loss in wind turbine support structures at different corrosion zones to understand changes in local stress in towers and monopiles. Thus, a three-dimensional (3-D) FEA model and an analytical solution are developed in this work to predict the stresses in the tower, monopile and soil region of the 15 MW OWT designed by the joint efforts of National Renewable Energy Laboratory (NREL), Technical University of Denmark and University of Maine.
The demand for increasing the capacity of future OWTs would require an increase in their size to reduce the stresses generated by winds and environmental impacts such as material loss and creation of pits due to corrosion. In addition, changes in the dynamic properties, including the natural periods and the eigenmodes of the tower-monopile vibrations, are also expected to occur.34,35 The frequency for an OWT has been analysed to be between the 1P and the 3P regions, which correspond to a frequency band of 0.10 Hz to 0.38 Hz 36 (‘1P’ is the frequency of one complete rotor rotation, while ‘3P’ is blade passing frequency per rotation). However, this research focussed on stress evolution at different corrosion zones to understand the component of the support structure most susceptible to damage, especially for design considerations. So far, the two most detrimental effects identified are lateral wind loads and corrosion effects. Although separate effects, OWT’s response has to be considered for structural integrity purposes for these two effects.
The novelty of this paper is to incorporate a corrosion model into structural analyses to provide a better understanding of the effect of wind loads and corrosion rate on the stress levels over time for the largest prototyped and recently installed 15 MW OWT design. This goal is achieved by employing wind load models into finite element analyses and analytical solutions to predict the stress evolution by considering the impact of wind speed and uniform material loss due to corrosion, which has not been previously researched for large-capacity OWT.
The generation of load cases, analytical models, FEA models and corrosion implementation used in this work are all explained in Section 2. Section 3 summarises the findings after accounting for the magnitude of forces due to wind speeds and wave impacts, stress fields generated due to applied loads and material loss due to corrosion. Section 4 concludes the key findings from this study and suggests future research in the field.
Research methods
This section covers the description of the 15 MW NREL OWT used as a case study, methods used to determine the long-term environmental impact of uniform corrosion on this OWT, including the use of aerodynamic and hydrodynamic load cases for ultimate limit states (ULS), 4 turbine operating conditions, analytical model for analysis and finite element analysis.
Overview of 15 MW OWT design
In line with exploring high-rated capacity OWT with a large diameter, which is the current state of the art, NREL partnered with renowned industry experts to create a high-rated capacity 15 MW OWT as a reference model to aid research studies. This design was extrapolated from an OWT in operation. This conceptually designed OWT has a tapered tubular tower with a rotor diameter of 240 m and a hub height of 150 m supporting the Rotor-Nacelle Assembly (RNA). This wind turbine is classified as Class 1B direct-drive machine with its coordinate origin at the tower top. Table 1 summarises the essential parameters adopted from its specification. 36 The monopile has a constant section and the assembly is presented in Figure 1, with the mudline being 30 m below the mean sea level (MSL).
Properties of 15 MW OWT considered. 36
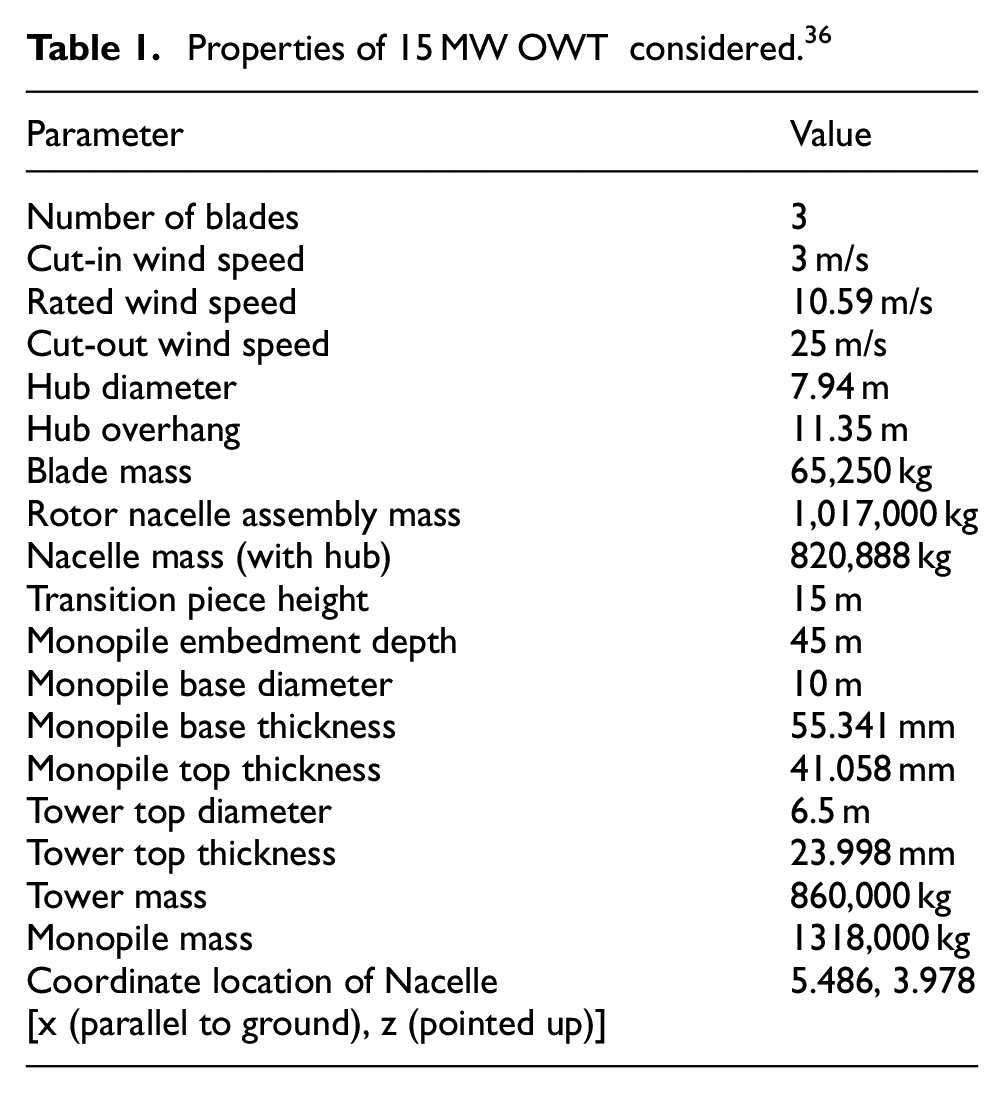
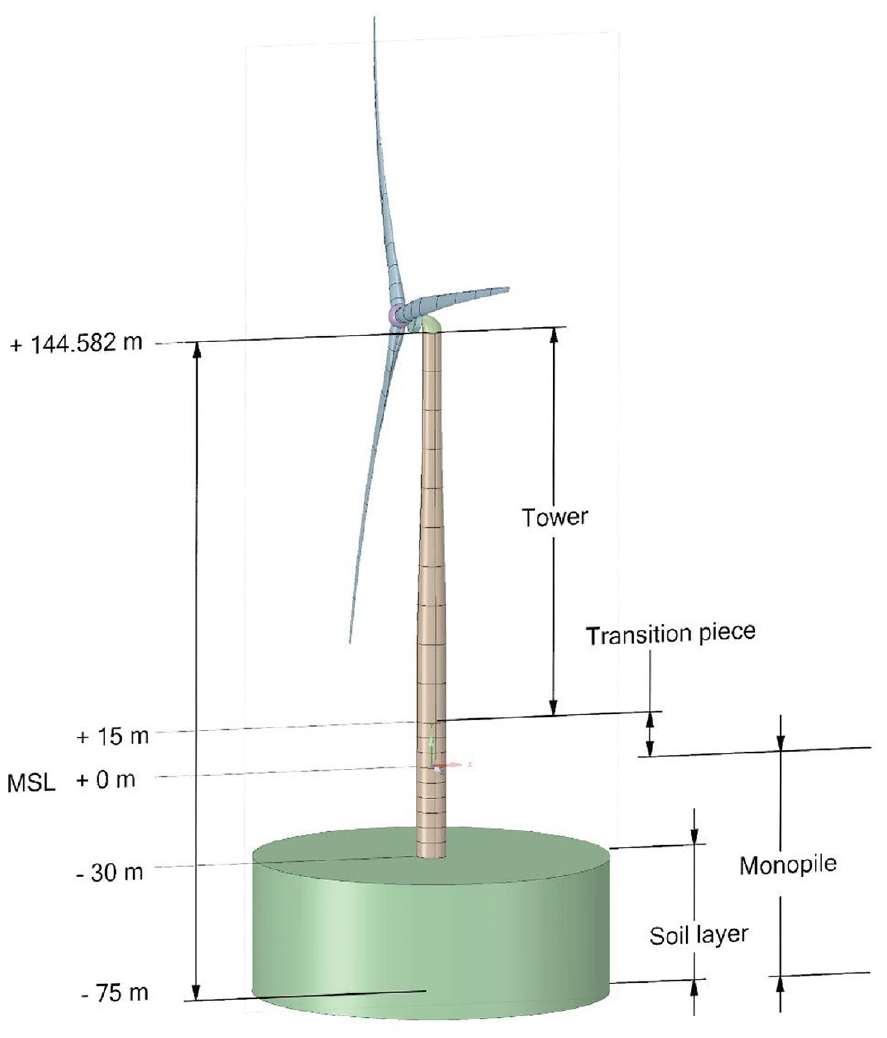
Illustration of an adapted 15 MW wind turbine geometry with modelled soil layer. .
Generation of load cases
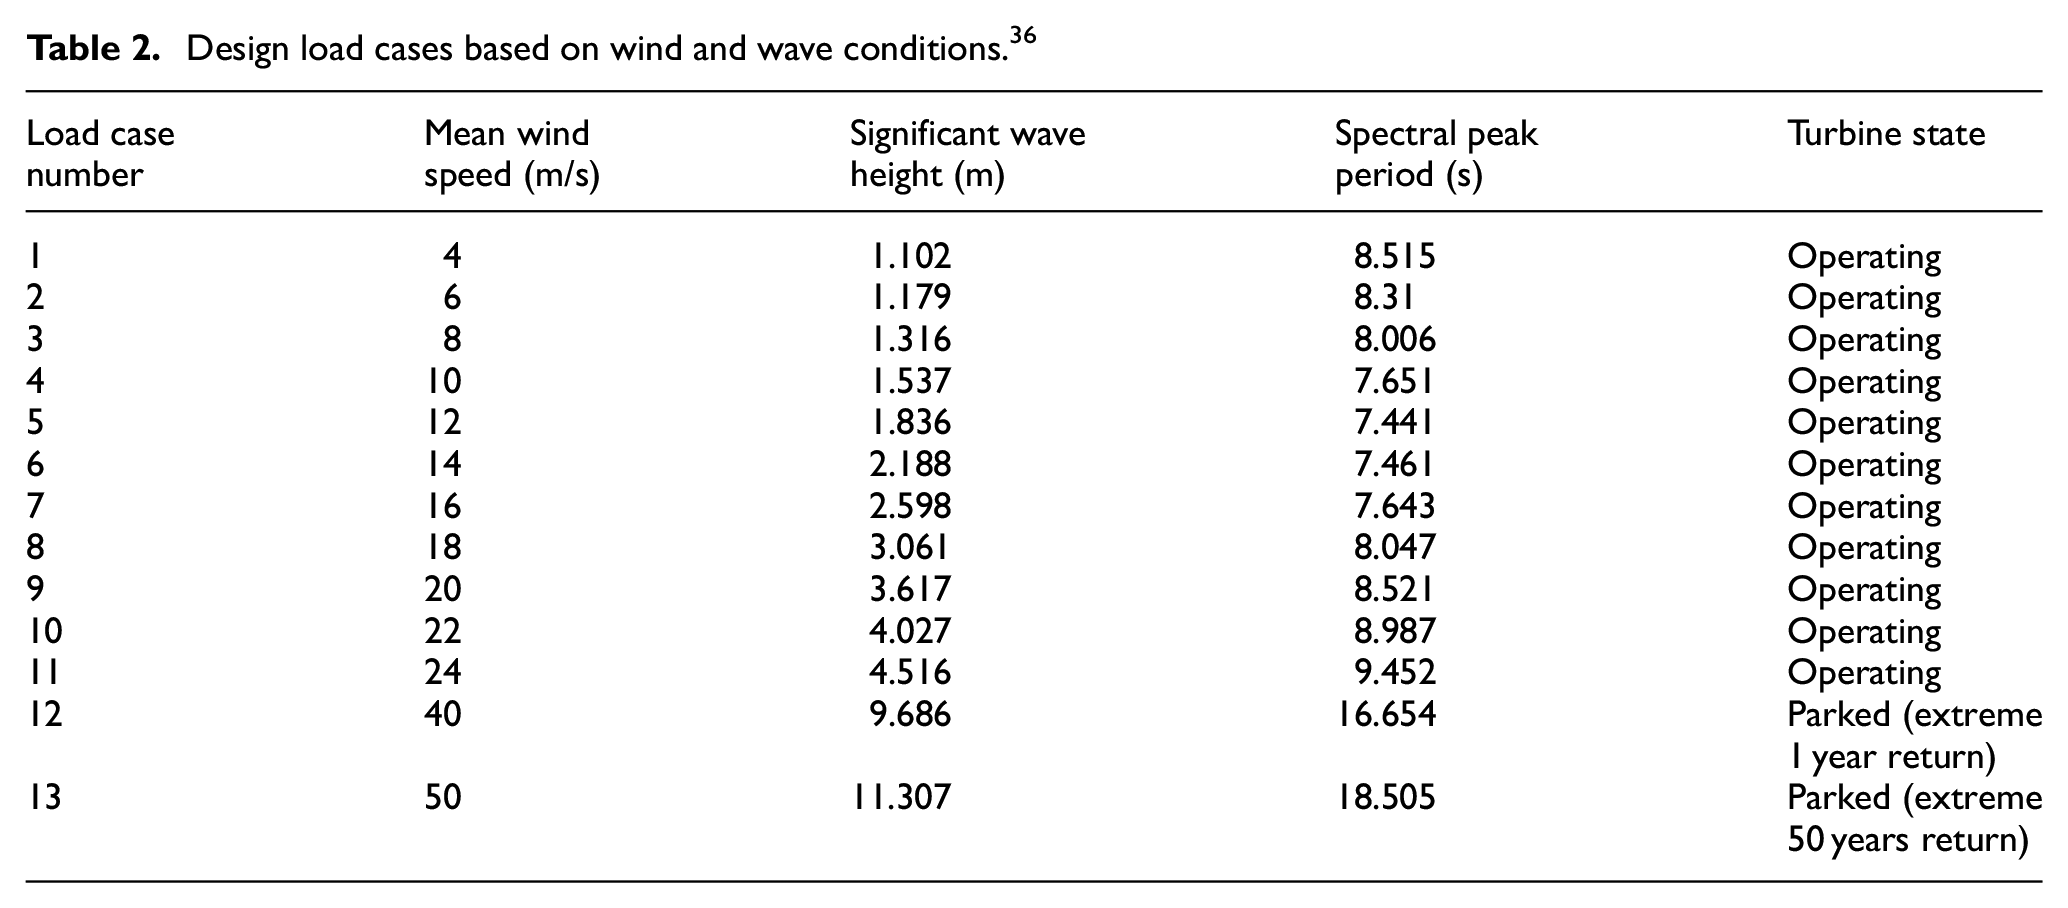
The ULS-based analysis used in this support structure is based on the specific wind, wave, soil and frequency characteristics. The analysed site meteorological ocean (met-ocean) characteristics are based on detailed 200-year wind and wave probability distributions collected from 23 offshore sites in the United States. 37 As shown in Table 2, the mean wind speed is represented by a Weibull distribution conducted on time series data, which yields the mean velocity and the related significant wave height is calculated using a spectral peak period. At a height of 10 m, the project site has a 50-year significant wave height and a 50-year 10-min extreme wind speed. The mean wind speed and wave height values in Table 2 have formed the basis for the design load cases for normal operating conditions as well as extreme wind and wave parked conditions presented in this section.
Design load cases based on wind and wave conditions. 36
OWTs are subjected to various loads, classified as gravitational, aerodynamic, hydrodynamic (static/dynamic), actuation, ice and wake loads according to BS EN 61400-3-1:2019. 38 Calculations and formulae for environmental conditions and loads are detailed in DNV-RP-C205. 39 For this study, inertia and gravitational loads, aerodynamic and hydrodynamic loads and soil impact have been considered for accessing the critical loads, bending stresses and effects of uniform corrosion. Current and hydrostatic loads have been analysed and discovered to have negligible effects. Effect of tilting moment has been studied and its effect has been found to be negligible. 40 The worst-case load for this case is caused by yaw-misaligned parking situations with excessive wind speeds and extreme coherent gusts with a direction change, which has guided the load case definition. Also, analysis has been considered at positions of maximum bending moment for maximum stresses in the vertical directions for which shear stress is negligible. The worst wind velocity has been taken to correspond to the worst-case wave height.
Wind load on rotor
The wind load operating on the OWT is determined by wind speed and the turbine’s aerodynamic form. The thrust force, FT, is generated by the rotor’s lateral wind forces. As it creates the largest bending moment near the base of the monopile, it is critical to evaluate this force for accurate analysis. The thrust force at the hub cannot be determined unless the power curves are known, from which the angle of attack may be taken to give the coefficient of thrust. The technical report for the 15 MW OWT design 36 provides these aerodynamic coefficients (see Figure 2), which provides the relationship between the power and thrust coefficients with wind speed. It could be observed that the generator reaches maximum power at 10.59 m/s, at which the rated wind speed and thrust force are expected to be at their peak.
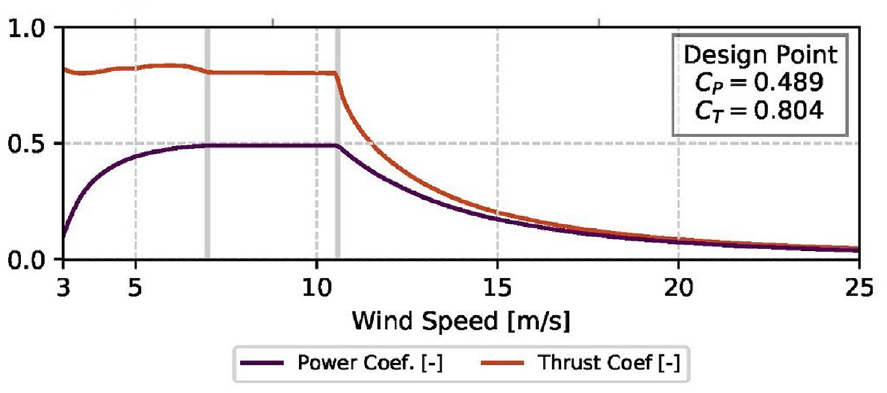
Aerodynamic coefficients for thrust force calculation. 36
The mean thrust force acting at the hub for static analysis is given in equation (1) 41 :

where CT is the coefficient of thrust obtained through the aerodynamic coefficient graph (see Figure 2), ρ is the mass density of air (1.225 kg/m3),
Wind load on tower
Wind loads operating on the wind turbine tower,

where C is the shape coefficient based on Reynolds number Re, ρ is the mass density of air,
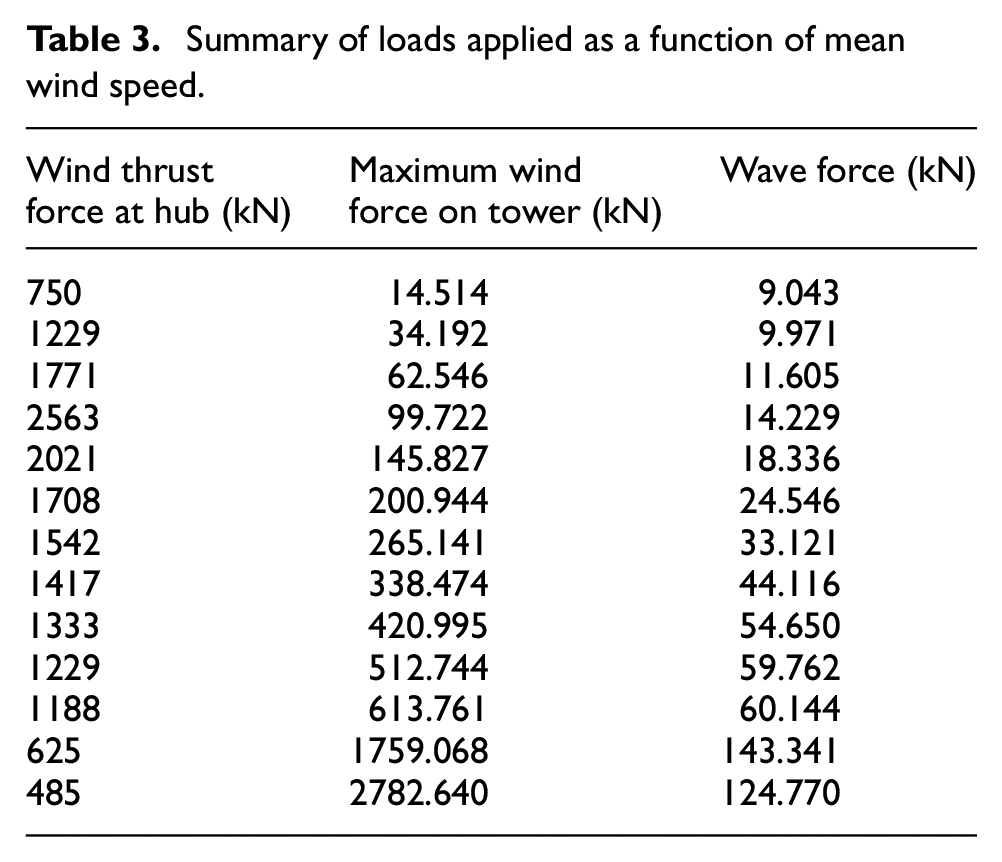
The limitation of equation (2) alone is that it doesn’t factor in the structure’s dynamic behaviour. To consider dynamic effects, BS EN 1991-1-4:2005 42 has been applied. From the mean wind speed, Vm, the basic wind speed, Vb, was calculated based on the conditions and terrain category as a function of the terrain roughness factor Cr(Ze). The turbulence intensity factor, Iv(Z), is a function of the maximum height Z (m) above the ground of the section being considered. A structural factor, CsCd, of 1.15 was applied throughout (notations detailed in BS EN 1991-1-4:2005 42 ). An increase in velocity produced a corresponding increase in the force experienced in the wind turbine tower. Table 3 summarises all loads applied to the OWT, including the wind force on the tower and the wave on the monopile. The maximum values are also summarised in Table 3, while calculations as a function of the height were considered in the analysis.
Summary of loads applied as a function of mean wind speed.
Wave load on monopile
The wave load on the monopile is calculated by Morrison’s equation (equation (3)) using the linear wave theory satisfying the conditions that the diameter of the monopile is smaller than one-fifth of the wavelength in accordance with DNV-OS-J101. 4 For the case of the OWT under consideration, the intermediate wave conditions are met and the values of horizontal velocity of flow and horizontal acceleration of flow are given in equations (4) and (5) respectively, as recommended by BS EN 61400-3-1:2019. 38

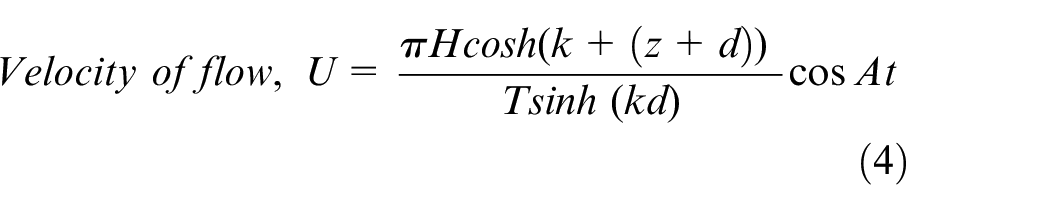
Where k = 2π/λ is the wavenumber, λ is the wavelength, D is the monopile diameter, ρ is the density of water (1029 kg/m3), A is the cross-section area of the monopile in the vertical plane, z is the positive height above the MSL, d is the depth from the MSL to the mudline,
The loads applied in this study are dynamic loads applied in a novel approach. A Weibull distribution was applied to wind speed versus time series and wave height versus frequency data. From the distribution analysis of the wave height and frequency, a correlating spectral peak period has been obtained, forming the basis for the load case presented in Table 2. 36
Analytical model for stress calculations
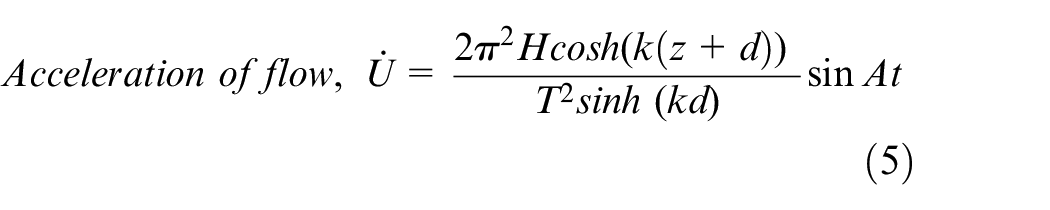
The guidance for calculating stresses in tubular members and joints consists of using beam theory to estimate the nominal tensile and compressive stresses. 4 The Euler–Bernoulli cantilever beam with masses representing the RNA and the blade has been applied to monopiles by Gupta and Basu. 44 The soil is represented by a fixed base with aerodynamic and hydrodynamic forces acting on the cantilever beam, as illustrated in Figure 3. It has been aimed at obtaining the bending stresses in tension and compression in the tower and the monopile for applied loading conditions.
Euler–Bernoulli cantilever beam considered for analytical model of 15 MW OWT.
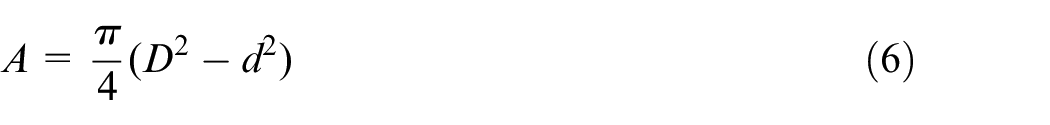
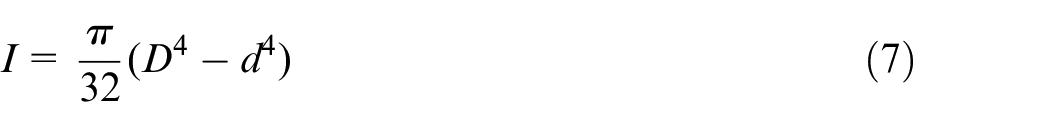
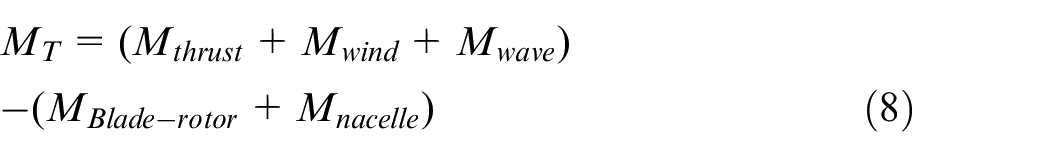
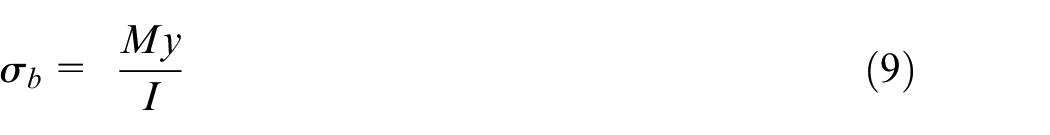
The cross-sectional area (A) of the tower and monopile (circular hollow section) and the moment of inertia (I) are calculated using equations (6) and (7), respectively. Following this, the total bending moment (MT) is estimated based on each force, direction and weight acting on the structure about the base (A-B) given in equation (8). Hence, the bending stress σb is calculated using equation (9). The compression stress σc is calculated using equation (10), where the force Fy is determined by the gravity acceleration and the mass of the entire OWT. The bending and the compression stresses act in the vertical (y) direction. The bending moments create shear stress in the vertical direction, which has a zero value at the locations with the maximum stresses due to bending and, hence, neglected. There is shear stress due to the lateral forces, which do not act in the vertical direction and it is quite small in magnitude, hence neglected. Considering all stresses contributing in the vertical (y) direction, the total stress in the y-direction σy is given in equation (11). Considering that the bending moments generate stress fields under tension (positive values) and compression (negative values), the values of the maximum tensile and compressive stress fields are given by equations (12) and (13) respectively.


Finite element model
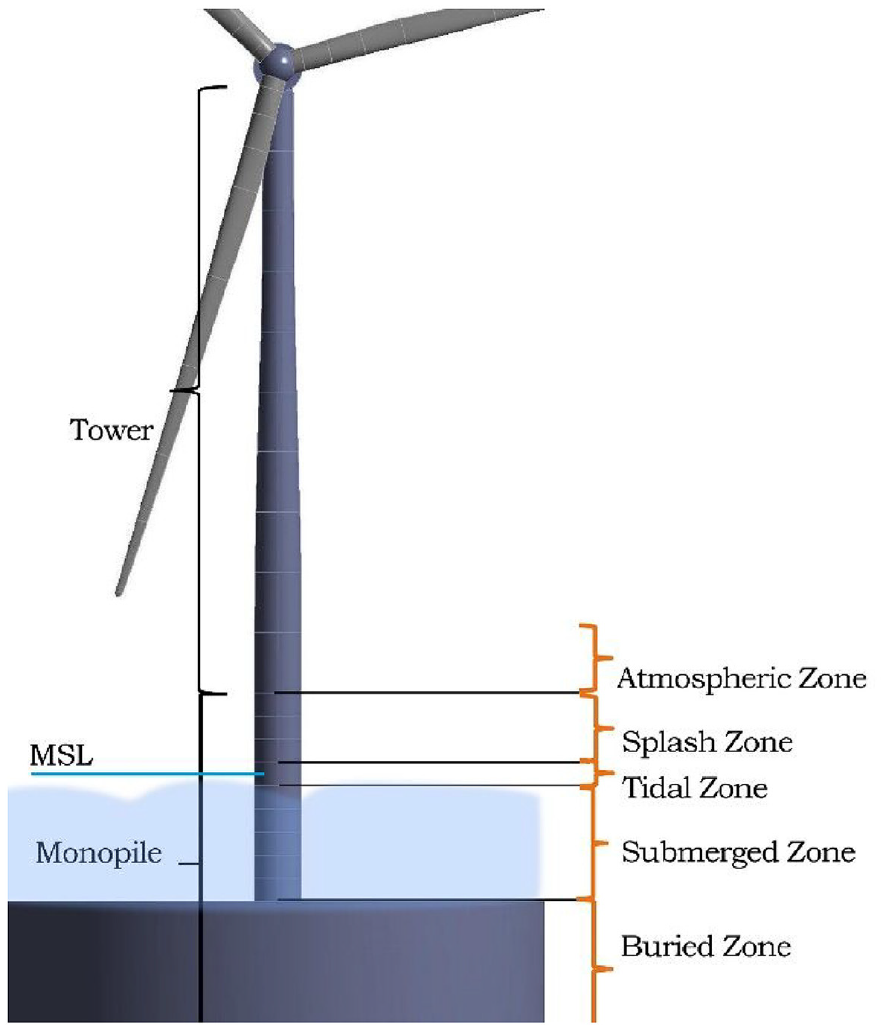
The 15 MW OWT support structure from Section 2.1 was modelled in the widely used commercial FEA software for structural analyses ANSYS Mechanical 45 (see Figure 1). This study conducted structural analyses for wind velocities in the range of 0–50 m/s, where load cases were developed and applied for a specific wind speed. As an example, a wind speed of 8 m/s is illustrated in Figure 4. The wind and wave forces are modelled in the same direction, and all sea states are regarded to be in just one direction according to IEC 61400-1:2019. 5 Considering different load directions can provide further understanding of how different stresses are distributed across the tower structure. However, considering the worst condition enables analysis of the ULS conditions and allows for comparative analyses of the thickness loss due to corrosion. The blade and the RNA are represented with point masses. Gravity acceleration is applied to the point masses and the tower structure. The thrust force is applied as a remote force acting at the centre of the rotor because when wind moves over the blades, it creates forces of lift and drag. These forces result in a net thrust force acting on the blades, pushing them in the direction opposite to the wind flow and transferring them to the rotor. The force on the tower was uniformly applied from the splash to the top of the tower as different wind speeds were experienced at different heights on the tower, and these zones were exposed to the effect of wind. The wave force was applied to the tidal and submerged zones as different wave forces are experienced at different heights on the monopile. These regions are underwater, as illustrated in Figure 5. The buried zone was represented with a soil model with zero displacements to its bottom and side surfaces in all directions.
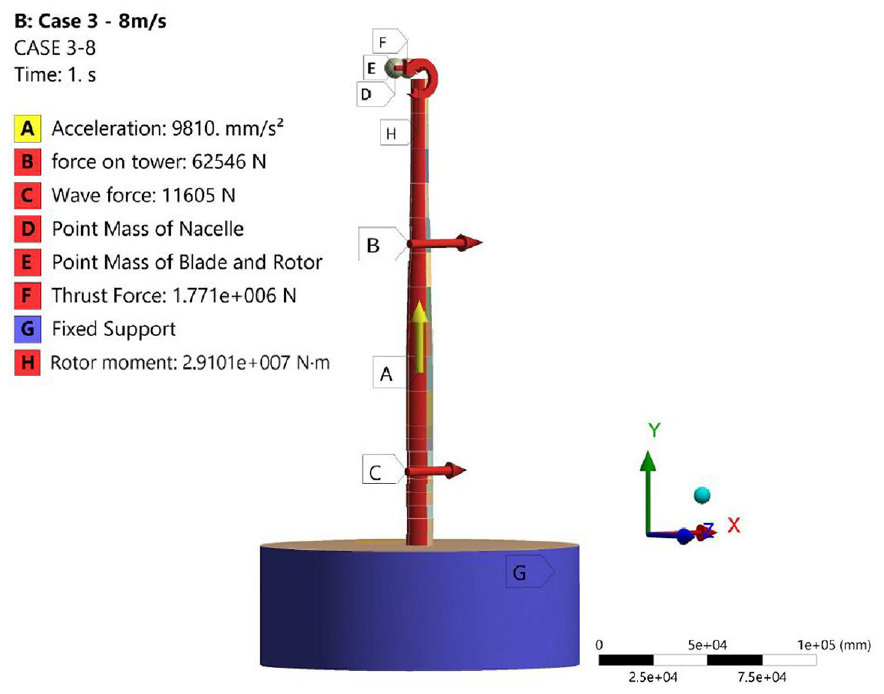
A 3-D FEA model in ANSYS showing loads and boundary conditions.
Corrosion zones in seawater for a large-diameter wind turbine.
S355 structural steel was used for the monopile, a common material for OWT support structures. 46 The monopile and the tower are modelled with isotropic elastic material properties. A Young’s modulus of 200 GPa, a Poisson’s ratio of 0.3 and a density of 7850 kg/m3 were used. 36
The model considered the soil-structure interaction to provide realistic representation of dense sand parameters.7,14,47 They are found in practically all sections of the North Sea, where most of Europe’s OWTs are located. 48 The Mohr-Coulomb soil model is used to model the mechanical behaviour of the soil using 3-D continuum elements, which were also used by Oh et al. 49 A soil model with a diameter of 120 m and a depth of 65 m was developed. Also, a Poisson’s ratio of 0.3, dilatancy angle of 7.5°, internal friction angle of 37.5°, unit weight of 11 kN/m3 and cohesion of 0.1 kN/m2 were used for the Mohr-Coulomb soil model. Figure 6 shows the difference in the results when considering the soil-pile interaction as in the numerical model and when it is not considered in the analysis. Although there is a negligible difference for both compression and tension values, modelling a soil pile interaction is necessary for enhanced reliability, efficiency and overall performance.
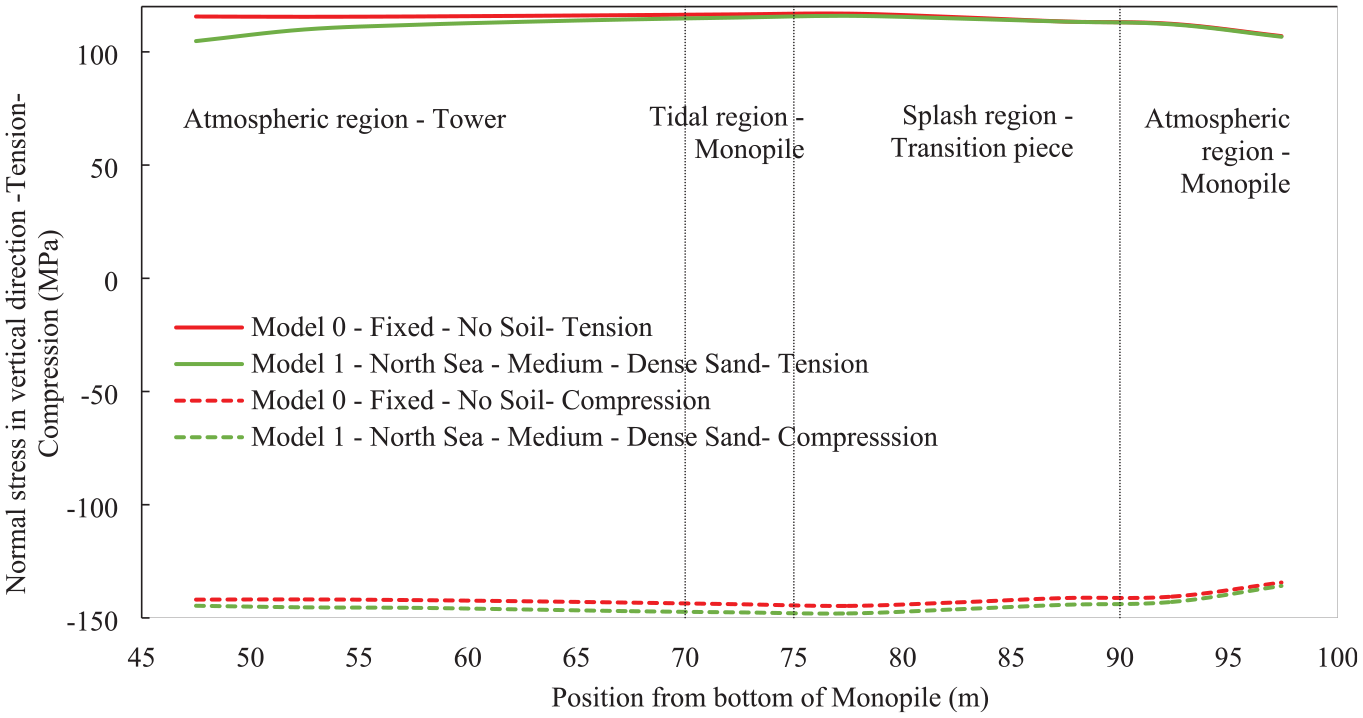
Effects of soil-structure modelling on the predicted stresses using ANSYS.
The natural frequency of this 15 MW OWT was also predicted and analysed. The natural frequencies at the first bending mode shape, which is the dominant mode shape due to the nature of the loads acting in lateral (x) direction, was obtained to be 0.16887 Hz and 0.1552 HZ for a model with fixed base and a model with soil representation respectively. These results from the frequency analysis were between the 1P and the 3P regions, which correspond to the safe frequency band of 0.10 Hz to 0.38 Hz that covers all wind speeds possible. 36 From the modal analysis, these frequencies are far from resonating frequencies and the structure will not resonate.
The tower and the monopile were meshed with four-node SHELL181 elements from the ANSYS library to represent their thickness. Due to the large dimensions of the model, an optimum element size was identified by conducting sensitivity analyses on the mesh. A coarse mesh density may result in overestimating the predicted stress due to over-stiffening, whilst a refined mesh density increases the computational time and could result in convergence issues. 50 Therefore, a mesh sensitivity study was conducted using element sizes in the range of 10 mm to 4000 mm. The stress results were recorded at the tension and compression zone of the splash region. The results in Figure 7 show that a finite element size of 150 mm is optimum for delivering accurate stress prediction and fast computing. The model meshed with element size of 150 mm (mesh is shown for illustration) resulted in 275,246 nodes and 381,193 elements. The designed thickness was assigned to the shell elements. The use of shell elements also allows the incorporation of material loss due to corrosion by changing the element thickness value of the shell elements. All the FEA computations ran with a four-core parallel distributed memory on an Intel Core i7-10510U CPU with 16 GB RAM.
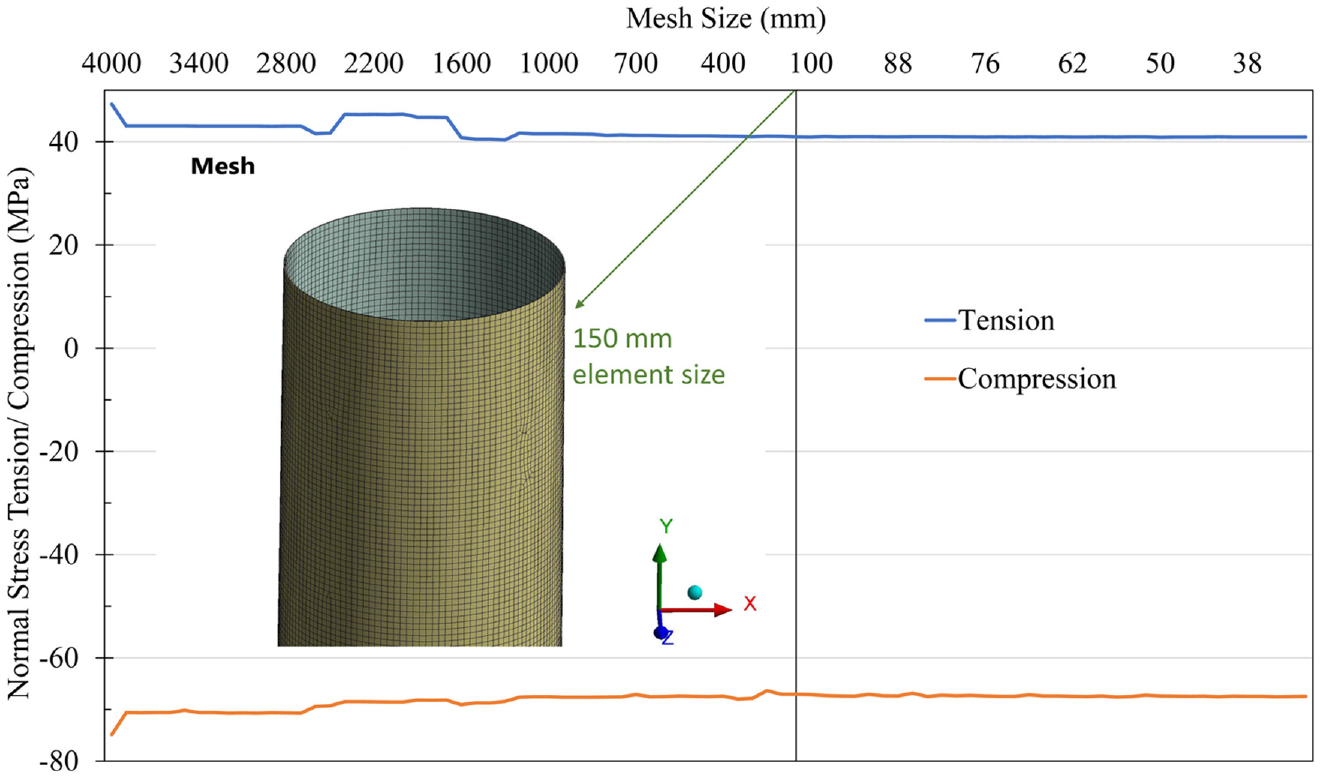
Mesh sensitivity analysis with mesh element size with stresses calculated at the splash zone.
Modelling of material loss due to corrosion
A uniform corrosion model was applied in this study to understand the corrosion effect on the stress field of the OWT support structure. The accurate prediction of long-term structural integrity requires accurate modelling of long-term corrosion impact on the useful life of the structure. 51 The damage caused by stress levels must be assessed as part of the remaining life estimation of wind turbine structures in hostile conditions and under deterioration effects by considering the material thickness loss. 52
Figure 5 shows the corrosion zones required for corrosion assessment of OWT support structures according to DNVGL-RP-0416, 53 while Figure 8 shows the typical extent of corrosion from a site on a wind turbine monopile-tower area. These zones represent ocean environments where the material loss rates per year are provided in Table 4. Understanding the effect of material loss on stress evolution over time is particularly beneficial for designing high-capacity large OWTs in marine conditions and providing a vital component for subsequent fatigue studies. The model applied in the study details structural capacity of an OWT in terms of bending resistance as a function of thickness loss by reducing inner and outer monopile diameters. For instance, Melchers (2005) 51 used a corrosion material loss model to estimate the remaining life of steel offshore structures. It provided a reasonable and accurate quantitative assessment where cross-sectional dimensions primarily influence the structural capacity. This model is critical because corrosion is not a stand-alone deterioration mechanism but rather one that interacts with applied stresses and other mechanical damage and must not be overlooked, as presented in equations (14) and (15).


Where
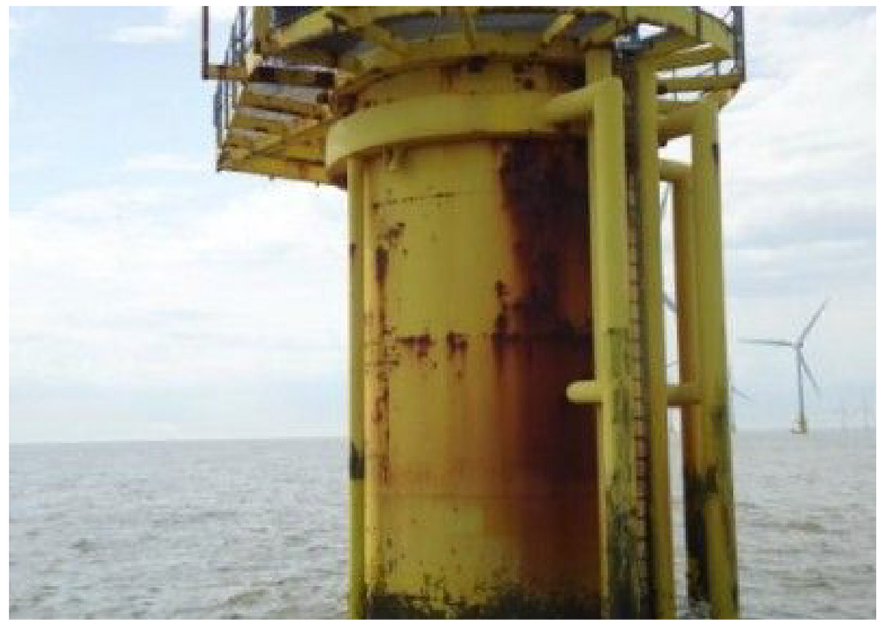
Extents of corrosion in a monopile of an OWT. 54
Rate of corrosion loss as a function of time for long-term corrosion assessment per DNVGL-RP-0416.
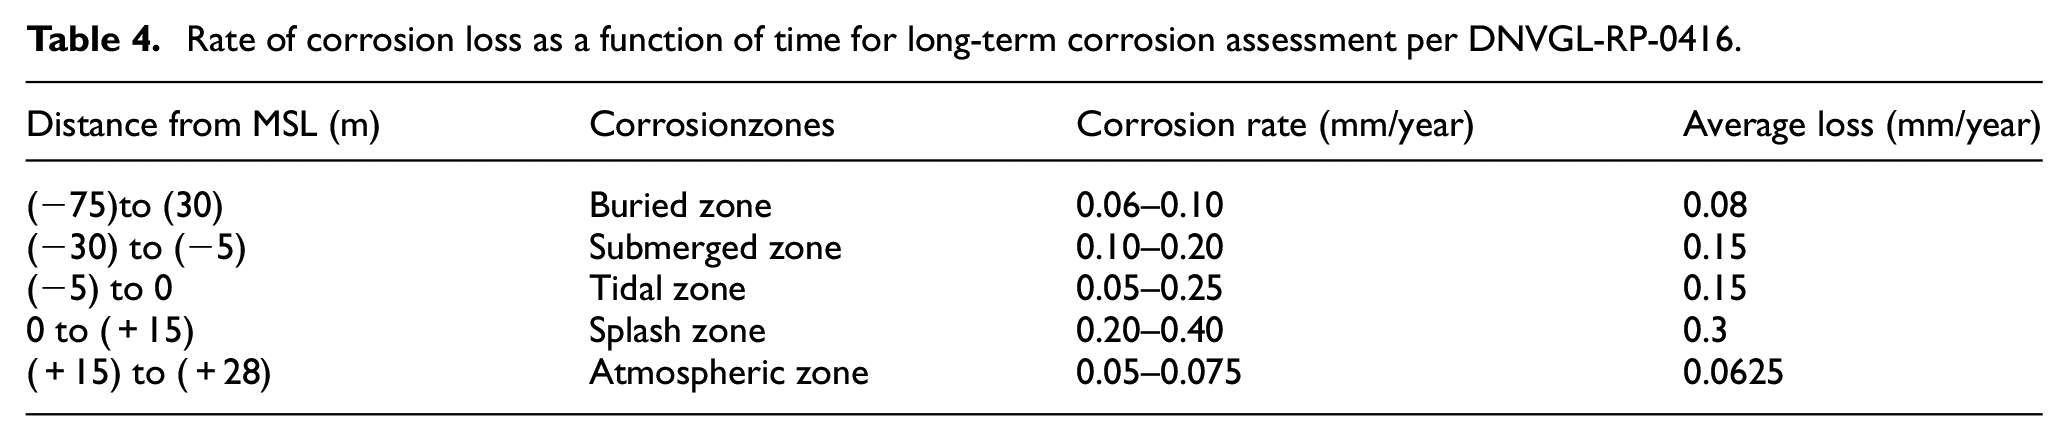
In this study, the corrosion rates for the different zones from Table 4 were implemented by changing the analytical model’s cross-sectional area (equation (6)) and the moment of inertia (equation (7)). For the FEA shell model, the assigned thickness values for the elements in the different corrosion zones were modified to represent the material loss due to corrosion. The corrosion effect was studied for the four specified zones (atmospheric, splash, tidal and submerged) using the analytical and the FEA models. As uniform corrosion causes a change in thickness, it is important to note that the dynamic property of the wind turbine such as natural frequency, is also affected due to the changed stiffness and mass.
Results and discussion
Effects of aerodynamic and hydrodynamic forces on the OWT
Figure 9 shows the calculated thrust force on the rotor, wind force on the tower and wave force on the 15 MW OWT, as detailed in Section 2. During its operation, the OWT will experience the highest thrust force (2.563 MN) at a wind speed of 10.59 m/s. Previous research studies on 5–6 MW capacity OWTs have reported thrust force of 2 MN, 8 1.42 MN, 55 and 1.63 MN. 56 These values show that the experienced thrust force for an OWT increases as its power capacity increases. The wind force on the rotor reduces when the wind turbine approaches the cut-out speed or when it is no longer in operation (parked), while the wind force on the tower body builds up by increasing the wind speed. Increase in the wave force also correlates with an increase of the wind velocity, which is based on a theory that relates wind speed to wave height in a direct relationship. 57 The OWT will experience a tower force of 1.76 MN based on an extreme wind speed of 40 m/s recorded in a year, as described in the design load cases. In a 50-year return span, an extreme wind force of 2.78 MN was observed at a mean wind speed of 50 m/s. Overall, this means that the thrust force in an OWT is the force with the greatest magnitude during operation. When in parked conditions, special attention should be paid to the wind force on the tower, particularly for wind gusts, as these can cause greater cyclic loads, which can cause fatigue damage, as observed in another OWT with a floating foundation. 58 While these values provide an insight into the force values for design considerations, for damage monitoring, high wind and wave forces may be recorded more often due to future impacts of climate change.
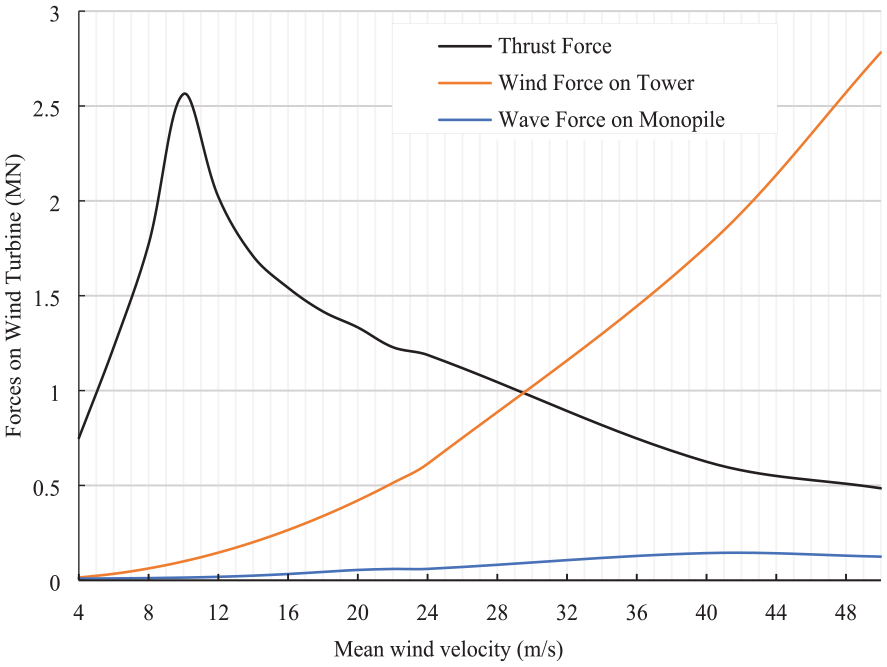
Effect of wind velocity on forces acting on OWT for normal and parked conditions.
Effect of wind velocity on stresses in the vertical direction at different zones of the OWT support structure
The relationship between mean wind velocity and the normal stresses in the vertical direction in the support structure has been investigated. At no wind and wave loads, the material will be under compression due to the weight of the OWT. During loading, the thrust force is expected to have the greatest contribution to the bending stresses due to its highest magnitude and its height from the mud line, creating greater bending moment. Figures 10 and 11 show the predicted tensile and compressive stresses at different mean wind speeds at each zone of the support structure. The stresses in tension and compression were predicted using the developed analytical and FEA models. First, it can be seen the close correlation between the two models. This observation provides confidence in the methods used to predict the stress field. The largest bending stress occurred near the fixed region (mud line) in the submerged zone. These bending stress values were expected because that area will see the greatest bending moment. This result means the weld above the mudline, particularly in the heat-affected zone, would have the highest risk of possible fatigue crack initiation. 21 In Figure 10, the highest values for the stresses in tension were observed at the rated speed of the wind turbine (10.59 m/s) during normal operation. The maximum and minimum tensile stresses in the vertical direction of 76.74 and 67.5 MPa were obtained at the submerged and air zones, respectively. When a wind turbine is parked, the maximum tensile stress in the vertical direction also occurs in the submerged zone of the monopile.
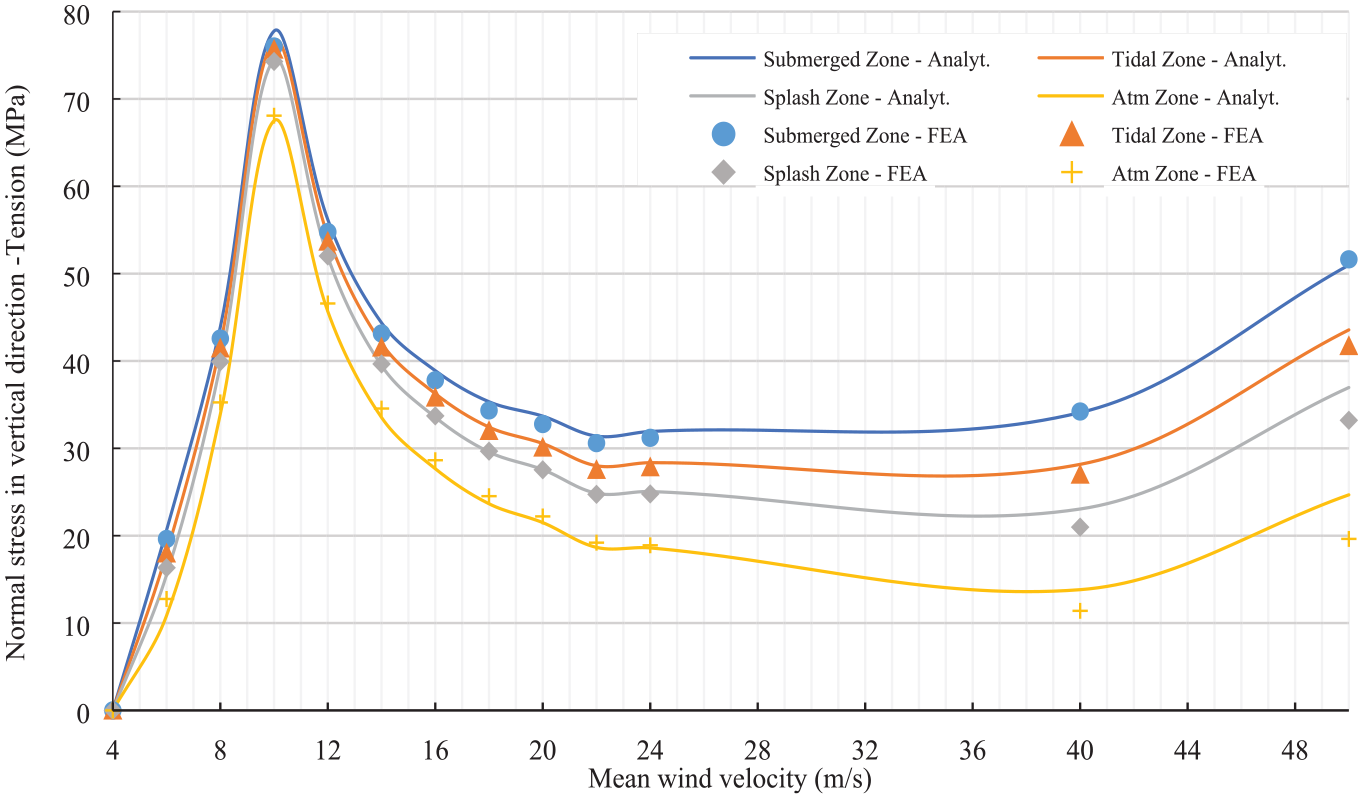
Effect of wind velocity on tensile stress in the vertical direction.
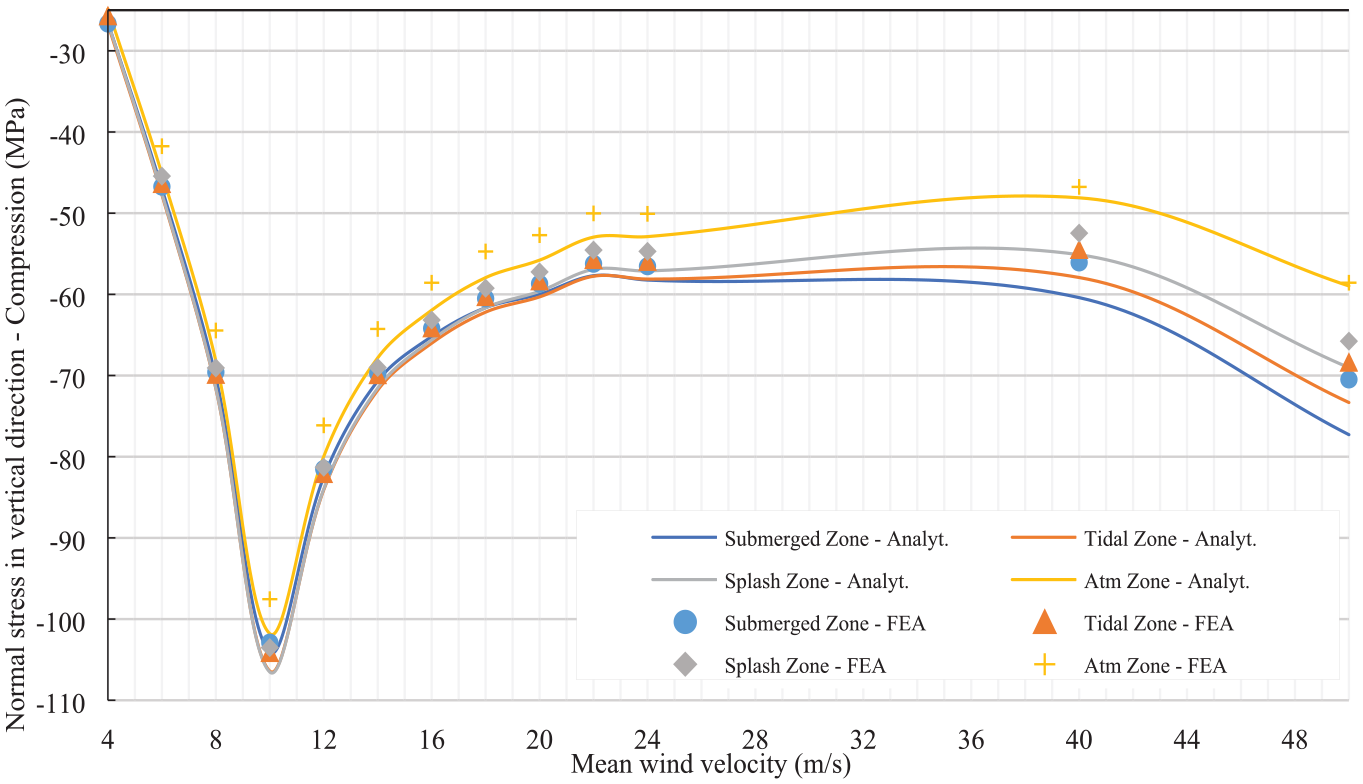
Effect of wind velocity on compressive stress in the vertical direction.
The compressive stresses in the vertical direction shown in Figure 11 were generally higher in absolute magnitude than the tensile stresses because the compressive stresses were due to the weight added to the compressive bending stresses. It should be noted that the positioning of the wind turbine tower-top masses has helped in reducing the overall effect of bending when being subjected to wind forces, which are part of what makes this new high-capacity large wind turbine capable of reducing the tensile stresses. The splash zone experienced slightly higher stresses than the submerged zone in maximum power production conditions, but the reverse is the case when OWT is in parked conditions. The splash zone happens to be in the transition piece region of the OWT. More detailed results would have been obtained if the geometry of transition piece geometry were factored into the geometry from the 15 MW NREL report. This could be considered in future work to improve the predicted stresses. Higher stresses were again found in the submerged zone for the parked conditions. In conclusion, the patterns in Figure 10 (predicted stresses) and Figure 9 (generated force) are similar, showing the thrust force domination in operating conditions. Also, the rise in stresses in the parked condition indicates that wind effects on the tower are dominant in this state, while wave loads will create smaller bending moments due to the distance between the applied load and the mud line.
Overall, the FEA results correlated well with the analytical results for all wind speeds investigated in this study. Compared to the magnitude of the predicted stresses, it can be concluded that permanent deformations are very unlikely because the maximum predicted stress in compression is approximately 107 MPa, which is less than one-third of the yield stress of the material used for OWT structures. For instance, the structural steel S355 has a yield stress of 355 MPa or greater for some high-strength steel alloys. When OWT transitions from parked condition to power production, the largest stresses also move from the submerged zone in tension to the splash zone in compression, which is in the transition piece region. It can be hypothesised that the bottom-most weld in this region could be a likely site for fatigue damage when OWT is not operating and the transition piece region is of concern when it is in operation. The main failure mechanism could be fatigue at the weld’s heat-affected zone due to the lower fatigue limit. Also, there will be a higher stress concentration at the weld toe if not machined.
Effects of long term-corrosion loss rate on the evolution of stresses
The impact of uniform corrosion on the stress field of high-capacity OWTs with large diameters has been assessed in four zones (atmospheric, splash, tidal and submerged). The results are described in terms of predicted stresses in the vertical direction (tensile and compressive) at different mean wind velocities as well as the effects of the corrosion rates at the four zones expressed by exposure time and thickness loss. Considering the data obtained from analytical calculations and FEA predictions from 2184 simulation runs, the average difference between analytical and numerical predictions was 3.64%. This value showed a consistent correlation and provided confidence in the predicted stresses. In FEA, each load case ran for 1 min, corresponding to 13 min for 13 load cases (Table 2). Thus, for 20-year thickness loss for all load cases, the total FEA run time was up to 4 h. However, the analytical solution in the Excel sheet ran in just 1 s for all load cases and thickness loss, showing that the analytical solution provided a better computational time than the FEA.
There was a change in the location of the maximum tensile stress as the corrosion rate at the splash zone was higher (Figures 12 and 13). For compressive bending stresses, which are dominant, the splash zone experienced the maximum bending stress with high values over time in operating mode. The greatest stress values in the monopile were found at 10 m/s, which is close to the rated velocity. Also, high stress values were found at 24 m/s, which is around the cut-out speed at which a wind turbine shuts down. This suggests that when a wind turbine shuts down, the shutdown mechanism contributes to stresses generated in the tower (atmospheric zone) and transition piece region in the splash zone (see Figure 5). The possibility of a shutdown cannot be overlooked and it must be addressed, especially in fatigue design. 5
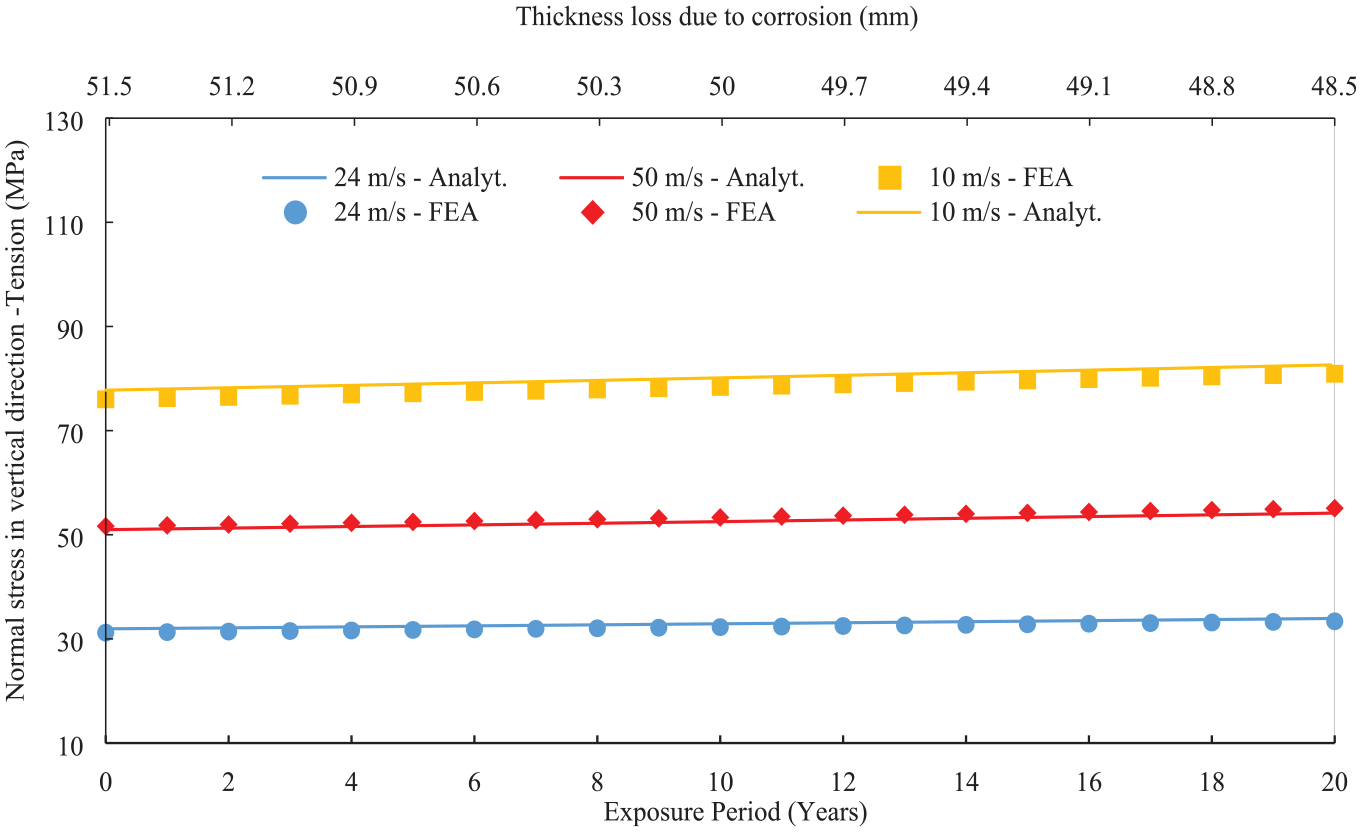
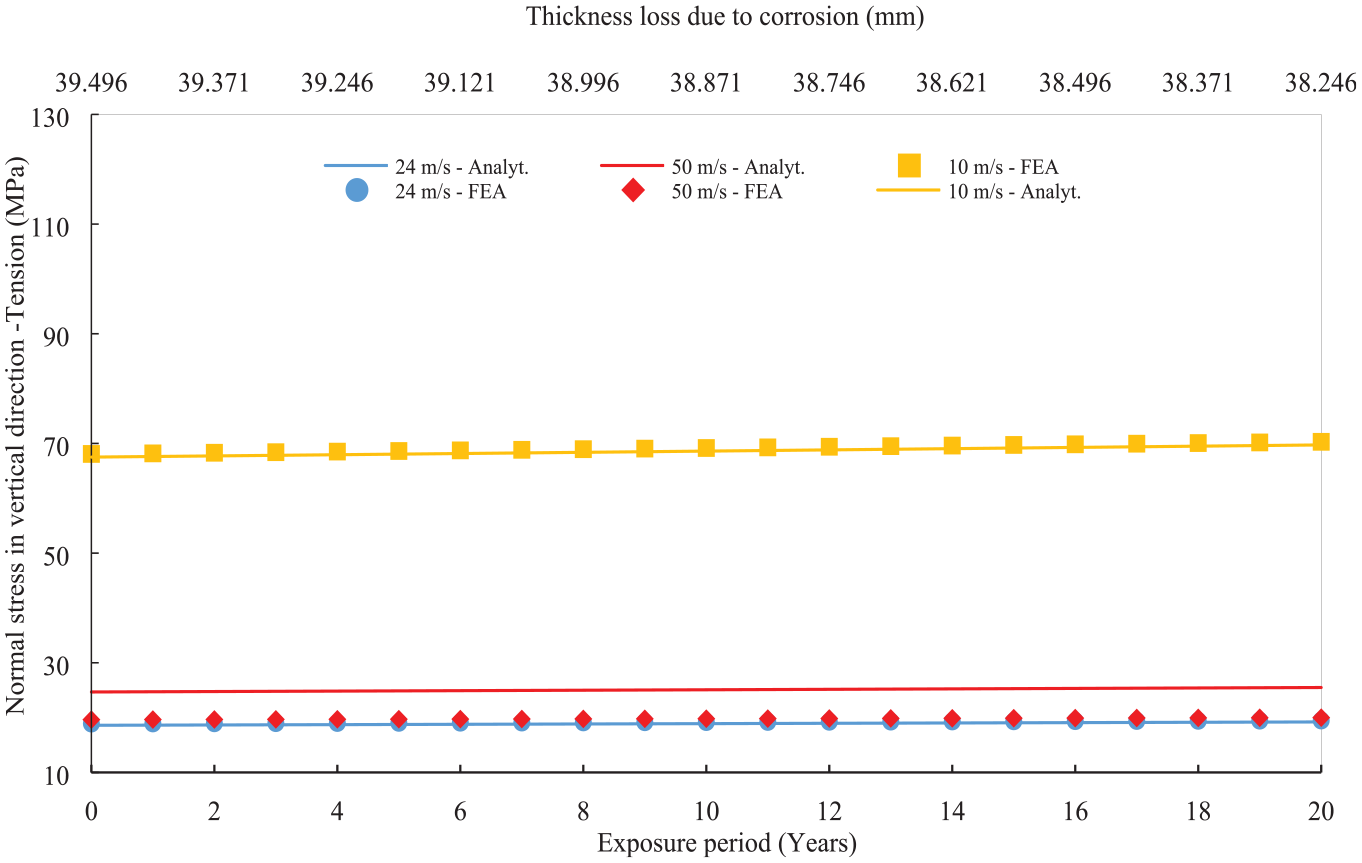
Effect of uniform corrosion on tensile stress at submerged zone.
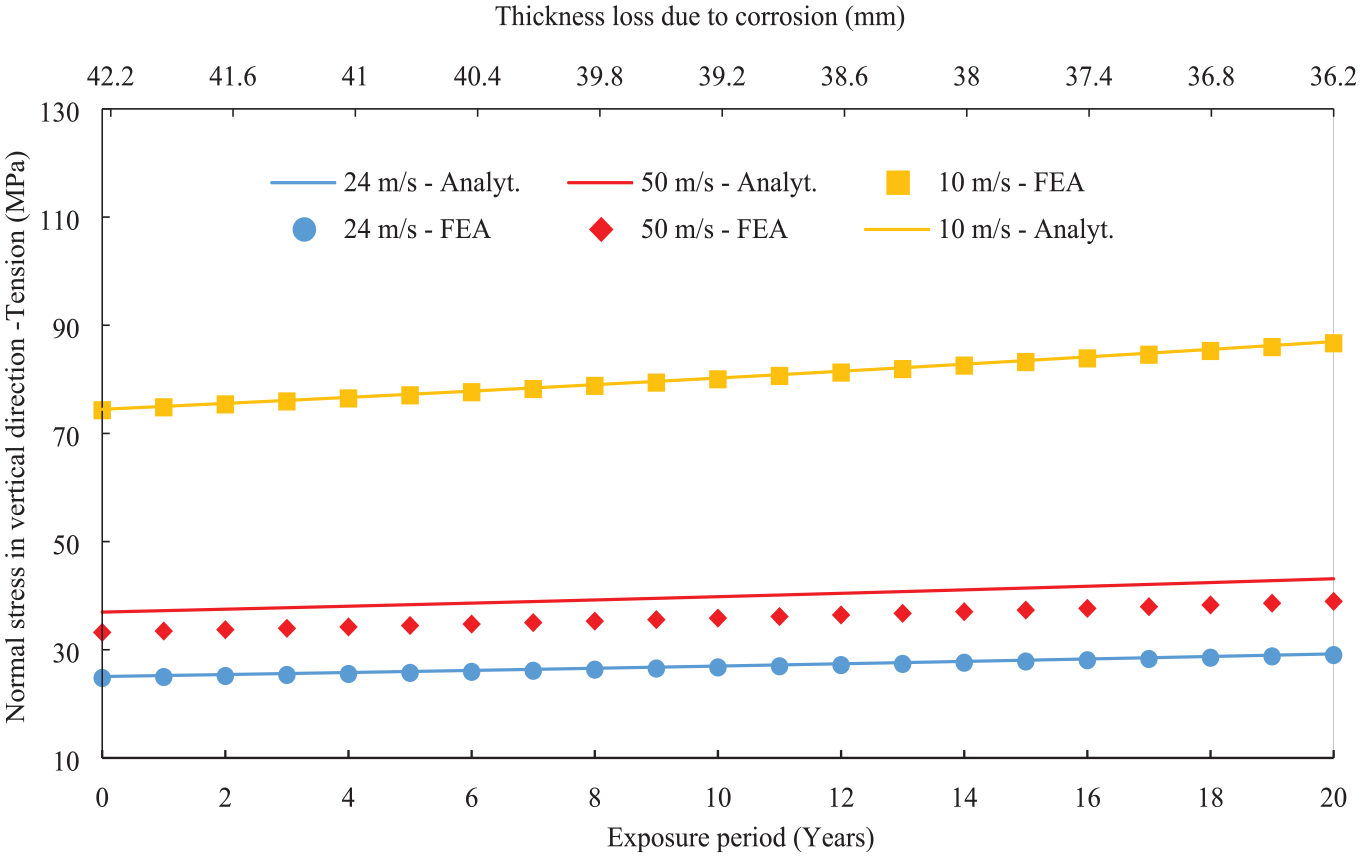
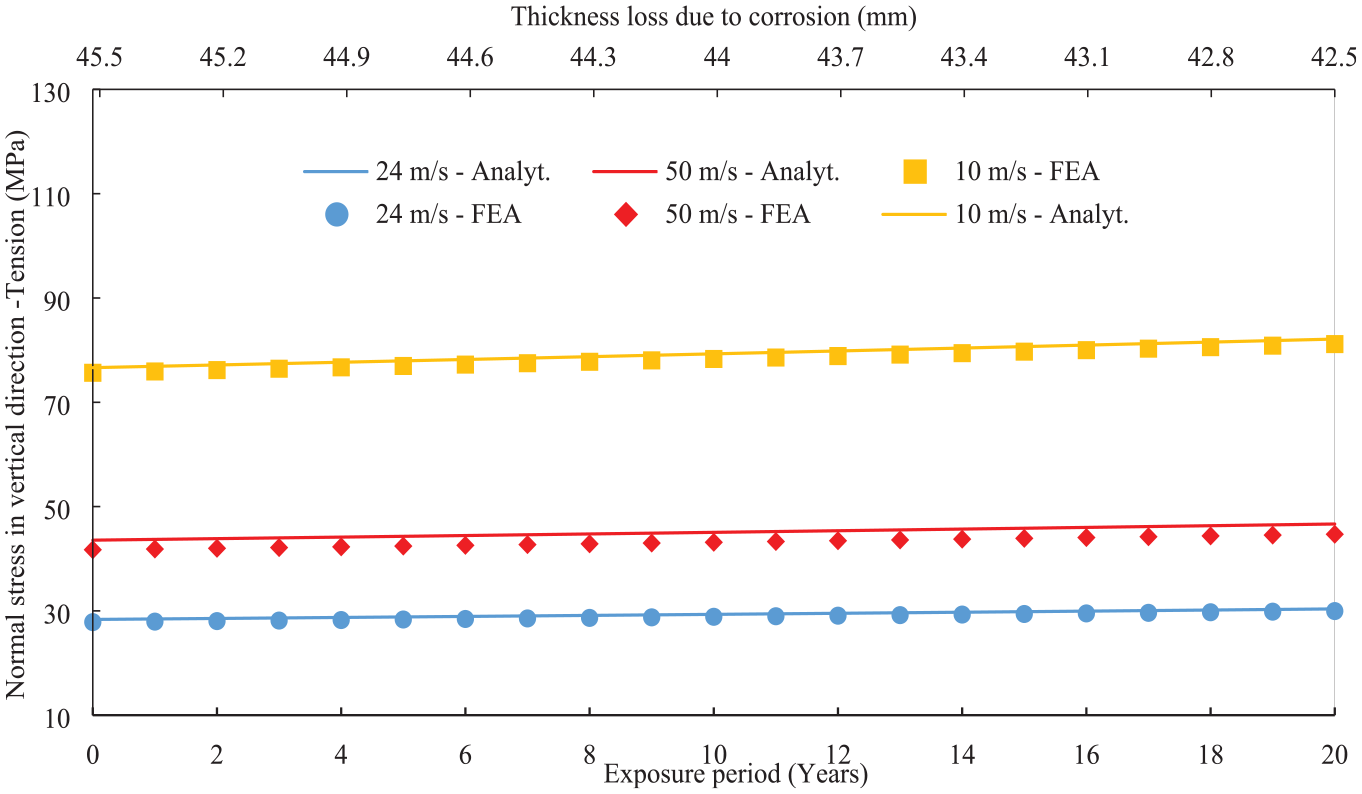
Effect of uniform corrosion on tensile stress at splash zone.
The corresponding increase in exposure days and corrosion loss in steel material follows a similar pattern to the results that have been reported. 51 Despite the similar trend, there is a tiny discrepancy in the corrosion loss values between the analytical and FEA predicted results at 50 m/s mean wind velocity in the atmospheric zone tensile zone (Figure 14). This could be due to FEA findings being obtained at boundary conditions where the wave load was applied or the fact that the distribution of the applied loads in the FEA (based on nodal distribution) differs slightly from the load distribution of the analytical solutions. As previously stated, when support structures such as towers and monopiles are exposed to these corrosive conditions, pits emerge and the coalescence of these pits causes the uniform thickness loss model to be used. As a tapered tubular section is considered, S355 steel tower thickness varies and the different thickness loss means that some zones lose thickness more than others, with the worst zone already identified (splash zone).
Effect of uniform corrosion on tensile stress at atmospheric zone.
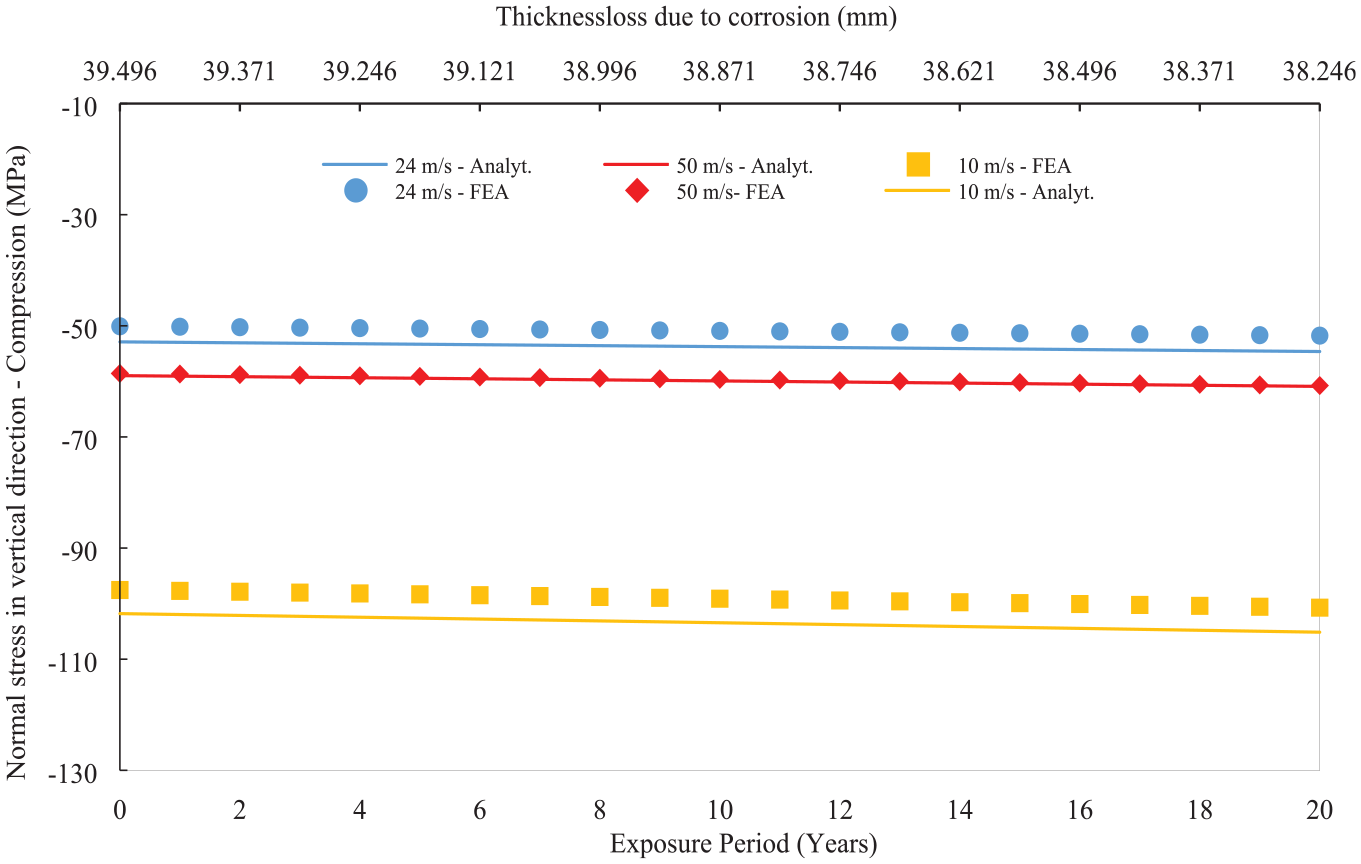
In conclusion, Figures 12 to 15 show the evolution of the maximum tensile stresses over time, while Figures 16 to 19 show compressive stresses over time, associated with a thickness loss due to corrosion. The general trend is that the stresses increase over time for the three investigated wind velocities at 10, 24 and 50 m/s. The rate of stress increase is directly linked to the corrosion rate as there is a reduced area for the forces to act upon, which leads to increased force impact and high stresses generated in the support structure. This shows that corrosion affects the stresses, which could lead to undesirable deflection, buckling, creep, relaxation, fatigue and fracture. Figure 12 shows that the stress rate at 10 m/s in the submerge zone increases from 76 MPa to 81 MPa for 20 years, while the stress increase in the splash zone for the same wind velocity (see Figure 13) is from 74 MPa to 87 MPa. It can be determined that the stresses after year seven will be greater in the splash zone than in the submerged zone. This fact indicates that corrosion should be considered during design as well as material loss due to corrosion needs to be monitored in service to avoid any potential risks of failures (i.e. fatigue crack initiation and propagation). Another observation is that the highest magnitude stresses are in compression, which could lead to permeant deformations if they exceed the material’s yield stress. Using the analytical model, the highest predicted compressive stress at 10 m/s was -124 MPa in the splash zone after 20 years. The typical yield stress of the structural steels used for the towers and the monopiles exceeds 355 MPa, hence, there is a small risk of permanent deformations. The analyses in this study were conducted up to 50 m/s where the maximum compressive stresses were -82 MPa. Under compressive stresses, bucking in slender structures is another material failure that needs to be analysed in the design of OWT. Unlike material yielding, buckling is a geometric failure that can result in sudden and catastrophic collapse due to buckling instability where the stresses are below the yield stress of the materials. Investigation of buckling under compressive stresses was not in the scope of this research. However, it can be analysed under linear elastic and non-linear conditions using finite element codes such as ANSYS Mechanical or similar.
Effect of uniform corrosion on tensile stress at tidal zone.
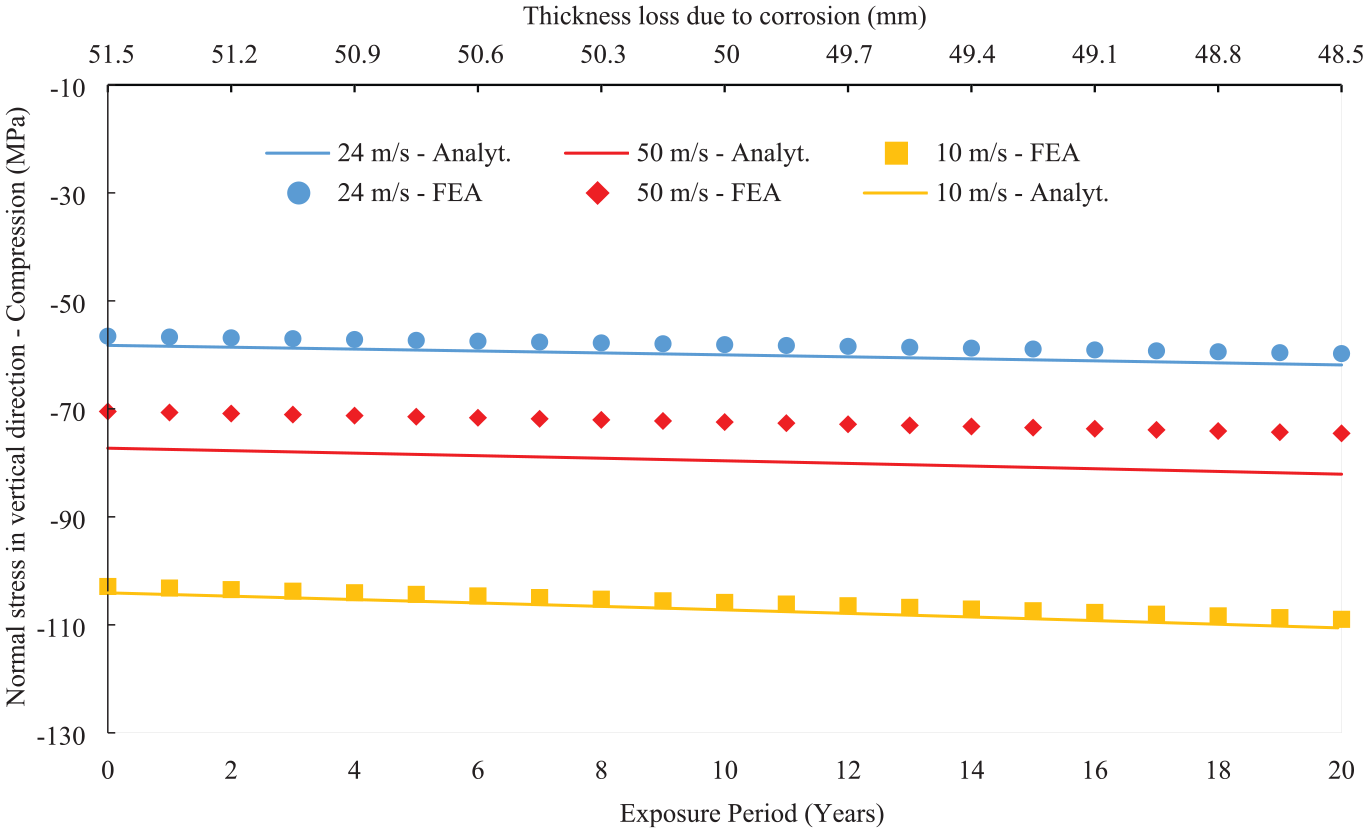
Effect of uniform corrosion on compressive stress at submerged zone.
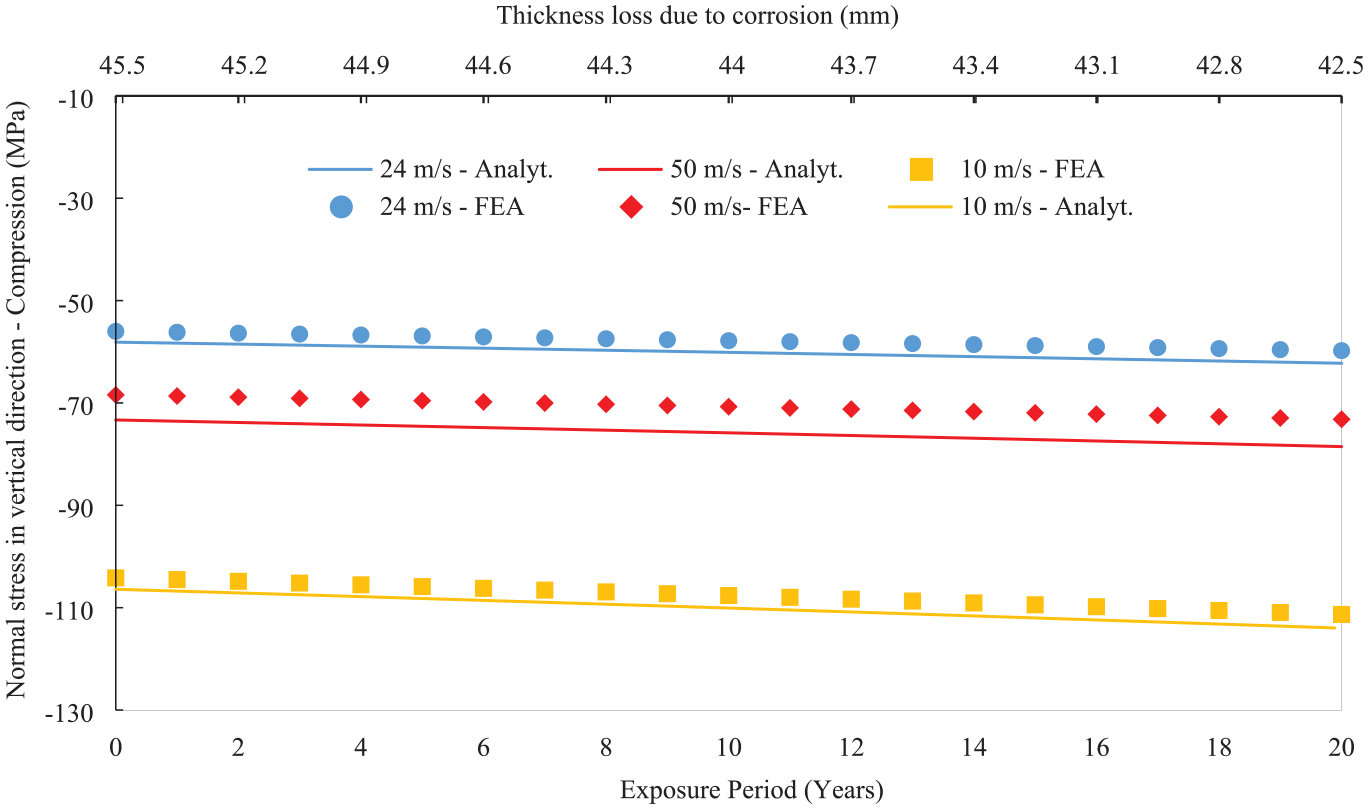
Effect of uniform corrosion on compressive stress at tidal zone.
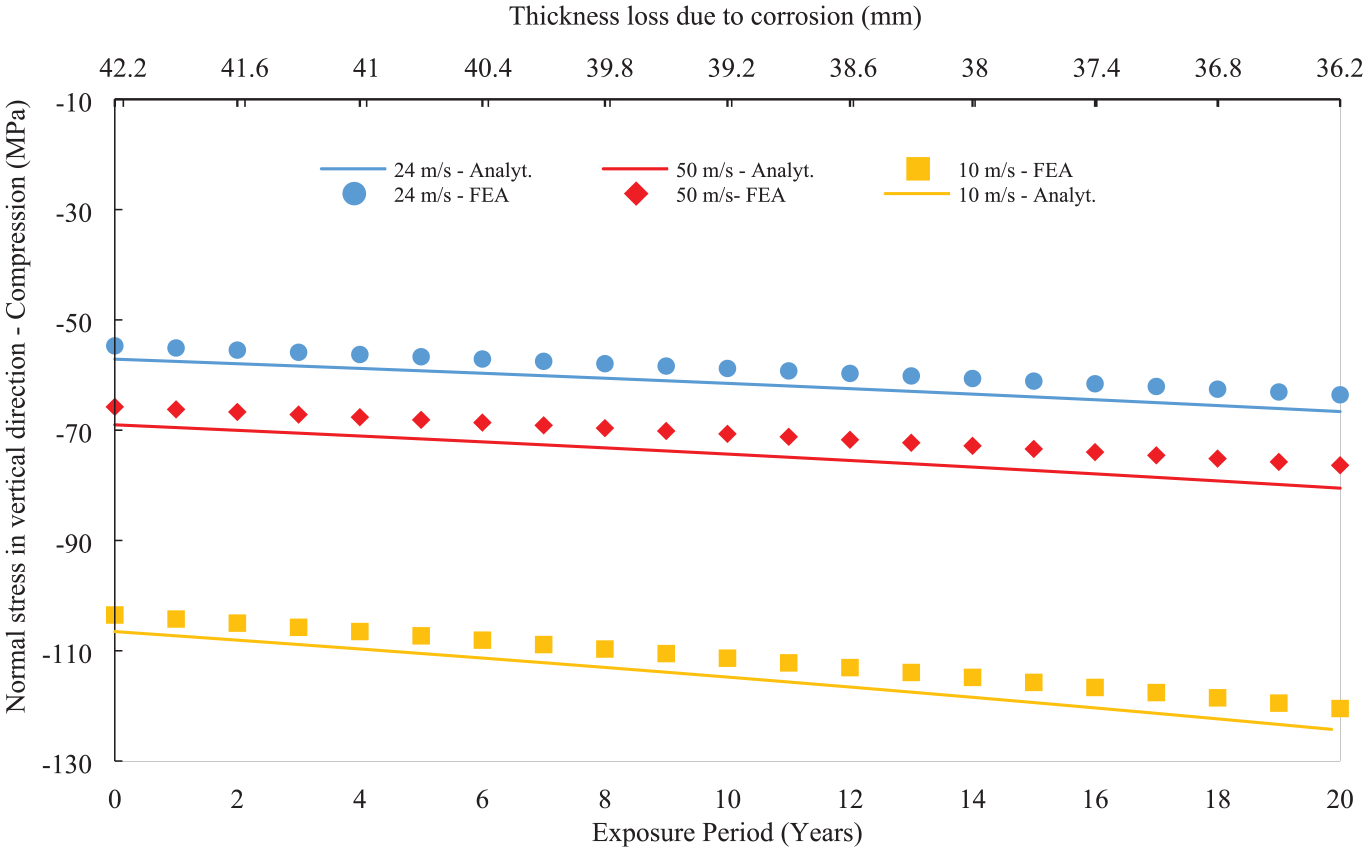
Effect of uniform corrosion on compressive stress at splash zone.
Effect of uniform corrosion on compressive stress at atmospheric zone.
Conclusion and future perspectives
As part of ensuring structural integrity of marine structures, a probabilistic uniform corrosion model in four corrosion zones (submerged, tidal, splash and atmospheric zones) and its effect on the stress evolution in the support structure of a high capacity large OWT were investigated. The prediction of the stress field and its evolution due to uniform corrosion loss of the material was conducted using analytical and FEA methods by applying aerodynamic and hydrodynamic load cases developed in this study. Both methods showed great correlation and the following conclusions were derived from this research work:
It was found that at peak production of the analysed OWT design, a thrust force of 2.563 MN can be experienced. However, when the OWT is in a parked condition, the dominant forces are due to the wind and wave forces acting on the tower and the monopile.
As more high-capacity OWTs are expected to be built, the rotor diameter and hub height will grow, resulting in an overturning moment in the monopile. It was found that the overturning moment counterbalances the moments generated due to wind leading to a reduction of the induced tensile stresses.
The overall weight of the entire OWT induced compressive stresses which were beneficial to neutralise some of the tensile stresses generated from the wind and wave loads. However, the compressive stresses were increased, but their magnitude remained less than one-third of the yield stress of the material (i.e. S355), hence no risk of permanent deformations.
The predicted stresses for as-designed OWT structure showed that the highest tensile stresses were approximately 78 MPa at the submerged zone, which is an indication that there might be risks of fatigue crack initiations in the welds.
The presented analytical calculations showed close correlation with the FEA results for a wide range of wind velocities and material loss due to corrosion. This shows that the two methods are in agreement with their predictions of the stress field, and they can be used for further fatigue analyses considering the transient nature of the stress due to constantly changing wind velocity over time as well as the corrosion impact on the material. The analytical model could be used for real-time fatigue damage calculations to estimate the remaining life of OWT structures due to its capability to conduct fast calculations.
The findings of this study could be useful in future OWT design, as thickness loss due to corrosion and the resulting stress values could aid design engineers in specifying adequate tower and monopile thickness, particularly in the most corrosion-prone zones, as a means of providing a safe, stable and cost-effective design.
This research demonstrates a capability for the prediction of the nominal stresses, which may be paired with S-N curves that take into consideration the size and morphology of the corrosion pits for a more complete and precise characterisation of fatigue.
In addition to the conducted stress analyses under uniform corrosion conditions, modal finite element analyses were performed to predict the natural frequency of the OWT. It was demonstrated that the natural frequency in the bending mode was within the standard requirements. In similar fashion, finite element analyses could be conducted to predict the risk of failure due to buckling under compressive stresses as a future perspective.
Footnotes
Appendix
Declaration of conflicting interests
The author(s) declared no potential conflicts of interest with respect to the research, authorship and/or publication of this article.
Funding
The author(s) received no financial support for the research, authorship and/or publication of this article.