
Abstract
Accurate prediction of the hydraulic effect of hydrate deposition and plug location is critical to the safety and operability of natural gas transport pipelines, especially for gas-dominant subsea pipelines where maintenance and intervention activities are more difficult. To achieve this, the present work improved an existing two-phase pressure drop relation due to friction, by incorporating the hydrates deposition rate into the equation. In addition, a model has been developed to predict the pipeline plugging time. The transient pressure drop predictions in the present study for all six cases at high and low velocities are within 4% mean relative error. Similar predictions by Di Lorenzo et al. are within 40% maximum relative error, while the mean relative error of the transient pressure drop predictions by Zhang et al. was 7.43%. In addition, the plugging flowtime model underpredicts the plugging time by a mean relative error of 9%.
Keywords
Introduction
To enhance pipeline design for effective operability and prevent excessive transient pressure-drop that can lead to pipeline failure, it is important to identify possible sources of time-varying disturbances along the pipeline. Restriction to flow due to blockages in gas pipelines are responsible for time-varying pressure fluctuations during operation. 1 As a result, accurate prediction of the pressure drop along the pipeline is an important aspect of design and operation in gas pipelines flow assurance. Similarly, understanding the hydraulic effect of hydrate deposition on hydrates plug location is critical to the safety and operability of natural gas transport pipelines, especially for subsea gas transport pipelines where maintenance and intervention activities are more difficult. Hydrates morphology, properties and growth kinetics have been discussed extensively in the literature,1–5 and forms the basis for studying hydrates formation in pipelines using analytical and numerical models. Hydrates are formed at low temperatures and higher gas pressures, a condition that exist in pipelines on the seabed due to low temperatures. 6 For subsea gas flowlines and pipelines, the presence of hydrates has been reported to cause line plugging and other related hazards.1,7 Hence, to proactively prevent pipeline failures from hydrate plugs there is the need to predict the time for hydrates to plug the pipeline and the resulting transient pressure spikes. However, evidence from the literature indicates that more studies are needed to accurately and proactively predict both plugging flowtime and transient pressure drop of hydrates deposition in a gas-dominate pipeline. Thus, the purpose of this study is to develop an improved analytical modelling approach to predict the effect of hydrates deposition on the plugging flowtime and transient pressure drop in a subsea gas pipeline. To achieve this, our pressure drop analytical model directly incorporates the hydrates deposition rate in predicting the transient pressure-drop through a modification of the general two-phase gas-liquid steady-state pressure gradient in horizontal pipeline. 8 The corresponding plugging flowtime was estimated from the volumetric hydrates depositional growth geometry proposed in the literature. 9 The rest of the paper is organised as follows. The next section presents the literature review which discusses blockage detection in pipelines, hydrates deposition and the resulting transient pressure drop prediction and predicting the location of hydrates plugging event location along a gas pipeline. The methodology describes the model development stages. This is followed by the validation of the hydrate-induced transient pressure drop model with experimental results. In the succeeding section, the transient pressure predictive model was applied in predicting hydrates plugging event location along the pipeline. Finally, the paper ends with the conclusions of the major findings.
Literature review
The main source of blockage in gas pipelines is the formation of hydrate beddings and plugs.1,10 Removing hydrate plugs in a pipeline can lead to accidents where the plugs behave like projectiles at high speed due to the higher pressure upstream of the plugs. For ageing gas pipelines, pipe burst from overpressurisation due to blockages are possible because of the reduction in pipe wall thickness from internal corrosion. 11 For surface pipelines, infrared temperature gun is used to identify cold section(s) where hydrates plugs are located, but for buried and offshore pipelines this approach is not feasible. 1 Flow modelling, where the operating temperature crosses the hydrates curve have been applied in locating the section(s) where hydrates are formed in buried or subsea pipelines, although this approach cannot locate plugging sections because hydrates are formed and moved downstream to form beds and plugs. 1 Suspected hydrate plug locations are valves, low points along the pipeline/dents or riser base. However, at low flow scenario hydrate plugs can form along the horizontal section of the pipe. 12 Although it is impossible to locate the precise position of hydrate plugs along the horizontal section of the pipeline, other approaches that have been applied in locating hydrates plugs are reported in the literature. 10 These include the use of mechanical device such as coil tubing for wells, injection of thermodynamic inhibitor into gas pipelines to observe the pressure response, gamma ray densometer provided the plug location can be accessed, hoop strain gauge installed around the pipe by a remotely operated vehicle (ROV) to report change in hoop dimension and the simulation of temperature, pressure and other process data. Simulation approach is cost effective and can predict accurate hydrates plugging location. 10
The detection of blockages along pipelines is a challenging problem and has received considerable attention in literature.13–20 However, blockage location detection techniques from flow transients using time domain or frequency domain analysis proposed in the above literature are not suitable for real-time detection of hydrates plugs in gas pipelines for the following reasons. The first approach is the pressure wave (time domain analysis), which depends on the determination of acoustic velocity from the time of flight of the pressure disturbance in the fluid medium.15,16,21 In this approach, gas is propagated from the receiving facility (downstream of the blockage) to the surface of the blockage. The time of flight is the total time from when the pressure signal was sent to when the reflected signal from the surface of the blockage was received. However, the acoustic velocity is affected by the pipeline internal diameter and wall thickness. During hydrates deposition the pipeline hydraulic diameter varies linearly along the hydrates section, hence the uniform ratio of pipeline internal diameter to the wall thickness in the acoustic velocity equation proposed by Stewart and Jack 15 is not suitable for hydrate plug location detection. In a similar pressure-time approach, 13 the detection of plug location is based on finite difference discretisation of the velocity field, where the time to experience the first significant pressure fluctuation is related to the fluid velocity to obtain the distance of the blockage from the inlet. The length of the blockage is estimated from the time when the first transient rise in pressure was detected to when the signal decayed to ‘zero’. The model was developed for liquid flows and did not consider the temperature and pressure dependent fluid parameters such as density and viscosity of gas. Viscosity effects influences the prediction of blockage severity in gas pipelines. 16
A second approach is the pressure wave (frequency domain) analysis method. 22 By assuming a sinusoidal behaviour of the pressure and flow velocity, the time domain in the pressure wave analysis method above is converted into frequency domain to estimate the blockage location from the observed amplitude of the disturbance injected into the fluid domain. The blockage location is estimated from a relationship of the fluid velocity, frequency, number of peaks and length of the pipe.22–24 Again, the frequency domain approach requires an external fluid disturbance to create a reflected signal off the surface of the partial blockage. An approach that can lead to accidents in locating hydrates plugs if the fluid pressure is not adequately depressurised before injecting the flow disturbance. A third approach is based on the detection of blockage location from the prediction of wall shear stress. 14 In this approach, a small sinusoidal disturbance is introduced to the original flow from an external source at the inlet to create time changes in the velocity field and wall shear stress. This nature of sinusoidal disturbance will have little effect in detecting hydrates plug location because of the higher pressure and non-steady flow in gas pipelines. To close the above gap, we propose a cause-effect analytical modelling approach for the transient pressure drop (dependent variable) to locate the position of a single hydrate plug from the inlet of the gas pipeline. The independent variables are the hydrates deposition rate, the gas velocity and pipeline pressure and temperature.
The experimental and computational fluid dynamics (CFD) model by Yang et al. 20 suggests that pressure drop increases as the blockage location increases along the pipeline. Transient pressure-drop fluctuations during hydrates deposition and pipe plugging can lead to pipeline rupture.12,25,26 The formation and prediction of hydrates in gas pipelines has gained scholarly and industrial attention from several published related papers and textbooks. These include experimental flow-loop models,6,12,26–28 analytical models9,29,30 and computational fluid dynamics (CFD) models.31–35 Experimental models for gas hydrates studies in pipelines are usually limited by scalability for real-life application because gas pipelines can span several kilometres which is difficult to setup in a laboratory experiment. However, experimental results have provided data for the validation of both analytical and CFD models. To overcome the limitation of experimental studies of gas hydrates in pipelines, analytical models have been developed. The results of the following analytical models for hydrates studies in gas-dominated pipelines provided compelling evidence that analytical modelling can predict the plugging flowtime and transient pressure drop during hydrates deposition, as discussed further.
Jassim et al. 36 described the near-wall behaviour and deposition spots of hydrate particles using Lagrangian particle deposition velocity theory. It was observed that increasing the Reynolds number increases the distance of deposition from the point of hydrates formation in the pipeline, except when the hydrate particles agglomerates to a critical size that becomes independent of the flow field velocity and are deposited in situ. Their work is important as it creates a picture of hydrates profile in a gas pipeline and the reason for pressure build-up during hydrates deposition. In our model, we used this understanding in the determination of the volume of pipe occupied by deposited hydrates and the resulting reduction in pipe hydraulic diameter.
Wang et al. 29 adopted the hydrates drift velocity proposed by Jassim et al. 36 and developed an analytical model that can predict the risk of hydrates plugging in gas-dominated pipelines. Three stages of flow pattern were investigated: gas-water-hydrates; gas-hydrate and water-saturated gas flow. From the model prediction, the first stage is more likely to plug the pipeline and was identified as the most vulnerable. While neglecting the effect of sloughing based on lack of established relative studies on the effect of sloughing on hydrates layer growth, the estimated hydrate thickness also increased almost linearly during this stage. Though, it was anticipated that the estimated hydrates thickness can be overpredicted when compared to actual pipeline in the field, yet the model prediction was adequate for early hydrate management intervention to prevent associated risks of pipeline failures from hydrates plugging. In the development of our model, we also adopted this line of reasoning in the prediction of pipe plugging time and pressure drop. Earlier, Wang et al. 37 developed an analytical model to capture hydrates formation from water droplets in the gas phase and to predict the most vulnerable sites for hydrates deposition. The model also predicted the plugging flowtime and transient pressure drop. However, the hydrates deposition rates predicted by the model was only for a higher velocity of 8.7 m/s, hence the accuracy of the model in predicting the plugging flowtime and transient pressure-drop at lower gas flow velocities could not be ascertained.
Di Lorenzo et al. 9 developed an analytical model with emphasis on hydrates sloughing to demonstrate that the hydrate deposited at the pipe wall is not stable. The authors argued against the immobility of the deposited hydrates at the pipe wall as this can lead to overestimation of the pressure drop. However, in their conclusion the authors indicates that their model was still unable to predict when and where hydrates sloughing can likely occur along the pipeline. In overcoming the limitation of the model by Wang et al. 37 identified earlier, the study results presented the depositional rate of hydrates at lower velocity of 4.7 m/s as well as at higher velocity of 8.8 m/s developed. However, the transient pressure-drop prediction was up to −40% relative error from experimental results at lower velocities. Also, the predicted hydrates deposition rate by the model underpredicted the experimental outcome at 4.7 m/s. The hydrates deposition rate was estimated by adjusting the pipeline volumetric change rate with different multiplier factors at various subcooling temperatures at constant gas flow velocity. The use of different depositional multiplying factors can limit the application of the model for large size pipelines. Hence, in our model we have neglected the effect of sloughing, but the model incorporates a multiplying factor to address the effect of any uncertainty in the predictions because of this assumption. Also, as a worst-case scenario, our current pressure drop prediction model assumes that the deposited hydrates are relatively stable, and that the growth is linear around the annulus of the pipe until the pipe is plugged. Again, to overcome the above limitations, our plugging flowtime and transient pressure drop models concentrated on having the hydrates depositional rate as direct input. The results of the CFD model by Umuteme et al. 35 for predicting hydrates deposition rates in gas pipelines, compared more favourably with experimental results at lower velocity of 4.7 m/s than the predictions of Di Lorenzo et al. 9 However, the CFD model was limited by pipe length, resulting in a gap to develop an analytical model that can predict plugging flowtime, transient pressure drop, and locate the position of hydrates plugging event in industry size pipeline.
Liu et al. 30 developed an analytical model to predict the deposition of hydrates with emphasis on the shedding of hydrates at the wall. This model was aimed at addressing the limitation of constant gas shear stress adopted in the model by Di Lorenzo et al., 9 which is believed by the authors to have resulted in the high percentage relative error (up to −41%) recorded in their pressure drop predictions at lower gas flow velocity. The plugging flowtime and transient pressure drop model predictions by Liu et al. 30 indicated a good match with the experimental results of Di Lorenzo et al. 26 However, for real life application it is difficult to locate the positions along the pipe where hydrates sloughing and wall shedding occurs, except special instruments will be installed to monitor this variation along the pipeline.
In summary, one of the limitations of existing blockage location models is based on the need to introduce a pressure signal downstream of the blockage from an external source. 16 An approach that is not suitable for hydrates forming pipelines because of possible accidents that can occur when the upstream and downstream pressures are not balanced. Another limitation of existing pressure-wave blockage location models is that the reflected pressure wave from the surface of the hydrates is affected by the viscosity of the gas phase because of the drop in temperature, thus affecting the time of flight used in estimating the location of the hydrates plug from the acoustic velocity of the gas.16,17 Consequently, for hydrates forming pipelines where the temperature at the hydrates surface is colder, the time of flight will be affected by the return pressure wave. Also, existing hydrates plugging pressure drop estimating analytical models underpredicted experimental results at low flow velocity by up to 40%. 9 Hence, the need to develop an analytical model for accurate prediction of hydrate-induced pressure drop at low gas flow velocity.
Thus, the following two gaps have been identified. Firstly, there are two main analytical models that predicted transient pressure drop during hydrates deposition, but none was able to accurately predict the pressure drop as a result of hydrates deposition obtained from experiments at low gas velocity, which presents a concern for predicting hydrates forming in pipelines that are operating below design flow capacity. While both Di Lorenzo et al. 9 and Liu et al. 30 predicted hydrate induced pressure drop at higher gas velocity of 8 m/s, only Di Lorenzo et al. that predicted pressure drop at low gas velocity of 4.7 m/s, yet in some cases the results of their model at low gas velocity underpredicted experimental results. This is not ideal for a proactive predictive model. Secondly, the approach we have adopted in locating hydrate plugging event is novel to this study.
This study closes the identified gaps above with the specific aim to provide an industry fit-for-purpose semi-empirical analytical models that can be used in conjunction with the validated hydrates deposition rates prediction models, 35 with the objectives to predict the: (1) time from initial hydrates deposition to near ‘no-flow’ constriction or line plugging; (2) transient pressure drop due to increasing hydrates deposition on the pipe wall at both low and high gas flow velocity and (3) location of hydrates plugging section of the pipe.
Methodology
Model development stages
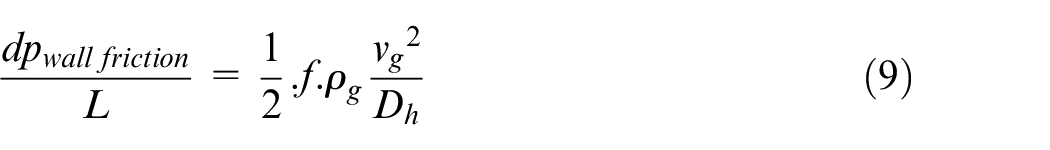
We assumed a hydrates-prone gas pipeline flow computational domain, with annular and linearly growing hydrates deposit profile (Figure 2). A two-fluid multiphase flow pressure drop equation due to friction was adopted for this domain with temperature, pressure, velocity, viscosity, and friction factor as input variables. Furthermore, the time to plug the pipeline from the onset of hydrates deposition was developed from the computational domain. Details of the model development stages are discussed further in the sections that follows. A schematic of the stages adopted is presented in Figure 1.
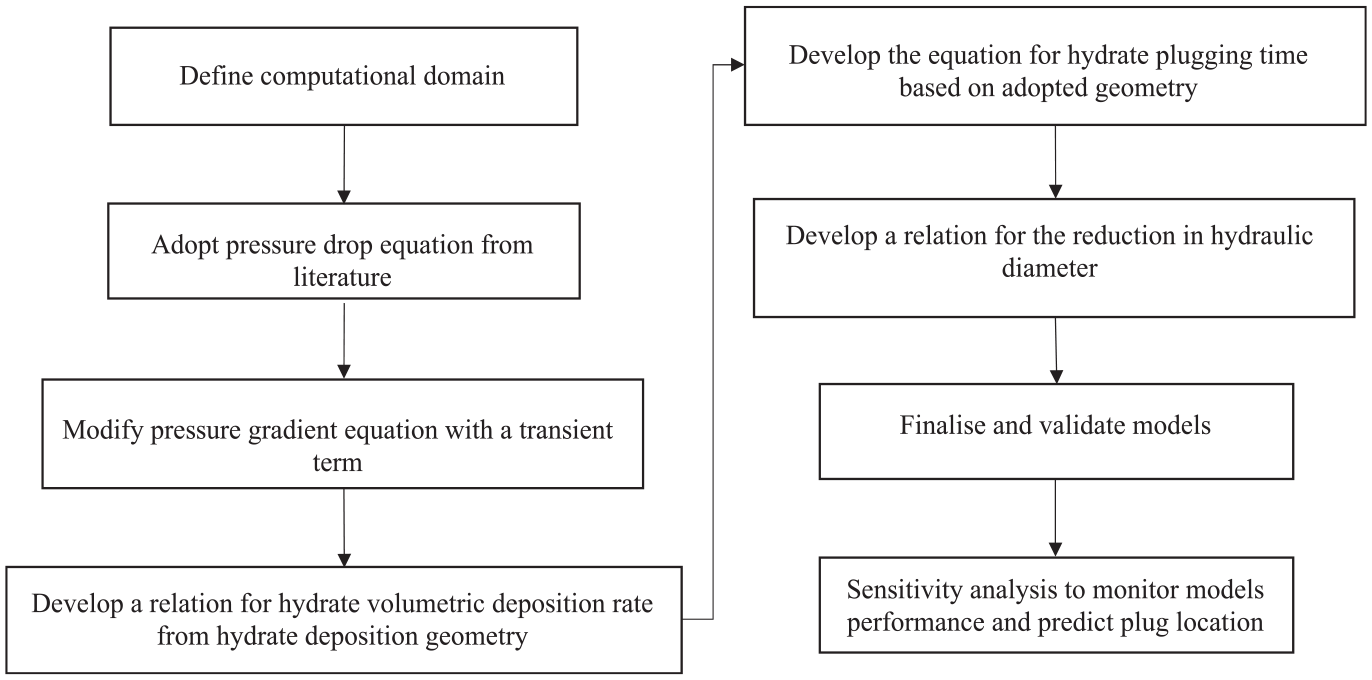
The development stages of plugging flowtime and transient pressure drop models.
Equations and derivations
The following basic assumptions have been made in the development of the transient pressure drop model in this work: (i) the pressure rise behind the hydrate plug is driven by the primary gas phase; (ii) change in temperature is negligible during hydrates deposition on the wall of the pipeline 27 ; (iii) viscous effect in the hydrates forming section increases the resistance to flow and (iv) there is a linear annular growing symmetrical hydrate deposits around the pipe which reduces the hydraulic diameter in relation to the hydrates deposition rate. The linear growth of hydrate deposits assumed in this work is an approximation of the schematic of hydrate deposits along a gas pipeline provided in the literature. 9 We have introduced an empirical model-fit factor in our model to minimise the effect of the above assumptions. Based on the fact that the pressure drop rises during hydrates plugging, the focus of this work is to develop a transient pressure drop model that directly incorporates the hydrate deposition rate into one equation to account for the viscous changes during hydrates formation through a modification of the two-phase gas-liquid steady-state pressure gradient equation. 8 Such a modelling framework is relatively lacking in existing hydrate-induced pressure drop predicting analytical models. Another separate model was developed to predict the plugging flowtime, which is also lacking in existing literature. The results from both models have been used to provide insight into the location of hydrates plugging event in a gas pipeline.
To validate the models developed in this study, hydrate deposition rates are obtained from experimental models by Di Lorenzo et al. 26 and Aman et al. 12 to predict the plugging flowtime and transient pressure drop at both high and low velocity scenarios. The computational domain is represented in Figure 2.
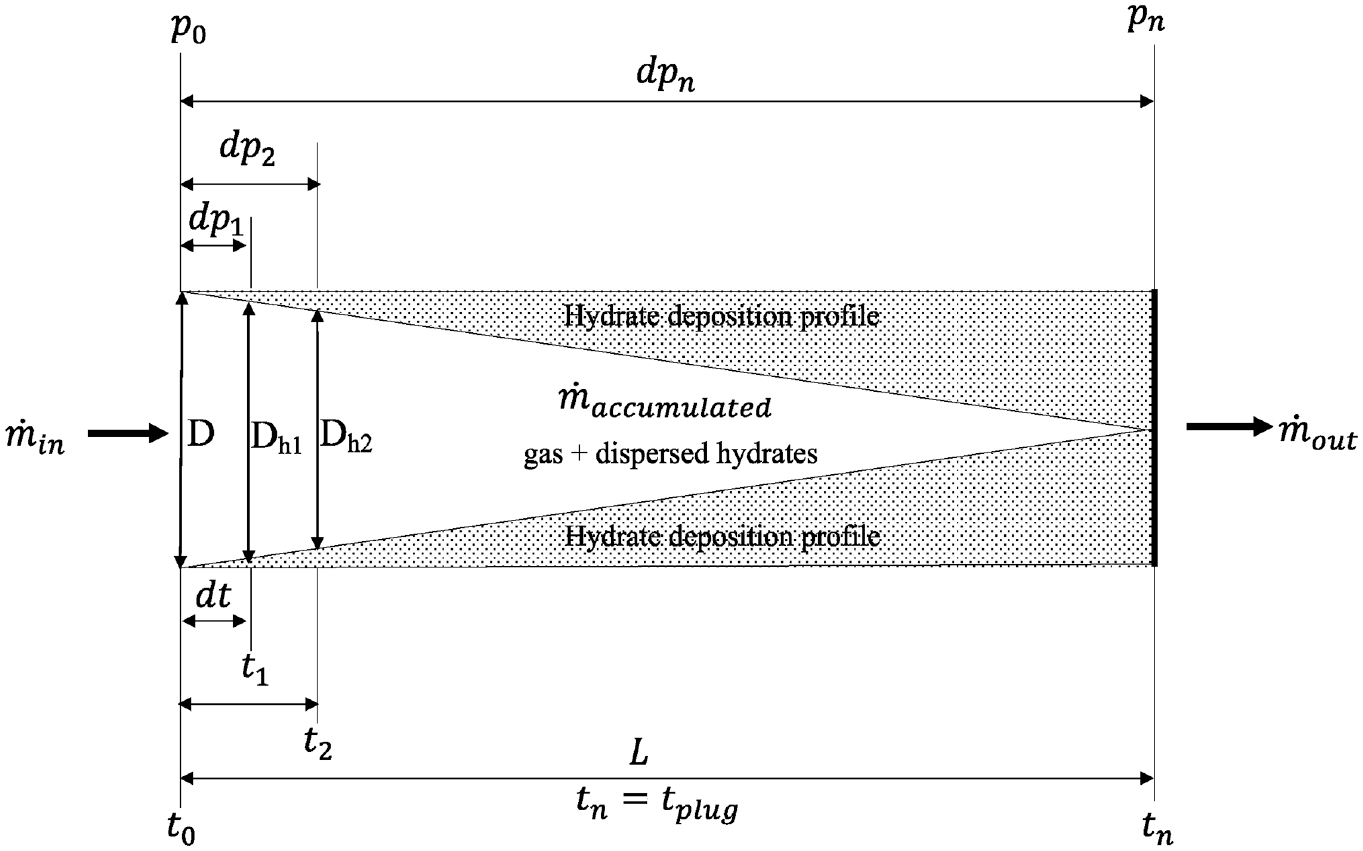
Computational domain.
The above geometry will be used to derive the plugging flowtime for hydrates deposition and the resulting transient pressure drop. The gas flowtime (
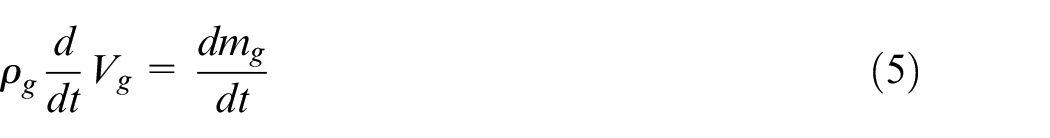
Mass conservation equation
Considering a hydrate forming pipeline section of length (

Once the pipeline is plugged by hydrates,

This can be expressed in differential form as:
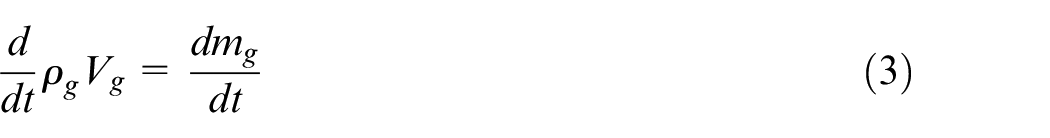
Differentiating the LHS of equation (3) using partial differentiation technique, yields:
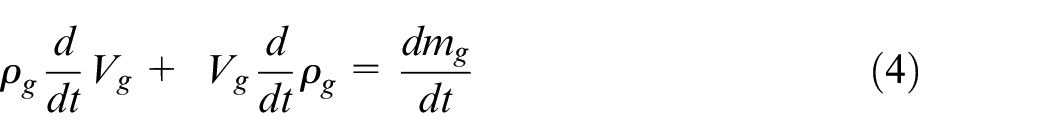
Since the model predicts the first spike in transient pressure drop as a result of plugging by hydrates, it is assumed that the pressure and temperature of the gas behind the hydrate plug are relatively constant at this instant. Implying also that the time-dependent gas density is relatively constant, hence
Re-arranging gives:
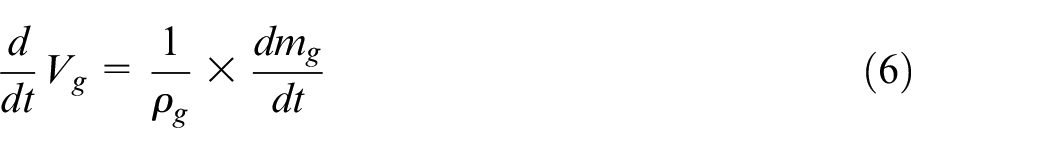
where
Momentum equation
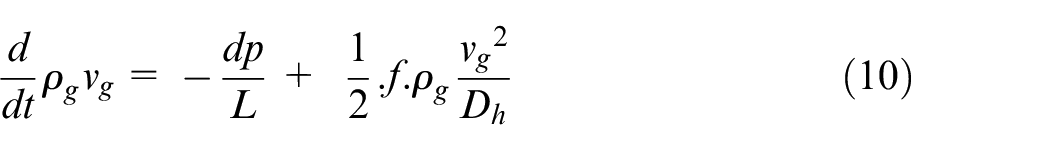
According to previous research, it has been indicated that prior to the plugging of the pipeline by hydrate deposition, the flow is primarily driven by the inertia force of the gas phase. 40 Thus, the momentum equation for the gas phase is stated as follows.
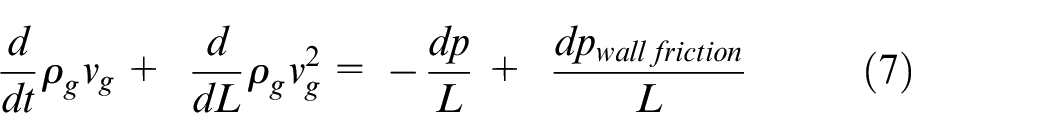
Assuming that the pipeline is plugged by hydrates, the convective term,
During hydrates formation in a gas-dominated pipeline, the multiphase flow is approximated as single-phase. This is because hydrates are deposited on the wall and the flow along the hydraulic diameter is driven by the gas phase. Hence, the diameter (
Inserting equation (9) into equation (7) will give:
Expanding the LHS using partial differentiation, yields:
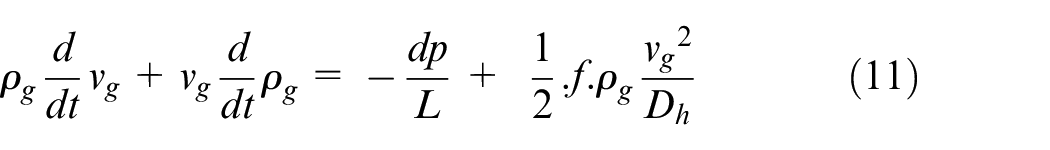
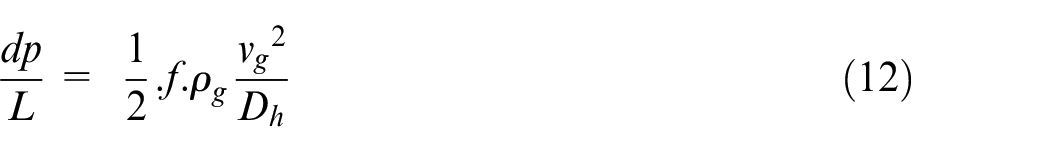
We have assumed that the gas density is constant at the instant of plugging, hence
In this study, the hydraulic diameter
where the subscript
Volume of hydrates deposited
The above derivations have been based on the following five assumptions: (i) hydrates deposition along a pipeline are unevenly distributed,
25
and are estimated experimentally from the pressure gradient in equation (12), by calculating the reduction in pipeline hydraulic diameter from the beginning of gas and water injection into the experimental loop until the end of the experiment
44
; (ii) the pipeline hydraulic diameter is related to the hydrates film growth layer along the pipe using a constant growth rate.
9
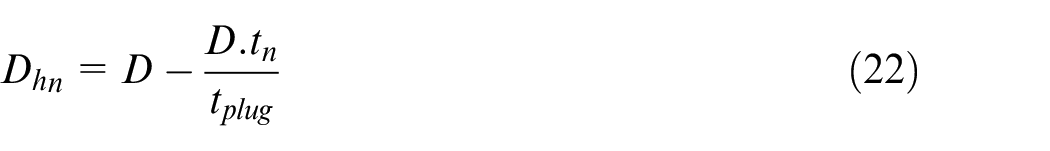
However, this constant growth rate is dependent on the subcooling temperature and the gas flow velocity and can only be determined accurately through experimental observations. In our model, the constant hydrates layer growth rate is represented by the ratio of the pipe diameter to the hydrates plugging flowtime in the pipe as presented later in equation (22); (iii) the plugging flowtime
For industry application, the hydrates growth sectional length (L) can be determined from the pressure and temperature gradient profile generated in a hydraulic simulator; from where the pressure and temperature correspond with the hydrates equilibrium condition determined from a phase envelop. This is because, hydrates are generated at the horizontal section of the pipeline and transported downstream to a point of obstruction or change in flow configuration.10,26 Based on this profile, the maximum time from onset of hydrate to the point where the pipeline becomes plugged can be estimated as a function of the hydrate deposition rate and the pipe diameter. The change in gas volume during hydrates formation can be explained by the mass continuity equation in equation (6).
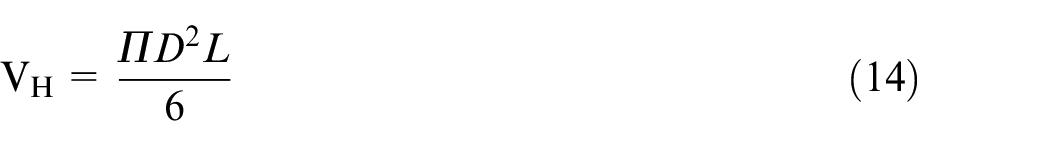
In this study, the relation for the deposited volume of hydrates will be developed by taking a 3D geometry of the computational domain in Figure 2, as:
The hydrates deposition rate can be obtained by dividing both sides of equation (14) with the time to plug the pipeline section.
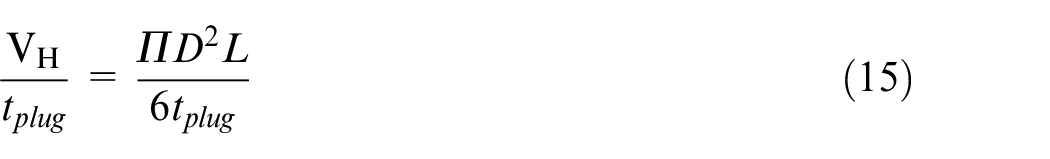
This can be re-arranged as:
where
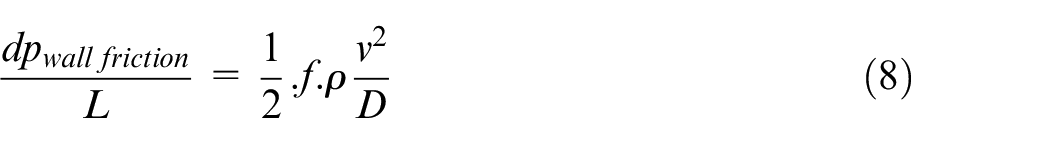
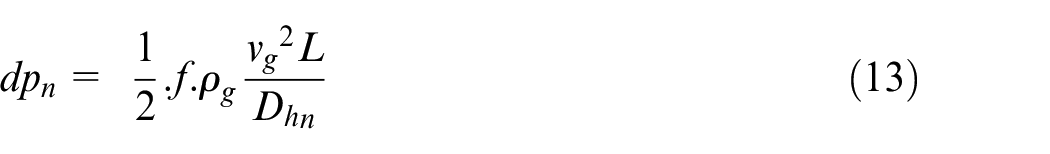
where the gas density
Since there is no lubrication of the pipe wall by the gas, it is assumed that the gas is flowing over a smooth layer of hydrates and the friction factor is estimated from the equation for smooth round pipe. 45 During hydrates deposition, the flow behind the point of deposition is assumed to be frictionless. 10
The Reynolds number is defined as:
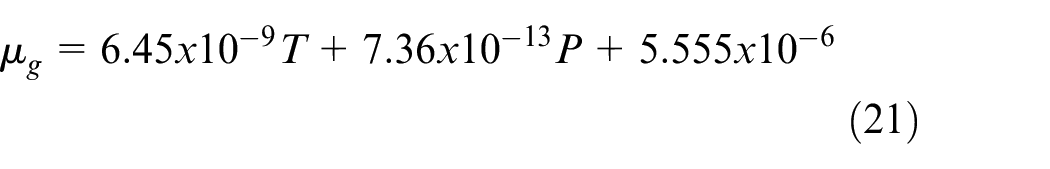
where T is temperature (K); and P is pressure (Pa).
Pipeline hydraulic diameter
The hydraulic diameter
Where
Final models
The final transient pressure drop model during hydrates deposition can be derived by substituting
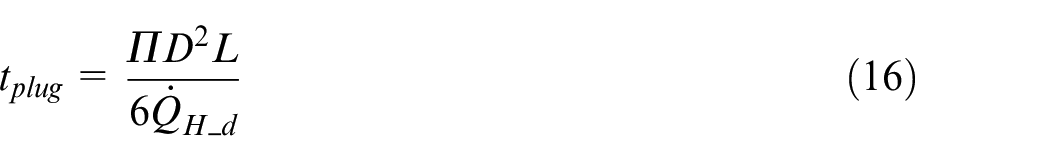
The time to plug
where:
D = pipe internal diameter (m)
Solution algorithm.
Equation (25) above is the pressure drop model incorporating the hydrate deposition rate. The inclusion of hydrates deposition rate in the model already contained the influence of the subcooling temperature. At the current hydrates deposition rate, the model predicts the first spike in pressure at the pipeline condition. The pressure drop is estimated as the difference between the first pressure spike and the hydrates formation equilibrium condition. When the model is implemented to locate hydrate plug in the line, different lengths can be iterated until the flowtime matches the recorded operational flowtime between the onset of hydrates and the first pressure spike. Ballard et al. 46 recommended the installation of pressure transmitters along the pipeline to monitor hydrates formation, as a spike in pressure is an indication of hydrates forming downstream of the pressure transmitter. Our model can be implemented with this kind of installation to predict real-time hydrates deposition rate.
To solve the above model, we developed the computational algorithm presented in Figure 3.
The above algorithm is explained in the following steps:
Step 1: Input data for hydrate deposition rate (
Step 2: The expected time to plug the exit of the pipe based on the deposition rate is calculated.
Step 3: The timestep is also calculated by dividing the time calculated in step 2 into n equal sections
Step 4: Computes the pressure and temperature dependent gas stream density and viscosity.
Step 5: Computes the Reynolds number
Step 6: Computes the empirical factor
Step 7: Computes the first computational instantaneous time
Step 8 and 9: Evaluates the pressure drop with the inputs and calculated variables from steps 1 to 8 and reports the pressure drop.
Step 10: Advances the timestep by adding the timestep to the previous computational instantaneous time.
Step 12: Executes a conditional statement that determines if the computation should proceed or terminate.
Model validation and discussion of results
This model incorporates the hydrates deposition rate for gas-dominated pipeline in one mathematical relation. Two main equations were developed earlier; to predict the plugging flowtime (equation (26)) and the associated transient pressure drop formulation (equation (25)). The point of hydrates formation can be obtained from a phase envelop, and pressure and temperature gradient plot from a hydraulic simulator, or directly from subsea pressure and temperature transmitters installed on the flowline or pipeline. Also, the actual sectional length (L) experiencing hydrates growth can be obtained in like manner. In all the six cases considered from experimental data in Di Lorenzo et al. 44 and Aman et al., 12 the plugging flowtime and transient pressure drop were dependent on the hydrate deposition rates.
As a proactive hydrate plugging preventive analytical tool, it is essential that the model can ‘underpredict’ the experimental plugging flowtime at the experimental transient pressure drop in the literature. The basic assumption behind the transient pressure drop model is to stop gas flow once the first spike in pressure drop is recorded as a precautionary measure. Figure 4, compares the model performance with experimental data in the literature at both low and high velocities of 4.6 and 8.7 m/s respectively.
From both figures, the analytical model predictions at both high and low velocity compared favourably with the experimental plots in the literature. By using only one multiplier factor, which is a function of the gas velocity, this model is an improvement over the analytical model of Di Lorenzo et al. 9 since it proves to be more adaptable for industry application without adjusting the multiplier factor under various flow velocity. The relative error from the experimental results is calculated as in equation (27).
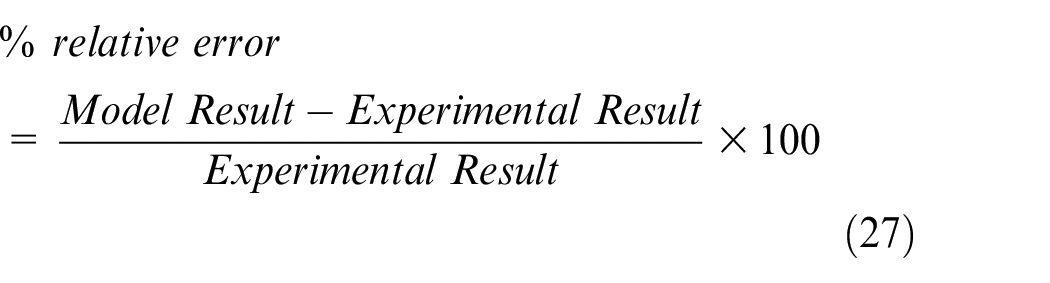
The transient pressure drop predictions from experimental results for all six cases at both low and high velocities is at a maximum of 6% relative error. Similar predictions by Di Lorenzo et al. 9 were within 40% relative error. Also, the mean relative error of the transient pressure drop predictions by Zhang et al. 25 was 7.43%. Hence, our model is an improvement over existing analytical hydrates plugging pressure drop prediction models. Again, the plugging flowtime for all cases was underpredicted within mean relative error of 9%, suggesting the plugging flowtime model can proactively predict hydrates plugging. More importantly, because our model incorporates the hydrates deposition rate directly it is invaluable in real-time tracking of hydrates deposition rates when the pipeline is fitted with temperature and pressure transmitters.
Input data
The hydrate deposition pipe length is 33.4 and 0.0204 m in diameter as in the flowloop experiment information reported in Di Lorenzo et al. 44 and Aman et al. 12 In both experiments, the hydrates were generated at a 12 m inlet section of the pipe and deposited downstream along the pipe. Flow velocities are 4.6 and 8.7 m/s. 12 The input parameters used are presented in Table 1 below.
Input parameters.
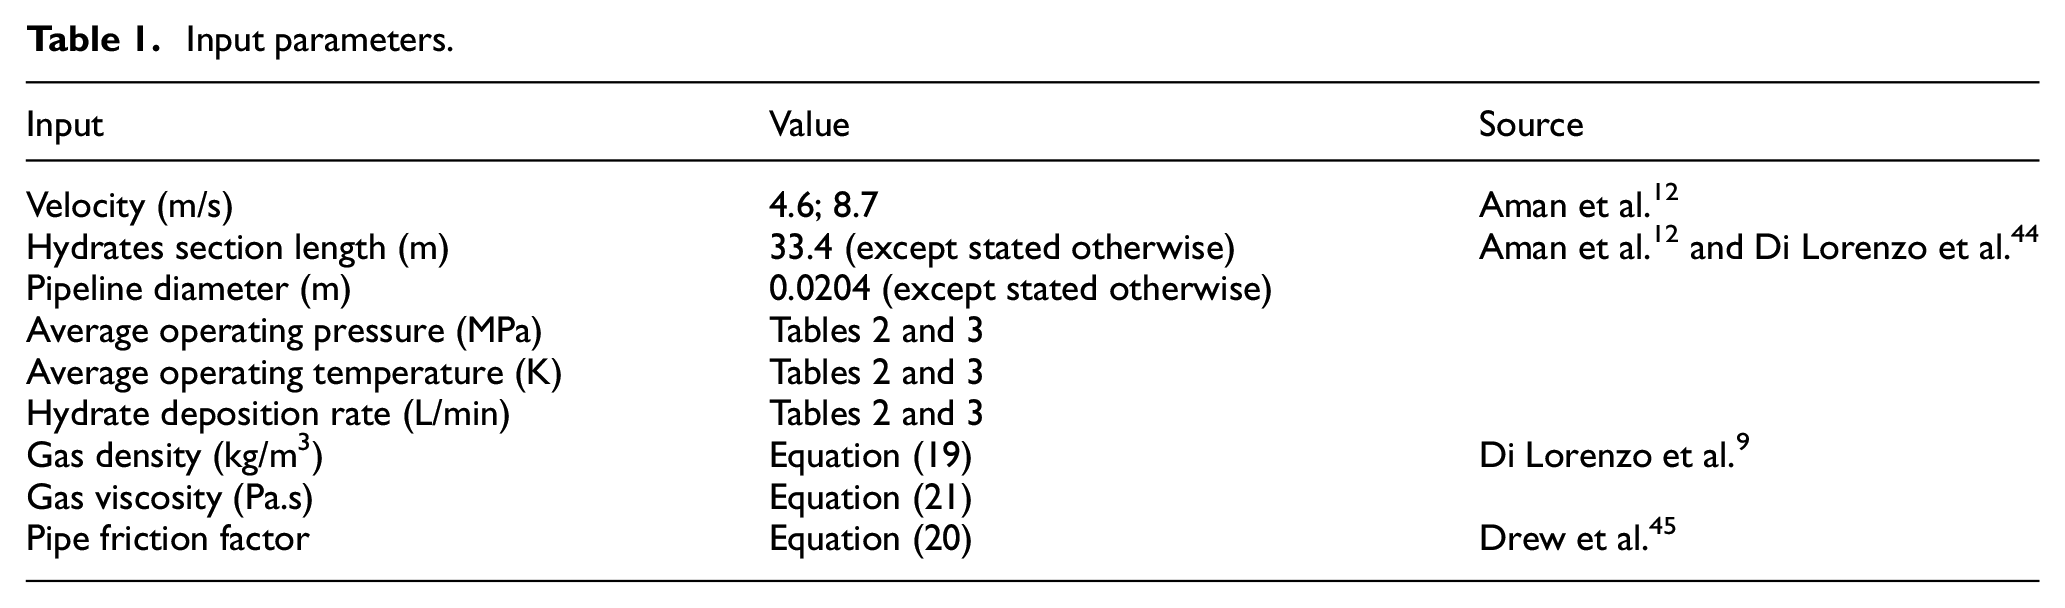
In our model, the simulation using the solution algorithm developed in Figure 3, was terminated when the instantaneous time equals the calculated time for hydrate plug at the nth timestep. For each run, the transient pressure-drop is calculated for a time
Hydrate plugging flowtime and transient pressure drop
Equations (25) and (26) are the two sets of equations needed to predict the plugging flowtime of hydrates and transient pressure drop. The results of the calculations from these two equations are validated with experimental results from Di Lorenzo et al. 44 and Aman et al., 12 Hydrates formation and deposition is not uniform along the pipe as reported in the literature. Thus, the flowtime has been modelled to be less than the actual runtime in the experiments. In theory, the gas phase is both upstream and downstream of the hydrates plug, hence the need to balance the pressure at both ends of the hydrates plug to prevent accidents. The experimental results used for validation indicates that the hydrates are more stable at lower velocity of 4.6 m/s as the gas temperatures are below 292 K. The model results at 4.6 m/s where the hydrates are stable have minimal relative error compared with predictions at 8.7 m/s. Hence, our model is very useful in predicting the severity of hydrates under low gas productivity scenario. The two sets of validations carried out with experimental results are discussed below.
Validation of model predictions at gas velocity of 4.6 m/s
Aman et al. 12 conducted a series of flowloop experiments to compare formation and deposition rates of hydrates at low flow gas velocity. Details of the experiments are discussed extensively in the literature. Only two data sets representing experiment 1 and 2 from the literature were considered for validation based on the following reasons: (i) experiment 3 is reported with similar hydrates deposition rate with experiment 1, yet has higher gas consumption rate and a lower transient pressure drop; it is expected that at the same deposition rate and flow velocity the pressure drop is relatively equal; (ii) experiment 4 has a lower hydrates deposition rate compared with experiments 1 and 2, yet was reported with a higher pressure drop; it is expected from theory that higher deposition rates should have higher pressure drop at similar plugging flowtime; (iii) experiment 5 is reported with the highest gas consumption rate, yet with lower hydrates deposition rates compared with the outcomes of experiments 1, 2, 3 and 4, which is inconsistent with theory. From the model results, experiments 1 and 2 compared favourably with expected theoretical outcome, hence were used for the validation results presented in Table 2, below.
Comparing model predictions with experimental results by Aman et al. 12 at 4.6 m/s.
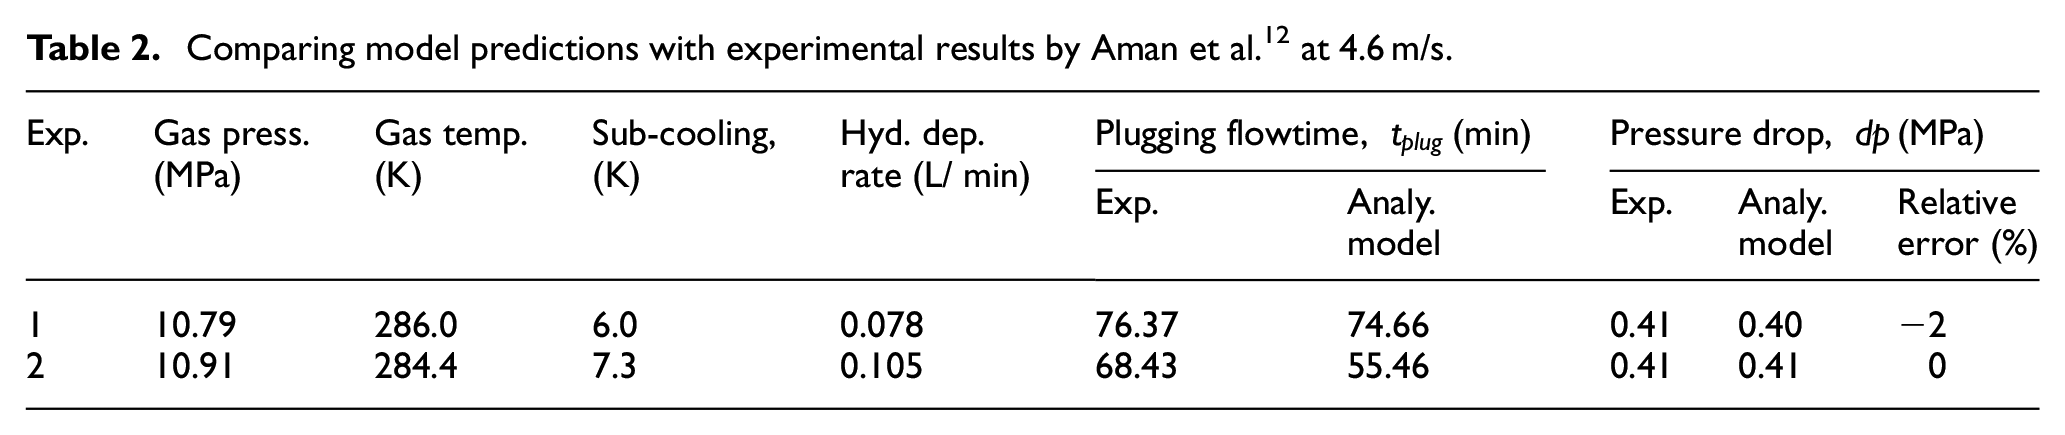
From Table 2, the transient pressure drop model underpredicted the experimental results by 2% relative error. The mean relative error of the pressure drop predictions from experimental results is 1%. The plugging flowtime model underpredicted the experimental values as expected. The predictions are in order as expected for a proactive predictive model, and an improvement over the predictions of Di Lorenzo et al. 9 From experimental observations at lower flow velocity, the pressure drop is not expected to vary significantly across different subcooling temperatures, because the gas shear stress on the hydrates at the pipe wall is low. 12 This position is replicated from the model performance in Table 2. Again, the indication from the model results is that early plugging occurs at higher hydrates deposition rate, which is also consistent with experimental observations.
Validation of model predictions at gas velocity of 8.7 m/s
Di Lorenzo et al. 44 conducted a flowloop experiment to compare hydrates formation and deposition rates at constant higher gas flow velocity of 8.7 m/s. The resulting series of experimental results formed the basis for further work in this research area, and the results have been used to validate analytical hydrates deposition models.30,37 The hydrates deposition rate is estimated as 30% of the formation rate based on the results in Di Lorenzo et al. 44 Another source also reported an average deposition rate between 24% and 26% of hydrates formation rate. 37 The 30% approximation was used because the results in Di Lorenzo et al. 44 did not specifically present the average deposition rates. The experimental results were obtained at a gas velocity of approximately 8.7 m/s and the outcomes are compared with the model predictions in Table 3.
Comparing model predictions with experimental results by Di Lorenzo et al. 26 at 8.7 m/s.
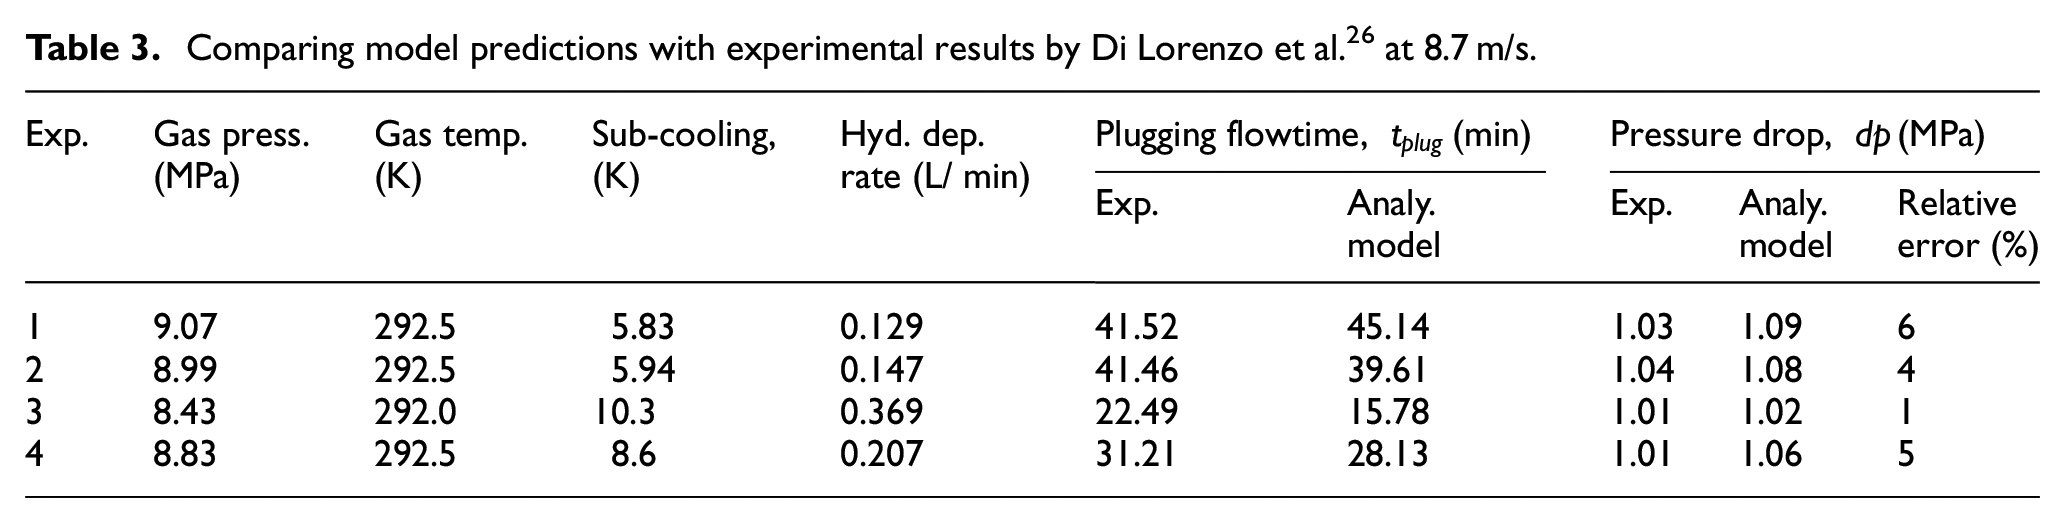
As seen in Table 3, the model overpredicted the transient pressure drop by a maximum relative error of 6%, with a mean relative error of 4%. Also, the plugging flowtime model underpredicted the experimental values as expected. Both predictions are also in order since by overpredicting the transient pressure drop and underpredicting the plugging flowtime, it is possible to predict early hydrates obstruction in the pipeline for proactive intervention. Thus, the present work is an improvement over the predictions of Di Lorenzo et al. 9 at higher velocity of 8.7 m/s with pressure drop predictions within 10% relative error from experimental results.
Hydrates transportability
Since hydrates formation and deposition rate is directly related to the gas consumption rate, the RHS of equation (6) can be modified with the density of hydrates to account for the rate of change in pipe volume (m3/s) due to the presence of hydrates as shown below:
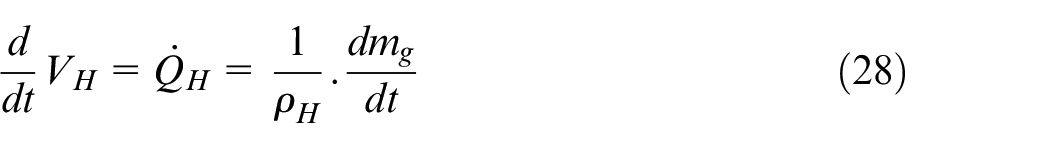
Where
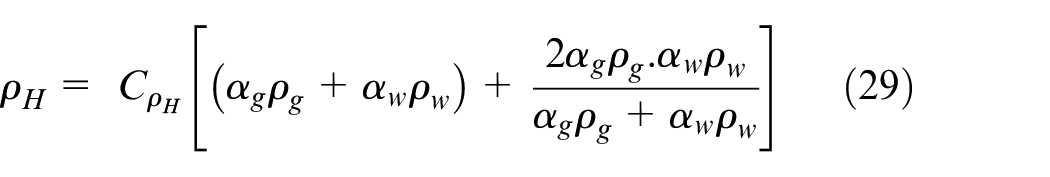

where
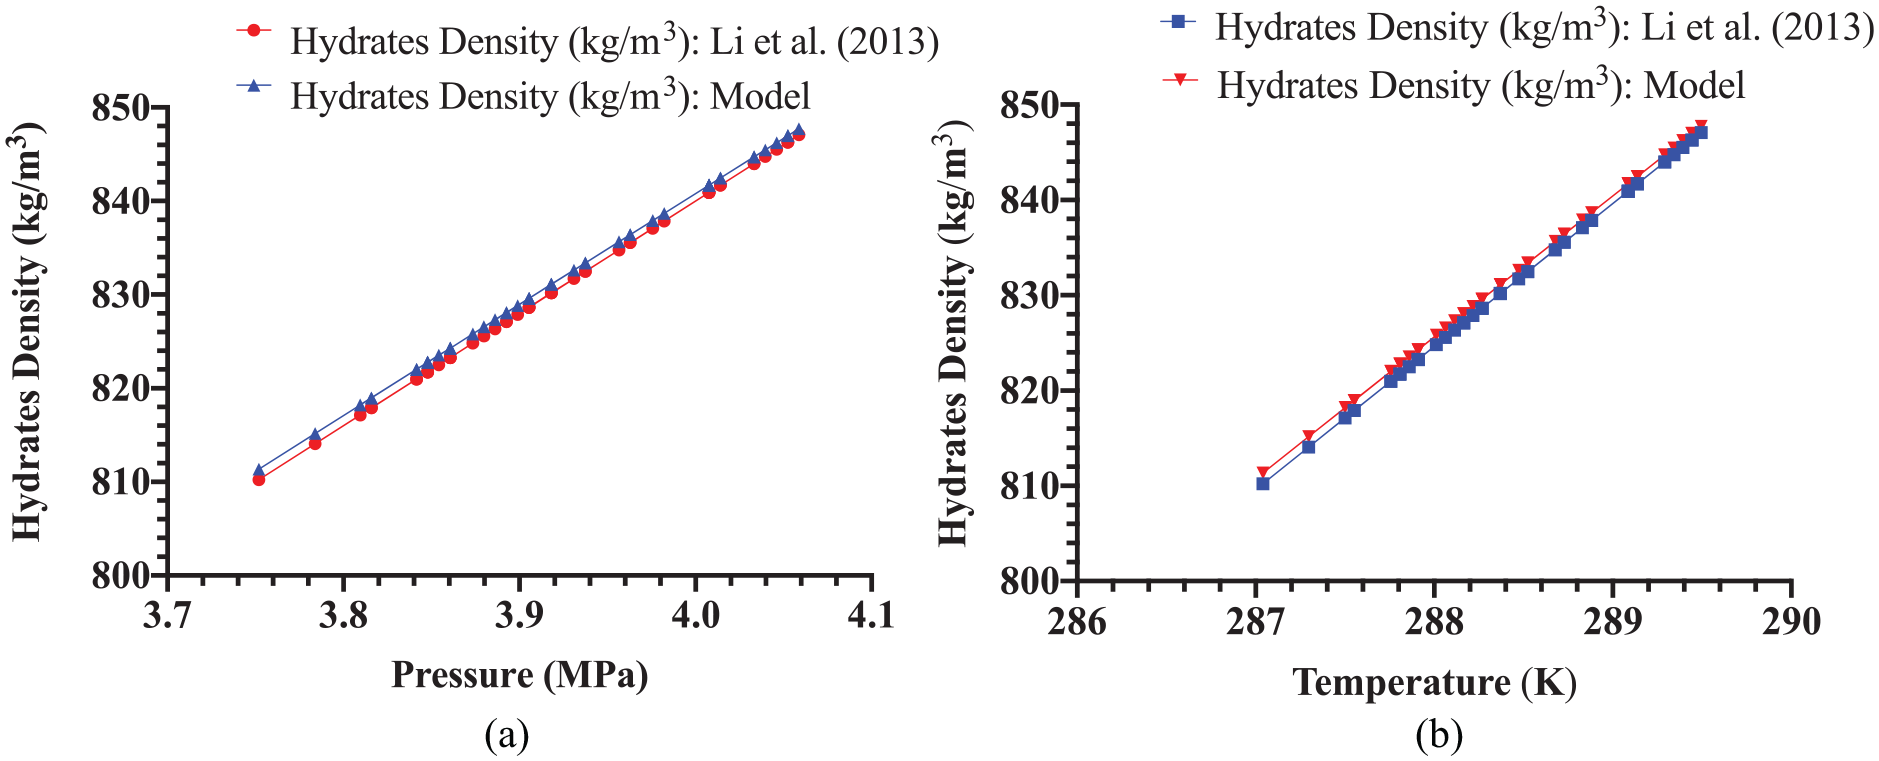
Comparing predictions of hydrates density estimation model with experimental results: (a) pressure and density of hydrates and (b) temperature and density of hydrates.
The hydrate density derivation in equation (29) is based on the observation in our previous CFD model on the prediction of hydrates deposition rate, 35 where it was observed that the gas density increased towards the pipewall during the simulations. So, we applied an averaging technique to relate the density of natural gas and water under hydrates forming temperature and pressure conditions to the density of hydrate. The regression formulation in equation (30) was used to fit the outcome of equation (29) to experimental results in Li et al. 6 The above mathematical relation should be applied when the pipeline operating temperature and pressure are within the stable hydrate zone, which is left of the loci in Figure 7. From Figure 5, the hydrate density estimation using equation (29) compares favourably with the results in Li et al. 6 In theory, there is a positive correlation between gas pressure and the density of hydrates. 1 Also, in Figure 5, a positive linear relationship is observed between hydrates density and the temperature and pressure in the pipeline. For annular flow scenario, which is applicable to gas-dominated pipelines, the average density of hydrates measured from the experiment by Ding et al. 47 at 10% water volume fraction, temperature of 273 K and pressure of 5 MPa is 825 kg/m3, and the prediction from equation (29) is 857 kg/m3, which represent 4% overprediction relative error from the experimental measurement. Again, the hydrates growth rate equations in the literature9,12,30 assumed 950 kg/m3 as the density of hydrates, whereas the value obtained from equation (29) using the pressure (8.9 MPa), temperature (289 K) and water volume fraction (0.06) experimental conditions of Di Lorenzo et al. 26 is 935 kg/m3. Implying that the result of the new hydrate density estimation equation for gas-dominated annular flow hydrates formation scenario is consistent with experimental results. Hence, instead of assuming the density of hydrates in future hydrates related experiments and models, the equation developed in this study for the density of hydrates (equation (29)) can be used. This will ensure that the density of hydrates used is representative of the variation in gas pressure and temperature changes during the simulations. Again, since gas transportation in pipeline is related to gas temperature and pressure, this model is a handy tool for estimating the density of hydrate formed in the pipeline in the field. Also, accurate estimation of the density of hydrates enables the estimation of the right trust to push the hydrate plug out of the pipeline using the relation for fluid force (equation (31)).

where
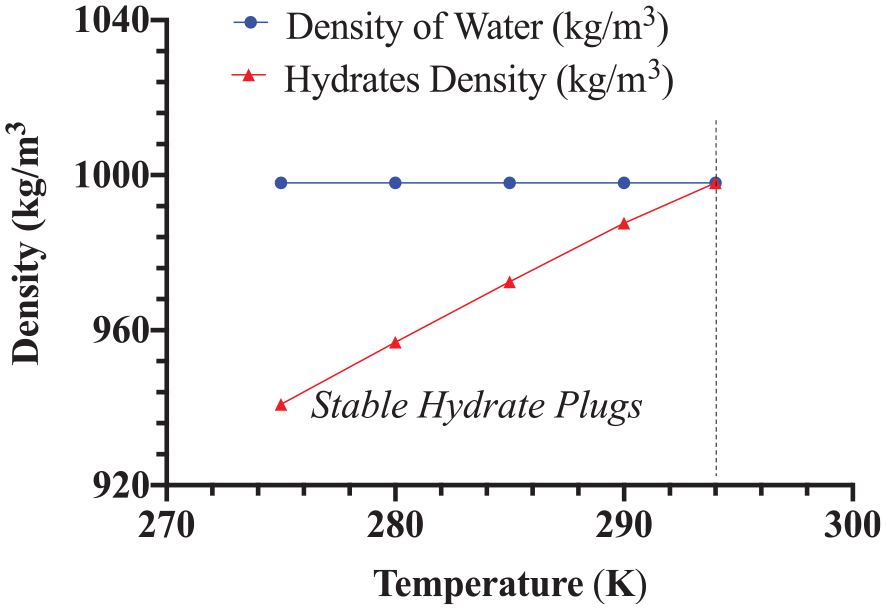
Determining the temperature for hydrates transportability at gas pressure of 6.0 MPa by increasing the temperature of the pipeline.
From Figure 6, at a gas pressure of 6.0 MPa the calculated density of hydrates using equation (29) shows that the transportability of hydrates plug can be achieved if the temperature is increased beyond 293 K. This also corresponds to the point where the hydrates are unstable from the methane hydrate curve (Figure 7).
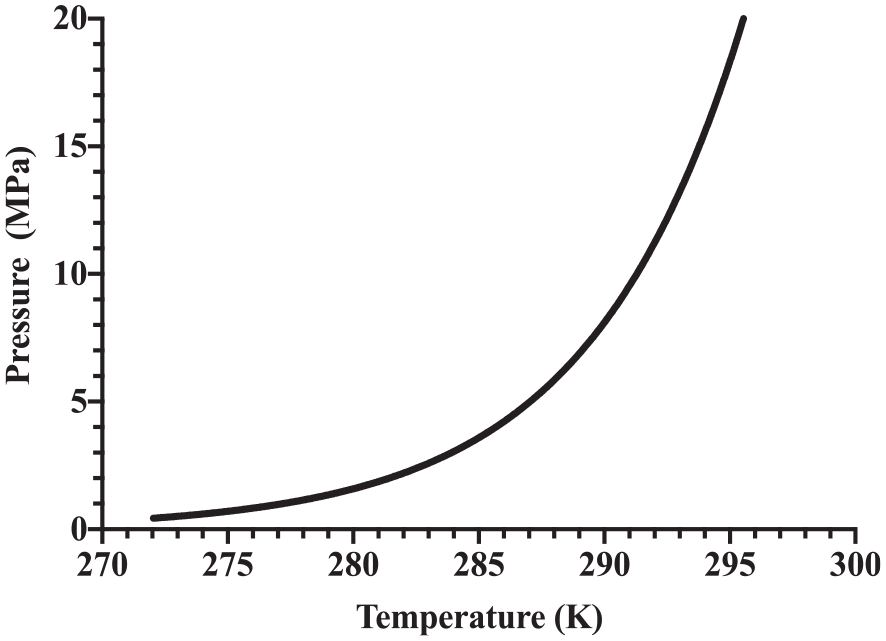
Methane hydrates loci. 26
Location of hydrates plugging event
The purpose of the sensitivity simulations in this section is to use the hydraulic effect of hydrates deposition rates on transient pressure drop and hydrates plugging flowtime to locate hydrates plugging event along the pipeline. Hydrate plugs increases the line-pack upstream of the plug, leading to transient pressure waves moving upstream which can trip the discharge compressor if the transient pressure equals the discharge shutdown setting of the compressor. 49 When the compressor fails to trip, the pipeline can rupture because of over pressurisation. If the compressor trips, the pressure surge in the pipeline because of the locked-in gas will gradually disappear, and the gas velocity will reduce because of friction and drop in inertia. 49 However, the locked-in gas pressure behind the hydrate plug can still lead to failure, especially for older pipes with reduced pipeline wall thickness because of internal corrosion. Throughout the calculations and simulations in this section, it is assumed that a single plug is formed at any time along the pipeline. In the simulations that follows, the transient pressure drop and plugging flowtime prediction models developed earlier, will be used to predict hydrates plugging event along a gas pipeline. Before determining the location of plugging events using the models developed earlier in this study, it is important to perform some parameter sensitivity simulation to investigate the performance of the models against related theoretical suggestions in the literature.
Effect of hydrates deposition on transient pressure drop and plugging flowtime
The pressure in the pipeline determines the shear stress of the hydrate deposit on the wall. The shear stress determines how much differential pressure is needed to release the hydrate plug. 10 Hence, it is important to determine the resulting transient pressure drop in the pipeline because of hydrate plug formation. Theoretically, increase in hydrates deposition rates at constant gas flow velocity due to increase in subcooling temperature leads to increase in transient pressure drop.12,26 This is because of the reduction in pipe annulus as hydrates are deposited on the pipe wall. For practical application, it is expected that pipeline plugging, and early transient pressure rise should occur more in cold locations when the temperature is relatively stable below the hydrate equilibrium temperature and higher-pressure conditions that encourages hydrates formation. The results in Figure 8 using equations (25) and (26), agrees with the expected theoretical outcome, that hydrates plugging risk increases with increasing deposition rate under the same flow condition.12,26,44
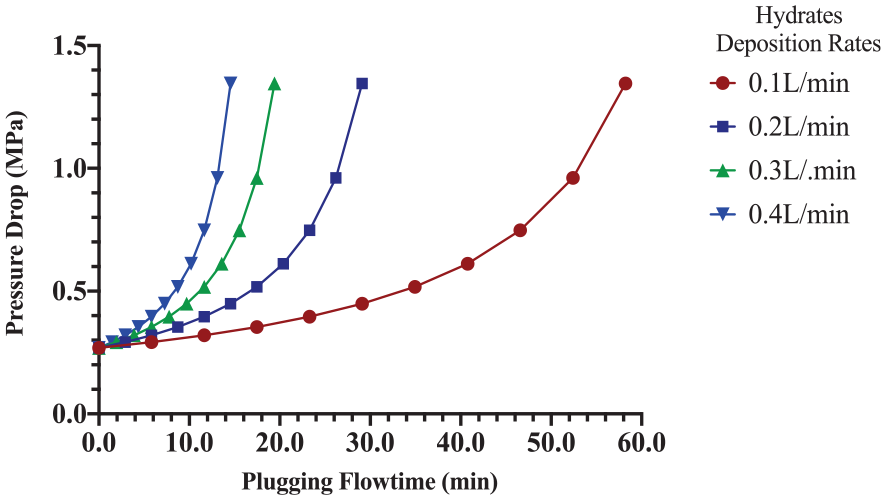
Comparing pressure drop curves at different rates of hydrates deposition at a gas velocity of 8.7 m/s, and pipeline temperature of 287.5 K and pressure of 10.9 MPa.
Effect of increase in pipeline diameter
The purpose of this sensitivity using equations (25) and (26) is to investigate the effect of increasing diameter on pressure drop and plugging flowtime for diameters of 0.0204, 0.0408, 0.0612 m and corresponding deposition rates of 0.14, 0.28 and 0.42 L/min. The hydrate plug is assumed to be located 50 m from the point of hydrates equilibrium condition, at the gas velocity of 8.7 m/s, pipeline temperature of 287.5 K and pressure of 10.9 MPa.
The results indicates that though the hydrates deposition rate increases as the pipe diameter increases (Figure 9), the transient pressure drop is lower with extended plugging flowtime provided the upstream compressor discharge pressure is the same in larger pipes. The implication is if line is expected to have hydrates, increasing the pipe diameter can reduce the susceptibility of the line to hydrates plugging. However, this decision must be arrived at by considering the possible gas flowrate from the field throughout the useful life of the pipeline, to avoid issues of internal corrosion with under-capacity utilisation because of the low liquid loading capacity of the flow. 50
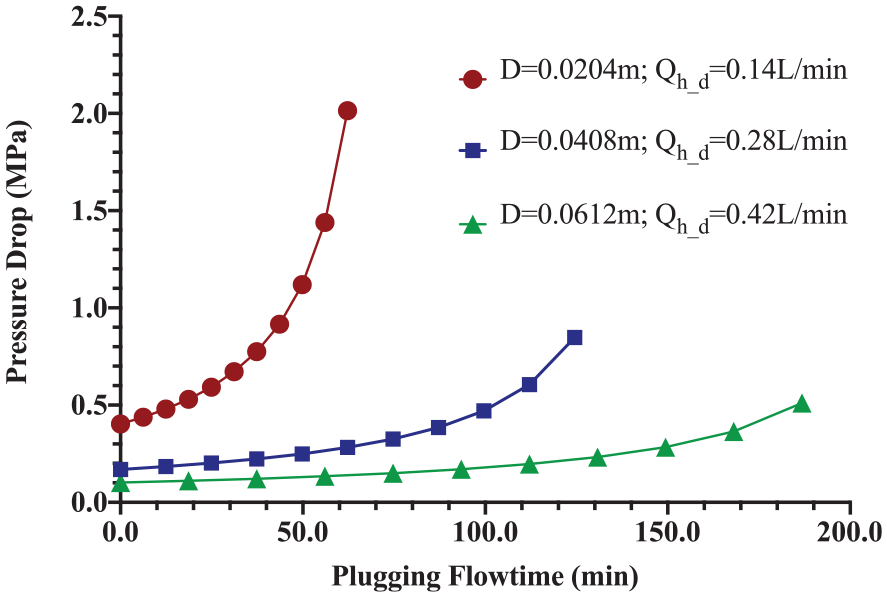
Comparing pressure drop curves at different pipeline diameter and corresponding hydrates deposition rates at gas velocity of 8.7 m/s, and pipeline temperature of 287.5 K and pressure of 10.9 MPa.
Effect of hydrates deposition rates on pipe inner diameter
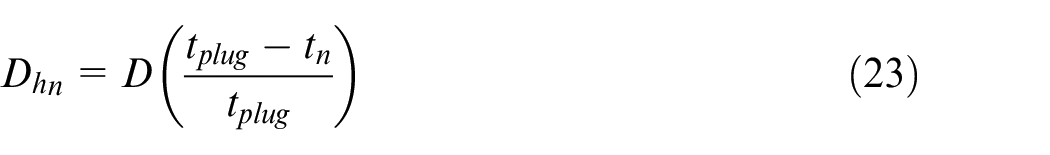
From equation (23), hydrates deposition on the pipe wall reduces the pipeline inner diameter in a nonuniform pattern as suggested from plots in Figure 10, below. This position is also corroborated in the literature. 37
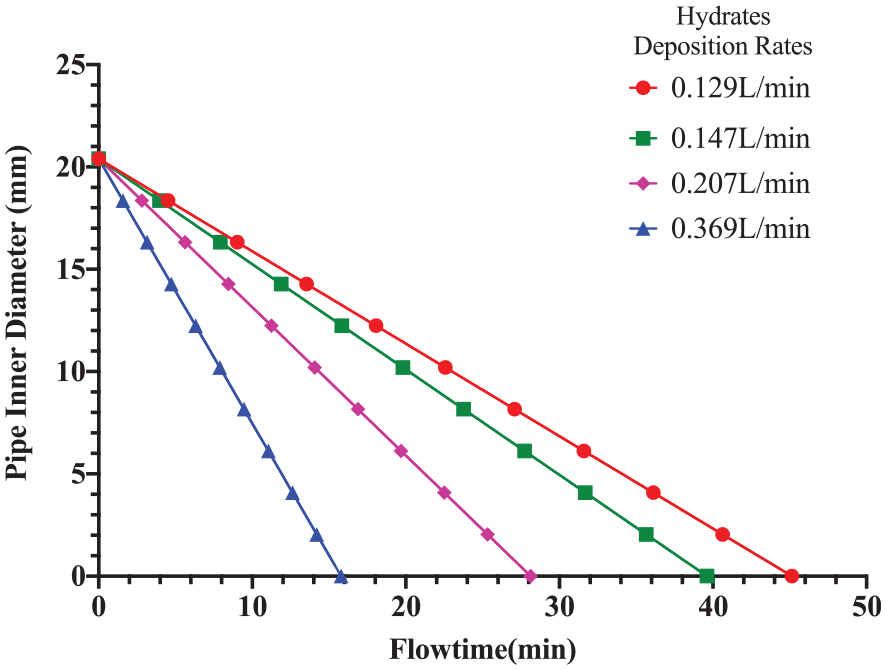
Comparing pipeline hydraulic diameter reduction at different hydrates deposition rates at gas velocity of 8.7 m/s, and pipeline temperature of 287.5 K and pressure of 10.9 MPa.
From the plot in Figure 10, the pipeline is plugged earlier at higher deposition rates under the same fluid velocity of 8.7 m/s. Hydrates deposition rate under the same flow condition is a function of the subcooling temperature. Lower pipe surrounding temperature enhances gas solubility in water, 38 leading to increasing hydrates formation and deposition. Hence, in deeper offshore sea floor conditions where the temperature is much lower, hydrates plugging will be earlier. The pipeline hydraulic diameter reduction rate (mm/min) increases from lower deposition rate to higher deposition rate (Figure 11).
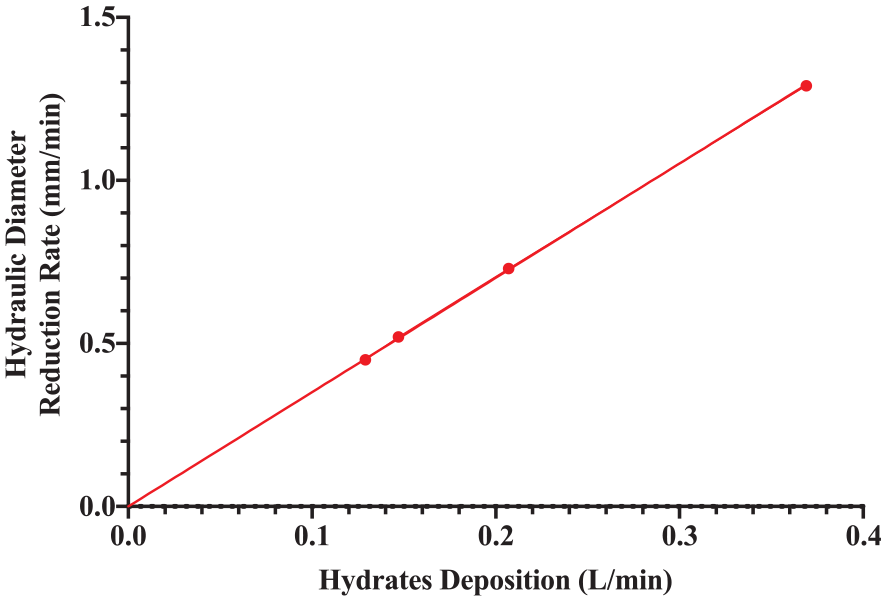
Pipeline hydraulic diameter reduction rate as hydrates deposition rates increases at gas velocity of 8.7 m/s, and pipeline temperature of 287.5 K and pressure of 10.9 MPa.
Hydraulic effect of hydrates plug at different sections of the pipeline
The hydrates forming section in the pipe determines the pressure drop and plugging flowtime. By varying the length of the section at a deposition rate of 1.0L/min plots of pressure drop for every sectional length are obtained in Figure 12.
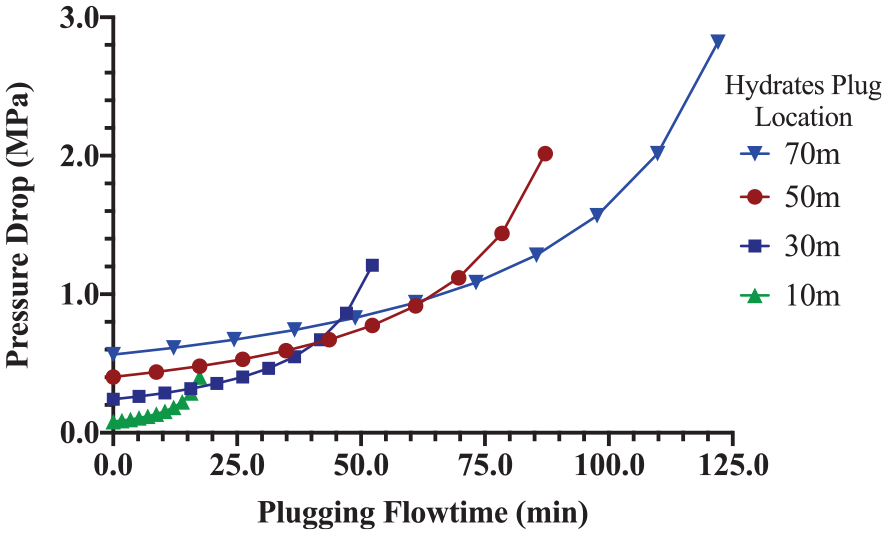
Pressure drop curves at different hydrates plug location along the pipeline at gas velocity of 8.7 m/s, and pipeline temperature of 287.5 K and pressure of 10.9 MPa.
The sensitivity simulation in Figure 12 is important because it indicates that the transient pressure drop model can be used to determine the location of hydrates plug in the pipeline. This observation is similar to the effect observed if valves at different locations along a horizontal pipeline are closed one at a time. Hence, the hydrates plug near the discharge compressor will experience a lesser transient pressure drop because of the lower volume of the line pack. When the plug location is farther from the discharge compressor, the line pack increases behind the plug until it reaches the compressor station. Hence, the volume of gas behind the plug increases as the plug is farther from the compressor discharge point. The transient pressure wave travelling upstream towards the discharge compressor station is from the hydrate plug location and at the speed of sound in the gas.42,49 In the discussion that follows, some parameters relating to the study of hydrate plug location and transportability have been studied. This is because in the beginning of every experiment, the relationship among the variables is not usually known until the end of the experiment. 42 A matrix of the correlation between these parameters is presented in Table 4.
Correlation between the location of hydrate plug and the parameters that defines the transportability of hydrates.
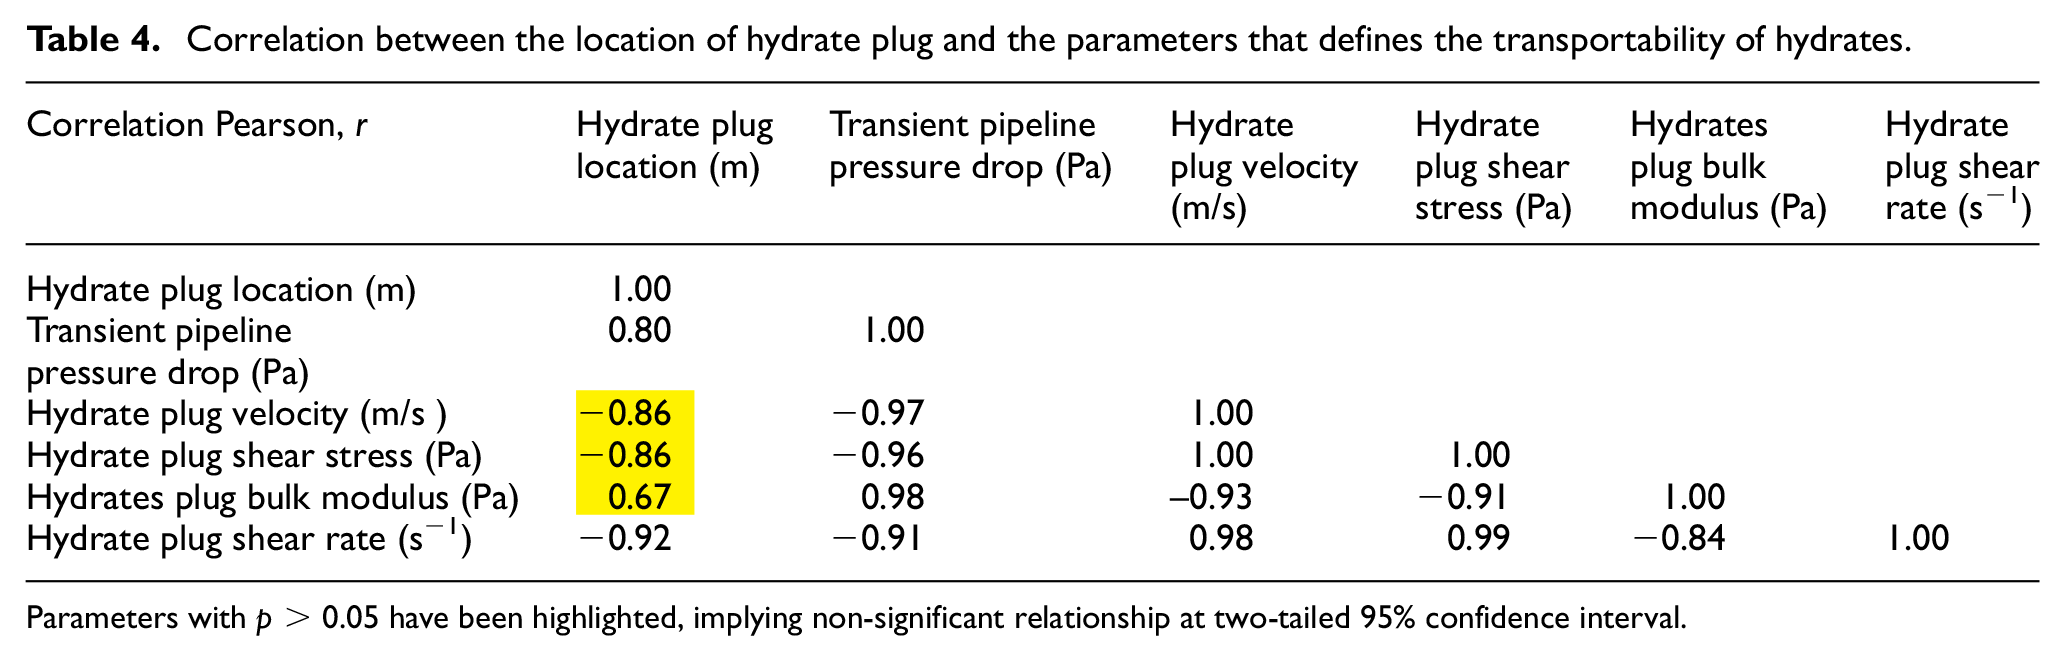
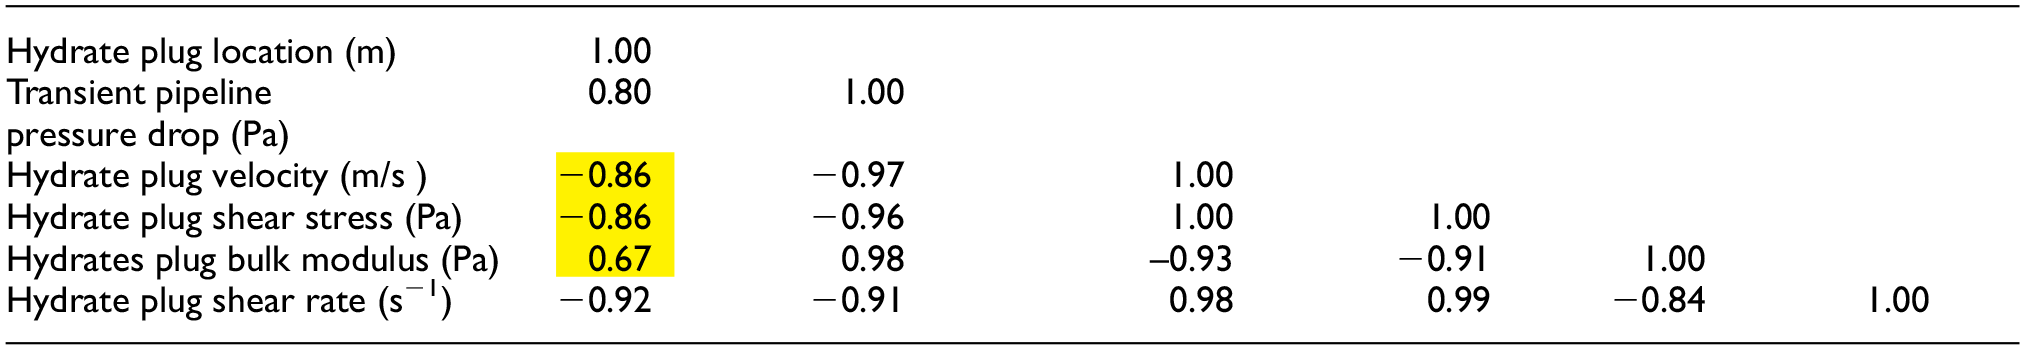
Parameters with p > 0.05 have been highlighted, implying non-significant relationship at two-tailed 95% confidence interval.
From Table 4, the following relationship are significant at 95% confidence interval (p < 0.05): (i) There is an increase in transient pressure drop as the location of the hydrate plug is farther from the hydrates equilibrium condition point along the pipeline, whereas the shear rate and shear stress of the hydrate plug reduces. Hence, the transient pressure drop is inversely related to the shear stress and shear rate of the hydrate plug; (ii) The transient pressure drop also increases as the bulk modulus increases. Implying that the pressure drop increases because of a reduction in the transportability of hydrates as a result of increasing resistance to shear; (iii) The velocity of hydrates determines their transportability in the pipeline. It is inferred also from the correlation in Table 4, that the velocity of the hydrate plug increases as the shear rate increases and reduces as the bulk modulus increases, which agreed with the observation in (ii) above. Consequently, the parameters measured above are the physical fluid properties relating to the transportability of hydrates in the pipeline, and these properties are related to both hydrate plug location and the induced transient pressure drop; suggesting that hydrate plug location can be inferred directly from the transient pressure drop. Details of the parametric sensitivity simulations using the transient pressure drop model developed in this study are discussed further. In the simulations using equation (25), the operating pressure was increased from 4 to 7 MPa at constant temperature of 285 K with gas velocity of 8 m/s, hydrates plug location at 500 and 1000 m, water volume fraction of 0.1, pipeline diameter of 0.102 (4 inches) and hydrates deposition rate of 10 L/min. This is to demonstrate the effect of hydrates location on transient pressure drop and the hydraulic behaviour of the physical flow parameters of hydrates.
Effect of pressure drop on the bulk modulus of gas and hydrate
Bulk modulus (
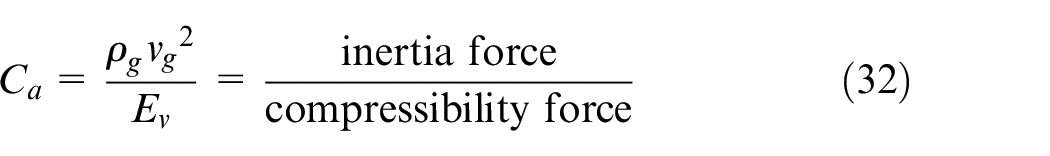
Where
Where
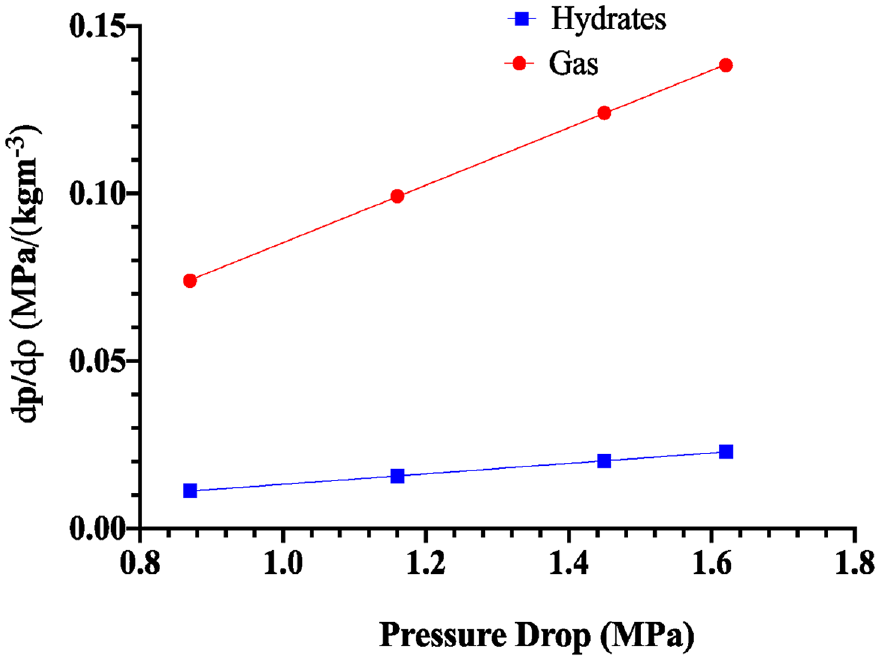
The hydraulic effect of transient pressure drop on the ratio of pressure drop to change in density at constant temperature of 285 K when the hydrate plug is located 500 m downstream of the hydrate equilibrium point along the pipeline.
From Figure 13, the transient pressure drop behind the hydrate plug is positively related to compressibility of the gas and hydrates. However, the gas experiences higher compressibility than the hydrates, which is expected from theory because of the low density of gas. This effect is responsible for the projectile thrust experienced in gas pipelines plugged by hydrates when the pressure upstream of the hydrates plug is higher than the downstream pressure. Figure 14 indicates that the bulk modulus of the deposited hydrates on the pipe wall increases linearly as the transient pressure increases due to increasing operating pressure. The implication of this graph is to explain how hydrate transportability and hydrate plugs can be achieved through the control of compressor discharge pressure.
The hydraulic effect of transient pressure drop on bulk modulus of hydrates as the gas pressure was increased from 4 to 7 MPa at constant temperature 285 K and various hydrate plug location downstream of the hydrate equilibrium condition along the pipeline.
The indication in Figure 14 implies that reducing the bulk modulus can enhance hydrates dissociation, detachment from the wall and transportability. Also, inferred from Figure 14 is the fact that if continuous increase in pressure drop is experienced, the plug location is farther away from the equilibrium position with higher resistance to flow.
Hydraulic effect of hydrate plug location on shear rate and shear stress
Earlier, it was discussed that the shear stress determines how much differential pressure is needed to release the hydrate plug or enable transportability of hydrates in the pipeline.
10
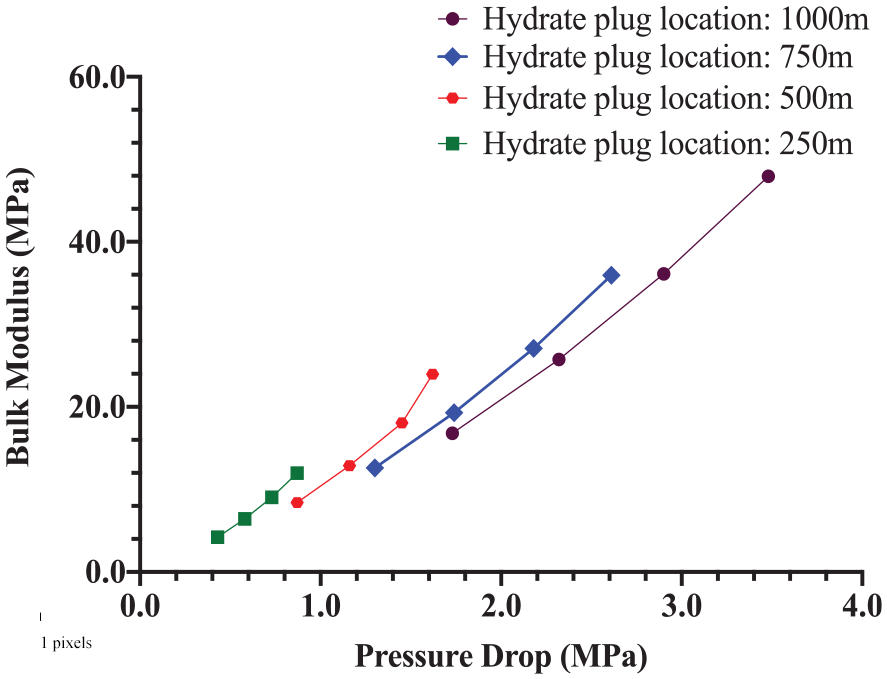
The relationship between shear stress and bulk modulus is important in understanding the transportability of hydrates. The shear stress of the deposited hydrates defines the possibility of hydrates sloughing and pipeline wall shedding by the hydrates deposits. Shear stress
To relate the shear stress to the bulk modulus, equation (33) was defined in terms of
Where
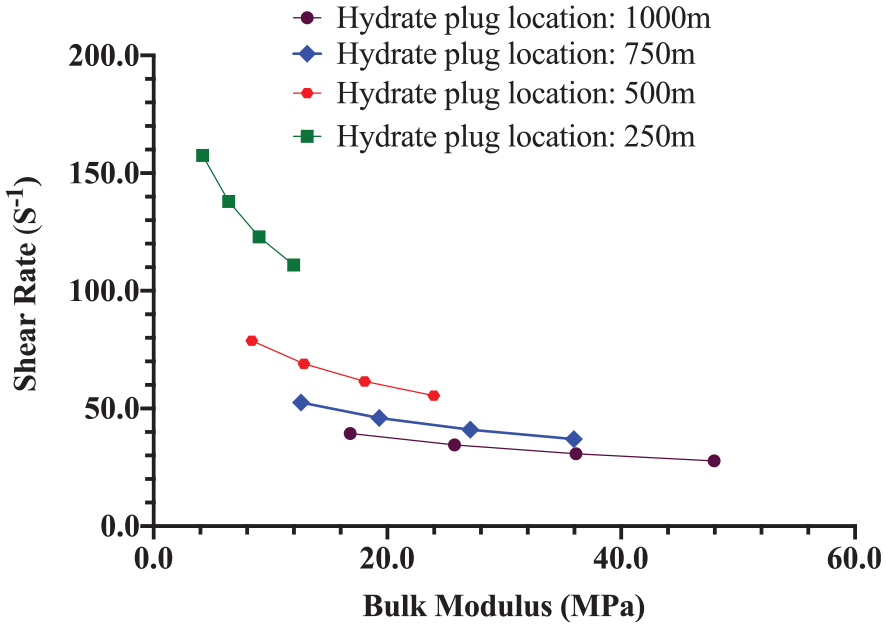
The hydraulic effect of bulk modulus on shear rate at constant temperature 285 K at various hydrate plug locations.
Hence, longer hydrates plug are expected as their location increases along the gas pipeline. The higher shear rate for hydrate plugs closer to the equilibrium point is due to hydrates sloughing and wall shedding phenomenon because of the presence of higher kinetic activity of the gas molecules leading to higher liquid and hydrate loading. However, as the plugging event is further from the equilibrium point, more dispersed water is consumed in the formation of hydrates, which deposits on the way while reducing the hydraulic gradient, until the plugging event leads to increasing transient pressures. Hence, since bulk modulus is positively related to transient pressure drop, the shear rate is also negatively related to transient pressure drop as seen in Figure 16. Lower shear rate can also be experienced by the hydrate deposit/plug due to lower deformation because the hydrates glides over a thin layer of water on the wall of the pipe. 10 However, this scenario cannot lead to very high transient pressure drop because of the relative motion of the plug, in response to the gas compression behind the plug. The bulk modulus measures the pressure drop with respect to the strain in the hydrate layer/plug (Figure 16).
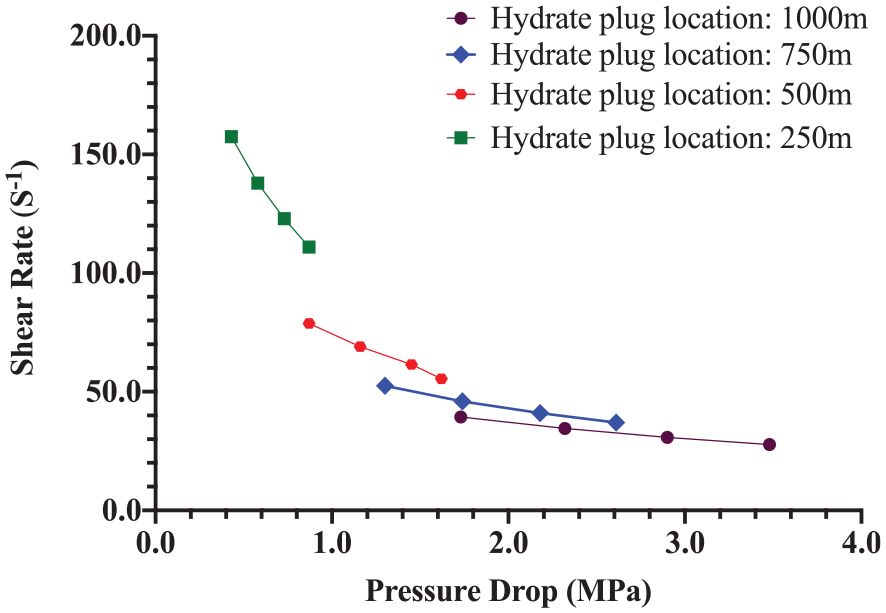
Comparing the hydraulic effect of pressure drop on shear rate at constant temperature of 285 K and varying hydrate plug location along the gas pipeline.
As observed in Figure 16, the increase in pressure drop is because the shear rate reduces, implying higher resistance to flow and deformation. Thus, for the range of operating pressures of 4–7 MPa considered, shear rate decreases as the distance of the hydrate plug increases from the equilibrium position, implying increased plugging risk. The indication in Figure 16, suggests that for shorter pipelines hydrates deposits can be removed by increasing flow to increase the loading of hydrate particles, and for longer pipelines, there is the need to estimate the pressure and temperature of dissociation and the force upstream of the flow to enable transportability of hydrate deposits and plugs. To explain the phenomenon of hydrates shear stress and the thrust behind the hydrate plug (equation (31)), the viscosity of hydrates is first obtained. In this study, the viscosity of hydrates is regressed using the relation we developed in equation (37) from the experimental measurements of the viscosity of hydrates in the literature. 51
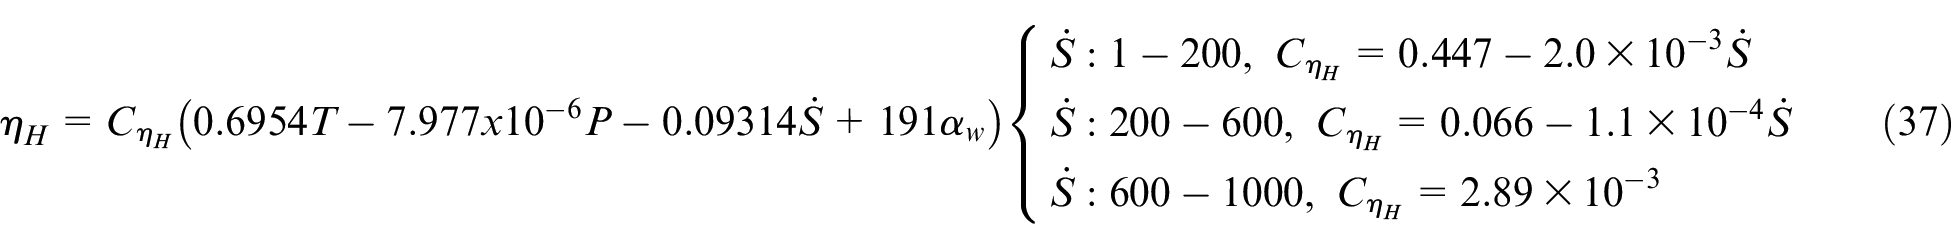
Where
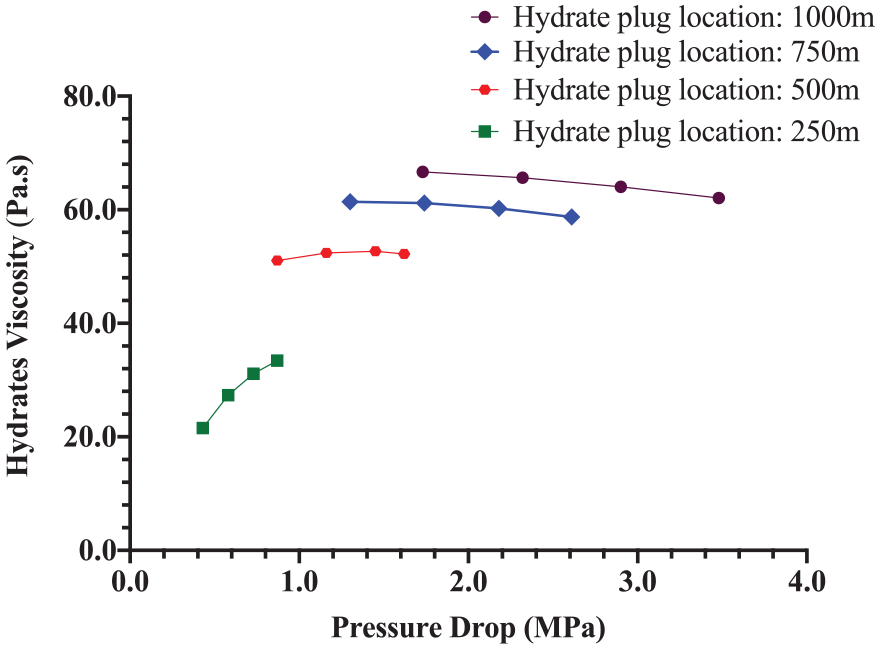
Comparing the hydraulic effect of transient pressure drop on the viscosity of hydrate at constant temperature of 285 K and varying hydrate plug distance downstream of the hydrates formation point.
From Figure 17, it is observed that at lower pressure drop (0–1.5 MPa) the viscosity increases with increase in transient pressure until the point (beyond 1.5 MPa) when the viscosity decreases with increase in pressure. This phenomenon is corroborated from the experimental measurement of the viscosity of water, 52 and since the high density of hydrate is as a result of water molecules, it is expected that the viscosity of hydrates will behave in similar manner. Hence, the shear stress of the deposited hydrates is obtained using equation (35) in Figure 18.
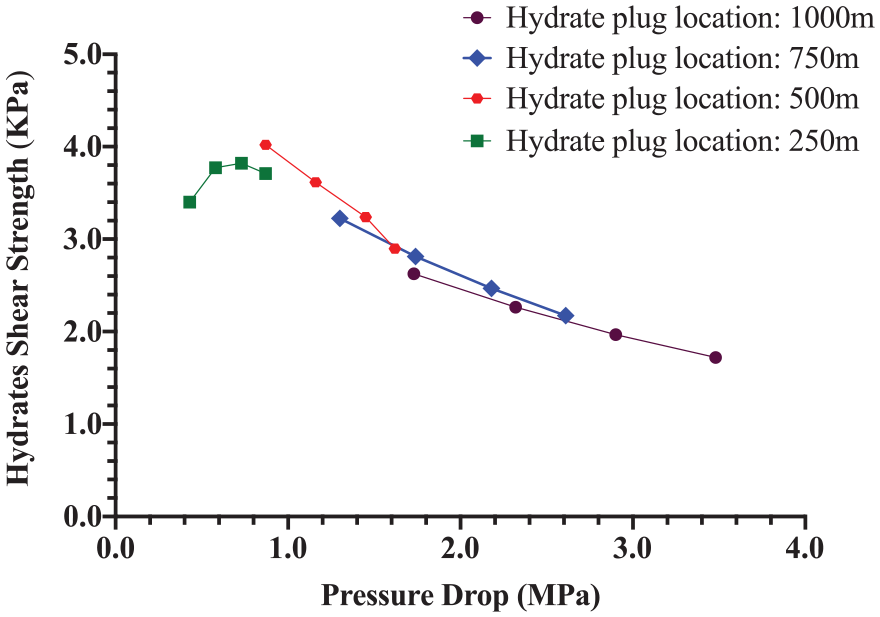
Comparing the hydraulic effect of transient pressure drop on the hydrates shear stress at constant temperature of 285 K and varying hydrate plug location beyond the hydrate’s formation point.
The same effect of viscosity at lower pressure and when the hydrate plug location is closer to the point of hydrates formation along the pipeline (Figure 17), is observed for the hydrate shear stress curves in Figure 18 because of the positive relationship between shear stress and viscosity (equation (35)). Theoretically, higher pressure drop is the result of lower shear stress in the flow domain as the pipeline length increases. 42 This observation is also asserted in Figure 18. Lower shear stress indicates poor transportability and increased plugging severity, while higher shear stress indicates reduced plugging severity. Once the hydrate plug is stuck in the pipeline, the pressure drop increases and the shear stress reduces. Thus, hydrates sloughing and wall shedding is possible when the hydrates deposit and plug location is closer to the source of hydrate formation. The estimated hydrate shear stress was used to determine the thrust needed to move the hydrate plug along the pipeline. This will help to estimate the pressure needed upstream of the hydrate plug.
Effect of hydrate plug location on hydraulic thrust upstream of the hydrate plug
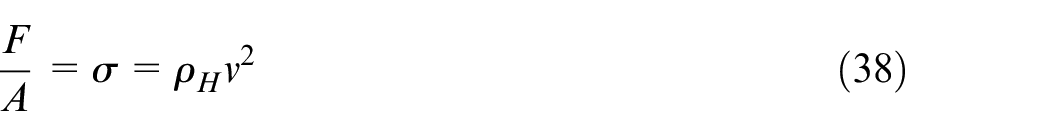
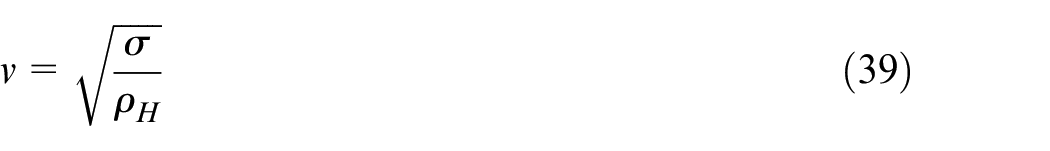
By assuming that the hydrates plug experiences normal stress on the upstream cross-sectional surface, equation (29) can be applied to determine the density of the hydrate. Thereafter, equation (39) will be used to determine the hydrate velocity (Figure 19). The relationship between the hydrate plug velocity is related to the hydrate shear stress in equation (39).
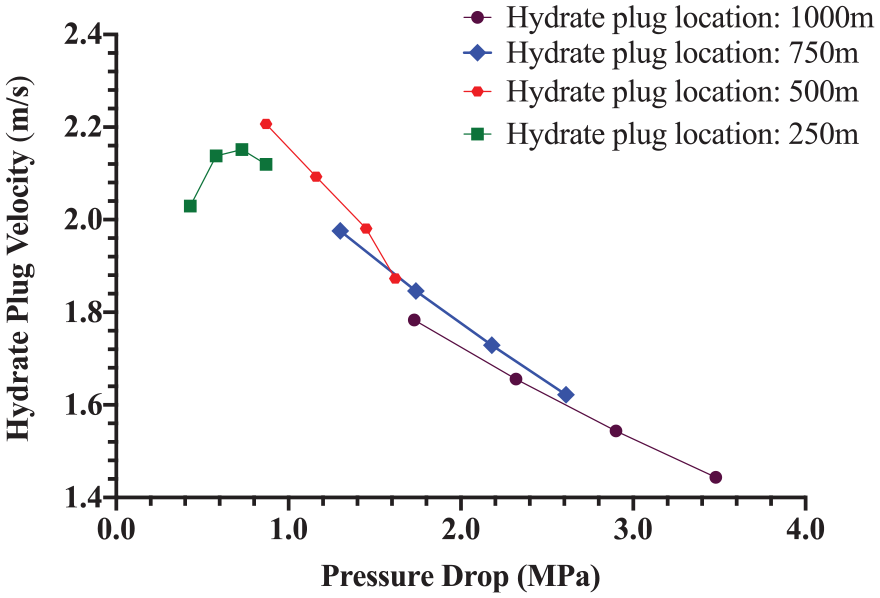
Comparing the hydraulic effect of pressure drop on the hydrates plug velocity at constant temperature of 285 K and varying hydrate plug location downstream of the hydrates equilibrium condition point along the pipeline.
Defining equation (38) in terms of
The observation in Figure 19 is like the effect of shear stress on pressure drop discussed earlier. The increase in velocity of the hydrate plug located 250 m from the hydrate equilibrium position was positive until the transient pressure drop of 0.8 MPa, after which the velocity reduced as the viscosity increases and shear stress reduced. According to Newton’s second law of motion, the change in momentum of the hydrate plug is driven by the gas upstream of the plug, hence a reduction in the velocity of the gas which happens when the hydrate plug location is farther from the compressor discharge point equally leads to a reduction in the velocity of the hydrate plug. Also, in accordance with Newton’s third law, there is equal and opposite reaction between the compressing gas and the hydrate plug, hence the compressive effect of the gas phase on the hydrate plug is in response to how much resistance the hydrate plug offers to the flow. This is also seen in the velocity of the plugs at each section investigated in Figure 19.
The thrust from the gas on the hydrate plug increases as the transient pressure drop increases, leading to more line-packed gas and a reduction of kinetic movement within the gas molecules upstream of the hydrate plug. In Figure 20, the thrust on the hydrate plug increased in like manner as the velocity and shear stress discussed earlier, when the hydrate plug location was at 250 m until the pressure drop value of 0.8 MPa. This is because the thrust is reduced due to increase in the bulk modulus of the hydrate plug.
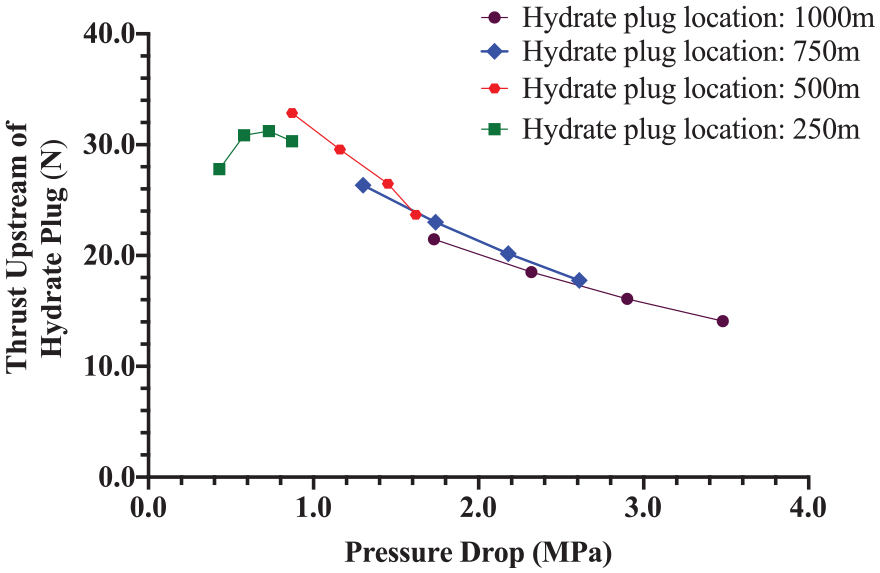
Comparing the hydraulic effect of pressure drop o then hydraulic thrust upstream of the hydrate plugs located at temperature of 285 K and varying hydrate plug location downstream of the hydrates formation point along the pipeline.
The implication from Figure 20 is the fact that since thrust decreases as the hydrate plug location is farther from the hydrate formation point, it is important to prevent hydrates settling on the base of the riser through early monitoring of hydrates formation. This way, the pipeline can be shut down once there are indications of increasing intermittent transient pressure drop which is the evidence of hydrates sloughing and wall shedding. As stated in the assumptions for the development of our transient pressure drop model (equation (25)), hydrates sloughing and wall shedding was neglected to enhance proactive prediction of hydrates plugging risk. Since higher pressure drop increases the risk of hydrate plugging event, the pressure drop must be continuously monitored to observe transient events. This approach can be modified to what work best for the specific field application. The pressure for the transportability analysis can be obtained as proposed in Figure 6 earlier.
Hydraulic flow parameters for locating hydrate plug
From Table 4 presented earlier, the following parameters are directly related to the location of hydrate plugs. Temperature is not included because the system is isothermal once hydrates are deposited on the pipeline wall. Hence:

Therefore, the rate of change of the location of the plug can be defined in relation to the rate of change of the parameters on the RHS of equation (40):
Once the pipeline is blocked by hydrate plug at the location
Locating hydrates plug at gas velocity of 8.7 m/s, and pipeline temperature of 287.5 K and pressure of 10.9 MPa.
As shown in Figure 21, if the pressure drop is about 1.8 MPa the hydrate plug can be located about 44 m downstream of the hydrate formation point. The hydrates formation point (0.0) is the location along the pipeline where the temperature is equal to the hydrates equilibrium temperature, provided the pressure is equal to or above the hydrates equilibrium pressure. This location can also be determined using subsea temperature probes/transmitters installed on the pipeline. Therefore, this study proposes equation (25) for locating the position of hydrate plugs based on the resulting transient pressure drop along the gas pipeline. How our model can be implemented for this purpose is discussed earlier.
Hydrates plug location prediction table
From the understanding in Figure 21, a table of hydrates plug locations can be developed as presented below. For field application, this table can be developed for any candidate pipeline experiencing hydrates to predict plug locations from point of hydrates equilibrium temperature, if the pipeline pressure is greater than or equal to the equilibrium pressure. Hydrates equilibrium temperature
Where
Hydrates plug location prediction at hydrates deposition rate of 10 L/min.
Comparing transient pressure drop at gas velocities of 4 and 8 m/s with respect to the plugging distance when the hydrates deposition rate is 10 L/min: (a) 4m/s and (b) 8m/s.
Hydrates plug location prediction at hydrates deposition rate of 20 L/min.
The results in Tables 5 and 6 illustrates that the pressure drop at the hydrates plug locations under the same pipeline diameter and flow conditions is similar, but the time to plug the pipeline at each location reduces as the hydrates deposition rate increases. Under the same gas velocity, inlet pressure and temperature and pipeline diameter, increase in hydrates deposition rate by a factor of 2 reduces the plugging time by the similar factor. The implication of this is the need to improve hydrates intervention frequency during lower pipeline surrounding temperatures, because hydrate deposition increases with increasing subcooling temperatures. In the industry, this kind of table can be developed for a candidate pipeline to relate pressure drop and time of flow to hydrates plug location along the horizontal section of the pipeline. The above simulation results demonstrate how the transient pressure drop model developed in this study can be used to locate the position of hydrate plugs based on the transient pressure drop and the time to the commencement of the plugging event. Figure 22 is the representation of the effect of plugging location on transient pressure drop when the hydrate deposition rate is 10 L/min.
As suggested from Figure 22, the transient pressure drop is positively related to the location of hydrate plugs. If this kind of graph is plotted for a candidate pipeline as also suggested earlier in Figure 21, the reading of the transient pressure drop can be used to predict the location of the hydrate plug. We propose a schematic of a real-time arrangement for predicting hydrate plug location in conjunction with the approach described in this section.
Hydrates plug location prediction steps
Figure 23 is a proposed hydrate forming and plugging pipeline section, installed with sensors for recording the temperatures and pressures in the pipeline, as these are the main real-time parameters needed by the models to predict the hydrates plug location. A real-time monitor registers the pressure fluctuations and temperature along with the time of flow. The time of flow starts when the pressure sensor indicates that the flow has achieved the operating pressure. The temperature plot is observed for a uniform temperature profile, which indicates hydrates formation, and the pressure plot is observed for a continuous rise in pressure. The pressure sensor is located at the hydrate equilibrium point predicted from hydraulic flow simulators and superimposing the temperature curve predicted by equation (42). The temperature sensor is located along the pipeline to obtain the average temperature along the hydrate forming section.
Proposed hardware installation on gas pipeline for real-time data transfer for hydrates plug location detection.
The proposed steps for using the readings from the arrangement in Figure 23 to predict the hydrates plug location are presented as follows:
a. Determine the pipeline hydrate equilibrium location by superimposing the equilibrium temperature determined from equation (42) on the operating temperature gradient for the pipeline.
b. Simulate the deposition rate using a validated hydrates deposition rate model in the literature. 35
c. With the predicted deposition rate, determine the time to plug the candidate pipeline at the riser base (equation (16)).
d. Determine the transient pressure drop from equation (25) by using predetermined hydrate plug locations along the pipeline as discussed extensively in this paper.
e. Plot the profile of the transient pressure drop at predetermined hydrate plug location as discussed earlier and develop a table similar to Tables 5 and 6.
f. Plot a graph of transient pressure drop against the predetermined hydrates plug location.
g. Monitor real-time pressure and temperature data from the pipeline using the arrangement in Figure 23.
h. Obtain the real-time transient pressure drop (Pa) at time (s) when the first significant pressure spike is above the maximum operating pressure or pipeline design pressure.
i. Compare the result with the plot of transient pressure versus hydrate plug location in step 5 to locate the probable hydrates plug location.
j. If the plug location predicted by the models is earlier or later than the actual position in the pipeline, the transient pressure drop model (equation (25)) should be calibrated appropriately to enhance the accuracy and consistency of future predictions by the model.
Also, to dissociate the deposited hydrates and free the line of the hydrates plug, we propose the following steps:
a. Estimate the hydrate density using equation (29).
b. Determine safe pressure and temperature to enhance transportability as described in Figure 6, where the density estimated from equation (29) is above the density of water (998 kg/m3).
c. Follow approved procedure to retrieve plug after depressurisation to the pressure determined from the previous step.
d. Determine thrust to free the hydrate plug and push the plug along the horizontal section of the pipeline as discussed earlier. For hydrates moving up the riser, the effect of gravity must be included, as this was not within the scope of this study.
Conclusion
Accurate prediction of the hydraulic effect of hydrate deposition and plug location is critical to the safety and operability of natural gas transport pipelines, especially for subsea gas transport pipelines where maintenance and intervention activities are more difficult. Hydraulic pressure drop analytical models exist in the literature for predicting the effect of hydrates deposition on the pipeline pressure because of reduction in pipeline hydraulic diameter. However, the existing models did not directly include the hydrates deposition rate in the pressure drop equation, making it difficult to directly investigate the effect of hydrates deposition rates on transient pressure drop. Also, the need to estimate the plugging time at various hydrates deposition rates requires another analytical model, which was lacking in the literature. To close the identified gaps, our approach directly incorporates the hydrates deposition rate for gas-dominated pipeline in one mathematical relation and developed another model for the time to plug the pipeline hydrates section. The basic assumption behind the transient pressure drop model is to stop gas flow once the first spike in pressure drop is recorded as a precautionary measure. By using only one multiplier factor which is a function of the gas velocity, this model is an improvement over the analytical model of Di Lorenzo et al. 9 because it proves to be more adaptable for industry application without having to change the multiplier factor under various flow velocity.
The transient pressure drop predictions for all six cases at both high and low velocity are within 4% relative error (mean relative error of 2.3%). Similar predictions by Di Lorenzo et al. 9 were within 40% relative error Also, the mean relative error of the transient pressure drop predictions by Zhang et al. 25 was 7.43%. As a proactive hydrate plugging preventive analytical tool, it is essential that the model can ‘underpredict’ the experimental plugging flowtime at the experimental transient pressure drop in the literature, which was also achieved with our model for all the six cases simulated for model validation. Hence, our model is an improvement over existing analytical hydrates plugging pressure drop prediction models. New models for estimating the density and viscosity of hydrates were also developed in this work. Approach to determining the location of hydrate plug was also proposed, as hydrates plug location can be predicted from a tabular chart developed from both models for various hydrates deposition rates by comparing the upstream pressures from pressure transmitters with the predictions from the models at specific flowtime from the onset of hydrates formation. More importantly, because our model incorporates the hydrates deposition rate directly, it is invaluable in real-time tracking of hydrates deposition volume when the pipeline is fitted with temperature and pressure transmitters. Hence, for practical application, the arrangement provided in this paper for monitoring real-time pipeline pressure and temperature is advised for implementation to aid the detection of hydrate plug location.
In addition to the verification and improved performance of the models, their capability was extended to predict hydrates plug locations along the pipeline by assuming that a single hydrate plug exists in the pipeline at any given flowtime. The results suggests that pipeline plugging flowtime reduces as the hydrates deposition rate increases, and that the pressure drop and plugging flowtime increases along the length of the pipeline. The main implications from the results of this study reveals the following:
a. This work is an improvement over existing pressure drop predicting models for gas hydrates pipelines at 4% maximum relative error compared with 40% by the model of Di Lorenzo et al. 9 and 7.43% by the model of Zhang et al. 25
b. A new model to predict hydrates plugging flowtime for proactive intervention in gas-dominate pipelines has been developed, which underpredicts the experimental plugging time by a mean relative error of 9%. Thus, in line with the philosophy of proactive predictive intervention.
c. By incorporating the hydrates deposition rate into the models, the predictions can capture real-time plugging events.
d. This paper also developed two other models: (i) hydrate density estimation model and (ii) hydrate viscosity estimation model. These models were used in the parametric analysis that provided further insights into the hydraulic effect of transient pressure drop on the physical parameters of hydrates.
e. Hydrates plug location has been predicted from a tabular chart for various hydrates deposition rates. By comparing the upstream pressure reports with the predictions from the model at specific flowtime from the onset of hydrates formation, the location of the hydrates plug can be predicted in field application.
f. Therefore, for practical application, it is proposed that the arrangement for real-time monitoring of pipeline pressure and temperature can be implemented.
Footnotes
Appendix
Notation
| Cauchy number (dimensionless) |
| diameter of the pipe section prone to hydrates formation (m) |
| pipeline hydraulic diameter (m) |
| bulk modulus (Pa) |
| dimensionless empirical approximation constant |
| dimensionless empirical model fit constant |
| length of hydrates section; distance from point of hydrates equilibrium condition (m) – is also the location of the hydrates plug |
| hydrate formation equilibrium pressure (KPa) |
| pipeline average pressure (Pa) |
| strain rate (1/s) |
| instantaneous flowtime (s) |
| plugging flowtime (s) |
| velocity of the primary continuous gas phase (m/s) |
| velocity (m/s) |
| volume of gas (m3) |
| hydrates deposition rate (L/min) |
| hydrates formation, agglomeration and deposition rate (L/min) |
| hydrate formation equilibrium temperature (K) |
| system temperature (K) |
| Greek symbol |
| friction factor (dimensionless) |
| density of the gas (kg/m3) |
| density of hydrates (kg/m3) |
| gas viscosity (Nm−2⋅s) |
| viscosity (Nm−2⋅s) |
| shear stress (Pa) |
| pressure drop (Pa) |
| timestep (s) |
| the ratio of the circumference of the pipe annulus to the diameter of that pipe, given as 3.142 |
Acknowledgements
The authors are grateful to the School of Engineering, Robert Gordon University, Aberdeen, United Kingdom, for supporting this research.
Declaration of conflicting interests
The author(s) declared no potential conflicts of interest with respect to the research, authorship, and/or publication of this article.
Funding
The author(s) received no financial support for the research, authorship, and/or publication of this article.