
Abstract
The abradable coating on the casing of a jet engine minimises any air gaps by allowing blades to cut a path into the abradable, reducing efficiency losses. Unfortunately, abradable cutting performance varies significantly with rub conditions and abradable type, leading to poor cutting performance and potentially damaging the blades. This study further develops the abradable testing capabilities of a 200 m/s spindle test rig by applying previously researched stroboscopic imagining techniques to record the front of the blade alongside thermal imaging of the blade and the abradable. The front camera makes it possible to see how adhesions are forming along the width of the blade, and how the adhesion growth differs between materials. The thermal camera can then be used to identify hot spots on both the blade and the abradable, providing an insight into how hot spots relate to adhesions both spatially and temporally. These tools have been proven with testing of Metco 601 at a range of incursion rates. At the incursion rate of 0.2 μm/pass the tools were able to provide conclusive results, with video footage of the front, side, blade temperature and abradable temperatures being aligned temporally and spatially. Numerical data could then be extracted to produce rub maps of adhesion height, blade temperature and abradable temperature on separate plots which is a powerful tool when looking for relationships between the data sets, and for identifying time-based patterns. Further benefits of this tool set were shown when focussing on individual adhesions events within a rub, allowing for the delays between abradable heating, adhesions forming and blade heating to be observed and quantified. When applied to multiple materials and at different test conditions this tool will provide further insight into how adhesion formation differs, and potentially into why adhesions form.
Introduction
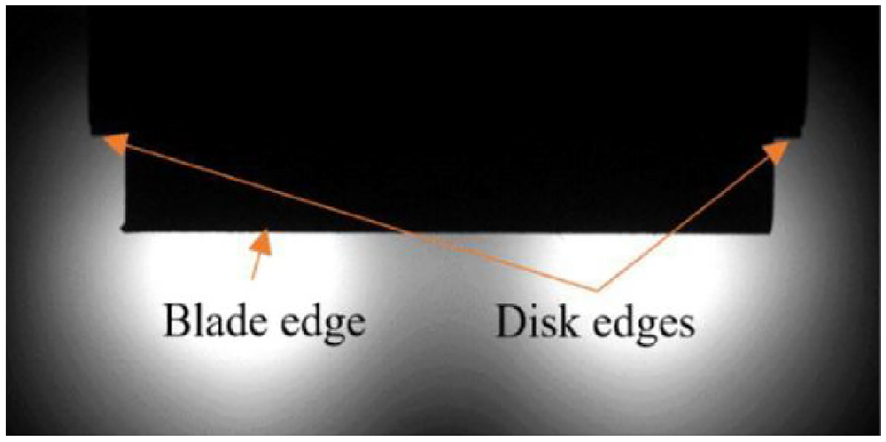
To maximise jet engine efficiency the gap between the blades and the casing must be minimised, this limits the amount of air which can travel around the outside of the blades. To overcome the limitations of machining and assembly tolerances an abradable coating is placed between the casing and the blades (Figure 1), when the engine is initially run the blades will cut a path into the abradable which should minimise any gap. In reality the cutting performance of the abradable is highly variable and can result in adhesions forming on the blades, leading to grooving on the abradable. In more severe cases the blades can wear, melt or even crack (Figure 2). These behaviours all have a negative impact on the efficiency and reliability of the engine. 1
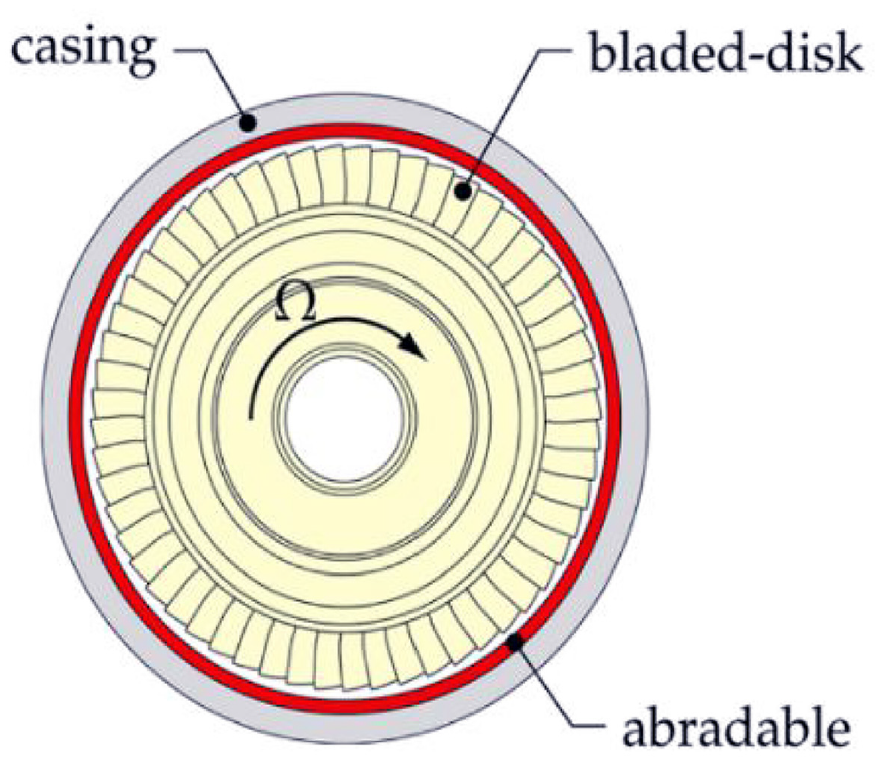
Abradable position. 2
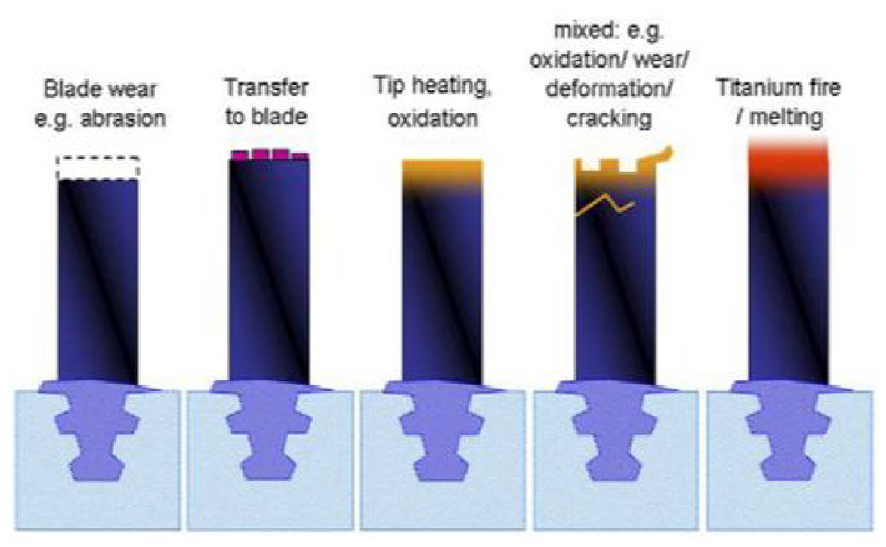
Blade wear mechanics. 1
This work aims to fill gaps in current knowledge around the impact of thermal properties to wear mechanisms through the development of novel in-situ measurement tools. In this paper existing stroboscopic imaging techniques have been applied to record blade profile, while simultaneously using a thermal camera to record hotspots on the blade and the abradable. Together these will allow for a deeper understanding of how abradable wear mechanisms relate to thermal behaviours.
Rub testing of abradables
Early work by Borel et al. 3 looked to replicate engine conditions with an Oxy-acetylene torch to heat blades up to 1100°C. This rig has been used extensively by Borel et al. 3 and Bounazef et al. 4 to test a range of abradables at varying conditions. The blades and abradable samples were analysed before and after testing allowing for the different wear mechanics to be identified and linked to different test conditions. This knowledge was vital when evaluating which abradables should be used in different parts of the engine but was not able to provide sufficient information to understand what causes the different wear mechanics observed.
As research into abradables developed further, two parallel approaches emerged. The first is to attempt to replicate the engine conditions exactly, with rigs being developed by Padova et al. 5 and Nitschke et al. 6 which use engine representative blades and abradable sections and operate at near engine speeds. In the case of the test rig created for the NEWAC research project a full scale blisk and full coated casing was employed. 7 The outputs of these tests can be used to measure forces and vibrations imparted by the tip rubs onto the rest of the engine. However, the additional complexity in trying to mimic the real engine increases the challenge when trying to run multiple tests of varying conditions.
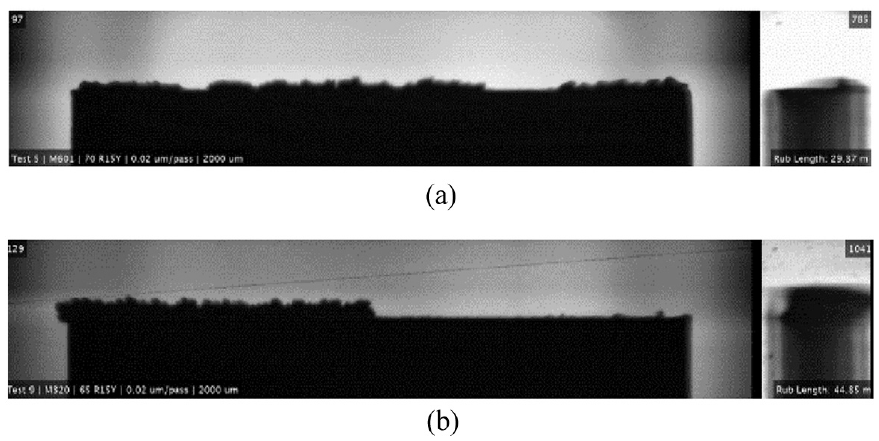
The second channel of research looks to remove complexity from the problem by moving away from exact engine replicas. Using simplified blade geometries and flat abradable samples rigs such as those developed by Taylor et al. 8 and Xue et al. 9 allow for rapid testing of different abradables at varying test conditions. Although force data extracted from these tests cannot be directly applied to an engine, the results from these tests allow for more data to be extracted on how different abradables behave under different conditions. An example of this is shown in Figure 3 where the incursion rate is shown to have a significant impact on the wear mechanics observed with Metco 320.
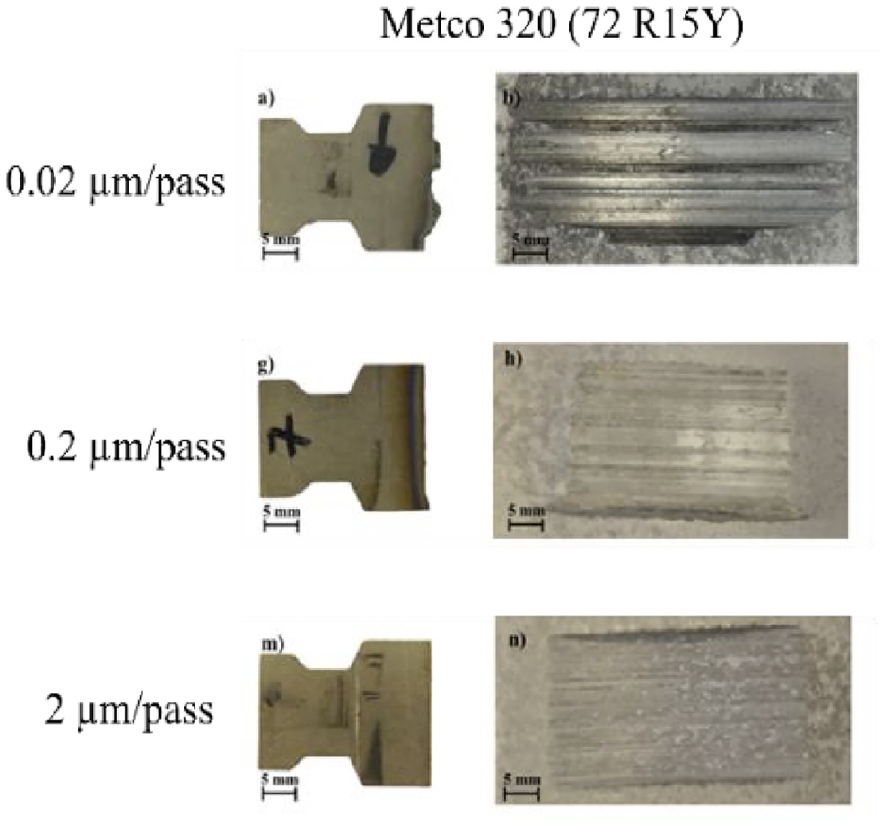
Cutting variability. 10
The understanding of how test conditions effect wear mechanics was developed further through the introduction of in-situ measurement techniques. An example of this is shown in the work by Fois et al. 11 where stroboscopic imaging was used to capture a side on view of the blade. Using this tool, measurements of the blade length could be taken throughout the test. This provides sufficient information to map how abradable performance varies with test conditions, information which can be applied directly by engine manufacturers when running in their engines. 11
During engine operation blade vibrations can lead to further rubbing between the blades and the abradable, this behaviour can be tested using rigs such as that created by Mandard et al. 12 which make use of a stationary blade alongside a rotating abradable ring.
These methods have been vital in identifying how different conditions affect cutting performance, and which operating regions lead to unacceptable outputs. However, in an engine these regions cannot always be avoided and there is not yet a sufficiently robust understanding of why these behaviours occur to develop ways to avoid wear in unfavourable conditions.
Previously there has been a large volume of research looking into how In-situ measurement techniques can be applied to abradable research, such as the addition of cameras recording the front of the blade 13 and dynamometers recording rub forces. 14 These developments have shown how gathering data throughout the rub makes it possible to better understand how adhesions form, and how wear mechanics are dependent on events which have occurred previously. This was seen in the work completed by Rahimov et al. 13 which showed how an adhesion was more likely to form at a location from which an adhesion had previously broken off. This new insight, alongside force measurement techniques, has provided a strong foundation to develop theories on why adhesions form. Further to this, in-situ thermal measurements tools employed by Agrapart et al. 15 have shown the importance of thermal management during a rub due to the large heat flux into the abradable. This work has been built on by Nyssen and Batailly 16 showing the benefits of including thermal behaviours in mechanical models of blade rubs during vibration events.
Although thermal behaviour has been shown to be important, there is a gap in understanding of the thermal behaviour with respect to adhesion and wear mechanisms. Attempts to model the thermal behaviour of Metco 601 by Watson and Marshall 17 resulted in poor correlations. It was theorised that this was to be due to nonlinearities and missed effects within the system, properties that the tools developed in this study have the potential to observe.
Method
This work looks to incorporate in-situ measurement techniques to the 200 m/s spindle test rig developed by Stringer and Marshall 18 (Figure 4).
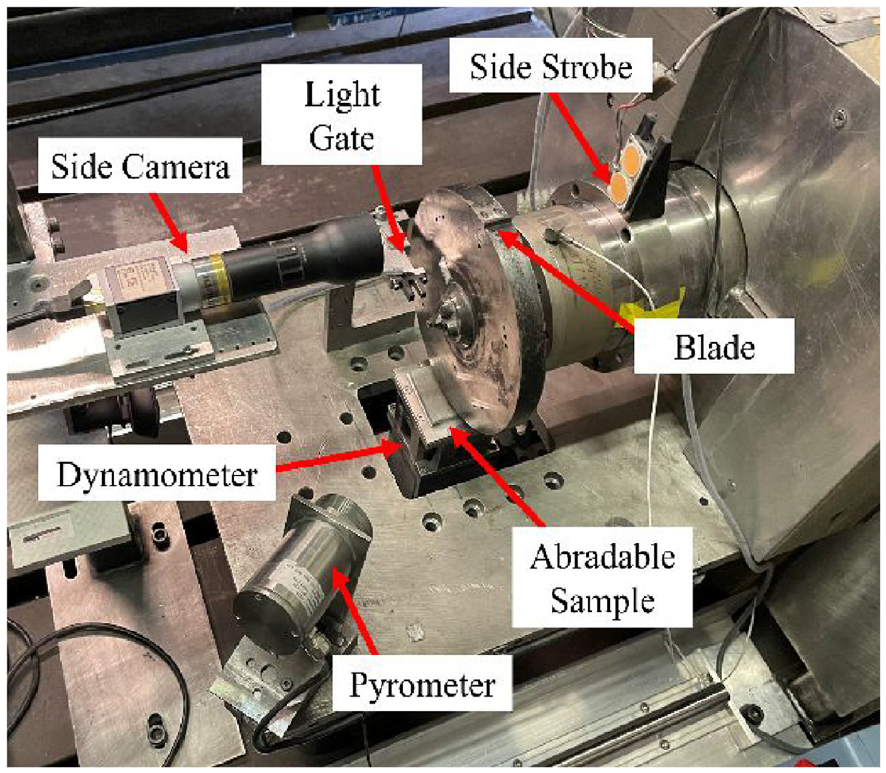
Low speed test rig.
Tests on this rig make use of a simplified blade and abradable geometry as shown in Figure 5. The test blade is clamped into a disc which has a dummy blade positioned 180° from the test blade to provide balance during rotation (Figure 6). This disc is then mounted to a spindle motor and rotated. In turn, the Abradable Sample is sprayed onto a steel plate, which is mounted on top of a motorised stage positioned below the disc.
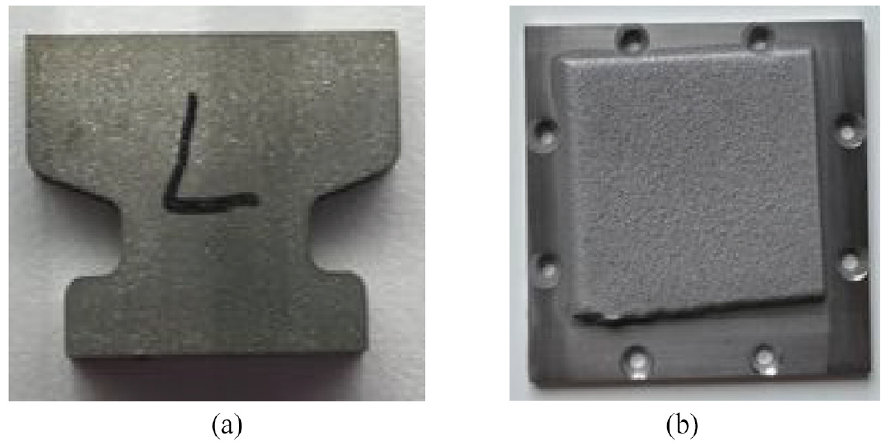
Test blade and abradable: (a) test blade and (b) abradable sample.
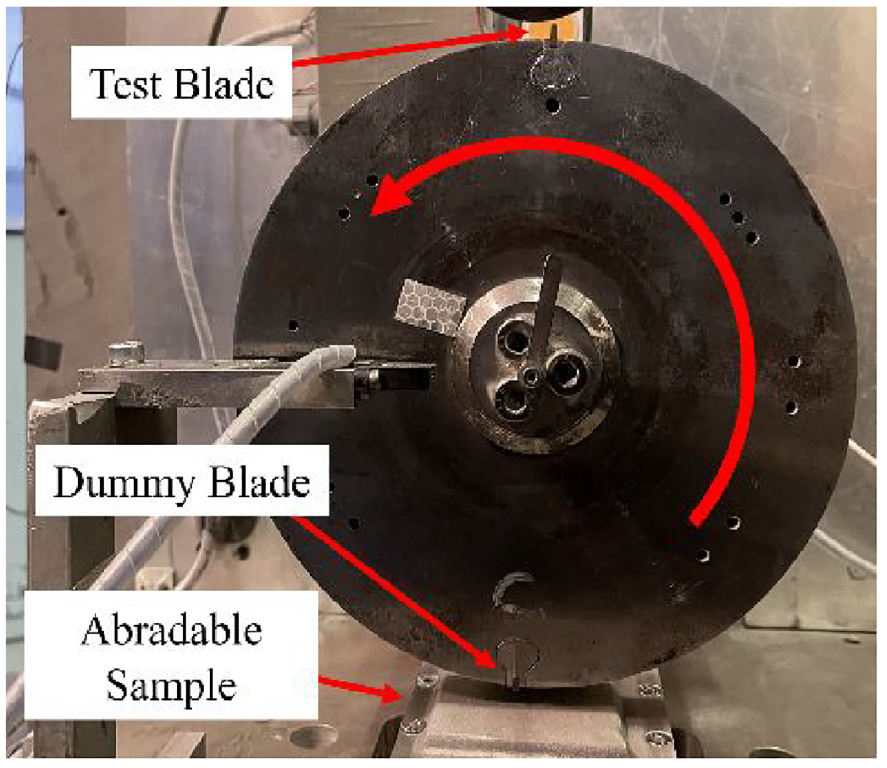
Test operation.
During the test the speed of the disc can set at any velocity up to a tip speed of 200 m/s. When the disc has reached a steady speed, the abradable sample will be pushed upwards by the stage at incursion rates as low as 0.02 µm for each pass of the blade (µm/pass). The stage will then continue to move upwards until a predefined incursion depth has been reached.
During a test data can be collected using tools such as a camera to record the side of the blade, a dynamometer to measure forces, as well as high speed and thermal cameras. This work aims to build on the existing capabilities of the rig to allow for the measurement of thermal and visible data simultaneously. This paper details how these tools have been installed and how they could be used to better understand the fundamentals of abradable wear mechanics.
Front camera
A camera has been installed into the rig which can record the front of the blade during the test. This setup is based off of the stroboscopic techniques developed by Rahimov et al. 13 Due to the spatial constraints of the spindle test rig – and lessons learnt by Rahimov – some changes have been implemented.
Due to the limited space within the rig a fixed focal length lens (Edmund Optics #59-870) and a small sensor camera (Allied Vision Alvium 1800 U-500c) have been used. This combination results in a narrow field of view, allowing the blade to fill the full field of view while minimising the margin of error between features measured at the leading edge of the blade compared with those at the trailing edge. 19
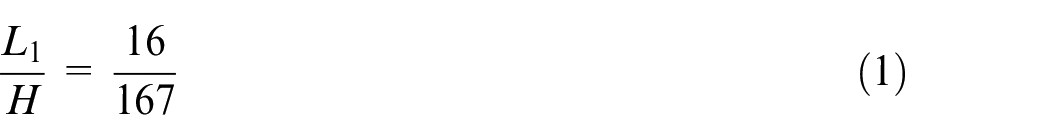
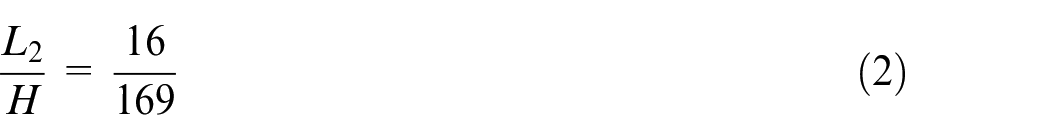
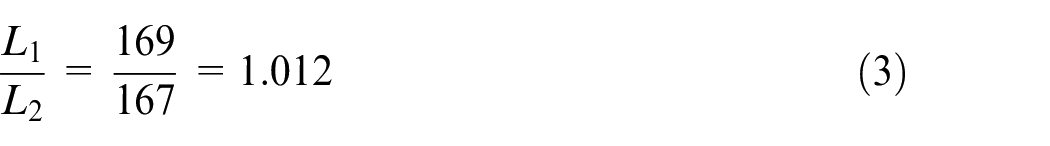
Figure 7 shows how a feature of the same size (H) appears larger to the camera sensor if it is positioned at the leading edge of the blade (L1) compared to if it were positioned at the trailing edge (L2). The size of the feature on the camera sensor is a ratio of the lens focal length and the distance of the object from the focal point, the ratios for this setup are given in equations (1) and (2). For this test setup measurements of adhesion heights will have an error of up to 1.2% depending on their position on the blade (equation (3)).
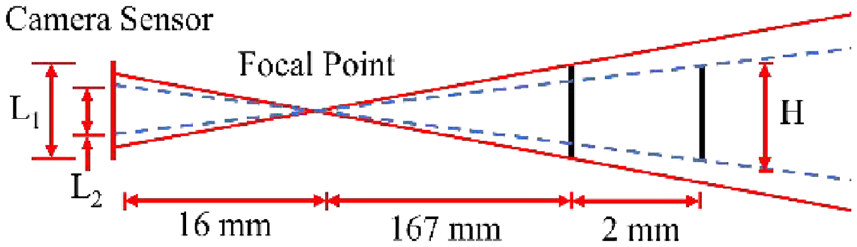
Camera field of view.
The stroboscopic set up by Rahimov et al. 13 made use of two separate LEDs to illuminate the blade. This resulted in a distinct lighting gradient with bright spots at the centre of each diode (Figure 8), this had to be corrected in post processing. To improve upon this for this application a light diffuser has been fitted in-front of the LEDs, smoothing the light gradient.
High speed rig front blade image. 13
The camera is triggered by the light gate installed by Fois et al. 11 for the side camera. This light gate has been shown to have a very repeatable response time and is unaffected by dust produced during a test. 18 This minimises the variation in blade position between images. Figure 9 shows the aligned front and side outputs for 0.02 µm/pass tests for two different abradable materials.
Front and side camera output: (a) Metco 601 and (b) Metco 320.
Thermal camera
Recording abradable hot spots
The FLIR A6750sc Thermal Camera was selected for this use case for its high frame rate, allowing for images to be captured for every pass of the blade. Due to the large form factor of this camera, it has been setup outside of the protective enclosure, observing the abradable through a window of Zinc Sulphide as shown in Figure 10. A lens extender (FLIR PN: 222-0006-05 REV-A) has been added to minimise the working distance.
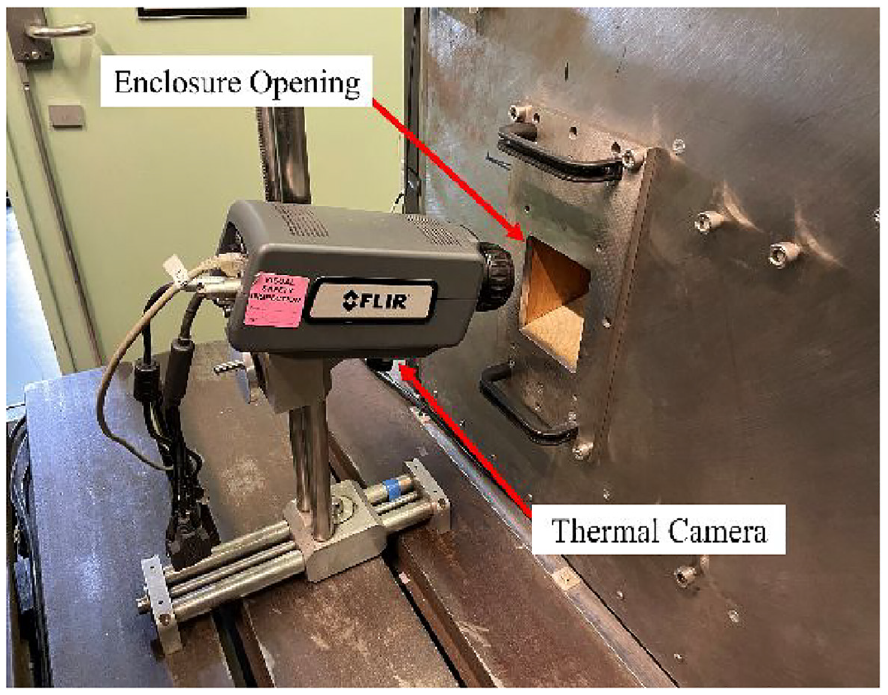
Thermal camera setup.
This setup results in a shallow camera angle which can view the abradable under the rotating disc. Whilst practical as a test set up this arrangement brings issues as the blade does block the view of the abradable once per revolution, and the abradable surface cools rapidly after each strike. As such, for the most consistent results each image must be taken when the blade is not obstructing the camera view, the same time delay after the rub event.
To synchronise the frame rate of the camera and the rotational speed of the spindle the output of the light gate used for the strobes is connected to the SYNC IN pin of the cameras AUX Connector (Pin 10). A delay between triggering and capturing a frame is then set within the ReaserchIR software package provided by FLIR, this allows the captured images to be set to a point where the blade is out of view of the camera.
Due to the shallow angle of the camera the raw image is compressed, making it challenging to distinguish individual hot spots. Figure 11 shows the raw output of the thermal camera while recording the abradable during a rub. The red areas show the presence of surface hotspots on the rub surface. To improve the clarity of the output homography methods have been applied to warp the output so that it appears that the footage was taken normal to the surface.
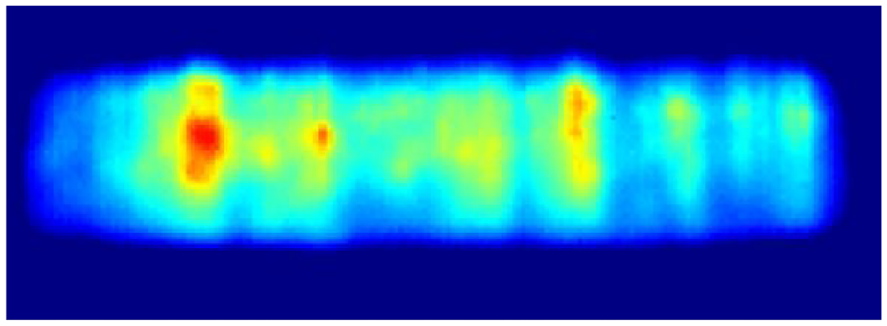
Thermal camera raw output.
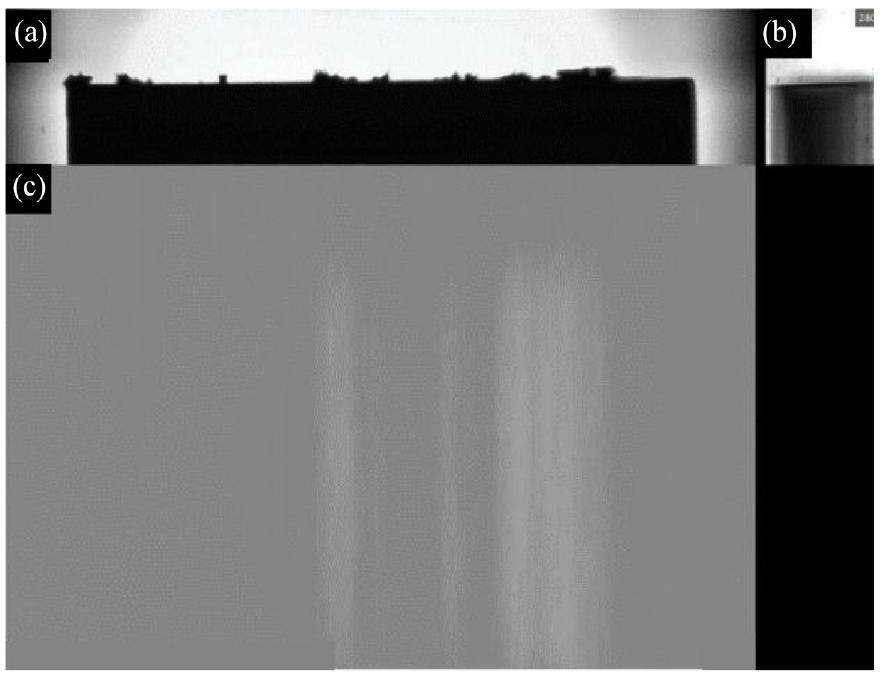
To create the required warp matrix a PCB with a gold surface layer was used with a pattern of nine holes drilled through the board, the gold surface was able to reflect the heat emitted from a flood light producing a clear image for the thermal camera (Figure 12). The holes were all separated by 7.5 mm and were aligned parallel to the direction of travel of the blade with the central hole aligned with the centre of the rub path.
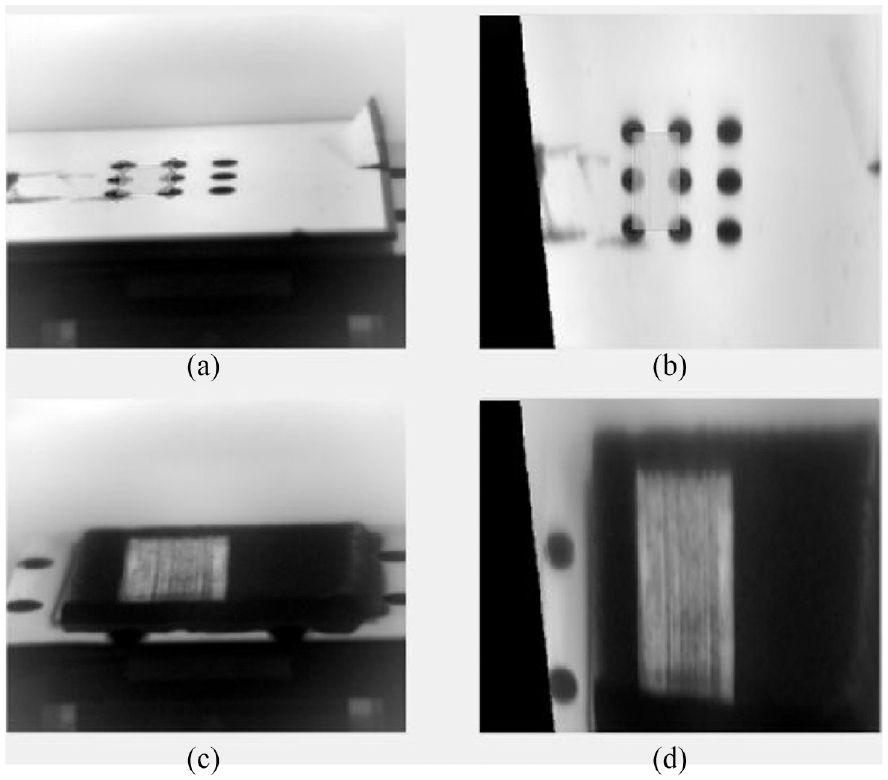
(a) Raw output of template with holes detected, (b) warped template image, (c) raw output of abradable and (d) warped abradable image.
Using MATLAB, the hole positions are detected using the detectMSERFeatures function. A projective transformation matrix is then created using the fitgeotrans function. This matrix can then be applied to any image taken with the same position relative to the camera using the imwarp function, outputting an image which appears to have been taken from directly above the abradable.
The required warp matrix will change for blades and abradables of different lengths and thicknesses. To generate the required warp matrix for a given test arrangement a video is taken of the stage moving with the template on top, and the matrix created at regular intervals as the stage moves. The elements of the 3 × 3 warp matrix vary linearly with stage position (Figure 13). Finally, knowing the gradient for each matrix element and the starting stage height for recording, it is possible in turn to extract a warp matrix for any stage height.
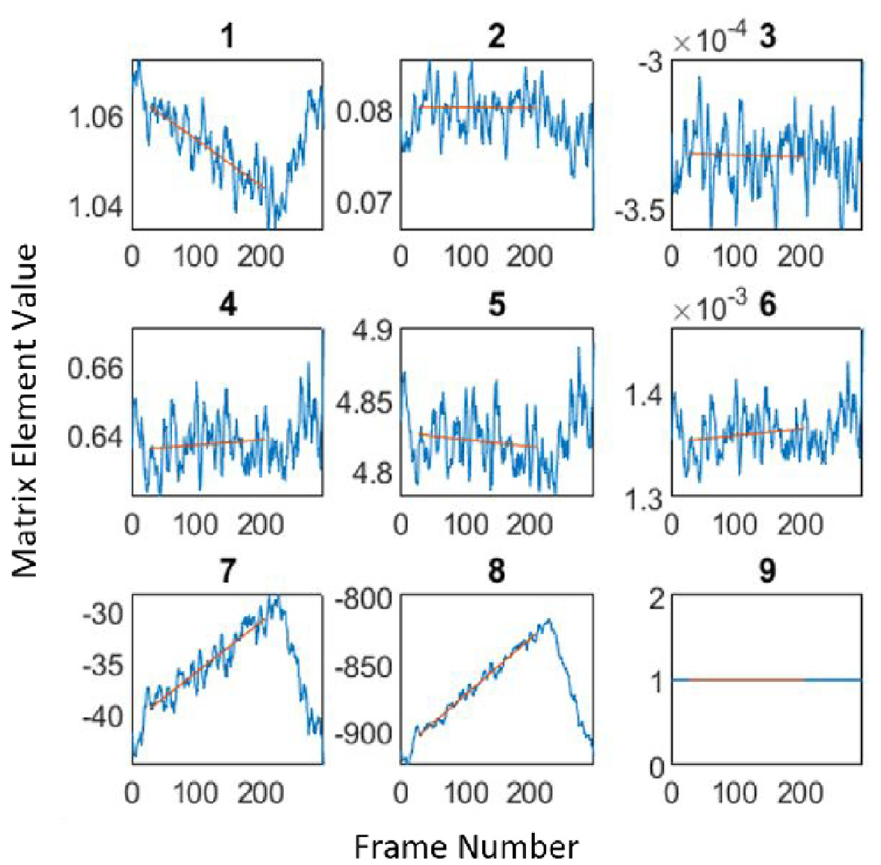
Warp matrix variation.
The output of the warped thermal image, alongside the front and side images, is shown in Figure 14.
(a) Front camera output, (b) side camera output and (c) warped abradable thermal.
Recording blade hot spots
To capture images of the blade and the abradable during the same rub a second light gate has been installed. This light gate is positioned 6 mm closer to the axis of the disc and can therefore be triggered by a shorter trigger arm (Figure 15). By using the offset light gate as a trigger for the thermal camera images can be taken twice per revolution, once when the blade is visible, and once when the abradable is unobstructed.
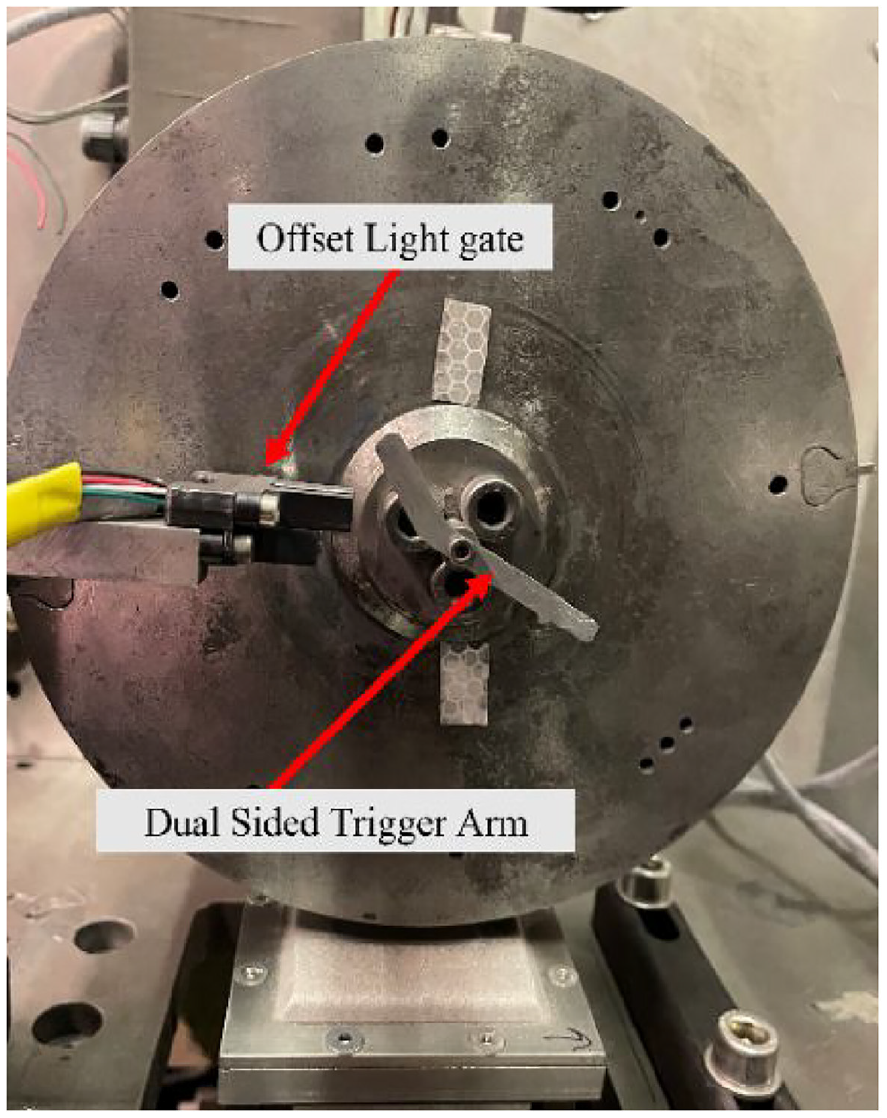
Dual trigger setup.
For tests with tip speeds less than 100 m/s the thermal camera can capture two frames for each revolution. At higher speeds the maximum frame rate of 400 Hz makes it impossible to capture both blade and abradable within the same revolution. Increasing the delay between sync input and image capture by one rotational period reduces the rate of image capture to two images per three revolutions. This allows the tool to be used up to the maximum speed of the spindle test rig (200 m/s).
To avoid the dummy blade from obstructing the abradable images the two trigger arms are separated by ≈160°. Due to the asymmetric positioning of the two trigger arms the time between frame captures differs for a blade image and an abradable image. The blade and abradable frames are therefore separated depending on the frame rate. At 200 m/s blade images will have a frame rate of 230 Hz while abradable images have a rate of 210 Hz.
With the images captured and separated into two separate videos, they are lined up with each other and played alongside the front and side footage as shown in Figure 16.
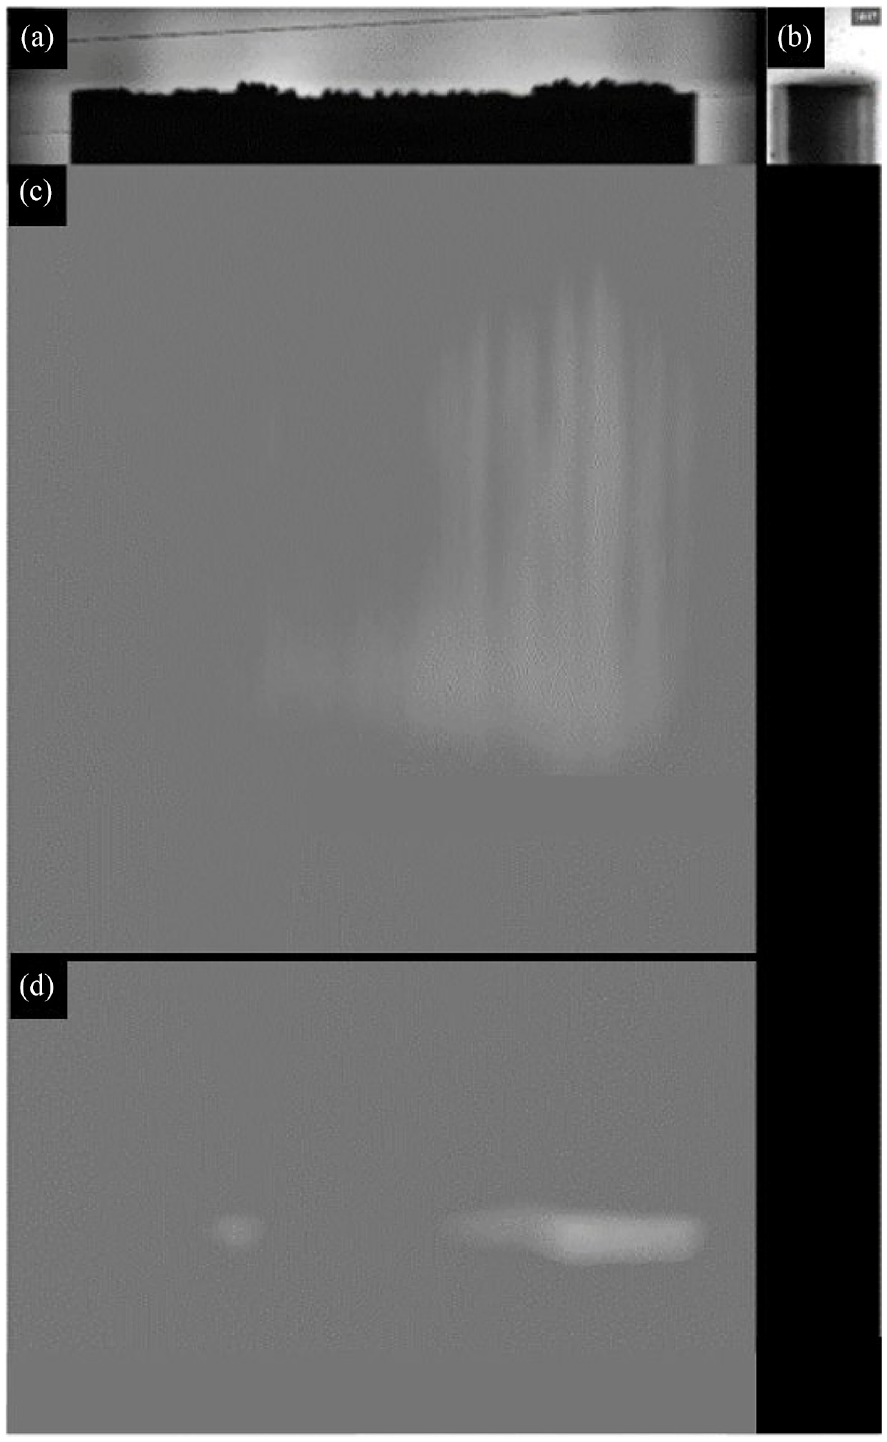
(a) Front camera output, (b) side camera output, (c) warped abradable thermal and (d) blade thermal.
For these results the apparent temperatures of the blade and abradable have been extracted from the ResearchIR software package using the default emissivity of 0.92. This is sufficient to identify hot spots, but the error in any calculated temperature is a function of material and camera properties. 20
With these limitations the results from this rig can only be compared to other results made using this rig as the errors will be consistent. At this stage this is sufficient to answer the question of how wear mechanisms link to hot spots and provides a level of insight which has not previously been possible. If work using these tools shows that accurate temperature readings would be beneficial measurements of how the emissivity of the abradable varies throughout the test would be required. This could be achieved by heating abradable samples which have been tested to varying incursion depths to known temperatures. By recording these samples with the thermal camera, it will be possible to extract information on how emissivity varies with temperature and incident angle for each abradable material.
Temporal alignment
All cameras are triggered by the LabView code developed to control the spindle test rig, the footage from the two visible cameras is collected by LabView, the alignment of these videos is confirmed by observing events such as adhesions breaking off on both video feeds. The thermal camera is triggered through LabView using the cameras AUX Connector (Pin 8), the video is then recorded using the FLIR ResearchIR software. This results in a delay between the thermal and visible cameras.
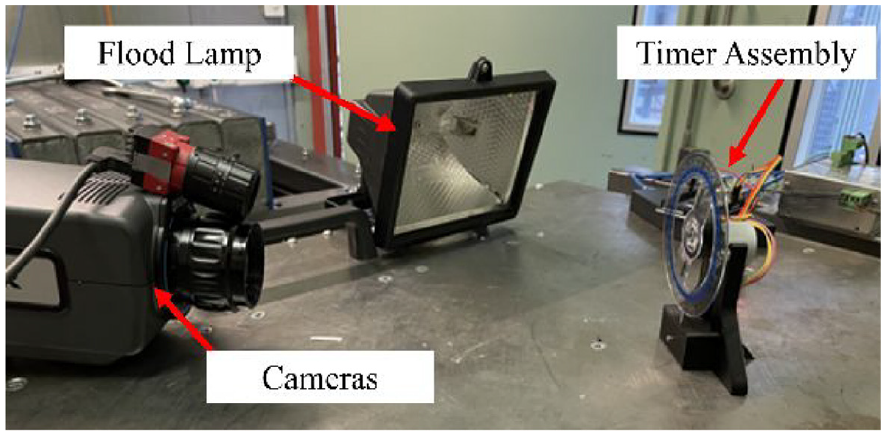
To align the cameras a separate test has been completed to measure the delay between them. This took the form of a protractor being rotated at a fixed angular velocity by a stepper motor with a needle pointing radially inwards at the protractor markings (Figure 17).
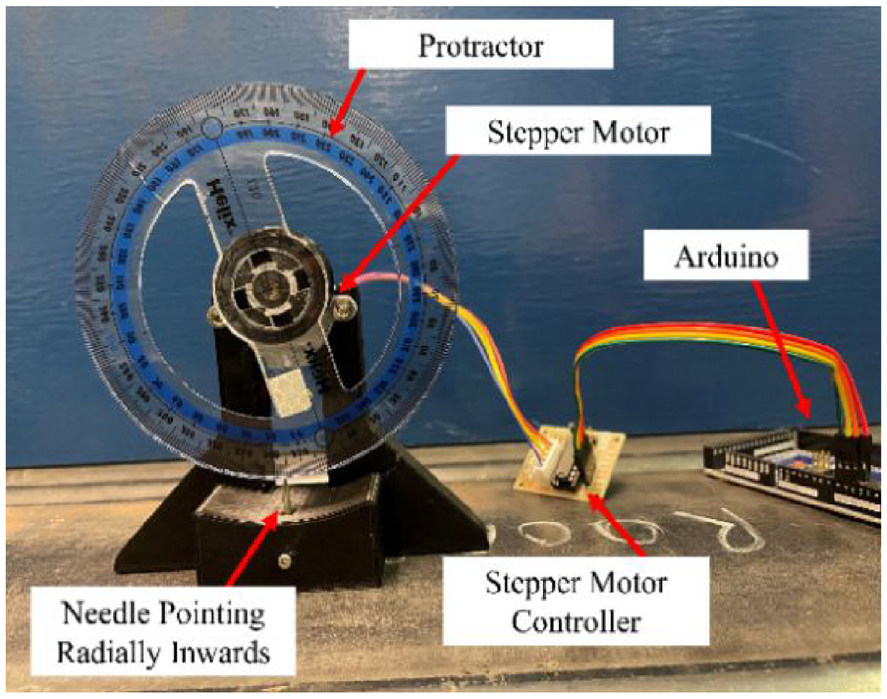
Delay measurement tool.
The front camera and thermal camera were both triggered to record the protractor, with the difference in angle recorded by both cameras used to measure the time delay (Figure 18).
Camera alignment testing.
As shown in Figure 19(b), the black markings reflect more energy than the clear acrylic and therefore appear hotter (brighter in colour) in the thermal camera output. This allows the numbers and markings to be clearly seen.
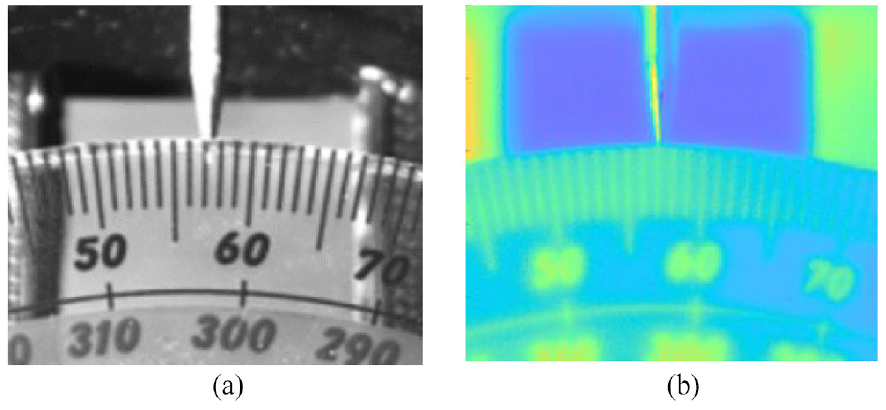
Output images of the delay timer: (a) visible image and (b) thermal image.
To reduce parallax error the lenses of the two cameras were positioned on a plane passing parallel to the pin and normal to the protractor (Figure 20). The camera positions were fine-tuned until the angles measured by both cameras were within 1°.
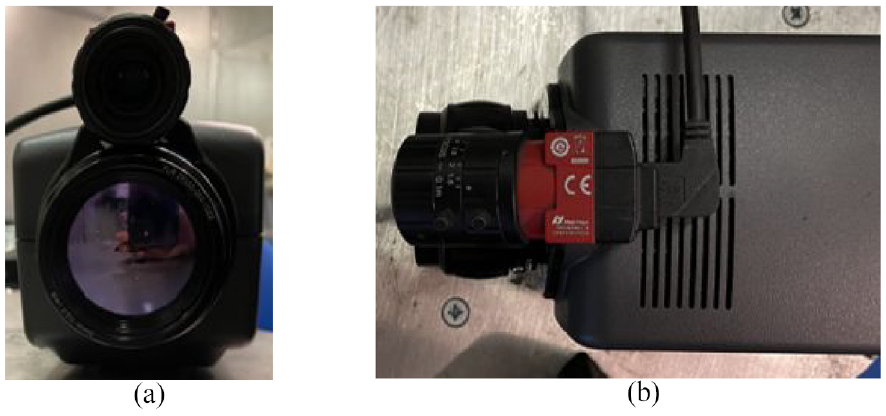
Camera position: (a) front view and (b) top view.
To convert the measured degree difference into time delay the rotation period of the compass was measured. The period was measured 42 times using a laser tachometer (Figure 21). All measurements were between 4.09 and 4.11 s, with this period 1° is traversed in 0.0114 s.
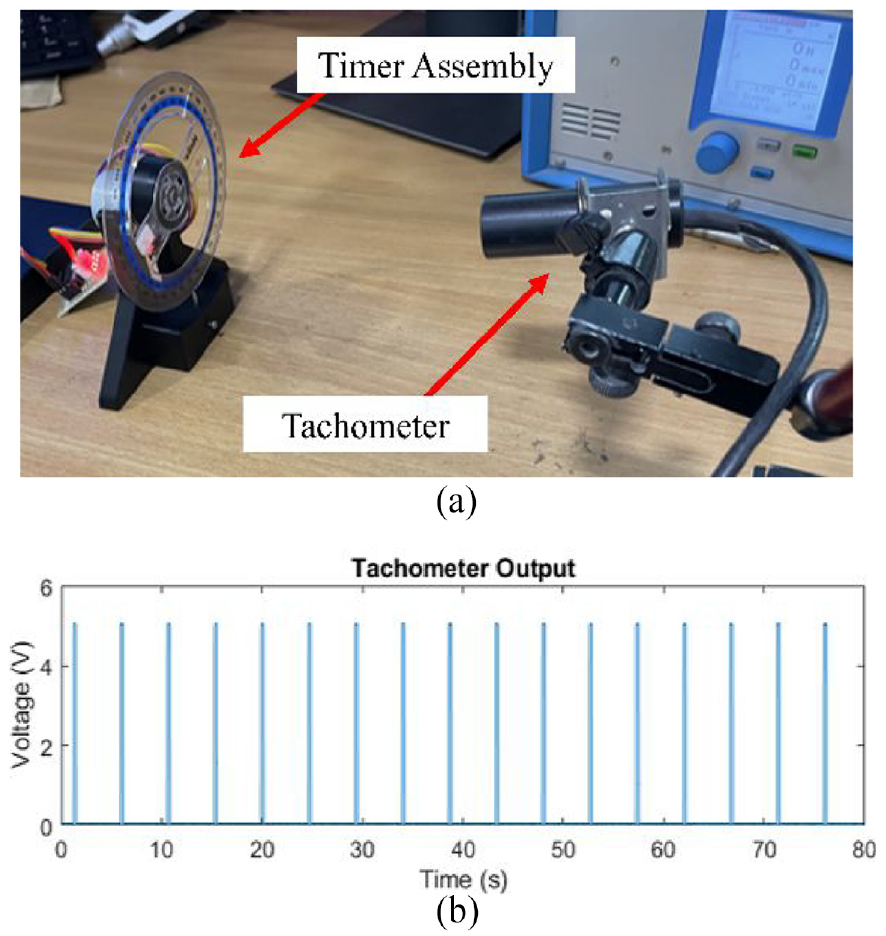
Rotational period measurements: (a) test setup and (b) tachometer output.
The delay between the visible and thermal cameras is primarily a function of the frame rates of the two cameras. For this investigation the frame rate of the visible camera was limited to 60 Hz, and the thermal camera was set to 220 Hz. These frame rates were selected to mimic those for a 200 m/s test with both blade and abradable thermal capture. A total of 35 datapoints were collected.
These results fell within a normal distribution with an average delay of 0.252 s between the two cameras, with the visible camera triggering before the thermal, and a standard deviation of 0.036 s.
Thermal and visible footage can therefore be aligned by adding a 0.252 s delay to the thermal video, at which point the alignment will be correct to within ±0.1 s with a confidence interval of 99.5%.
Tool validation
To validate the new tools described in this paper a set of rub tests have been completed. These tests have been completed using an AlSi - Polyester Abradable (Metco 601) at a hardness of 65.8 R15Y, the incursions have been completed with Titanium blades (An example of a blade and abradable sample is shown in Figure 5). These materials have been selected as the results should align with research completed by Rahimov et al. 13
Tests have been completed at incursion rates of 2, 0.2 and 0.02 µm/pass, with three repeats of each condition. The tests were all run with a blade speed of 200 m/s. These tests should therefore make it possible to observe a range of behaviours, while repeats allow for the evaluation of repeatability of the tools.
Results
All M601 tests exhibited the behaviours expected from previous research by Rahimov et al., 13 with a transition from mostly thermal blade wear at 0.02 µm/pass to mostly adhesion at 2 µm/pass (Figure 22).
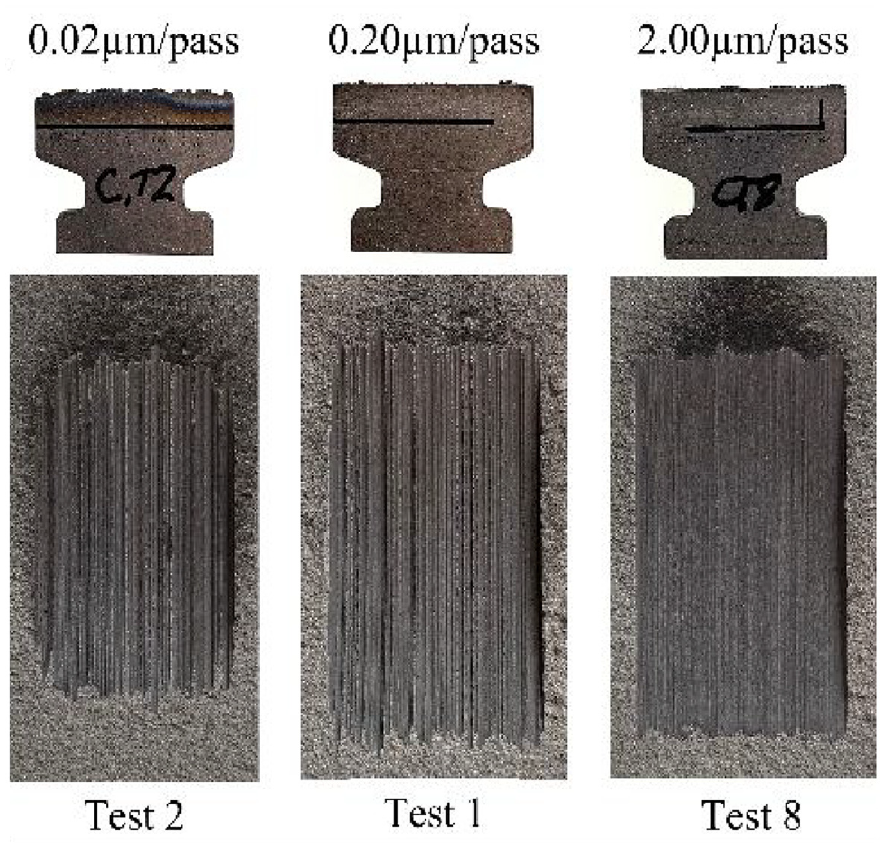
Cutting variability.
The transition from thermal blade wear to adhesion is echoed in the recorded thermal camera data, with a reduction in the maximum blade and abradable temperatures as incursion rates increase (Figure 23).
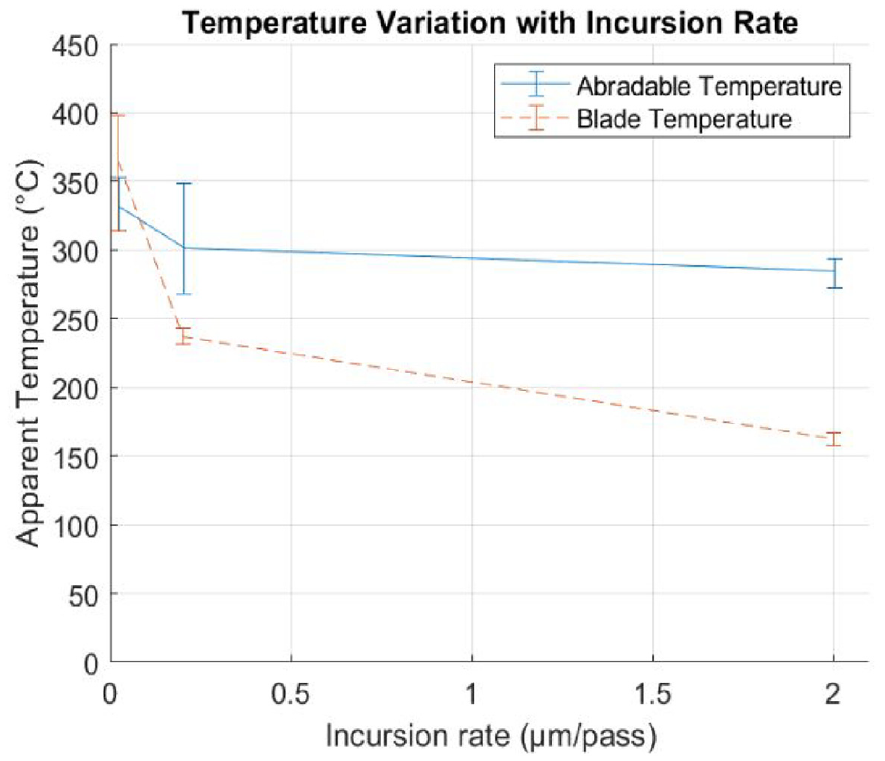
Maximum blade and abradable temperatures.
These results also demonstrate the repeatability of these tools with a maximum range between repeats of ±13%.
The data from each test has been analysed through the use of rub maps using the approach developed by Rahimov et al. 13 Each rub map presents how one of the measured attributes varies with rub length, where rub length is the cumulative distance that the blade has rubbed along the abradable surface during a test.
Figure 24 shows the rub maps for a 0.2 µm/pass rub. Figure 24(a) and (d) show the blade height from the front and side respectively. Figure 24(b) and (c) show the blade and abradable thermal respectively. These conditions produced the largest quantity of blade adhesion/fracture events, with minimal blade melting. As adhesions form on the blade hot spots can be observed on the blade and the abradable, the time and location of these hotspots align with the adhesions positionally and temporally. This can be seen clearly with the set of three adhesion events which have been highlighted in Figure 24. The side camera showed the adhesions forming at the trailing edge of the blade, this true at all tested incursion rates.
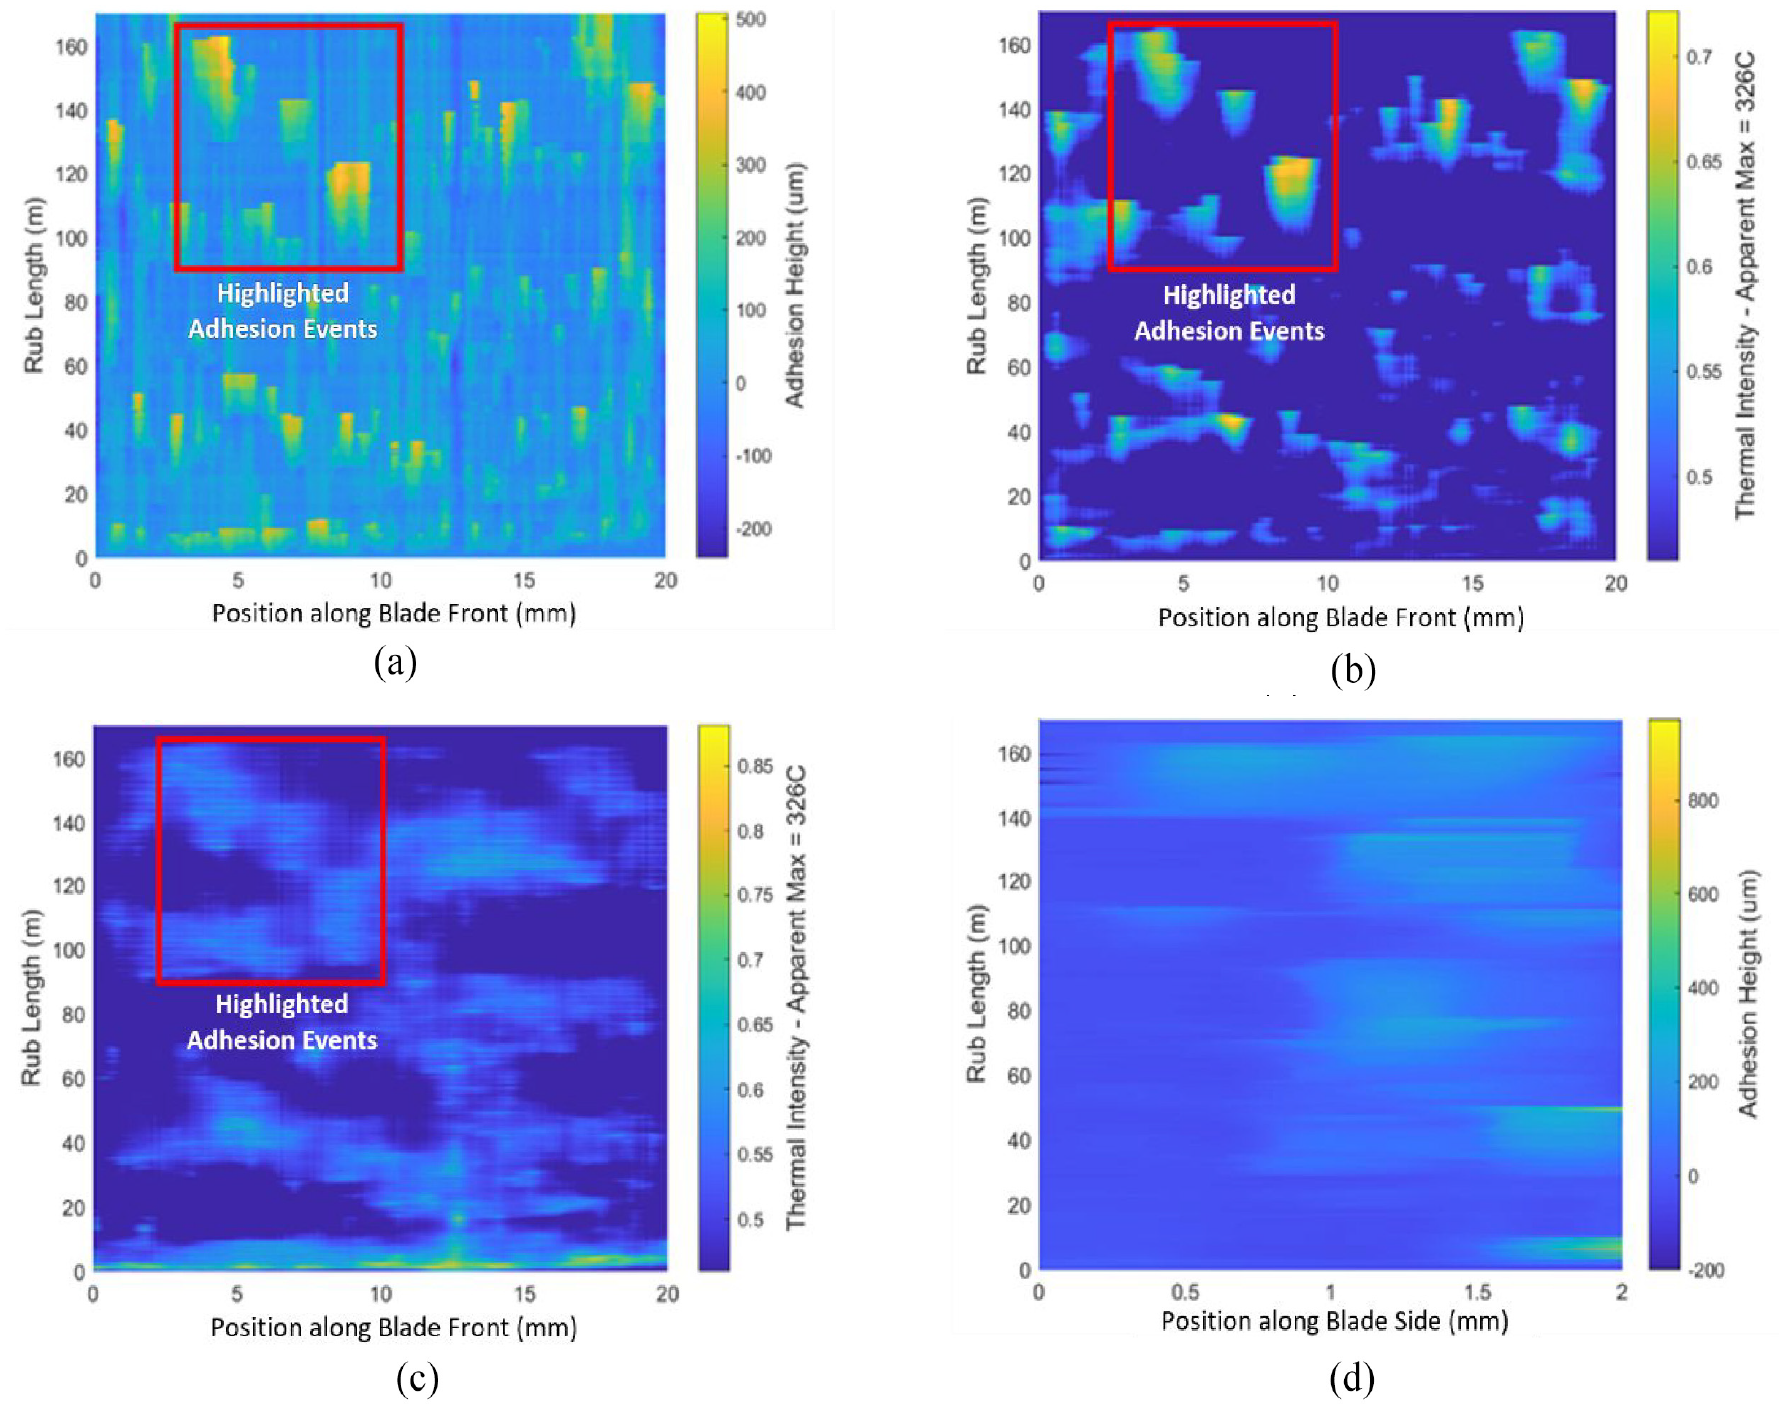
Rub maps for 0.2 µm/pass rub: (a) front view, (b) blade thermal, (c) abradable thermal and (d) side camera.
The force and adhesion behaviours measured during this study replicate the results produced by Watson and Marshall 17 and Rahimov et al., 13 the new outputs presented here are the thermal behaviours. At different incursion rates the thermal behaviour of the abradable varies significantly. At 2 µm/pass the maximum apparent temperatures observed were the lowest of all test conditions, these temperatures were however distributed more uniformly across the full width of the rub (Figure 25(a)). Unlike at 0.2 µm/pass the blade temperatures did not follow the abradable hotspots, the blade temperature instead stayed predominately below measurable levels (Figure 25(b)).
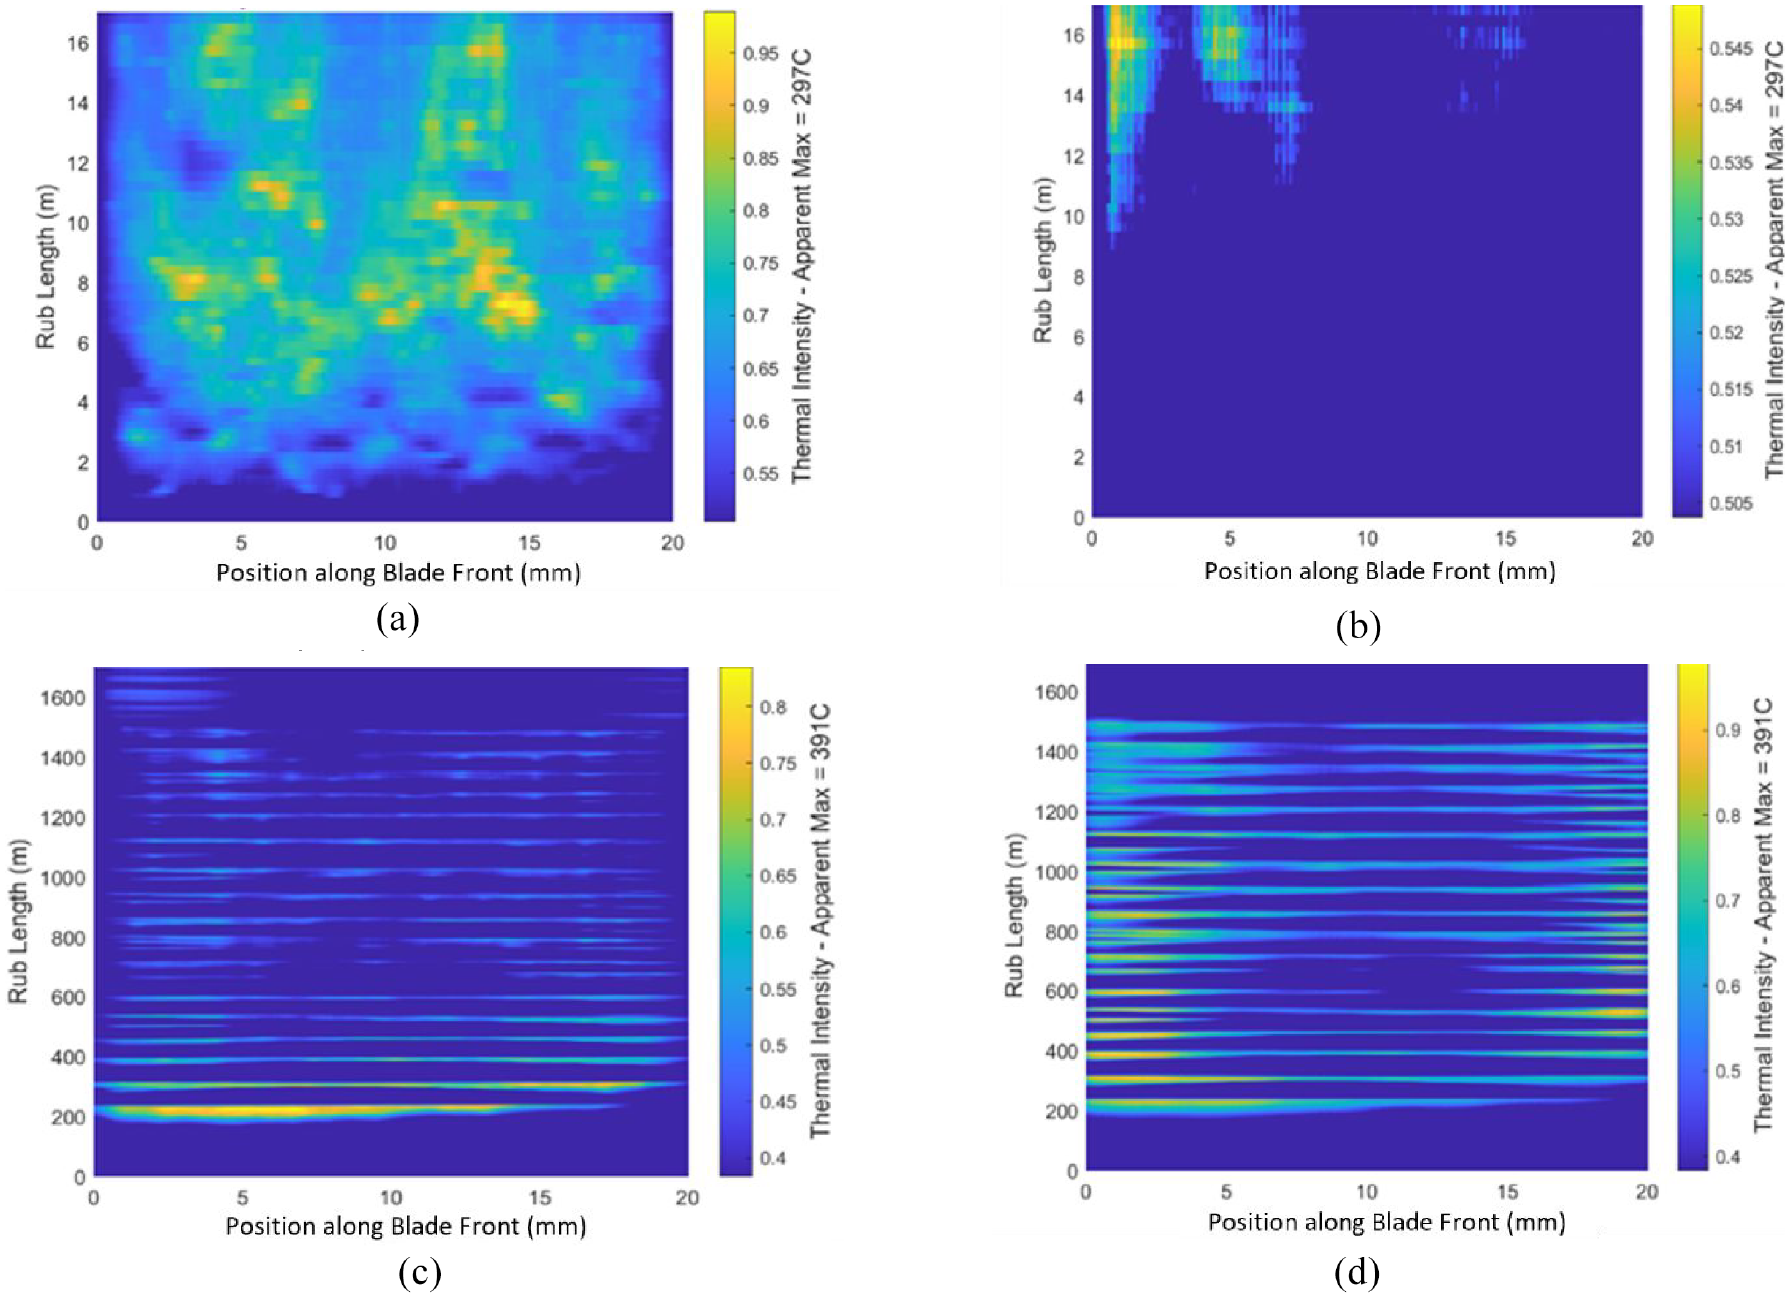
Thermal rub maps for 2 and 0.02 µm/pass: (a) 2 µm/pass abradable thermal, (b) 2 µm/pass blade thermal, (c) 0.02 µm/pass abradable thermal and (d) 0.02 µm/pass blade thermal.
At 0.02 µm/pass the highest apparent temperatures were recorded, these temperatures were seen to form across the full rub width for both the blade and the abradable (Figure 25(c)). Unique to this test condition was the cyclic thermal loading which occurred for the full duration of the rub.
The cycling temperatures aligned with the measured force data. Both normal and tangential forces show cyclic behaviour which aligns with the temperature pulses (Figure 26). With each pulse of temperature adhesion and melting events were observed forming across the entire width of the blade. The adhesions form in small chunks and were short lived, quickly breaking away from the blade.
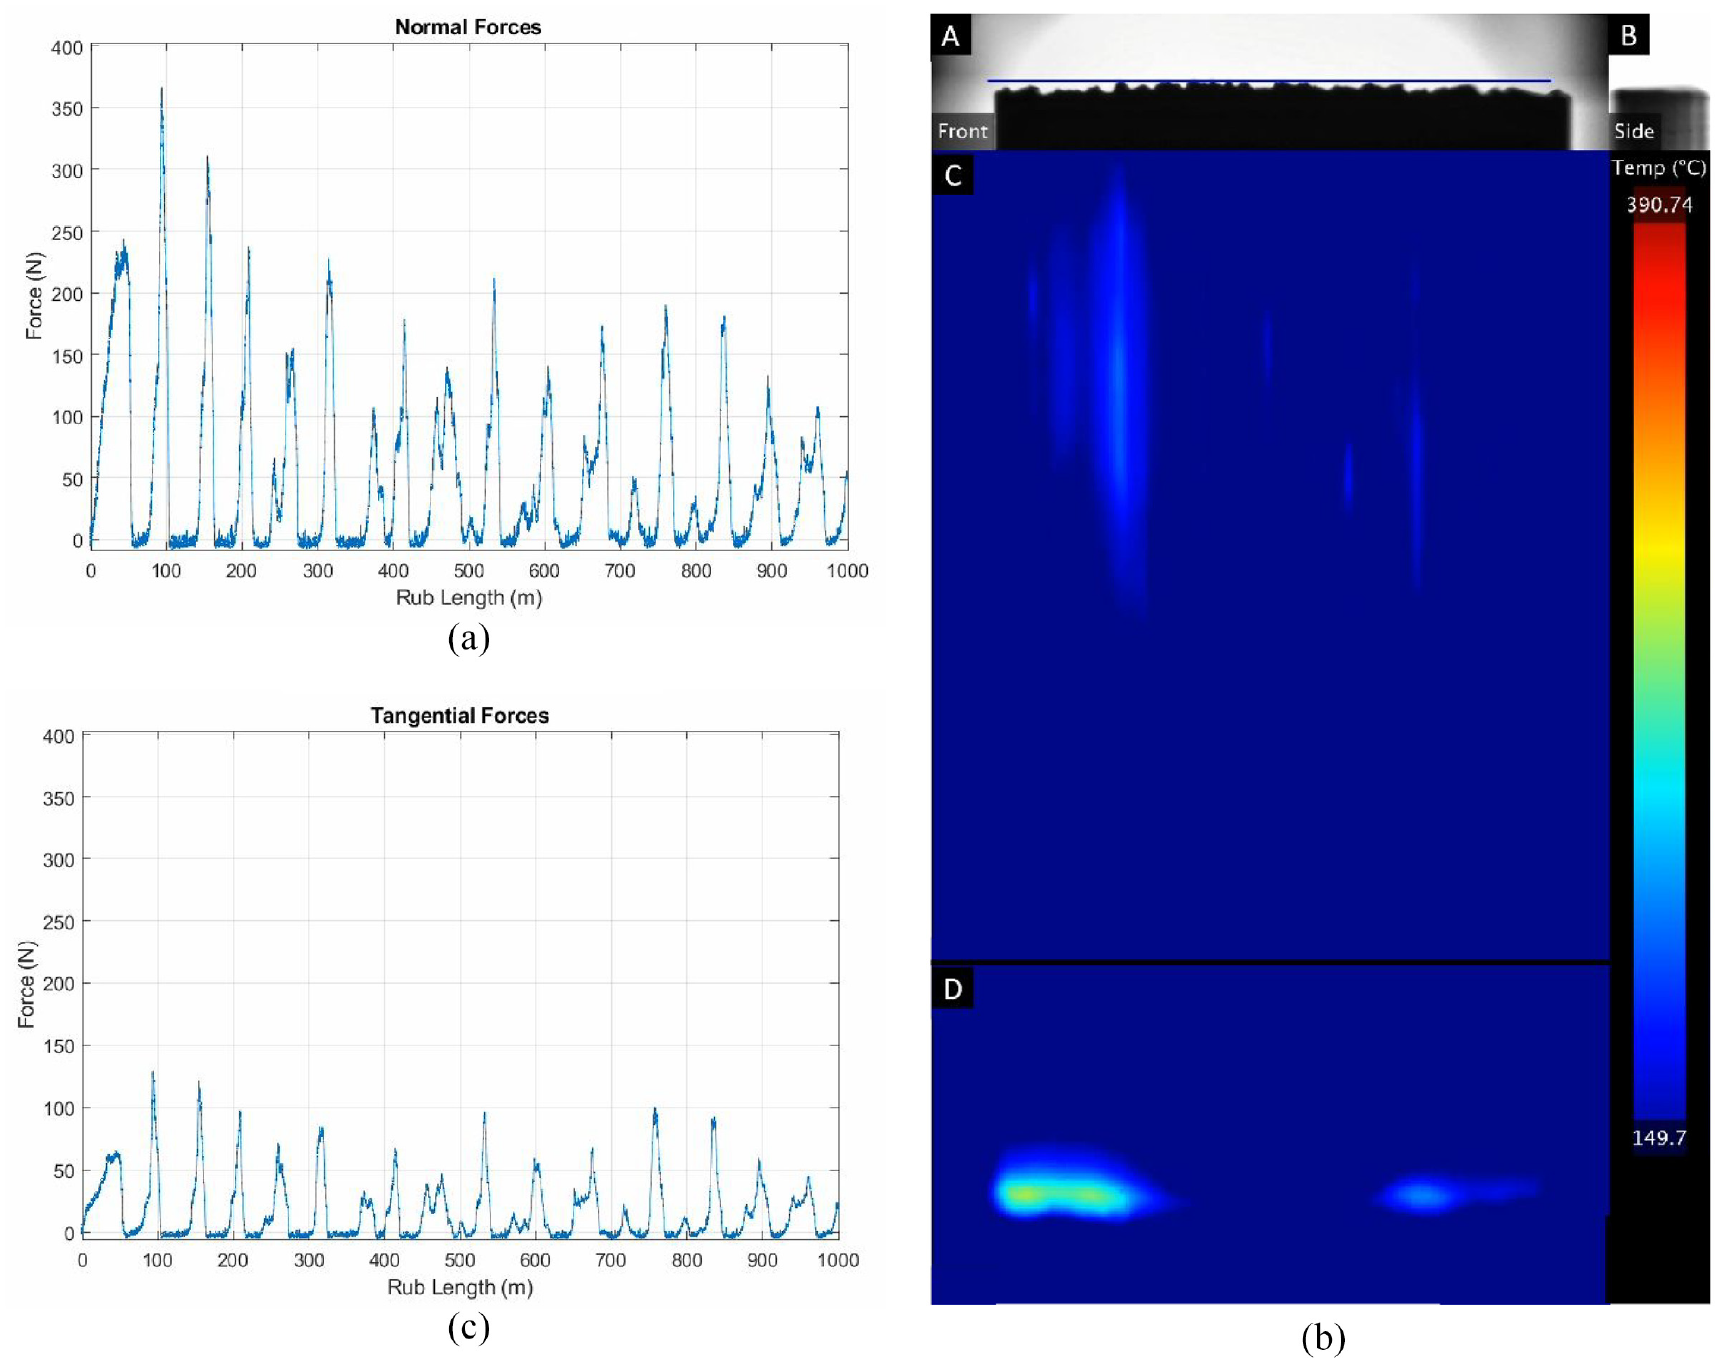
Force response for 0.02 µm/pass rub: (a) normal force, (b) camera output at 1000 m rub length. A – Front Camera Output. B – Side Camera Output. C – Warped Abradable Thermal. D – Blade Thermal and (c) tangential forces.
Discussion
The tools introduced in this paper are intended to provide a deeper insight into how thermal and visible behaviours relate to one another, the power of these tools is exemplified by the 0.2 µm/pass test results.
The aligned video shown in Figure 26 is an effective tool for visualising wear behaviour, making it clear to see when a blade is melting or when adhesions are forming. The created rub maps (Figure 24) abstract the problem and allow for easier extraction of time dependant patterns such as adhesions repeating at a single point.
To extract further information from these plots individual events can be identified and examined. For this test the event of an adhesion growing and breaking off has been selected (Figure 27). Focussing on this event in Figure 28 there is a clear event occurring both visibly and thermally, it can also be seen that not all events occur simultaneously. However, from this view the delays cannot be immediately resolved.
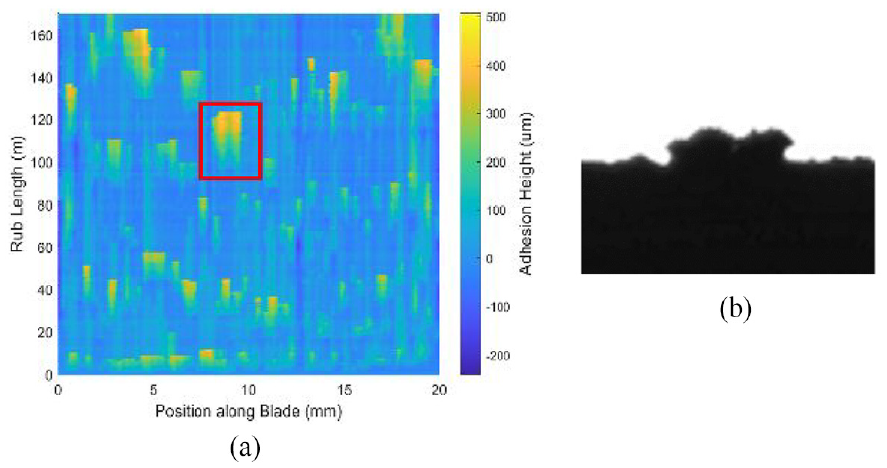
Isolated event: (a) Appearance on rub map and (b) physical appearance.
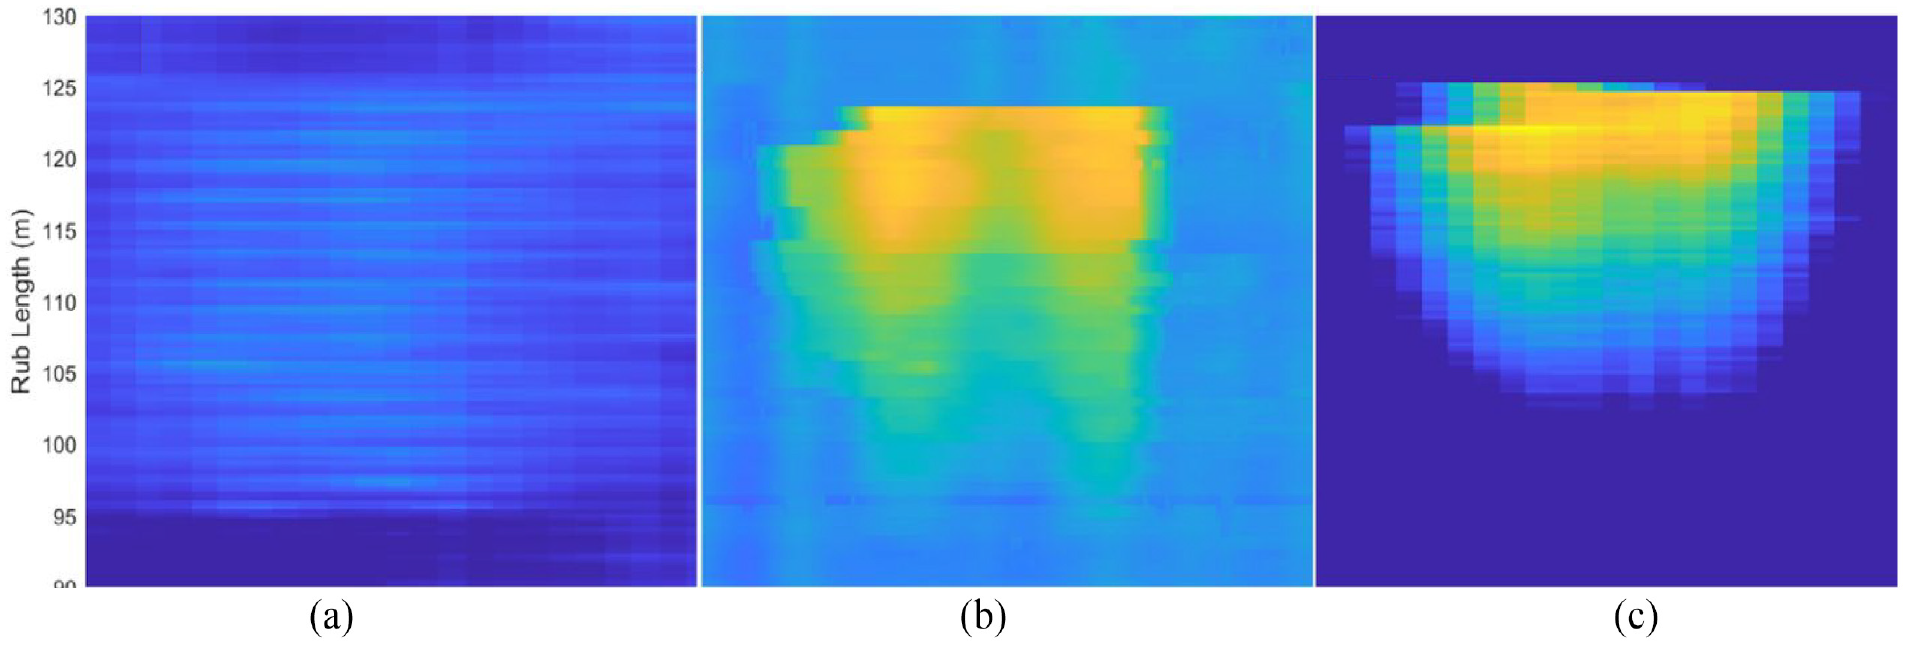
Zoomed view of event: (a) abradable hotspot, (b) adhesion formation and (c) blade hotspot.
However, by plotting the adhesion height, abradable and blade temperatures at a single position on the blade (Figure 29) on a single plot direct comparison of the different properties can be undertaken. From Figure 30 it can be seen that while blade temperature lags adhesion formation, abradable temperature consistently leads the adhesions. The adhesions also increase in size as the rub progresses. These results align with work completed by Rahimov et al. 13 which showed how adhesions appear more likely to form in a position where an adhesion previously broke away from.
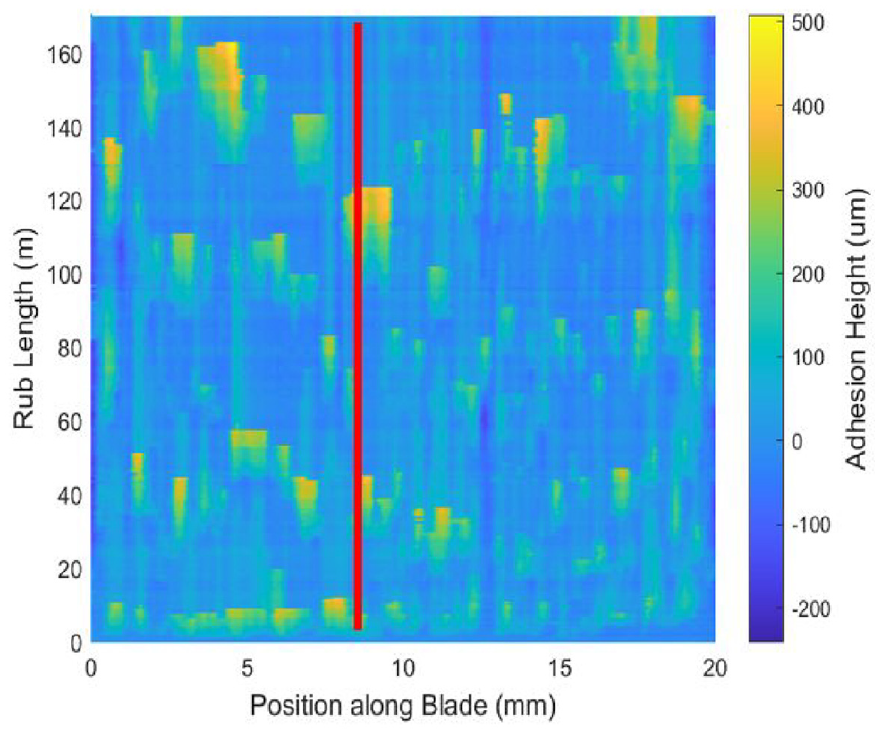
Line of extracted points.
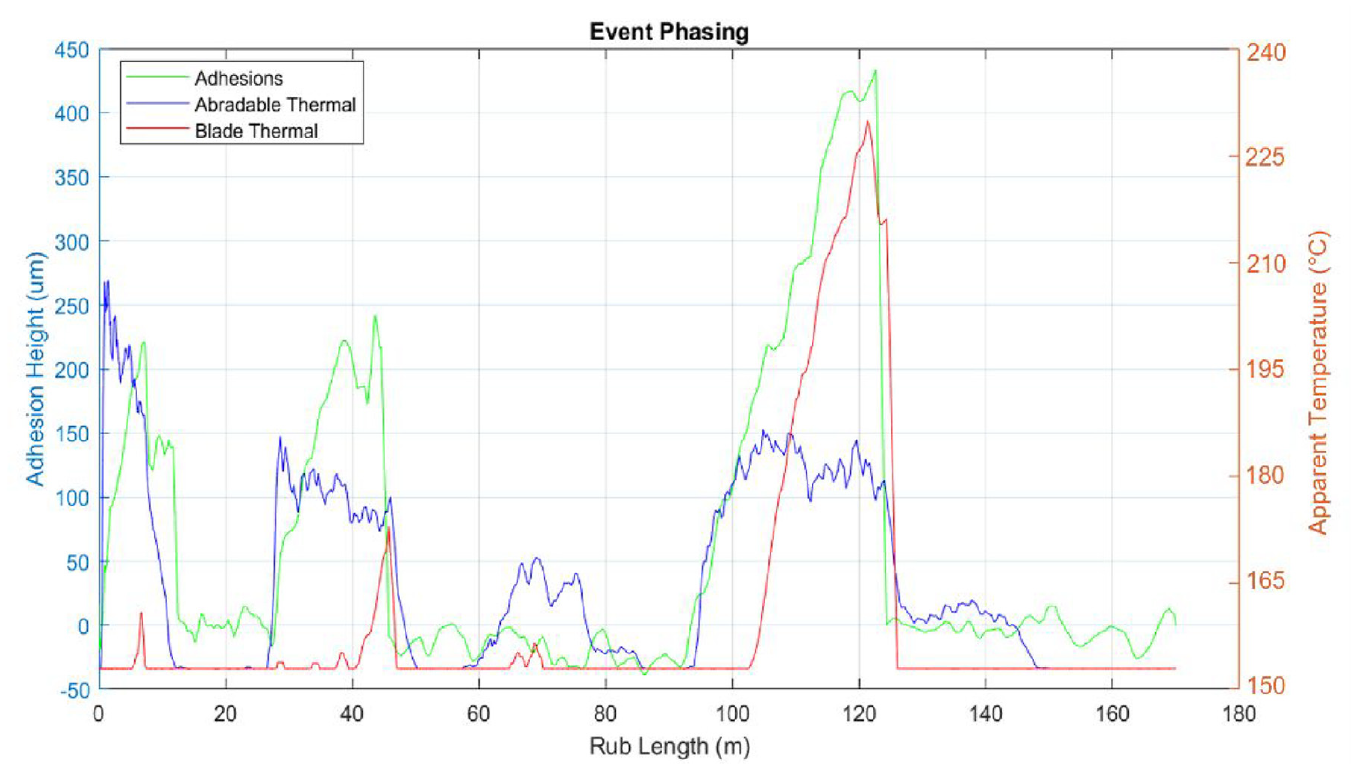
Time history along line shown in Figure 29.
With these tools being applied in tests of different materials at a range of incursion rates it may be possible to relate different wear mechanisms to different time phasing and magnitudes of the thermal and wear properties, this insight will help when trying to determine the root cause of the wear mechanics.
The increased visibility that these tools can provide during a rub will be useful when trying to devise novel theories on wear mechanisms, or when trying to understand the shortcomings of existing theories. For example, the models created by Watson and Marshall 17 struggled to predict the temperatures generated during a rub of Titanium blades on M601, where this was suggested to be due to nonlinearities within the system. With these new tools it is now possible to observe the nonlinear behaviour which may occur, such as the cycling temperature behaviour identified in this study.
With the ability to observe individual hotspots on both the blade and the abradable these tools have the potential to provide evidence for the theory that M320 wear events are linked to hotspots caused by subsurface concentrations of hBN as proposed by Fois et al. 10 The clumps of hBN, as shown in Figure 31, lead to localised areas poor thermal diffusivity. By observing the formation of hotspots and stopping the rub before the potential hBN density is removed, sections of the abradable can be taken to observe the densities and potentially confirm the theory.
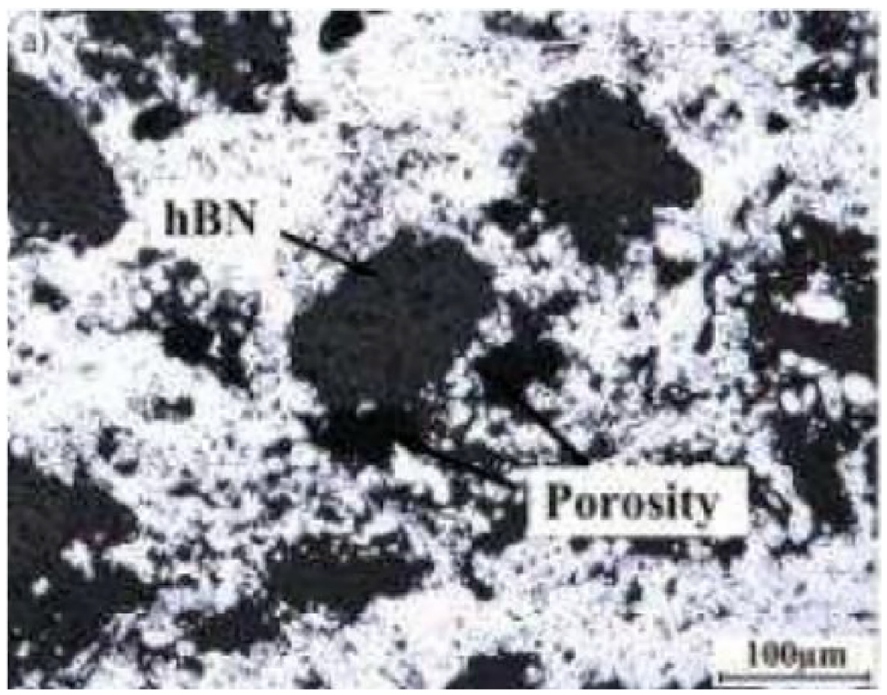
Metco 320 microstructure. 10
Conclusion
Research into the cutting behaviour of abradables has made significant jumps as new testing techniques and measurement tools have allowed for more information to be gathered. From initial rub tests which looked at how a blade changed before and after a rub, to more recent developments in in situ measurements which have provided an insight into how wear mechanisms develop during the rub. The novel in situ tools described in this paper aim to take this further by allowing for the simultaneous recording of visible, thermal and force data during a test.
The addition of the blade side and front cameras have been shown in previous research to provide vital information when looking to characterise wear mechanics and when looking at how these develop during a rub.10,13 By adding the thermal camera, alongside the front and side cameras, it is now possible to see how the temperature of the blade and abradable relates to adhesion growth.
Initial testing with these new tools has highlighted their ability to not only align hot spots with adhesions, but to also to observe how temperatures and adhesions develop over time. Results of tests with Metco 601 at 0.2 µm/pass have shown clear, and repeatable, time phasing between the wear mechanics and hotspots on the blade and abradable.
These initial results are of a limited run of tests and are therefore insufficient to draw any conclusions on the general relationships between adhesions and temperatures. However, these results do show how these tools could be applied to multiple different abradables at different test conditions allowing for temperature-adhesion relationships to be extracted.
These tools can also be applied to provide evidence for existing theories, and to fill holes identified in previous work.
Footnotes
Declaration of conflicting interests
The author(s) declared no potential conflicts of interest with respect to the research, authorship, and/or publication of this article.
Funding
The author(s) received no financial support for the research, authorship, and/or publication of this article.