
Abstract
This paper investigates the relation between acoustic emission events and the corresponding behavior of the specimens after damage under tensile loading. Tensile strengths of carbon/glass fiber epoxy composites subjected to impact damage were evaluated experimentally. The variations of amplitude, energy, and dominant frequencies of the AE events were studied to investigate the post-impact behavior of specimens. Different layers (6, 12-ply) and fiber materials were assessed, and their effects were considered. Waveform patterns and frequency domain analyses were also utilized to evaluate the damage severity. This practical method can be used as an advanced and straightforward approach to estimate either the value of the damage or residual strength subsequent to impact in laminated composites. It was proved that the impact damage led to dropping residual strength, especially in carbon/epoxy specimens, since they are sensitive to impact.
Introduction
Fiber reinforced composite materials have been utilized for many industrial applications in recent years as they have higher strength and stiffness in comparison with conventional materials. 1 Although laminated composite structures have higher strength, better elastic modulus, and easier fabrication processes, compared to traditional materials, these materials are alarmingly susceptible to impact-induced damages, which can be reasons of catastrophic failures.2,3 Drop weight impact tests have been performed on composite laminates in order to study the effect of impact damage.4–7 The residual strength of composite structures with impact-induced damages were predicted by means of the composite’s characteristic length.7,8
Structural Health Monitoring (SHM) approaches have been widely employed in order to visualize damage evolution in component and inspect the quality of engineering structures.9,10 With respect to composite materials, several researchers have been trying to correlate the damage to its AE parameters. The majority of the contributions in the case of composite materials have utilized the conventional AE analysis, which usually incorporates investigation of the event in diagrams of some AE features versus load, such as energy, count, amplitude and the duration of hits. It was deduced that the amplitude, energy, and frequency ranges of various damage modes are not the same.11–14 Cumulative AE count and energy curves were exploited to identify the thresholds of the damage evolution during loading and investigate the influence of temperature on the low-velocity impact response, and post-impact flexural strength. 15 A direct relation between the observed damage mechanisms and the recorded AE signals was established in carbon/glass hybrid laminates under tensile loading. 13 The inter-laminar fracture toughness evaluation in glass/epoxy composite specimens was identified using the localization of the AE signal sources and the cumulative AE energy. 16 Some studies showed that AE parameters can be used to anticipate the failure behavior in reinforced composites.17,18 Aslan 19 revealed that the amplitudes of AE signals for lax fiber LPET commingled composites can be classified in terms of the failure modes occurring in different stages of damage progression. According to his findings, the amplitudes of AE signals are categorized as matrix cracking (40–50 dB), fiber-matrix debonding (40–65 dB), fiber pull out (60–80 dB), and failure breakage (80–96 dB).
The acoustic emission method detects micro-damage events in structures and their sources. Sasikumar et al. 20 found that amongst all AE events, peak amplitude, event duration, and energy are the best parameters for predicting composite specimens’ failure load. The literature review indicates that AE techniques in the presence of other methods can characterize the circumstances in laminated composites. The method can determine how destructive the damage is and is practically capable of predicting the eventual steps. Each micro-mechanical event is believed to have a distinct waveform as a fingerprint to differentiate the waveforms. Some researchers have utilized the clustering method with different approaches in order to classify signals.21–24 In addition, some have applied the pattern recognition means to AE waveforms in order to address micro-damage sources.23,25–27 An AE cluster analysis was employed by some authors to identify damage mechanisms in UD glass fiber-reinforced polymer (GFRP) composites.22,26,27 Hoseinlaghab et al. 28 employed AE to study the effect of several nanoparticles on the residual tensile strength of Glass Fiber-Reinforced Polymers (GFRP) composites and obtained peak frequency ranges of damage mechanisms in composite materials. Barré et al. 29 used time domain features, such as peak amplitude, duration, rise time, counts, and energy, and found that the peak amplitude of AE events is correlated to damage mechanisms. Some researchers exploited several AE features in time domain for clustering. One of these contributions, 26 revealed four typical waveforms of AE signals for GFRP composites: A-type signal which indicates matrix cracking with low amplitude, medium-rise time and medium duration, B-type signal that is related to interface debonding with short rise time and short duration. Additionally, D-type signal characterized with medium amplitude, medium-rise time and long duration refers to delamination in glass/epoxy composites, and C-type signals were found in glass/polyester composites and analogous with B-type signals.
Fast Fourier Transformation (FFT) is a powerful and widely used tool in SHM studies to transfer data from time domain into frequency domain, from which the primary frequency can be calculated.11,30 By plotting the primary and secondary frequencies (i.e. the highest and second-highest frequencies) from each power spectrum along the progress of the test, it was found that the primary and secondary frequencies appearing in each event can be correlated. The experimental outcomes have not proved any significant correlation between damage mechanisms and AE signals. Besides, the literature has not proceeded to a precise classification or practical method. Consequently, there is a long way to identify any acoustic signature of the damage mechanisms and apply efficient approaches for ambiguous parameters to be characterized.
This study aims to evaluate the effects of damage with different impact energies on the residual strength via tensile test and recording acoustic emission signals simultaneously. In addition, the effects of different ply numbers and carbon or glass fiber materials were considered on the tensile failure of specimens subjected to impact. The main reasons for decreasing the residual strength are drop-weight damages such as fiber breakage and matrix crazing, which are proportional to the impact energy. The obtained AE signals were investigated by knowing the characteristics of the AE events, such as frequency or energy, corresponding to different cases.
Experimental procedure
This section describes the specimens’ properties and the experimental set-up.
Specimen preparation
A simplified vacuum infusion process was used to produce unidirectional composite laminates with the dimensions 270 mm × 120 mm. Firstly, the glass or carbon layers saturated with well-mixed epoxy resin were stuck in parallel. Secondly, they were put into the mold, then to achieve good integrity, the vacuum state was imposed until they were fully cured. Finally, in order to eliminate inhomogeneous edges, the dimensions of specimens were reduced to 250 mm × 100 mm by the water-jet cutting method. Furthermore, the visual investigation was conducted to ensure specimens there is no source of matrix cracking at edges of specimens. Specimens were produced in four groups, 6-ply, and 12-ply, with different fiber materials, carbon or glass. At least 16 specimens were provided for each group. The intention of dissimilar layer counts and fiber materials led to consider their effect on impact damage and assess the residual strength after subjecting to different damage energies. The damaged glass/epoxy composite samples are presented in Figure 1.
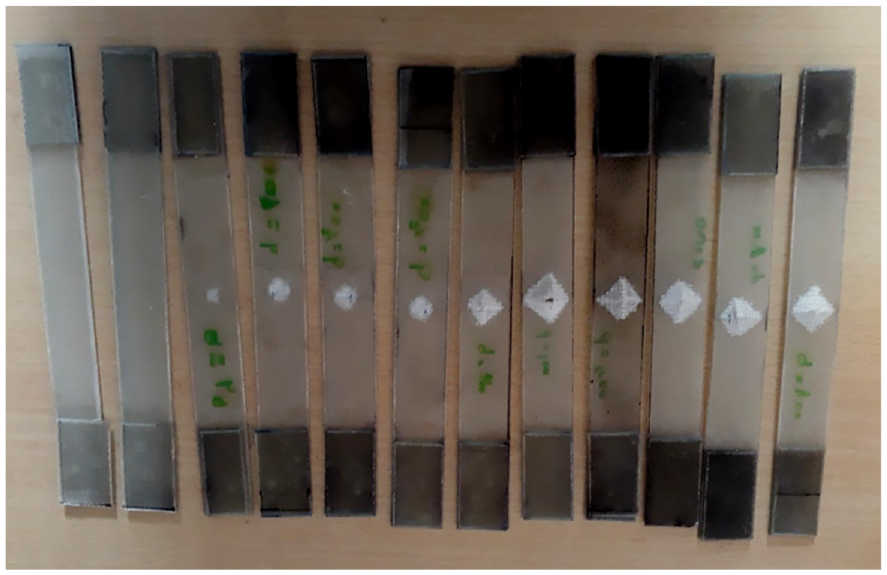
Damaged glass/epoxy composites.
Test procedure
After primary preparation, the damage test was performed in accordance with ASTM D7136, 31 and different impact energies were applied to specimens by means of a drop hammer of 2100 g with a frontal radius of 16 mm. Before applying the damage, the specimens were fixed in a unique fixture as depicted in Figure 2. Then, drop weight impact was conducted with various energy of 4, 8, 12, and 16 J. Finally, specimens were cut using a water jet, and damaged areas were placed in the center of them.
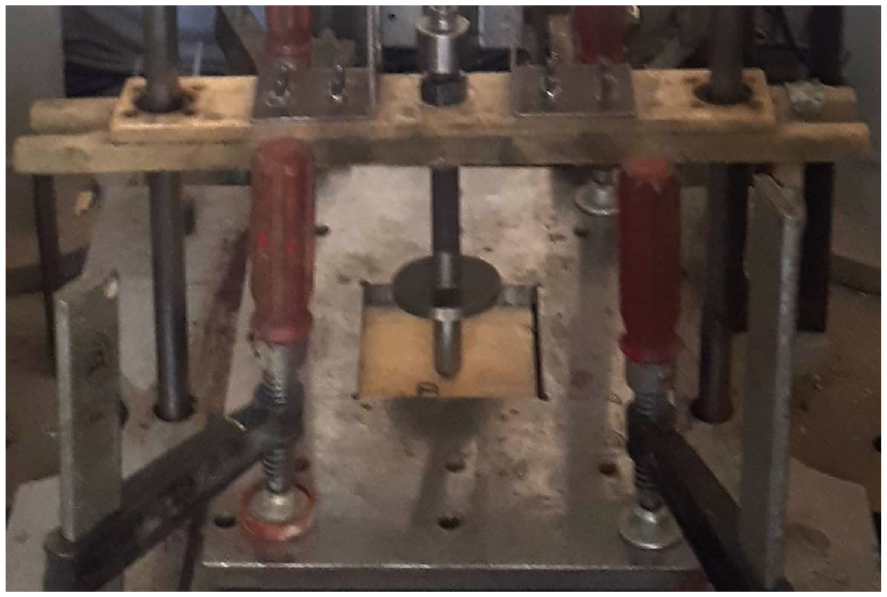
Drop weight impact test.
In order to accomplish tensile tests based on ASTM 3039, 32 uni-axial quasi-static testing of the damaged composites was performed by a universal testing machine equipped with the pneumatic gripping system, under displacement control using a speed of 2 mm/min. The nominal test specimen dimensions were 250 × 25 mm. At least three damaged specimens of each type were tested. The AE sensor was attached to one side of the specimens, as shown in Figure 3, to monitor the damage events acoustically. The ambient temperature range was recorded at 20 ± 1°C.
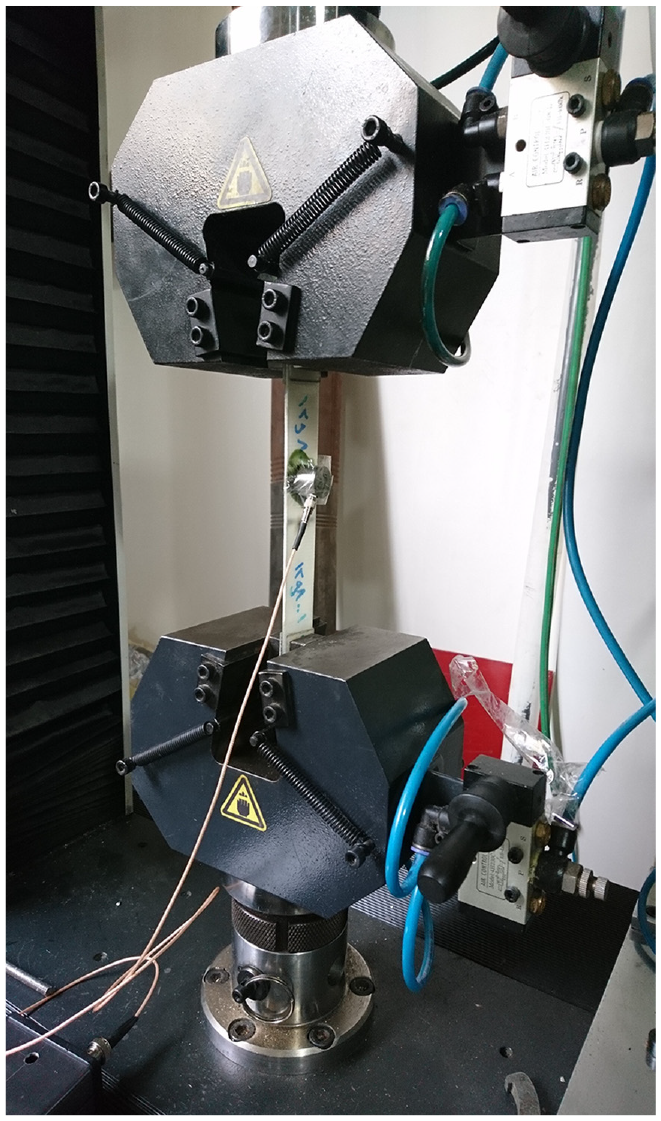
AE test set-up.
AE sensor
The generated AE signals were recorded using an AE sensor with an optimum operating range of 50–800 kHz. The sampling rate of AE data acquisition was set to 4 MS/s (Mega Samples per Second). The pre-amplifier with a gain selector of 40 dB was utilized to boost the acoustical signals. The calibration of AE sensors was implemented using the pencil lead break method, according to ASTME976-10 standard. 33 Vacuum grease was also selected as the coupling material between specimens and sensors to cover the contact surfaces.
Result and discussion
The effect of three parameters, including the impact energy, number of plies, and fiber materials, on the residual strength of fiber reinforced specimens, is discussed in this section. Also, the impact of the mentioned factors on the recorded AE events is investigated. AE monitoring technique provides useful information about different stages for the damage evolution in the fiber reinforced composite. According to some literature,24,34 the conventional AE events may not be adequate to investigate different aspects of damage evolution in FRCs because of a large number of damages and stress redistribution mechanisms, such as matrix cracking, fiber/matrix debonding and fiber breakage, is constantly changing. This issue applies to current research as well. To elaborate on this problem, some of the conventional AE events, such as energy and counts, were recorded while the tensile test was performed. The variation of these events with respect to changes in applied tensile load is depicted in Figure 4. As it can be seen, the AE energy data shows no straightforward correlation with the increase in tensile load even though the number picks with an energy higher than approximately 100 aJ tends to rise as the specimen reaches its failure. The number of counts generally goes up as the force increases, but it is still difficult to study different stages of damage evolution through the data. This study investigates the usage of extracted frequency information of AE data in order to overcome the difficulty in interpreting AE data.
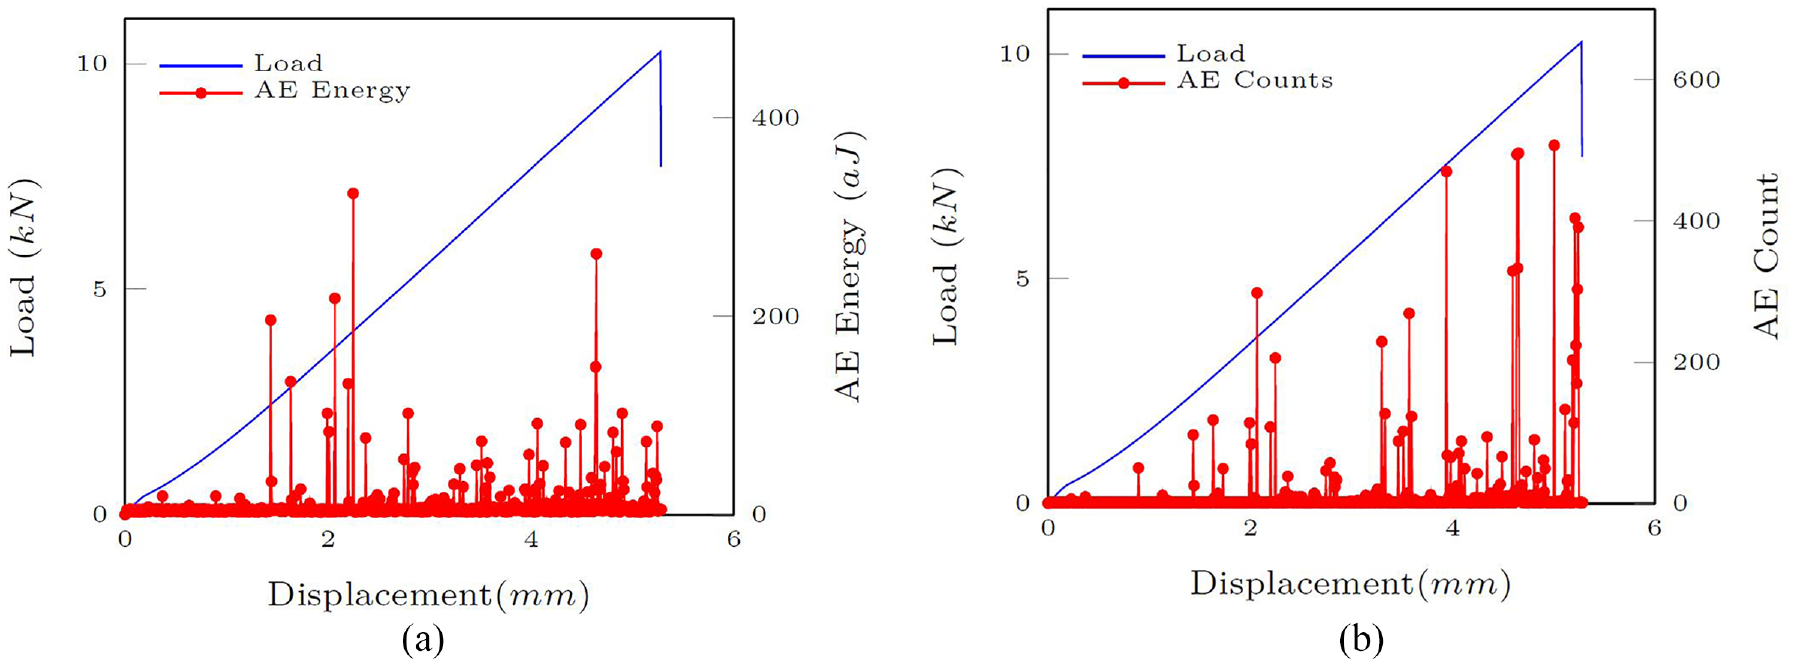
(a) Load-displacement plots and (b) their related AE energy and counts distribution for a damaged 6-ply glass fiber specimen subjected to impact with energy of 6. J.
The effect of impact energy
As the energy of impact increases, the amount of normalized residual strength decreases, which is depicted in Figure 5. Normalized residual strength is calculated by dividing the residual strength of the damaged specimen by the ultimate strength of the identical specimen without any damage. In 6-ply specimens with 16 J of impact energy, the residual strength decreased dramatically due to the severe destruction of the impact. In contrast, the decline in residual strength has not been observed in 12-ply specimens due to their higher thickness. In Figure 5, it is pretty evident that the variations of normalized residual strength among specimens subjected to 4 J impact were nearly close to one another except for 6-ply carbon fiber specimens.
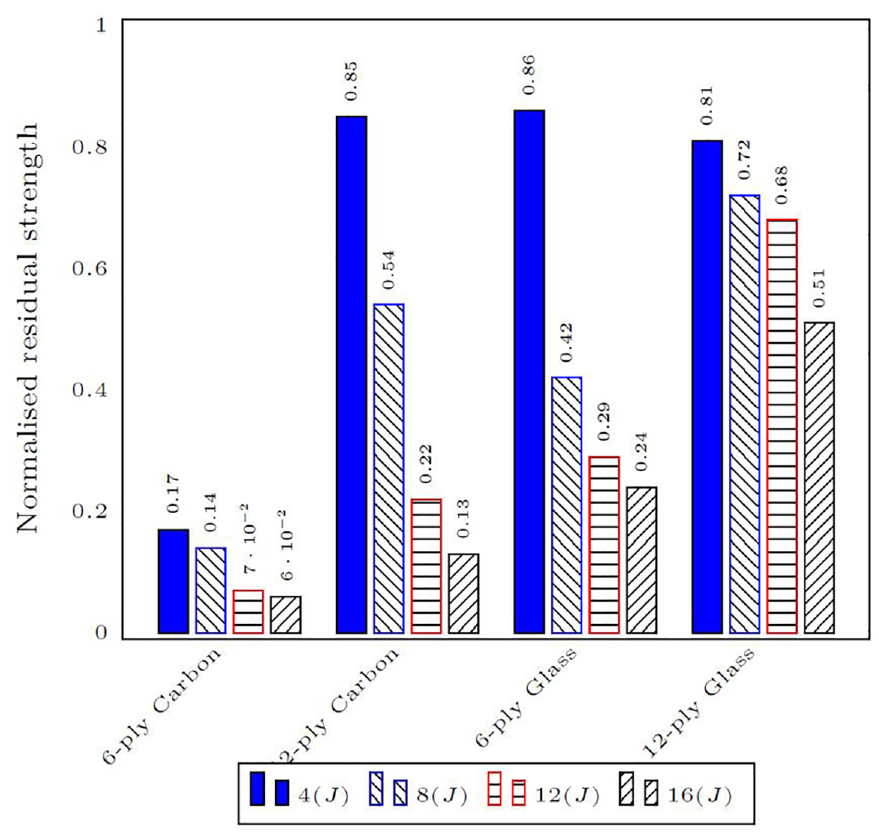
Normalized residual strength for different types of specimens.
It is not easy to interpret the AE results accurately, as an AE waveform is formed from several individual sources associated with different events. To facilitate the interpretation of AE data, frequency analysis and power spectrum data can be adopted. In Marec et al., 23 the frequency distribution versus the power spectrum was employed to distinguish different types of micro-structural failures. It was shown that such graphs may provide enough information to distinguish combined events since the primary and secondary frequencies can be related to the same event. 18 Nonetheless, the aim of this contribution is to find a correlation between distribution and the number of AE first and second frequency and the progress of tensile test. The progress-based distributions of the first and second dominant frequencies for a few tests were illustrated in detail in Figure 6. The points on the graph are acoustic emission events, which fell on the graph’s horizontal axis, and their vertical positions indicate the stage of the test.
The first and second dominant frequencies of GFRP specimens, no damage and subjected to 8 J impact.
Some features that can be extracted from such graphs, as indicated in Figure 6, are the number of dominant frequencies, the mean of dominant frequencies, the range of distribution, and the start point of observing these events. With respect to the effect of impact energy on the residual strength, it can be seen that increasing the impact energy dramatically reduces the number of events since the density of points is proportional to the amount of micro-mechanical events happening during the specimens’ destruction. This trend can be vividly seen for both 6-plies and 12-plies specimens. On the other hand, there is no significant difference between the start point of observing events nor can any shift be seen in the center of event distribution. Also, the range of dominant frequencies is almost equal for specimens with the same number of plies.
The influence of the number of layers
The number of layers is directly proportional to the residual strength of damaged fiber reinforced composites. In general, the more layers of a specimen, the more tensile strength it has. 7 As summarized in Figure 7, for 12-ply glass fiber specimens with impact-induced damages with the energy of 4 J or 8 J, there is not an inconsiderable decrease of ultimate tensile strength. On the other hand, damaged 6-ply specimens, even subjected to low-energy impact, witnessed a significant decrease in ultimate strength. The drop in strength of 6-ply specimens, which had lower thickness, was more sensible than 12-ply ones.
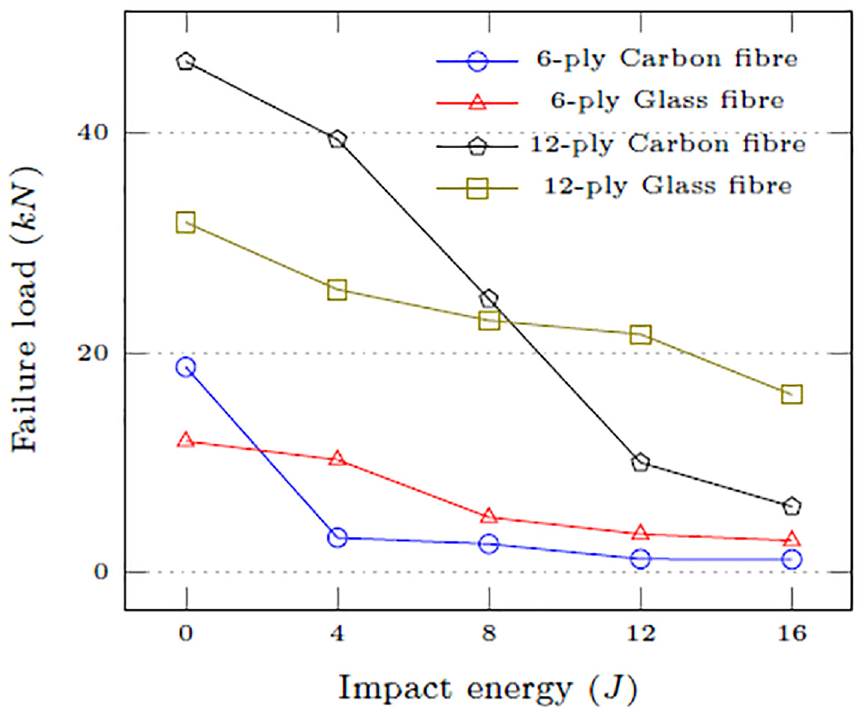
The effect of impact energy on the failure load.
To figure out the effect of thickness on the impact behavior of specimens, the impact energy per ply was considered. Relatively comparing, based upon Figure 8, CFRPs experienced steep decrease. According to the experiment results, the normalized mean residual strength for the 6-ply and 12-ply specimens were 0.28 and 0.55, respectively.
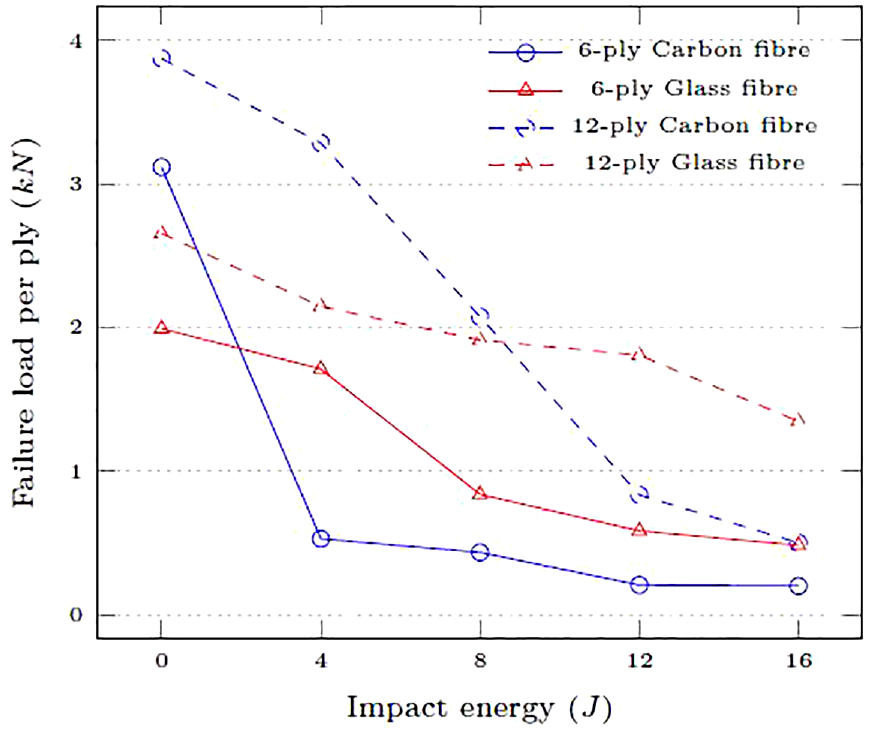
The effect of impact energy on the failure load to layer count.
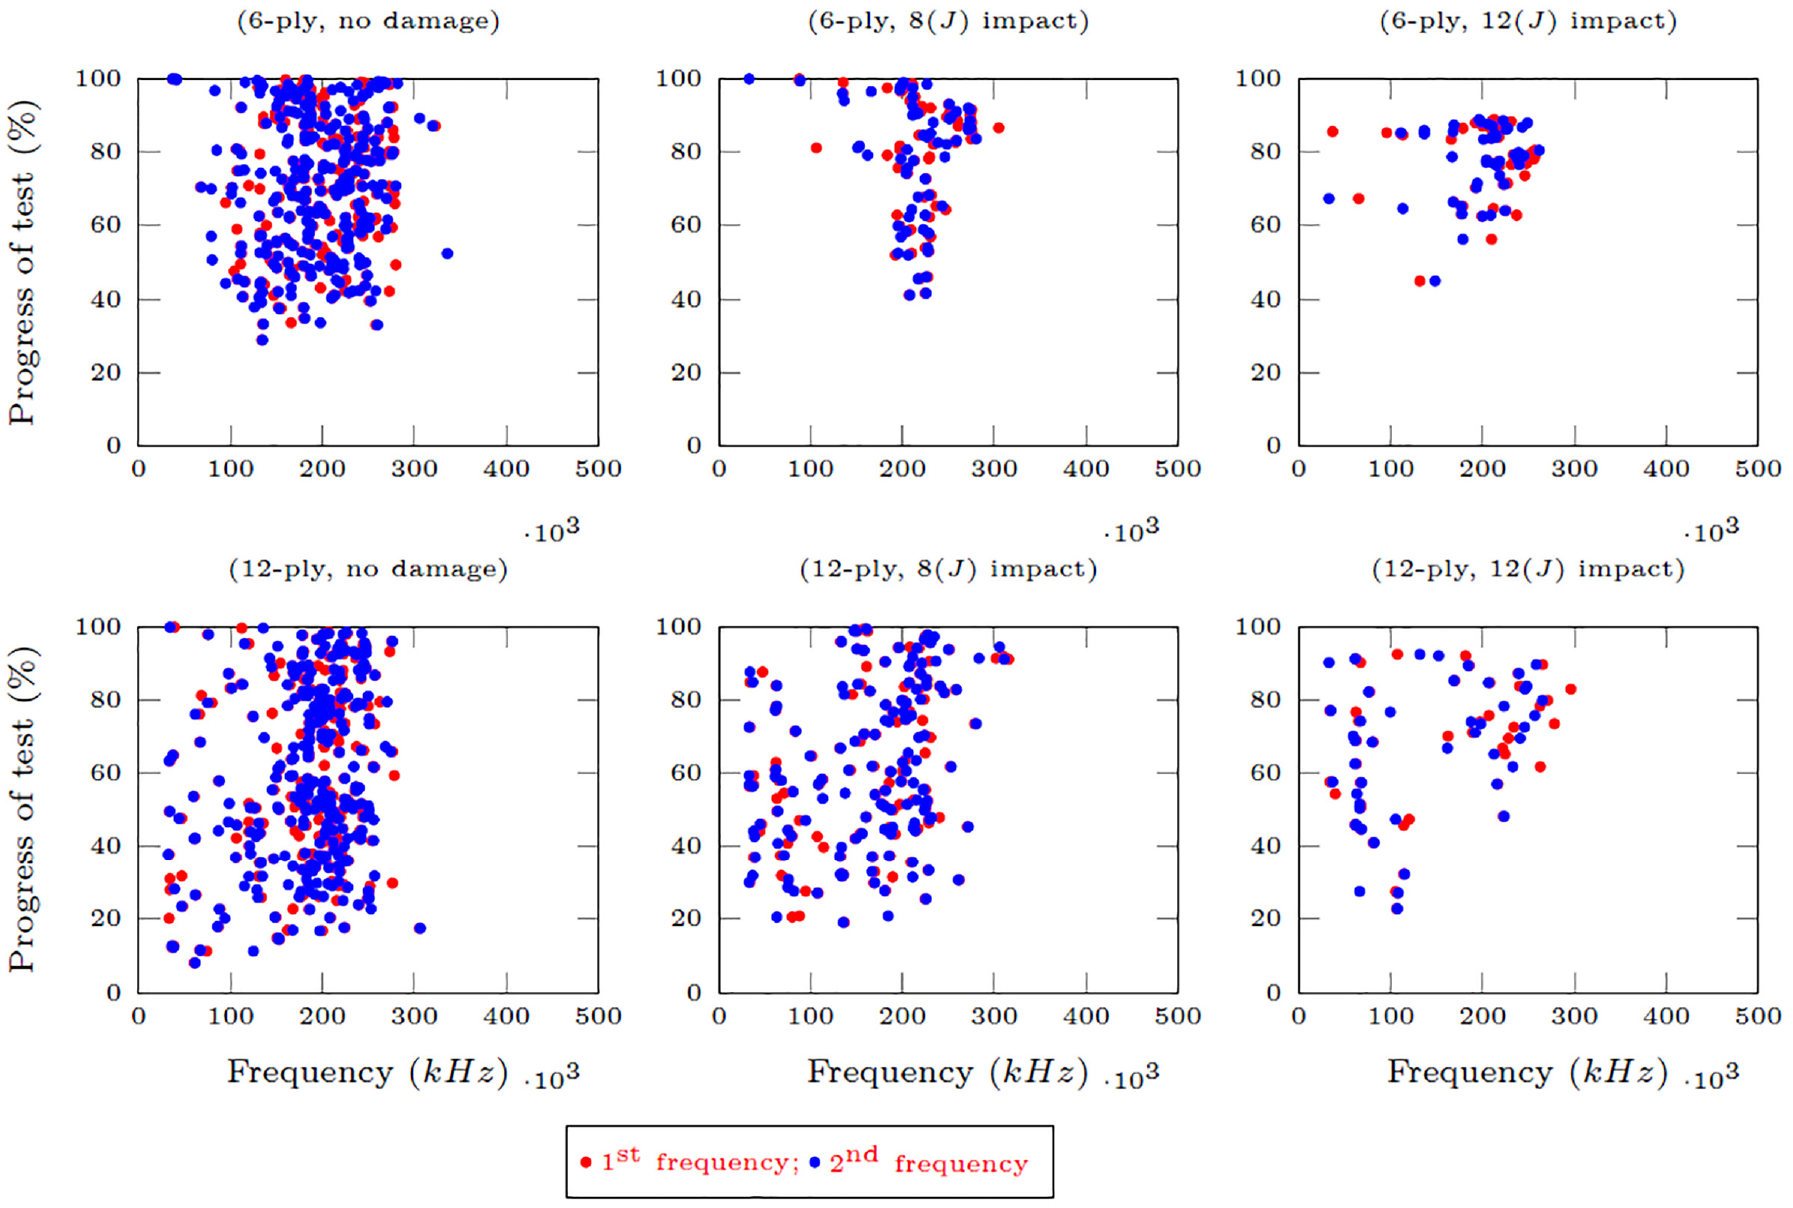
To study the correlation of dominant frequencies with the specimens’ number of plies, the frequency distribution against the progress of the test for CFRP and GFRP samples with 8 J impact energy is depicted in Figure 9. The first noticeable difference is the total number of events which decreased in both samples with a lower number of plies. This is in good agreement with the previous results that the force required for breaking a 6-ply sample is considerably lower, referring to Figure 7. Another difference that the number plies have triggered is the stage of the test where the first event is recorded. As it is illustrated, the first dominant frequencies for 12-ply samples occurred around 20%, whereas that of 6-ply samples happened after making 40% progress. Considering 200 and 100 kHz to be roughly the center of frequency distribution for GFRP and CFRP samples, respectively, it can be seen in 12-ply graphs the dominant frequencies deviate more from the center. In other words, a higher number of layers may affect broadening the range of dominant frequencies.
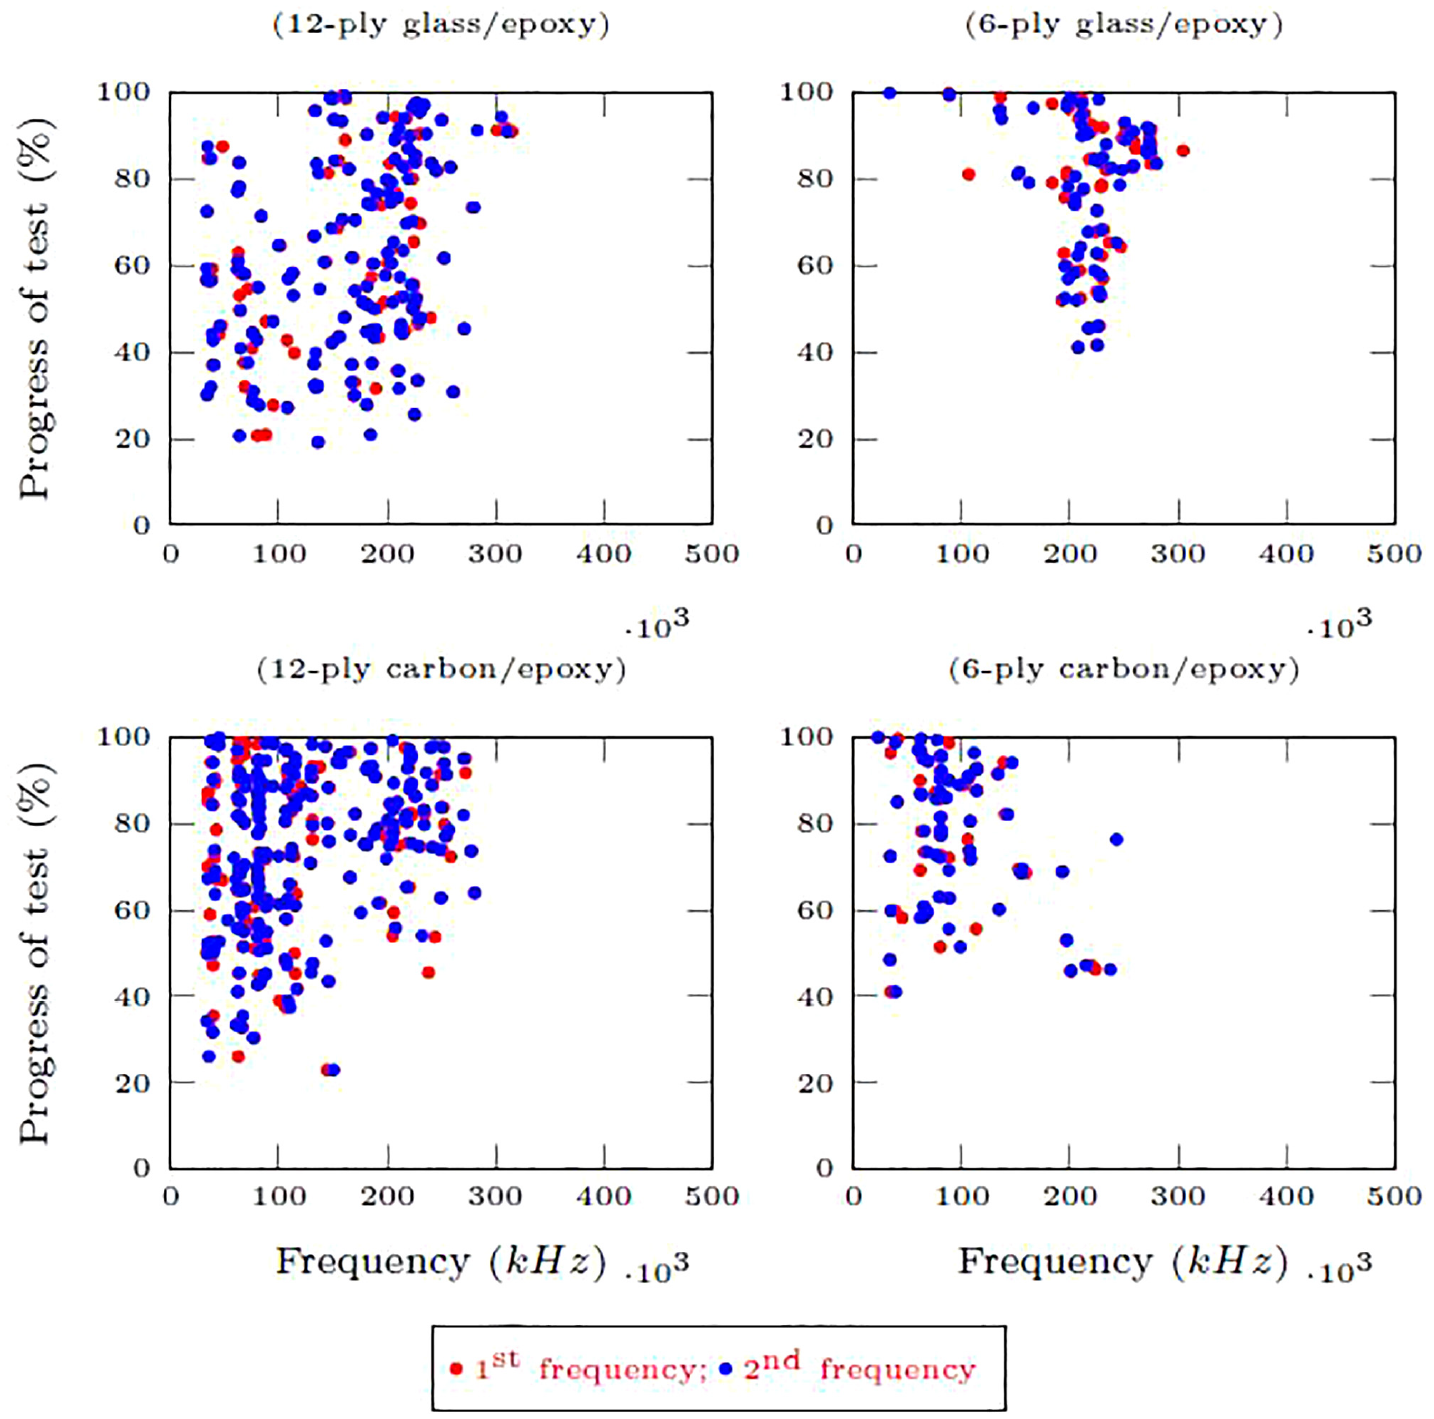
The first and second dominant frequencies of GFRP and CFRP specimens, subjected to 8 J impact.
Almost all samples followed the same pattern at the end of tensile loading and prior to failure, where the energy of events and the number of hits became remarkably high due to extensive and progressive destruction. Such a rise in the number of events can be an indication of an upcoming failure.
The effect of fiber material
The fiber materials influenced the residual strength of damaged fiber reinforced composites. Although the carbon fiber composite specimens indicate a higher residual strength than the glass fiber specimens with the same specifications, CFRPs were more sensitive to impact damage than GRPs. So that the residual strength of carbon fiber specimens subjected to the damage of 12 J or 16 J of impact descended dramatically. It is because glass fibers are not as strong as carbon fibers are, but they tend to be more flexible. Figure 10 illustrates the average strength reduction of different specimen types. The average strength reduction of carbon fiber samples was higher than glass fiber ones, either 6-ply or 12-ply. Evaluating the percentage of the average strength reduction in 6-ply specimens relative to 12-ply specimens with the same fiber material demonstrated that 6-ply carbon fiber specimens underwent a massive drop rather than 6-ply glass fiber specimens. According to the experiments, the normalized mean residual strength for the carbon fiber and glass fiber specimens were 0.27 and 0.57, respectively.
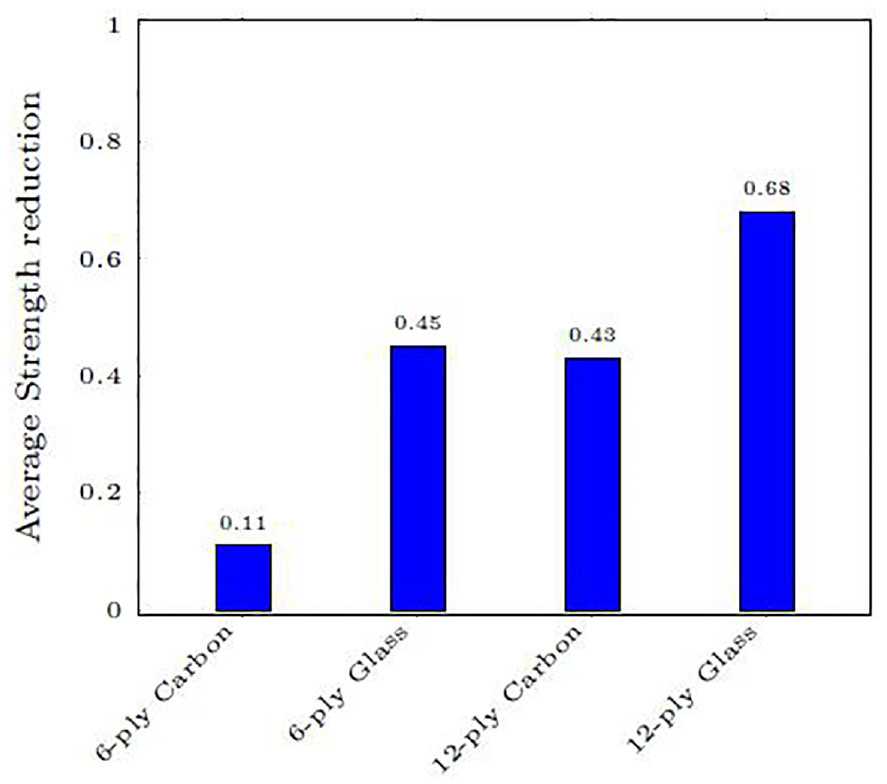
Average strength reduction for different types of specimens.
The frequency bands of the specimens’ first and second dominant frequencies mainly varied from 50 to 300 kHz. The dominant frequencies of the primary mechanical events in all specimens during unidirectional tensile tests were usually below 300 kHz. Frequency distributions can also provide some information regarding effect of samples’ material on their residual strength. Apparently, for carbon/epoxy specimens, the density of frequencies laying on 100 kHz, and for glass/epoxy specimens, the density of frequencies around 200 kHz was higher in comparison to other values, as shown in Figure 11.
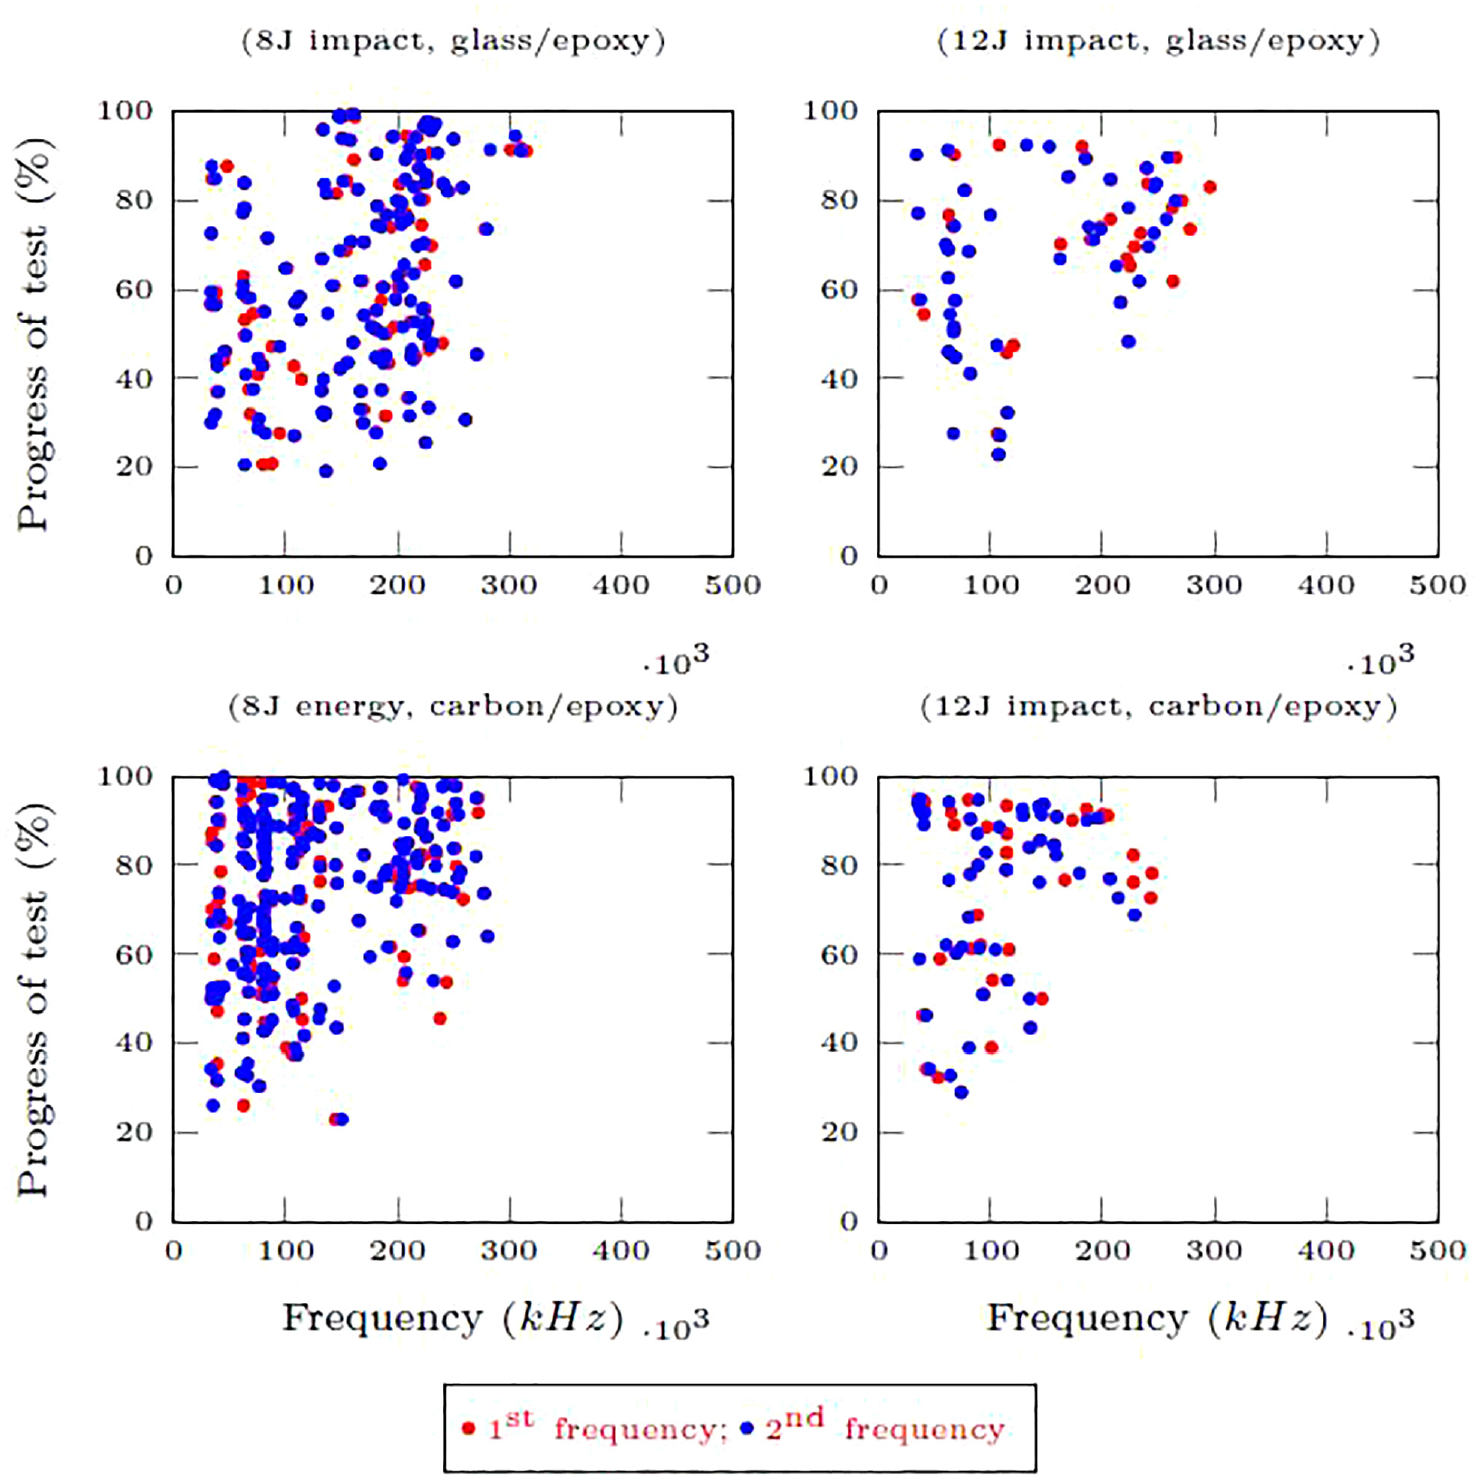
The first and second dominant frequencies of 12-ply GFRP and CFRP specimens, subjected to 8 and 12 J impact.
As mentioned previously, each event waveform refers to a specific micro-destruction.23,25–27 In glass-fiber specimens subjected to damage, the number of C-type signals was much more than damaged carbon-fiber specimens. It was another piece of evidence that proved that carbon fibers were more sensitive to damage than glass fibers. In all specimens, the number of A-type signals descended by increasing the energy of drop weight impact. In 6-ply specimens, there were few D-type signals, as delamination, compared to 12-ply specimens, which possessed a long rising time, durations, and high amplitudes. Despite the fact that the specimens had the same matrix material, the dominant frequencies differed from one fiber material to the other. In each graph of Figures 6 and 9, clustered points decreased remarkably due largely to the impact damage, that some damage occurred in either fibers or matrix.
Conclusion
The residual strength of GFRP and CFRP specimens are studied through Mechanical tests at ambient temperature under quasi-static loading and continuous Acoustic Emission monitoring. A strong correlation between tensile failure and damage is found. The AE signals are assigned to distinct damage severity based on the correlation between AE events and damage mechanisms. Conventional AE parameters and frequency are best-distinguished descriptors to characterize damage severity. It is found that subjecting to impact played an active role in the number of events and tensile strength. Indeed, the results can effectively be summarized by saying that the number of plies and fiber material played crucial roles in the residual strength. The average strength reduction of carbon fiber samples is higher than glass fiber ones, either 6-ply or 12-ply. The drop in strength of 6-ply specimens, which had lower thickness, was more sensible than 12-ply ones. Generally, glass fibers are not as fragile as carbon fibers are. Additionally, in the case of subjecting to impact, the experiments show that the residual strength descended as the ratio of specimen thickness to the layer count dropped in either carbon or glass fiber specimens. The tensile failure load fell as the energy of impact rose. According to the experiment results, the normalized mean residual strength for the 6-ply and 12-ply specimens are 0.28 and 0.55 respectively, and for the carbon fiber and glass fiber specimens are 0.27 and 0.57 respectively.
In general, the results showed that the AE technique could be used as a damage evaluation method in many ways. In order to investigate the sensitivity of different fiber contents to impact, it is a good idea to test more specimens with different fiber types and weight fractions. Furthermore, for interpreting and identifying the micro-events, it is a good idea to conduct more detailed tests to analyze the relationship between the first and second frequencies and utilize post-processing approaches like wavelet transform.
Footnotes
Declaration of conflicting interests
The author(s) declared no potential conflicts of interest with respect to the research, authorship, and/or publication of this article.
Funding
The author(s) received no financial support for the research, authorship, and/or publication of this article.