
Abstract
Ferrography is a significant means of wear particle detection for mechanical equipment. In view of the issue that the wear particle deposition process by a ferrograph is difficult to accurately adjust to avoid accumulation or escape, the deposition behavior of wear particles coupled with the magnetic, fluid and solid field in a ferrograph is studied by the finite element method. The wear particle force and its deposition principle are first analyzed, and the theoretical deposition law is obtained. By building 3D finite element model, setting the magnetic, flow field and wear particle parameters, the coupled simulation based on the particle tracking is carried out. According to the process of wear particles flowing out of the oil tube and then depositing on the ferrogram slide, the effect of oil pressure, viscosity, density, ferrogram slide inclination angle, distance between oil tube and ferrogram slide and the particle release mode on the particle deposition behavior is studied. Based on the velocity and displacement of particles, the reasonable parameter ranges are obtained, and the sensitive variables are determined. In order to verify the numerical law through experiments, the area and perimeter of wear particles are adopted, meanwhile the oil viscosity is selected as the adjustable parameter, and the tested results prove the numerical simulation correct.
Introduction
With the progress of technology and productivity, the mechanical equipment is becoming larger, faster and smarter. Thus, the reliable operation of equipment becomes more important. 1 As a natural phenomenon, the friction, wear and lubrication widely exist in the mechanical equipment. Wear is one of the common failure forms of the mechanical equipment. 2 Taking the wear particles as an object to study the wear state of mechanical equipment is an effective monitoring approach, where the ferrography analysis of wear particle is a mainstream way. 3 Ferrography analysis uses a called ferrograph with the high gradient and strong magnetic field to separate the wear particles produced by the friction pairs of mechanical equipment from the lubrication oil according to the particle size, deposit the wear particles on the glass ferrogram slide and then make an image by a microscope to analyze the distribution law of wear particles to finally realize the wear state evaluation of mechanical equipment. 2
With the development of ferrography analysis technology, many scholars had carried out a great deal of research on two main aspects of wear particle deposition 4 and wear state identification. 5 Peng et al. 6 used the multiple machine learning algorithms to classify the wear particles according to their features. Ren et al. 7 proposed a wear particle recognition method based on the hierarchical fuzzy support vector machine, and the recognition rate reached 90%. Peng and Wang 8 used three classifiers to distinguish the abnormal wear particles and impurities in ferrograph images for the particles overlap, and proposed an improved Convolutional Neural Network (CNN) to identify wear particles. 9 Yang et al. 10 used the Mask Region with CNN (Mask RCNN) to identify the pixel level wear particles. Peng et al. 11 proposed an abnormal wear particle detection model based on two-level CNN and used the support vector machine for particle classification. The identification of wear particles is based on the collection of wear particles. In terms of wear particle collection, Xiao et al. 12 proposed a multi-excitation wear particle sensor to realize the lubrication oil monitoring. Sun 13 designed a wear particle sensor by the magnetic adsorption and imaging to realize a single wear particle recognition. For the ferrograph design, Fan et al. 14 used the solid-liquid simulation to obtain the distribution of wear particles to determine the optimal collection location. Sun 13 numerically simulated the annular magnetic field where the wear particle sensor is located, and obtained the field distribution in the deposition area. Ma 15 designed an on-line rotary particle depositor and optimized the magnetic field. Fan et al. 3 conducted 2D and 3D finite element simulation of the magnetic field in an analytical ferrograph and obtained the magnetic field design law. According to the above research, at present, it mainly focuses on the wear particle recognition method and simplified ferrograph design.
However, the wear particle deposition on the ferrogram slide is a complex magnetic, fluid and solid field coupled process. The unreasonable parameter setting of magnetic and fluid field may lead to the failure of particle deposition, including the accumulation and escape of particles. Therefore, it is urgent to develop a novel multi-field coupled numerical simulation technology to reveal the real deposition law of wear particles to then guide the optimal design and adjusting of ferrograph device. At present, the relative research on the wear particle deposition law based on the multi-field coupled numerical analysis can hardly be found in the existing literature. In this paper, an analytical ferrograph instrument is used as the object, and the COMSOL platform is used to study the wear particle deposition behavior considering the coupling effect of magnetic, fluid and solid field.
Force analysis and deposition principle of wear particles
The schematic diagram of ferrograph instrument is shown in Figure 1(a). 3 It is mainly composed of the micro pump, Magnetic Field Device (MFD), ferrogram slide and oil drain unit. The ferrogram slide is obliquely placed above the MFD at a certain angle. When the metal wear particles flow to the ferrogram slide along with the oil under the action of micro pump at a certain initial speed, the MFD can form a high gradient strong magnetic field on the slide plane, and quickly magnetize the metal particles floating in the oil and then deposit them on the ferrogram slide. Ideally, the ferromagnetic particles should be arranged into a chain along the direction of magnetic force and uniformly arranged from large to small according to their sizes. However, in the wear particle deposition process, the accumulation or escape phenomenon of particles is often caused by the unreasonable setting of an operator, including too big oil pressure, too close distance between wear particles and ferrogram slide and so on, finally resulting in a large error in the subsequent ferrograph image analysis and wear state evaluation.
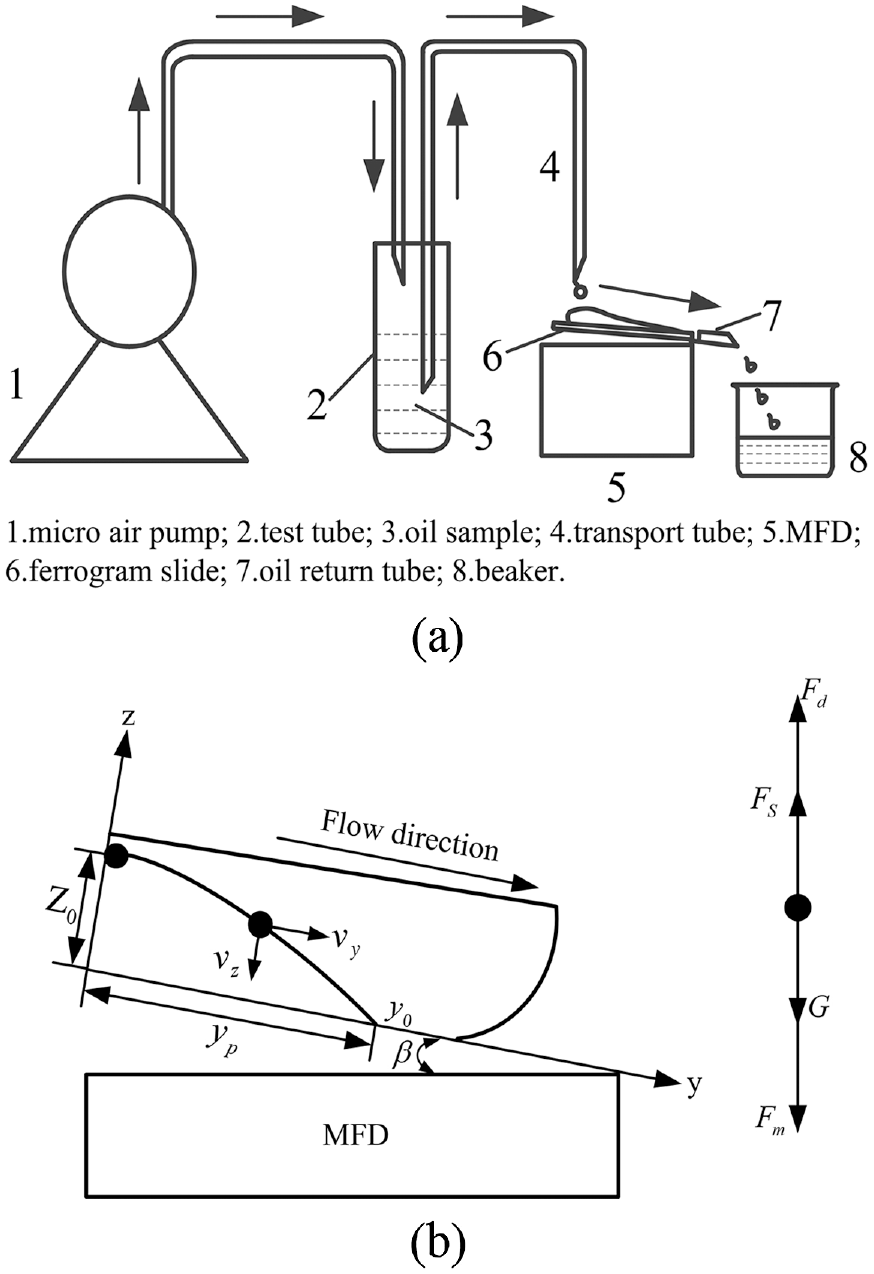
The schematic diagram of ferrograph and wear particle force: (a) ferrograph and (b) wear particle force.
To reveal the wear particle deposition law on the ferrogram slide, the quantitative relationship among the deposition position, magnetic field, fluid field, ferrogram slide and particle parameters needs to be established. 16 Therefore, it is necessary to make some assumptions on the magnetic, fluid and solid field: (i) the oil is the Newtonian fluid, and the particles are reduced to the sphere and uniformly suspended in the oil, (ii) the particles reach the magnetization saturation under the magnetic field, (iii) the micro pump delivers the compressed air at a uniform speed, and the oil flows at a uniform speed, the oil flow is treated as the stable laminar, (iv) the effect of Brownian force is ignored.
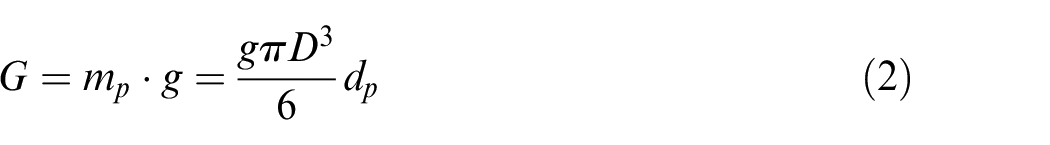
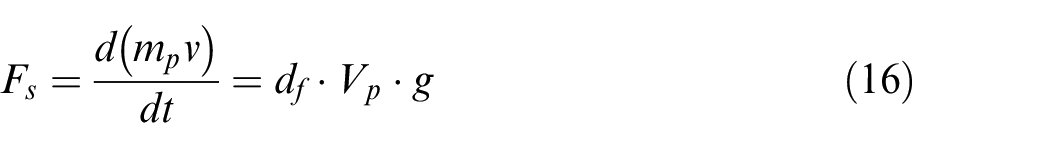
As shown in Figure 1(b), through the force analysis of wear particles, it can be seen that the particle is subjected to four forces, that is, the gravity G, the magnetic field force Fm, the buoyancy Fs and the viscous force Fd of the oil. Z0 is the initial particle height in the oil, y0 is the deposition position, and β is the angle between the ferrogram slide and vertical direction line. According to the Newton’s second law, the following formula can be obtained.

where mp is the particle mass and ap is the deposition acceleration.
According to the Stokes theorem, the following formulas can be obtained.
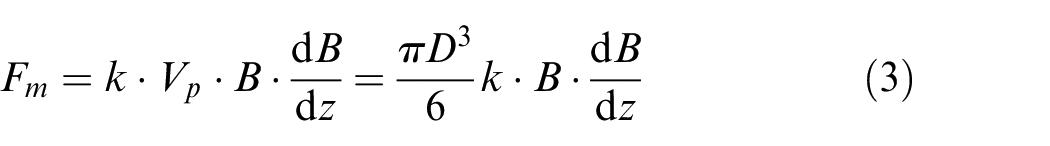
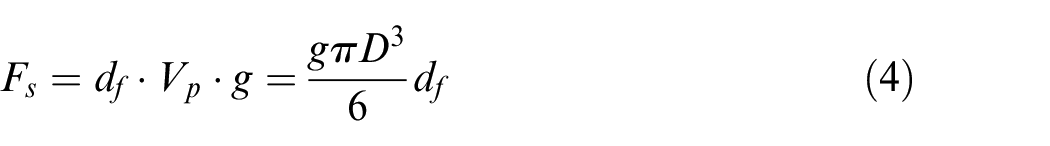

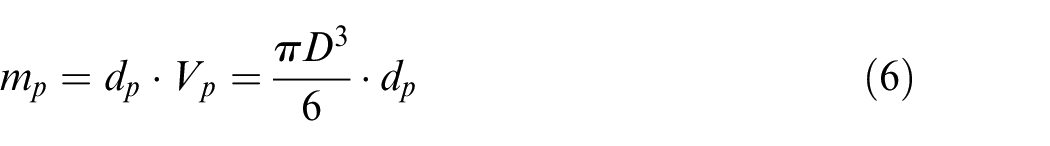
where D is the particle diameter, Vp is the particle volume, dp is the particle density, df is the oil density, g is the gravitational acceleration, B is the magnetic induction intensity, k is the particle bulk magnetic susceptibility, η is the oil viscosity, vp is the particle speed along the vertical direction, t is the time.
According to the viscosity between the oil and ferrogram slide, the velocity of each layer of the oil film along the thickness conforms to the law of quadratic function, as the formula (8). 16
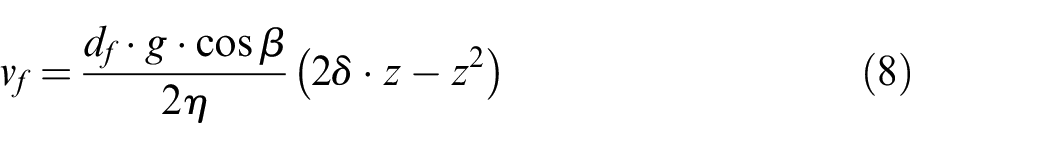
where vf is the oil velocity along the ferrogram slide, β is the angle between the ferrogram slide and vertical direction line, δ is the oil film thickness, z is the thickness of different oil layers.
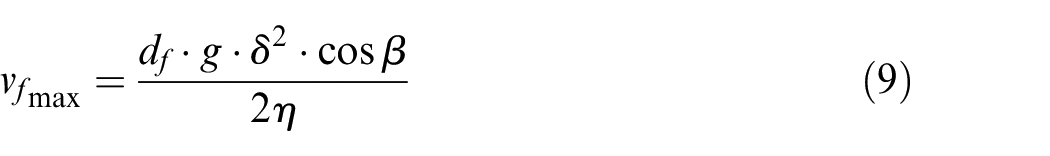
By substituting z equal to δ into the formula (8), the maximum flow velocity of the uppermost layer can be obtained.
According to the flow velocity distribution, the average oil flow Q can be calculated.
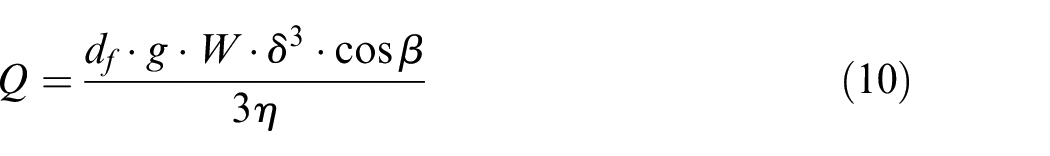
where W is the oil flowing width.
The particle velocity vy at different heights along the flow direction y is expressed as

Substitute the equations (2)–(7) into (1) and sort, there is
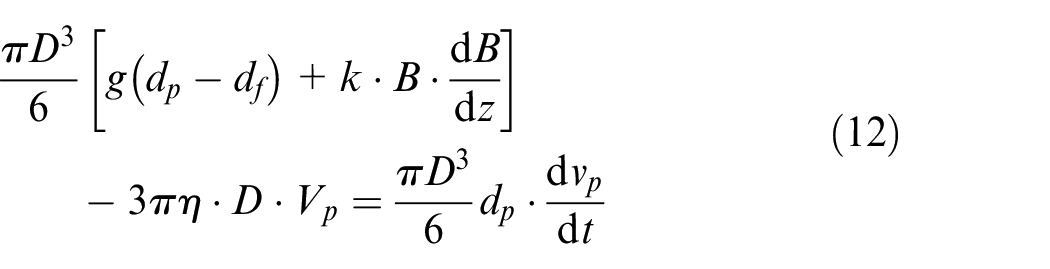
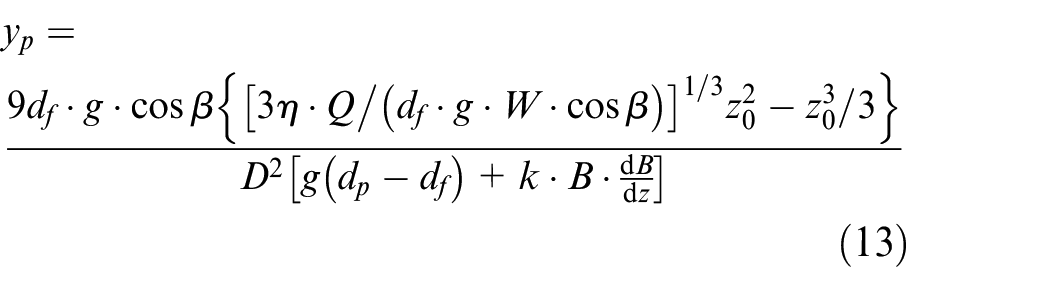
By solving the equation (12) and setting the initial conditions, the relationship between the initial height z0 and the particle deposition position yp can be obtained.
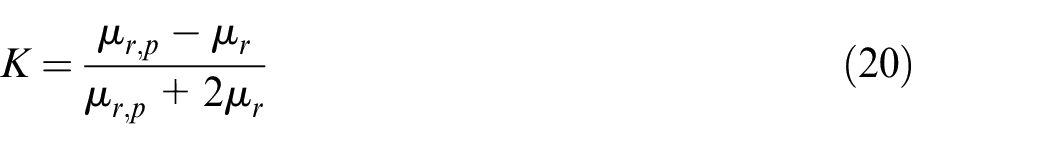
According to the magnetic induction intensity B required is greater than or equal to 1.51T,
3
taking the magnetic field gradient
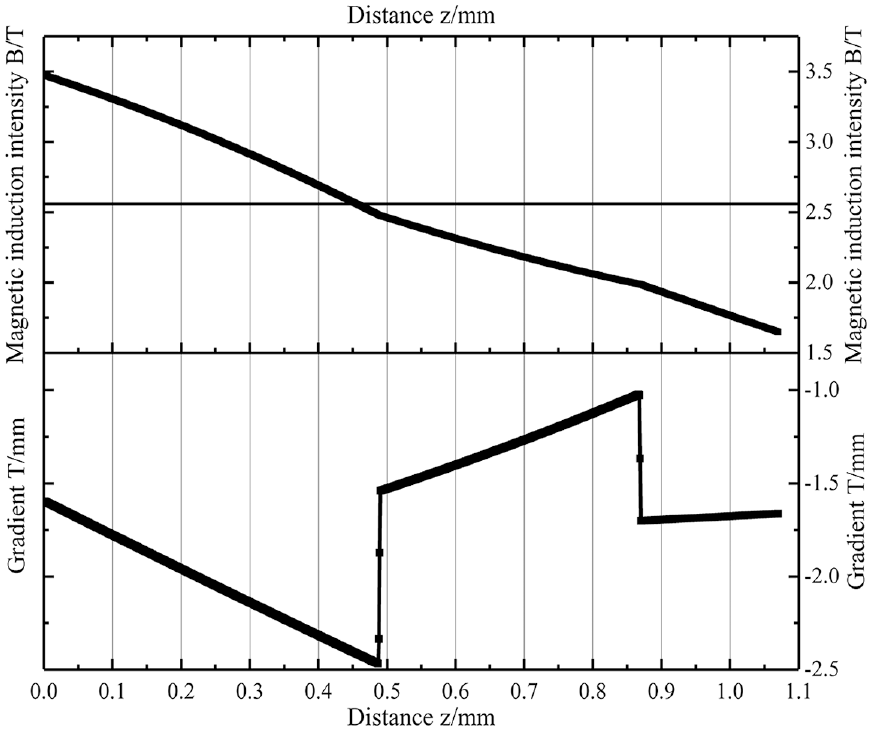
The comparison between the magnetic induction intensity and the gradient.
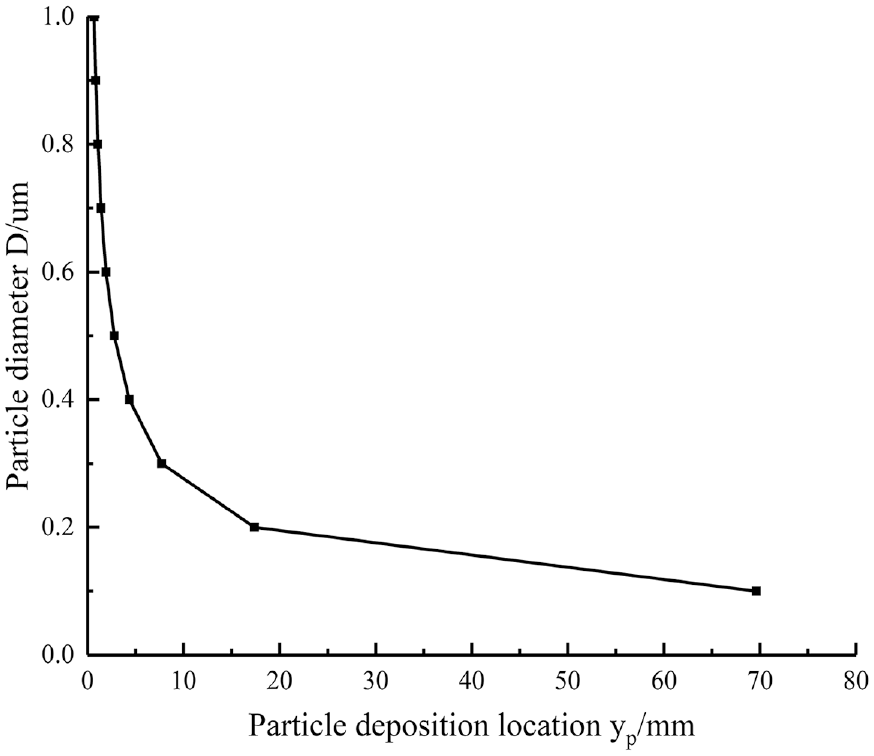
The relationship between the deposition location and the wear particle size.
It can be concluded from Figure 3 that the wear particle deposition location is related to the particle size, initial height, oil density and viscosity, ferrogram slide inclination angle and etc. From this curve law, we can know that the large particles are first deposited near the inlet of ferrogram slide, and the small particles are deposited near the outlet of ferrogram slide.
Coupled analysis scheme of wear particle deposition behavior
In this paper, the magnetic field parameters were set according to Fan et al. 3 Both the magnetic and fluid field were set as the steady-state fields, and the particle tracking in the fluid was considered.
Principle of particle tracking
The particle tracking can provide the Lagrangian description, where the particles are regarded as the discrete entities, which can interact with the external field and surrounding the geometric boundary, and the particles can interact with each other. By solving a set of equations based on the motion law, their trajectories are calculated in the time domain. The most common equation is the second-order ordinary differential equation, and the approximate solution can be obtained through the numerical calculation. When the initial time is 0, first determine the particle position q0 and the velocity v0, then a group of discrete solutions is determined by the time stepping. When the time interval decreases, the particle motion becomes more accurate.
Processing of wear particles
The solution time of particle tracking is much longer than the Lagrangian time scale τp. The particle tracking uses a strict time step. The step size of the default solver is the same as the output time, but for a specific field, the output time is obtained by interpolating the adjacent step sizes. The undergoing gravitational settlement motion equation of particles is a rigid ordinary differential equation. As the particle velocity approaches the free settling velocity, the time step becomes large. If the particle release has the multiple time periods, the time step is very small. Therefore, in order to capture the tiny wear particles, a lot of the execution time is needed. The inlet boundary condition is used to release particles into the simulation domain, and the particles are assumed to have a certain initial velocity. If the initial time step is much greater than τp, the drag force may overcompensate, the particle velocity will change the direction and may be thought to collide with the entry boundary, causing the errors.
Stiffness treatment of tracking model
There are two kinds of stiffness model to deal with the particle motion. 17 The first is the “power” method, the smaller time steps are taken. If a lot of outputs are not needed, a small step can be adopted. Another method is to delete the inertia term. It is assumed that the drag force and other forces are always in the dynamic equilibrium, instead of completely dissolving the particle motion in the initial τp, that is, the particle immediately reaches the free settling velocity. In the particle release and propagation, the particle tracking is selected to solve the equations. There are four equations including the Newtonian, first order Newtonian, Newtonian without inertia term and mass, where the Newtonian is selected.
Numerical simulation of wear particle deposition behavior
Finite element modeling
In this paper, 3D model of ferrograph instrument is built in the Solidworks software, and then imported into the COMSOL platform to carry out the finite element analysis.
For the magnetic field, the ferromagnetic parts apply No.20 steel with the B-H curve, the permanent magnet adopts the residual magnetic flux density Br, the left and right magnets are the same and their magnetization directions are opposite. First set the spherical air domain with a radius of 100 mm, then set the zero scalar magnetic potential. As shown in Figure 4, the magnetic field space dimension is 65 mm × 65 mm ×55 mm, the ferrogram slide dimension is 60 mm × 24 mm ×0.18 mm, the fluid limiting groove width is 6 mm and its length is 58 mm, and the cylindrical oil tube dimension is Φ1.5 mm × 1.5 mm.
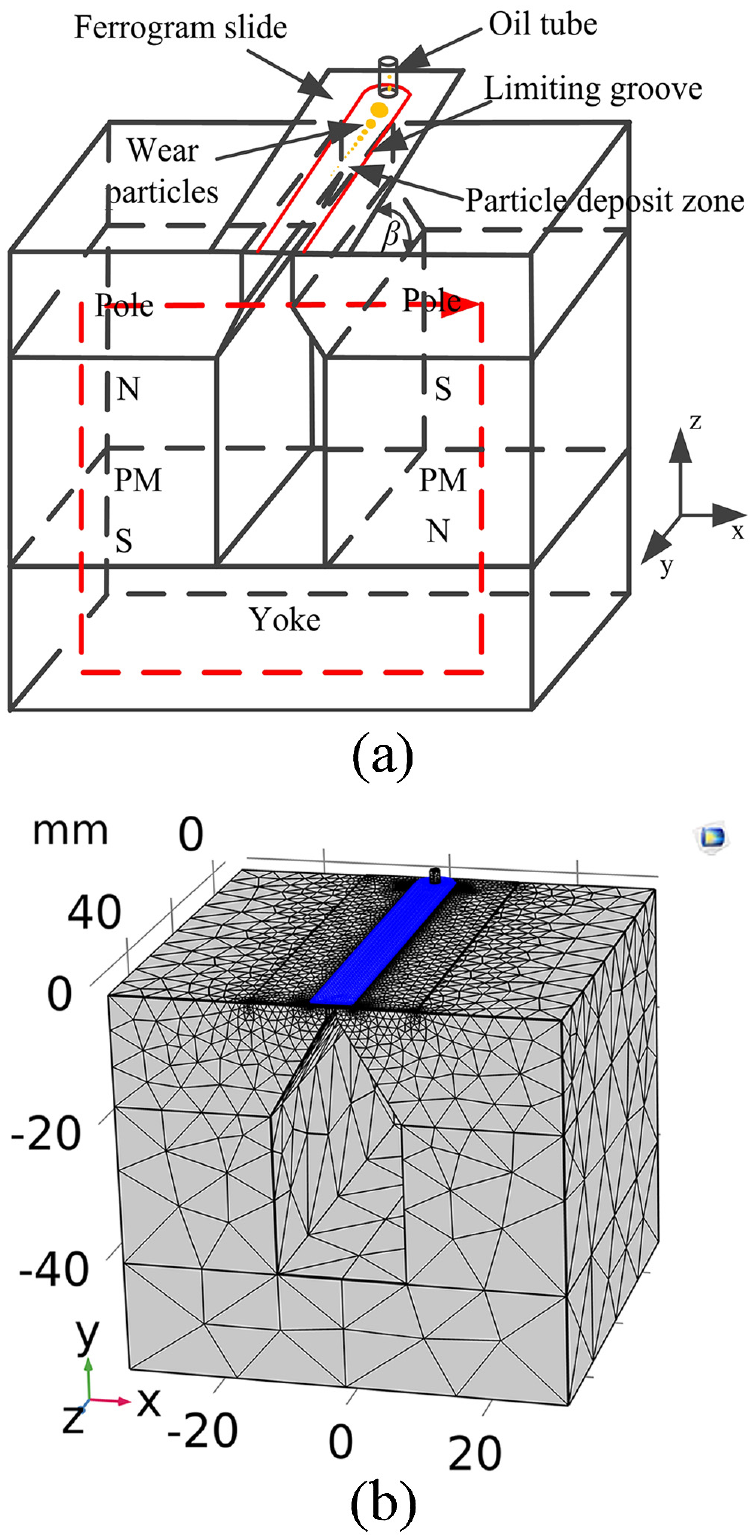
The model of ferrograph instrument: (a) model diagram and (b) finite element model.
For the fluid field, the laminar flow was used. First, select the fluid area, set the inlet pressure as 20 kPa, the boundary condition is “no wall slip.” The particle tracking was selected. Add the different size particles and give the particle density, and then add the forces. The magnetic force adopted the magnetic swimming force mode, and selected the corresponding inlet (i.e. the particle release starting point) and outlet (i.e. the particle movement end point). The outlet boundary condition is “disappear,” the wall condition is “rebound,” and the particles were released according to different sizes.
In the particle tracking, the corresponding forces are as follows.
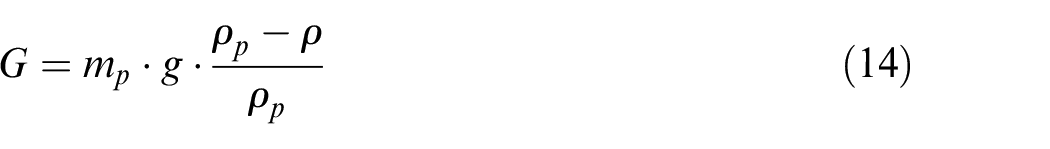
where G is the gravity, ρp is the particle density, ρ is the surrounding fluid density, and
When the particle density is bigger than the fluid density, the buoyancy is close to 1. When the particle density is the same as that of the fluid, it is close to 0. The particle is under the suspended state. The drag force comes from the Stokes drag law. The relative Reynolds number of the wear particle is very little, so the drag law is applied.
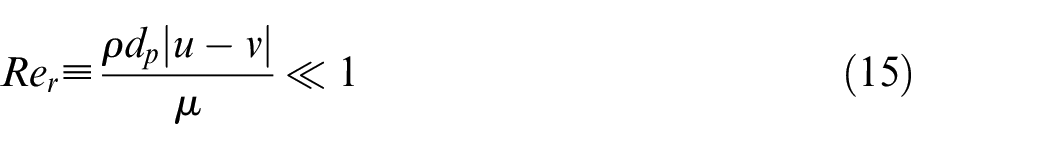
where
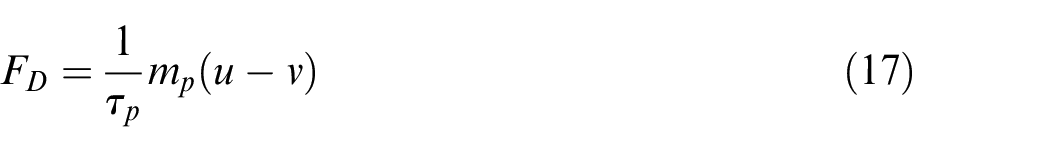
where FD is the drag force, τp is the time constant, and u is the surrounding fluid velocity.
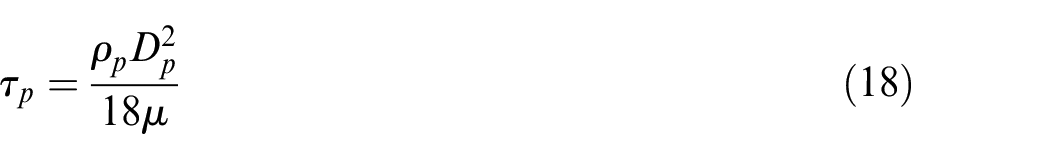
where Dp is the particle diameter, μ is the surrounding fluid dynamic viscosity.
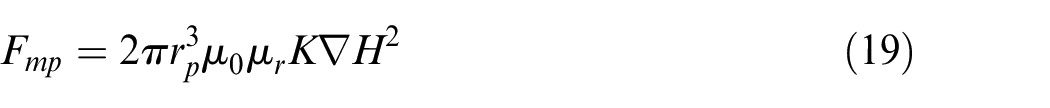
where
where
The finite element mesh of the magnetic field is the free-style tetrahedron, and that of the fluid field is the free-style triangle. The oil film had a certain thickness with eight layers. The analysis results of the magnetic and fluid field in the steady state were used for the transient analysis of wear particles. The total time is 1 s, which is divided into two periods, that is, range (0,0.00005,0.01) and range (0.01,0.01,1). The time step of the first period is 0.00005 s and that of the second is 0.01 s.
Quantitative analysis of wear particle deposition behavior
Based on the above settings, the velocity and displacement of wear particles with different sizes were calculated. The initial oil pressure, oil viscosity, oil density, ferrogram slide inclination angle, distance between oil tube and ferrogram slide, and particle release mode were discussed in turn. In all cases, the results were presented in a set of double vertical coordinate graph of particle velocity and displacement. Taking the zero point of horizontal coordinate as the starting point, the particle velocity decreases from left to right, and the particle displacement increases from left to right. Whether it’s a family of velocity curves or a family of displacement curves, the results of five-kind particles are distinguished by lines with different shape labels, the different colors are used just for the better display. In all cases, the size distribution range of wear particles is 0.1–0.5 µm and the distribution function was set to the value list.
Effect of initial oil pressure
Set the initial oil pressure as [8,20]kPa and calculate a group of results each 3 kPa. The particles adopted the point release mode. The distance between the oil tube and the ferrogram slide is 1.5 mm, the ferrogram slide inclination angle is 0.5°, the oil viscosity is 0.1335 Pa·s, and the oil density is 1254 kg/m3. The velocity and displacement of wear particles with the sizes of 0.1–0.5 µm are shown in Figure 5.
The particle velocity and displacement under different initial oil pressures: (a) at 8 kPa, (b) at 11 kPa, (c) 14 kPa, (d) at 17 kPa, and (e) at 20 kPa.
In Figure 5, the particle velocity curves are from the top left to the bottom right. The pressure is a dominant factor in 0–0.05 s, and the particle velocity changes rapidly. Within 0.5–1 s, the particle is subject to the comprehensive action of the magnetic force, gravity, buoyancy and drag force, and the velocity changes gently. The bottom left to the top right is the displacement curve family. The displacements for 0.1 and 0.2 µm increase linearly, from 0.3 µm that increases non-linearly and the nonlinear law for 0.4 and 0.5µm is obvious. Under the same time and convergence conditions, the velocity for only 0.5µm can reach 0, that is, the wear particles can stay on the ferrogram slide. By comparing five figures, it can be seen that the initial oil pressure is a sensitive factor, the maximum particle velocity for different sizes changes obviously, the particle displacement along the ferrogram slide length direction varies widely, and both the velocity and displacement increase with the increase of the oil pressure.
Effect of oil viscosity
If the oil viscosity is small, the adhesion of the oil to the lower wall of the ferrogram slide is small, the particles move quickly, and the particles with the small size may be lost. If the oil viscosity is large, the adhesion to the lower wall is large, which is not conducive to the flow of particles and is easy to cause the accumulation of large particles. The viscosity values of [0.0445,0.4005]Pa·s were set. The particles used the point release mode, the initial oil pressure is 20 kPa, the inclination angle of the ferrogram slide is 0.5°, the distance between the oil tube and the ferrogram slide is 1.5 mm, the oil density is 1254 kg/m3. The velocity and displacement of wear particles with the sizes of 0.1–0.5 µm are shown in Figure 6.
The particle velocity and displacement under different oil viscosities: (a) at 0.0445 Pa·s, (b) at 0.06675 Pa·s, (c) at 0.1335 Pa·s, (d) at 0.267 Pa/s, and (e) at 0.4005 Pa·s.
From Figure 6, it can be known that the oil viscosity is a sensitive factor, the maximum velocity of wear particles with different sizes changes obviously, and the displacement changes greatly along the ferrogram slide length direction. At this time, the variation range of the drag force is large, which is a dominant factor, the velocity and displacement of wear particles decrease with the increase of the oil viscosity.
Effect of oil density
The oil density affects the buoyancy of wear particles. The buoyancy is too small to reach the expected displacement. If the buoyancy is too large, that is, the resultant force is too large, the large particles will accumulate. The oil density of [1075,1433]kg/m3 was used. The particles used the point release mode. The initial oil pressure is 20 kPa, the ferrogram slide inclination angle is 0.5°, the distance between oil tube and ferrogram slide is 1.5 mm, the oil viscosity is 0.1335 Pa·s. The velocity and displacement of wear particles with the sizes of 0.1–0.5 μm are shown in Figure 7.
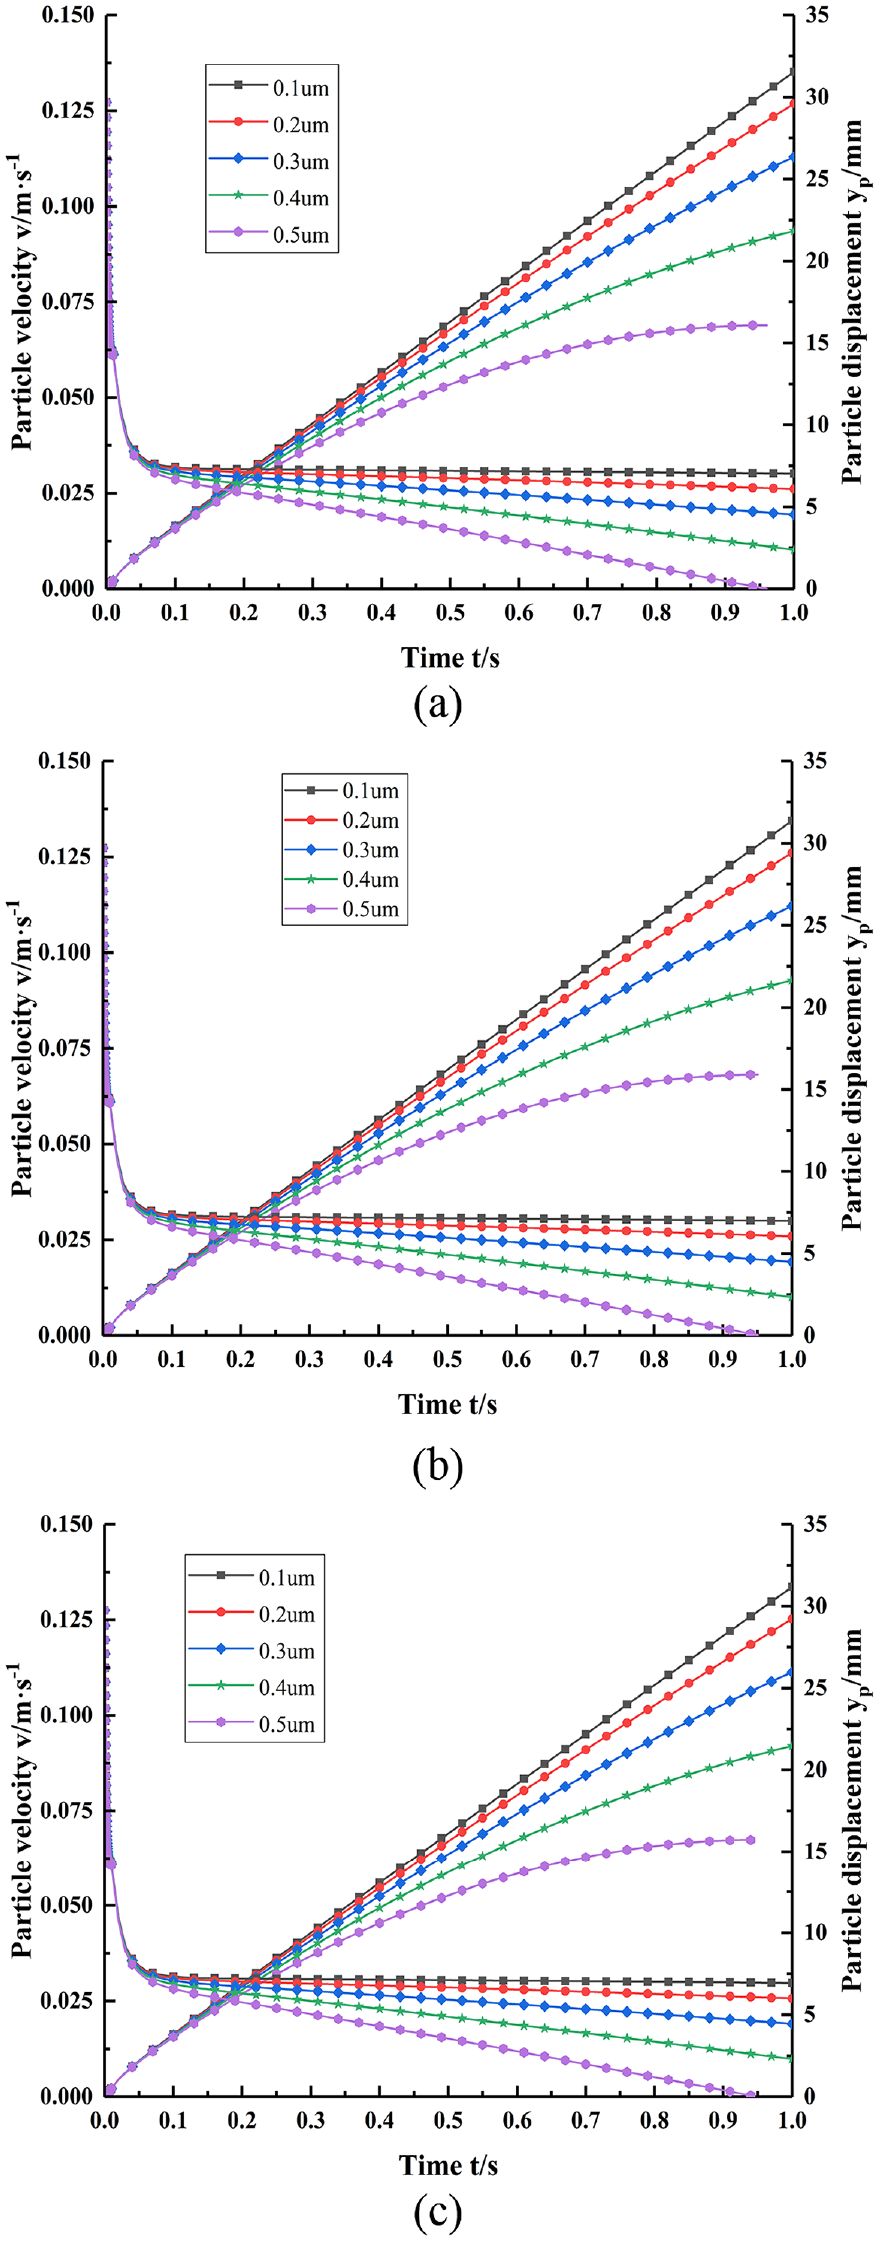
The particle velocity and displacement under different oil densities: (a) at 1075 kg/m3, (b) at 1254 kg/m3, and (c) at 1433 kg/m3.
From Figure 7, it can be seen that the oil density is an insensitive factor, the maximum particle velocity for different sizes hardly changes, and the displacement along the ferrogram slide length direction hardly changes. Because the oil density affects the buoyancy, and the buoyancy is not a dominant factor, so it has the little impact on the particle deposition behavior.
Effect of ferrogram slide inclination angle
The ferrogram slide inclination angle will affect the particle movement. The inclination angle is too small, the oil is not easy to flow, so the particle deposition can not achieve the expected effect. If the inclination angle is too large, the oil flows too fast, the particles may flow out of the ferrogram slide. Select [0.1,0.5]°, and calculate a group of results each 0.1°. The particles used the point release mode, the initial oil pressure is 20 kPa, the distance between the oil tube and the ferrogram slide is 1.5 mm, the oil viscosity is 0.1335 Pa·s, and the oil density is 1254 kg/m3. The velocity and displacement of wear particles with the sizes of 0.1–0.5 µm are shown in Figure 8.
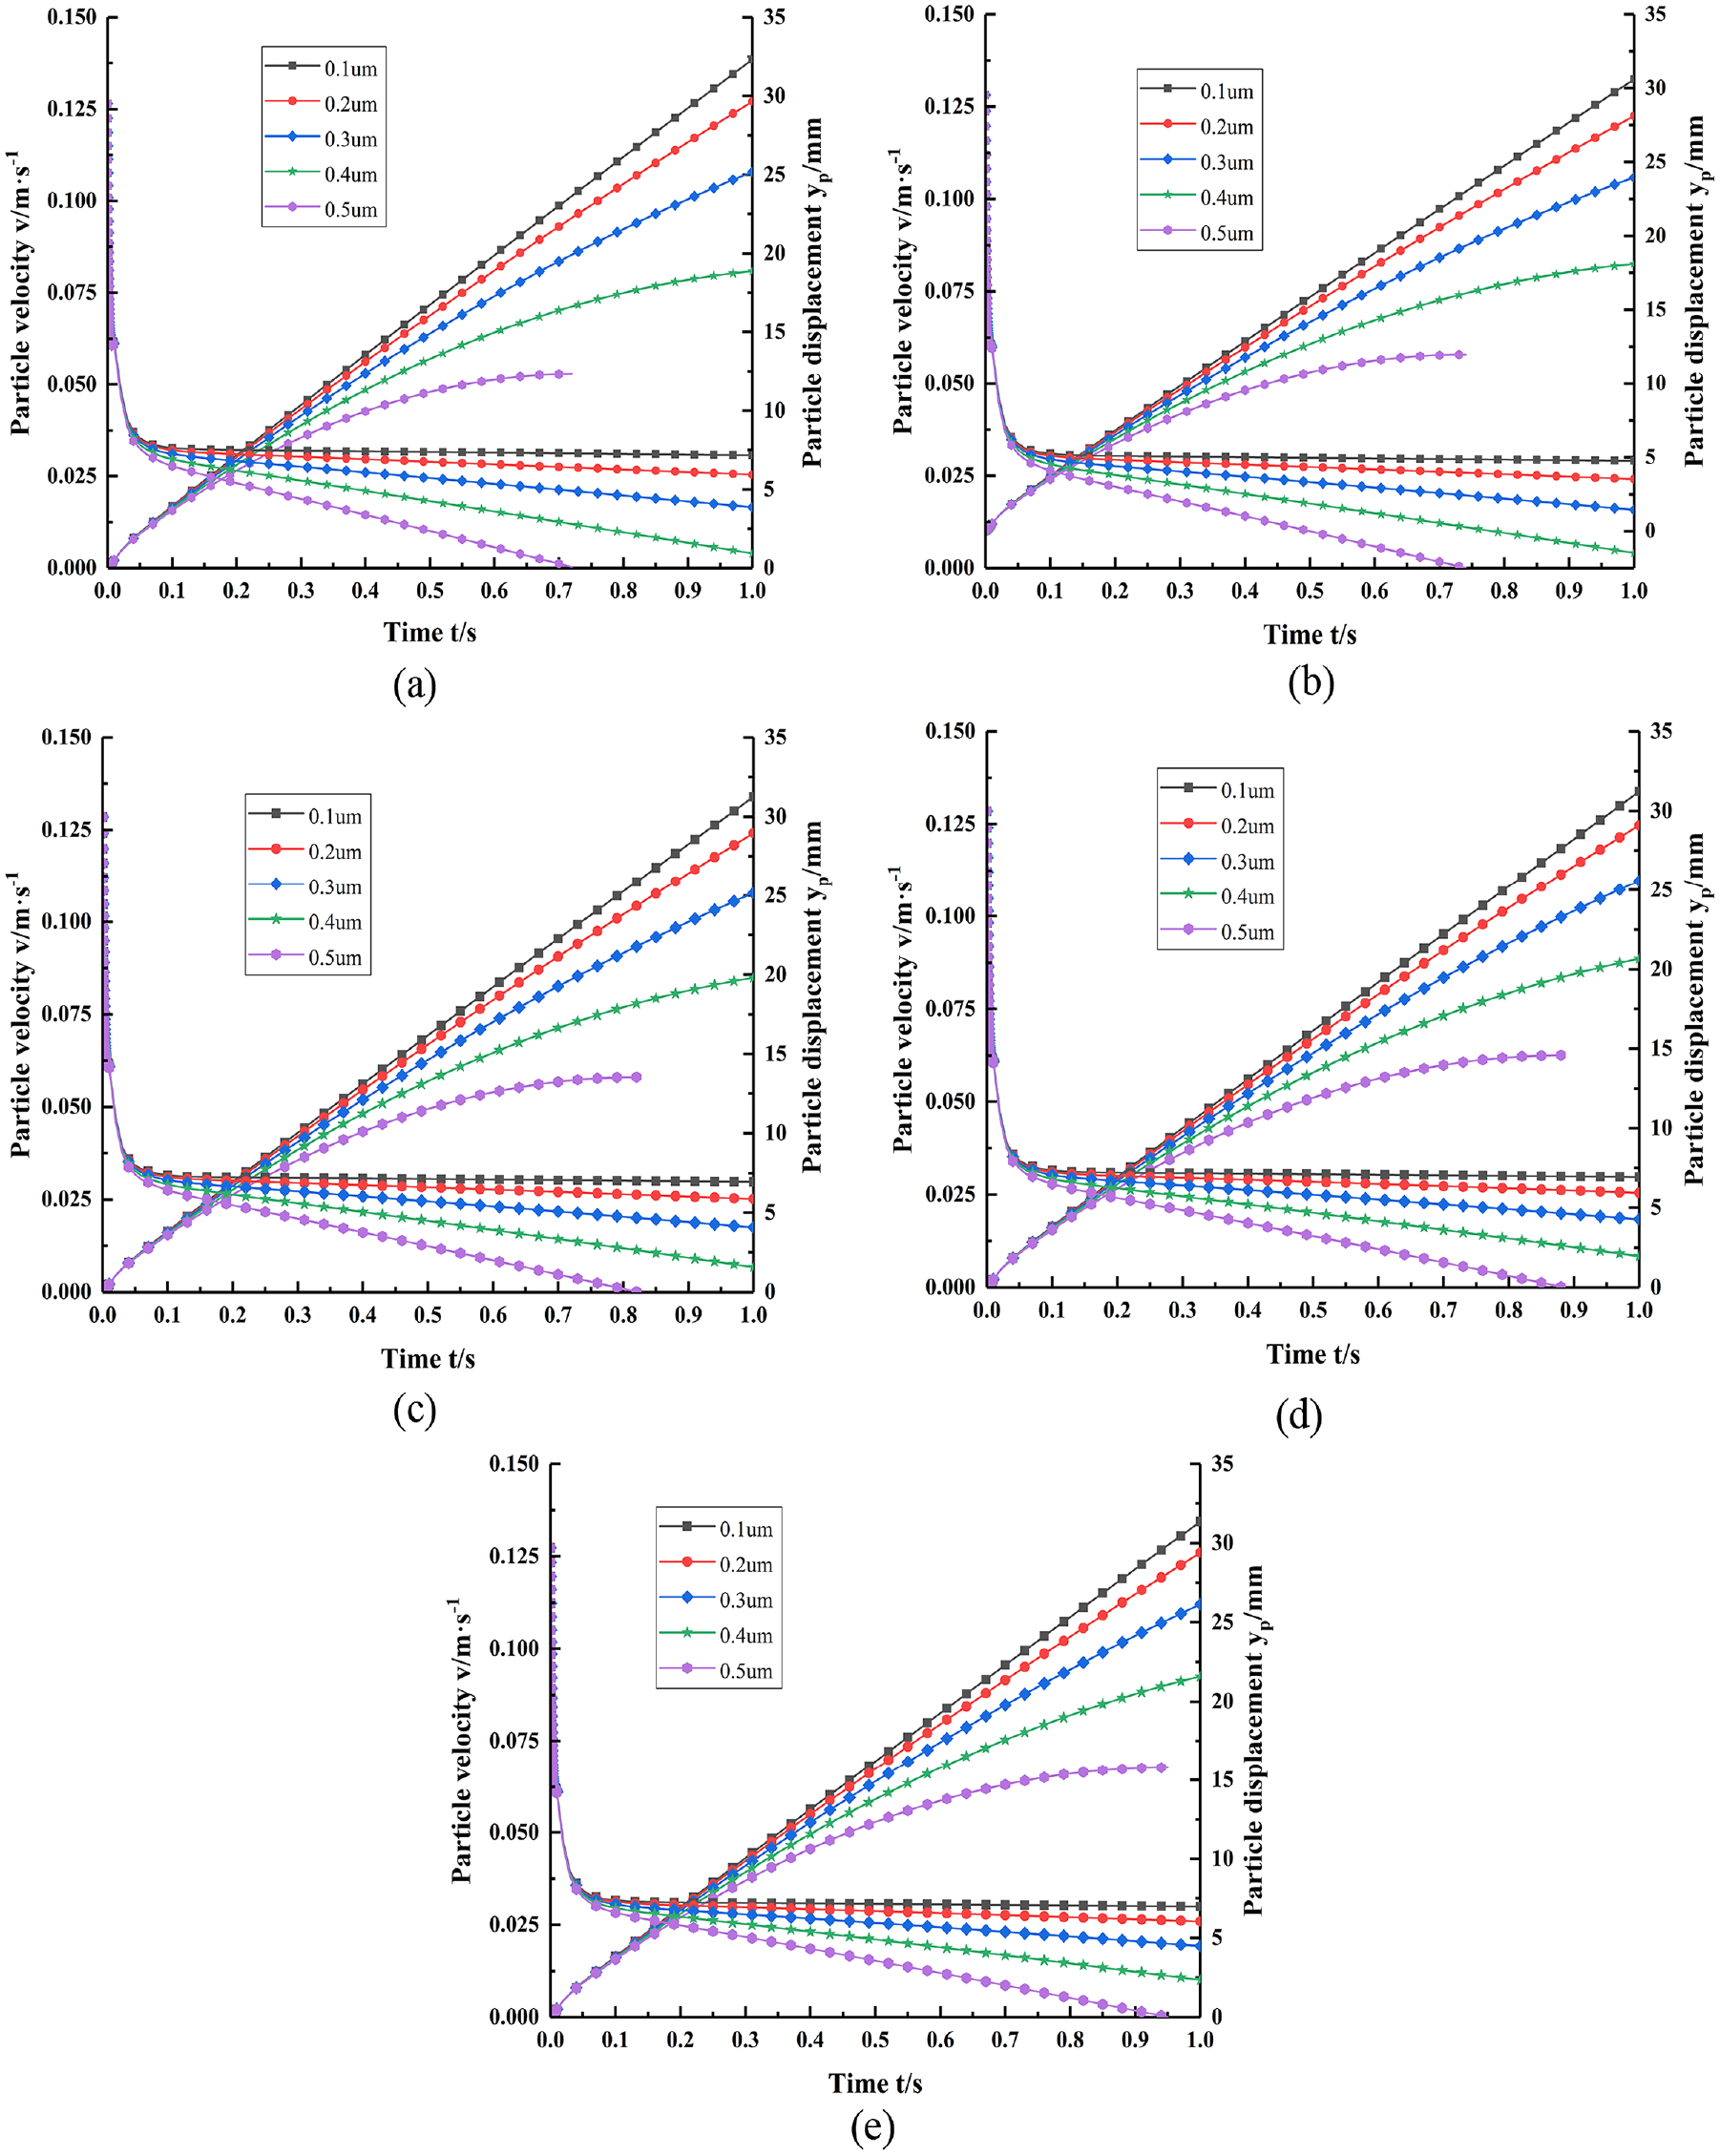
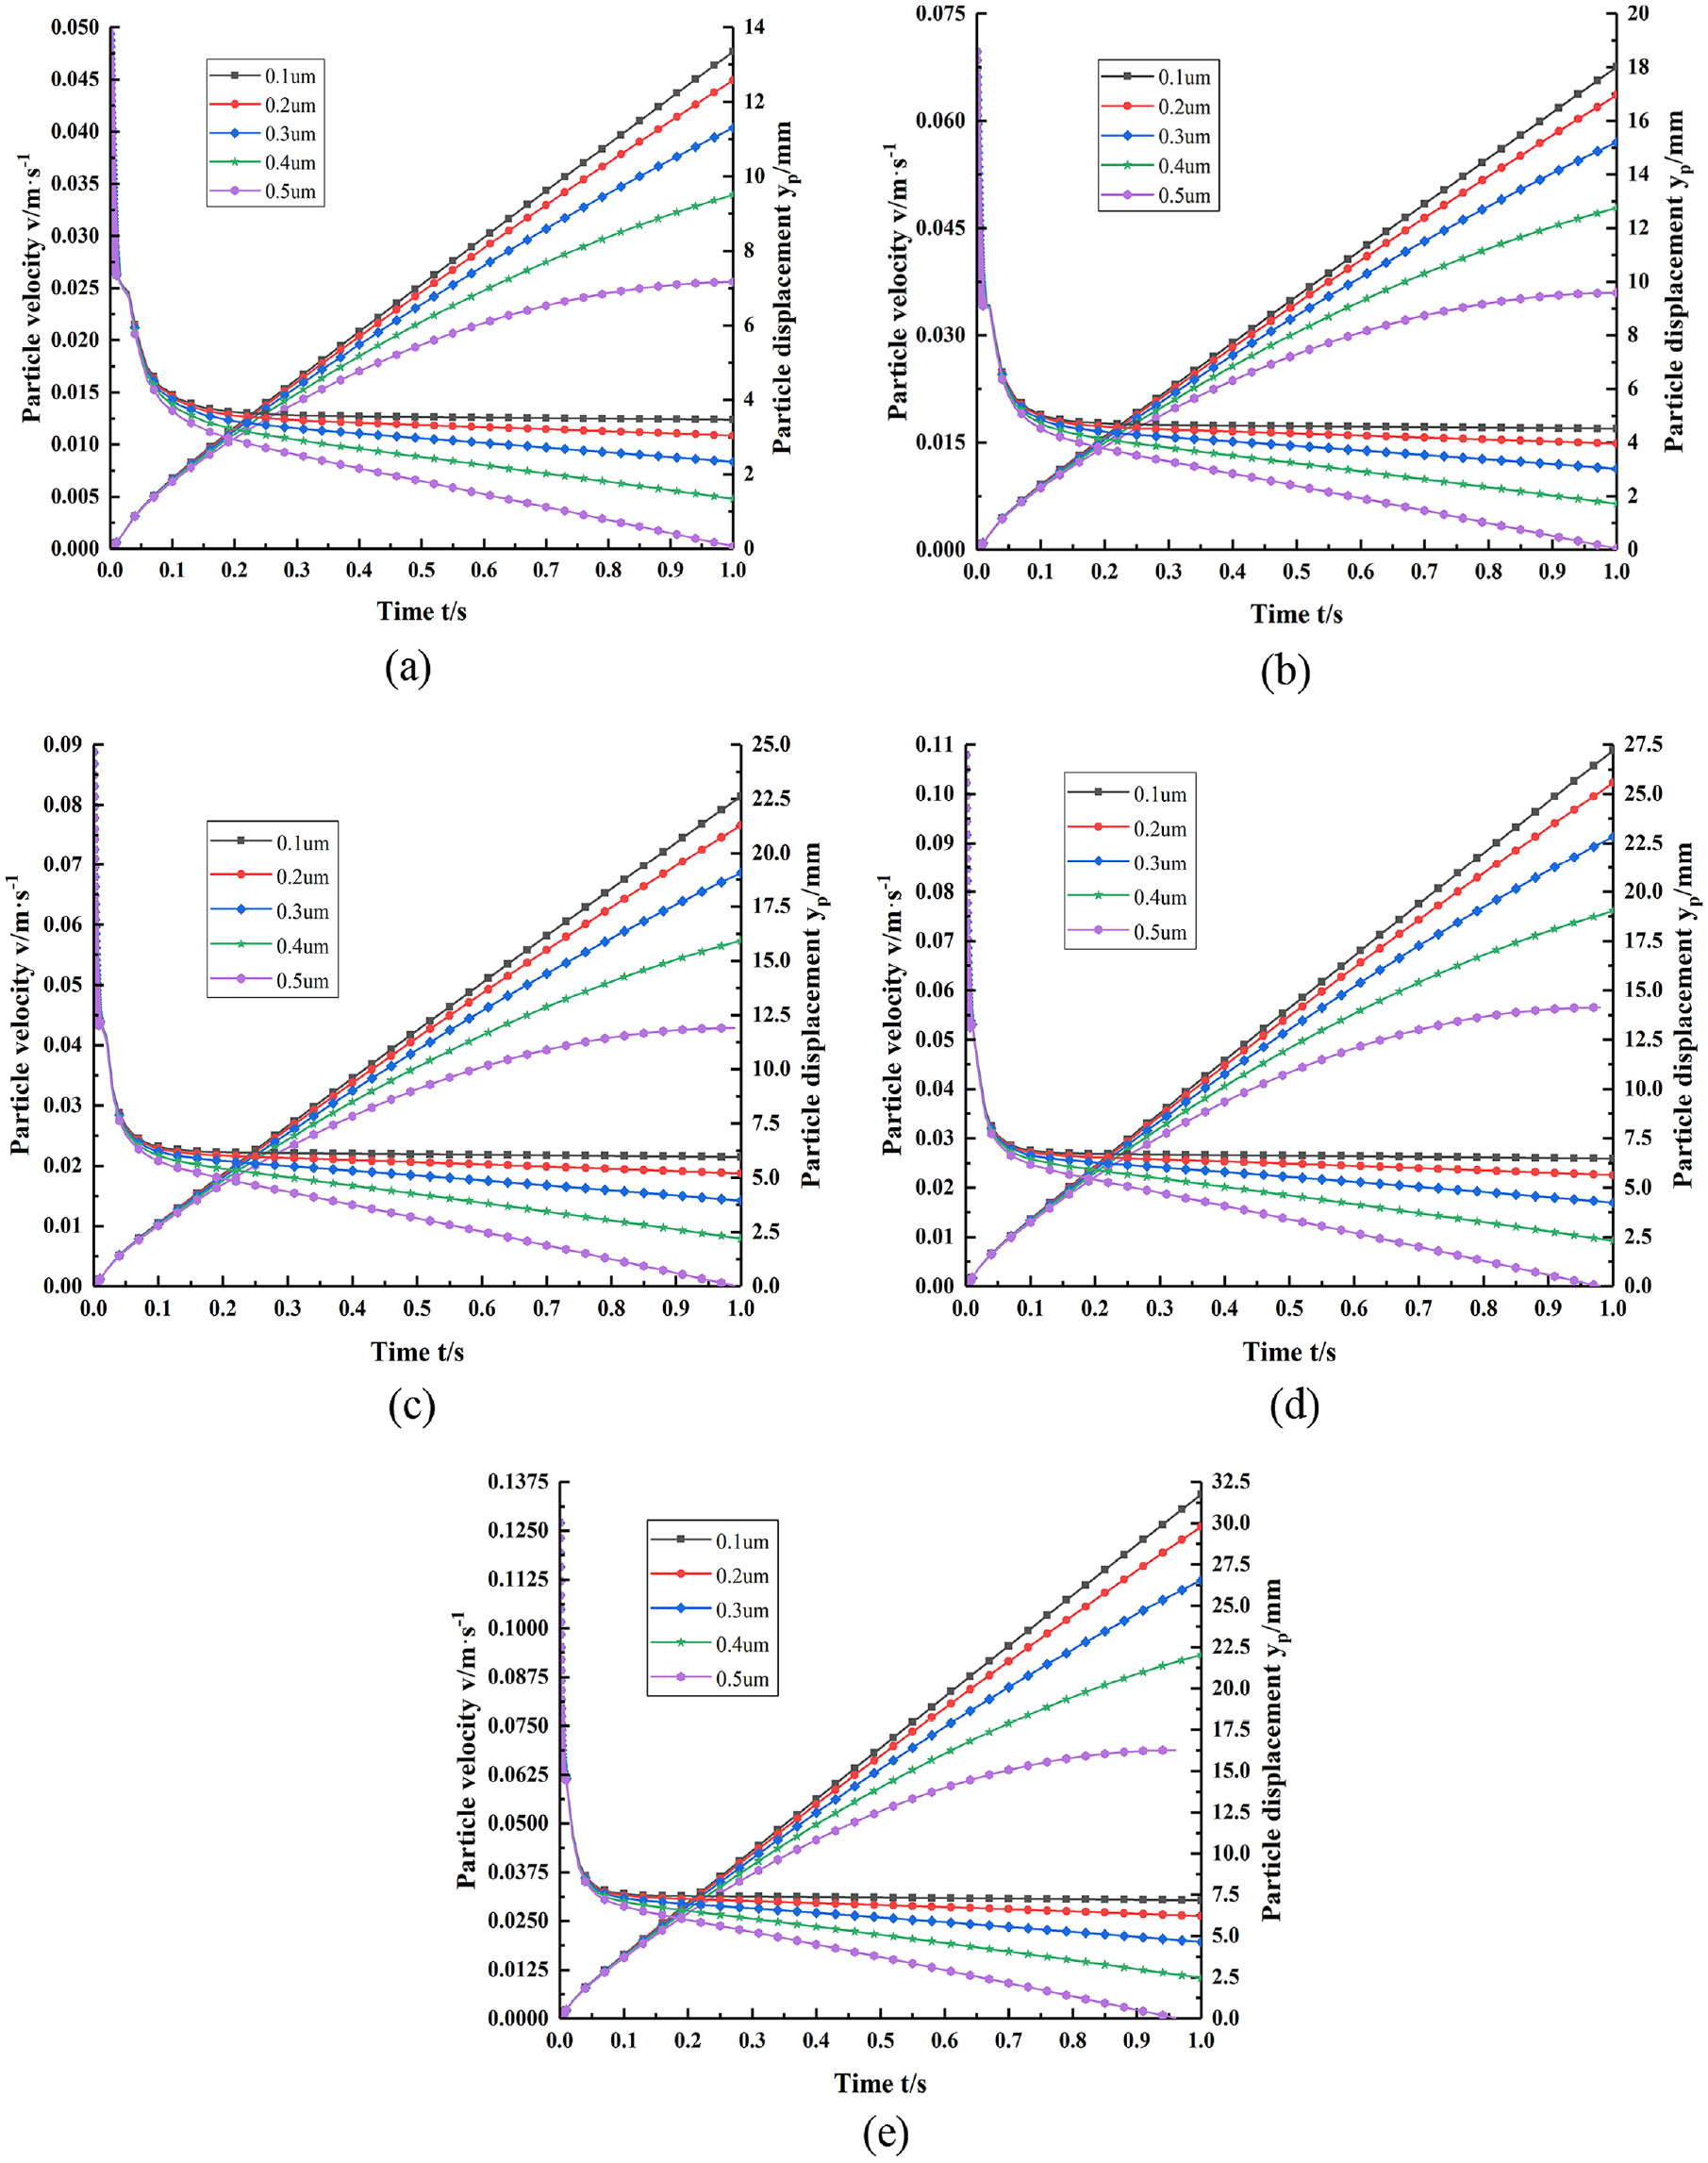
The particle velocity and displacement under different ferrogram slide inclination angles: (a) at 0.1°, (b) at 0.2°, (c) at 0.3°, (d) at 0.4°, and (e) at 0.5°.
From Figure 8, it can be seen that under the same conditions, the ferrogram slide inclination angle is an insensitive factor, the maximum particle velocity for different sizes hardly changes, and the displacement along the ferrogram slide length direction hardly changes. Because the angle change range is small, the magnetic field force hardly changes, so the resultant force hardly changes.
Effect of distance between oil tube and ferrogram slide
The distance between the oil tube and the ferrogram slide is also an important factor. If the distance is too close, the velocity of wear particles to the ferrogram slide is too fast to the inadequate magnetization of wear particles, and the energy lost in the air is large, which may lead to the particle deposition failure. Select [0.1,0.5]mm, and calculate a group of results each 0.1 mm. The particles used the point release mode, the initial oil pressure is 20 kPa, the ferrogram slide inclination angle is 0.5°, the oil viscosity is 0.1335 Pa·s, the oil density is 1254 kg/m3. The velocity and displacement of wear particles with the sizes of 0.1–0.5 µm are shown in Figure 9.
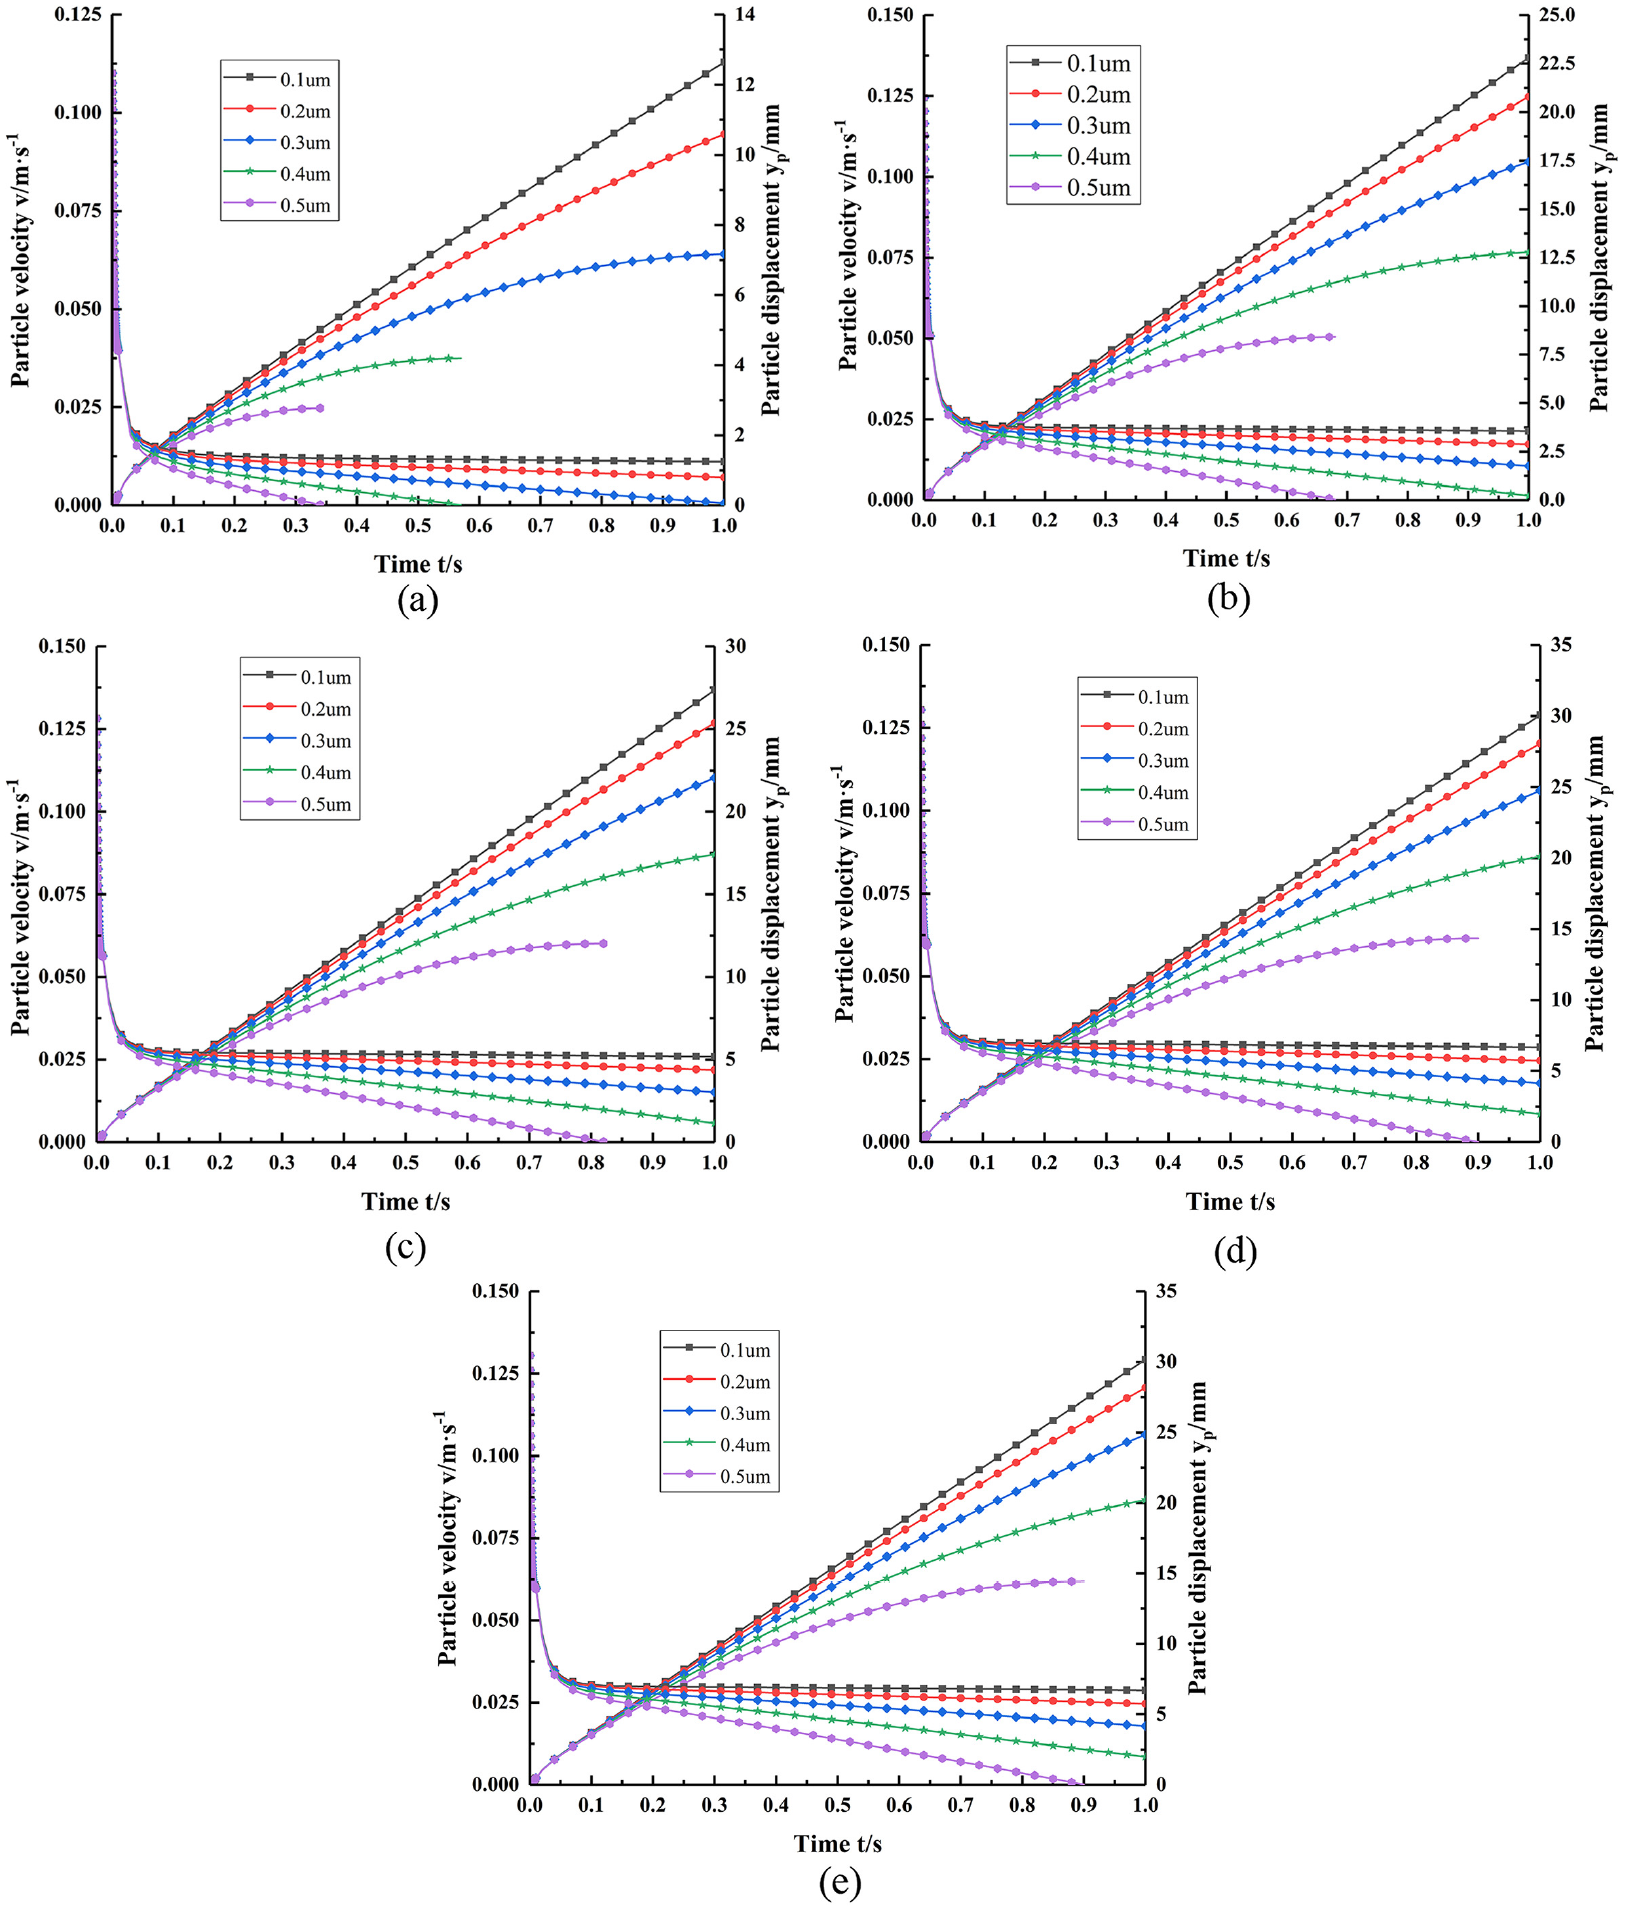
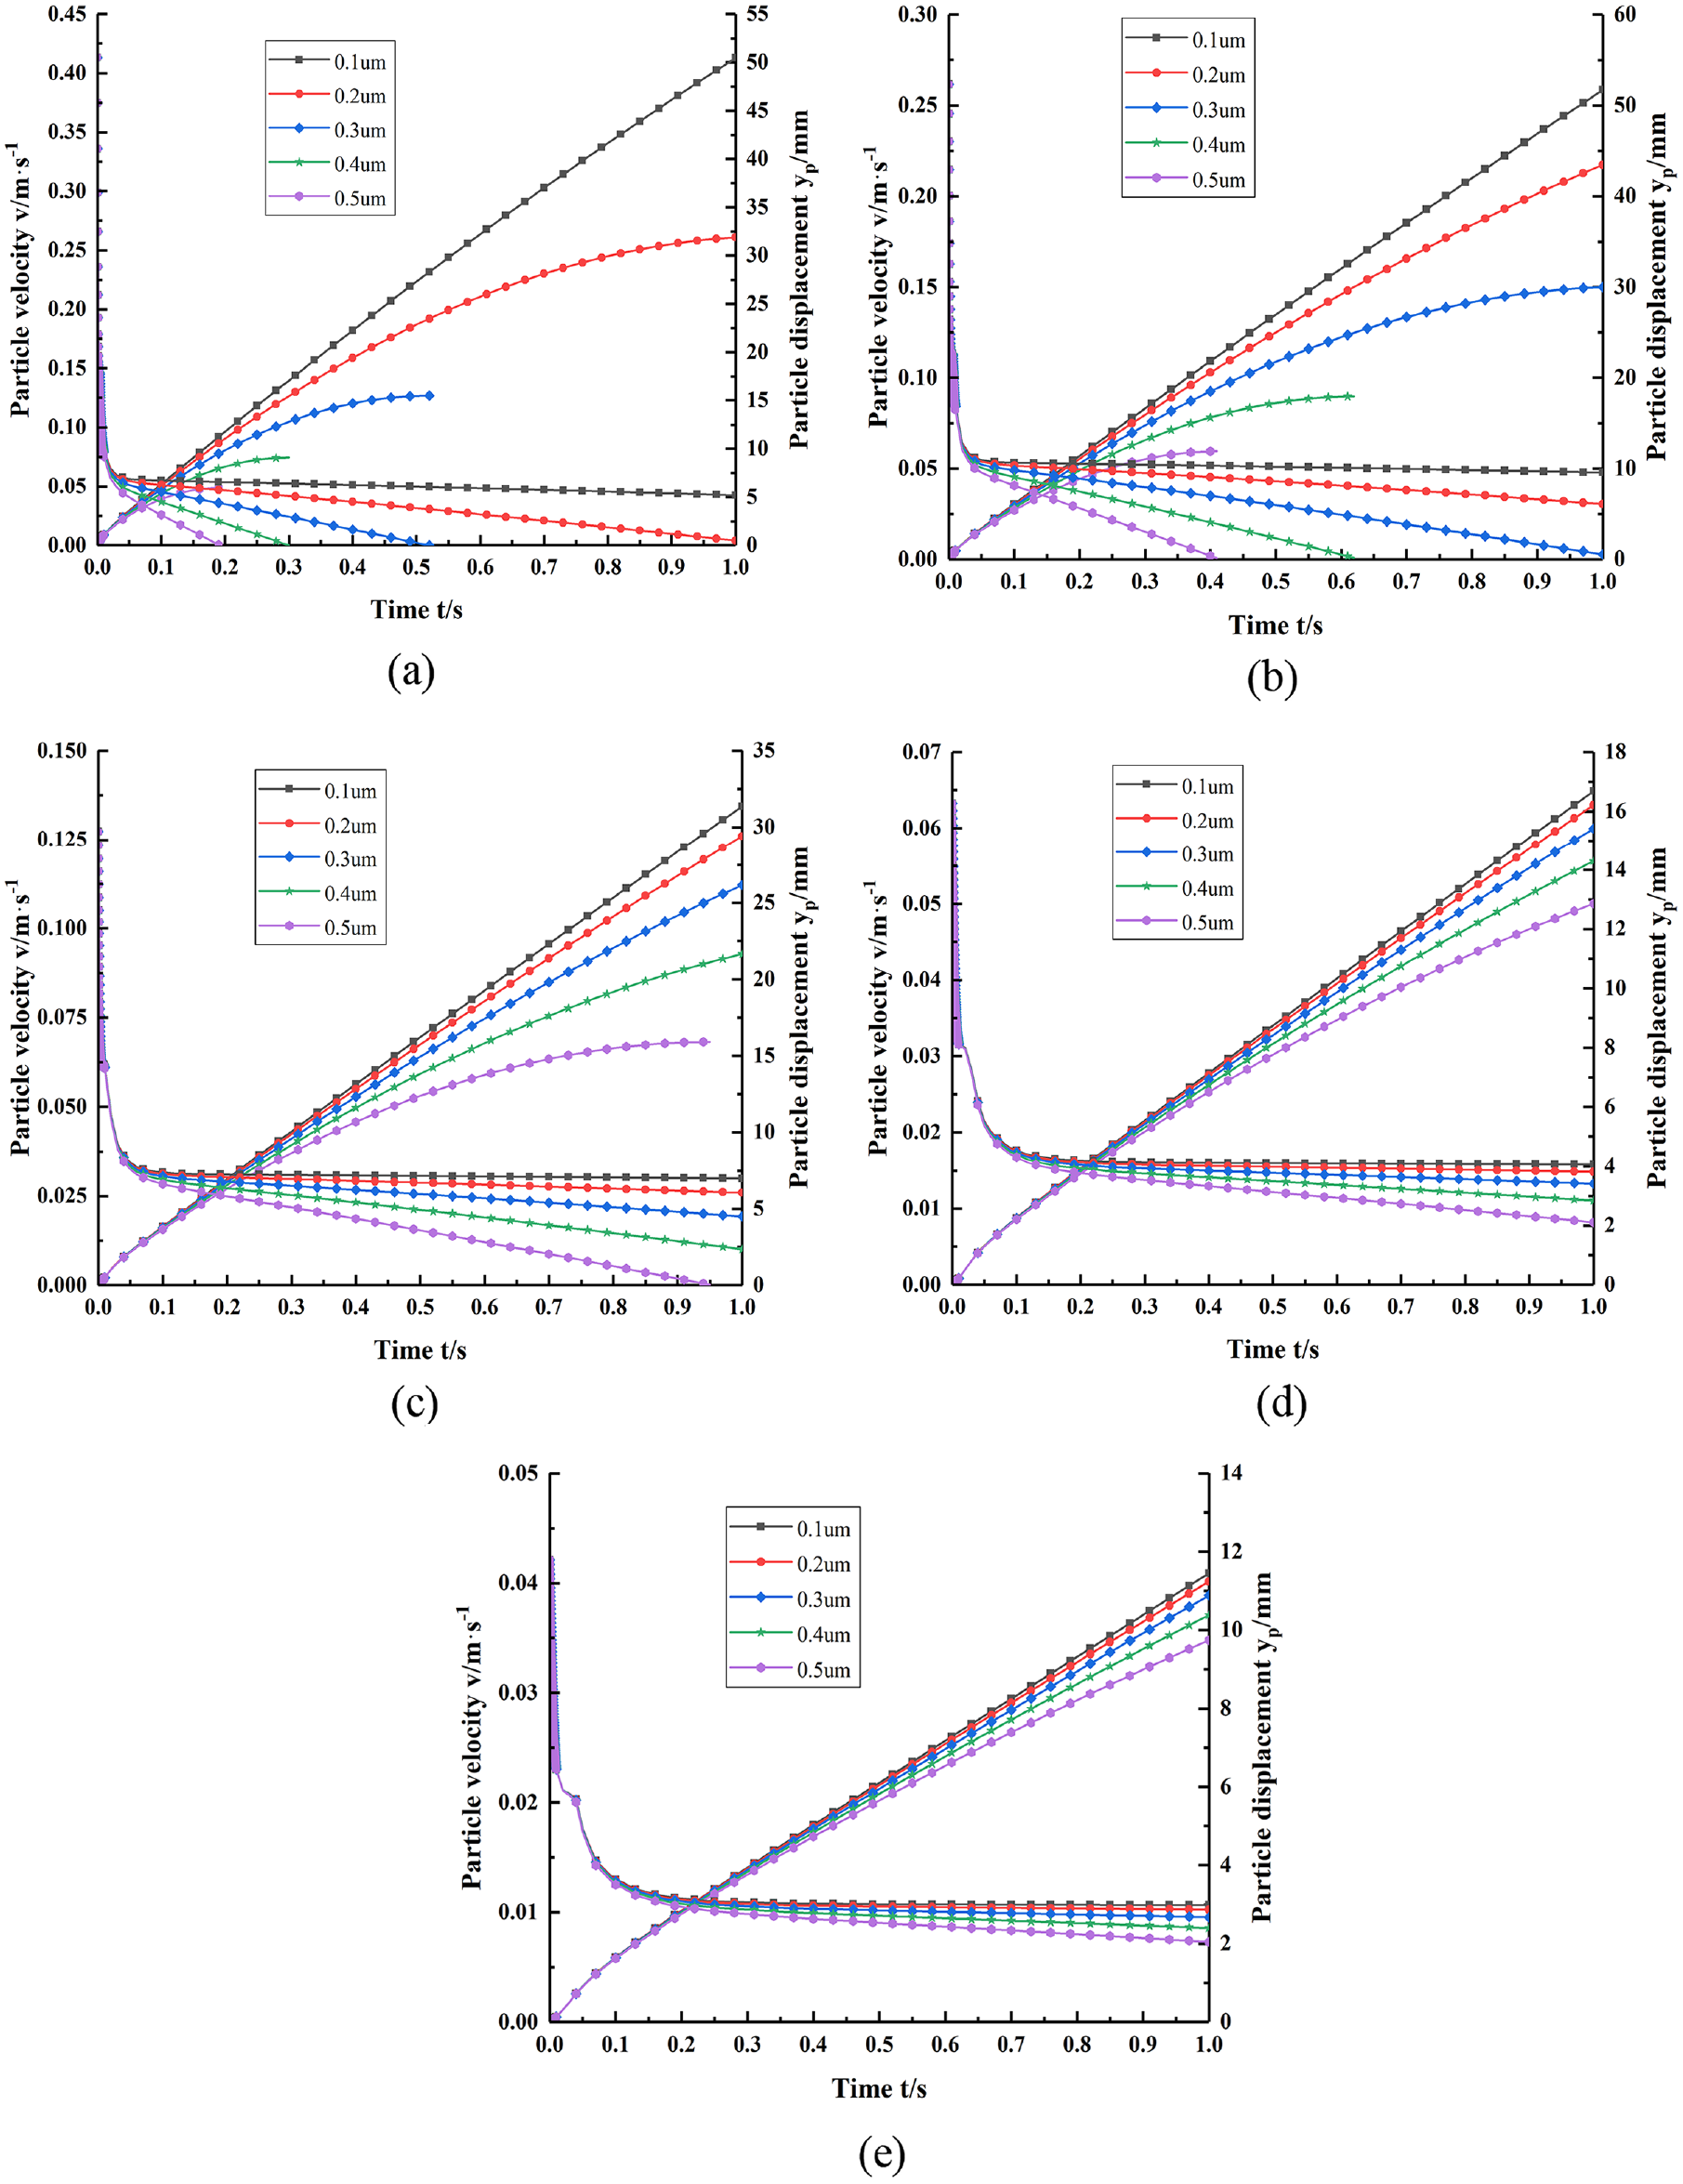
The particle velocity and displacement under different distances between the oil tube and the ferrogram slide: (a) at 0.1 mm, (b) at 0.2 mm, (c) at 0.3 mm, (d) at 0.4 mm, and (e) at 0.5 mm.
From Figure 9, it can be seen that under the same conditions, the distance between the oil tube and the ferrogram slide is a sensitive factor, and the maximum particle velocity for different sizes is almost unchanged. Relatively speaking, the displacement along the ferrogram slide length direction varies widely, increases with the increase of the distance between the oil tube and the ferrogram slide, and hardly changes after 0.5 mm.
Effect of particle release mode
In practice, the particle release mode is uncontrollable, and the different modes affect the particle movement. In this paper, two release modes of the point and circular surface were considered. The initial oil pressure is 20 kPa, the ferrogram slide inclination angle is 0.5°, the oil viscosity is 0.1335 Pa·s, the oil density is 1254 kg/m3, the distance between the oil tube and the ferrogram slide is 1.5 mm. The velocity and displacement of wear particles with the sizes of 0.1–0.5 µm are shown in Figure 10.
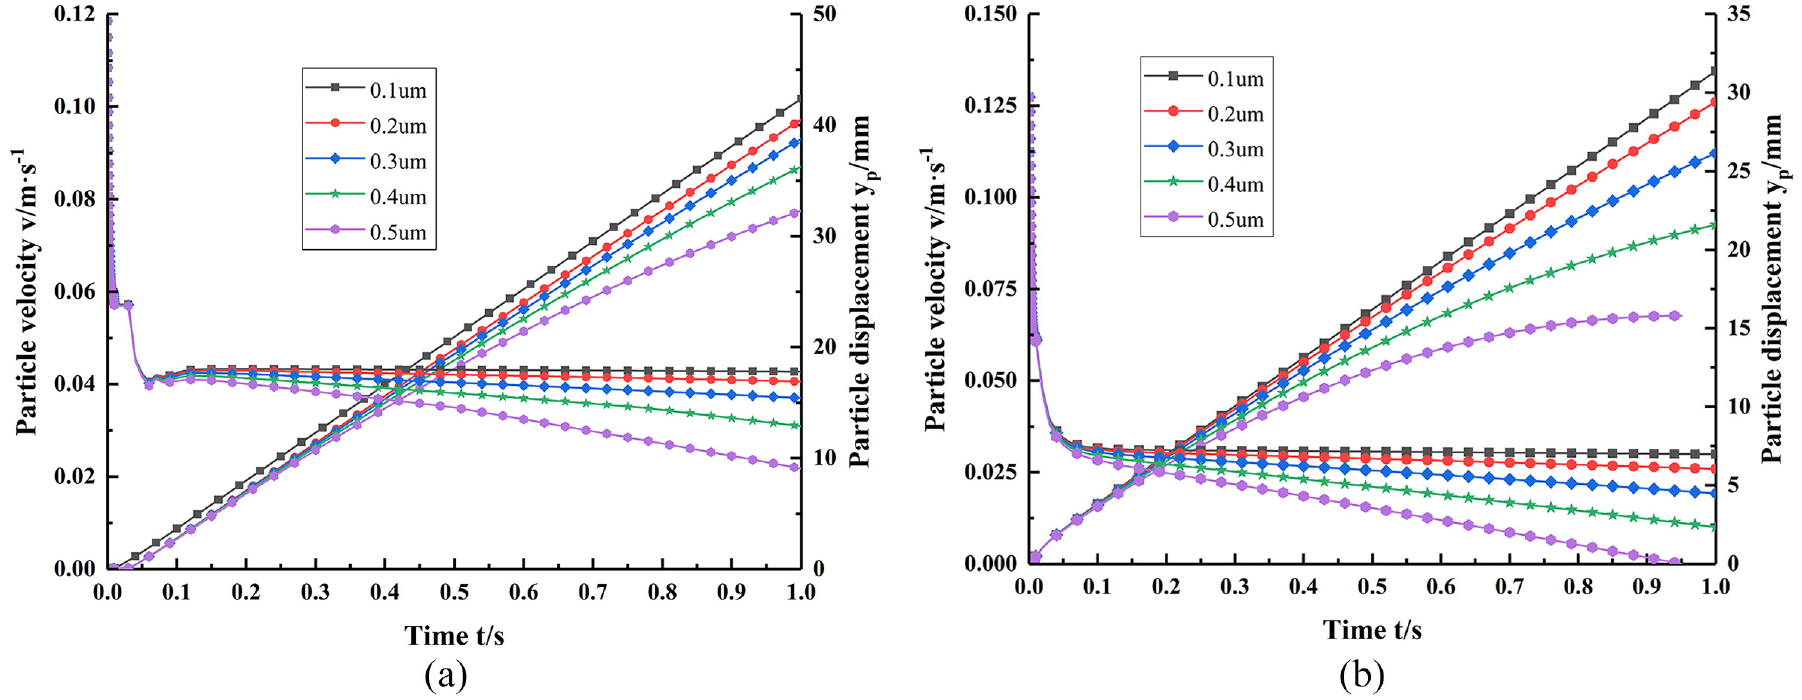
The particle velocity and displacement under different particle release modes: (a) under circular surface release mode and (b) under point release mode.
From Figure 10, it can be seen under the same conditions, when the particle release from a circular surface, the nonlinear increase of the velocity and displacement for different sizes lags behind that of point release, and the non-linearity is obvious at 0.5 µm. The particle velocity and displacement for different sizes are more concentrated, which can be clearly distinguished only at 0.5 µm. The maximum velocity changes widely.
Analysis results
Based on the above analysis, it is known that the ideal values of the initial oil pressure, the oil viscosity, the oil density, the ferrogram slide inclination angle, the distance between the oil tube and the ferrogram slide and the particle release mode are summarized in Table 1.
The ideal parameter range of particle deposition.
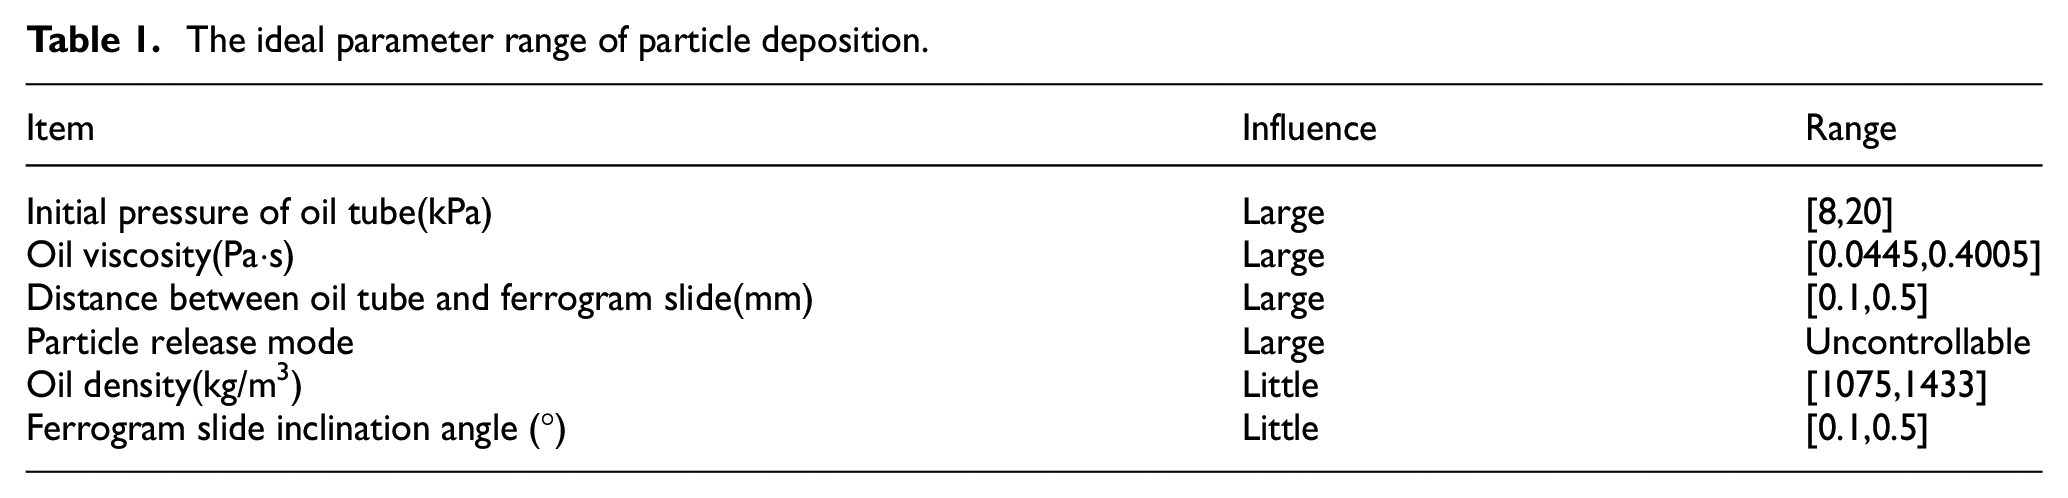
It can be seen from Table 1 that among six parameters, the initial oil pressure, the oil viscosity, the distance between oil tube and ferrogram slide and the particle release mode are four sensitive factors, they should be carefully set when preparing a particle ferrogram image. The particle release mode is an unregulated factor in practice, but vicariously the uniform distribution of particles in the oil by means of heating and oscillation can be done. The oil density and the ferrogram slide inclination angle are the insensitive factors, which have the little effect on the particle deposition result, they can be reasonably set according to the operation try.
Experiments
Test rig and setting
The experiments were done by an analytical ferrograph system, 3 as show in Figure 11. The test rig consists of a ferrograph instrument, a heating oscillator, a heating drier, a microscope and a computer. The ferrograph instrument was used for the preparation of ferrogram, which is the research object of this work. The microscope and PC combine to capture the ferrographic image. The heating oscillator is used to make wear particles evenly distributed in the oil by the heating and mechanical oscillations. The heating drier is used to volatilize the residual oil on the ferrogram slide quickly. The tested oil is taken from a gearbox in the laboratory. In the experimental parameter setting of the used ferrograph instrument, the initial oil pressure was 8 kPa, the inclination angle of the ferrogram slide was 2° and the distance between the oil tube and the ferrogram slide was 1.5 mm. Here, the inclination angle of the ferrogram slide was first set to 2°, thus the distance between the oil tube and the ferrogram slide was accordingly magnified to 1.5 mm. The aim of the following experiments is to verify the effect of wear particle size and oil viscosity on the deposition behavior of wear particles.
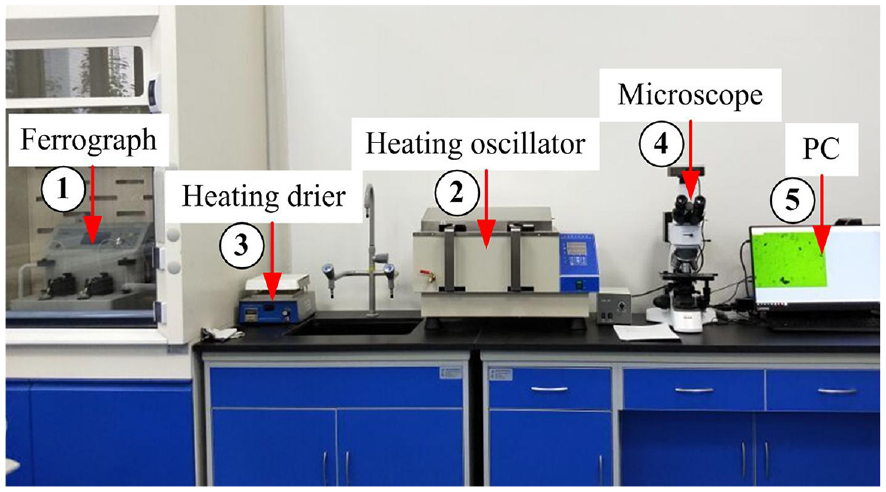
The test rig.
Size extraction method of wear particles
The size of wear particles is evaluated by the measurement of their geometric dimensions. For the size measurement of wear particles, this paper uses the area and perimeter of wear particles as the evaluation indexes. First, the gray processing of the particle ferrographic image is completed, and then the binarization operation is carried out. Second, the binary image is morphologically processed, that is, the image is opened and closed. The ferrographic image of wear particles after the above processing is shown in Figure 12.
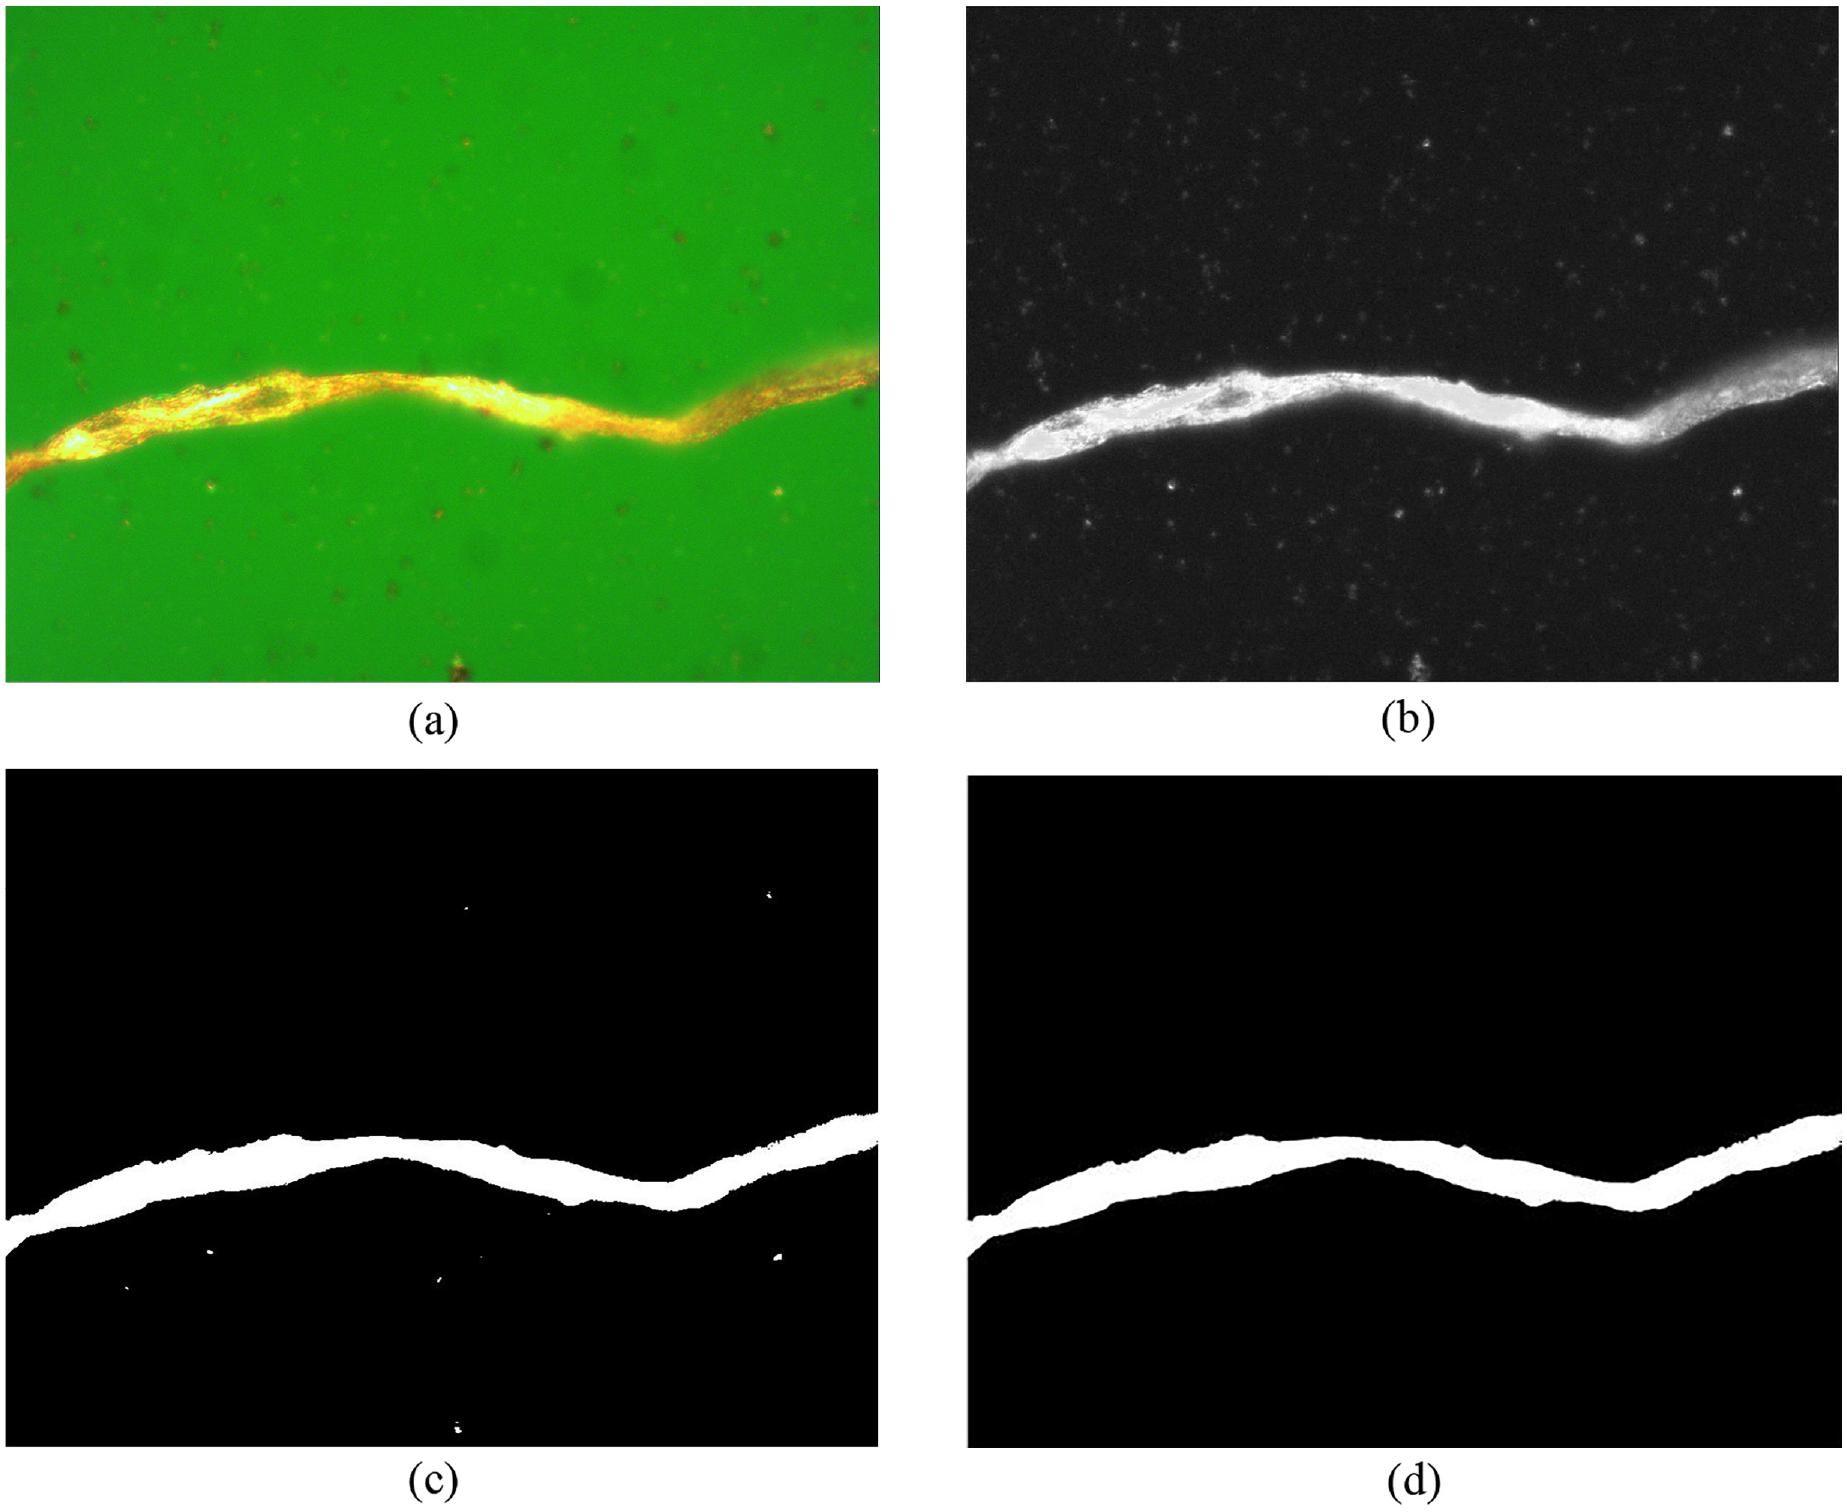
The processing of wear particle image: (a) original image, (b) gray image, (c) binary image, and (d) morphology image.
In this paper, the open operation is used to delete the objects with small pixels, and the region with 2000 connected pixels in the binary image is deleted. Each connected domain is marked and measured by using the regionppos function and bwlabel. After calling the relevant function, the size of each connected domain is calculated. The detection results are shown in Figure 13, with an area of 259,215 pixels and a perimeter of 5987.654 pixels.
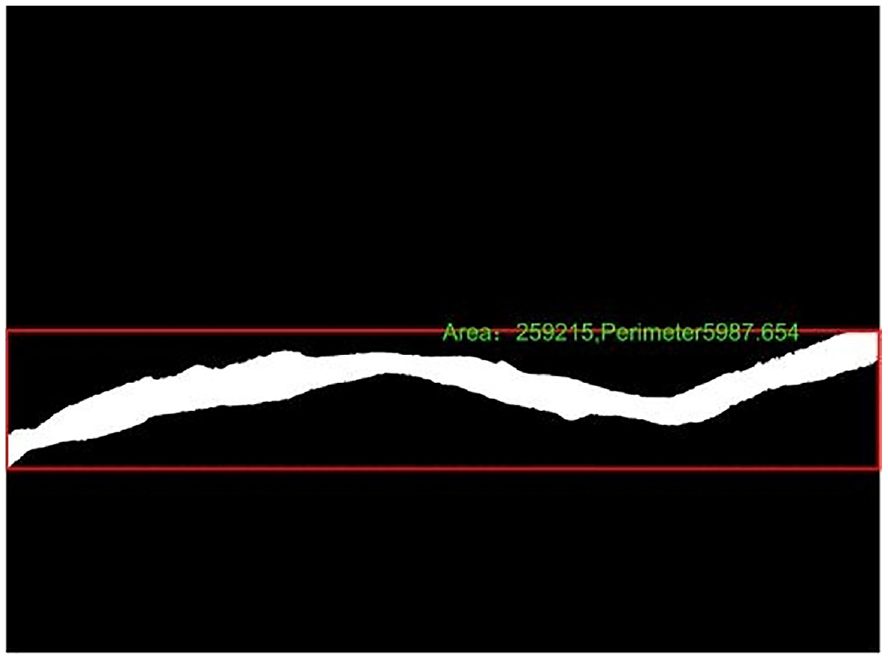
The area and perimeter of wear particle.
Verification of wear particle deposition law
Effect test of wear particle size
In order to more intuitively verify the obtained law that the large wear particles are deposited first and the small wear particles are deposited later. In this paper, according to the above image processing method, the wear particle ferrogram samples are selected, and the ferrographic images are observed from the ferrogram slide inlet to the outlet. The wear particle images after the gray-scale, binarization and morphological closed operation are shown in Figure 14. It can be seen that the area of wear particles at the inlet is 236,349 pixels and the perimeter is 5833.148 pixels. The particle area in the middle is 97,206 pixels and the circumference is 1235.549 pixels. The particle area at the outlet is 7191 pixels and the perimeter is 465.544 pixels. The deposition law of wear particles on the ferrogram slide is confirmed, that is, the large particles are first deposited near the inlet, and the small particles are deposited near the outlet later.
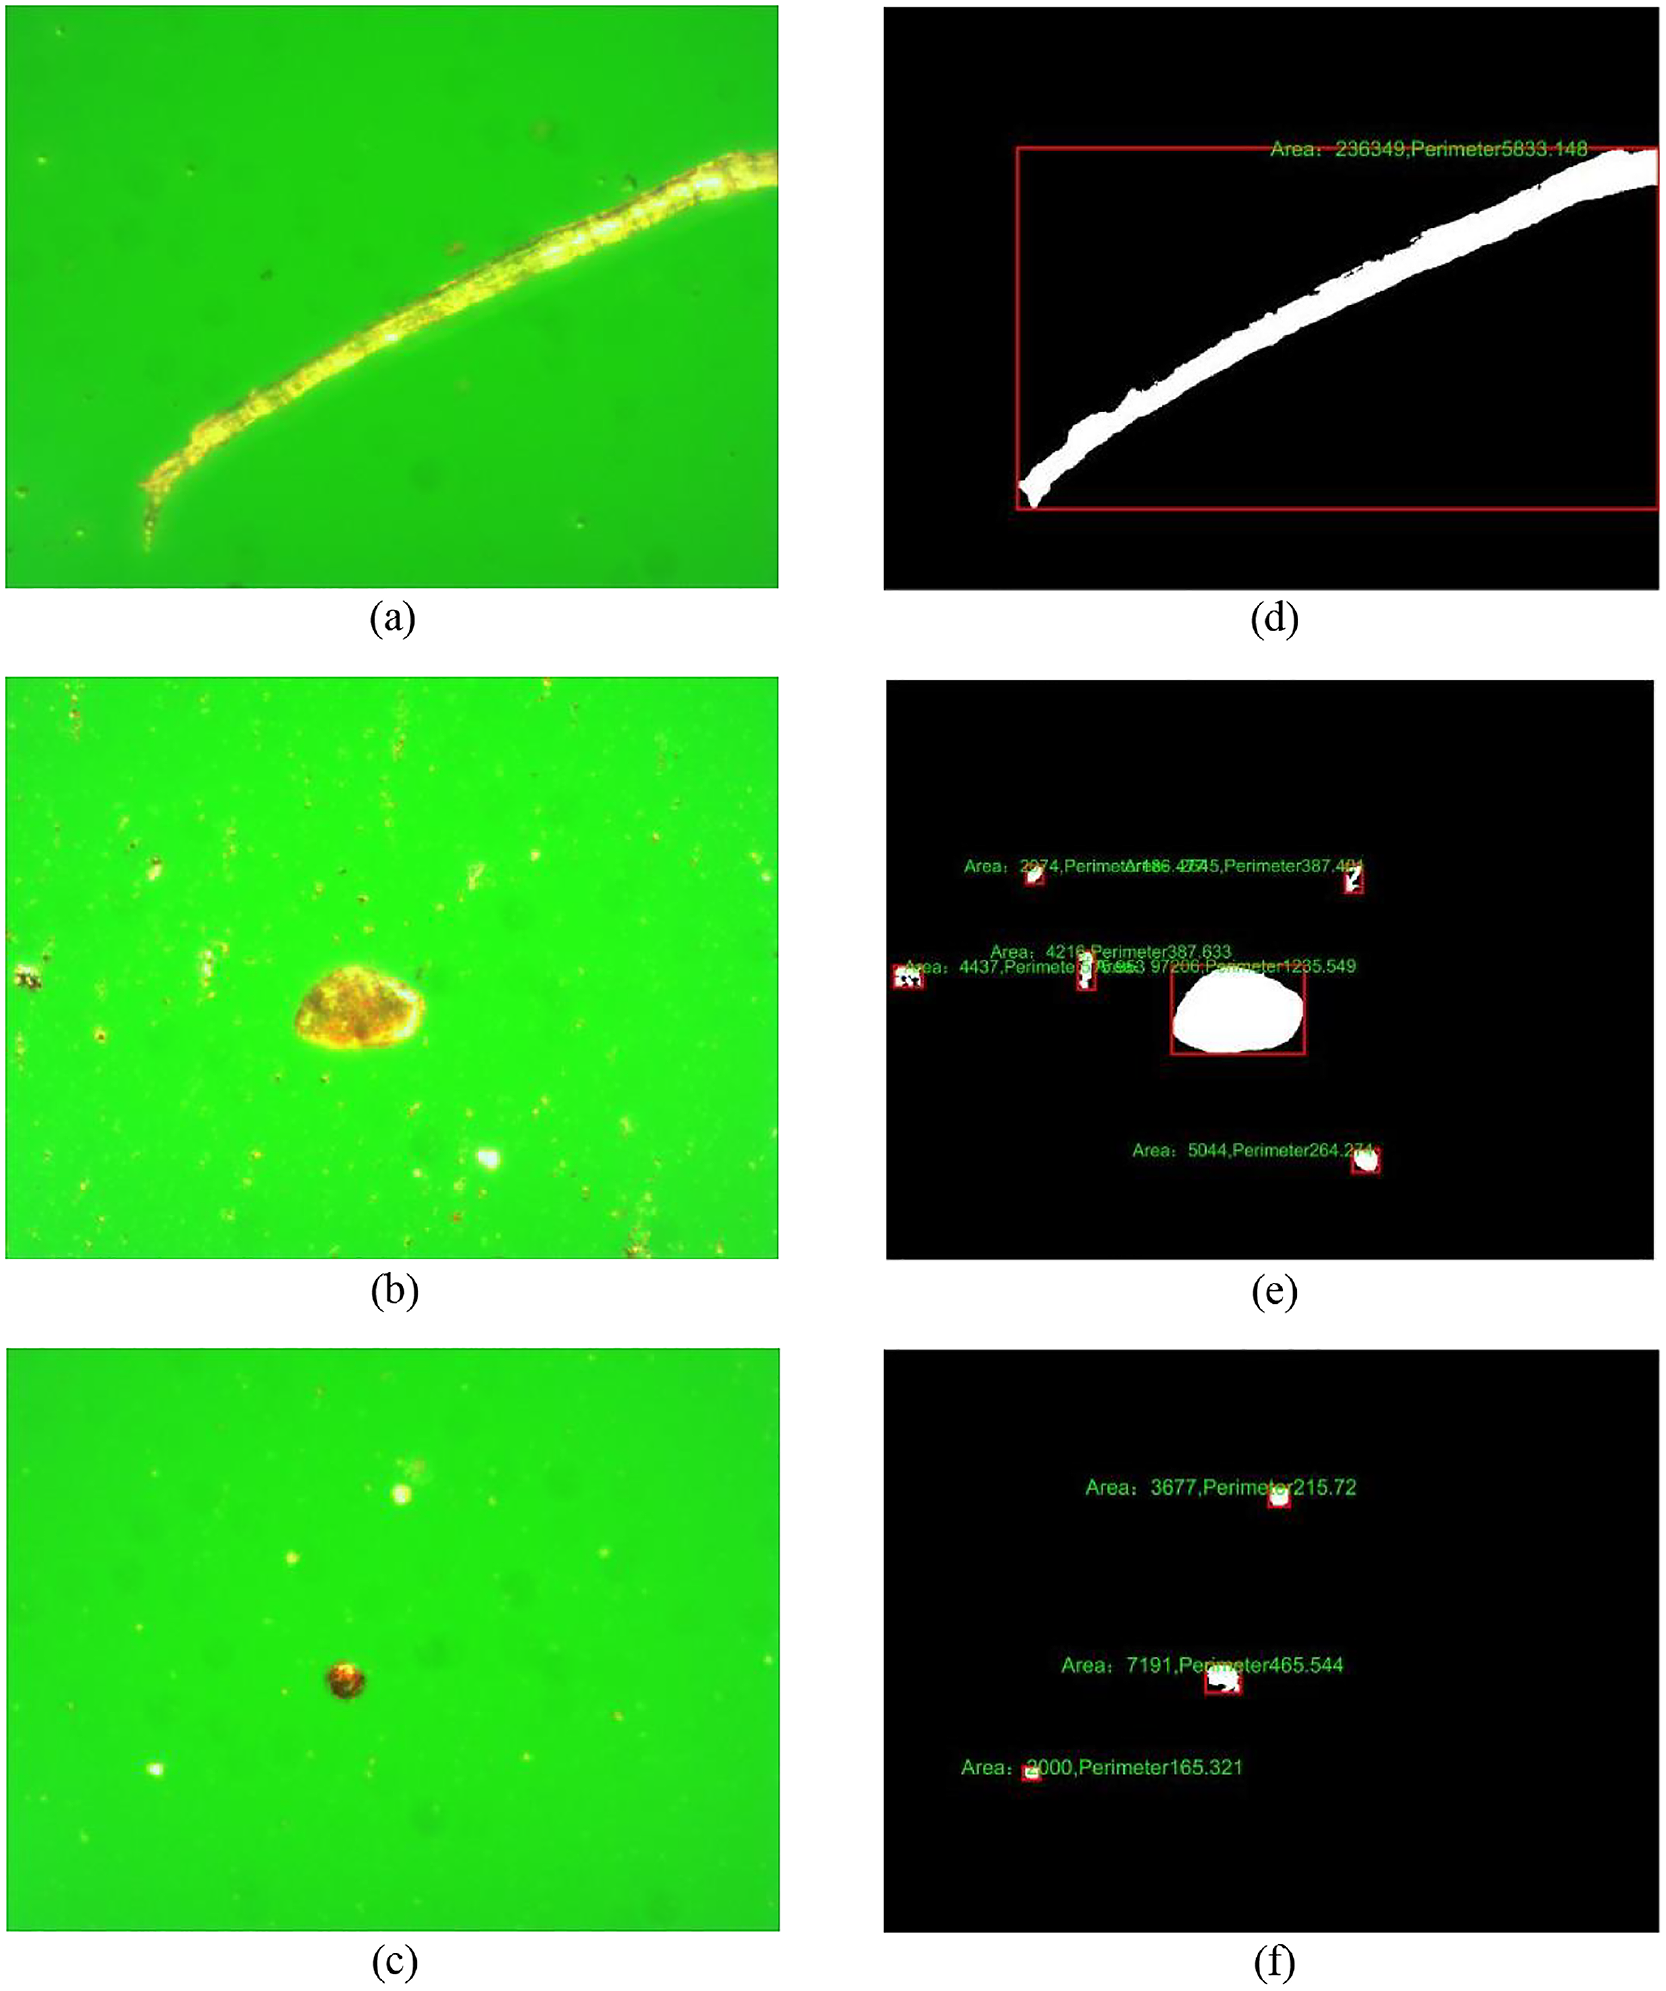
The wear particle image area and perimeter from the inlet to outlet of the ferrogram slide: (a) original image at the inlet, (b) original image in the middle, (c) original image at the outlet, (d) particle size at the inlet, (e) particle size in the middle, and (f) particle size at the outlet.
Effect test of oil sample viscosity
In order to verify the rationality of the ferrogram preparation result, the oil viscosity was selected as the adjustable factor. Two oil samples with different viscosity were used for the test. The first is the undiluted oil sample without the tetrachloroethylene, its tested image is shown in Figure 15(a), and the second is the diluted oil sample with the tetrachloroethylene in 3:1 volume ratio of the oil to the tetrachloroethylene, its tested image is shown in Figure 15(b). It can be seen from Figure 15 that because the oil viscosity affects the movement velocity of wear particles the wear particles from the undiluted oil show the adhesion phenomenon, while those from the diluted oil show no adhesion. It is proved that the oil viscosity greatly affects the distribution result of wear particles on the ferrogram slide and the low viscosity can effectively reduce the adhesion or even accumulation of wear particles.
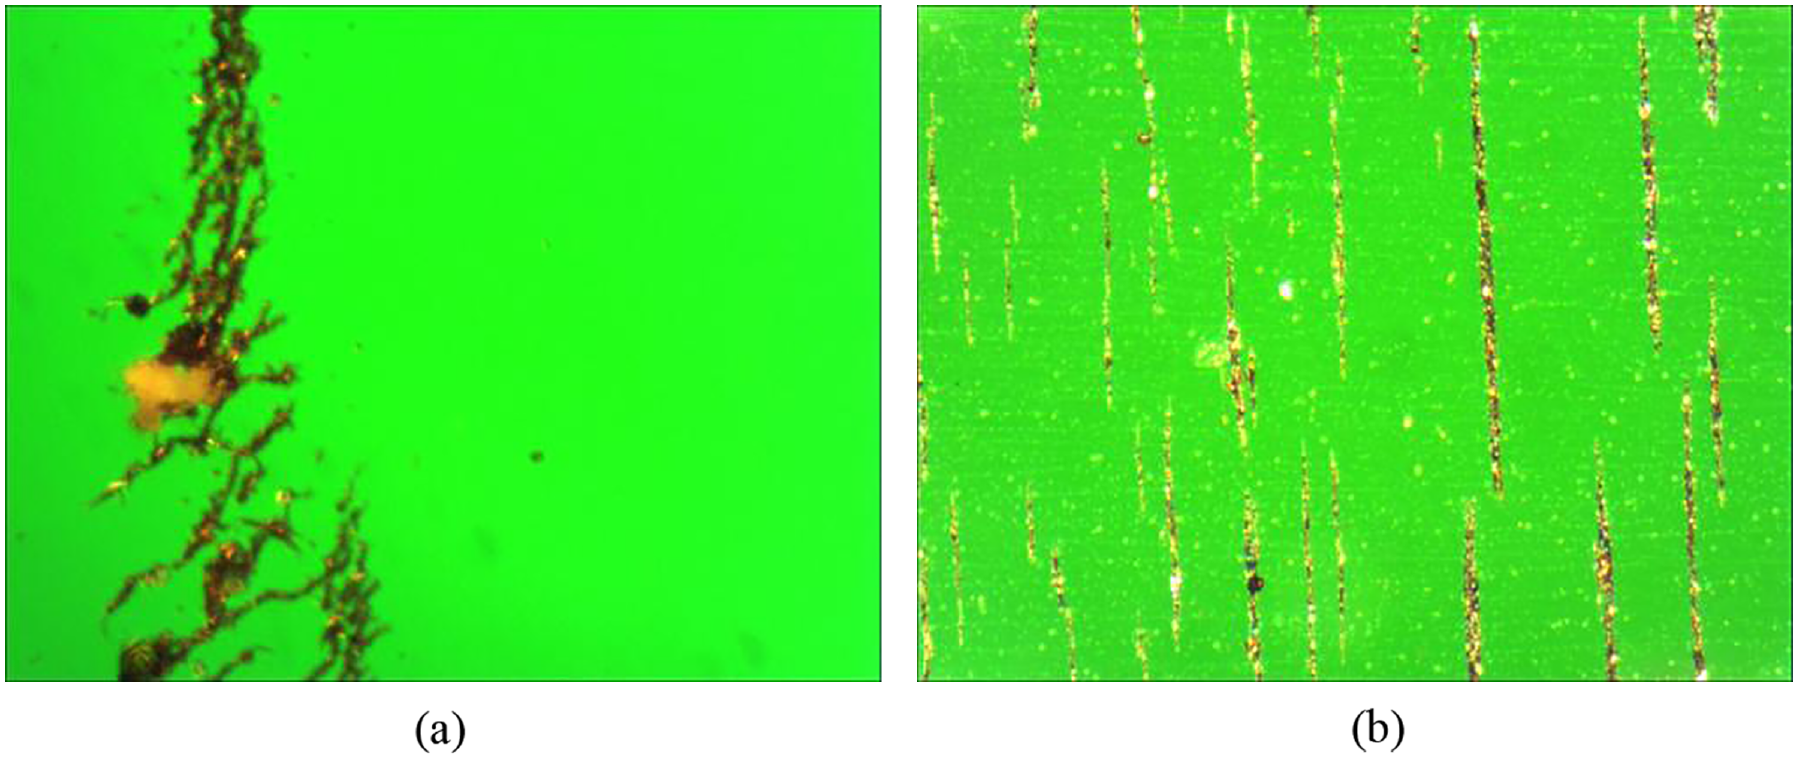
The ferrographic images for the oils with different viscosities: (a) particle adhesion for undiluted oil and (b) no particle adhesion for diluted oil.
Conclusions and future works
The coupled finite element simulation of the wear particle deposition behavior considering the magnetic, fluid and solid field in an analytical ferrograph instrument is carried out. The deposition law of wear particles is quantitatively revealed, and the reasonable range of main parameters and the sensitive parameters are determined. In the experiments, the area and perimeter of wear particle are selected to measure its size to verify the effect of the wear particle size on the particle distribution. Meanwhile, the oil viscosity is selected as an adjusting factor to prove that the diluted oil can help to obtain the ideal wear particle distribution.
This work mentioned in this paper is preliminary. The future works include the complete transient modeling and analysis, the multi-parameter quantitative experiment, and the intelligent identification technology of wear particles.
Footnotes
Declaration of conflicting interests
The author(s) declared no potential conflicts of interest with respect to the research, authorship, and/or publication of this article.
Funding
The author(s) disclosed receipt of the following financial support for the research, authorship, and/or publication of this article: This work was supported by the Natural Science Basic Research Program of Shaanxi Province of China (2021JM-391) and National Natural Science Foundation of China (52275131).
Data availability
The model and data included in this study can be available upon the reasonable request from the author Qi Liu (