
Abstract
In this paper, the results of an experimental campaign focused on the vibrations of shells are presented. More specifically, the goal is to investigate the effect of thermal gradients across the shell thickness on the nonlinear dynamics. The shell is made of polymeric material and an aluminum mass is clamped on one end of the shell; the other shell end is clamped to an electrodynamic shaker, which provides a base harmonic excitation. Tests are performed in a controlled environment where a thermal gradient on the shell thickness is generated by means of a climatic chamber and an internal cartridge heater. Different temperature gradients and base excitation levels have been considered. The nonlinear dynamic scenario is analyzed through amplitude–frequency diagrams, bifurcation diagrams, waterfall diagrams, time histories, Fourier spectra, phase portraits, and Poincaré maps. Results show a strong effect of the temperature on the dynamic response of the shell: subharmonic, quasi-periodic, and chaotic vibrations take place as well as large amplitude vibrations, high sound levels are detected.
Introduction
Thin-walled structures and components, such as shells, are quite common in Mechanical Engineering. This kind of structure allows developing strong and lightweight systems. The counterpart of such efficiency is the propensity to instability and resonances. Examples of thin-walled structures applications can be found in Automotive (hood, car door), Aerospace (fuselage, satellite solar panels), or Nuclear Energy industry (fuel rods). Moreover, in many applications, such as pipes and heater exchanger, the environmental temperature across the shell thickness can be different; this likely produces strong temperature gradients that influence the dynamic behavior.
Literature review
The literature on the shells and the plates is huge and covers problems of stability, vibrations, and fluid–structure interaction. However, from the literature review, it will be clear that the research on those topics is still challenging due to the complex dynamics that characterize these structures.
In the fifties of the previous century, the research on Aerospace was quite intense due to the enormous economical effort on military technologies needed for the Cold War. In such period, the investigations on shells were extremely numerous, leading to the development of several methods of analysis and the disclosure of many phenomena.
One of the works that deserve to be mentioned is the seminal work of to Leissa, 1 where the fundamental theories of shells were reported as well as many numerical and experimental results. More recently, Païdoussis2,3 published two fundamental books on the topic of fluid–structure interaction. In particular, the dynamics of shell-like structures subjected to internal, external, or annular axial flows was deeply analyzed. A large number of numerical and experimental results can be found in such books. Other books, strictly related to the present paper, are Soedel 4 and Amabili.5,6 In the latter two references, the most recent advanced shell theories are clearly presented and discussed, which take into account different complicating effects and non-linearity sources, beyond the traditional geometric effects. In addition, various numerical and experimental results are reported.
Comprehensive literature reviews, which cover two decades (1989–2009) of research on homogeneous and composite shells, have been published by Qatu7,8 and Qatu et al. 9 Other extensive reviews on nonlinear dynamics of shells, with and without fluid–structure interaction, can be found in Amabili and Païdoussis: 10 Alijani and Amabili; 11 and Kubenko and Koval’chuk.12,13
Vijayaraghavan and Evan-Iwanowski 14 studied, numerically and experimentally, the response of a clamped-free cylindrical shell subjected to sinusoidal base excitation. This study highlights the effect of the parametric excitation due to the in-plane inertia which, for certain conditions of amplitude and frequencies, can lead to unstable responses, i.e. large lateral vibrations.
Librescu et al.15,16 analytically studied the vibration response of flat and slightly curved panels under several mechanical and thermal load conditions. The effects of the geometric imperfections, axial-compressive loads, and lateral pressure were analyzed. Results on the interaction between the structure frequencies and the external load, both mechanical and thermal, were presented and discussed.
Several comprehensive comparisons between theories and experiments can be found in Amabili17,18 and Amabili et al., 19 where the effects of geometric imperfections and fluid–structure interaction on the nonlinear dynamics of circular cylindrical shells and panels were investigated.
Alijani et al. 20 investigated the nonlinear vibrations of plates and curved panels. Results pointed out the importance of considering a nonlinear damping model into the reduced-order model to obtain a good agreement between experimental tests and numerical simulations.
The dynamics of a circular cylindrical shell connected to a rigid disk on top and subjected to seismic base excitation was deeply investigated by Pellicano and Avramov 21 and Pellicano.22,23 Experimental tests were performed; the results were used to validate several semi-analytical models based on nonlinear Sanders–Koiter theory. Even a model that takes into account the dynamics of an electrodynamic shaker can be found in such references.
Haddadpour et al. 24 analyzed the free vibrations of functionally graded (FGM) cylindrical shells under thermal load. The equations of motion were based on Love’s theory, including nonlinear geometric terms, and solved through Galerkin’s method. A polynomial series expansion was used for solving the heat conduction equation by imposing the steady-state condition and finding the temperature distribution across the thickness direction.
Sheng and Wang25–27 studied numerically the behavior of FGM shells subjected to thermal loads, with and without the presence of a flowing fluid. Results showed that, due to a reduced structure stiffness, higher temperatures lead to an increased radial response of the shell.
Biswal et al. 28 presented a study on the free vibration of composite shallow shell in controlled hygrothermal conditions. The response of several composite curved panels, with a different number of layers has been analyzed, both numerically and experimentally, in different conditions of temperature and humidity. Results show that, for higher temperatures and for higher humidity, the fundamental natural frequency decreases.
A numerical study on the linear and nonlinear vibrations of a functionally graded cylindrical panel, subjected to a temperature gradient across the thickness can be found in Liew et al. 29 The dynamic behavior of the panel was analyzed for several temperature conditions, different aspect ratios, vibration amplitude, etc.
Mallon et al.30,31 investigated the dynamic stability of a thin cylindrical shell carrying a top mass and subjected to harmonic base excitation. The semi-analytical model was based on Donnell’s assumption. In addition, experimental tests have been carried out. Results showed a strong aperiodic response of the structure, when the excitation frequency is close to the natural frequency of the first axisymmetric vibration mode of the shell.
Kubenko and Koval’chuk 32 presented the results of an experimental study on the dynamic instability of laminated composite shells. The structure was externally excited by means of shaker in the transverse direction. An interaction between flexural modes and the presence of traveling waves has been observed.
Trotsenko and Trotsenko 33 and Trotsenko 34 developed an analytical model for studying the dynamics of cylindrical shells with a rigid body attached to one end.
Pellicano et al. 35 experimentally studied the vibration of a cylindrical shell subjected to seismic base excitation. The dynamics of two shells with different aspect ratio have been investigated. A saturation of the primary resonance has been observed; such saturation was due to a dynamic instability that takes place for different loading conditions. The study proves the complex shell behavior, when the shell is excited by external resonant forcing.
Zippo et al.36–38 and Pellicano et al. 39 experimentally investigated the dynamics of polymeric cylindrical shells subjected to an axial load. The effects of several complicating effects such as axial preload, extreme temperature conditions, resonant harmonic, or random excitations have been investigated. Results show that under particular conditions of temperature and load, the shell can exhibit strongly nonlinear response (sub-harmonic, saturation, synchronizations).
The present paper continues and completes the investigation presented in Zippo et al., 37 where homogeneous temperature fields were considered. Here, the investigation is devoted to the effect of gradients of temperature.
With the aim of covering an evident lack of literature on experimental analysis of shells dynamics under extreme thermal conditions, in this paper, an experimental study on the nonlinear vibrations of thin circular cylindrical shell subjected to a thermal gradient across the thickness is presented: an accurate test setup has been developed to perform tests in controlled environment hygrothermal conditions and a test procedure, that enables to follow nearly unstable states of the shell, has been here adopted.
Test setup
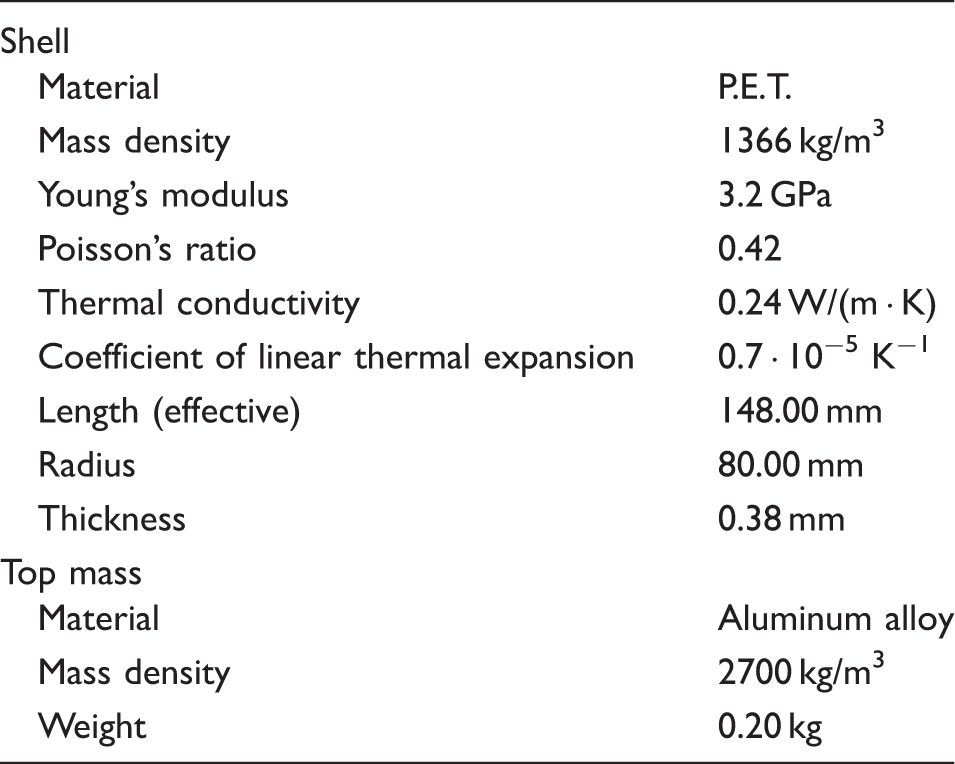
A polymeric circular cylindrical shell made of polyethylene terephthalate (PET) is mounted vertically on a vibrating base. On the top edge of the shell, an aluminum cylindrical mass is clamped. The bottom edge of the shell is clamped to a Vibration Table Adapter (VTA), Figure 1. The test specimen geometric dimensions and material properties are listed in Table 1.
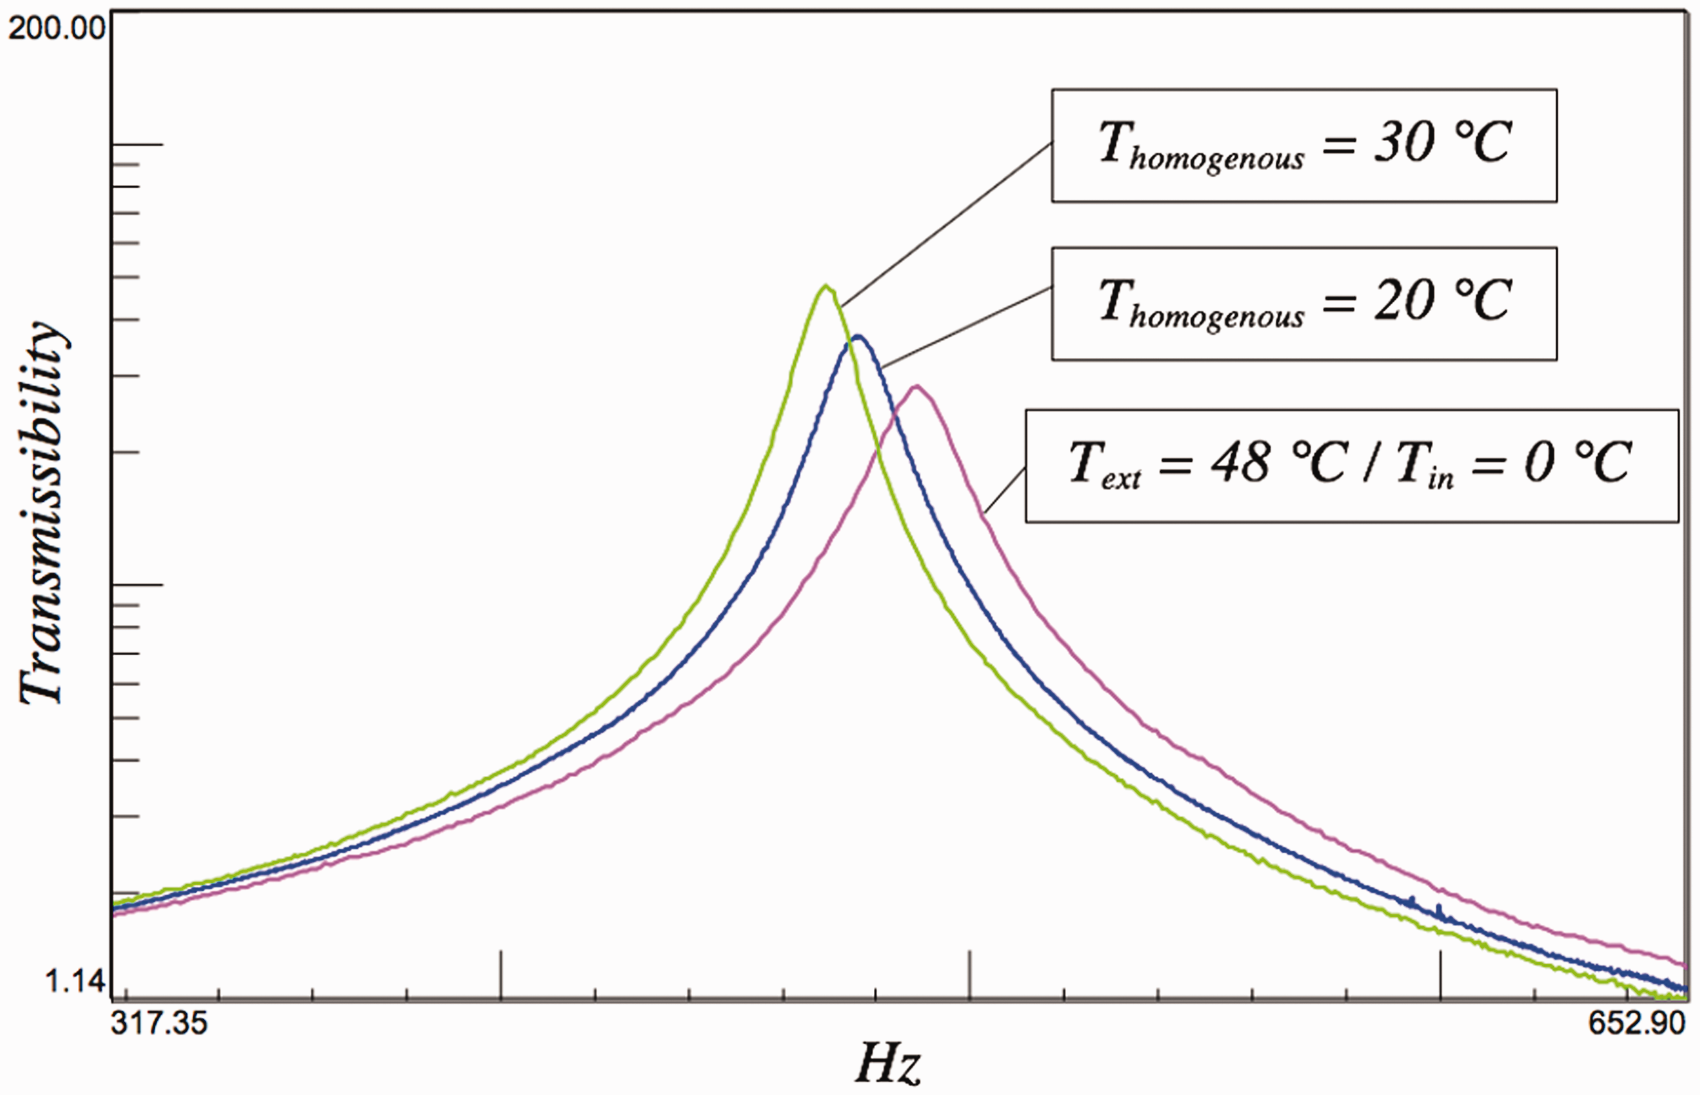
(a) Detailed view of the test specimen during the assembly phase and (b) vibrometer laser beam diverted on the shell wall by the periscope. Transmissibility of the shell.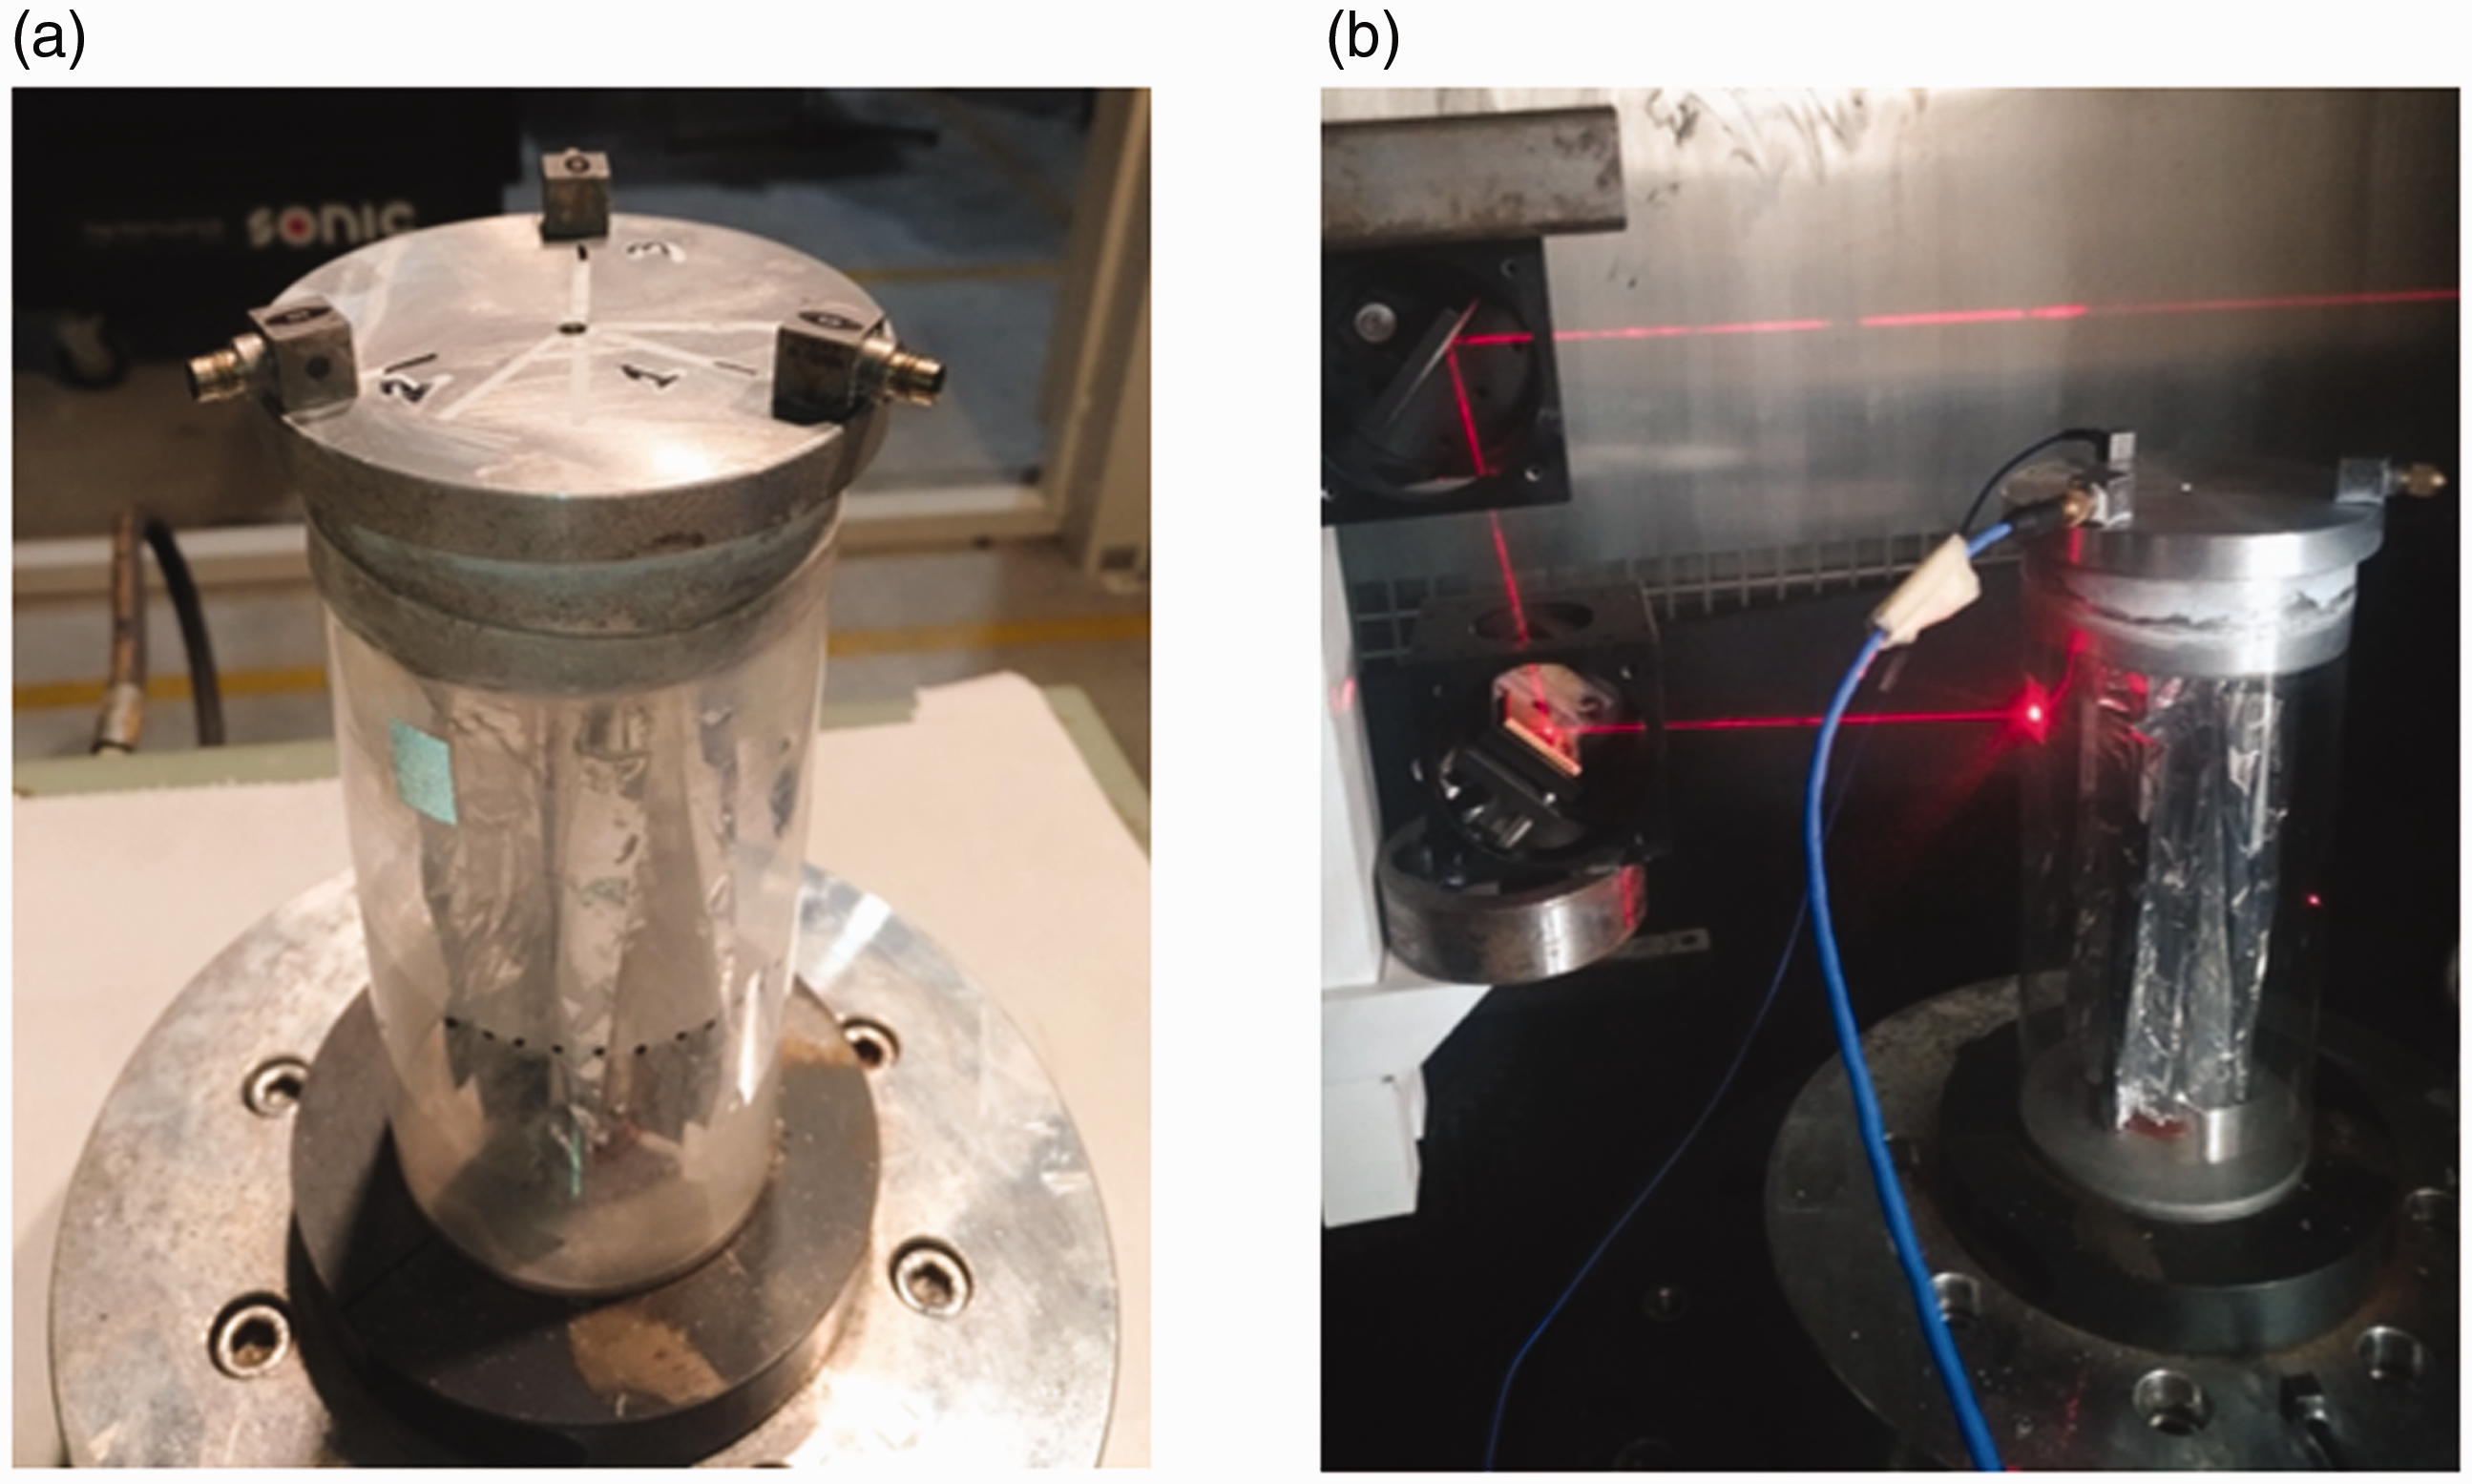
The VTA, made of aluminum, allows the shell to be connected to the shaker moving table. The shaker used to excite the test specimen in the longitudinal direction is a Dongling ET-40-370 (40 kN peak force, 100 g maximum acceleration, 500 kg max static payload, 1–2800 Hz frequency band), which allows a very well controlled base motion.
All tests have been performed in a controlled environment with steady-state conditions of temperature; this was possible thanks to the use of a climatic chamber and a finned cartridge heater placed inside the shell. This kind of layout allows for generating a controlled temperature gradient across the shell thickness. The temperature is measured by a digital thermometer equipped with two wire thermocouples of the k-type: the first one provides the climatic chamber temperature, i.e. the temperature of the air surrounding the shell, i.e. the outer part of the shell wall; the second one gives the temperature inside the shell, i.e. the inner shell wall temperature. The climatic chamber has a proportional-integral-derivative (PID) controller that guarantees a steady air temperature surrounding the shell. The cartridge heater is powered by an external supplier, the internal temperature is manually adjusted by varying the cartridge electric current and checking the temperature through the digital thermometer; moreover, the cartridge fins make the temperature uniformly distributed inside the shell.
In order to characterize the vibration of the top mass, three integrated electronics piezo-electric (IEPE) triaxial accelerometers (each having a mass of 5 g) are mounted on the top mass and are angularly spaced of 120° on the top disk. Conversely, in order to avoid the added-mass effects on the shell lateral surface, which is extremely light, the shell radial motion has been monitored through a laser vibrometer Polytec OFV-505 (±25 m/s max velocity, 0.1 pm displacement resolution, 24 MHz frequency bandwidth), which measures the velocity of a point of the shell located at 12.8 cm from the bottom edge in longitudinal direction; moreover, a Micro Epsilon optoNCDT 2200 laser telemeter (1 µm accuracy, 2 mm/V sensitivity) measures the displacement of a point at 7.8 cm from the shell bottom edge. The angular offset between the two laser beams is 100°.
An IEPE monoaxial accelerometer is glued on the VTA with the aim of measuring the drive excitation which acts on the shell base. The control/acquisition system is a Siemens LMS Scadas coupled with LMS Testlab software.
As it is well-known from literature, thin structures exhibit strong non-linear response and high sensitivity to small perturbations. The seismic base motion is controlled with an open-loop control strategy. Instead, a real-time closed-loop strategy is used to control the voltage signal sent to the shaker power amplifier: the control voltage is externally generated in MATLAB environment and then is sent to the amplifier through a Testlab module (see references Pellicano;
22
Pellicano et al.;
35
Zippo et al.36,37). The output provided by the shaker controller is a stepped-sine voltage vi(t) function. The generic ith step of excitation is defined as follows

The step from a frequency i to a frequency i + 1 is carried out through a smooth C1 function in order to avoid the introduction in the system of further perturbations that can negatively affect the stability of a strong nonlinear system such as the shell.
The frequency range 300–730 Hz is investigated for both upward and downward frequency variations. A sampling frequency of 12,800 Hz is used for data acquisition, a frequency step of 2.5 Hz and a step duration of 10 s have been settled. In order to avoid the transient response resulting from the frequency variation, only the last 1000 periods have been considered during the data postprocessing phase.
The response of the structure has been investigated under two different temperature gradients across the shell thickness (48 ℃/0 ℃, 48 ℃/20 ℃) and four drive excitation amplitude levels (0.1 V, 0.2 V, 0.3 V, and 0.4 V).
It is important to highlight that tests have been performed far from the glass-transition temperature of the PET, which is approximately 70 ℃.
A preliminary analysis has been carried out with the aim of determining the resonance frequency of the first axisymmetric mode of the shell. That analysis has been useful in order to set thresholds to the investigated frequency range.
Using the measured accelerations in the vertical direction, the transmissibility has been calculated as ratio between the top mass and the base accelerations.
Figure 2 shows the transmissibility of the shell for different conditions of temperature:
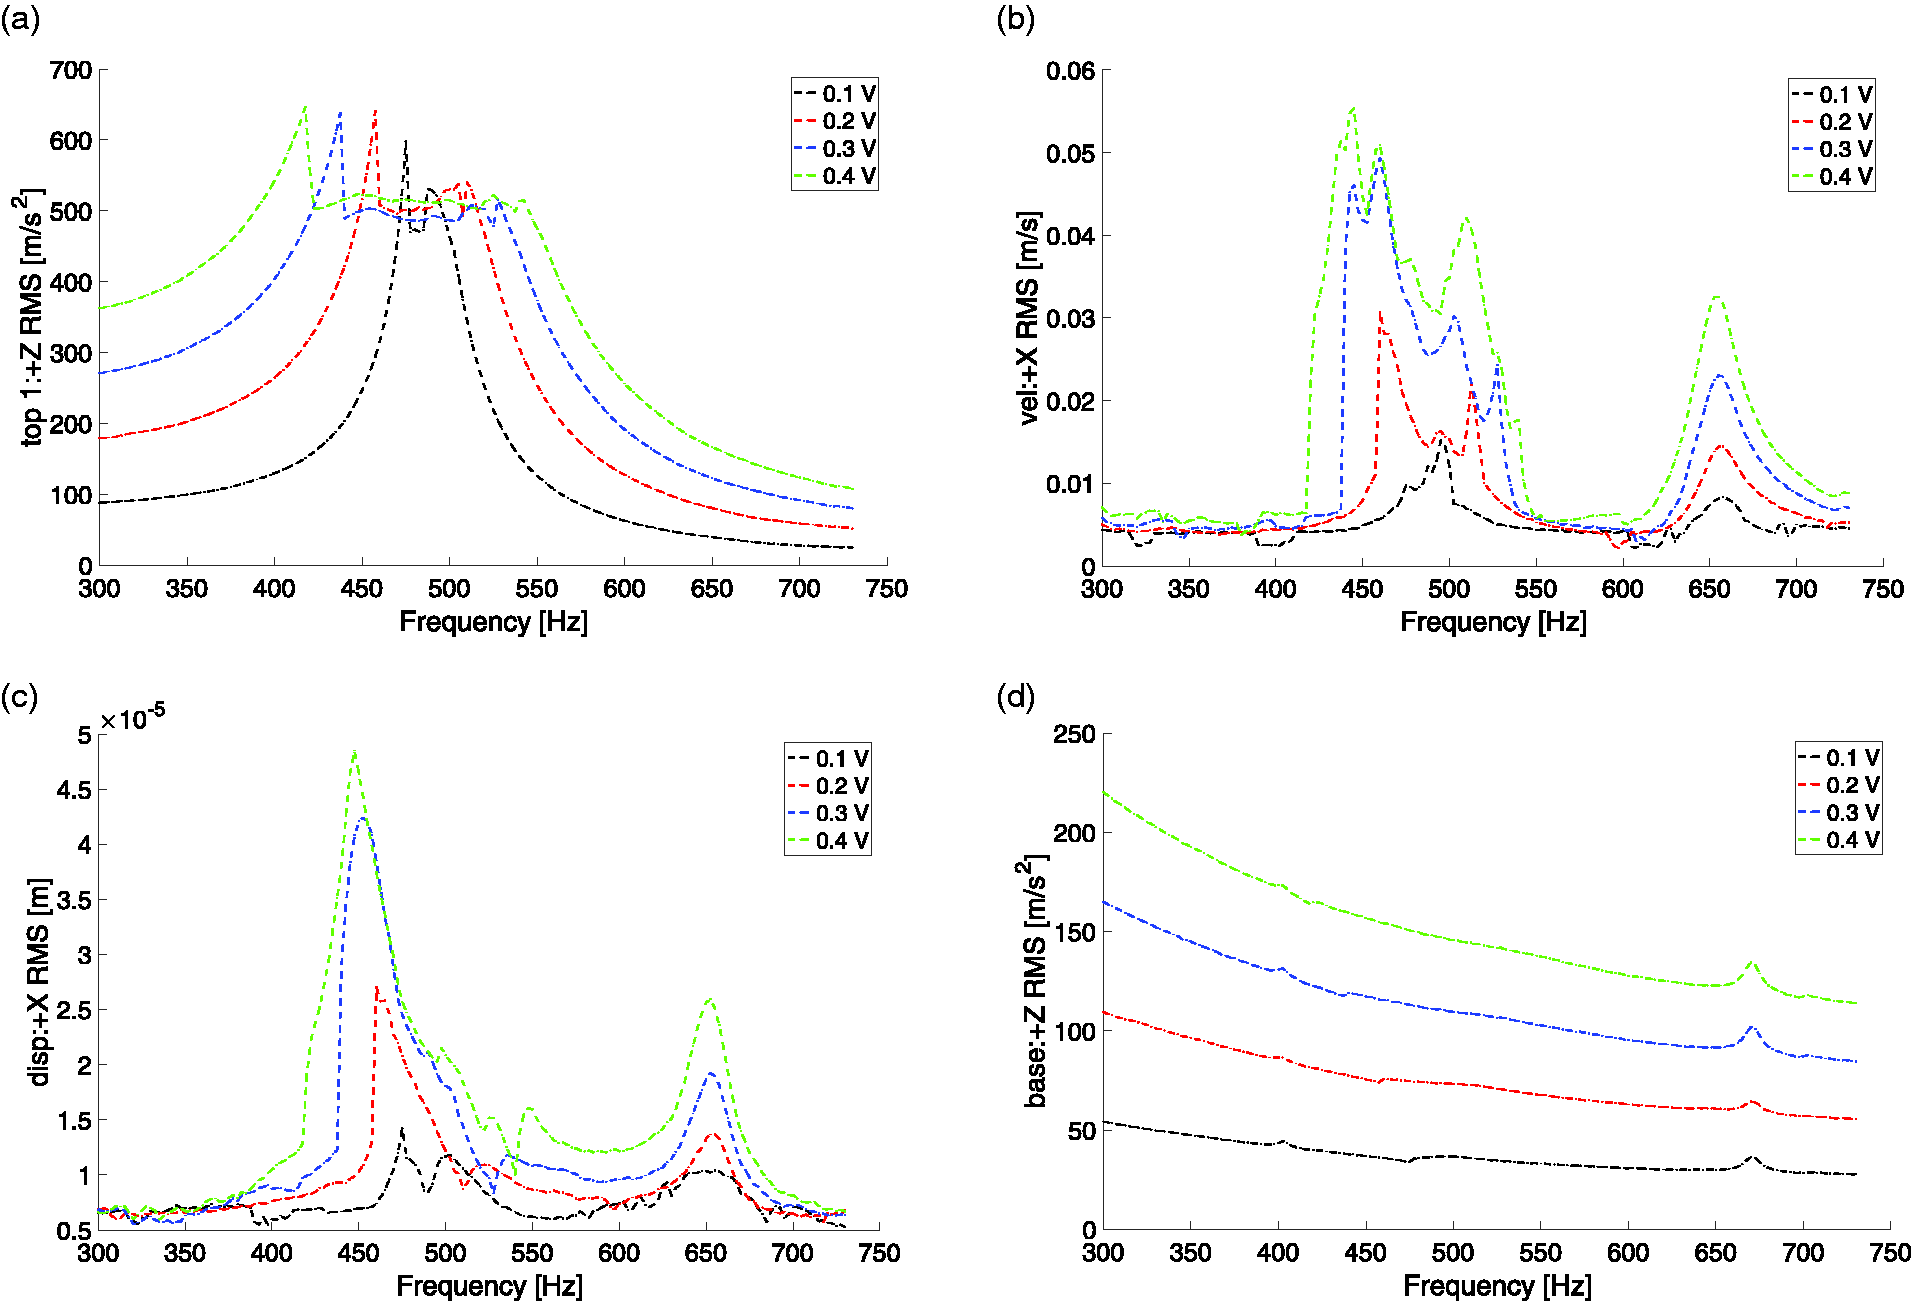
Homogenous temperature 30 ℃ (green line); Homogenous temperature 20 ℃ (blue line); Internal temperature 48 ℃/external temperature 0 ℃ (pink line). Amplitude–frequency diagrams—upward frequency variation—48℃/0℃. (a) Top mass vertical acceleration, (b) shell lateral velocity, (c) shell lateral displacement, and (d) base vertical acceleration.
Test specimen characteristics.
First axisymmetric vibration mode: Natural frequency, transmissibility maximum amplitude and quality factor.
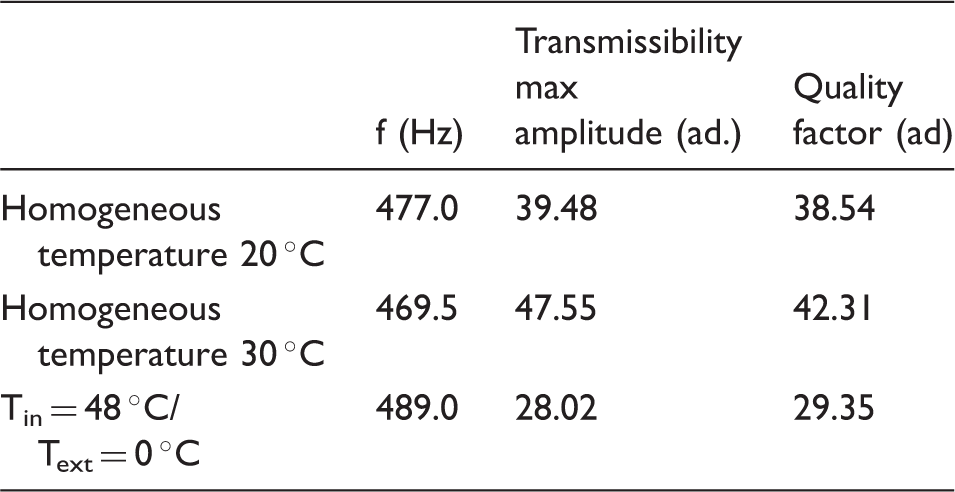
The quality factor is strictly correlated to the damping of the structures and is evaluated through the half-power bandwidth method. For a polymeric shell with homogeneous temperature, the quality factor increases until the temperature reaches the value near the glass transition of the polymer, then it shows a sudden decrement. 38
When a thermal gradient across the shell thickness (Tin = 48 ℃/Text = 0 ℃) is present, the quality factor is the lower than what has been measured in condition of a homogeneous temperature of 20 ℃ even though the average temperature is about 24 ℃, i.e. the damping is higher. This means that there is a predominant effect of the external shell layers (lower temperature and higher damping) with respect to the inner shell layers where the surface is exposed to a higher temperature environment.
Experimental results
In this section, the experimental results are analyzed and discussed. The spectral analysis is conducted in conjunction with bifurcation analysis in order to depict a clear view of the shell nonlinear behavior when subjected to thermal gradient in the thickness direction.
In the following, the sensor locations and directions are defined:
Top 1 + Z is the vertical acceleration of the top mass, Base + Z is the vertical acceleration of the shaker base, Vel + X is the radial velocity of the shell, Disp + X is the radial displacement of the shell.
Effect of excitation level
A severe saturation in the top mass vibration occurs when the forcing frequency approaches the natural frequency of the first axisymmetric mode of vibration of the structure. In this condition, the shell dynamics is governed by the interaction between the top mass and the shell dynamics, this is due to an auto-parametric excitation arising when the structure is axially excited by a harmonic load. The saturation phenomena in shells have been observed in the past18,30,32 and a comprehensive mathematical description of this kind of interactions can be found in Nayfeh and Mook 40 for simple two dofs systems, using a perturbation method; the saturation of a directly excited mode arises in presence of internal resonances when a critical values of the frequency and the amplitude of the forcing are reached. It is known from the literature that this phenomenon is due to system quadratic nonlinearities and allows the energy “spill-over”, an energy exchange, between directly and non-directly excited vibration modes.
In Figure 3(a) to (d), the amplitude–frequency diagrams for upward frequency variation of the drive excitation are reported. The response amplitudes are expressed using the root mean square values (RMS). A clear saturation of the top mass vertical acceleration is observed in Figure 3(a): taking as a reference the curve relative to 0.4 V of drive voltage, between 422.5 and 542.5 Hz, the acceleration amplitude remains almost constant (average value 509.2 m/s2) even though the shaker still provides energy to the system. Furthermore, higher drive excitation amplitude leads to enlarged saturation region: when the drive amplitude increases from 0.1 V to 0.4 V, the unstable range increases its width from 475 Hz–487.5 Hz to 417.5 Hz–542.5 Hz, respectively. This kind of behavior is in close agreement with Pellicano,
22
where the stability boundaries drift apart as excitation amplitude increases. When the “spill-over” between the first axisymmetric mode and shell-like mode occurs, large lateral response of the shell can be observed due to a shell-like mode activation: a second peak at 655 Hz is visible from the vibrometer and telemeter measures, Figure 3(b) and (c). The base acceleration is shown in Figure 3(d); the amplitude decreases with the frequency and a shell-shaker interaction takes place at 402.5 Hz and 670 Hz, near the resonances of the test specimen.
Amplitude–frequency diagrams—upward vs downward frequency variation—0.4V—48 ℃/0 ℃. (a) Top mass vertical acceleration, (b) shell lateral velocity, and (c) base vertical acceleration.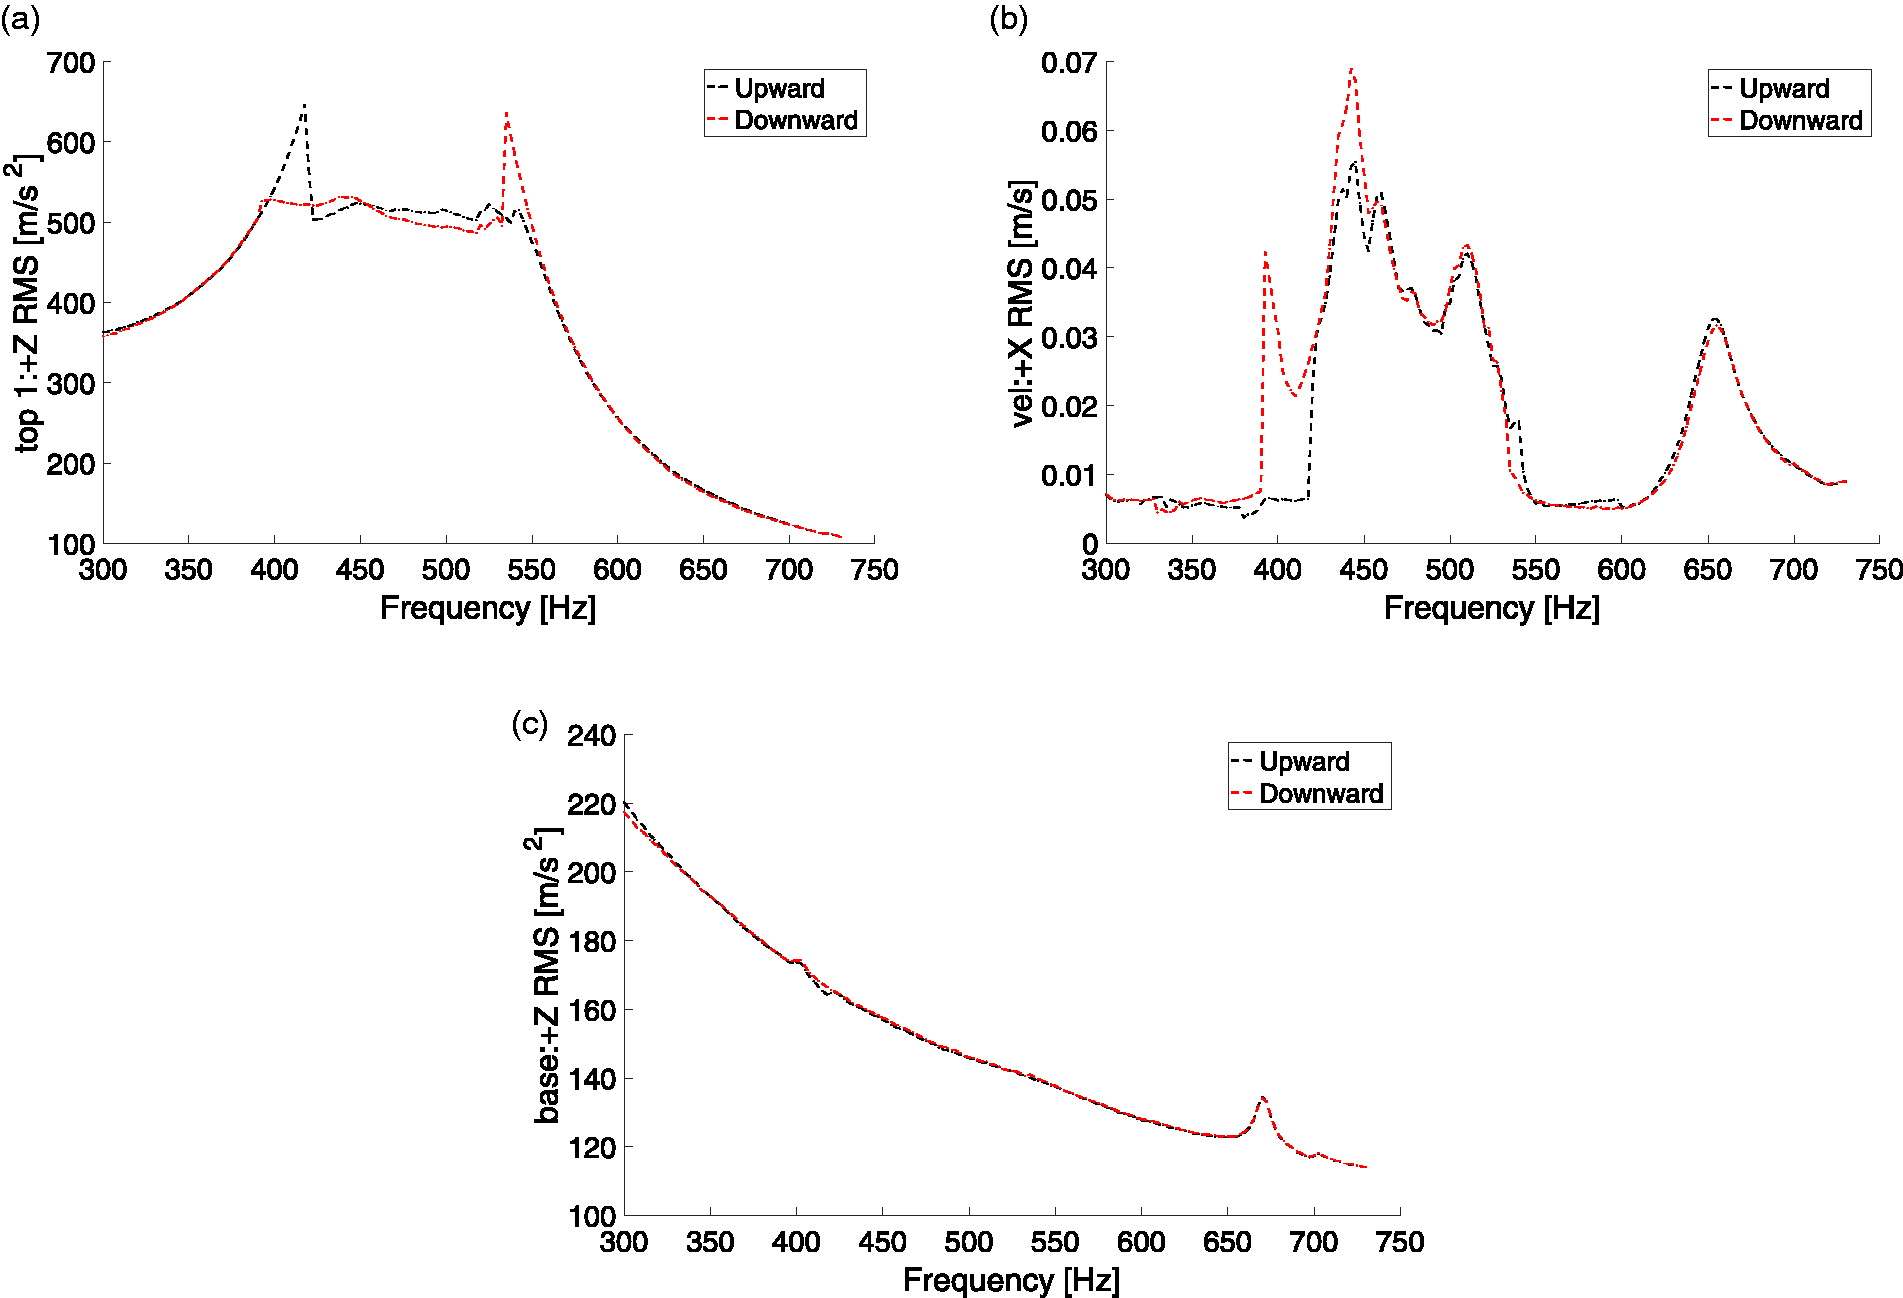
In Figure 4(a) to (c), the amplitude–frequency diagrams obtained for upward and downward frequency variation at 0.4V are compared. The top mass vertical acceleration does not change significantly between the two tests, Figure 4(a); almost the same average response amplitude has been measured in the saturation region: 509.2 m/s2 for upward and 510.9 m/s2 for downward frequency variation. Despite Figure 4(c) shows no remarkable differences in the two excitation amplitude curves, in Figure 4(b), a typical nonlinear softening response can be observed: for the downward experiment, the maximum velocity (0.0689 m/s at 442.5 Hz) is higher than what has been measured for the upward experiment (0.0554 m/s at 445 Hz); moreover the left limit of the saturation region moves to lower frequencies (from 417.5 Hz to 390 Hz); this means that the saturation region becomes wider.
Amplitude–frequency diagrams—upward frequency variation—gradients comparison at 0.4 V. (a) Top mass vertical acceleration, (b) shell lateral velocity, (c) shell lateral displacement, and (d) base vertical acceleration.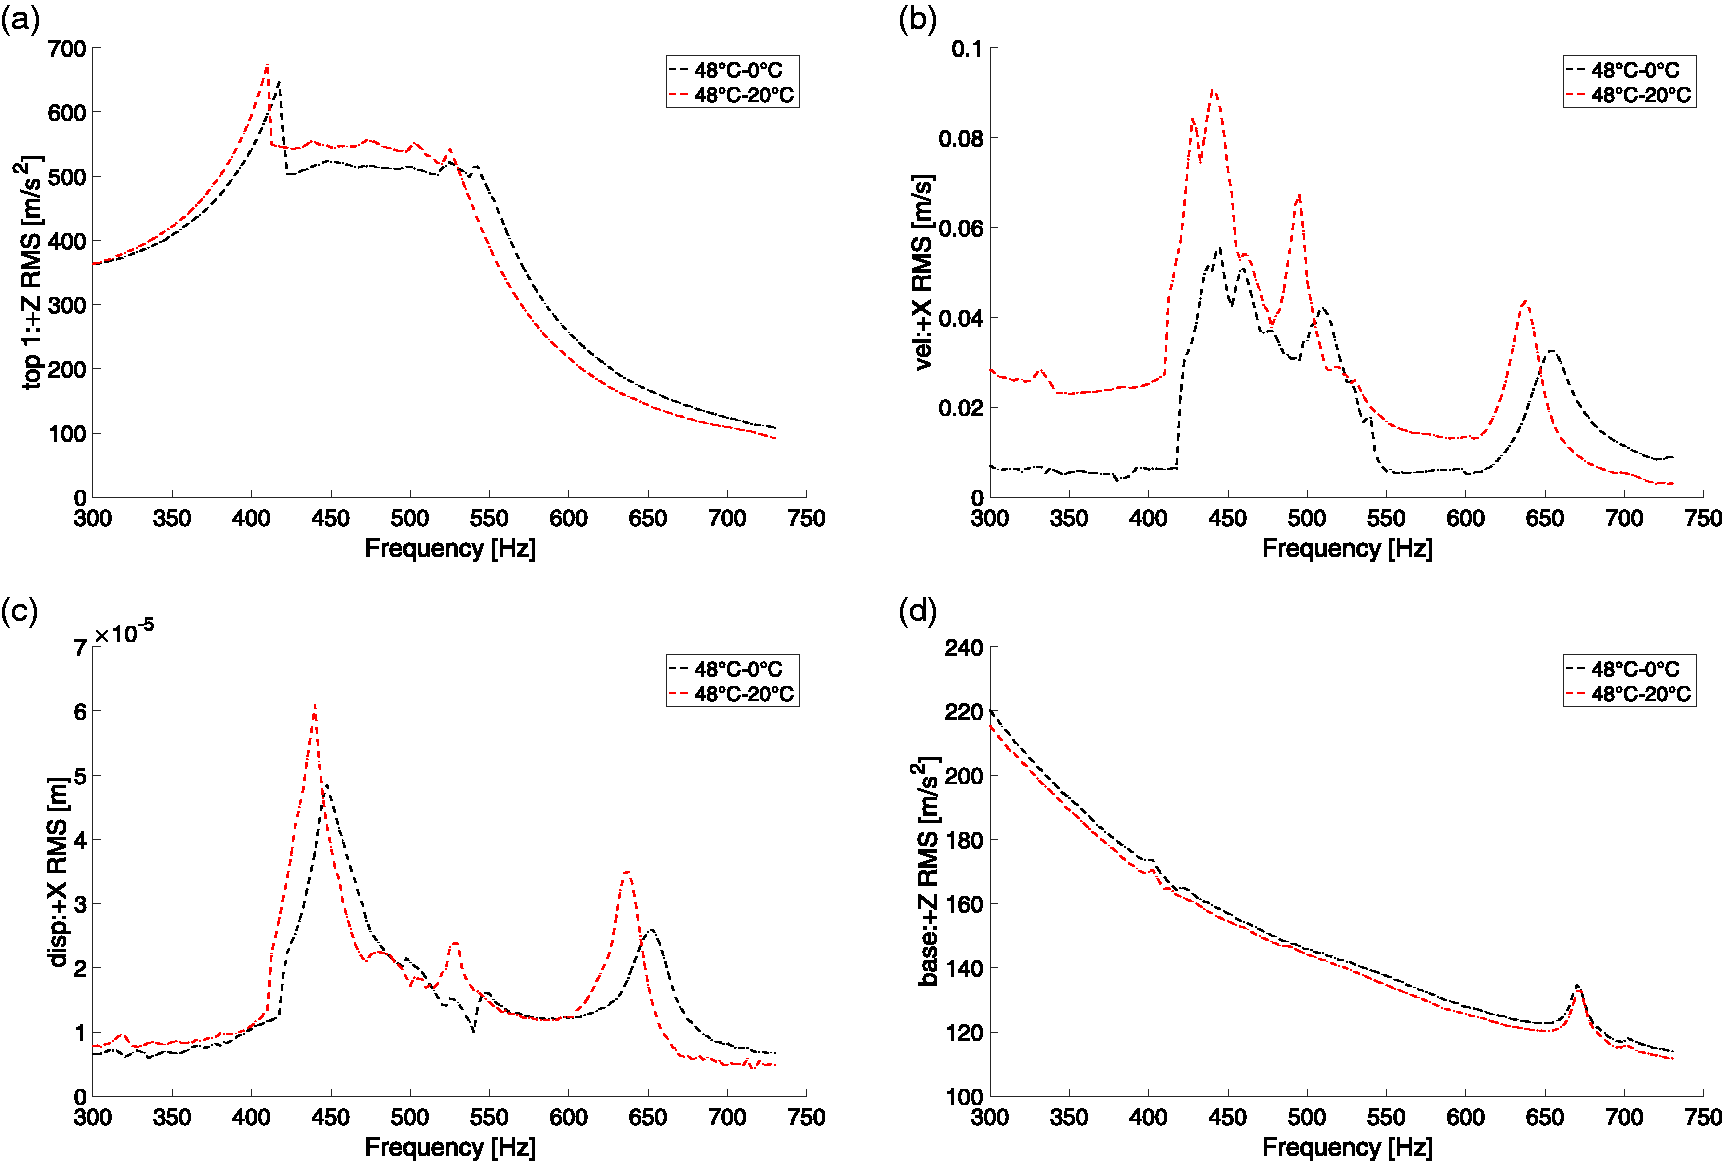
Gradients comparison
A comparison between four case studies concerning different conditions of temperature gradients across the shell wall is presented:
Case A: Tin = 48 ℃/Text = 0 ℃; A = 0.4 V; upward frequency variation; Case B: Tin = 48 ℃/Text = 20 ℃; A = 0.4 V; upward frequency variation; Case C: Tin = 48 ℃/Text = 0 ℃; A = 0.4 V; downward frequency variation; Case D: Tin = 48 ℃/Text = 20 ℃; A = 0.4 V; downward frequency variation.
Case A vs case B
To provide a comprehensive description of the effect of thermal gradients on the shell dynamics, the classical frequency analysis is carried out in conjunction with the bifurcation analysis of the experimental data.
A slight shift of the top mass acceleration curve toward the lower frequencies is shown in Figure 5(a) for higher outer temperature: the saturation region moves from 417.5–542.5 Hz (case A) to 410–525 Hz (case B) with an increased maximum acceleration from 646.1 m/s2 to 673.7 m/s2, respectively. At the same time, the maximum measured radial velocity, Figure 5(b), grows from 0.05339 m/s at 445 Hz (case A) to 0.0905 m/s at 440 Hz (case B), and the maximum measured radial displacement, Figure 5(c), grows from 4.848 × 10⁻⁵ m at 447 Hz (case A) to 6.093 × 10⁻⁵ m at 440 Hz (case B). Those results are in agreement with the findings of Zippo et al.,
38
where higher temperatures emphasize the nonlinear behavior of the shell. That behavior can be ascribed to a decrement of the damping factor of the polymeric structure for this specific temperature range.
Bifurcation and waterfall diagrams—upward frequency variation—0.4 V—48 ℃/0 ℃. (a) and (b) Top mass vertical acceleration, and (c) and (d) shell lateral velocity.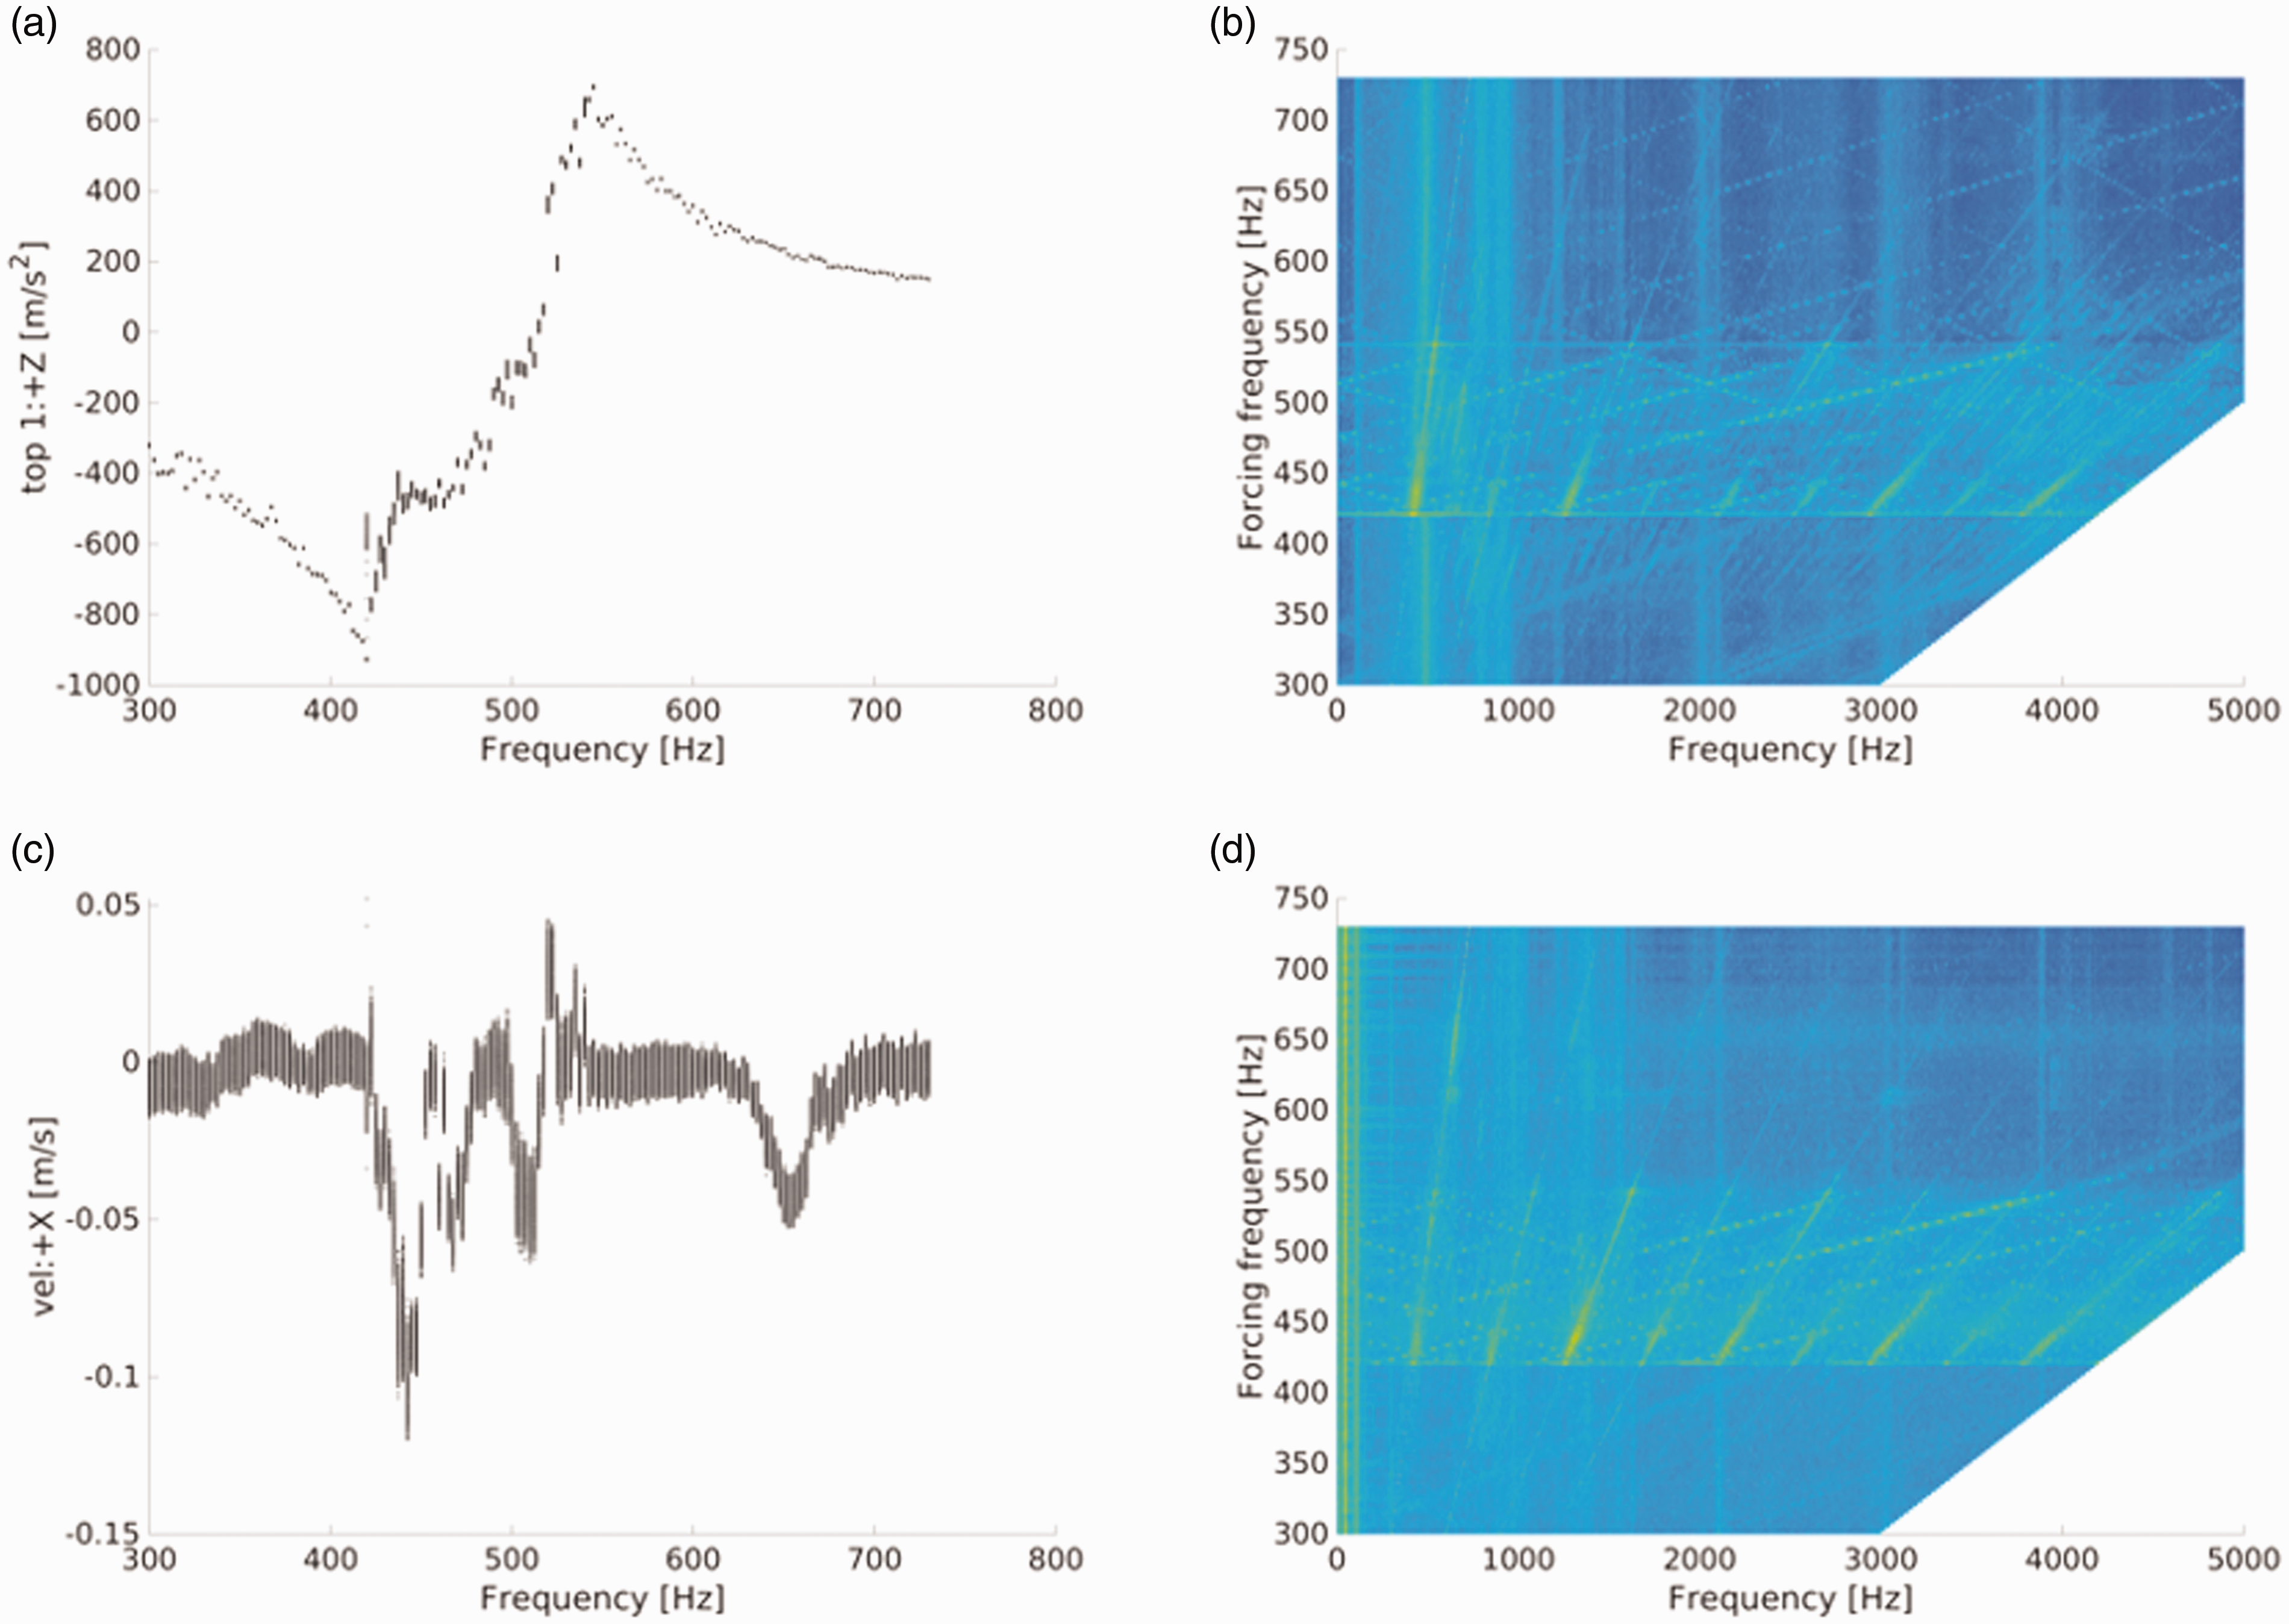
Now the bifurcation diagrams of the Poincaré maps are built from experimental vibration data. Such diagrams are useful for mechanical systems displaying a strong nonlinear character susceptible even to really small changes of the external conditions. In fact, the frequency analysis itself is not exhaustive to provide a clear view of the dynamics of a complex mechanical system such shells are (see Moon 41 ).
The bifurcation and the waterfall diagrams of case A are shown in Figure 6(a) to (c). Unstable motion takes place between 417.5 Hz and 542.5 Hz, see Figure 6(a), for higher and lower frequencies, the response is periodic; in this frequency range, Figure 6(b), the contribution to the top mass response of the odd harmonics is evident (1st–3rd–7th–9th). Moreover, the vertical line at 481 Hz is due to the resonance of the first axisymmetric mode. Figure 6(c) and (d) show an unstable motion in 417.5–542.5 Hz in agreement with Figure 6(a) and (b).
Bifurcation and waterfall diagrams—upward frequency variation—0.4 V—48 ℃/20 ℃. (a) and (b) Top mass vertical acceleration, and (c) and (d) shell lateral velocity.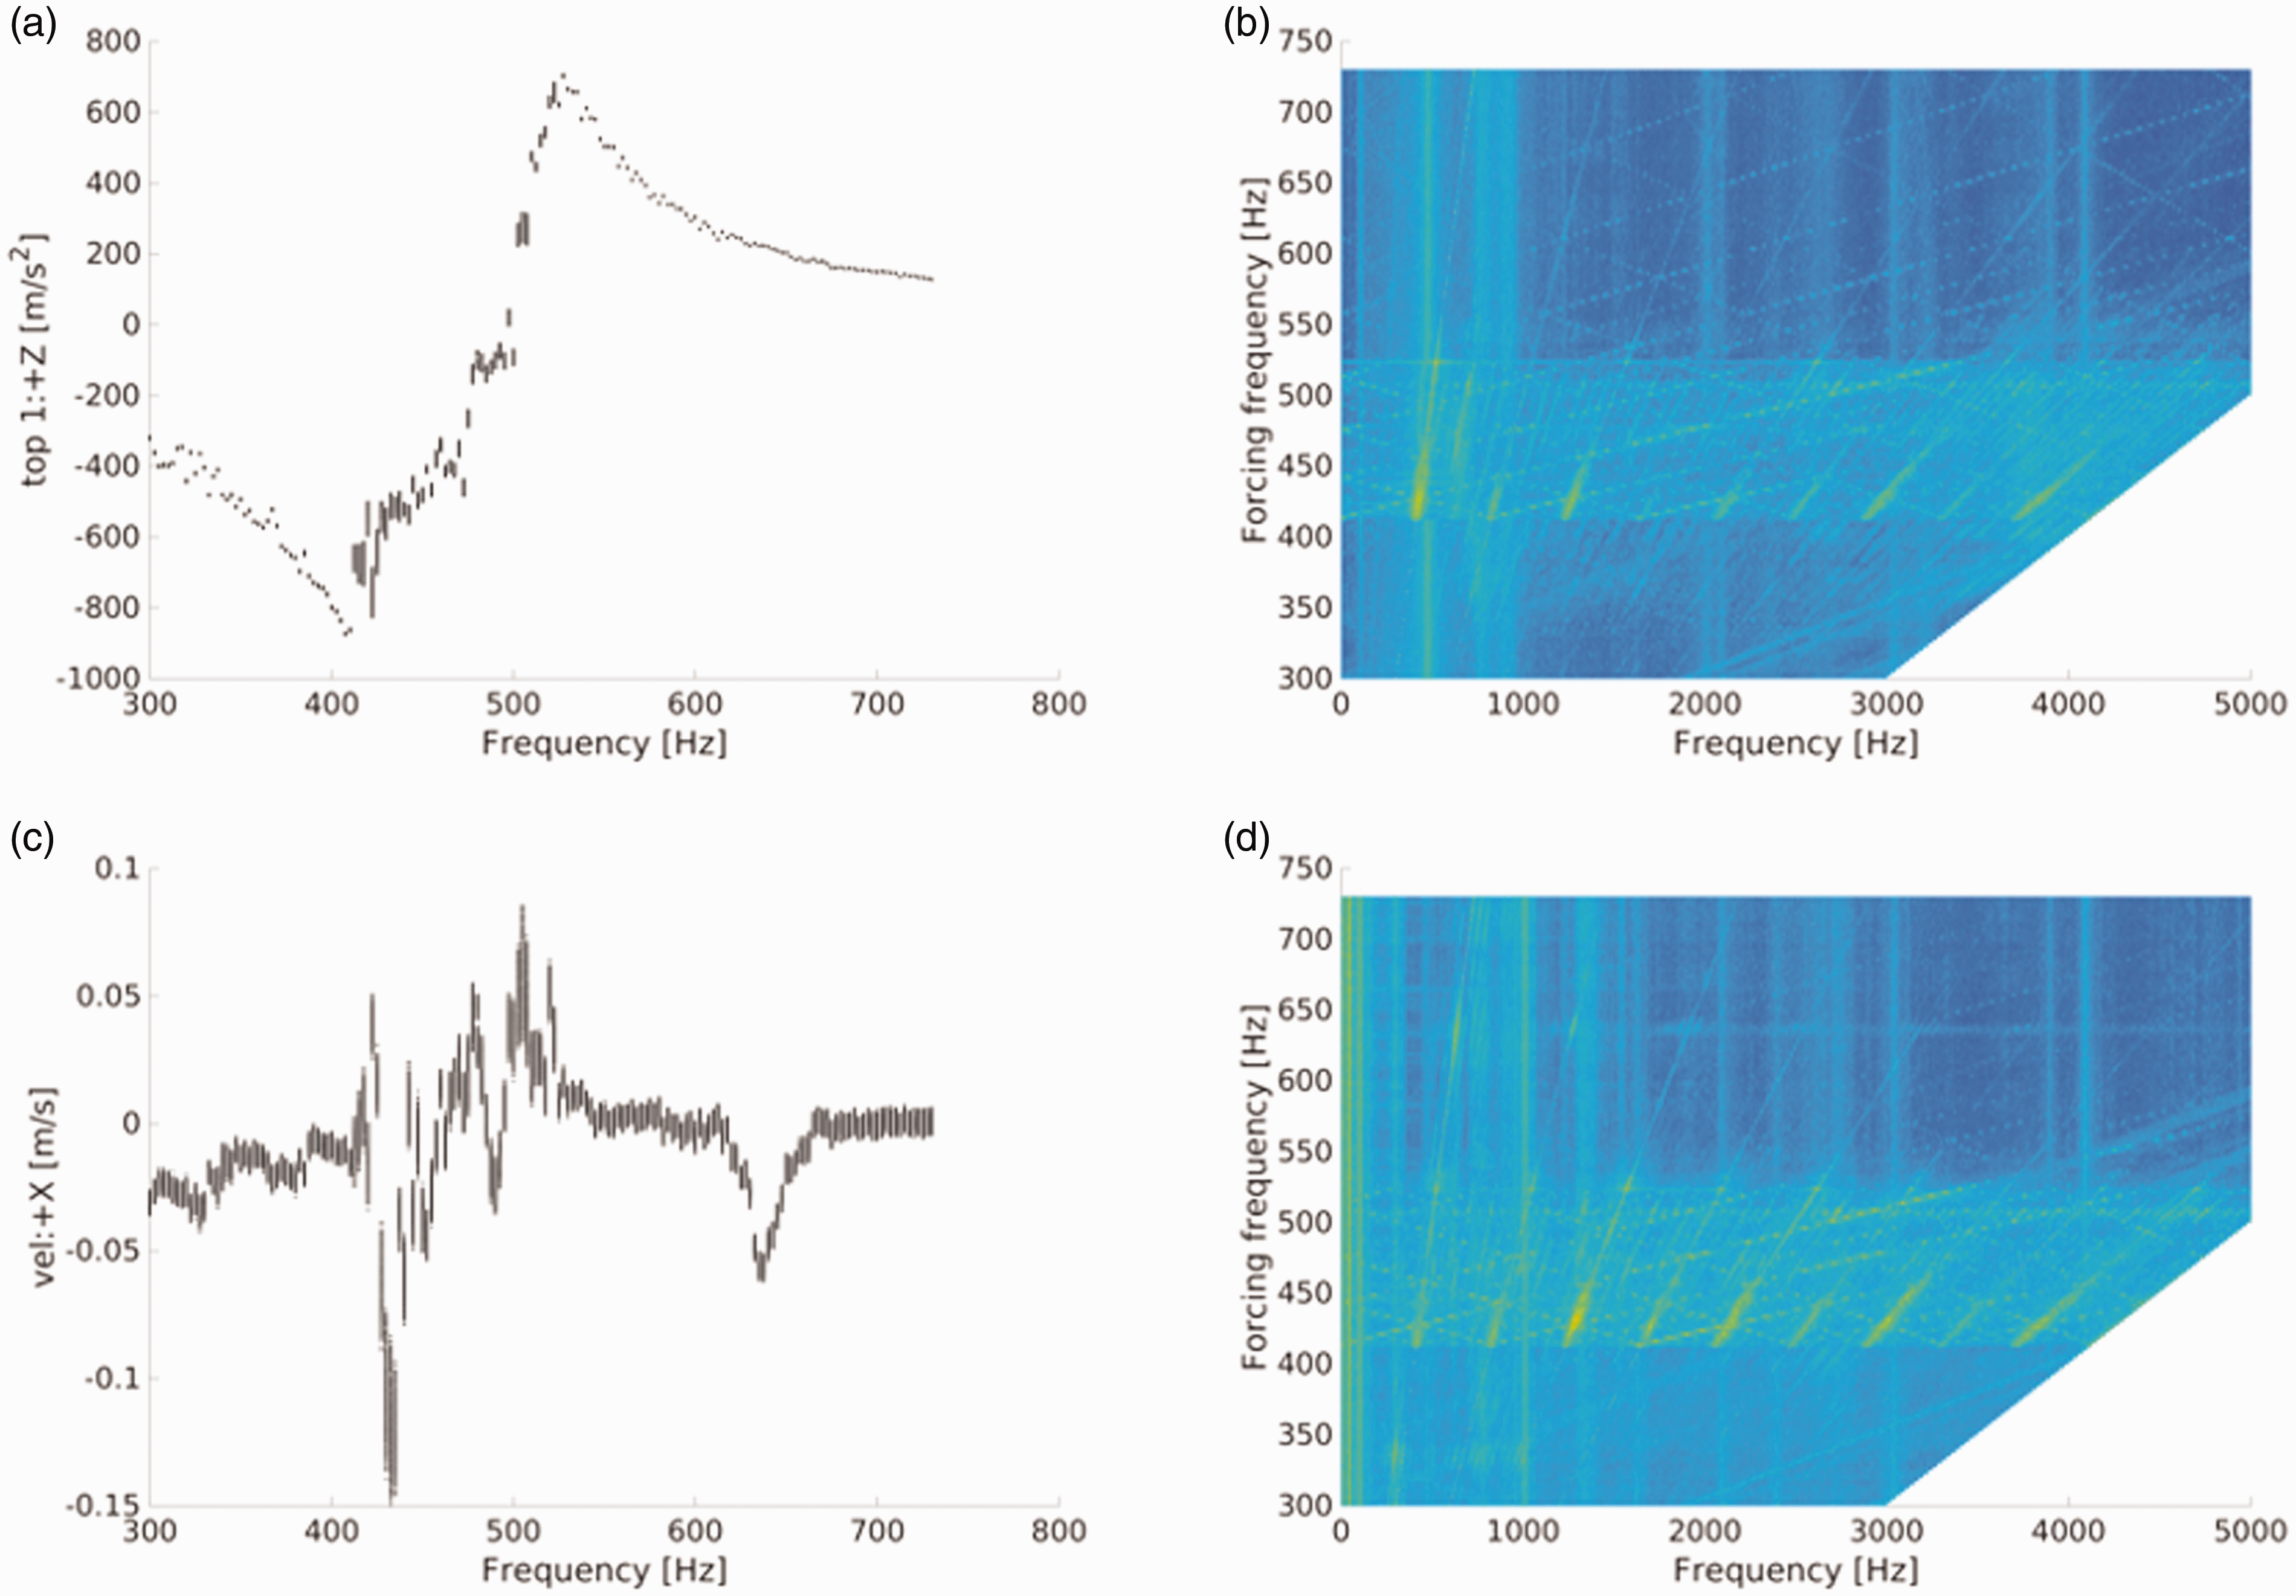
In Figure 7, the bifurcation and the waterfall diagrams of case B are shown. Figure 7(a) shows irregular motion between 410 Hz and 525 Hz. The top mass waterfall diagram, Figure 7(b), shows beam-like modes: the bending mode at 109 Hz and axisymmetric mode at 474 Hz. In Figure 7(c) are clearly visible the fundamental harmonics, in particular the third, and the irregular motion in the energy spill-over frequency range.
Amplitude–frequency diagrams—downward frequency variation—gradients comparison at 0.4 V. (a) Top mass vertical acceleration, (b) shell lateral velocity, (c) shell lateral displacement, and (d) base vertical acceleration.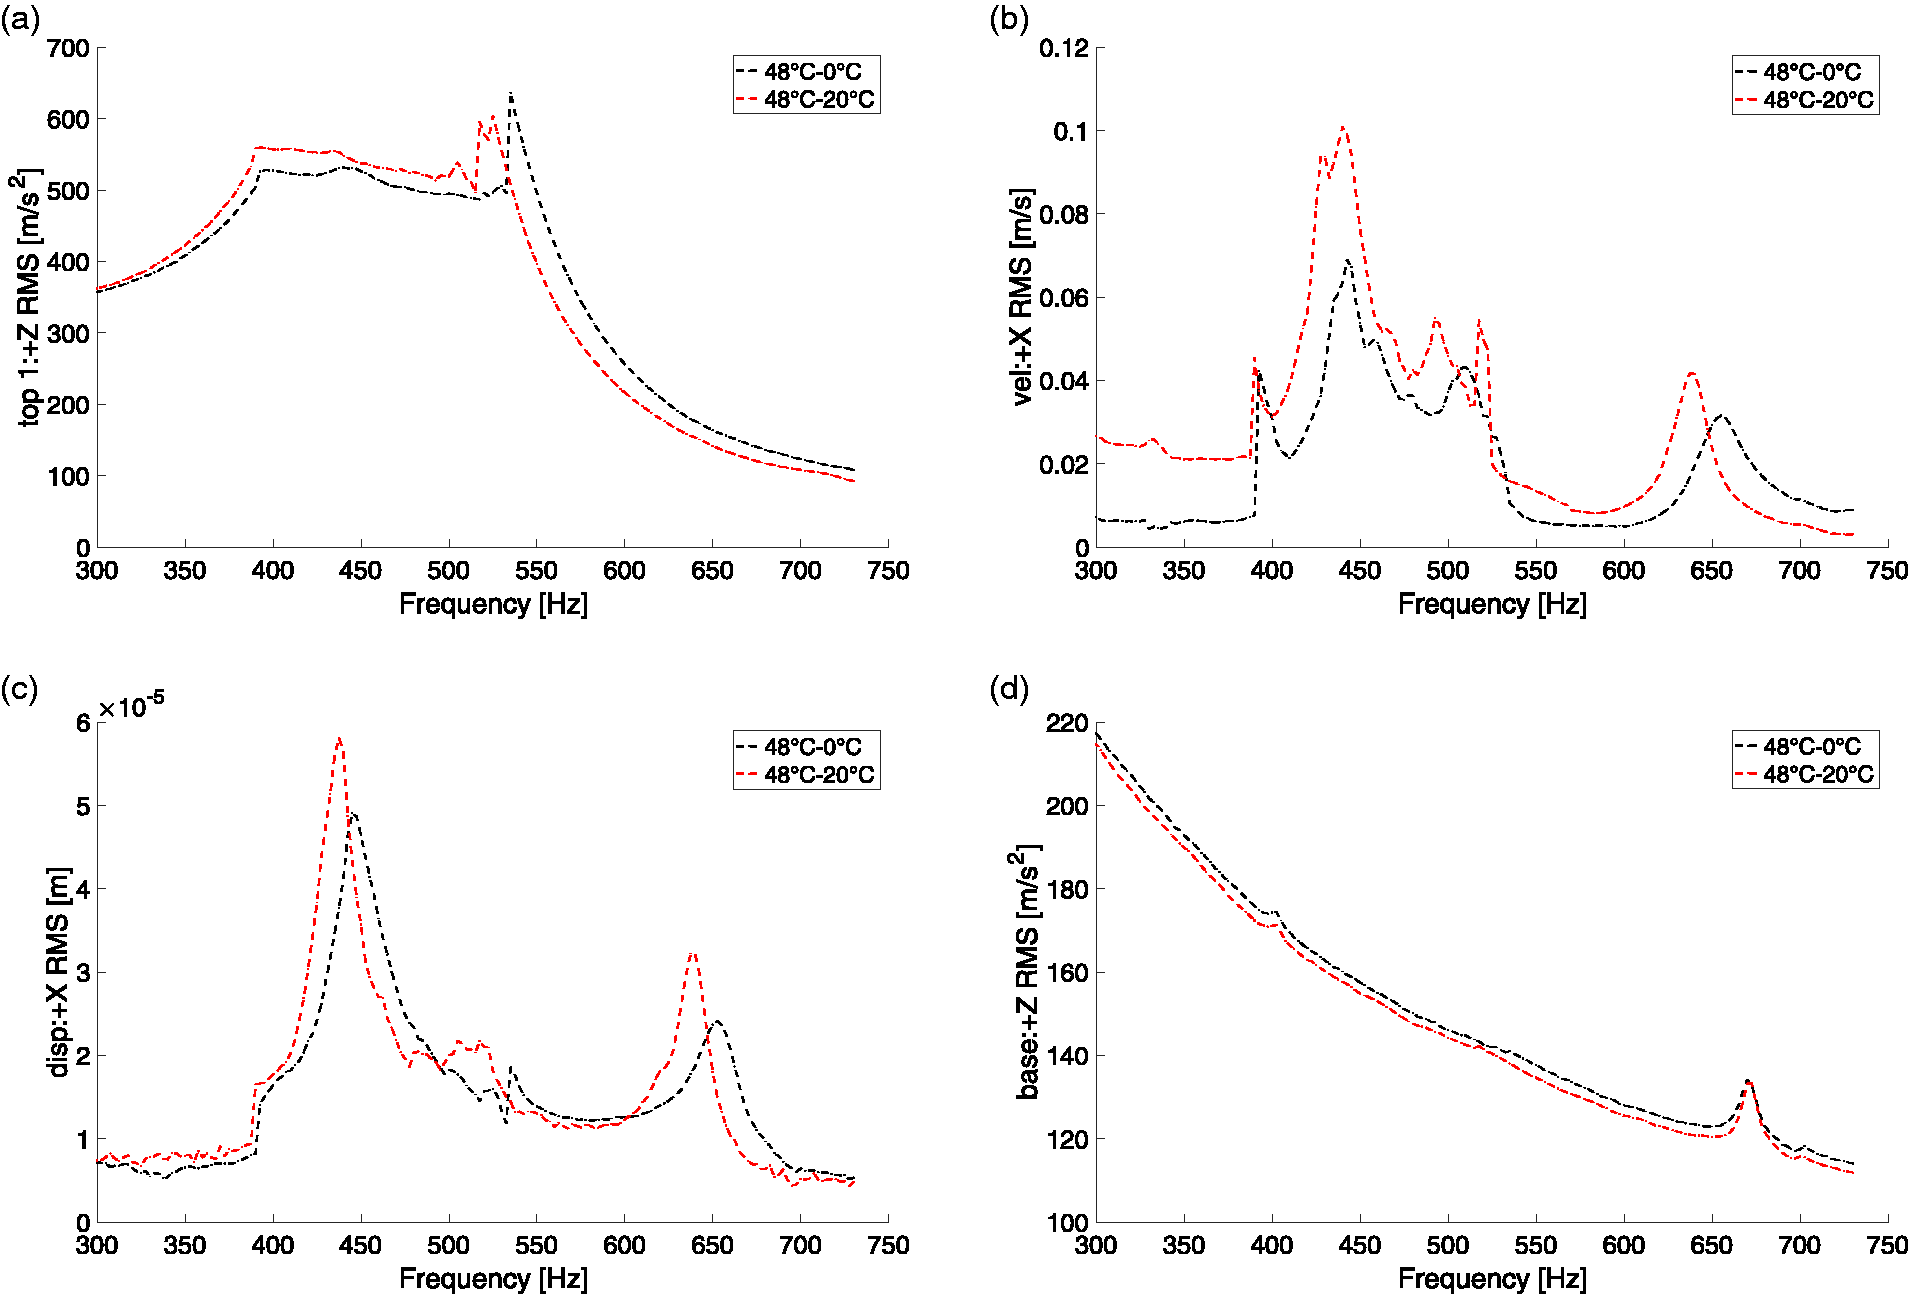
After analyzing bifurcation and waterfall diagrams, some specific regimes are analyzed in detail through time histories, Fourier spectra (normalized to the excitation frequency), phase portrait, and Poincaré maps. It is important to stress out that the top mass vertical acceleration has been taken as reference and 2-D maps are obtained by using the shell radial velocity as additional reference.
Case A results are shown in Figure 8. Before the saturation takes place (fonset = 417.5 Hz), the top mass motion is periodic with the same frequency of the drive excitation, Figure 8(a). The phase portrait shows a flat trajectory resulting from the limited response of the shell in radial direction, Figure 8(c).
For ωdrive = 500 × 2π rad/s, the top mass motion is subharmonic: three distinct sets are shown by the Poincaré section, Figure 8(l); the Fourier spectrum, Figure 8(f), presents well-pronounced peaks in correspondence of the odd harmonics (1×(ω/ωdrive), 3× (ω/ωdrive), 5× (ω/ωdrive), 7× (ω/ωdrive), 9× (ω/ωdrive)) and relative side-bands, in particular for (ω/ωdrive) =
Figure 9 shows the results relative to the case B. Inside the saturation frequency range, the response of the shell is different respect to what has been observed in Figure 8: for ωdrive = 470 × 2π rad/s, the response is quasi-periodic as proved by the close set shown by the Poincaré map, Figure 9(h); for ωdrive = 500 × 2π rad/s, the top mass acceleration spectrum exhibits an increased contribution of the fifth harmonic, Figure 9(j). Furthermore, the Poincaré map shows a closed set of five distinct points, Figure 9(l), which suggests a period-5 subharmonic motion.
Case C vs case D
In this subsection, the results obtained for downward frequency variation of the drive excitation are compared. The changes in the shell response, due to different temperature gradients, are analyzed and discussed.
Figure 10(a) to (c) show a shell behavior that is qualitatively similar to what is shown in Figure 5(a) to (d), where a soften response of the shell for higher mean temperature can be observed: although the base excitation is the same, Figure 10(d), an enhanced radial response of the shell can be observed for case D, where the maximum of the velocity (Figure 10(b)) grows from 0.06894 m/s (442.5 Hz) to 0.1008 m/s (440 Hz); that matches the laser telemeter measurement, see Figure 10(c), where the maximum displacement shifts backward and grows from 4.906 × 10⁻⁵ m (445 Hz) to 5.813 × 10⁻⁵ m (437.5 Hz).
Bifurcation and waterfall diagrams—downward frequency variation—0.4 V—48 ℃/0 ℃. (a) and (b) Top mass vertical acceleration, and (c) and (d) shell lateral velocity.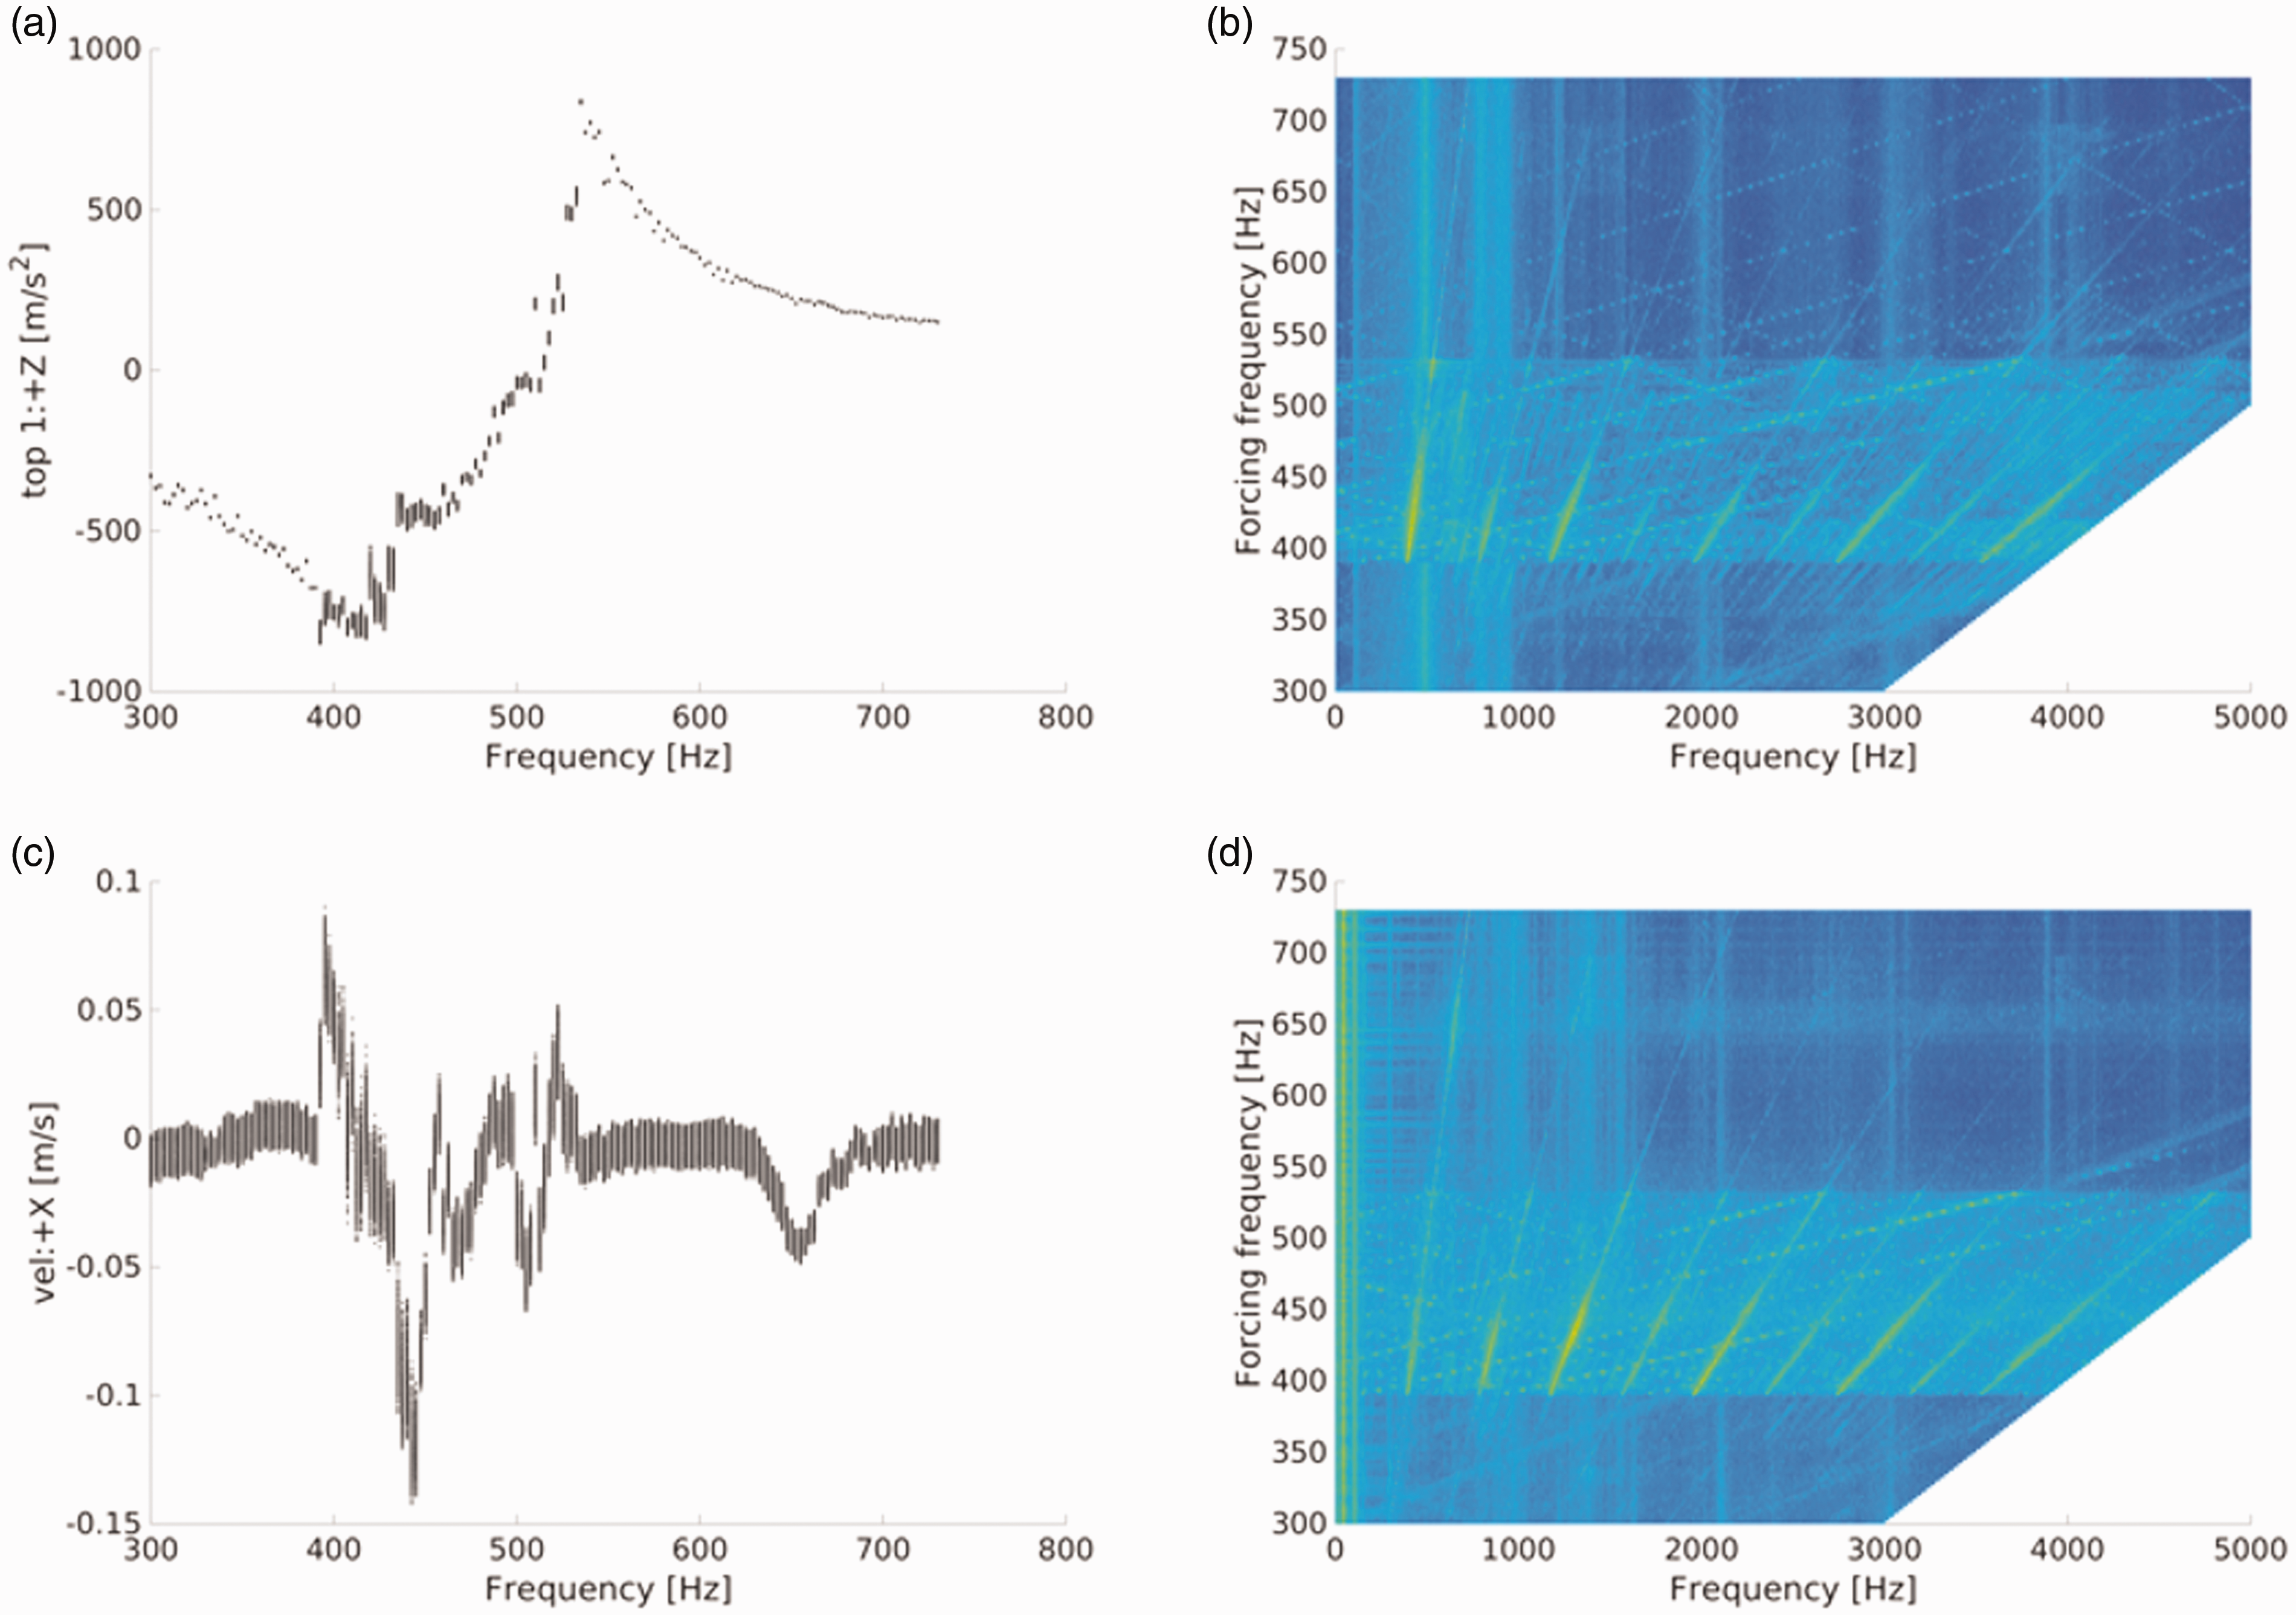
In Figure 11(a), the bifurcation diagram of the top mass acceleration in the z-direction is shown. A vibration irregularity arises at 535 Hz, then the response tends to be more chaotic from 460 Hz to 392.5 Hz. Outside the frequency range 392.5 Hz–535 Hz, the top mass vibration is regular. The radial velocity bifurcation diagrams, Figure 11(a), presents irregular motion in the highlighted frequency range. In the waterfall diagram in Figure 11(b), the first two beam-like modes are visible from vertical lines at 110 Hz (bending mode) and 487 Hz (axisymmetric mode). The same diagram shows clearly the contribution of the odd fundamental harmonics to the top mass response.
Bifurcation and waterfall diagrams—downward frequency variation—0.4 V—48 ℃/20 ℃. (a) and (b) Top mass vertical acceleration, and (c) and (d) shell lateral velocity.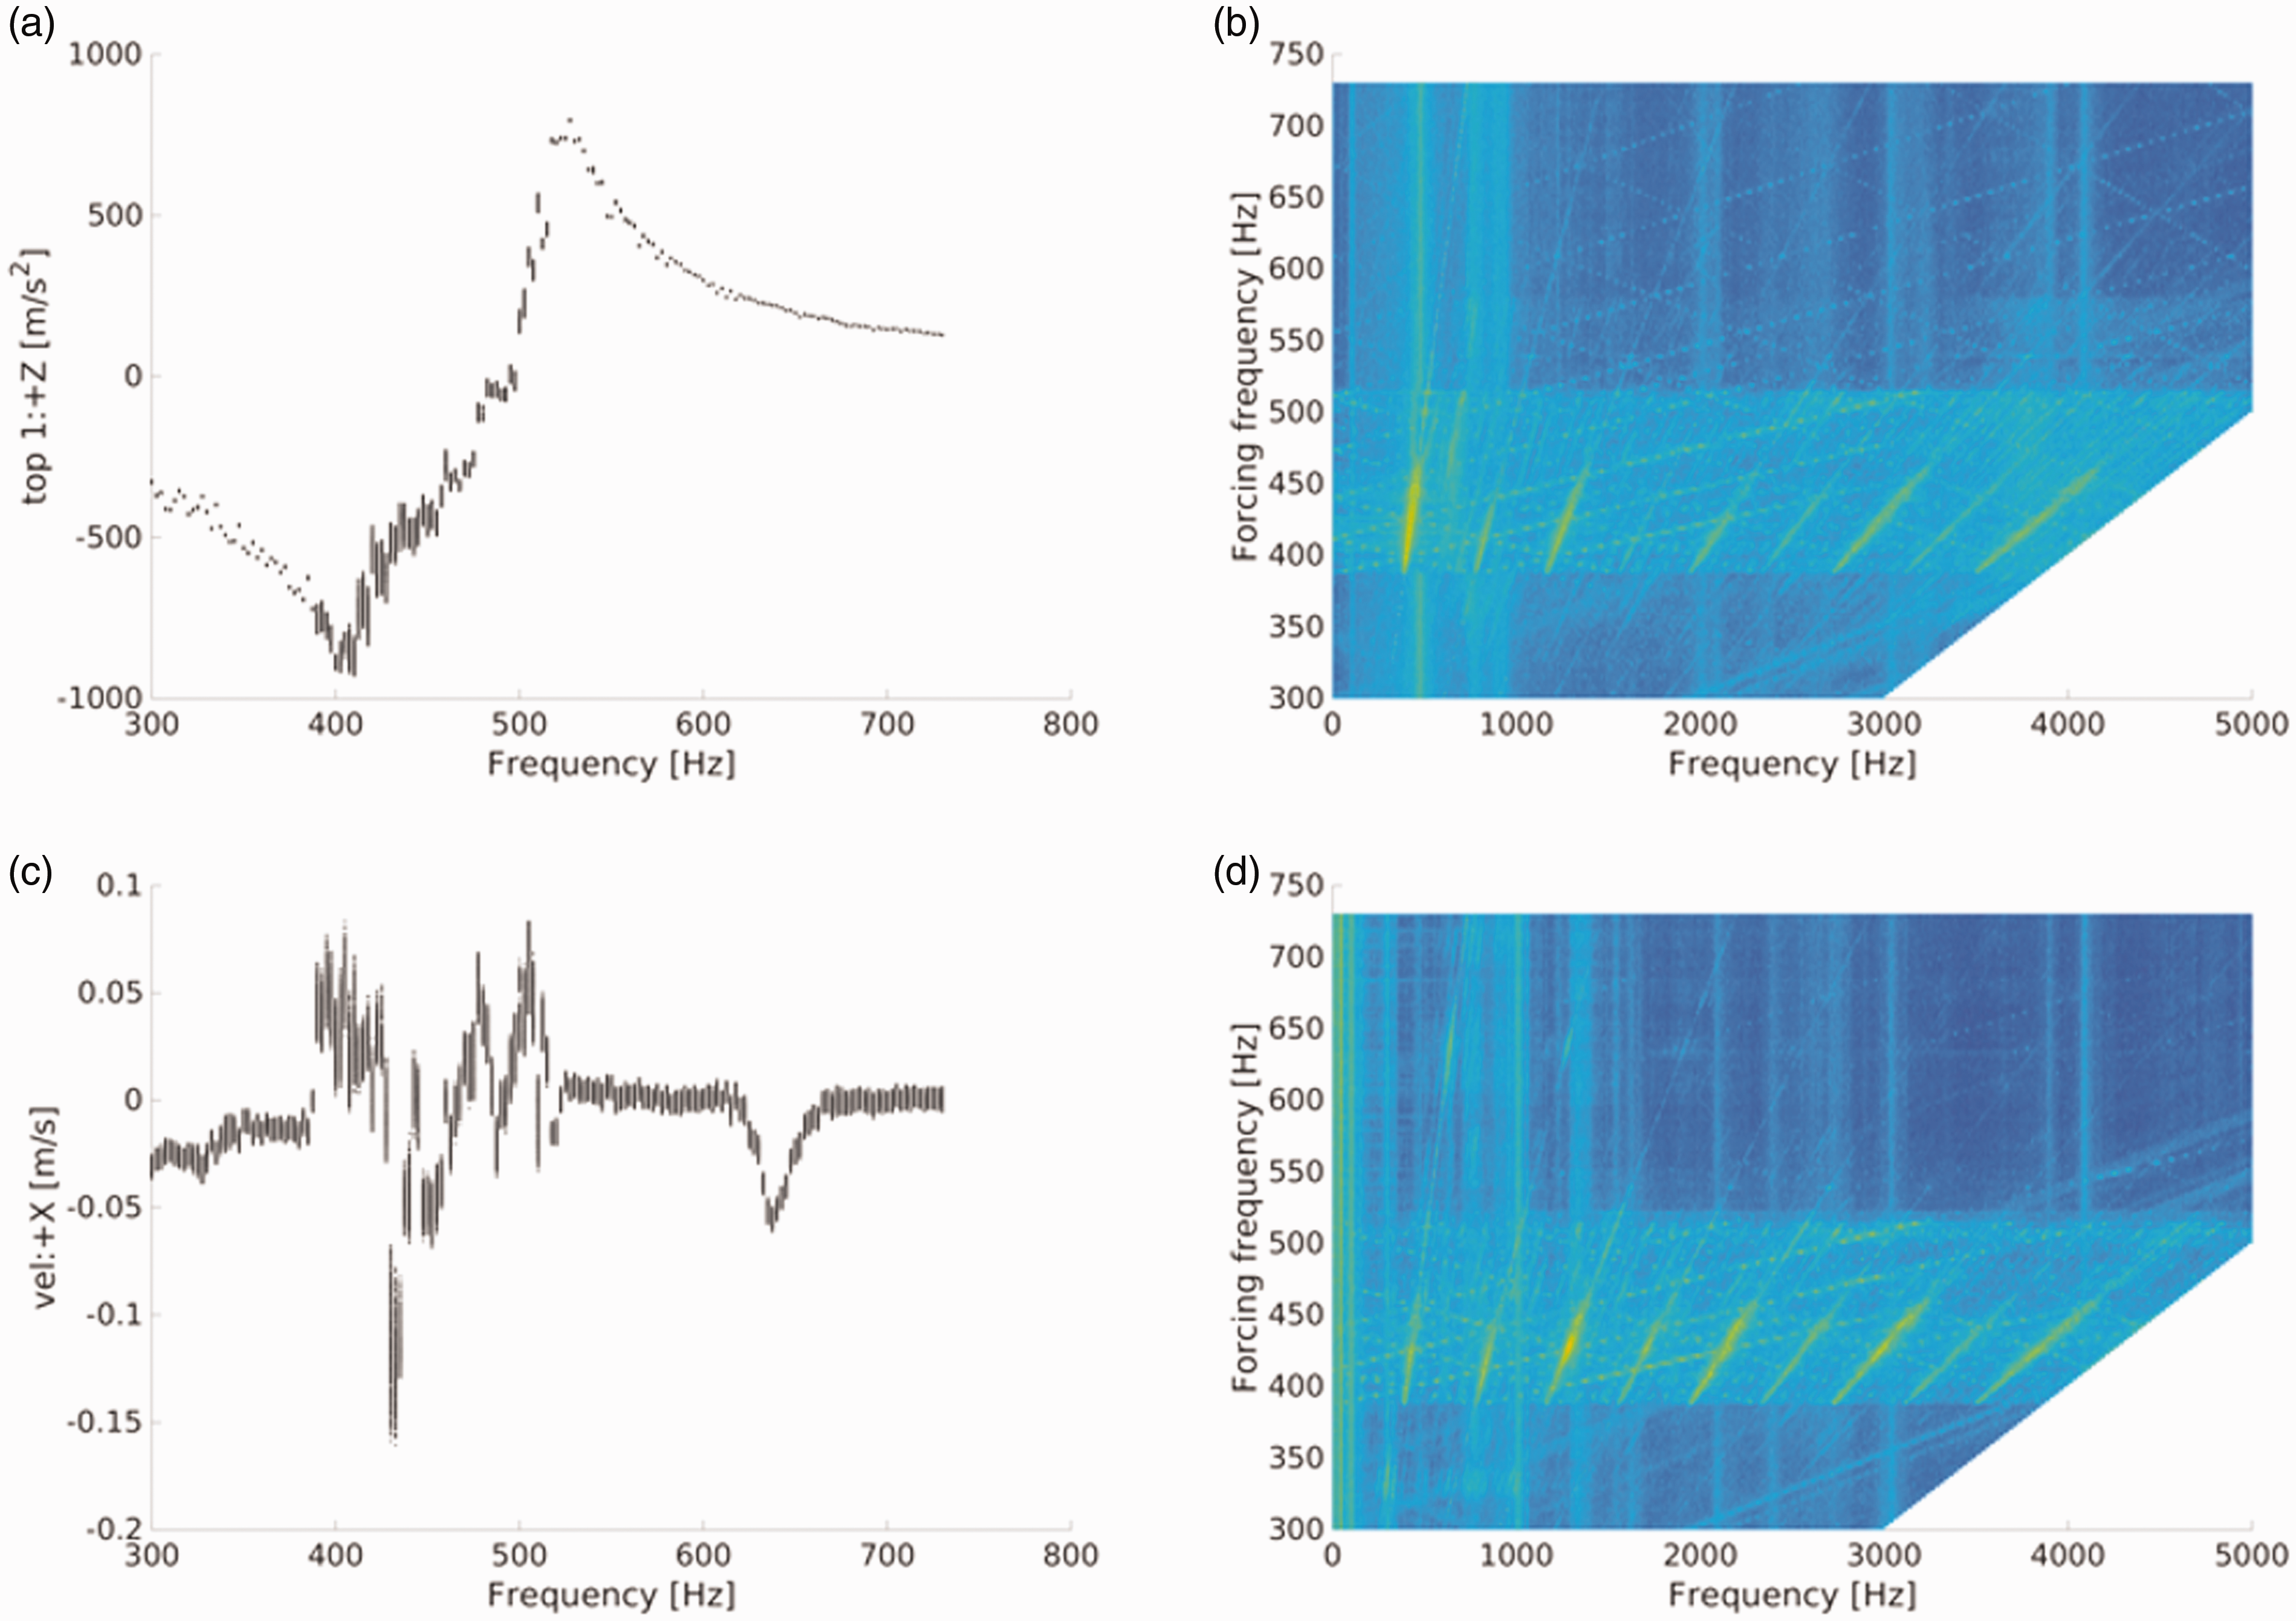
Figure 12(a) to (d) show the bifurcation and waterfall diagrams relative to case D. In Figure 12(a), the saturation phenomenon thresholds are 527.5 Hz–390 Hz, and the top mass waterfall diagram, Figure 12(b), presents a horizontal scattering exactly in the same frequency range. From the lateral velocity bifurcation diagram, Figure 12(c), an unstable motion takes place between 522.5 Hz and 390 Hz; in addition, large radial vibration arises in the 622.5 Hz–665 Hz frequency range. From the diagram in Figure 12(b), the first vibration mode of the structure can be observed at 107 Hz and 476 Hz and correspond to the bending mode and axisymmetric mode, respectively. Focusing on the saturation frequency range, contrary to what is shown in the top mass waterfall diagram, where the response seems to be governed by the fundamental harmonic, the shell radial response (Figure 12(d)) has a bigger contribution from third and fifth harmonics.
Time histories, Fourier spectra, Phase portraits, Poincaré maps—0.4 V—48 ℃/0 ℃; upward. Time histories, Fourier spectra, Phase portraits, Poincaré maps—0.4 V—48 ℃/20 ℃; upward. Time histories, Fourier spectra, Phase portraits, Poincaré maps—0.4 V—48 ℃/0 ℃; downward. Time histories, Fourier spectra, Phase portraits, Poincaré maps—0.4 V—48 ℃/20 ℃; downward.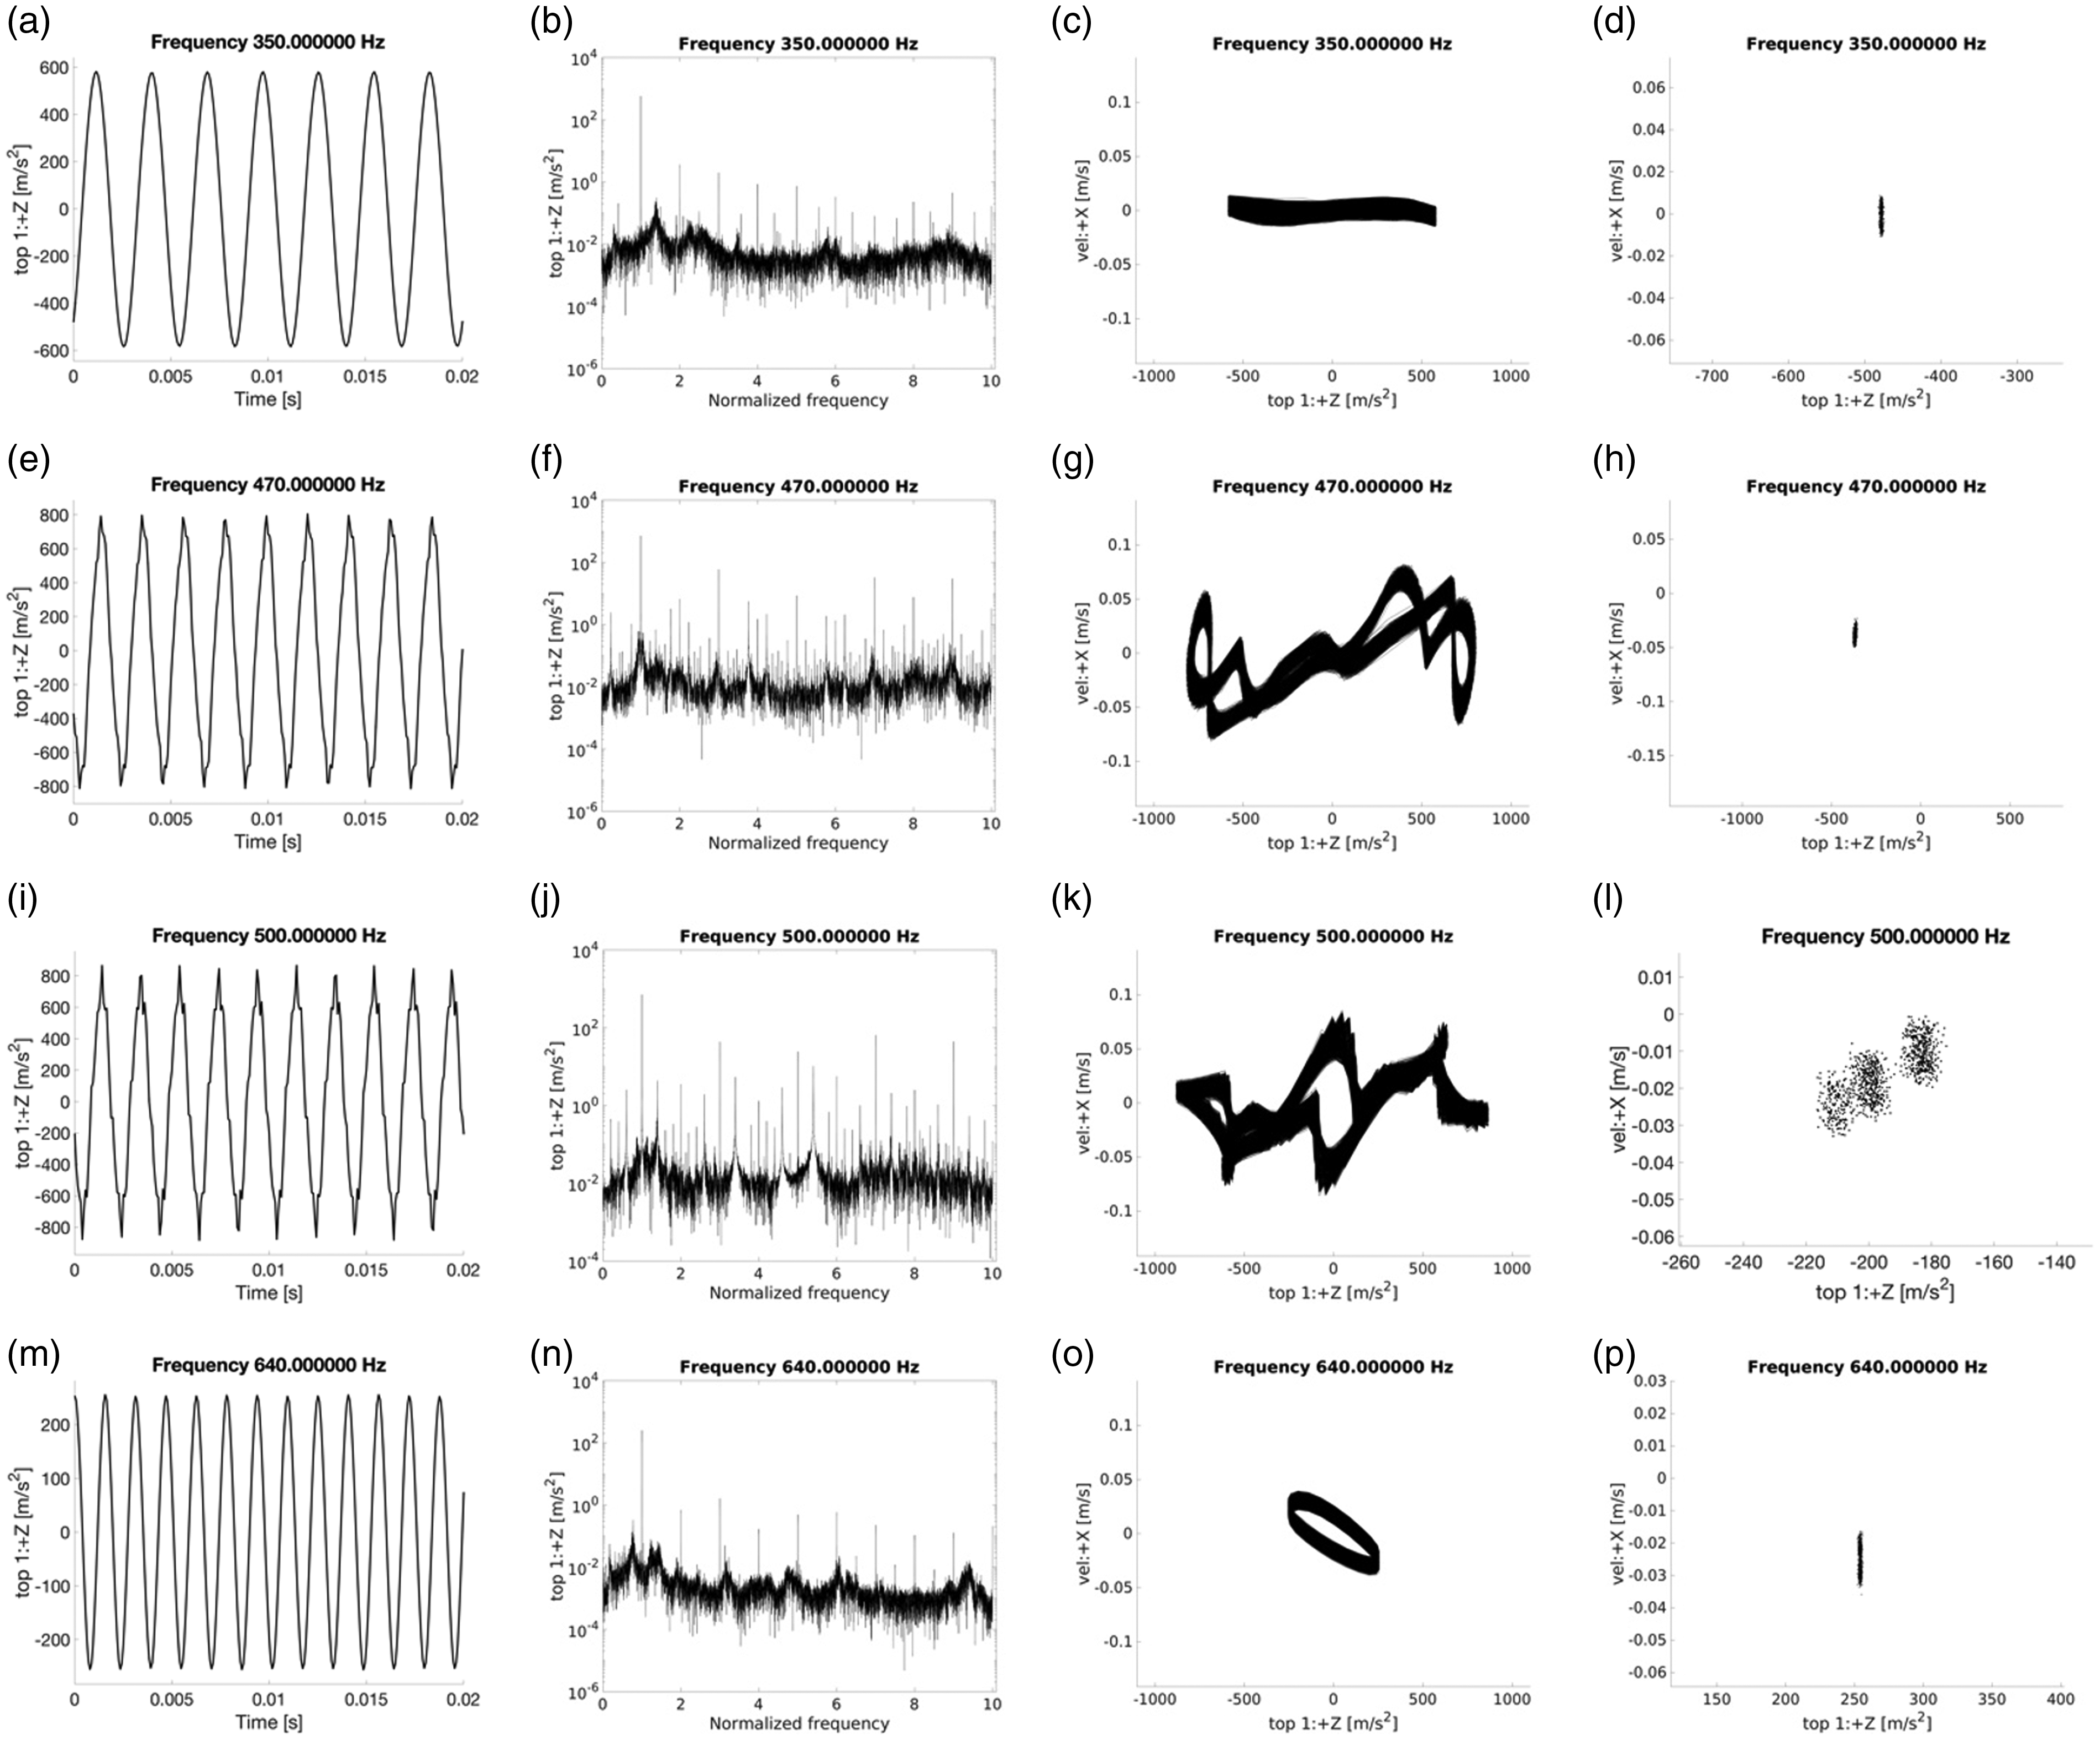
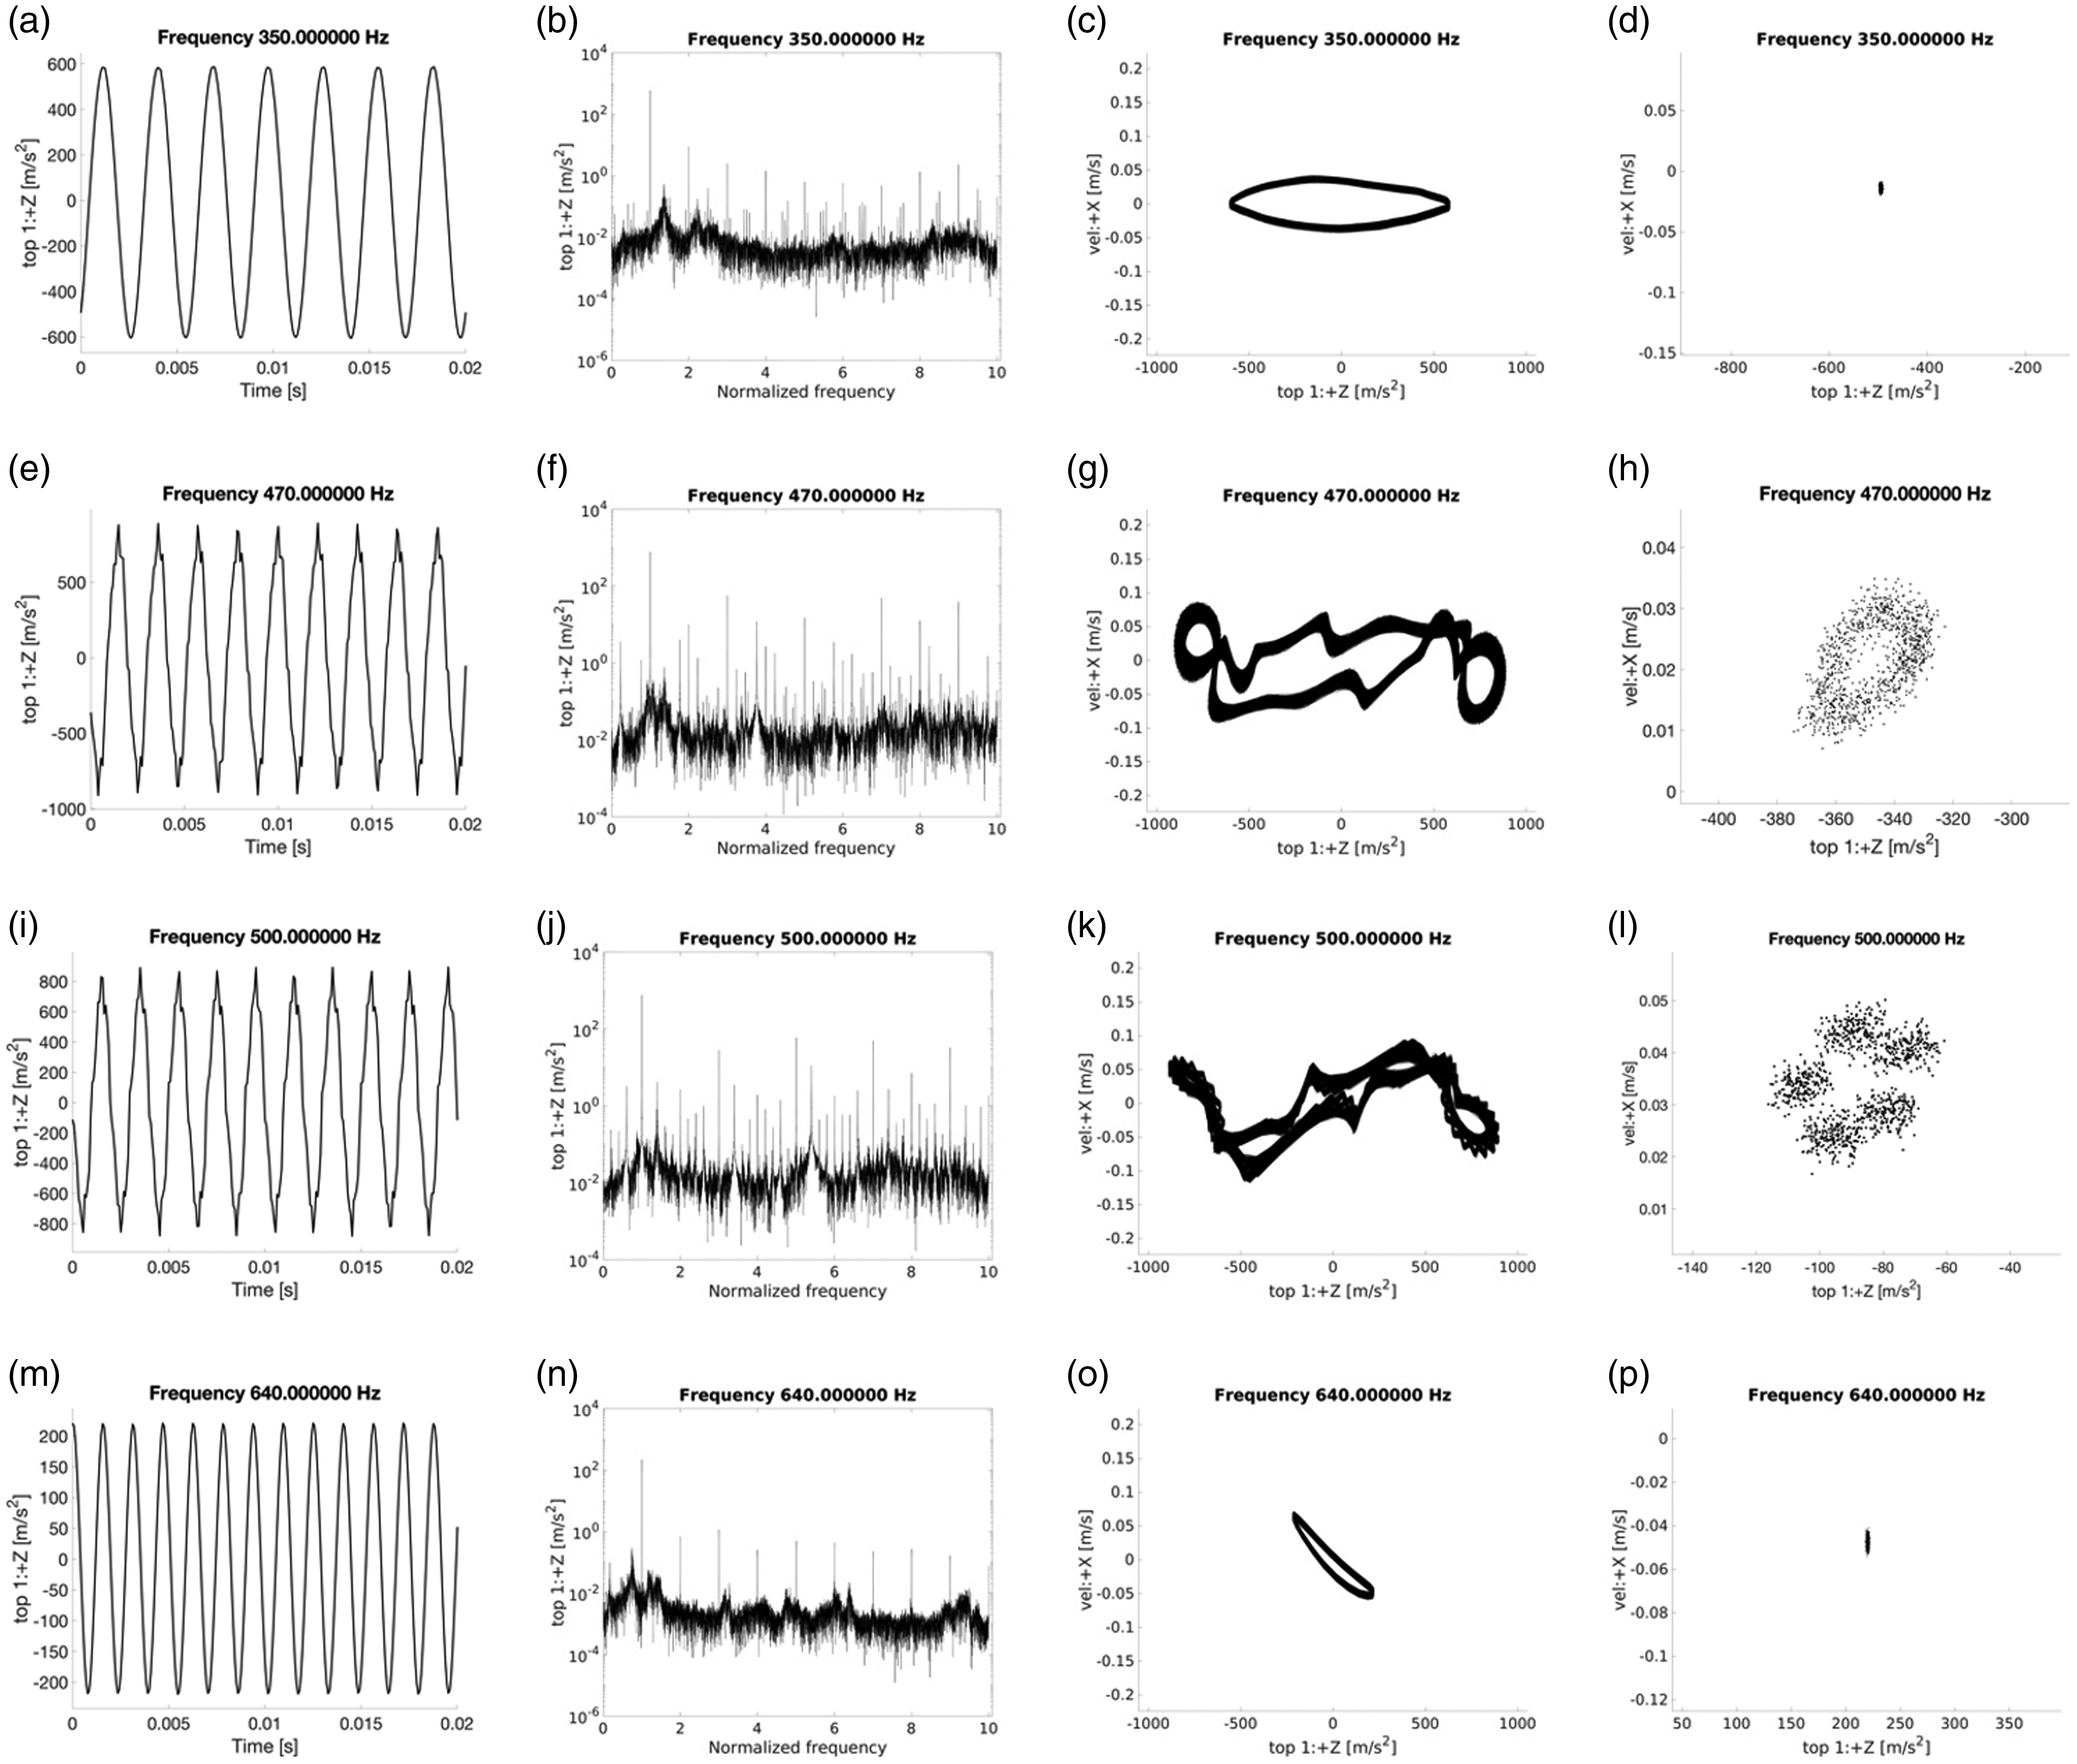
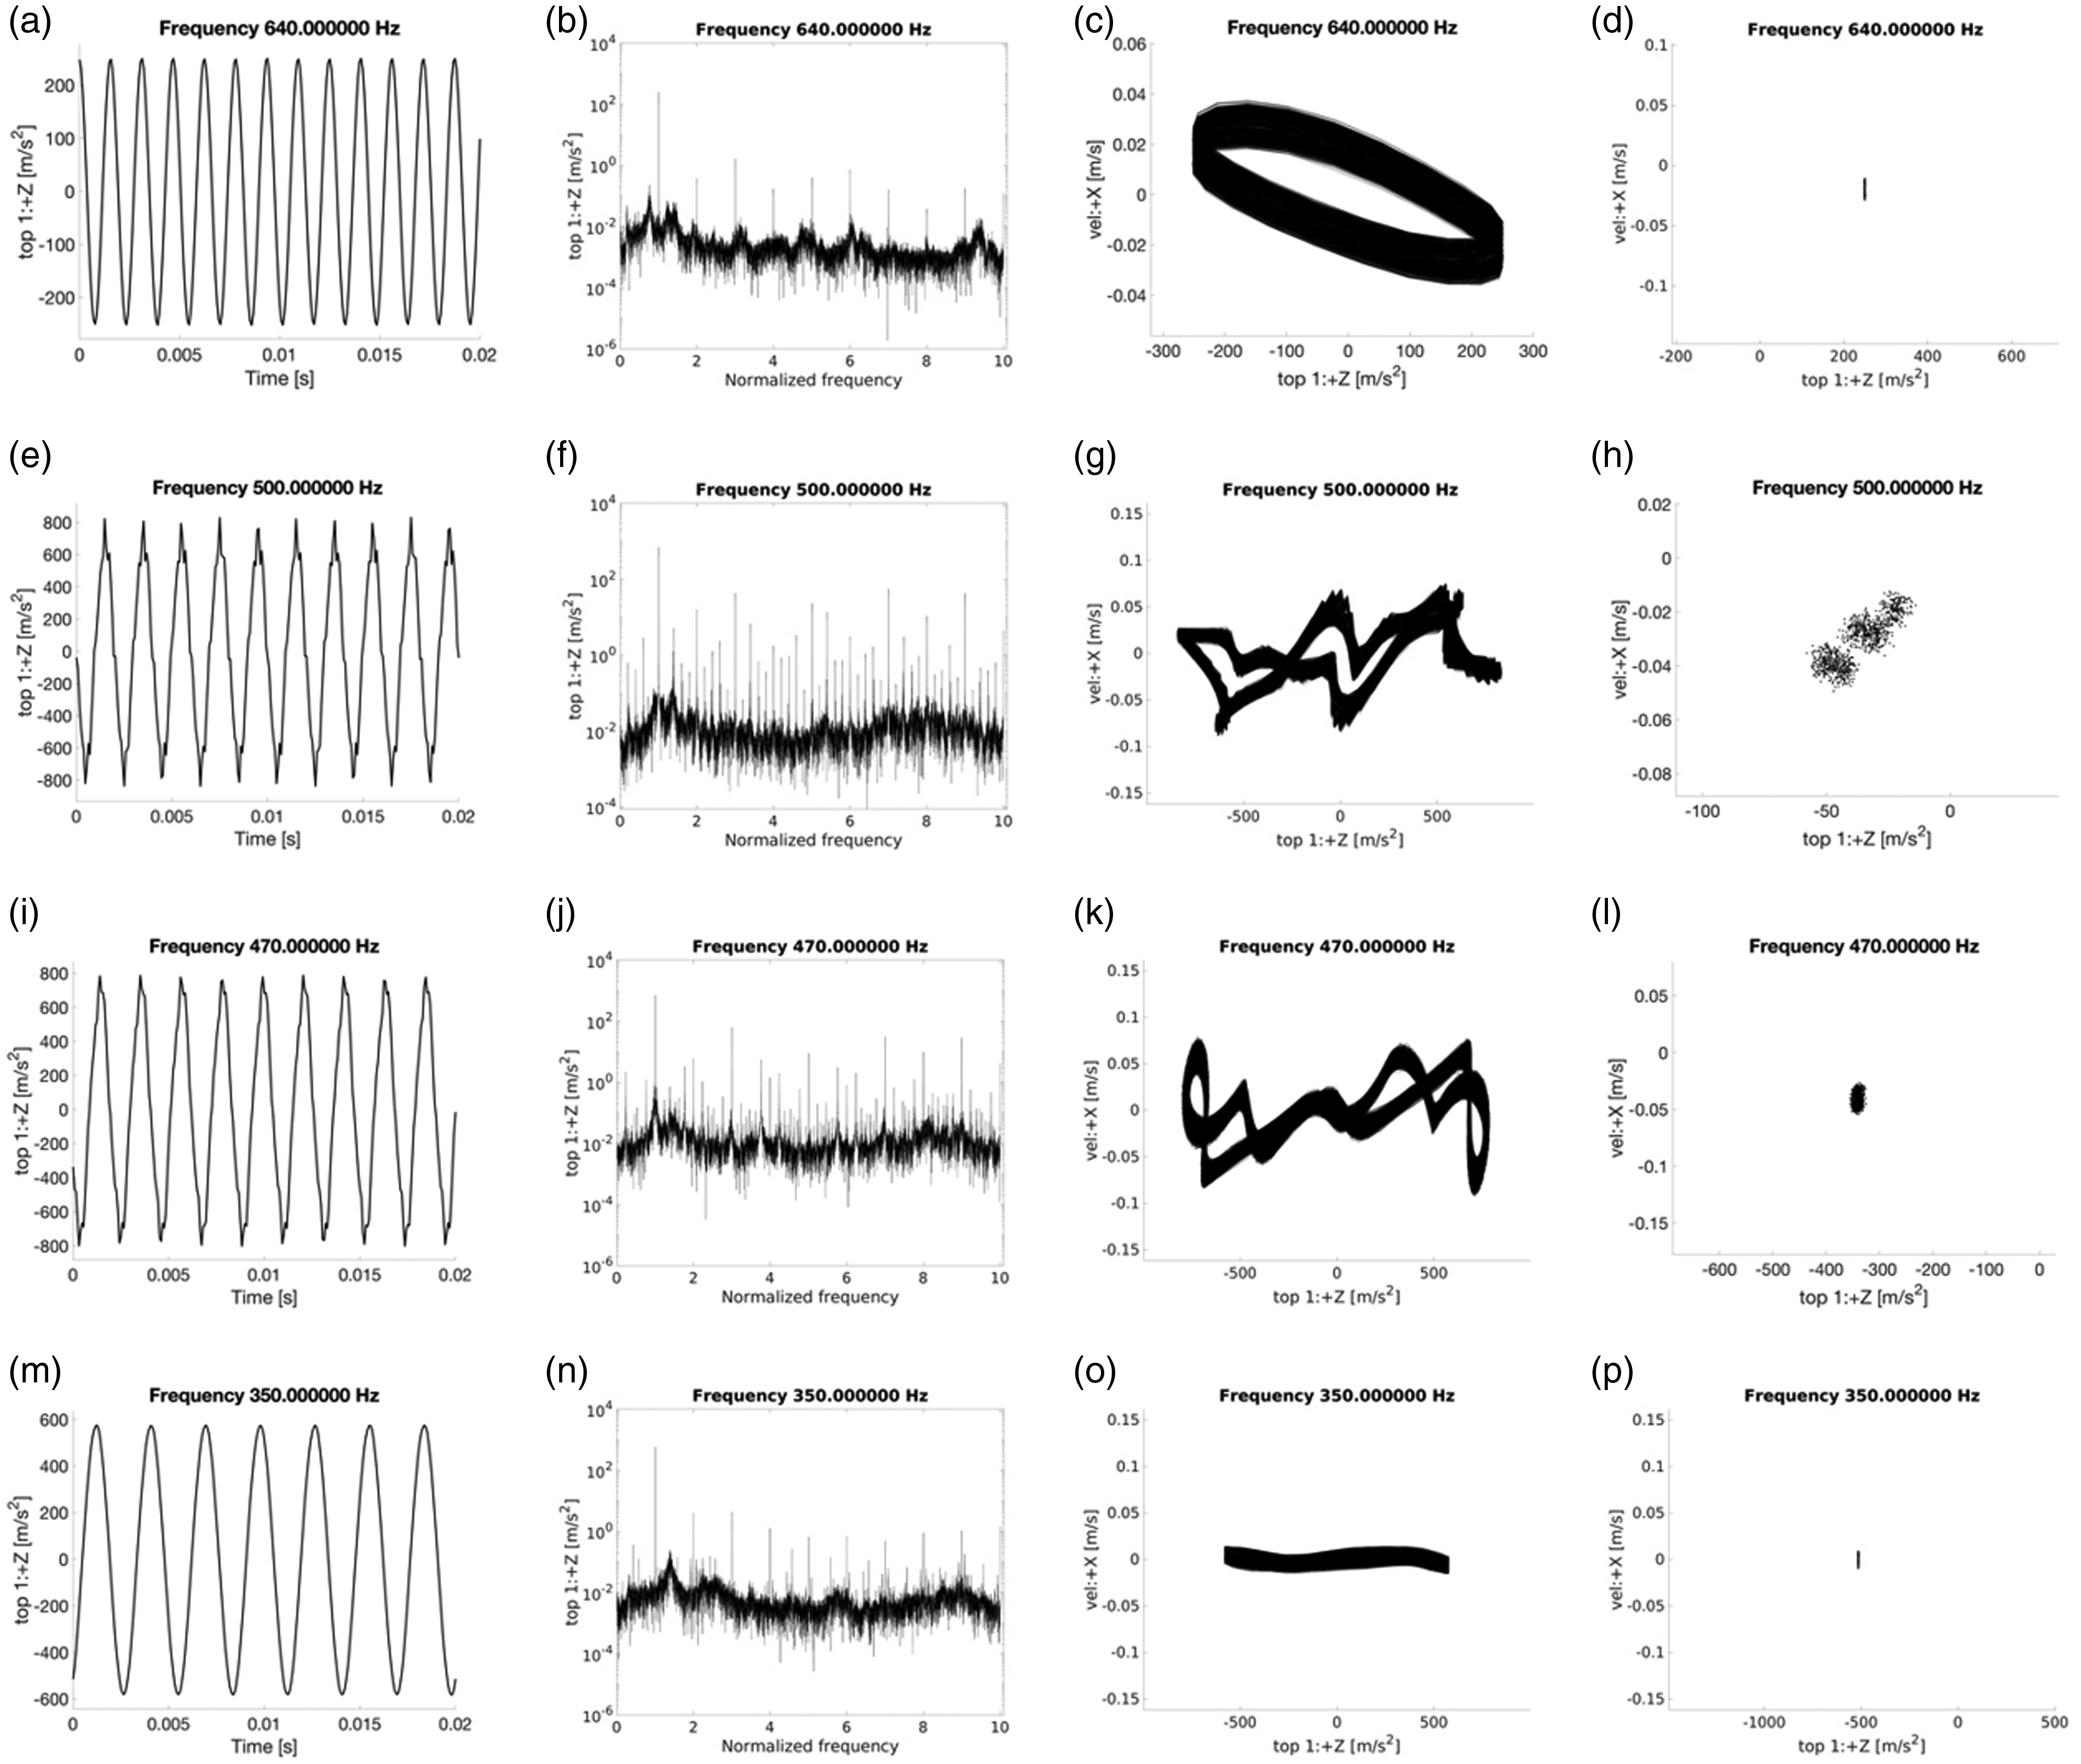
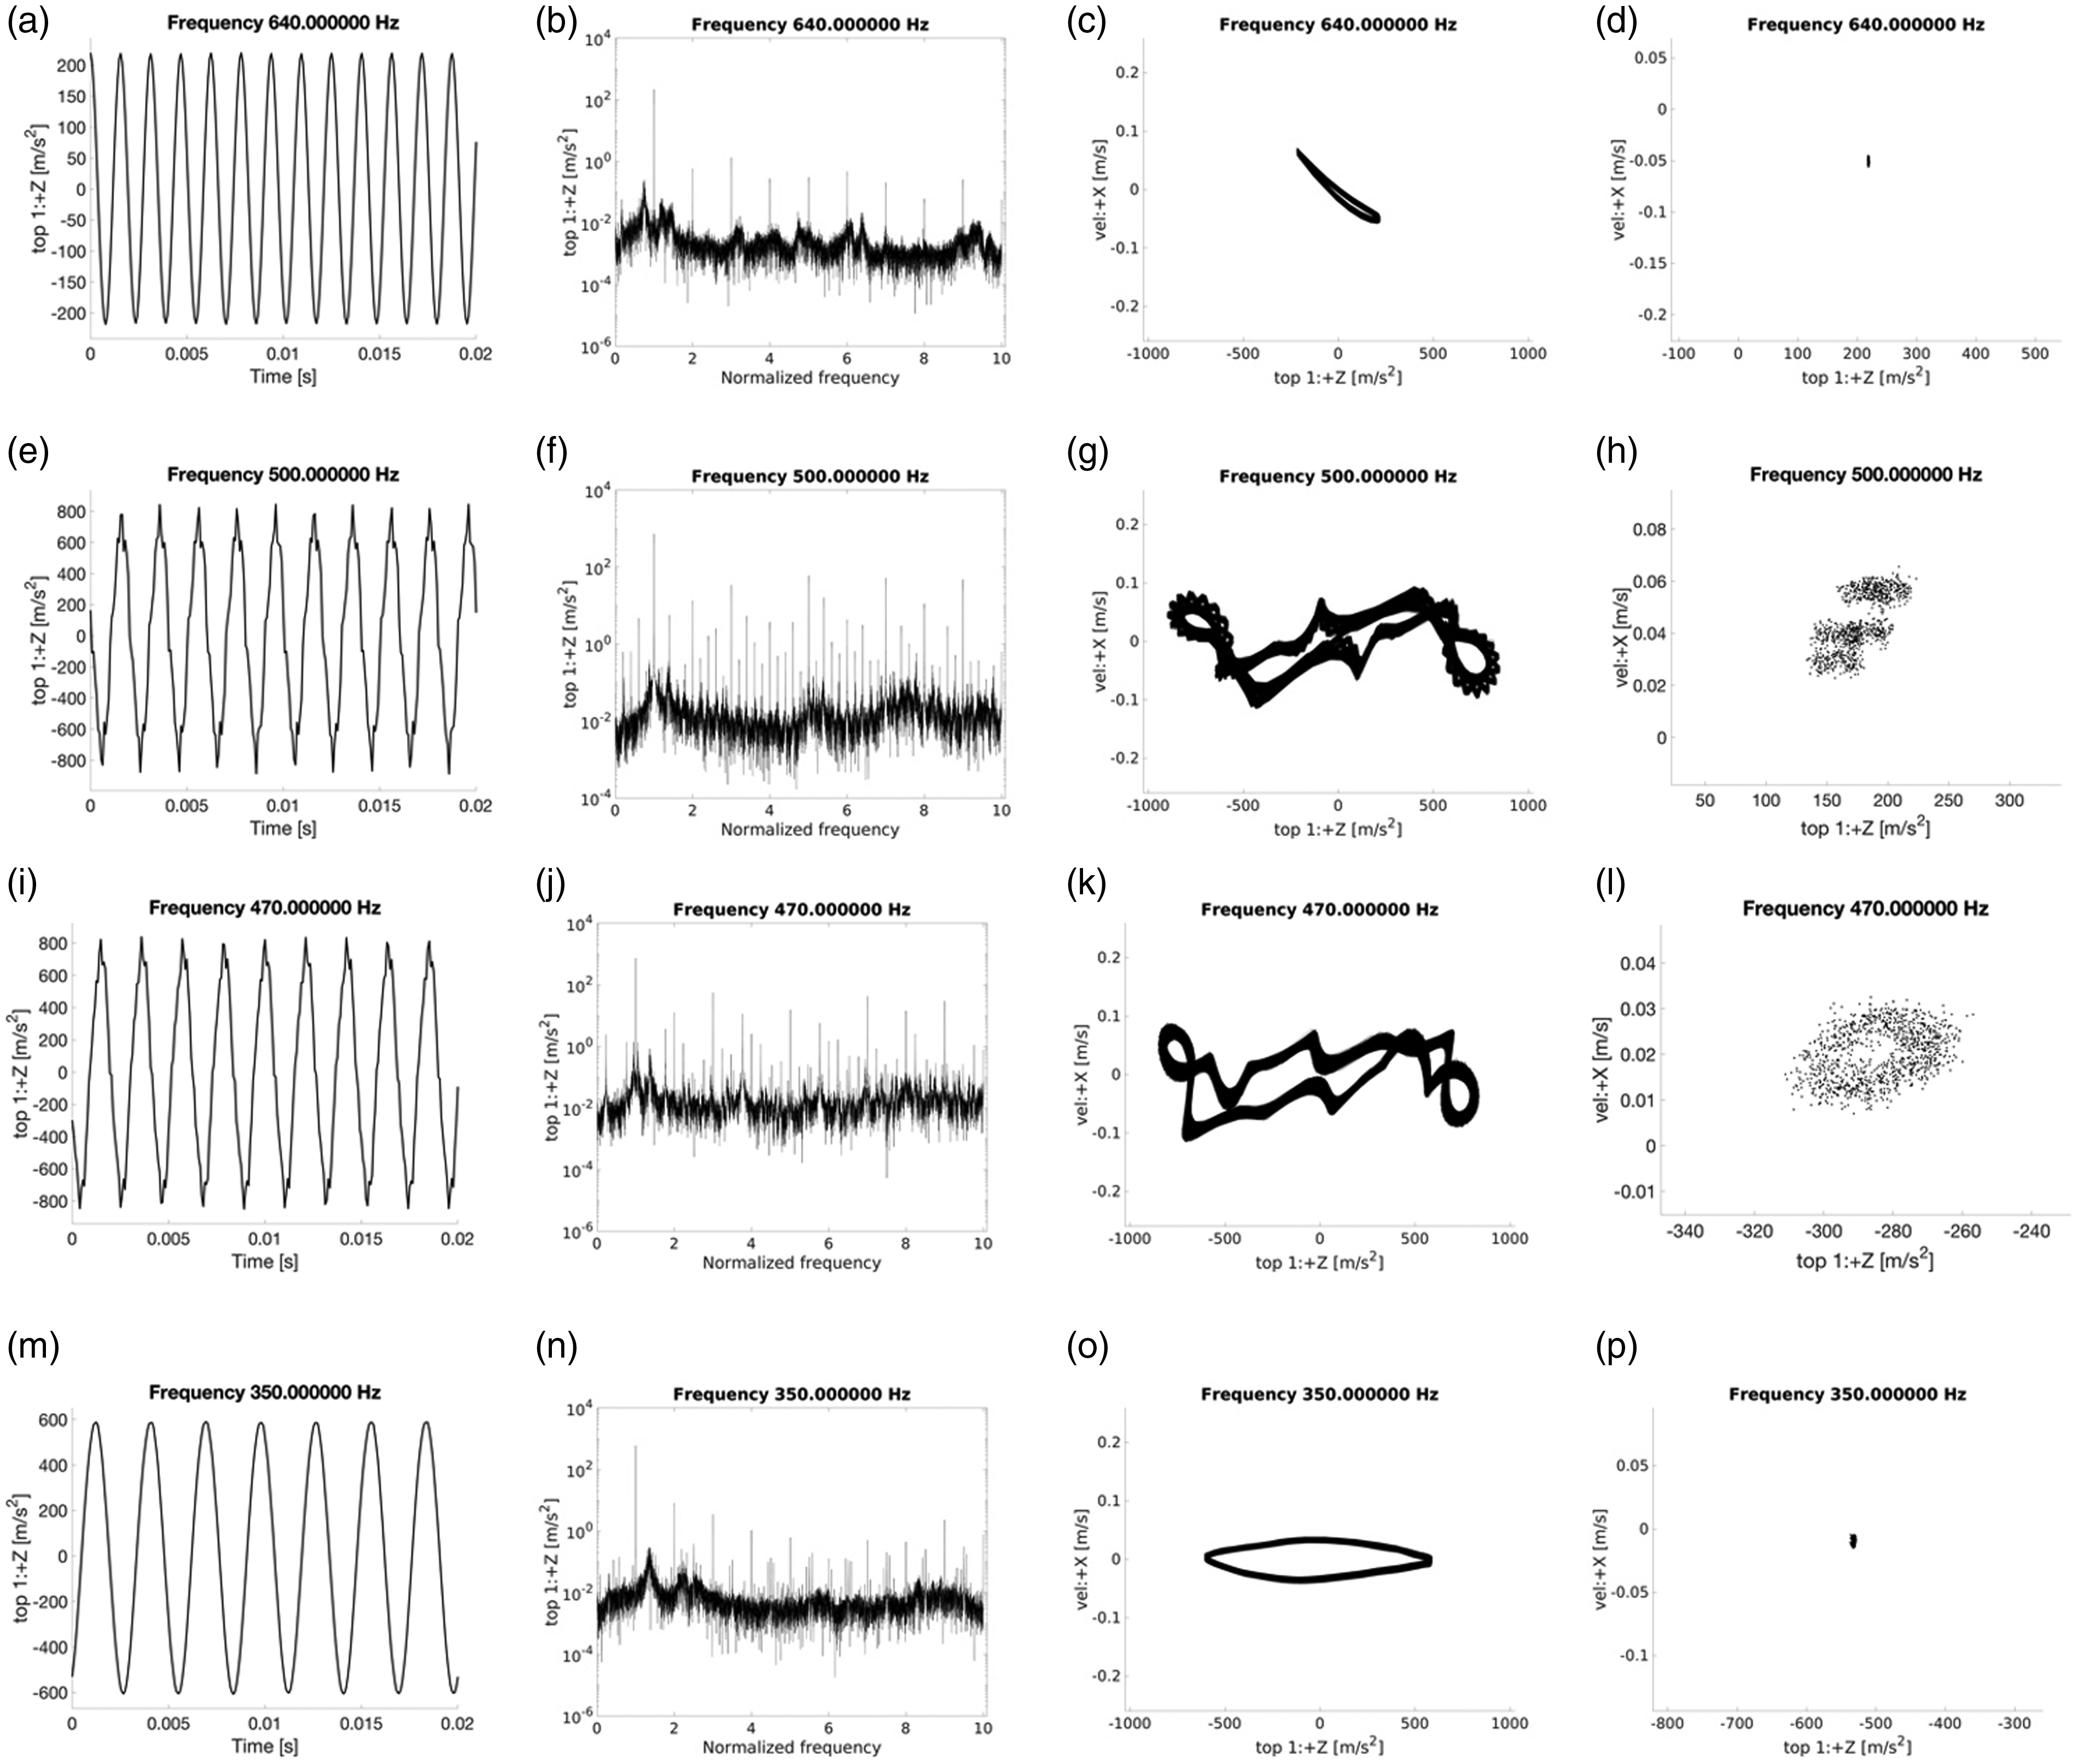
Figure 13 presents the results of case C. Outside the saturation region, when ωdrive = 640 × 2π rad/s, as well as for ωdrive = 350 × 2π rad/s, the top mass motion is periodic with the same frequency of the drive excitation; small radial motion and flat trajectories are shown by the phase portraits diagrams, Figure 13 (c) and (o). For ωdrive = 500 × 2π rad/s: the top mass motion is strongly nonlinear, period-3 subharmonic is shown by the Poincaré section, Figure 13(h), and a broad-band Fourier spectrum, Figure 13(f), is governed by odd harmonics (1×(ω/ωdrive), 3 × (ω/ωdrive), 5 × (ω/ωdrive), 7 × (ω/ωdrive), 9 × (ω/ωdrive)) and side-bands for (ω/ωdrive) =
In Figure 14, for a test performed with a lower temperature gradient (28 ℃) but with a higher mean temperature (34 ℃), the response is similar to what has been presented in Figure 13. Needs to point out that for ωdrive = 470 × 2π rad/s, different shell response is observed: a quasi-periodic motion takes place, as demonstrated by the closed set shown by the Poincaré map, Figure 14(l).
Conclusions
In the present work, the effects of the temperature on the nonlinear dynamics of a polymeric cylindrical shell have been experimentally investigated. Both homogeneous temperature and gradients across the thickness are studied.
Two different temperature gradients (48 ℃, 28 ℃) and several load-amplitude excitations (0.1 V, 0.2 V, 0.3 V, 0.4 V) have been investigated.
Tests have been carried out in controlled hygrothermal environment conditions. In order to excite the first axisymmetric mode of the shell, the specimen has been forced in the longitudinal direction through base harmonic motion in the frequency range 300Hz–730 Hz.
The shell exhibits larger amplitude vibrations during the tests performed with a higher temperature. The results confirm the strong temperature dependence of the mechanical properties of the polymer such as damping and Young’s modulus. Moreover, tests performed under different temperature gradients show a completely different dynamic scenario: strong subharmonic vibrations, quasi-periodic responses, as well as saturation phenomenon have been observed.
Footnotes
Declaration of Conflicting Interests
The author(s) declared no potential conflicts of interest with respect to the research, authorship, and/or publication of this article.
Funding
The author(s) disclosed receipt of the following financial support for the research, authorship, and/or publication of this article: The authors thank the Regione Emilia Romagna for supporting this research, Project “DiaPro4.0” (PG/2018/632156).