
Abstract
In order to calculate the efficiency of an automotive manual transmission, taking into consideration the effect of its most power consuming components – gears and bearings – as well as the interactions between them is of high importance. In this paper, a dynamic model has been developed which can predict the frictional losses of a complete gearbox as a system and, thus, its efficiency. The effect of temperature on bearing preload is also considered and taken into account from a system perspective identifying its effect on the bearings frictional losses (as well as the overall efficiency). The operating conditions used are snapshots of the Real Driving Emissions driving cycle, which is a standard metric for automotive manufacturers. Results show that doubling the temperature can lead to 120% increase of the bearing losses and up to 140% increase of the total transmission losses. The effect of the variation of operating conditions (velocity and torque) is also taken into account. The novelty of this paper lays in the development of a dynamic model which takes into account the performance of a complete gearbox under transient operating conditions, as well as the interaction among its main components and the ability to make changes on the influencing factors of transmission efficiency so that their effect on the complete gearbox efficiency can be tracked. This has not been yet reported in the relevant literature which mainly focuses on the influencing factors of transmission power loss and efficiency experimental measurements under various operating conditions for gear pairs instead of complete gearboxes.
Introduction
The necessity for reduced fuel consumption and emissions due to the imposed regulations leads to the requirement for higher efficiency transmissions. 1 Nevertheless, in-depth research on the total frictional losses of gearboxes is not common in the available literature due to the fact that their efficiency is already considered high with values up to 97%. 2 Moreover, in the past years, the main focus has been on controlling Noise, Vibration and Harshness.
However, research has been reported on the efficiency of manual transmissions. To be more precise, experimental measurements have been conducted by various researchers to track either the transmission power loss under various operating conditions or the effect of several factors on transmission efficiency. 3 Nevertheless, due to the experimental nature of this research approach, the influencing factors of gearbox efficiency are often summarized to the types of gears used in gearboxes or even the type of transmission, as well as the type of vehicle itself. 4 Another approach on estimating transmission efficiency has been the categorization of the different types of loses that occur both on the gears and the bearings of manual transmissions. Experimental tests have been conducted in order for this categorization as well as the proposed most dominant loss sources to be verified.5,6 However, this is not considered an approach for complete transmission efficiency since the interactions neither within the gear pairs nor between the gears and bearings are taken into consideration. On the other hand, literature findings show that transmission efficiency simulations are limited, especially when the effect of multiple influencing factors is taken into account or the interactions among the transmission main components.7,8 To be more precise, in most cases of calculating power losses, gear pairs or bearings are individually examined. 9 It should be mentioned that some approaches on the interaction between gears and bearings on the same shaft have been conducted but not for complete gearbox scale. 10 Nevertheless, predictions of complete transmission losses can be found in the literature. The models employed in most cases are quasi-static instead of dynamic and, most importantly, the interactions between the bearings and gear pairs are not taken into account even for cases that bearing losses are considered part of the total transmission efficiency calculation. 11 To be more precise, on some cases, models have been developed in order to calculate specific types of losses even including experimental validation but usually they refer to a single gear pair, leading to misinterpretations of their effect on complete transmissions. 12 It should be mentioned, however, that there are cases where a complete gearbox is examined but the operating conditions are not representative of a real automotive transmission (high speeds and torque values are not examined, the transient changes in the operating conditions cannot be tracked or there are difficulties on utilizing the low-speed conditions).13,14
For the development of a complete automotive gearbox dynamic model, it is necessary to evaluate the power loss of its main components. Synchronizers and seals contribute to transmission losses; however, it has been shown 15 that their power losses are 15% or less of the total transmission power loss and, consequently, may be neglected due to the fact that any improvements could not increase the total efficiency considerably. On the other hand, the efficiency of gears can vary based on the type employed with some types being highly efficient, reaching efficiency values of even 98%. Nevertheless, there are gear types characterized by 90% efficiency, which points to the need of investigating gear teeth mechanical losses. 16 Additionally, bearings are also used in every manual transmission and introduce frictional losses which make them the second most power-consuming gearbox part. 17 Since tapered roller bearings are widely used in manual transmissions, it is important to study their performance and introduce improvements that could reduce their frictional losses. The effect of temperature on the performance of tapered roller bearings should also be taken into account since it vastly affects the value of thermally induced preload. 18
The main types of bearing losses are due to viscous and boundary friction in the contacting elements. 19 For cylindrical roller bearings and tapered roller bearings, the value of the initial preload can be an important factor for the generated friction during operation, and even if it is carefully considered in the design stage, it will always affect the power consumption. 20 Besides the initially applied preload, thermally induced preload is also generated during operation due to uneven thermal expansion of the bearing components and has a consequence on bearing losses. Its effect can be reduced with preload compensation via different suggested mechanisms. 21
The generation of thermally induced preload is completed in four stages: (a) the heat generation due to friction, (b) the heat transfer on the bearing parts, (c) the component expansion following the heat transfer and (d) the contact force induction. 22 The factors affecting the generated thermally induced preload are the bearing deflection caused by the instantaneous radial and axial forces, the uneven thermal expansion between the rollers, the outer ring/housing geometry and finally the rotational speed of the bearing. 21 The thermally induced preload affects the efficiency of the complete transmission.
In this paper, a tribodynamic model of a manual transmission has been developed for calculating efficiency. The novelty of the model lies on the fact that it takes into account the interactions between the main gearbox components (gears and bearings) on calculating their mechanical losses leading to the prediction of the complete transmission system efficiency as well as the effect of temperature. Consequently, thermally induced preload is also considered. The simulations use the Real Driving Emissions (RDE) driving cycle as input operating conditions to provide a useful predictive tool of the manual transmission losses for industry purposes. Results show that the temperature increase has a major effect on the generated frictional losses of the bearings (consequently adding to the total transmission losses).
Methodology
System model description
The manual transmission system model predicts the dynamics of gears and their effect on the tribological performance, hence efficiency of the tapered roller bearings. The simulations run for different temperatures of the bearing rolling elements in order to capture the temperature effect on preload and, consequently, on the friction generated at the bearings. The transmission examined is shown in Figure 1.
The examined transmission layout.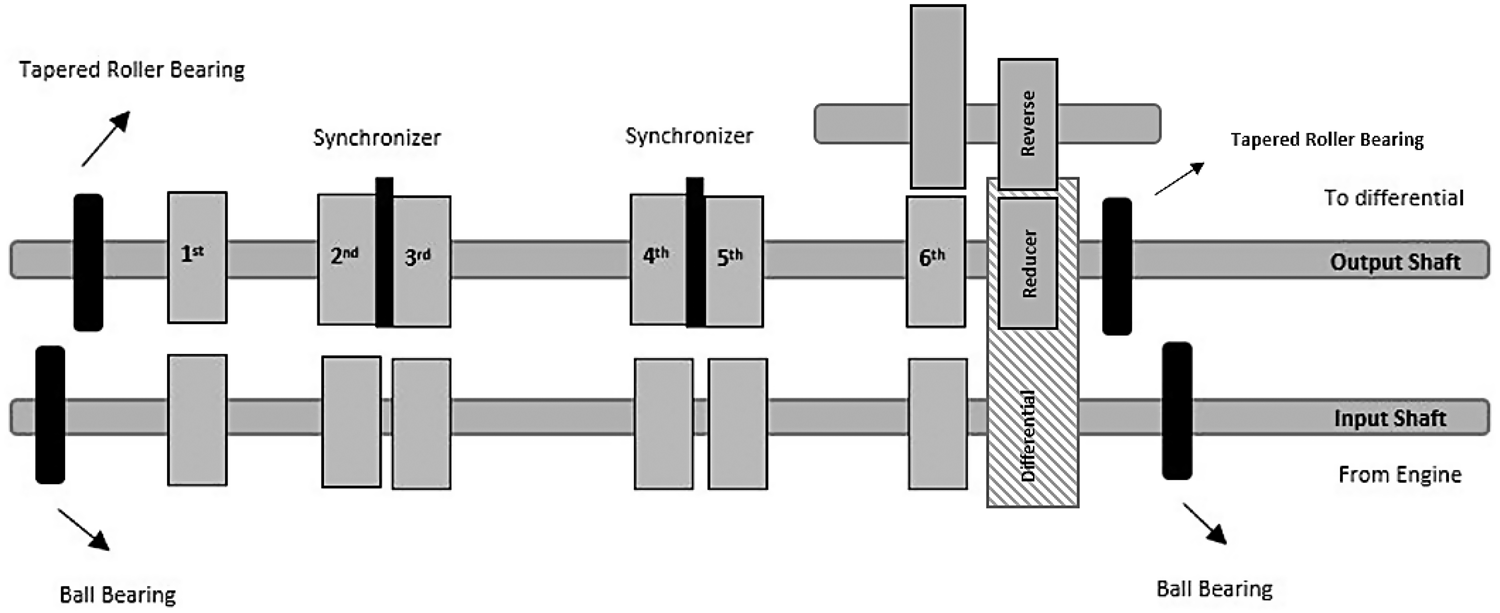
In order for the model to calculate the complete frictional losses of a manual transmission, taking into account the interactions between gears and bearings is of high importance. This is achieved by calculating the generated dynamic load during gear meshing and transferring its effect to the bearings. It has to be emphasized that the bearing loss calculations are not conducted simultaneously with gear meshing calculations. 23 Nevertheless, this approach can be reliable, since all the gear meshing data are used to evaluate the bearing condition. It should be pointed out that gear teeth modifications are not investigated in this research. The transmission was examined without assessing if different materials or geometry would have a beneficial effect on its efficiency.
The input shaft velocity values for each time step are taken from the RDE driving cycle. Based on the driving cycle data, the engaged gear is identified. For each gear pair (loaded or unloaded), the equations of motion are solved using an iterative method in MATLAB. The equation of motion of each gear is solved using MATLAB’S ode45 function, which applies a Runge–Kutta iterative method to calculate the output shaft velocity for the loaded gear case (and that of the loose gear in the unloaded cases) and the loads on the gear teeth, with the different types of friction included.
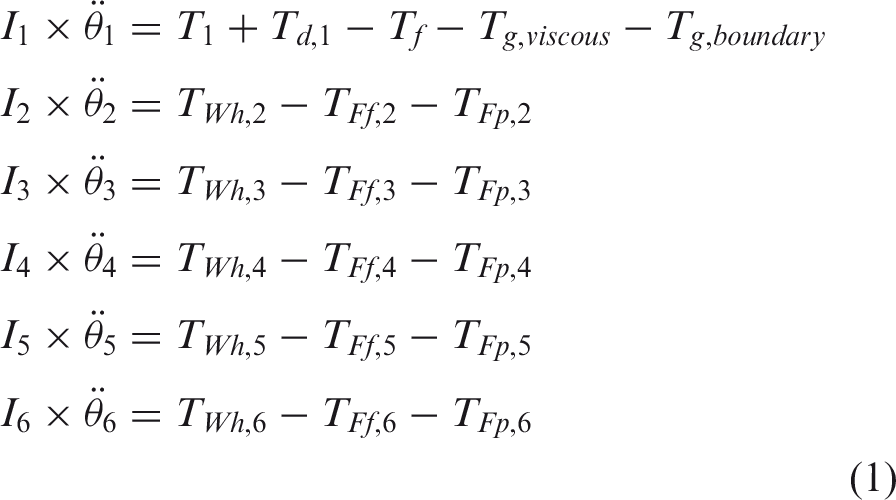
It should be stressed that different equations of motions describe the operation of loaded and unloaded gears. The model has 6 rotational degrees of freedom (DoF) due to the examined gearbox consisting of six gear pairs. One degree of freedom describes the dynamics of the engaged gear pair whereas the other five represent the loose gears. The simultaneous solution of the 6 DoF system of equations allows for calculating the transmission power loss at each instant of time. For the scenarios examined in this research either the first or the second gear pair is engaged. A similar approach (equations of motion) would be used for any other gear pair engaged, since the model created has the ability to track the engaged gear pair and modify its equation of motion. The following equations of motion are solved for the first gear pair being engaged
24
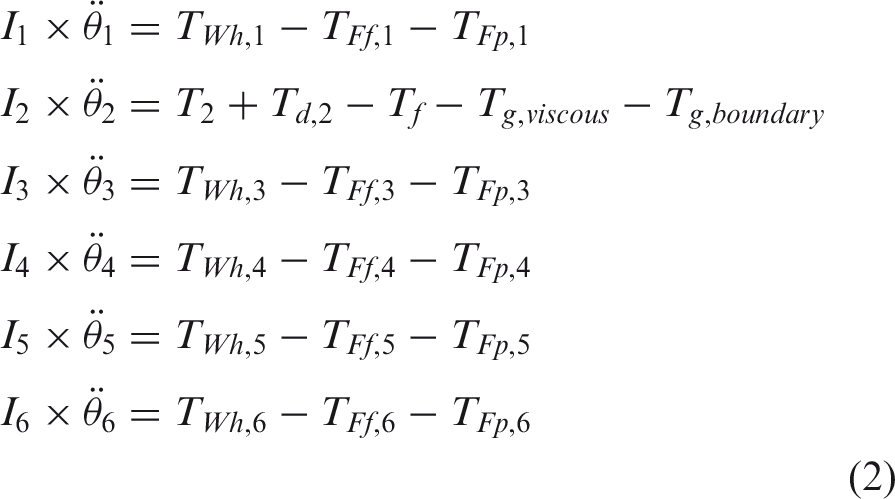
Consequently, for the case of the second gear pair being engaged, the set of equations of motion is modified to
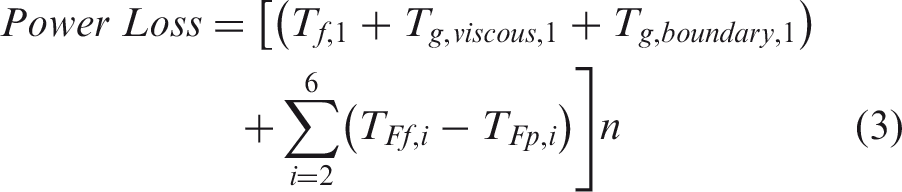
By solving the aforementioned set of equations of motion, the different reactions applied on gear pairs have been calculated. In order for the power losses to be calculated at each time step of operation, equation (3) is used which is modified based on the gear pair that is engaged. The power loss expression below assumes that the first gear pair is engaged
Applied load on tapered roller bearings and the effect of thermally induced preload
The main characteristic of tapered roller bearings is the ability to undertake both axial and radial loads. 4 For the current case of manual transmission, these loads are a result of gear meshing. However, in this section, the focus will be given on the calculation of the applied load on the bearing rolling elements since it is a complex procedure requiring an iterative method.
The application of load leads to two different deflections on the tapered roller bearing elements, one on axial (
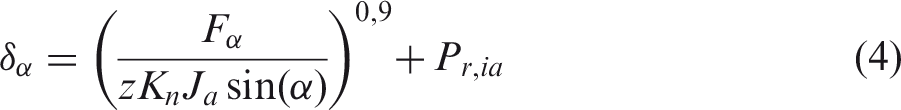
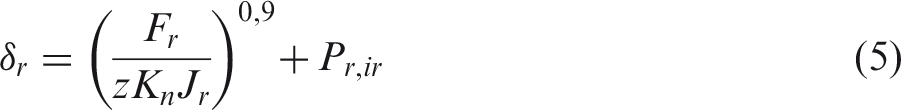

Let Ja and Jr denote the axial and radial integrals, respectively. The values of these integrals depend on the load distribution factor e
28
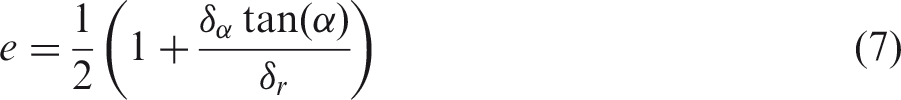
Complicate differential equations describe the relationship between the integrals and the load distribution factors. 29 However, solving these equations is not required since tables can be found in the literature, which describe their relationship via precalculation of these integrals. In this model, the aforementioned tables are used for connecting the value of both integrals with the load distribution factor. Even with the use of tables, an iterative method cannot be avoided. At each time step for the specific values of loads that are applied on both directions, the axial and radial deflections are calculated. The next step is the calculation of the load distribution factor. The integrals for the corresponding factor are traced by the tables used. The steps are repeated, and the final values of the deflections are found. Appendix 2 presents a flowchart describing the method for the bearing load calculation.
As mentioned already, due to heat generation during bearing operation, an additional deflection due to thermally induced preload is built. This highly depends on the temperature that the gearbox is operating, as shown in equation (8),
30
which is the reason for simulating different temperature conditions


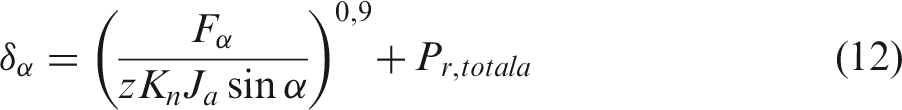
The thermal expansion preload, although defined for each element is assumed to be symmetric circumferentially neglecting manufacturing imperfections. Hence, it is also added to the overall preload which contributes to the overall deformations of equations (4) and (5). The total value of deflection is then calculated as

However, an axial component of thermally induced preload should be calculated as

After calculating the thermally induced preload, it is necessary for each time step of simulation to add its value on the bearing deflections as follows so that it is taken into account when calculating friction
26
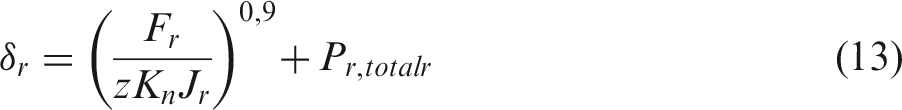
By using the aforementioned equations for the deflection and the iterative method as described, the values of the axial and radial integrals are calculated. With these given, the calculation of the maximum value of the load applied on the normal direction on the bearing at each instant of time can be calculated as
23
:
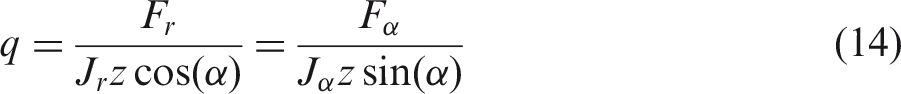
This value of the total load is used for the calculation of the generated friction on the bearing rolling elements as will be described in the following sections. Equation (14) shows that the total applied load can be found by using data either for the axial or for the radial directions. This is due to the fact that the contact angle of all the rolling elements of the tapered roller bearing is the same. It should be pointed out though that for the calculation of the integrals, both the effect of axial and radial deflection has been taken into consideration.
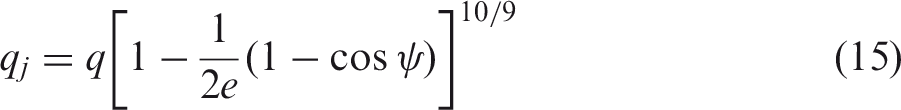
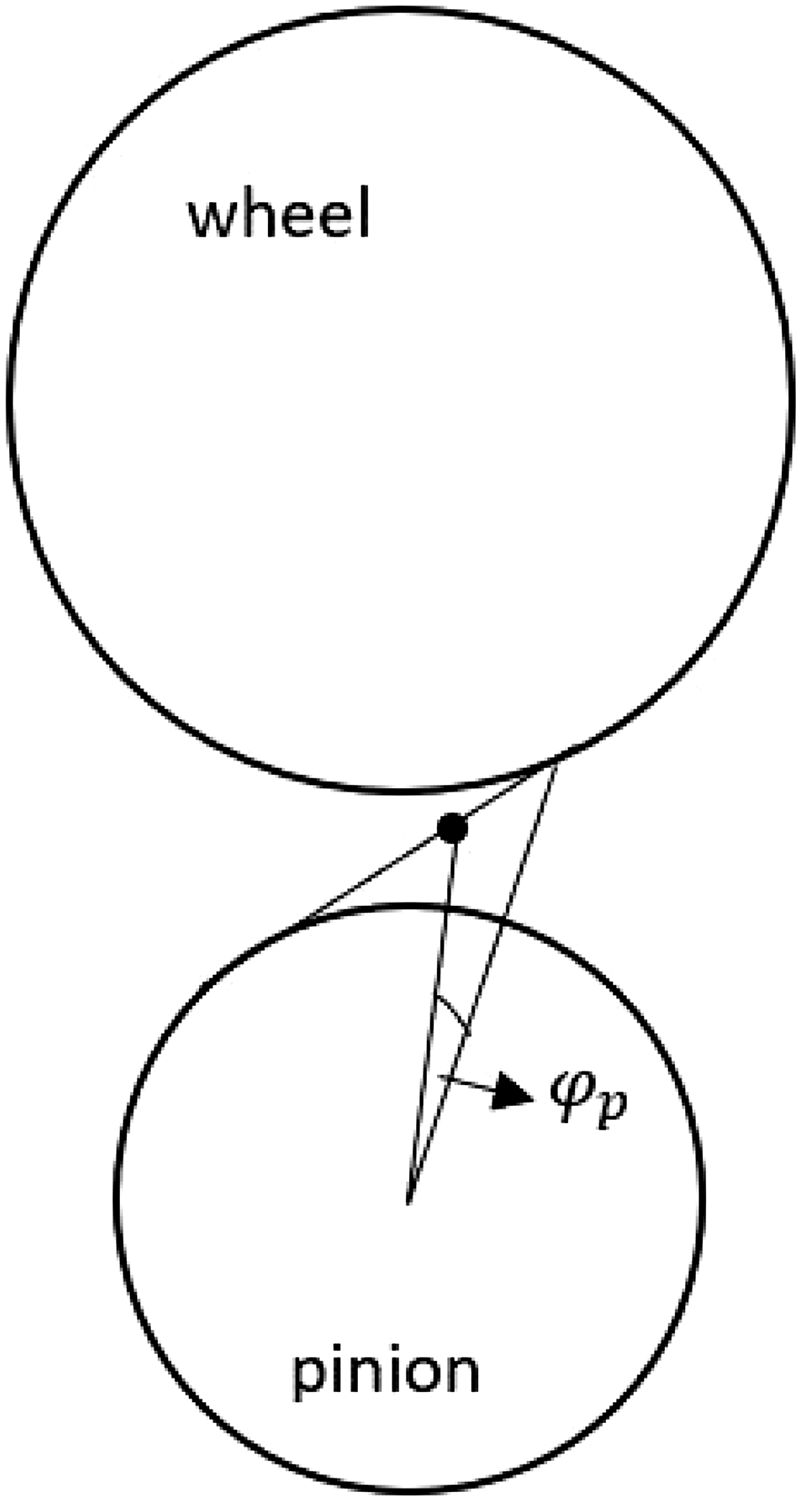
The value of the maximum load as described in equation (14) is not evenly distributed around the bearing (as shown in Figure 2). Consequently, it is necessary for each time step to track the value of load qj which is actually applied on each rolling element of the bearing and is a function of its position around the shaft
Angle affecting load on bearing rolling elements.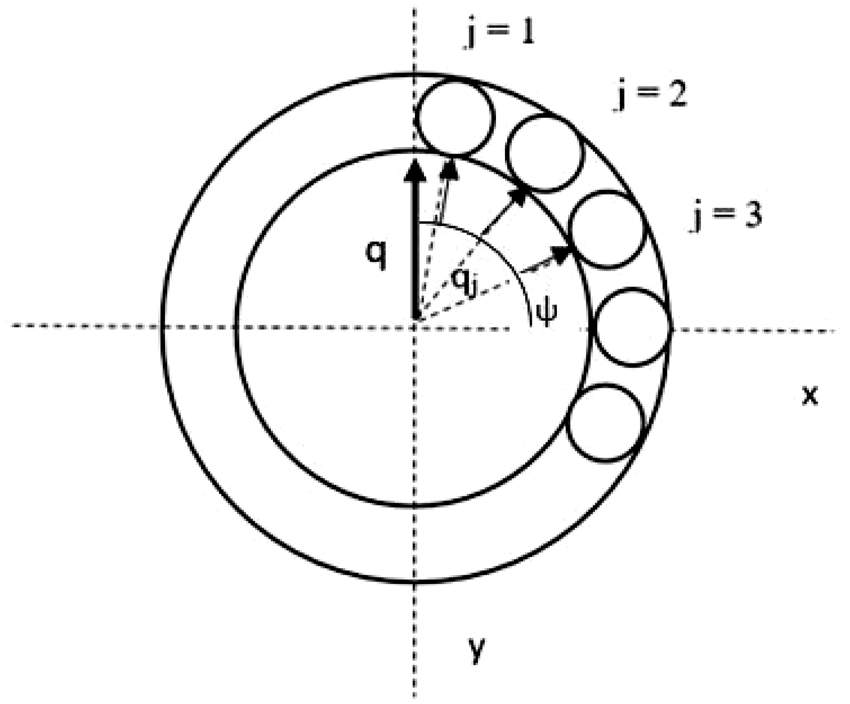
Bearing friction
The tapered roller bearings suffer mainly two types of friction, viscous and boundary, under elastohydrodynamic regime of lubrication due to the high speeds and loads under which the gearbox of a manual transmission operates,
31
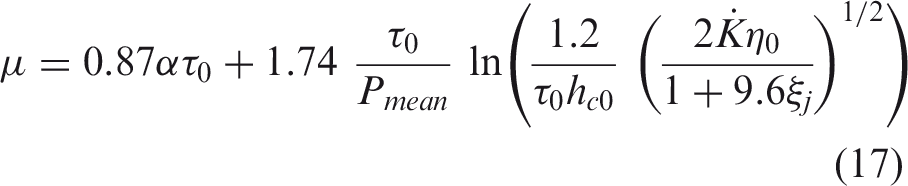
whereas the rib contacts are not considered within this research. For the calculation of viscous friction at each instant, equation (16) is used
32

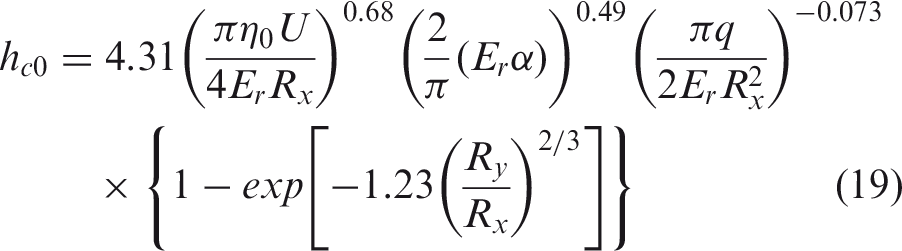
Rx, Ry are the radii of curvature along x and y direction, respectively, since an elliptical contact is considered
35
and Er is the reduced elastic modulus of contact
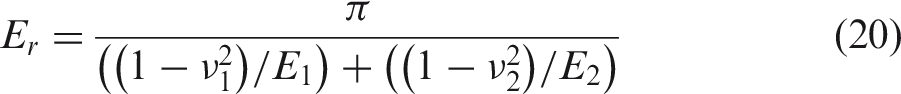

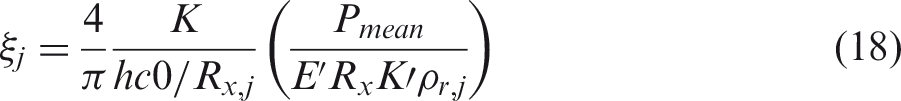
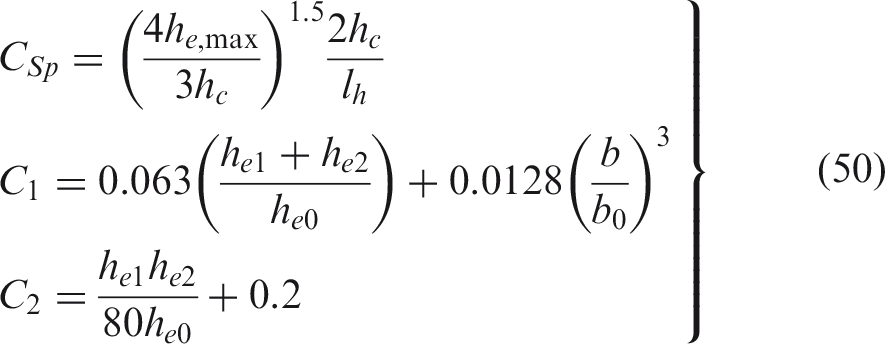
The methodology for estimating boundary friction is then required for completing the calculation of total bearing frictional losses. In the case of tapered roller bearing used in transmission applications, boundary friction applies due to the fact that thin lubricant films are present and asperity contact occurs. The method assumes a Gaussian height distribution of surface asperities. The formula for calculating boundary friction is given by


The Gaussian distribution of asperity peaks leads to a fraction of load that can be carried by these asperities,
39
as given by
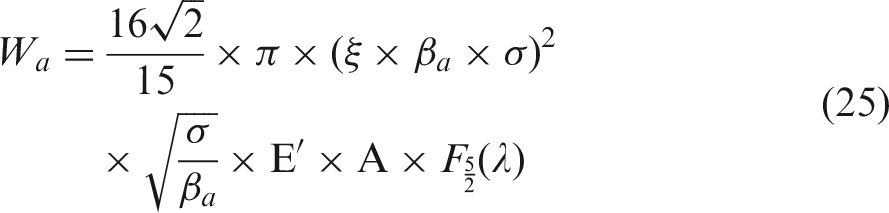
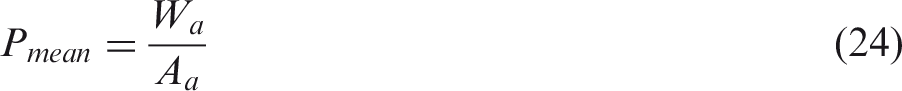
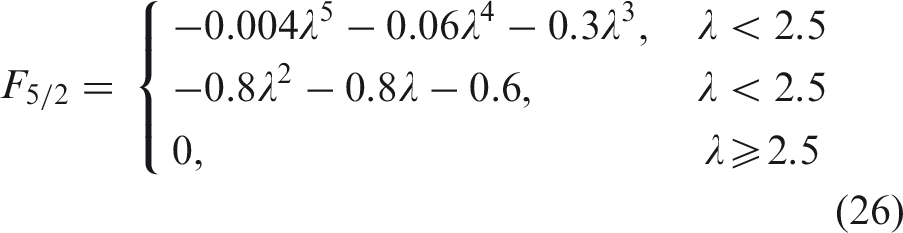
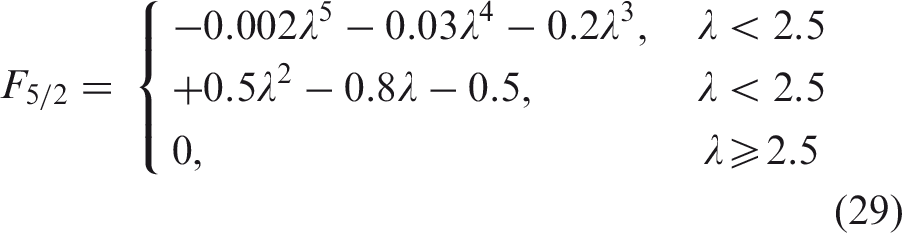
In equation (24), ξ is the asperity density per unit area, βa is the average asperity tip radius, σ is the composite RMS surface parameter, Α is the apparent contact area, E′ is the reduced elastic modulus of contact, as described in equation (27), and F5/2(λ) is a statistical function for a Gaussian distribution of asperities, as given in the following equation.

The asperity contact area Aα is described by

Unloaded gear modeling and frictional losses
Prior to calculating the gear teeth frictional losses, it is necessary to describe their meshing so that the loads and velocities applied on gears and transferred to bearings can be calculated. Additionally, it is necessary to separate the meshing modeling between loaded and unloaded gears since different conditions apply and their physics are not described by the same equations. In this section, the modeling of unloaded gears is described. The geometry of the gears examined plays crucial role on the calculation of their kinematics and consequently dynamics. In this case, helical gears are considered.
Based on the dimensions of the gear teeth, it is necessary to calculate the line of action. This way it is possible to track the number of teeth that are in contact simultaneously in relation with the total angular displacement of the gear. The number of teeth in mesh is necessary for the calculation of the oil film thickness that is concentrated on the gear teeth and of the load and friction that are generated during operation. The line of action is described by
40

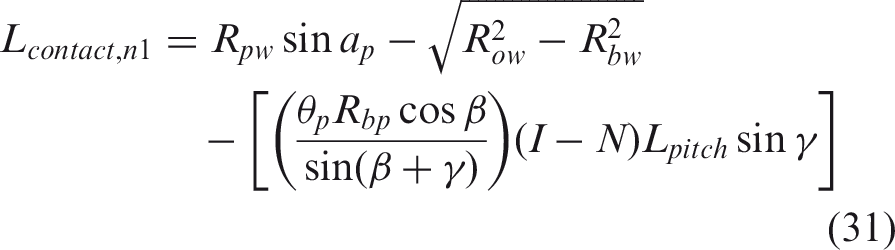
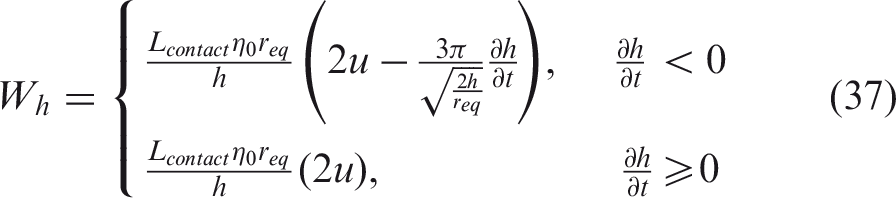
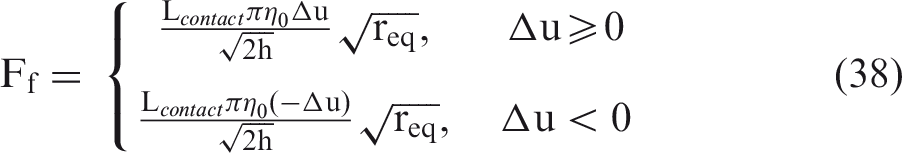
Within the model, the number of teeth (n) that are simultaneously in contact is captured. For each tooth that is in mesh at the specific time step examined, it is necessary to calculate the contact length, shown as Lcontact in Figure 3. It should be pointed out that n1 and n2 in the same figure refer to tooth 1 and 2 being in contact simultaneously. The equation for calculating the contact length is given by
Helical gear teeth contact path. Position of contact point in angular terms.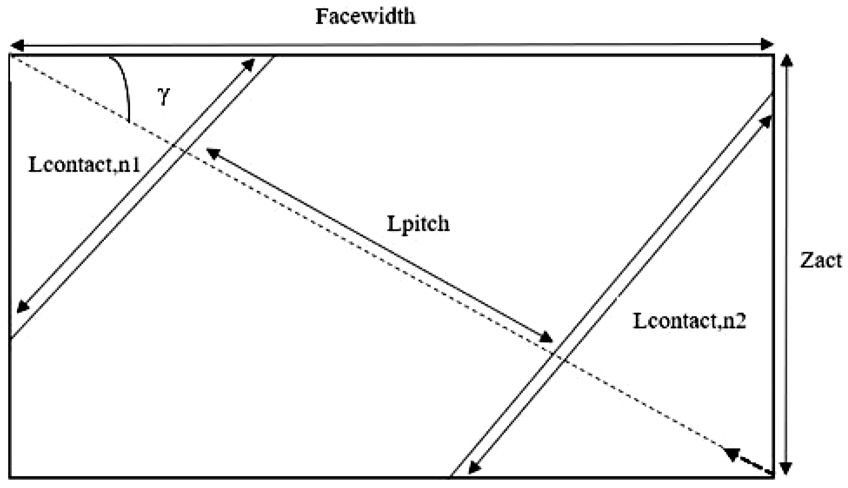
It should be pointed out that for helical type of gears, the theoretical contact line is considered a straight line and the lubricant entrainment direction is the direction that defines the transverse plane, which results to not having any curvature on y direction. 41
The unloaded gear teeth are under hydrodynamic regime of lubrication. The film thickness in the normal section is given by
42
The lubricant reaction on the gear teeth was calculated for hydrodynamic regime of lubrication which is considered applicable due to the low loads of unengaged teeth
43
The first type of friction generated on the gear teeth is viscous friction, which for the case of gears is usually referred as flank friction.
44
The hydrodynamic viscous friction is described by
Loaded gear modeling and frictional losses
In order for the model to track the effect of bearing thermally induced preload on the total power losses, the prediction of the loaded gear pair dynamics is necessary. Even though gear kinematics can be defined as described in the previous section for the unloaded gears, the load and friction of the gear teeth are given by different equations since the hydrodynamic regime of lubrication no longer applies. Elastohydrodynamic lubrication regime is considered instead. The load that applies on the engaged teeth during the meshing as a result of the gear stiffness is given by


The teeth of loaded gears transfer high torques leading to the generation of both viscous and boundary friction under elastohydrodynamic regime of lubrication. For helical gears, the contact line is considered straight so the contact that will be used for the calculation of friction is line contact and the curvature is calculated only for the major axis of the entraining motion of the lubricant. For calculating friction, a similar method to that applied on bearings is used. The viscous friction is given by

The high loads that apply on the engaged gear teeth lead to the generation of boundary friction in addition to viscous friction. The methodology followed for the calculation of boundary friction is similar with that described for the tapered roller bearings

Churning losses
Finally, for completing the calculation of gearbox losses and its efficiency, churning losses should also be considered as described below for dip lubrication conditions used in the examined gearbox.

Results
Experimental measurements
In order for the transmission model to use realistic data, the gear and bearing element surface properties are experimentally measured using the Alicona Infinite Focus Measurement Machine. This allows for more direct comparison against the transmission experimental measurements. This device is used to obtain the surface properties of an examined object by identifying the height differences within its points by scanning the surface from its lowest to its highest point. The resolution under which the scanning process is conducted can be as low as 20 nm. Appropriate software allows for the surface recreation with its main features. 50
Surface topographies for both bearings and gears. (a) 3D image of asperities for the roller of the tapered roller Bearing, (b) Topography parameters for the roller of the tapered roller bearing, (c) 3D image of asperities for the first gear, (d) Topography parameters of first gear.
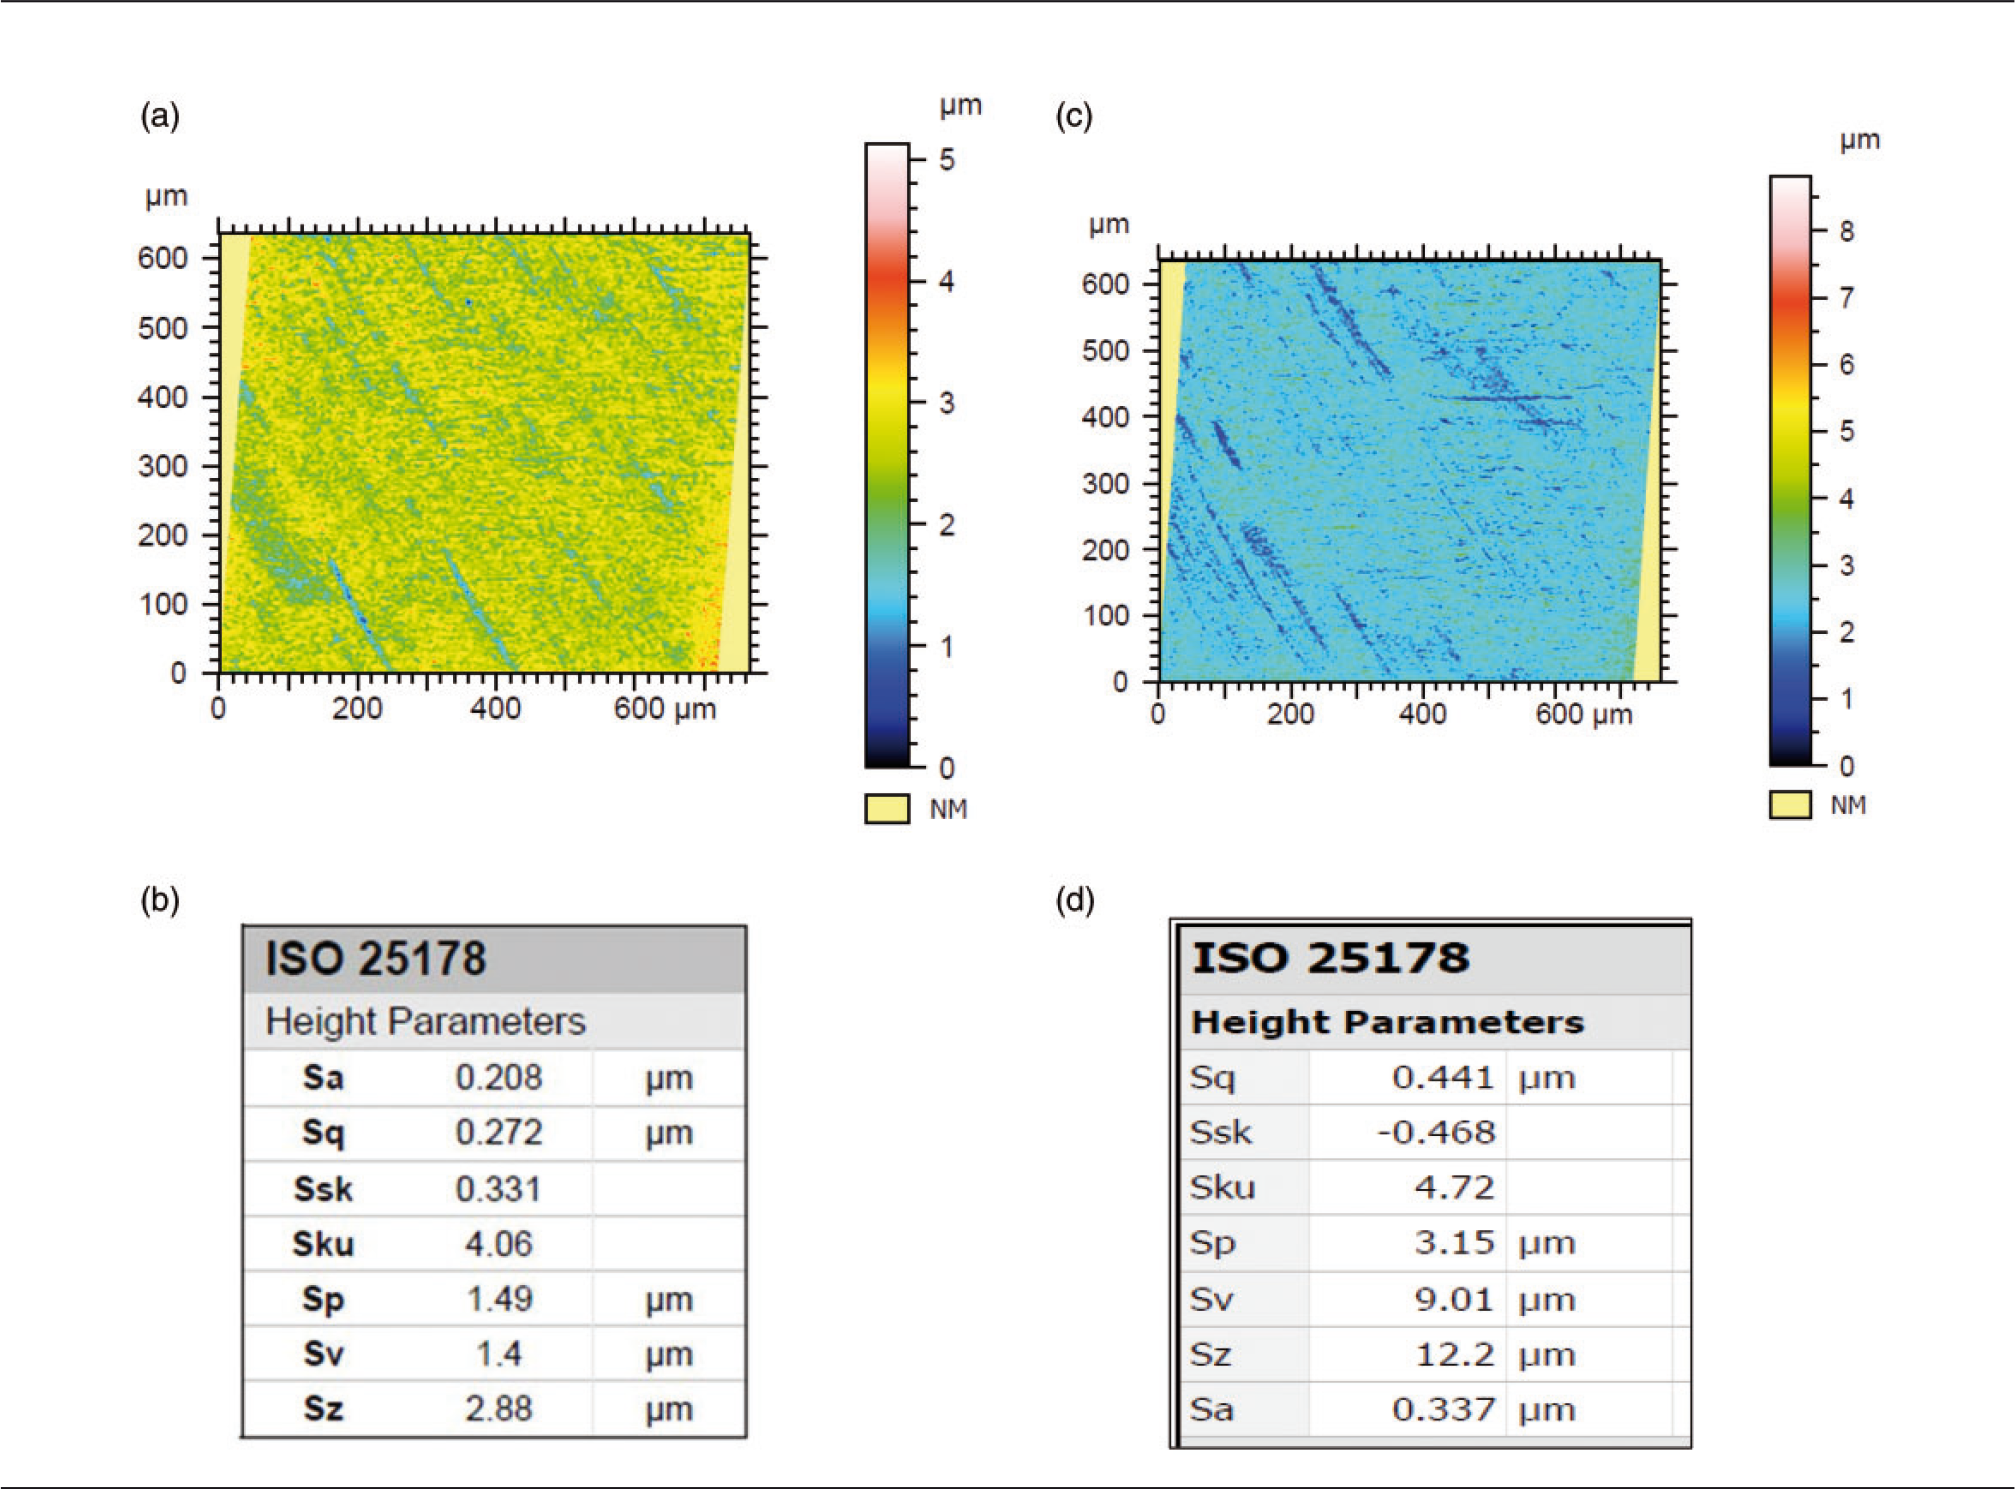
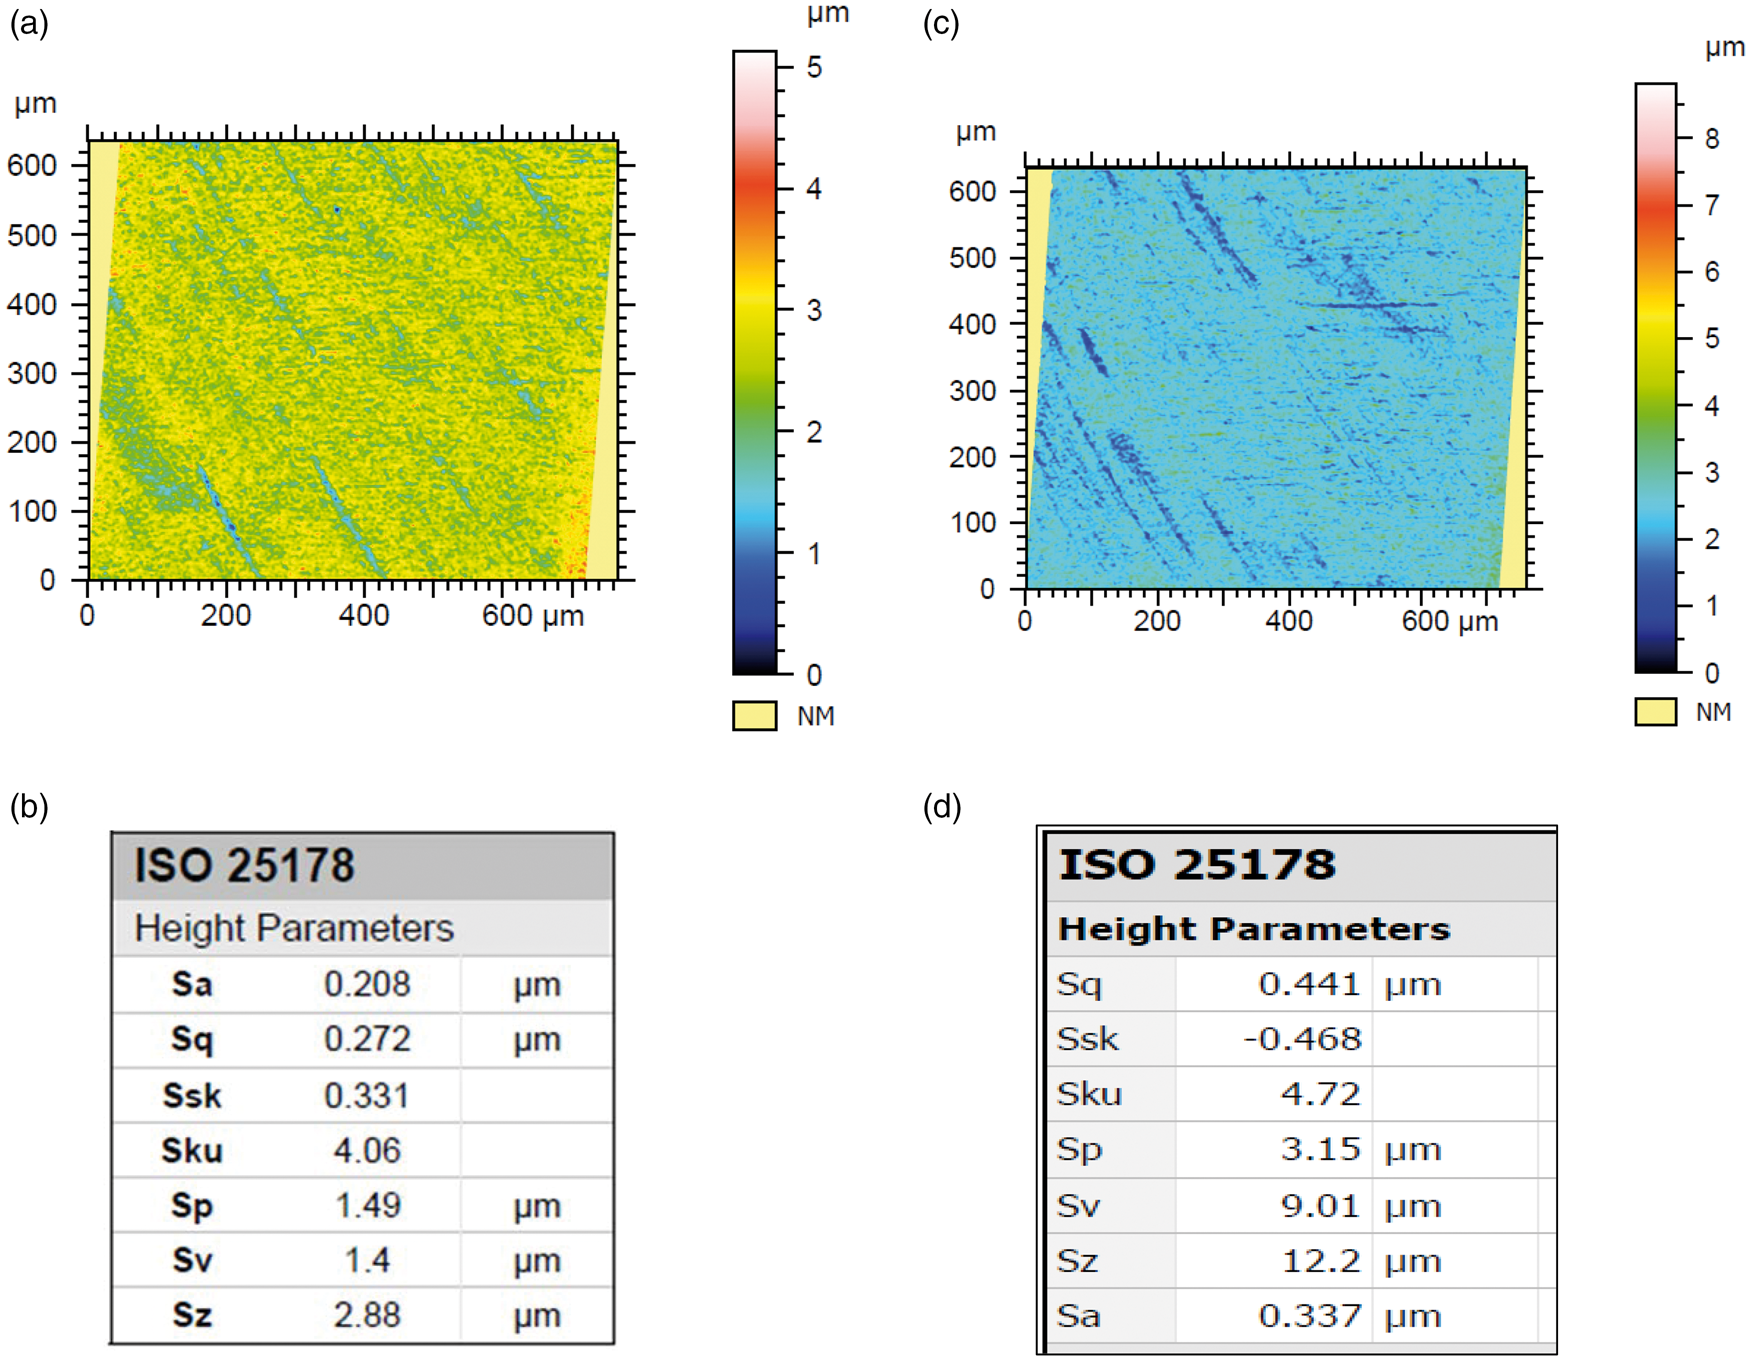
It should be highlighted that within the different gears, the surface properties can differ significantly, up to 20%. However, this is due to the fact that is designed to be engaged in severely different operating conditions. It should also be pointed out that for the bearing surface measurements a fit to plane options was used during the postprocessing of the data so that the round shape of the rolling elements would not affect the height of asperities that was captured.
Model validation
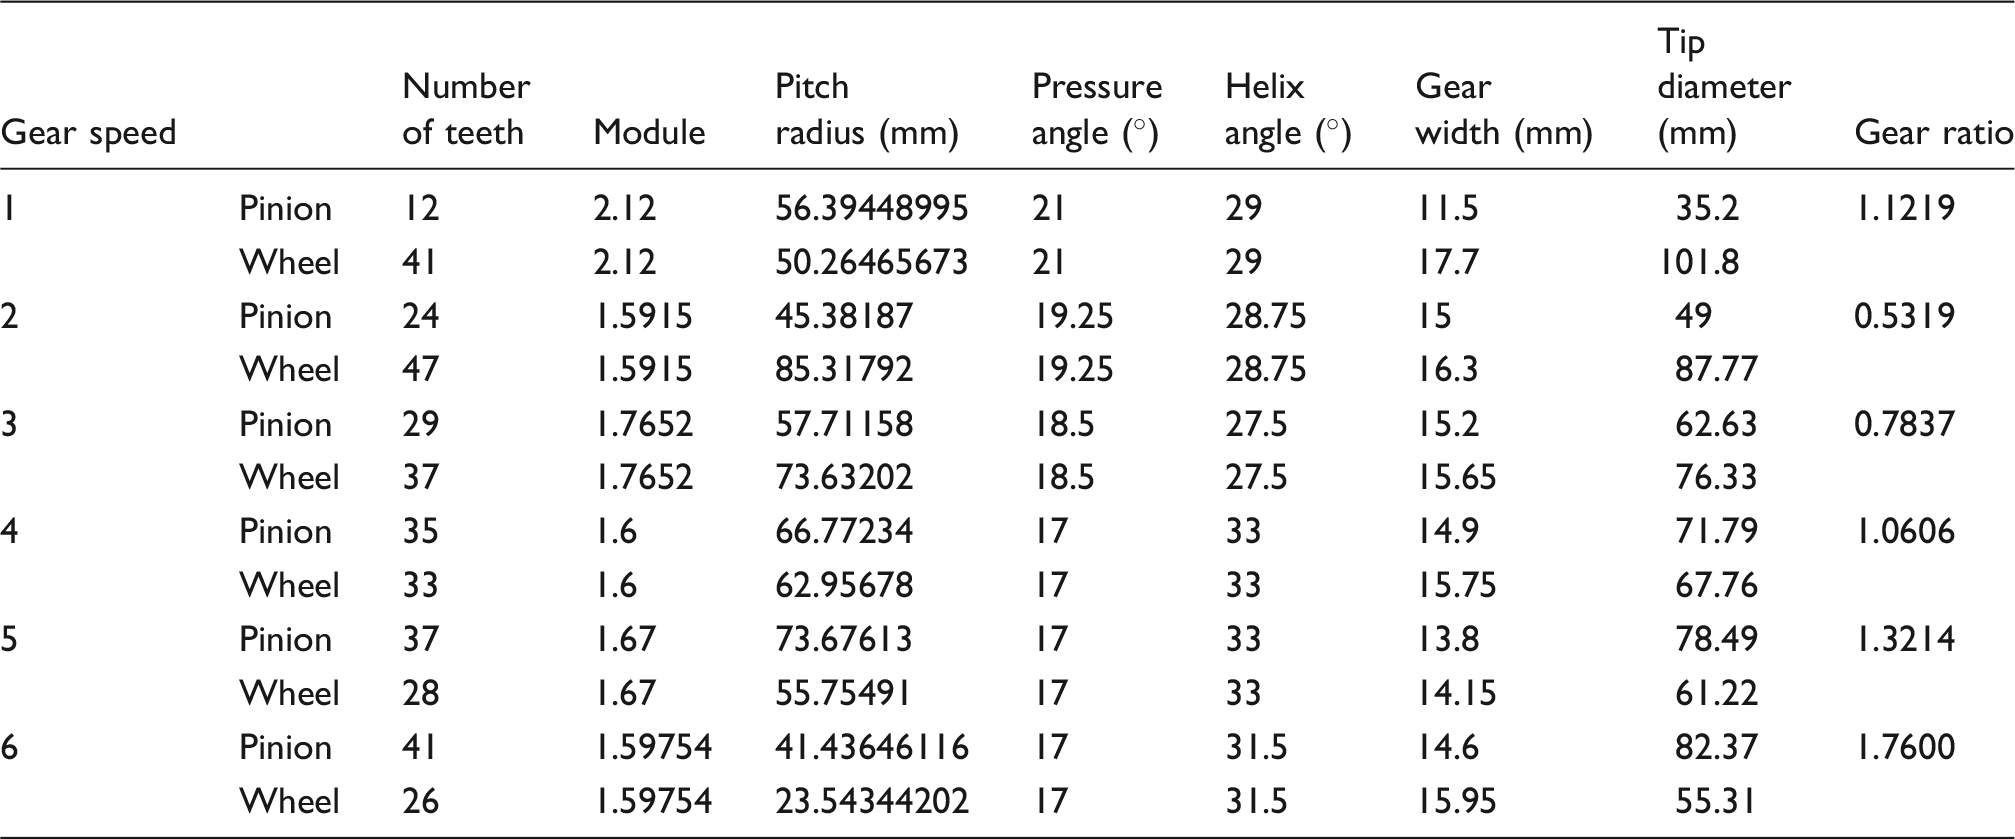
Gear data.
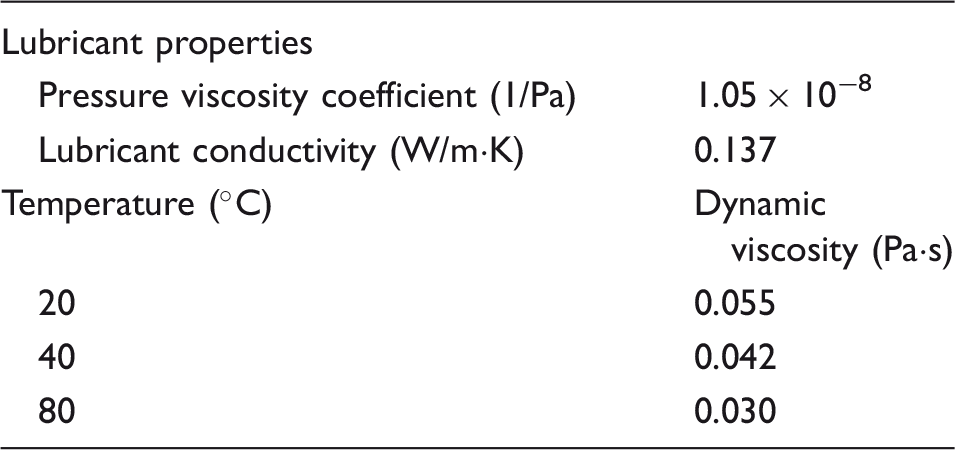
Lubricant properties and dynamic viscosity for different temperatures.
The input conditions for model simulations are taken from the RDE driving cycle, which is presented in Figure 5. It was decided to test two small parts of the cycle. The conditions of these parts are in detail described in Table 4.
RDE driving cycle. RDE: Real Driving Emissions. RDE cycle scenarios examined.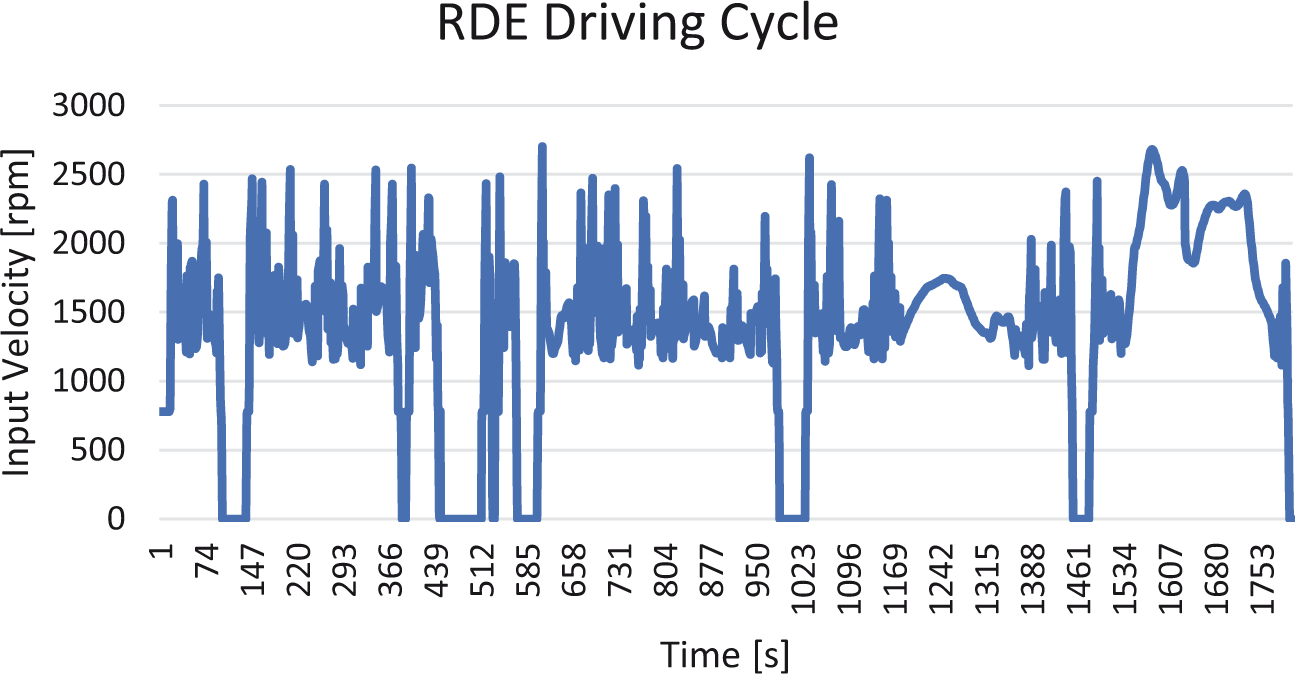
The aforementioned model for calculating the complete transmission losses as a system requires validation in order to be applied for different case scenarios of operating conditions. Experimental data collected for the RDE cycle from a vehicle equipped with the same transmission show the power losses variation for several input velocity and torque combinations, as presented in Figure 6. The experimental measurements of the gearbox power loss were conducted in a test rig comprising an electrically driven dynamometer, the examined transmission, thermocouples to trace oil temperature and torque meters. An oil cooling device keeps the temperature stable. Each test runs for 20 min and the engagement of the gear pair is established prior the beginning of the test. The variation of the input shaft speed is maximum 3% of the set value whereas the same applies to the input torque as well. The temperature change for the experiment to be considered accurate should be ±2 ℃ of the set temperature. The output torque measurement deviation is also around 3%.
Transmission power losses obtained experimentally.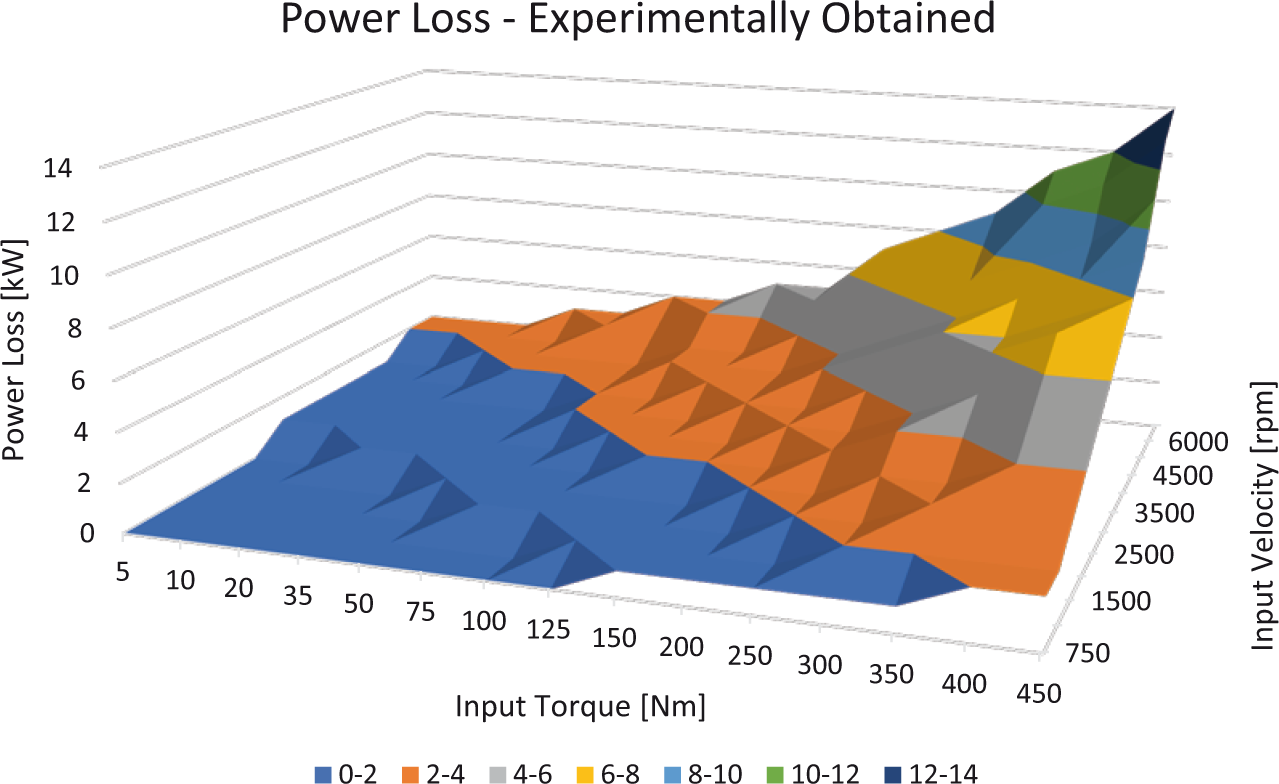
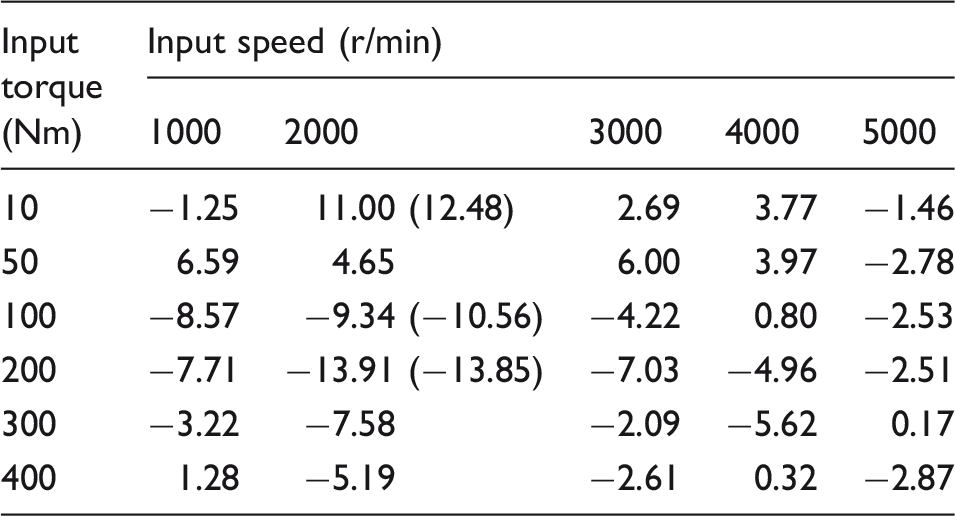
In order for the model to be evaluated, it was decided to run simulations for the same input velocity–torque combinations and the results to be compared against the experimental data. The simulation results are presented in Figure 7. It was observed that in the examined cases, the difference between the simulation results and the experimental data is less than 14%. This verifies that the model is a reliable tool to calculate the frictional losses of a vehicle’s manual transmission. Table 5 shows in more detail the power loss difference (percentage) between simulation results and experimental measurements for various operating conditions corresponding to the results of Figures 6 and 7. Additionally, the values in parentheses in Table 5 have been calculated by taking into consideration the highest errors of the measurements. To be more precise, we have used +3% on both torque and speed data and recalculated the differences presented in Table 5 (for the most extreme values of the table) using the new input values. As it can be seen, the additional percentage difference is no more than 1.5% even when considering the highest measurement errors.
Transmission power losses obtained from simulations. Difference (%) between power loss simulation results and experimental measurements.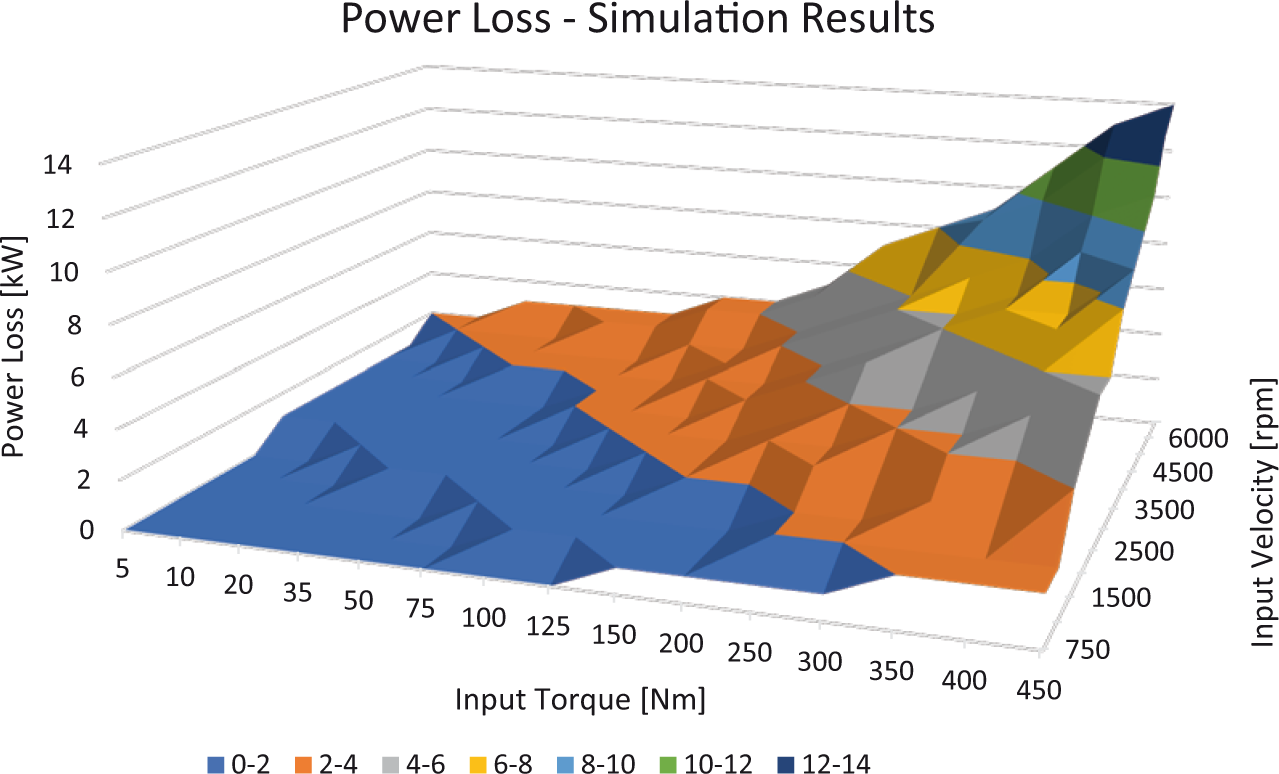
Simulation results
The dynamic model previously described was used for various parts of the RDE driving cycle (and different temperature values for the rolling elements of the tapered roller bearings in order to include the effect of thermally induced preload) to calculate the frictional losses of the complete transmission in comparison with the temperature variation during operation. In this section, the results will be discussed.
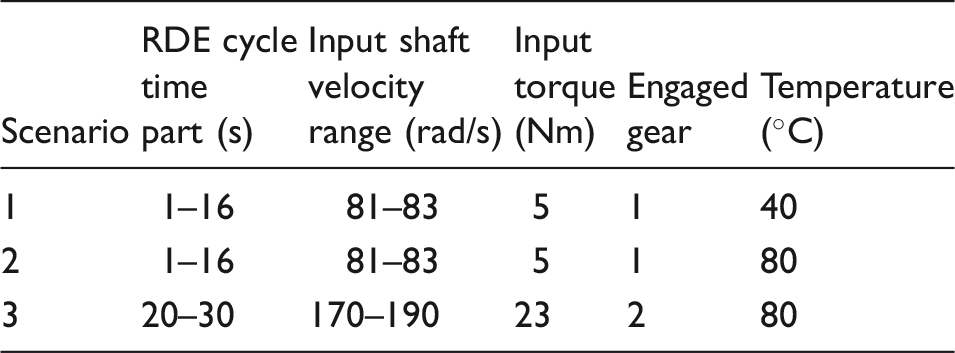
Three scenarios were examined, as illustrated in Table 4. For the first two scenarios, the input velocity was considered the same and only a temperature rise is applied for assessing the effect of thermally induced preload. For the third scenario, a different part of the RDE driving cycle was employed so that a different gear pair is engaged.
The different temperatures were mainly chosen to trace their effect on the thermally induced preload. The values chosen are representative of gearbox operating conditions and commonly used by automotive manufactures as a metric when comparing transmission efficiency. The value of the initially applied preload (deflection) is typically measured at 20 ℃ and for the simulations was assumed at 0.01·10−5 m. For the first scenario the temperature was set to 40 ℃. The value of thermally induced preload is 1.3405·10−5 m and as a result the total preload is 1.3505·10−5 m. When the temperature increases to 80 ℃ for the second scenario, the thermally induced preload changes to 2.6810·10−5 m and the total to 2.6910·10−5 m. The same preload value applies on the third scenario as well.
For the first scenario examined, the transmission power losses are presented in Figure 8. The use of the dynamic model allows for calculating the complete gearbox losses. However, the amount of each different type that applies is also calculated. The combination of using RDE cycle parts and identifying the engaged gear pair as well as the use of original gear dimensions and surface properties makes the following results representative of the operation of the transmission in a realistic scenario. Results show that the churning losses of the gearbox are followed by the frictional losses of the loaded gear. It should be highlighted that since the model takes into account the presence of all gears simultaneously, the losses of the unloaded gears are presented as a whole. However, separate calculation is also possible since the friction of each gear, loaded or unloaded, is also approached individually. It is also important to mention that even though the effect of churning losses is quite high compared to the other frictional losses, the combined generated friction on the loaded gear is comparable to the churning loss value. The model has the ability to test the effect of changes on the gear properties, such the use of different materials or coating, or minor modifications on the geometry of the gear, and track the effect on each type of loss as well as the effect on efficiency.
Gear losses for scenario 1.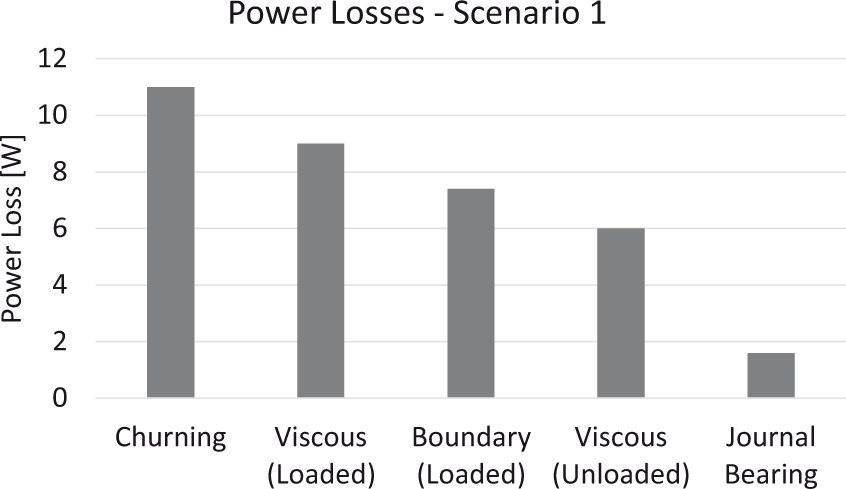
The power losses for the third scenario are shown in Figure 9. It should be reminded that the difference between scenarios 2 and 3 is the temperature change. Nevertheless, it was identified that when gears are only considered for the power losses and not the bearings temperature does not have a major effect leading to a minor increase at the total power losses, less than 1%, which is the reason for presenting the losses for scenario 3 only.
Gear losses for scenario 3.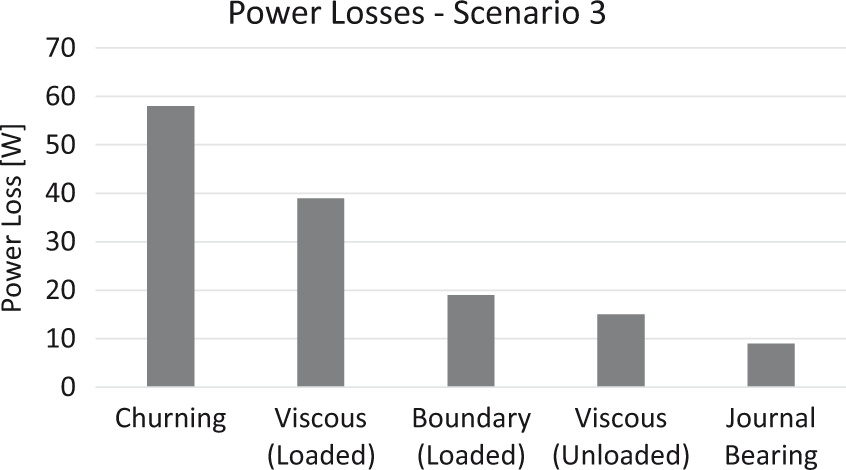
The losses calculated as presented in Figure 9 show that the operating conditions of the transmission have a major effect on the generated losses. Since the change of the engaged gear is tracked within the model and the input conditions have been modified, it is obvious that a small but abrupt change during driving can lead to a major change on the transmission efficiency. Though, the apportionment within the types of losses follows the same pattern as described previously. For this case though, the ability of the model to interact with the gear characteristics is of high importance since the difference that could be achieved for increasing transmission efficiency could be higher and lead to complete transmission efficiency improvement since the values of the frictional losses are affected by the gear properties more than the churning losses.
Afterwards, the rolling element bearing losses for the three different scenarios examined are illustrated in Figure 10. For the cases of the bearings, it is necessary to present all the examined cases since both the operating conditions and the temperature influence the values of the generated friction respectively. Even though the values are lower compared to those of gears, the effect of bearing losses cannot be neglected when calculating transmission efficiency. It has to be highlighted that even for the same operating conditions the temperature change can increase the power losses of bearings highly. For double the operating temperature, the total power losses of the bearing increase more than double for all the examined cases. Also, it should be reminded that the values of the generated friction are, among others, a result of the meshing forces that are generated at the same time on gears since the model created includes the interaction between the two main transmission components. Due to the fact that viscous friction is for all cases higher than boundary friction, it is very important when examining transmission efficiency to be able to interact with the surface properties of the components. Additionally, it should not be neglected that even though both the operating conditions as well as temperature have significant effects on the generated friction, the levels of importance are comparable.
Rolling element bearing losses.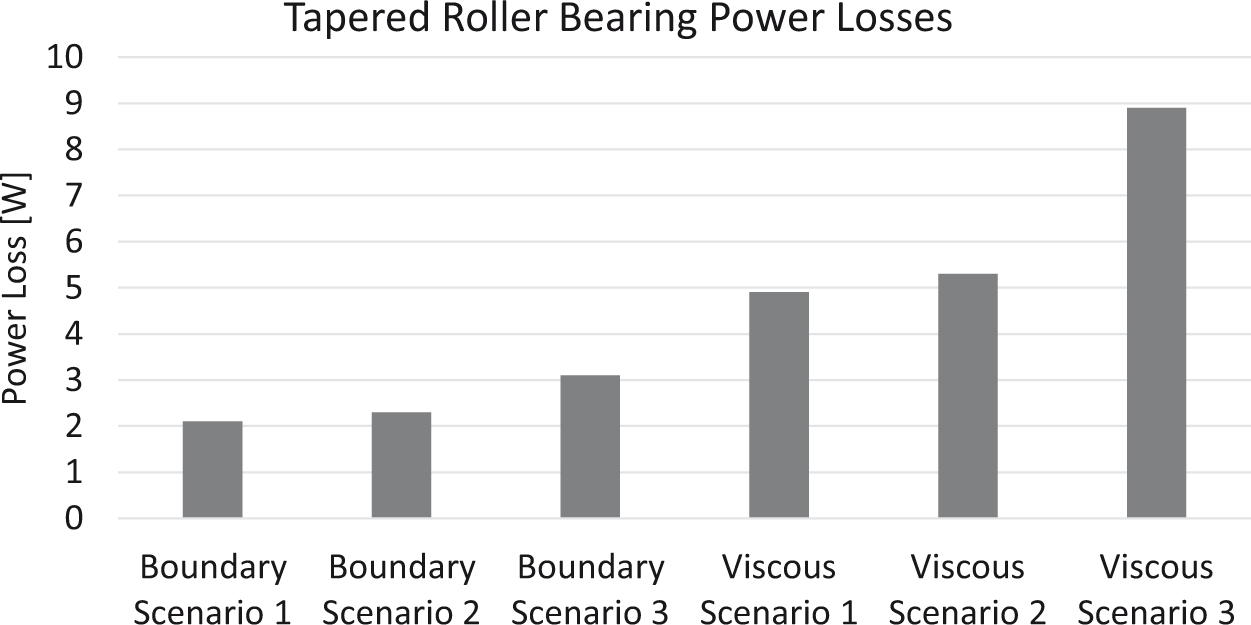
Figure 11 illustrates the bearing losses for the three scenarios examined, with the addition of two more scenarios in which the third and fourth gear are engaged with the gearbox operating at 1500 rpm and 45 Nm input torque. The temperature was assumed to be 80 ℃ for both new scenarios. The percentage of power loss in tapered roller bearings was calculated using the following formula:
Percentage of bearing losses compared to total transmission power loss for high temperatures.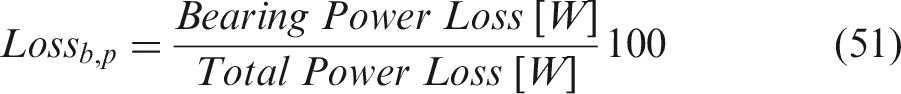
The results in Figure 11 show that bearings can play a key role on transmission efficiency. To be more precise, when the transmission is not operating under extreme torques, the bearing power consumption increases, especially when temperature is considered. It appears that the combination of high temperatures and low to moderate low toque values (scenarios 2–5) constitutes operating conditions where control of the temperature effect by thermally induced preload could improve the total transmission efficiency.
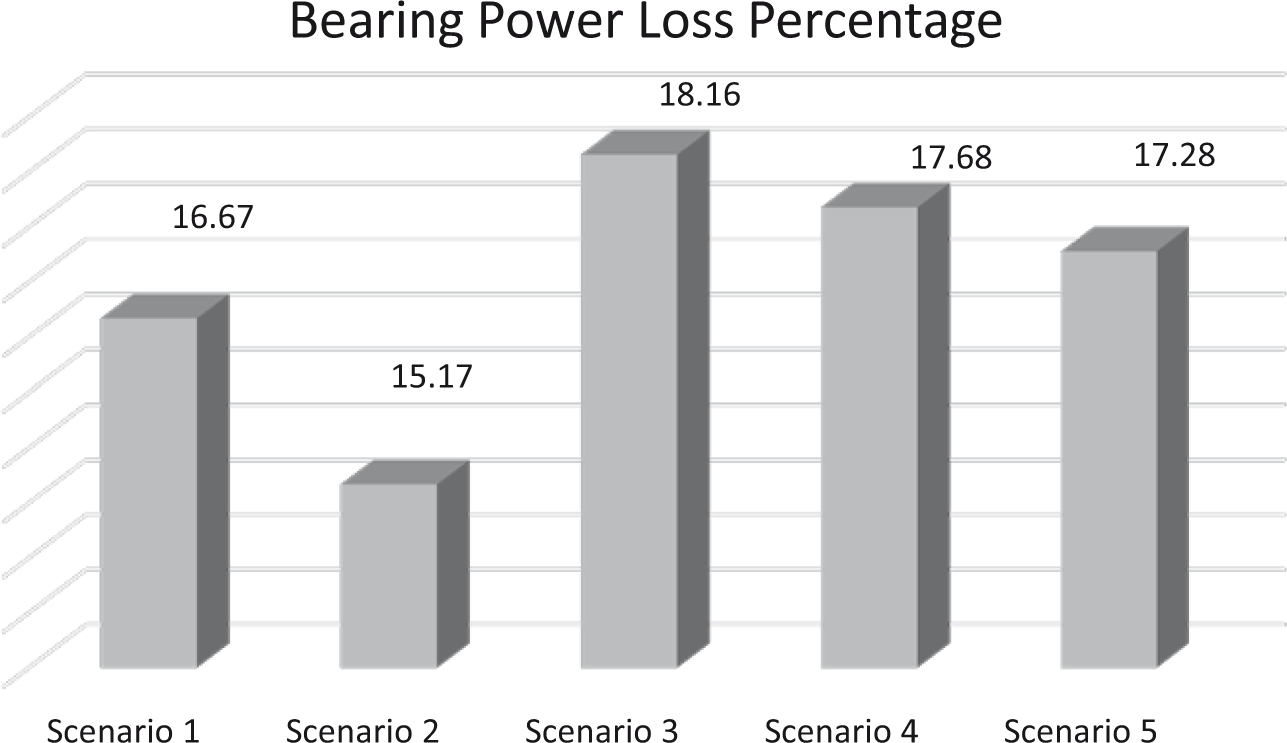
The findings of the simulation results are summarized in Figure 12 where the effect of each power loss type on the total transmission losses is presented. The level of churning losses is really high when compared with each one of the other types of friction that appear during the transmission operation. However, the combined effect of the all the other types is obviously compared with that of churning losses and, subsequently, updates that could be conducted that reduce the values of the other losses can definitely increase complete transmission efficiency. The ability of the created model to easily modify various parameters, surface characteristics or geometry, could relatively conveniently help identify the factors that are more worthy of further research.
Manual transmission power losses.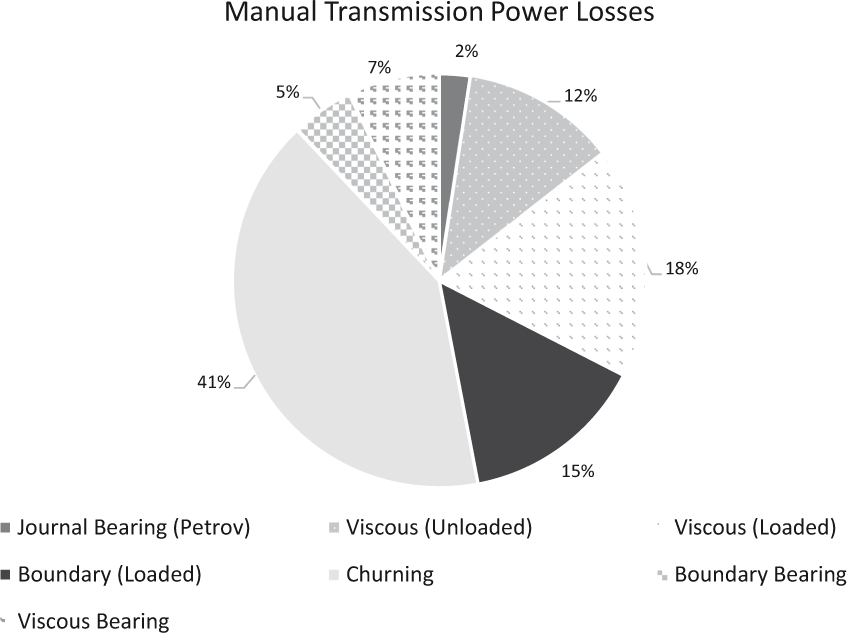
Conclusion
In this paper, a transmission tribodynamic model has been developed that captures the load and friction generated due to gear meshing and bearings simultaneously. RDE driving cycle conditions were used as input so that the results are representative of realistic original equipment manufacturer (OEM) transmission testing. The temperature effect on thermally induced preload and, as a result, bearing friction was taken into account, showcasing that the model is able to predict the changes in transmission efficiency. The power losses of the manual transmission were compared against experimentally obtained values, validating the model.
The amount of power loss both on bearings and gears lead to the conclusion that there is still room for improvement on each gearbox component that could lead to overall gearbox efficiency improvement. To be more precise, it was identified that churning losses have the most effect on total transmission losses representing around 40%. The next highest contribution originates from the viscous friction of the loaded gear (21% of the total power loss). Finally, the frictional (power) loss of the bearings was identified as an important factor for efficiency (14% of the total transmission losses) especially due to the dependence on temperature, which is a parameter not easy to control.
Additional investigation on the variation of bearing losses compared to total transmission losses was conducted in order to verify the importance of temperature. To be more precise, it was identified that the combination of low input loads and high temperatures, which is part of the RDE driving cycle, can lead to significant increase of the bearing frictional losses compared to the other components, highlighting once again the importance of temperature control.
As part of the future work, it is the aim of the authors to include additional components (such as seals and synchronizers) in the study of transmission power loss in order to provide a more complete picture. Additionally, the control of the temperature effect on power losses by considering thermally compensating bearings is another future task.
Footnotes
Declaration of Conflicting Interests
The author(s) declared no potential conflicts of interest with respect to the research, authorship, and/or publication of this article.
Funding
The author(s) disclosed receipt of the following financial support for the research, authorship, and/or publication of this article: The authors would like to express their gratitude to Ford Motor Company for its financial support under its University Research Program.