
Abstract
Sheet metal stamping processes are used primarily for high-volume products produced for a range of sectors, from white goods manufacturing to the automotive and aerospace sectors. However, the process is susceptible to defects. Due to the numerous potential defects that may arise in the stamping product, human inspectors are often deployed for their detection. However, they are unreliable and expensive, especially when operating at production speeds equivalent to the stamping rate. This study investigate CNN-based automatic inspection for stamping defects. The study carried out two sets of experiments. All the Experiments yielded high classification accuracy, recall and precision demonstrating the viability of the CNN method for defect detection in the sheet metal stamping process. Additionally, this study revealed that in limited data confounding factors can be a challenge. The second experiment further explored the impact of small neck defects, harsh lighting and reflections on defect detection. The observations indicated that the model struggled to identify defects occluded by reflections, particularly small neck defects.
Introduction
Sheet metal stamping processes are used primarily for high-volume products produced for a range of sectors, from white goods manufacturing to the automotive and aerospace sectors. 1 In the automotive sector, the capacity of sheet metal stamping to produce intricate and multifaceted designs at speeds of up to tens of parts per minute is pivotal. This is particularly important for crafting complex components such as structural parts, panels and body components with precision. However, like any other manufacturing process stamping is susceptible to defects.
Split and neck defects are crucial defects in sheet metal stamping. Although the formation of these defects are rare their impact is significant due to the following reasons. Small split and neck defects are subtle in appearance, these defects can not be reworked. Moreover, when these defects go undetected, the affected parts continue down the manufacturing line and are assembled with other components, resulting the entire assembly becomes scrap.
Human vision inspection stands out as the prevailing technique for stamping defect inspection. 2 However, this method proves to be costly, time-consuming and tedious, particularly in continuous manufacturing settings. Although the literature lacks a comprehensive analysis focussing on the impact of high-volume production speed on human inspection accuracy, early research observed an exponential increase in accuracy with extended inspection time 3 and a recent study indicates a trade-off associated with inspection time. 4 Inadequate time for inspection can result in missed defects, while excessive time can lead to false alarms. Importantly, the limited inspection time, environmental complexities and component intricacies contribute to the reduced accuracy of human inspection. 5 Additionally, human error often arises due to fatigue. Moreover, the constrained timeframe allocated for defect identification during stamping increases the likelihood of missing defects.
Prior to the present study, several sensor-based approaches were employed for similar purposes. Nonetheless, it is crucial to note that sensor systems in industrial settings exhibit a mere 46% functionality, 6 primarily due to the susceptibility of touch-based sensors to malfunction. In contrast, vision-based sensors offer distinct advantages by avoiding these issues and offering cost-effective hardware solutions.
Convolutional Neural Network (CNN) models have demonstrated excellent performance in detecting anomalies and defects in images. For example, Zhuxi et al. 7 used CNN to detect defects in aluminium sheet strips and achieved a 96.28% average precision. Zhang et al. 8 used the CNN model to detect bridge surface cracks. Moreover, they improved the CNN model architecture to detect defects using an edge device for real-time application. Yao and Li 9 used to detect defects on Light guide plates of LCD displays.
Expanding beyond traditional CNNs, advanced Deep Learning (DL) architectures, including transformer models, have been implemented for defect detection tasks. Gao et al. 10 introduced a novel variation of the transformer known as the ‘Cas-VSwin transformer’ and demonstrated its superiority over CNN-based state-of-the-art models in the domain of surface defect detection. However, Singh et al. 11 argued that CNN models remain the more suitable choice for stamping defect detection tasks, especially when limited training data is available.
In contrast, limited work has focussed on employing CNN models in non-uniform metal defect detection such as sheet metal stamping. Block et al. 12 demonstrated the detection and tracking of imprint defects on stamped components. Singh et al.11,13 used a dataset containing representative components for split defect detection and used CNN-based models to detect defects. However, no work did any in-depth analysis of the difficulties and challenges of employing CNN models in classifying defects in sheet metal stamping.
Therefore this research investigates split defects classification in stamping components by using a state-of-the-art CNN model. The study carried out two sets of experiments. While experiment 1 explores the usability and practicality of CNN-based defect detection, experiment 2 investigates the impact of harsh lighting and small defects.
In summary, the key contributions of this paper include:
Conducting comprehensive analysis of challenges associated with CNN-based defect detection in sheet metal stamping.
Developing a unique dataset encompassing extreme lighting conditions and various defect sizes, contributing to the advancement of robust industrial inspection systems.
Leveraging explainable AI tools, GradCAM, to enhance transparency and interpretability for the CNN-based approach in sheet metal stamping inspection.
Method
Sample manufacturing
Producing defective stamping samples for the purpose of training and validating DL models in research poses a significant challenge. This is primarily due to the rarity of defects and the lack of control over their occurrence during production. Therefore, this study used Nakajima et al. 14 samples. These samples are widely utilised in the limiting dome height test, which is a standardised evaluation method (ISO 112004-2:2008) designed to assess the formability of sheet metal materials. Additionally, this test aims to simulate the complex loading conditions encountered during stamping processes. Moreover, the process uses an open-die tool that allows real-time monitoring of crack formation and severity during the stamping process. Given the test’s simulative nature, the appearance of splits and necks in the Nakajima samples closely mirrors that of production components, making them suitable for validating our proposed method.
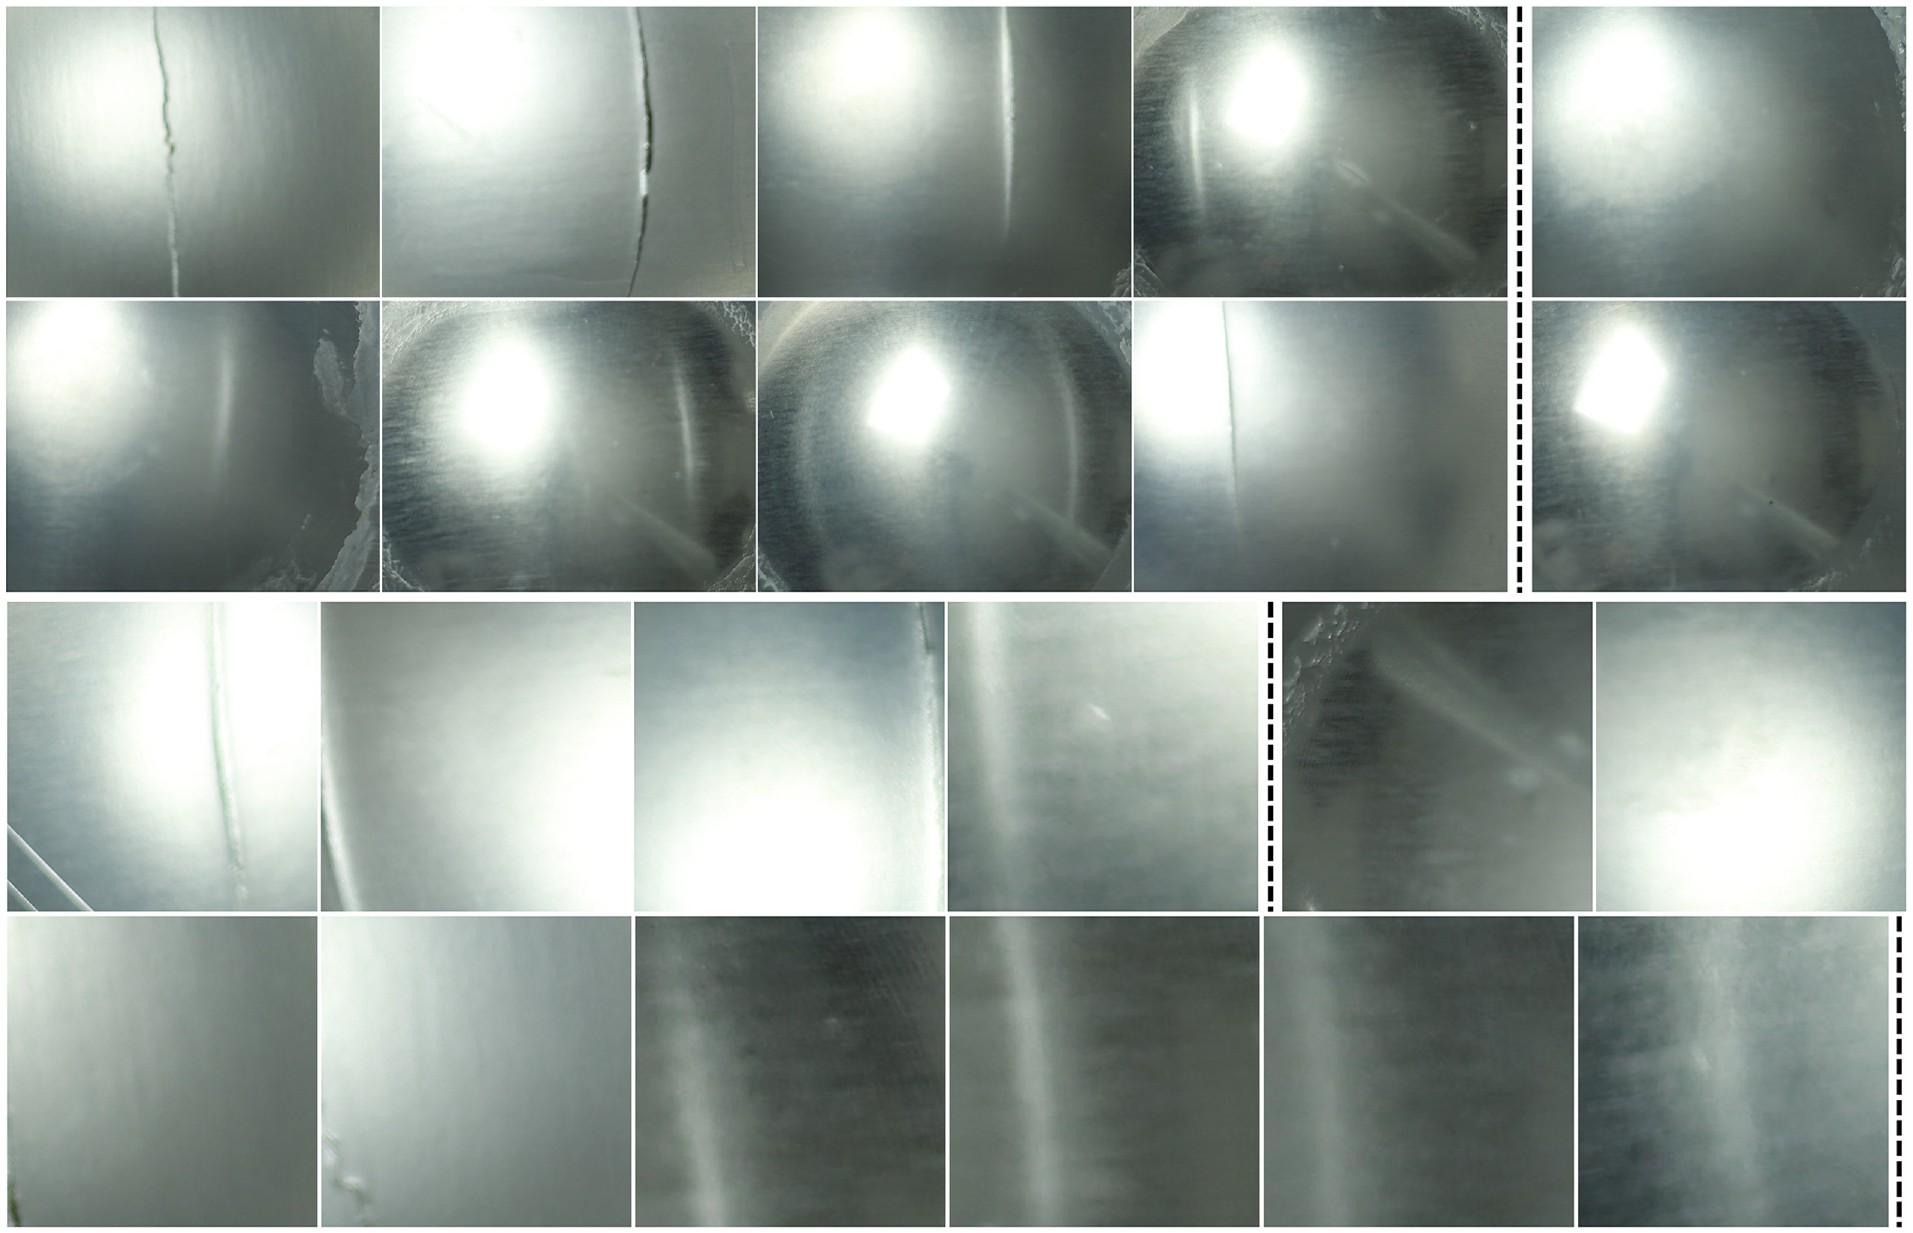
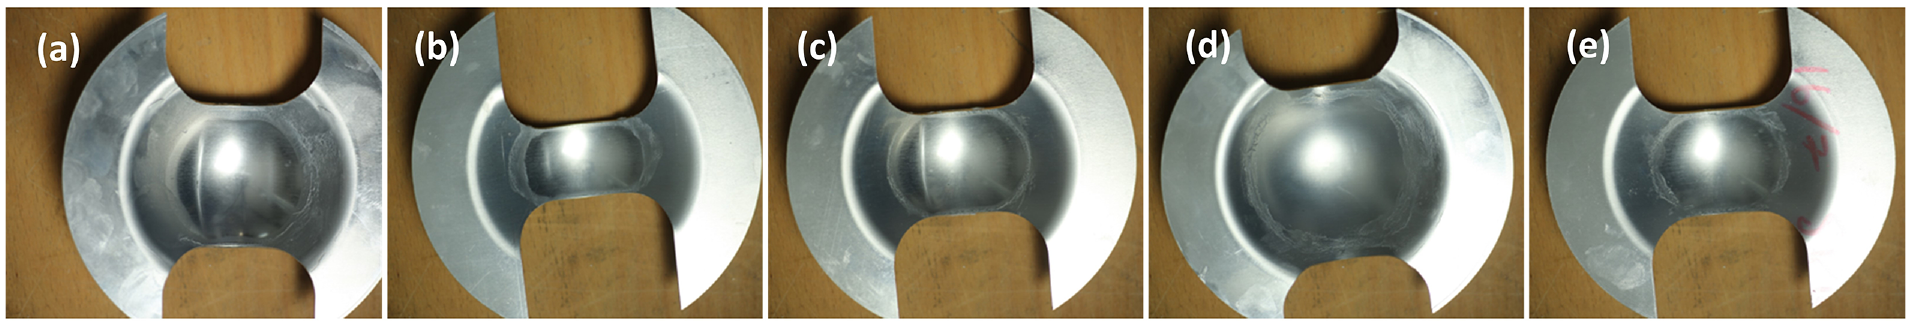
To manufacture these samples, raw aluminium sheet materials were cut into the required shapes and dimensions using a Datron CNC milling machine. Subsequently, using an Interlaken 225 press, these samples were pressed into their final shapes. To induce neck or split defects, we deformed the samples until we observed load drops indicative of necking or splitting. In contrast, non-defective parts were produced by pressing samples to a punch height before any necking or splitting occurred. Determining the appropriate punch height involved a trial-and-error approach. Examples of samples are shown in Figure 1.
Shows datasets used in Experiment 1, where the left half of the images show defective samples and the right half for good samples. Row1 depicts the full manufactured samples
CNN model
While a shallow network can effectively handle datasets that consist of similar shapes and a single class of defects, the inclusion of a greater number of layers in DL models often leads to enhanced generalisation and improved learning capabilities. However, it’s important to note that this advantage comes at the cost of increased complexity in optimisation. 15 Consequently, the training and testing accuracy may suffer when dealing with smaller and simpler datasets as the number of layers increases beyond a certain threshold due to the risk of overfitting.
Residual networks (ResNet) provide an elegant solution to this challenge by enabling the construction of deeper models without compromising performance. The fundamental idea behind ResNet is rooted in the concept that ‘considering a shallow network as a solution and its deeper counterpart, there exists a solution where it can copy the learned shallow model and identity function for the extra added model’. 15 Given the inherent complexities that can be encountered in real stamping environments, a deep residual neural network is a suitable choice, as it is well-suited for handling more intricate data while mitigating the risk of overfitting, even for the representative dataset used in this study.
The key innovation in ResNet lies in the use of residual connections, where the input to a layer is directly connected to the output from the same layer. This design encourages the layer to learn the deviation from the input, rather than attempting to learn a new function from scratch. Additionally, this implies that even when a model fails to learn anything meaningful, it can still retain the input values rather than forcing them to zero, which is a common initialisation strategy since model weights are often sampled from a zero-mean Gaussian function. Consequently, ResNet offers the flexibility to incorporate deeper models without sacrificing performance.
Experimental setup
The study comprised two sets of experiments. Experiment 1 was dedicated to assessing the feasibility and practicality of CNN-based defect detection, while Experiment 2 focussed on examining the effects of harsh lighting conditions and the detection of small defects. Due to the limited size of the dataset, we adopted a five-fold cross-validation approach to mitigate potential bias in the results. In this technique, the dataset was initially divided into five equal subsets. Subsequently, the model underwent training and testing in five iterations. During each iteration, one of the subsets served as the validation set, while the remaining subsets were utilised as the training set.
In adapting ResNet for this experiment, we replaced the original final layers of the network, which replaced 1000 fully connected outputs and a softmax layer, with a new layer designed to classify the data into two classes relevant to our study. The model was then trained using a cross-entropy loss function, and the Adam optimiser was employed with a learning rate of 0.001 for a total of 150 epochs.
Evaluation metrics
The pivotal metric for evaluating a defect classification model is recall, also referred to as sensitivity or the true positive rate. This metric indicates the percentage of correctly identified defects among all actual defects. Precision, a complementary metric to recall, signifies the percentage of correctly identified defects among all instances predicted as defects by the model. In addition to precision and recall, accuracy, the most commonly used metric and the F1-score, a trade-off between precision and recall, are presented in this article. The calculations are detailed below:
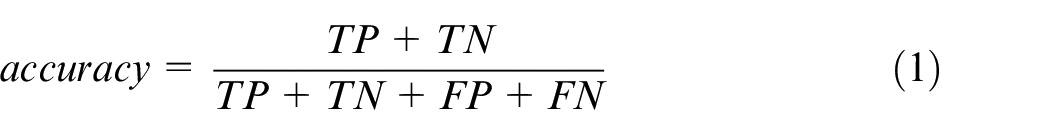
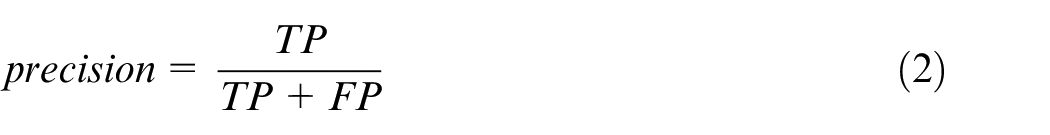
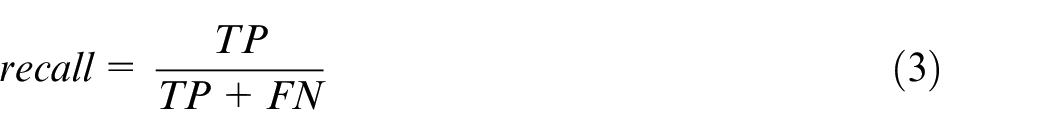
Here, TP (True Positive) represents the number of defective samples correctly predicted, TN (True Negative) represents the number of non-defective samples correctly predicted, FP (False Positive) denotes the number of good samples erroneously predicted as defects and FN (False Negative) indicates the number of samples containing defects incorrectly classified as good.
Furthermore, we employ GradCAM (Gradient-weighted Class Activation Mapping) 16 as a tool to enhance our understanding of the decision-making process within the CNN model. GradCAM generates heatmaps, providing insights into the image features contributing to the model’s classification decisions. These heatmaps highlight regions within the images that strongly influence the model’s predictions when superimposed onto the original images. This visualisation helps identify whether the model focuses on the expected defect regions or is influenced by confounding factors that affect its decisions. The GradCAM map is computed as follows:
Where
Experiment 1
This study used a preliminary dataset to identify the problems and test the usefulness of the CNN model in stamping defect detection.
Dataset
The dataset used in Experiment 1 comprises 65 defect samples, including 6 neck defect samples and 35 good samples. The images were captured without any specialised lighting, which was illuminated by both house lights and natural daylight coming from windows. The images are captured within a span of 5 h.
To ensure that the ML approach developed in this work effectively learns to classify the presence of cracks from images, it is crucial to eliminate any confounding factors that may be present in the dataset. Such factors include features from the background or shadows that could be erroneously associated with the split defect.
Considering that defects were located only near the centre of the samples, the images were cropped to the central area to create a dataset
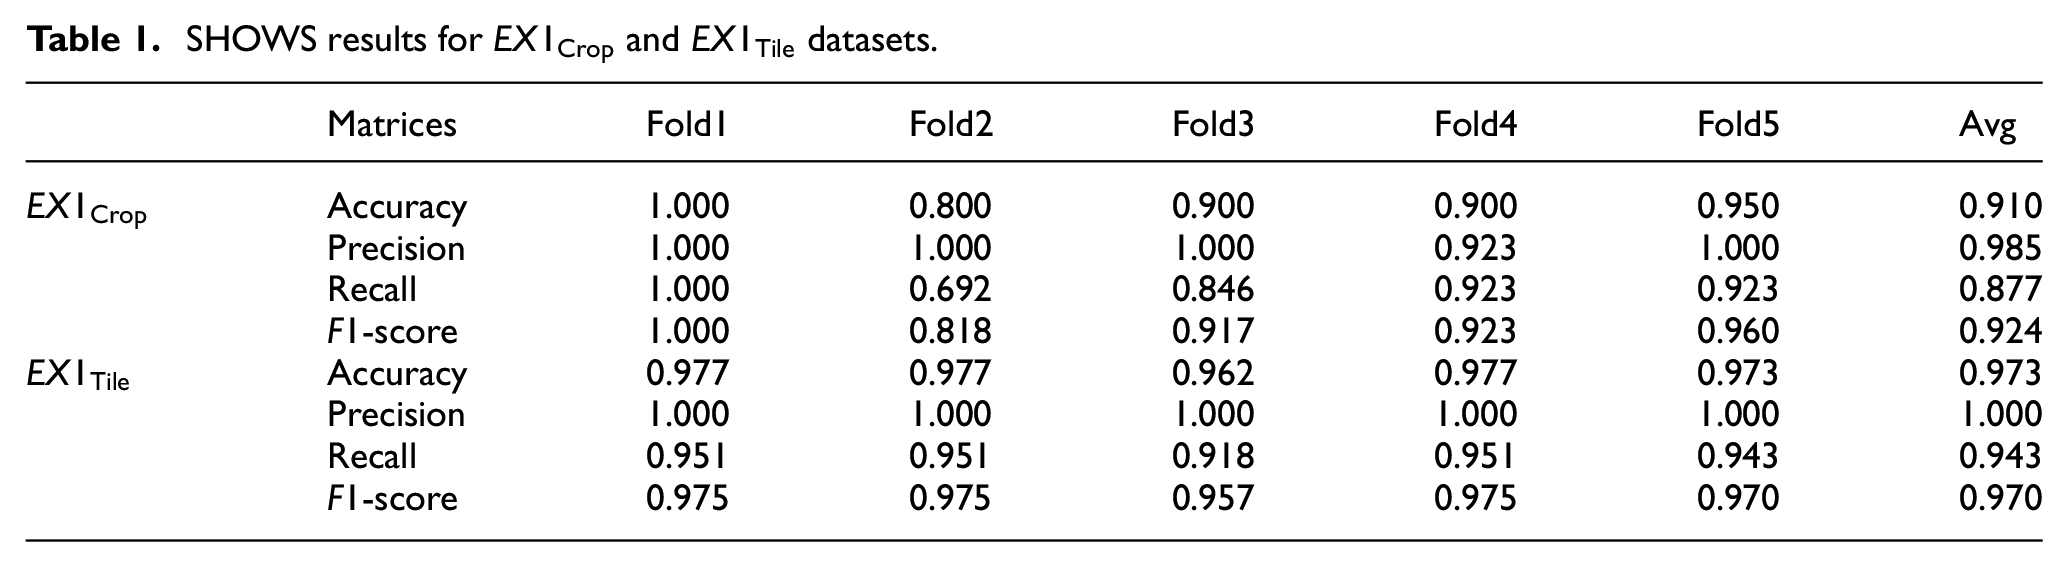
Quantitative results
The obtained average recall precision, F1 score, and accuracy from five-folds for
SHOWS results for
Qualitative results
The qualitative results for the
Displays the qualitative outcomes for Experiment 1. The left and right of the dotted lines show defective and good samples respectively. Rows 1 and 2 depict results for the
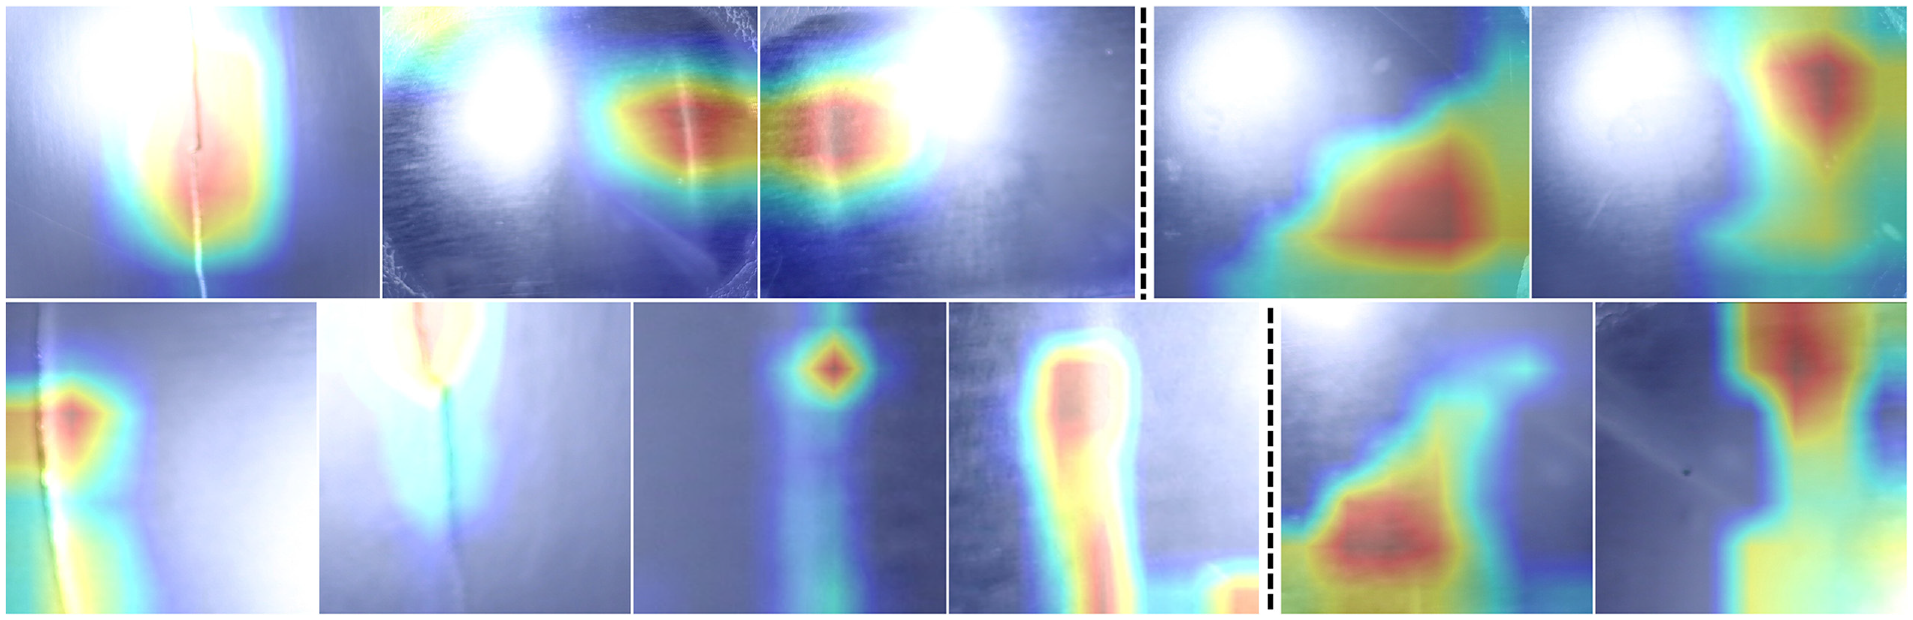
Shows GradCAM results for the
Ablation study
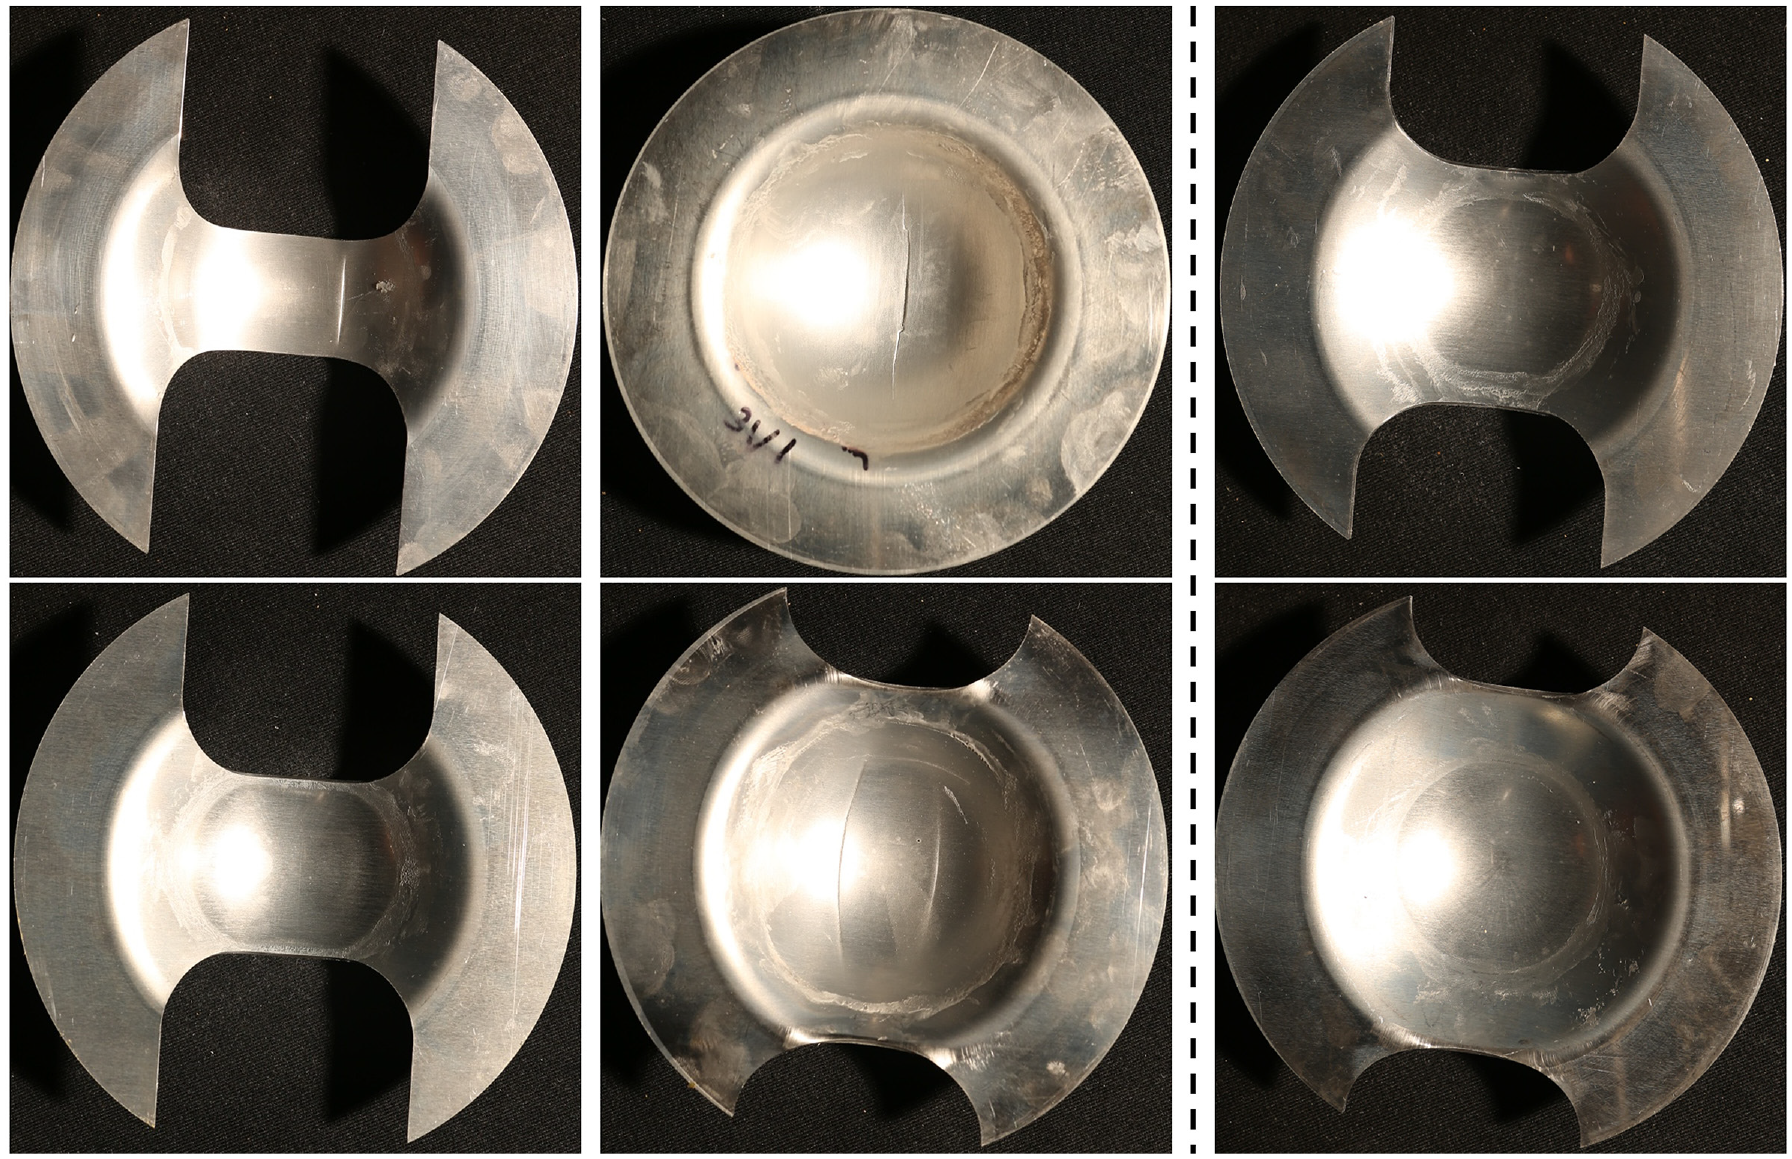
In Section 3.1, we assumed that utilising a small dataset containing background variables can introduce bias and confounding factors that may interfere with the model’s training. To further investigate this, we conducted an ablation study to classify the full images using the same resnet18 model. Interestingly, the results of the ablation study demonstrated that the model correctly predicted all defective samples except for a single false prediction (see Figure 4). While this indicates a high level of accuracy in defect detection, an analysis of the corresponding heat map (see Figure 5) revealed that the pixels influencing the CNN model decision on defect presence predominantly resided in the background of the image. These findings suggest that the model trained on
Shows qualitative results. (a and b) are correctly predicted defective samples, (c) shows the only false prediction from the model, defective sample predicted as good sample (c and d) shows correctly predicted good sample.
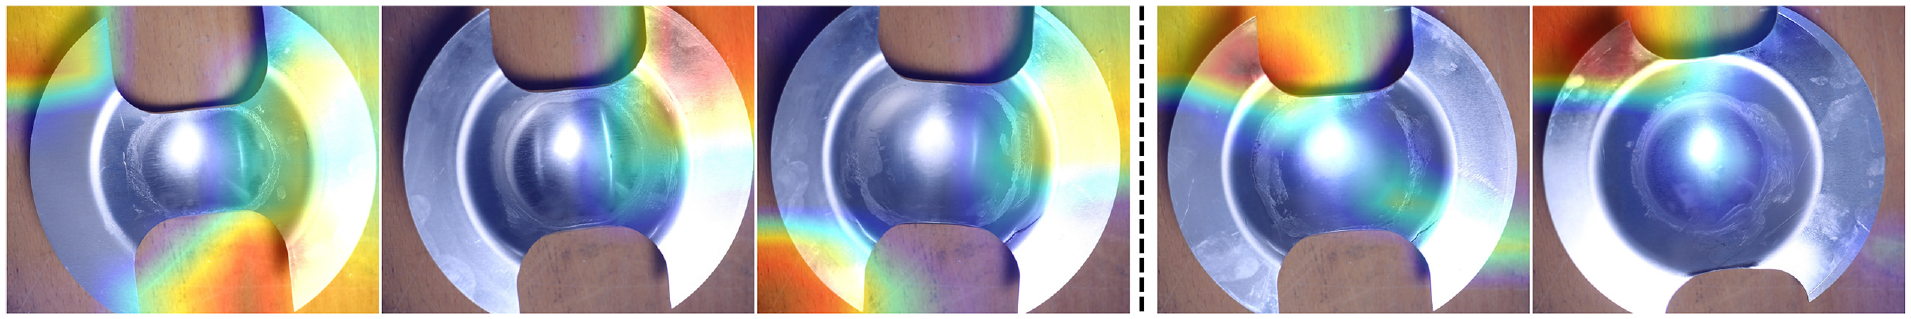
Shows GradCAM results for the
This trend was observed not only for defective samples but also for non-defective samples. The heat map analysis consistently showed that the model’s decision-making is based on background pixels, indicating the presence of confounding factors in the dataset.
Discussion
The outcomes obtained from Experiment 1 demonstrate the feasibility of leveraging CNN models for defect detection in sheet metal stamping. However, these models encountered challenges in two specific scenarios. Firstly, when faced with a limited number of analogous defects within the training dataset, and secondly, when encountering defects possessing little visual details. This challenge can be attributed to two primary conditions: either the defect itself exhibits subtle visual attributes (neck defects), or the pertinent details of the defect are obscured.
A notable example of this struggle can be observed in the
In the next experiment, we address these limitations by creating a dataset with a higher number of neck defects and capturing images in a controlled lighting environment. This approach allows for a more thorough evaluation of the model’s performance under challenging conditions and provides insights for further improvements in defect detection.
Experiment 2
This Experiment performs further analysis of defect detection in sheet metal stamping parts, focussing on the challenges identified in Experiment 1. An extended dataset with a higher number of neck defects has been created to address the limitations observed. Additionally, a controlled lighting environment has been established to investigate the impact of harsh lighting conditions on defect detail capture. Through this study, we aim to enhance defect detection accuracy and gain valuable insights for improved performance in challenging scenarios.
Dataset
The models trained in Experiment 1 demonstrated limitations in two specific cases: (1) detecting small defects such as necks and (2) identifying defects with limited visible details. Moreover, instances of bright reflections were observed, which can potentially occlude the finer details of defects.
To investigate these challenges, first, additional samples, specifically focussing on neck defects, were collected. The creation of neck defects involved stopping the punch just before reaching the predefined punch movement depth, resulting in the formation of defects. While successful attempts primarily resulted in neck defects, a few split and non-defective samples were also generated. The final dataset contains 150 samples including 24 samples with multiple defects and 30 non-defective samples.
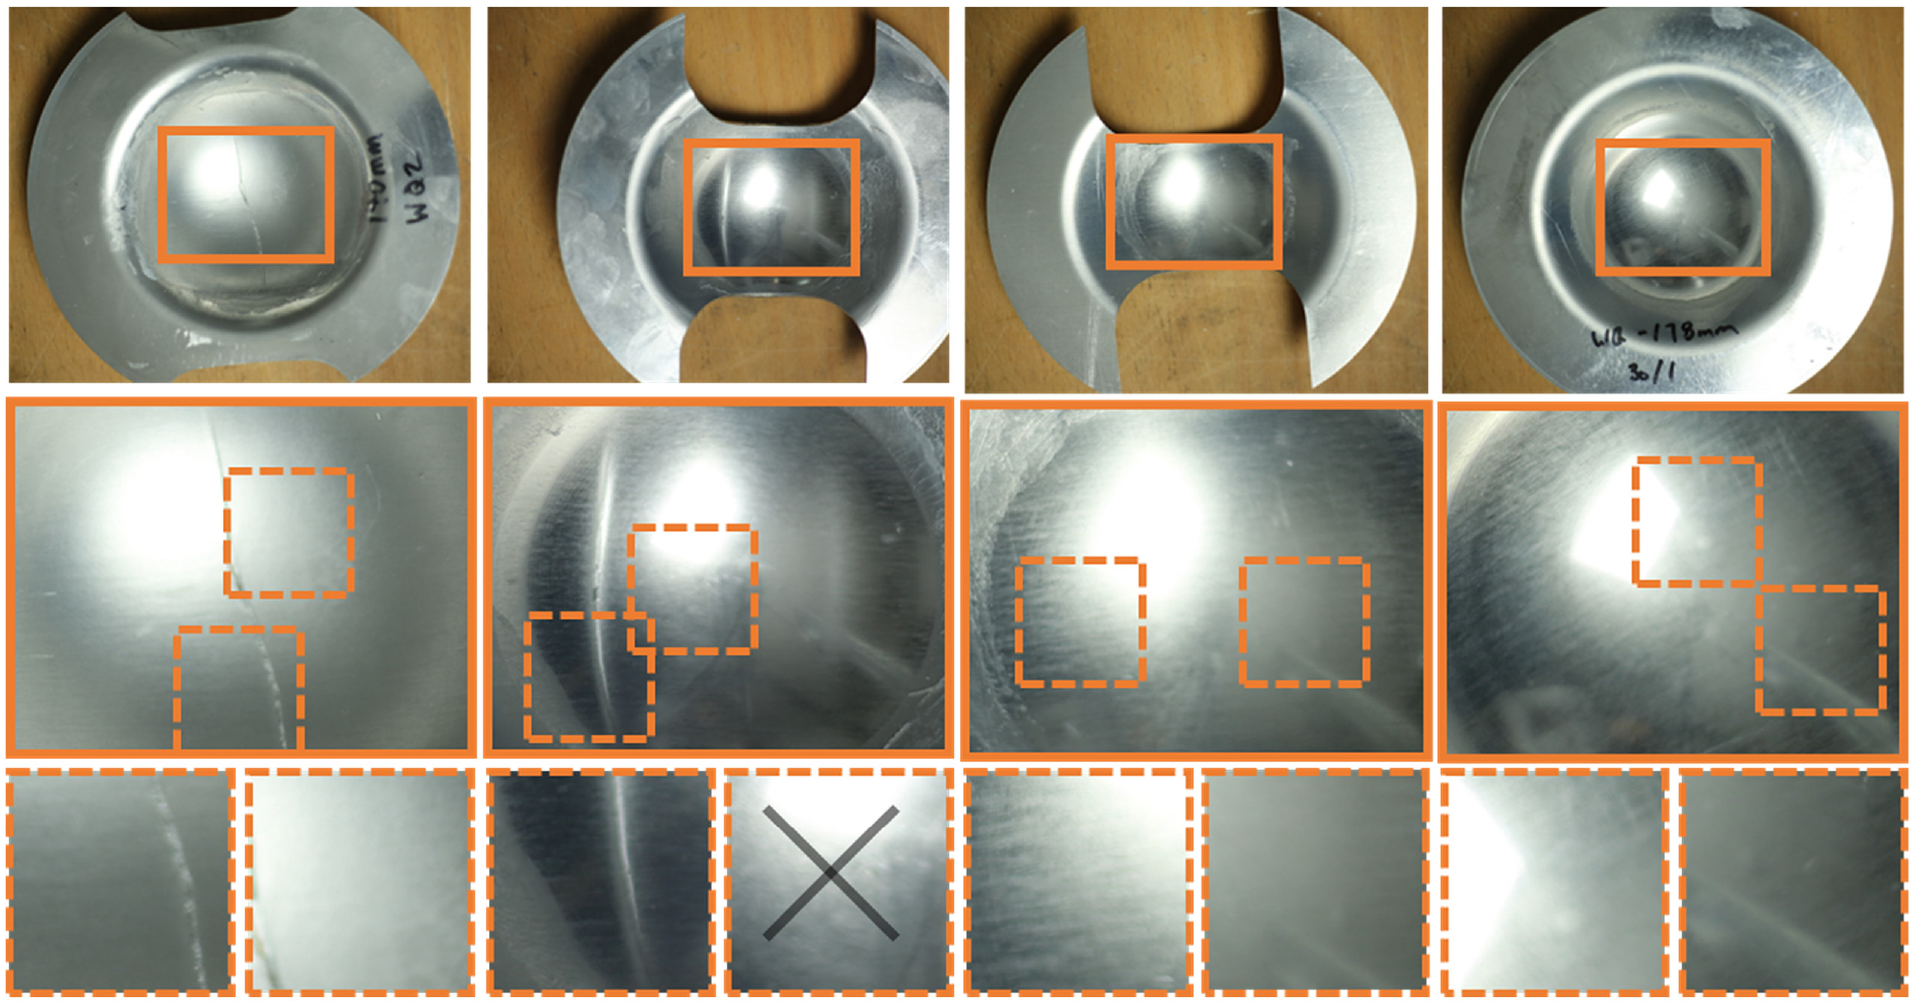
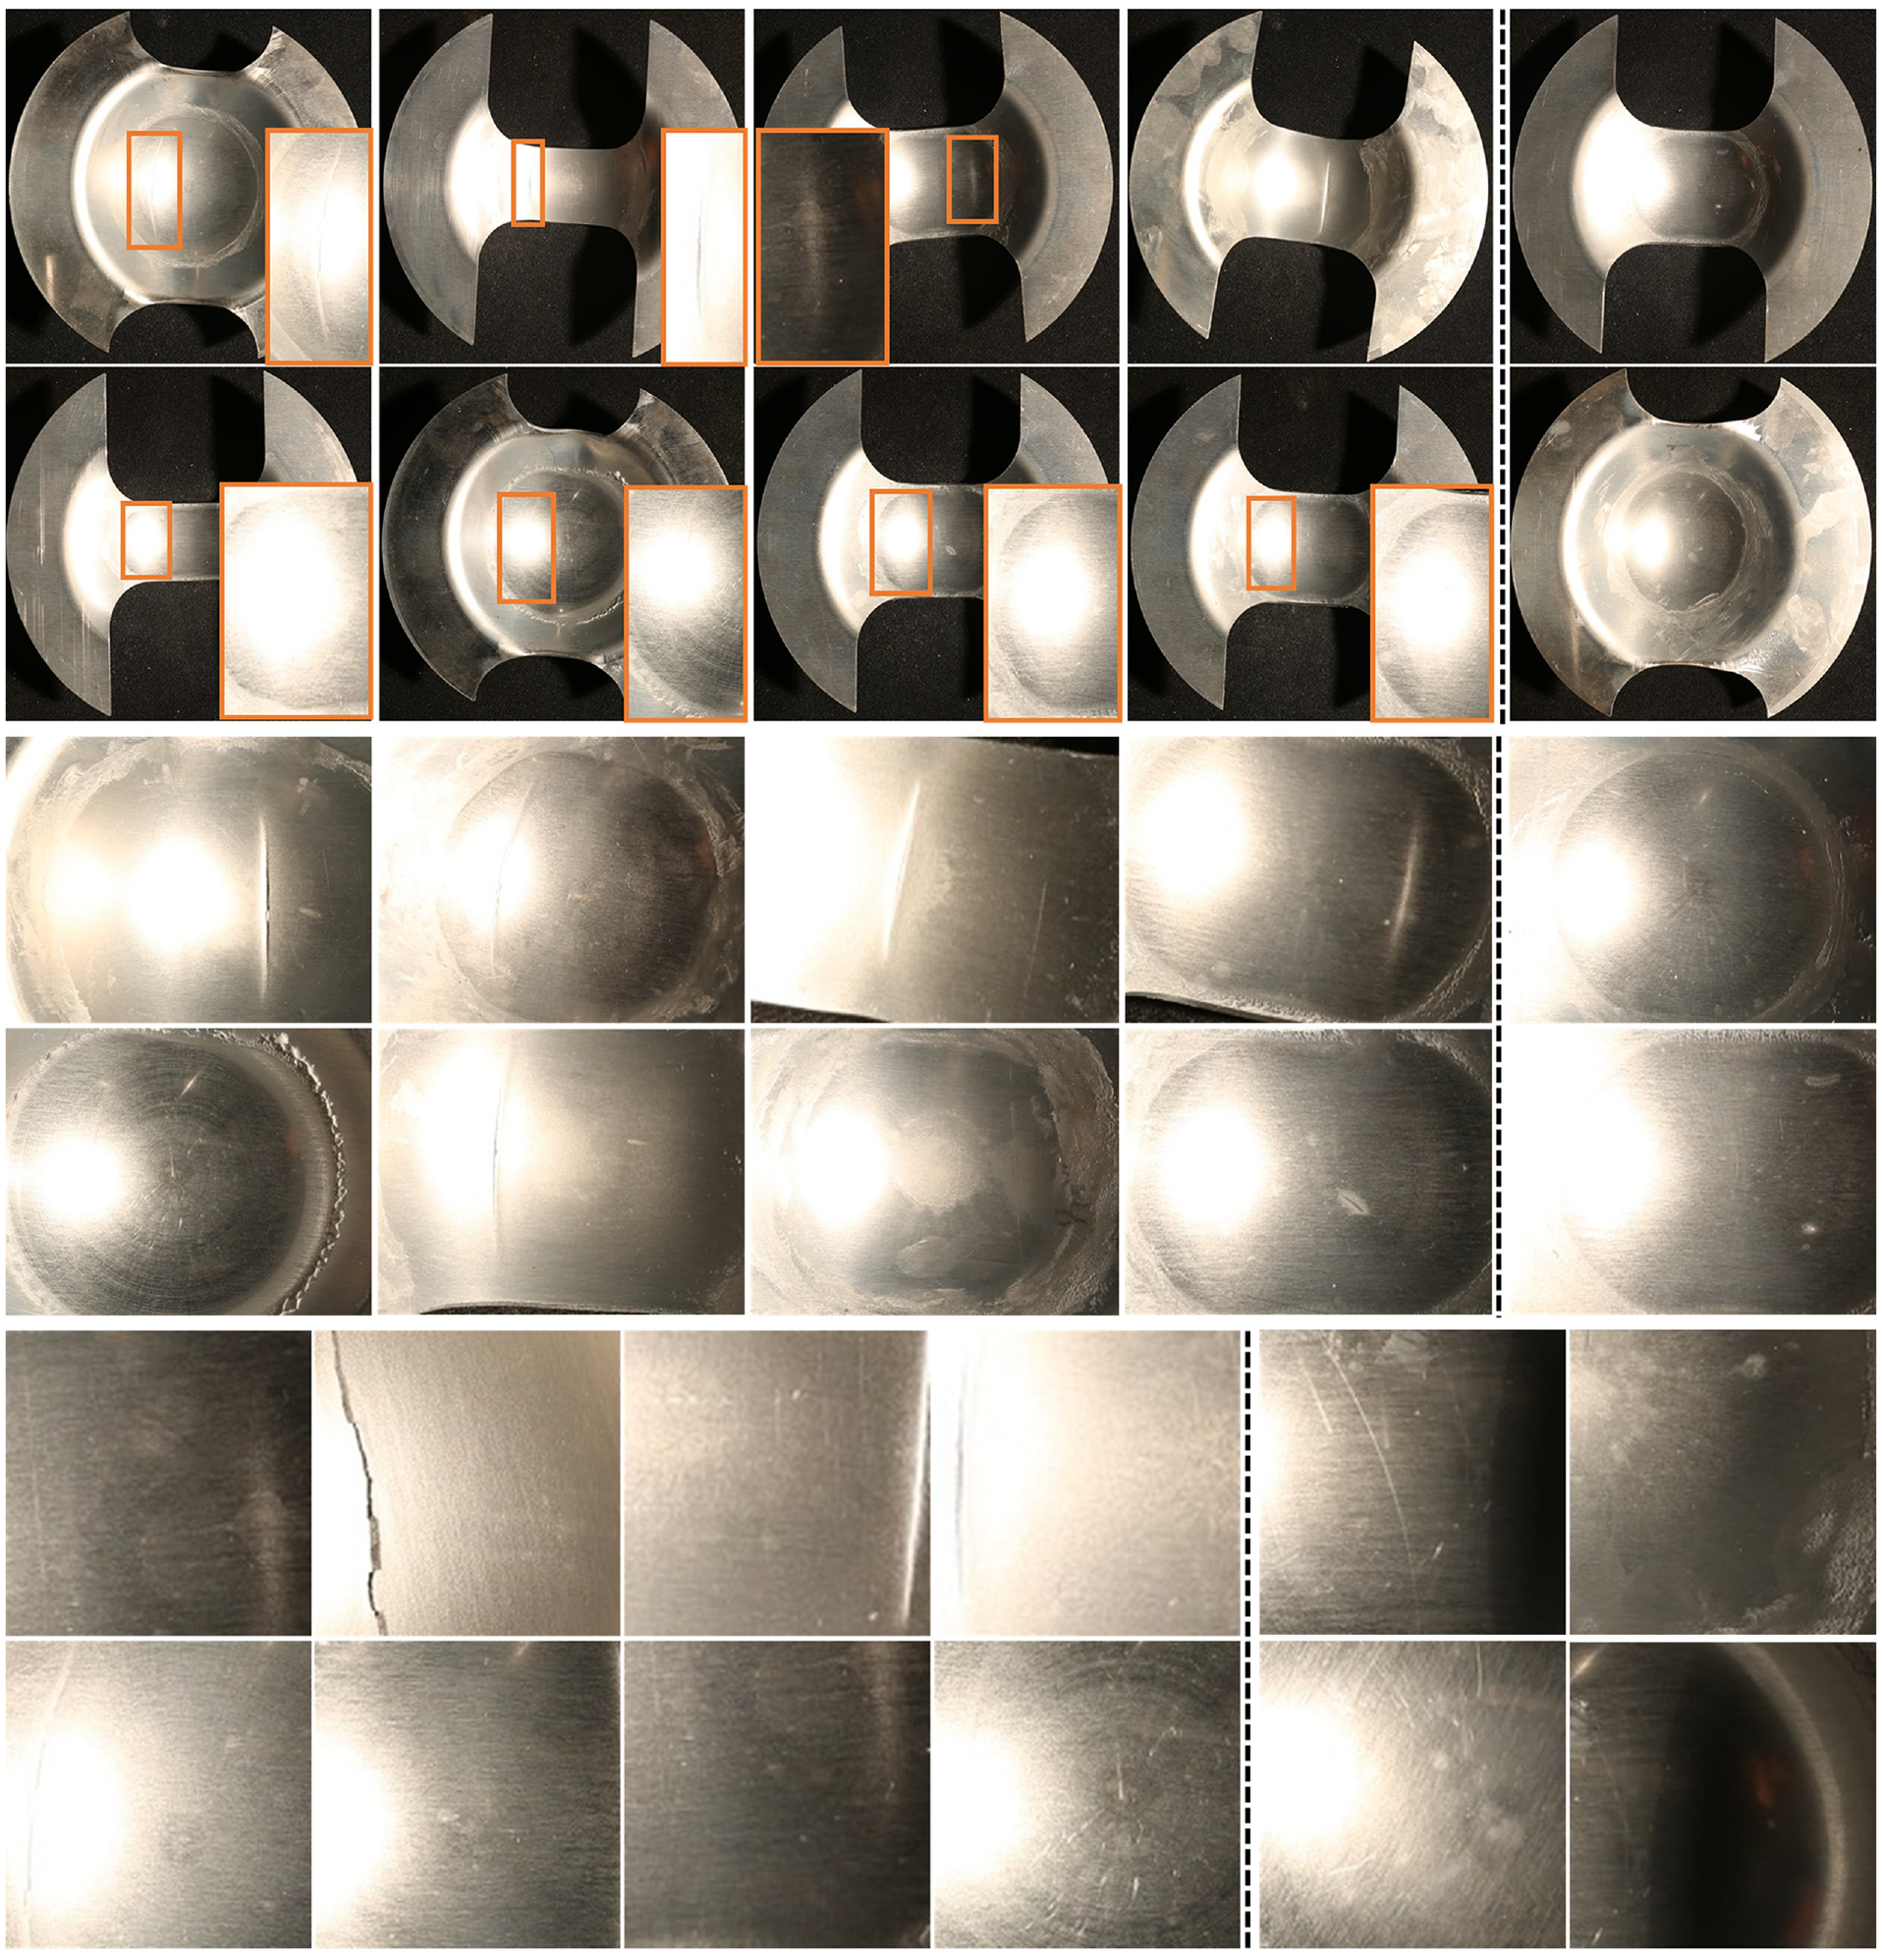
To investigate the effect of bright reflections, the images were captured in a controlled dark room environment. The setup caused approximately 50% of the defects to be located near the bright reflection area. Figure 6 displays examples of the collected images. As can be observed some neck defects are fully within the reflection area.
Shows example images from dataset 2, where the left and right of the dotted lines show defective and good samples respectively. The images are captured in a controlled environment with a black background. The scene is illuminated with a 2 KW halogen light.
Following the same methodology presented in Experiment 1, the images of whole samples
Quantitative results
Table 2 presents the performance metrics achieved by the model for each dataset configuration and fold. The model’s same level of performance on both the
Shows the model performance trained and validated on dataset2.
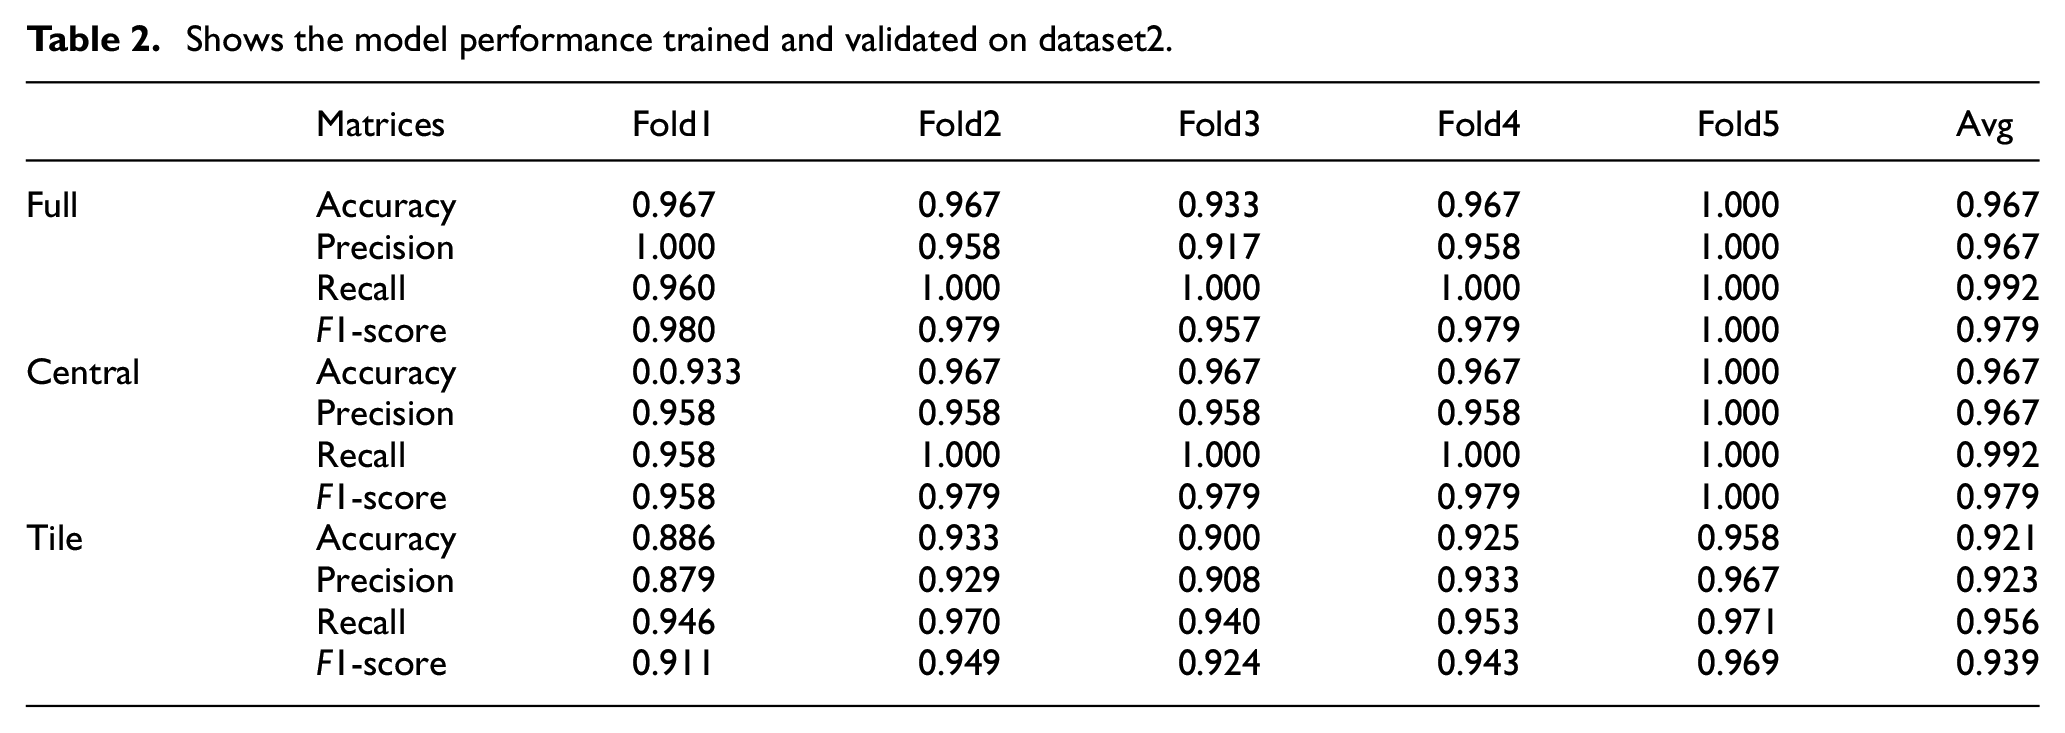
To comprehend this discrepancy, we need to consider cases where the models struggle to classify defects from good samples. There are two main scenarios (1) minor neck defects and (2) defect details occluded by light reflections. The latter is especially pronounced for small defects that become completely obscured by reflections. In the full and central datasets, in the case of samples with multiple defects, if a clear split defect is identified, the model classifies the sample as defective, even if it fails to detect other challenging defects. Yet, in the tile dataset, these individual defects function as separate samples, resulting in incorrect predictions.
Qualitative results
Figure 7 presents the outcomes of the qualitative analysis performed on each dataset configuration. The figure is structured into six rows, with each pair of rows dedicated to a specific dataset configuration. Rows 1 and 2 depict results for the
Displays the qualitative analysis outcomes for Experiment 2 across various dataset configurations. The left and right of the dotted lines show defective good samples respectively. Rows 1 and 2 depict results for the
We examined the GradCAM results to gain further insights into the model’s performance as shown in Figure 8. These results demonstrated that the model successfully learned and localised the defect regions, providing evidence of its capability to identify and classify defects. Moreover, the absence of confounding factors in the dataset was evident from these results, as the model relied solely on defect-related features to make its decisions.
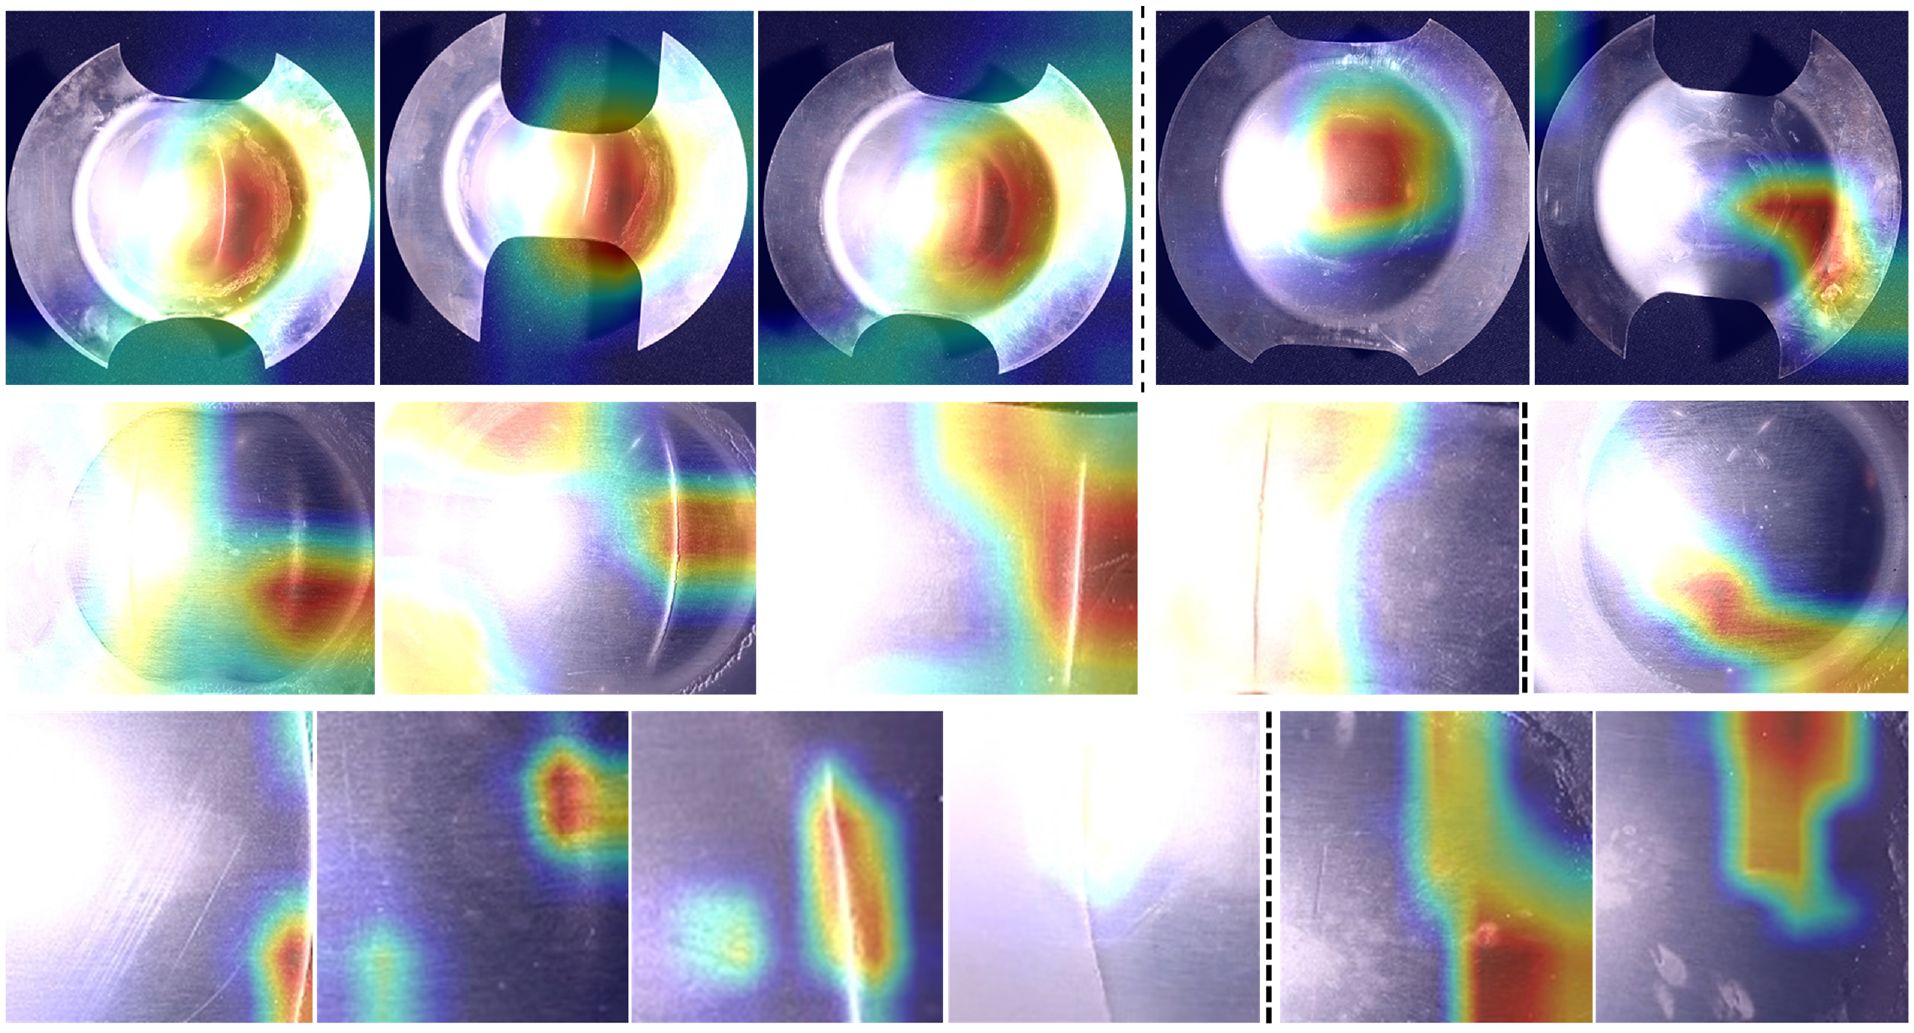
Shows GradCAM results for Experiment 2, where the left and right of the dotted lines show defective good samples respectively.
Discussion
The observation from Figure 7 reveals that a significant portion of incorrect predictions can be attributed to occlusions caused by reflections, particularly affecting smaller defects that become completely concealed by these reflections. For instance, the second and fourth images in the sixth row are incorrectly predicted due to the total obscuration of defect details. Moreover, the influence of reflections is also evident in false predictions for non-defect samples. For instance, in the last row, the sixth image of Figure 7 shows how the model can mistakenly identify arc-like reflections in a shadow region as defects. In other cases, reflections themselves lead to incorrect predictions for non-defect samples.
In contrast, when considering the tile dataset, the fourth image in the fifth row of Figure 7 stands out as accurately predicted by the model, despite the split defect residing entirely within the reflection region. This accuracy is attributed to the model’s ability to capture subtle defect details. Similarly, instances where neck defects are located outside the reflection region were correctly predicted.
These findings, coupled with the high overall accuracy of the model and successful GradCAM visualisations, provide evidence of the model’s generalisability and robustness to both split and neck defects when the pertinent defect details are present. This resilience to challenges posed by reflections showcases the model’s potential in diverse defect scenarios. However, it is acknowledged that addressing the outlined challenges, particularly refining the model’s performance in scenarios where defect details are obscured by reflections, holds promise for further improving the CNN model’s overall performance.
Summary
This article explored the application of a vision-based DL framework for detecting defects in sheet metal stamping. Although the DL model demonstrated excellent performance in detecting anomalies and defects in images, limited prior research focussed on stamping defects detection, and none investigated potential challenges within the process.
Two comprehensive case studies were conducted in this work, involving the training of a state-of-the-art DL model using different datasets of real stamping parts. The dataset was generated by manufacturing a series of Nakajima samples containing parts with and without defects. In the first Experiment, the augmented datasets yielded high classification accuracy, recall and precision. These results indicate the viability of the proposed method for defect detection in the sheet metal stamping process. Additionally, the study employed explainable AI tools, such as GradCAM, enhancing transparency and interpretability for the CNN-based approach. This study revealed that the presence of confounding factors in limited training data could lead to model failure.
Drawing insights from the first experiment, a comprehensive dataset was constructed by introducing underrepresented defects (neck defects) and capturing images in a controlled lighting environment. The second experiment further explored the impact of harsh lighting and reflections on defect detection. The observations indicated that the model struggled to identify defects occluded by reflections, particularly small neck defects.
Overall, the study showcases the promise of the vision-based DL framework in sheet metal stamping defect detection. It also highlights its limitations and the importance of addressing real-world challenges like lighting conditions and limited available training data.
Footnotes
Declaration of conflicting interests
The author(s) disclosed receipt of the following financial support for the research, authorship, and/or publication of this article: This research was was financially supported by Warwick Manufacturing Group of University of Warwick. Award Number: WIIT, received by Aru Ranjan Singh.
Funding
The author(s) received no financial support for the research, authorship, and/or publication of this article.