
Abstract
Residual stress induced during welding is an essential factor affecting a fabrication product’s service life. The vibration stress relief (VSR) technique is widely used in metal fabrication to reduce residual stresses. This paper presents an experimental assessment of the effectiveness of VSR in shielded gas metal arc welded low carbon construction steel (IS2062 E250BR) plates. An eccentric rotating mass vibration exciter with different process parameters has been used here to generate the vibration and the residual stresses have been measured by the X-ray diffraction (XRD) technique. The effect of VSR on phase crystal grain, misorientation, and texture was examined through a scanning electron microscopy (SEM) and electron backscatter diffraction (EBSD) analysis. The results indicate that the compressive residual stress was reduced by 21%. The microstructural analysis shows that the applied stress has affected the grain growth and orientation. In the end, a qualitative analysis of VSR parameters and residual stress is established.
Introduction
Metal fabrication processes always induce residual stress in the product, which significantly reduces the life span of the material and its performance under oscillatory stresses. Due to high variational thermal cycles, residual stress is more prominent in welding. 1 Marine and offshore industries extensively use Submerged arc welding (SAW), Gas metal arc welding (GMAW), and Fluxed core arc welding (FCAW) due to their usability and ease of automation. Concurrently, residual stresses generated from these welding processes have adverse effects on the overall fatigue life of the metal component and the structure.2–4 Hot-rolled IS 2062 E250BR is usually used in marine and offshore structures due to its high weldability and pitting corrosion resistance. Various stress relaxation processes like post-weld heat treatment (PWHT), 5 shot-peening,6,7 post-weld rolling, 8 and thermo-mechanical tensioning 9 are commonly used to reduce residual stresses. Due to the high degree of process complexity and high energy requirements, the above methods suffer disadvantages. The utilization of PHWT and thermo-mechanical tensioning techniques necessitates high temperatures, resulting in the emergence of fresh intermetallic constituents and the development of oxide layers on the exterior surface, which contributes to the constraint stated as a limitation. 10 In recent years, the usage of the VSR technique is rapidly increasing to avoid the process complexities generated due to the thermal relief processes. For the same amount of stress relief, the VSR process requires lesser working time and lesser energy requirement (1%). 11 On the other hand, VSR conveniently handles the issues of intermetallics formation with negligible induced distortion. This method is also beneficial in enhancing tensile strength without significant microstructural changes. 12
The benefits of VSR, especially for welding residual stress reduction, have been studied extensively in recent years. 13 Wang et al. 14 analyzed the microstructural texture development due to VSR in AZ31 Mg alloys and noticed that vibration stress excitation introduces random orientation of grains, weakening an existing strong orientation. For the same material, Ebrahimi et al. 15 calculated (numerically) the effectiveness of the VSR load frequency on the longitudinal residual stress. They found that the stress can be reduced significantly if the loading frequency is more than 50% of the fundamental frequency. Rao et al. 16 modeled and evaluated the effectiveness of VSR using amplitude and frequency of applied stresses in the case of 304 L stainless steel. Vykunta Rao et al. 17 analyzed the microstructure of an aluminum 5052 alloy-made butt joint subjected to vibration and observed that the average grain size was improved after the stress treatment. The joint was made by using gas tungsten arc welding. Sun et al. 11 examined the microstructural sample of bar steel subjected to vibration and found that the yield strength and ultimate tensile strength of the sample were decreased by 3.1% and 7%, respectively. Mohanty et al. 18 have investigated and evaluated the efficacy of VSR for AISI 316 austenitic steel plate by using an electromagnetic exciter. The experimental findings indicate that the application of VSR treatment on the specimen resulted in a 5% increase in the ultimate tensile stress limit.
Recently, a substantial study on the influence of microstructure on residual stress for various machining processes has been undertaken.19–22 Different high-precision methods such as X-ray diffraction, hole drilling, and Neutron diffraction are used to quantify the residual stress in a material sample. Yang 23 has extensively studied the major process parameters (in a butt weld), focusing on the effect of vibration frequency and force amplitude. According to him, both resonant and non-resonant frequencies effectively reduce residual stress. For Ti6Al4V, Gao et al. 24 studied the microstructural transformation subjected to a thermal-vibratory stress relief process. An increase in low-angle grain boundary (LAGB) and dislocation density is noticed, which indicates that micro-deformation occurs during stress relief. Rao et al. 25 have reported that mechanical properties have improved by microstructure modifications and tailoring the vibration parameters.
In summary, the literature discussed above is limited to butt-welds subjected to different types of welding for various alloys. However, to the best of the author’s knowledge, a concrete microstructural analysis of the effect of VSR on low-carbon steel is not available. Since filet joints are commonly used for manufacturing stiffened steel panels in marine and offshore industries, the current study was focused on GMAW welded T-joint. In this study, IS2062 E250BR steel plate has been used exclusively for the GMA welding process. An eccentric mass electric motor attached to the structure requiring stress relief is a generalized source of vibration in VSR processing. 26 In the conventional approach, the Vibro-motor and the set-up for welding the plates are not integrated, and the motor is used to vibrate a larger table supporting the plate. This, in turn, necessitates a significant amount of energy. The effectiveness of utilizing electromagnetic exciters to generate vibration is doubtful due to its lack of cost efficiency. 18 In the current work, a semi-automatic welding set-up was integrated into the vibration generation set-up to apply the vibration soon after finishing the welding without altering the existing boundary condition. Also, the vibration was applied directly to the plate to reduce energy consumption. A point contact setup was implemented to transfer the load directly to the plate in situ without altering its mechanical boundary condition. The exclusivity of the present work lies in validating the effectiveness of VSR using XRD, microstructure and microtexture analysis.
Experimental procedure
Material used in the experiment
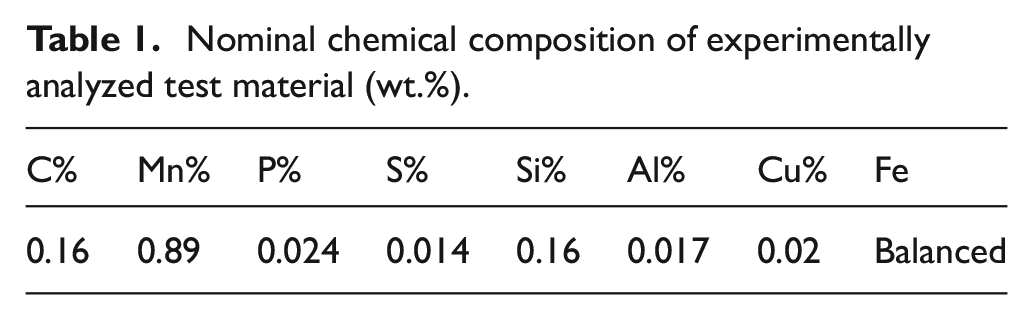
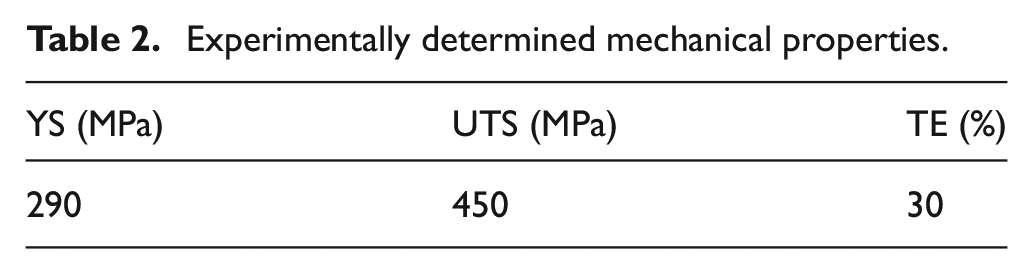
The factory received plates were of IS 2062 E250BR grade hot rolled medium and high tensile strength steel plates. The chemical composition of the steel plate is presented in Table 1. The concentration of Fe, Al, Mn, Cu, Si, and P was determined by X-ray Fluorescence (XRF) technique (Bruker D8 Tiger), whereas the concentration of C and S was determined using a carbon sulfur analyzer (Bruker G4-ICARUS). Sub-size tensile specimens of 25 mm gage length and 6 mm thick are prepared using ASTM standard (E-08). A uniaxial, uninterrupted, room temperature tensile test was performed at a strain rate of 1.33 × 10⁻³/s to determine the mechanical properties of the specimen, which are shown in Table 2. Based on these experimental investigations, the grade of steel was classified as IS 2062 E250BR.
Nominal chemical composition of experimentally analyzed test material (wt.%).
Experimentally determined mechanical properties.
Welding equipment and specimen preparation
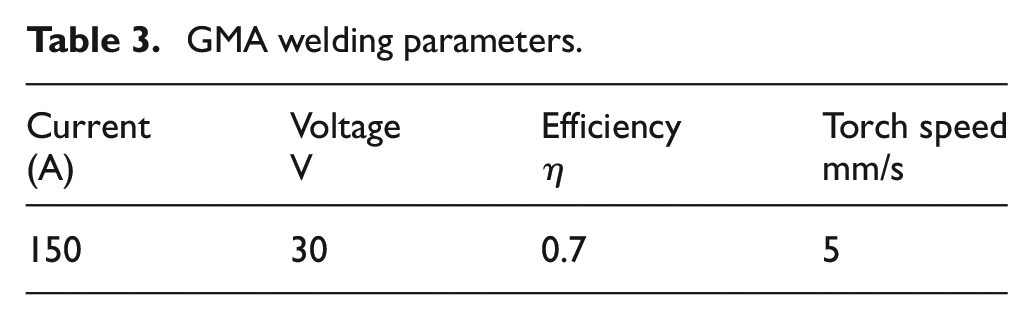
A filet joint consisting of two thin plates of the above specification was considered as the welding specimen. The base plate (400 mm × 200 mm × 6 mm) and stiffener (80 mm × 200 mm × 6 mm) were filet welded by CO2 GMAW (Gas Metal Arc Welding) technique using a semi-automatic welding set-up (Figure 1). Table 3 shows the GMA welding parameters used in this current study. To obtain a steady cooling rate, the constant surrounding temperature of the entire welding procedure from start to finish was maintained at 30°C. The coordinate system used for this welding is shown in Figure 1(b). The Y-axis is designated as the longitudinal direction (along the welding line) whereas, X and Z axes represent the transverse (along the length of the base plate) and normal direction, respectively. A rotating boom arm, which holds the welding torch was attached to the semi-automatic welding set-up to facilitate double-side welding (Figure 1(a)). A weld bead was deposited on both sides of the stiffener. The first line of welding was along the +Y axis and the second line is along the −Y axis. The specimen was cooled down (no forced cooling) to room temperature (30°C) after the end of the second welding. During this cooling phase, the vibration was applied to the specimen (vibration set-up has been described in the following Section 2.3). During welding, the base plate was fixed at one end in a horizontal cantilever position, as shown in the diagram (Figure 1(b)). Figure 2(a) shows the semi-automatic setup of the welding station. Welding was carried out using constant voltage electrode positive polarity with flux-cored wire with a diameter of 1.2 mm. The diameter of the feed wire and wire feed rate (5 m/min) was kept constant throughout the experiments. The shielding gas used in GMAW was 100% CO2. The gas flow rate was 1.2 L/min and the gas preheat temperature was 80°C. The input heat generated by the welding arc in GMAW is expressed by the following equation (1):

where
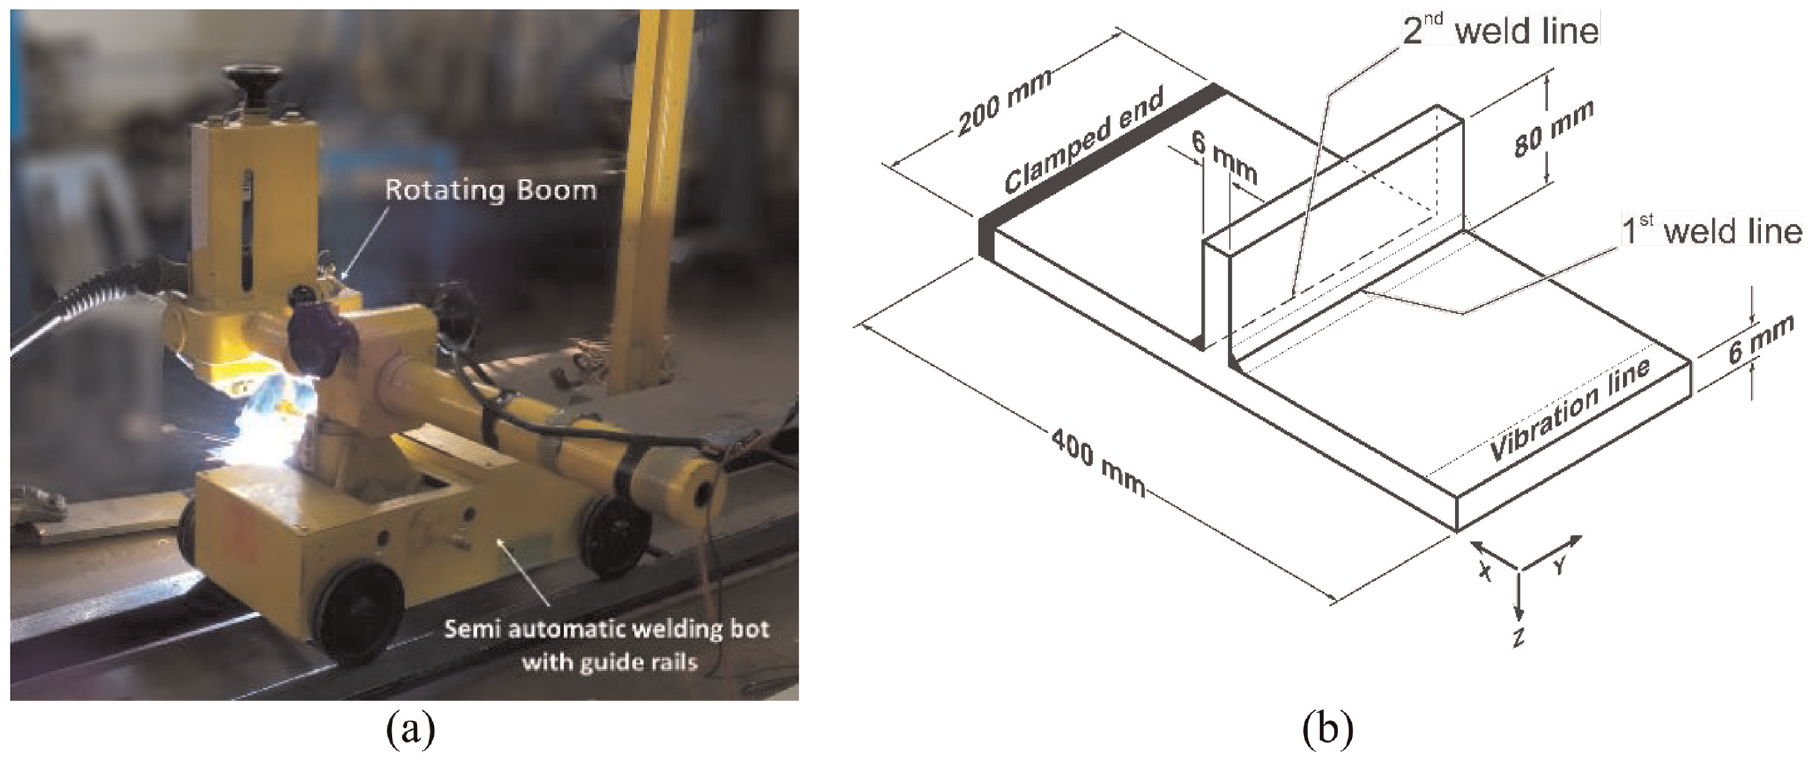
(a) Semi-automatic welding setup and (b) schematic of weld specimen.
GMA welding parameters.
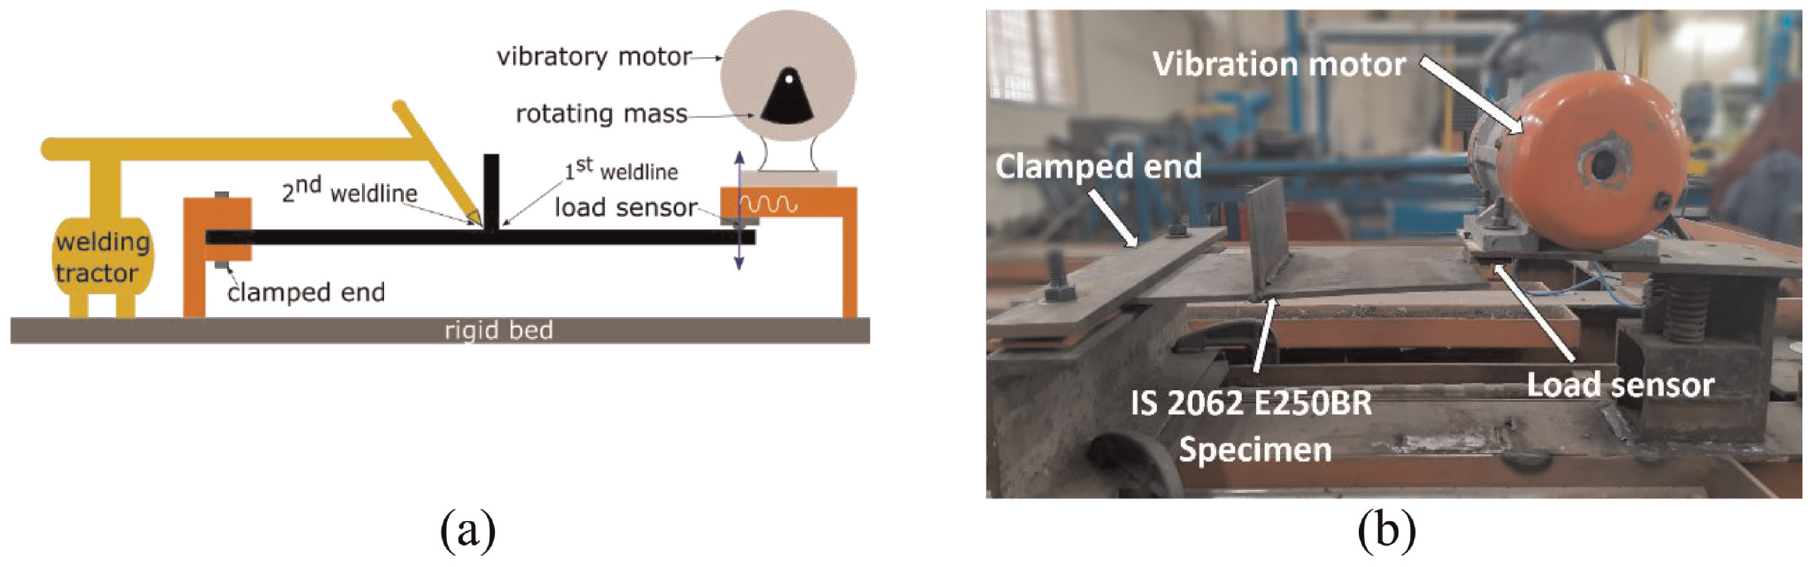
(a) Schematic of welding arrangement and (b) Vibration set-up.
Samples of dimension (8 mm × 8 mm × 6 mm) were cut from the desired location (Figure 3(a)) of the welded plates by wire electrical discharge machining (EDM) process. Further, the samples were polished for XRD stress analysis. Due to the prolonged testing time, the number of tests was limited to a single sample per plate. The location was chosen at the middle of the plate, close to the weld bead as shown in Figure 3(a). This location is close to the edge of the weld bead which is subjected to the grain growth zone and recrystallized zone. 30
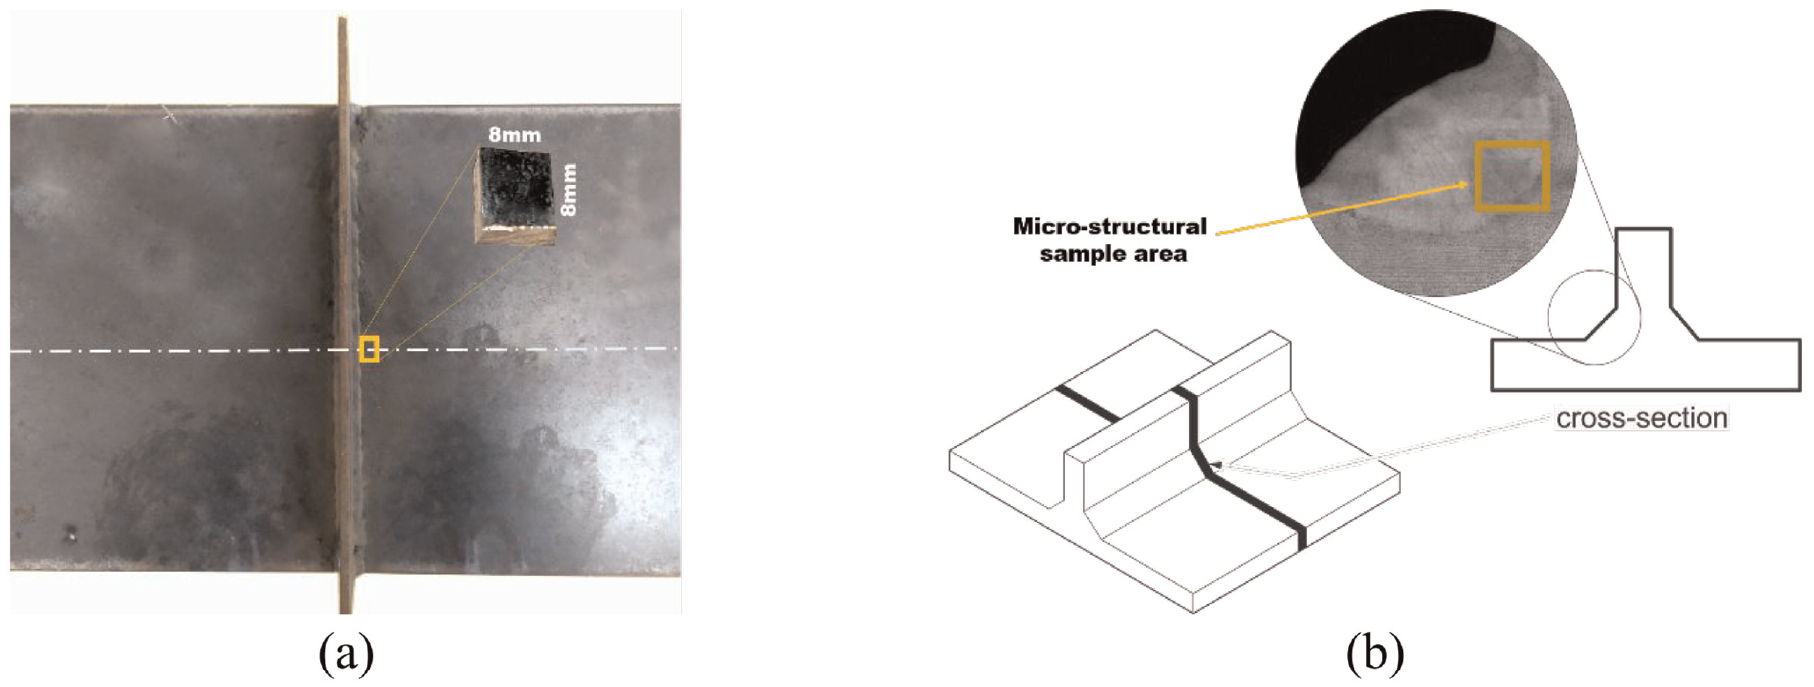
Specimens for: (a) XRD spectroscopy and (b) microstructural characterization.
The mild steel weldment (E25BR) sample of size (50 mm × 50 mm × 6 mm) was mechanically ground, polished, and etched with a 2% nital solution. The microstructure analysis was performed using both an optical microscope (OM, Model ZEISS) and a scanning electron microscope (SEM, Model ZEISS). The phase and texture analyses of the specimens were performed using the electron backscatter diffraction technique (EBSD-FIB, Model ZEISS) with a 025 µm step size by taking a cross-sectional area of 150 µm × 150 µm. The sample preparation for EBSD involves conventional mechanical polishing, followed by electro-polishing with 90% methanol and 10% perchloric acid solution. The grain aspect ratio, misorientation angle, and recrystallized phase fraction (GOS value ≤1° is used to partition the strain-free grains from the deformed grains) were evaluated using TSL-OIM software. The phases present in the steel were identified by X-ray diffraction (Pananalytical Empyrean series 2) analysis. The diffraction pattern was collected using Cr-Kα radiation (λ = 2.29
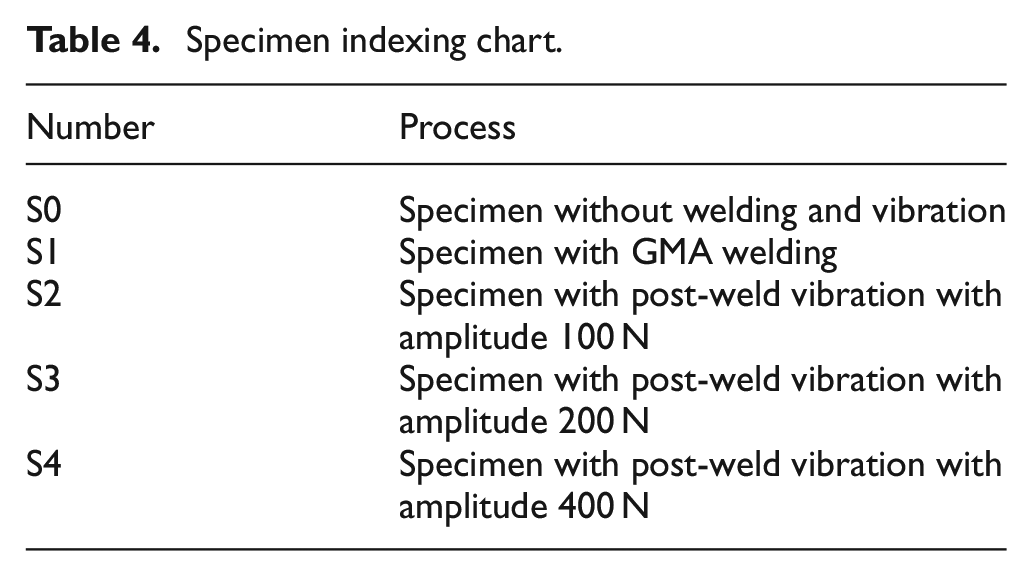
Specimen indexing chart.
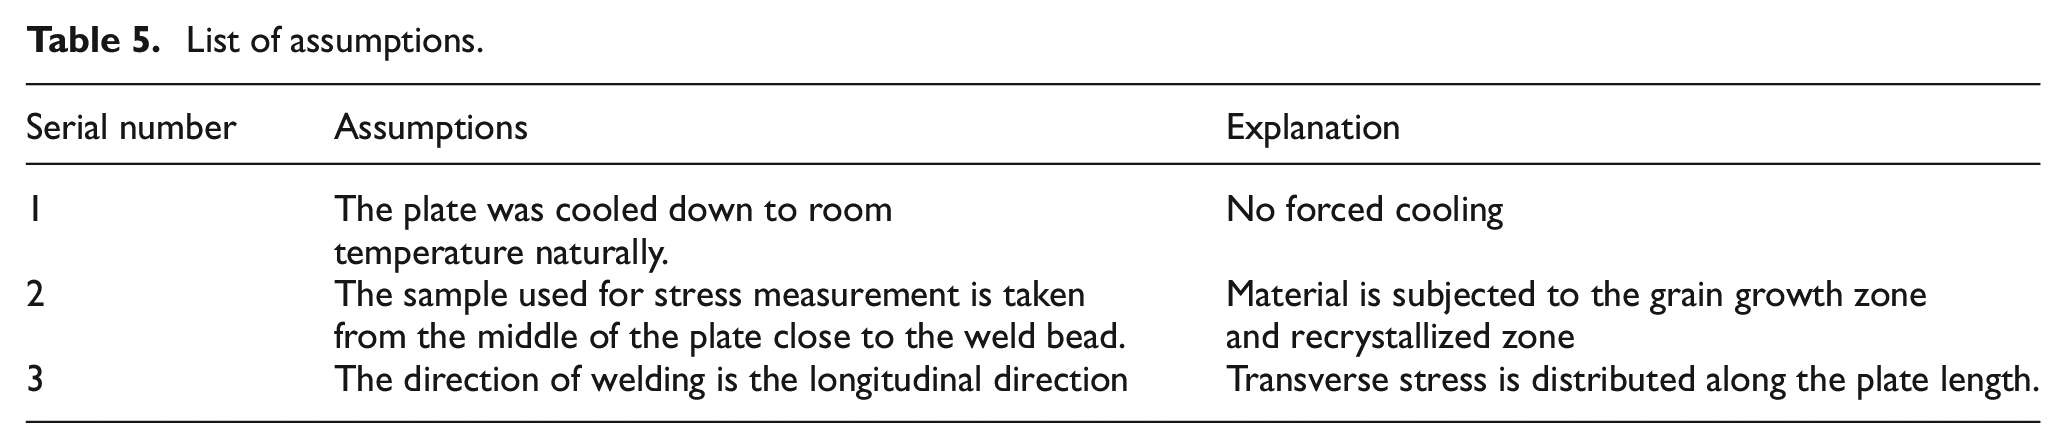
List of assumptions.
VSR set-up
The stress relaxation process was done using an in-house set-up of a Vibro-motor. It was an unbalanced 0.5 HP AC motor (maximum RPM: 3000) with pairs of eccentric weights fitted to the end of the motor shaft (Figure 2(b)). The Vibro-motor was mounted on a platform, firmly bolted to the rigid bed with help with the help of an elastically supported vibration absorber. The platform was connected to the plate specimen with help of a ball pointer (Figure 2(b)). The maximum load amplitude of the vibration was measured through a 50 kg RCA 740 load sensor fitted at the contact point between the plate and the pointer. The frequency of the plate vibration was measured by an accelerometer fitted to the plate. All the stress-relieving experiments were carried out with a non-resonant frequency of 25 Hz. The load amplitude of the vibration varied from 100 to 400 N. The duration of post-weld vibration was selected as 600 s (complete cooling time immediately after the second welding).
Results and discussion
XRD analysis
Welding residual stresses affect the state of stress in all three dimensions of the standard coordinate system (longitudinal, transverse, and out-of-plane stress or normal stress). In the current study, as the applied vibration is perpendicular to the surface of the plate, only the transverse stress component is largely affected, while the other two components are mildly affected.
The XRD analysis was conducted to identify the different phases present in the weldment. The peaks with higher intensity identify the presence of phases in the steel. Figure 4 shows the XRD pattern of the welded sample without vibration (S1). During the welding process, phase transformation occurs from austenite to martensite phase which is also confirmed by XRD analysis (Figure 4).
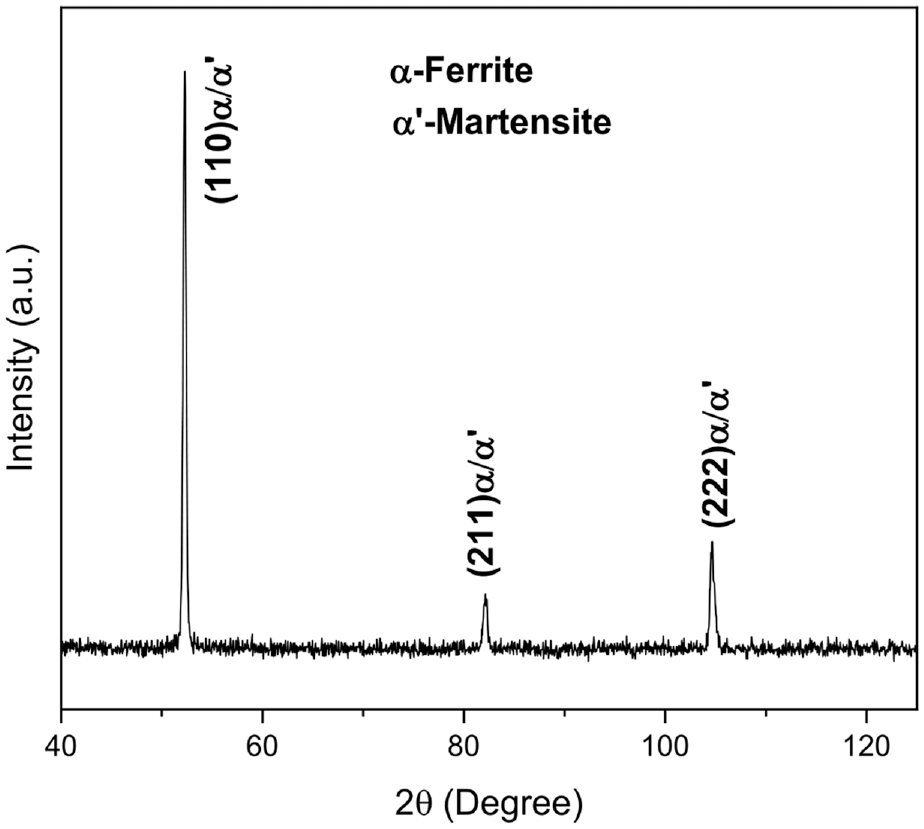
XRD pattern showing phases present in the sample S1.
Figure 5 shows the residual stress plot of each specimen as designated in Table 4 (put a summary table). Figure 5(a) shows the initial compressive residual stress in the as-received sample before welding in the as-received sample. After welding, the magnitude of the compressive stress increased by 93 MPa (Figure 5(b)) (without vibration). Figure 5(c)–(e) depict that the stress was gradually relieved as the vibration amplitude was increased from 100 to 400 N. It can be observed that the compressive stress was relieved from −394.8 to −307.1 MPa.
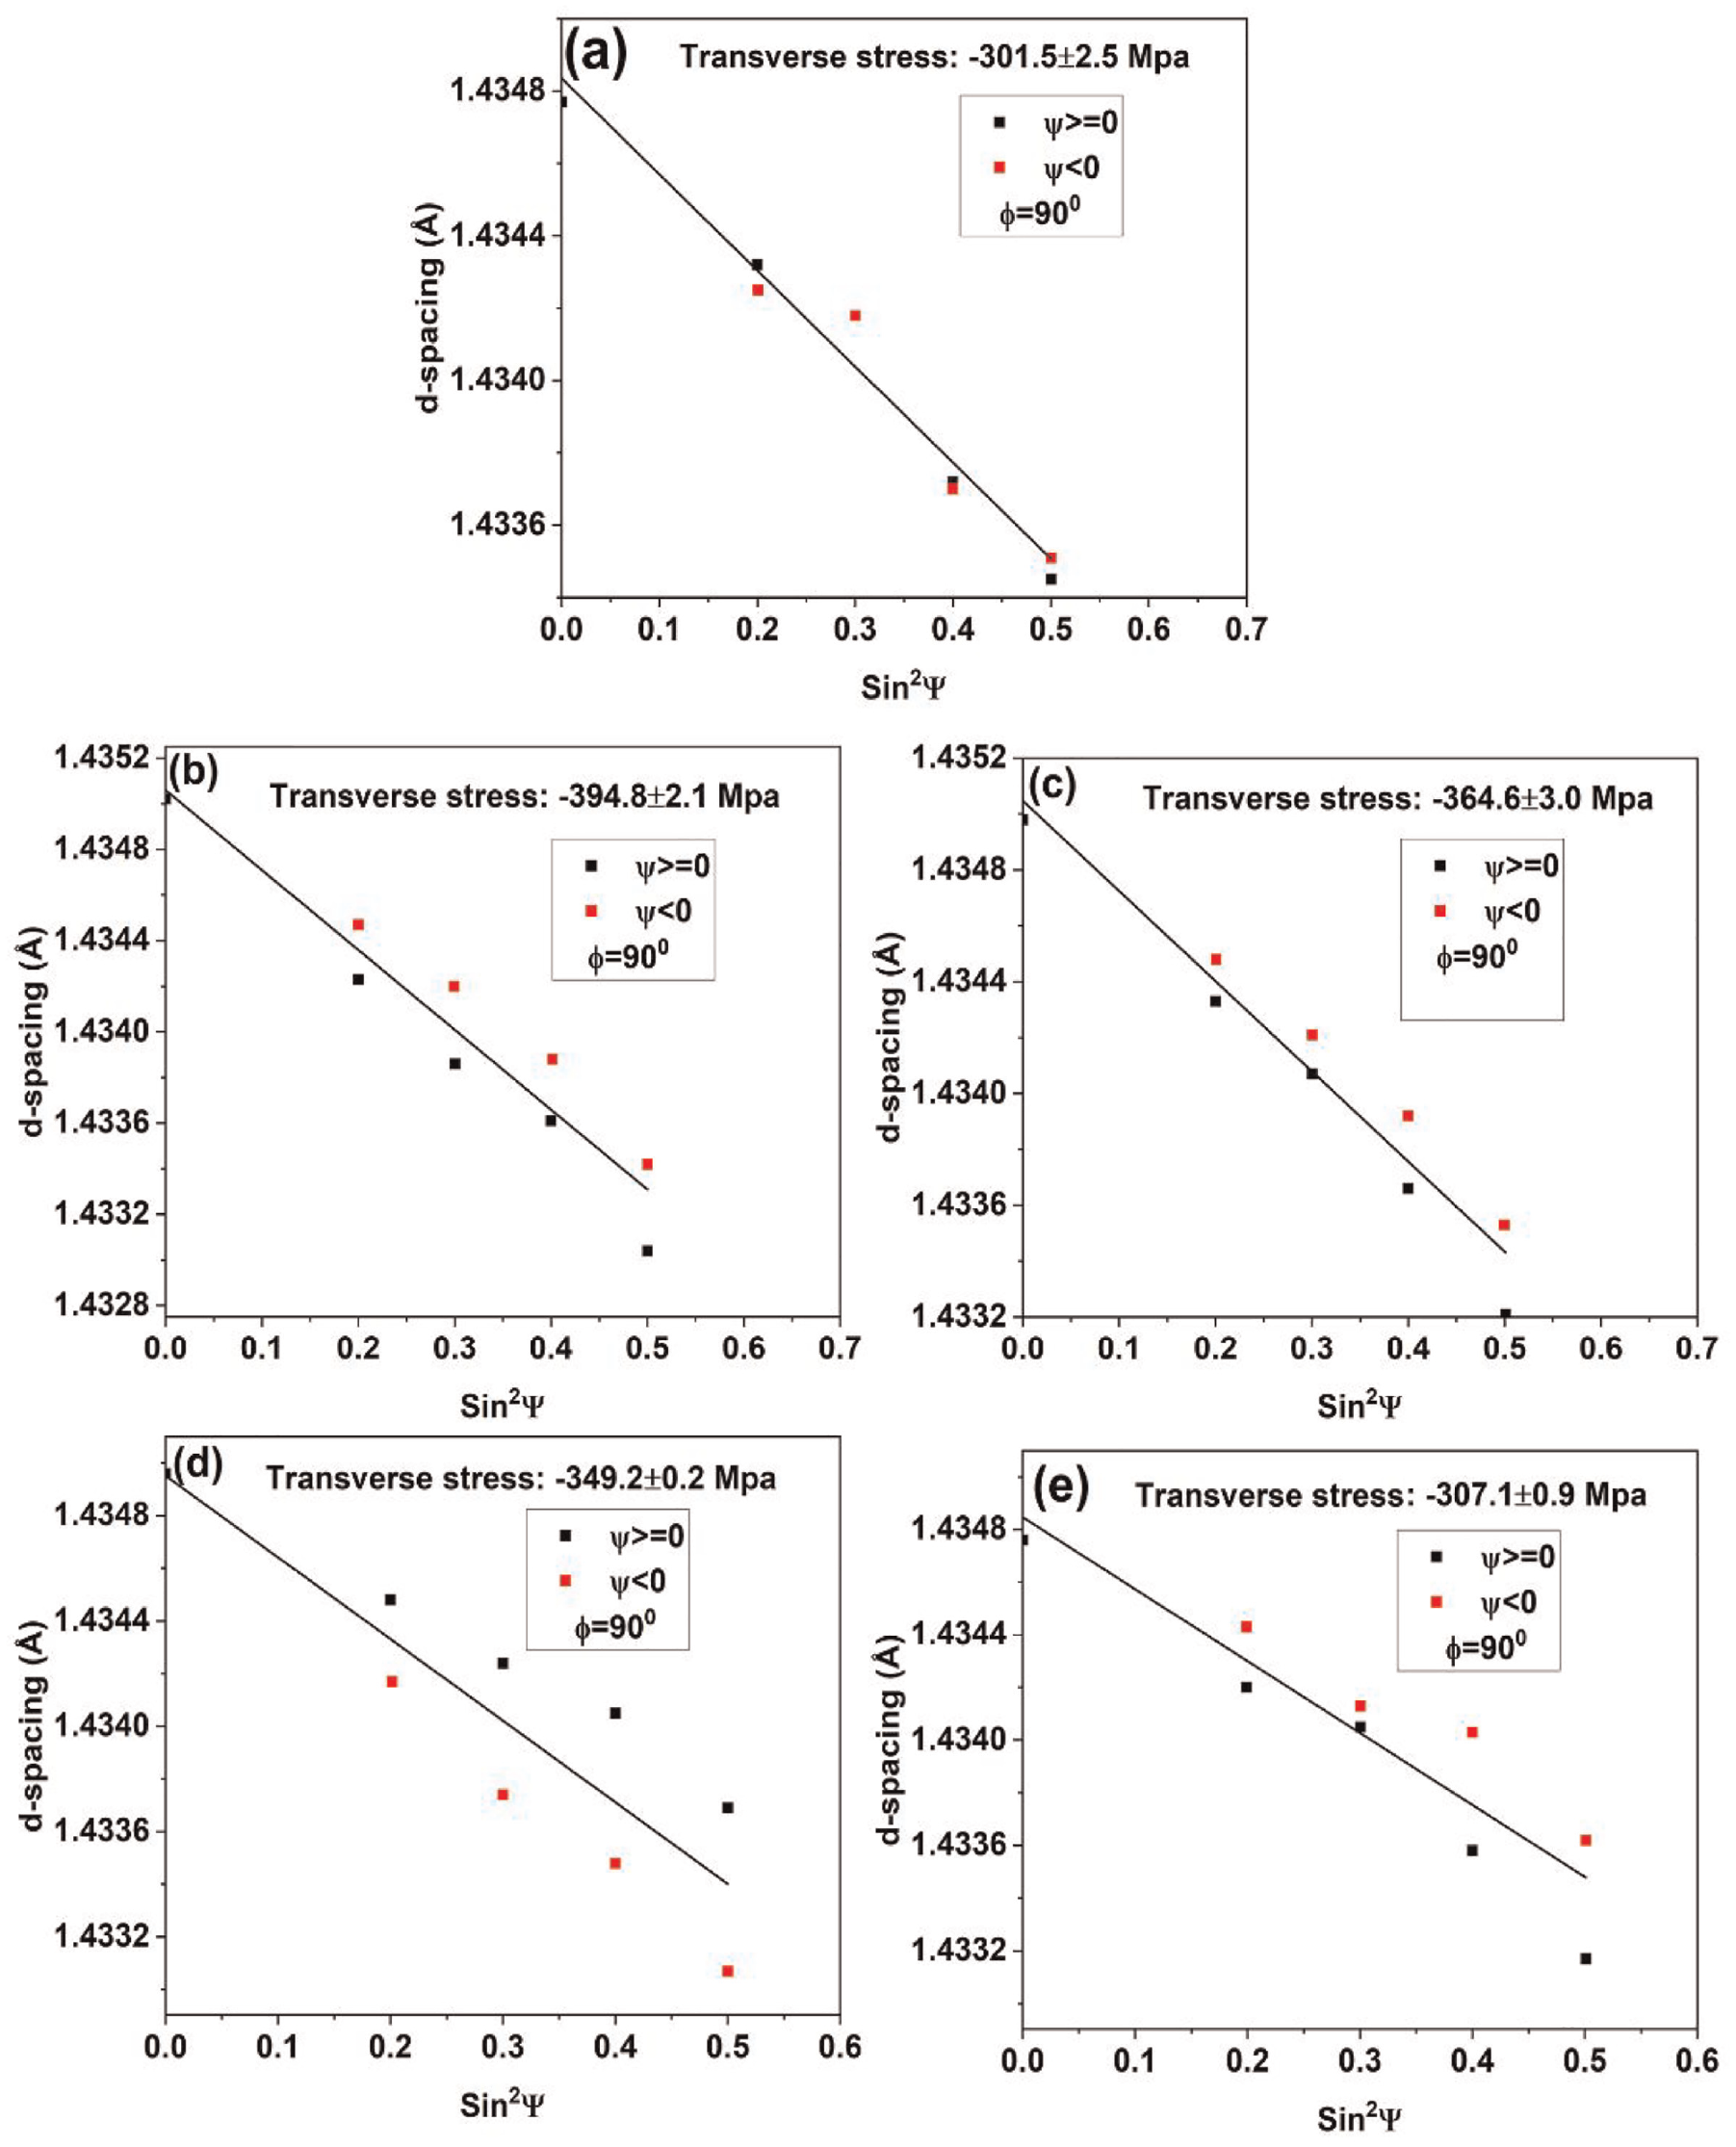
Residual stress plots of: (a) S0, (b) S1, (c) S2, (d) S3, and (e) S4 specimens.
Microstructural characterization
Figure 6 shows the SEM micrographs of all the specimens which are comprised of both ferrite and martensite phases. Specimen S1 shows uniform distribution of equiaxed ferrite and lath-type martensite phase (Figure 6(a)), whereas specimens S2, S3, and S4 show irregular ferrite, and needle and lath-type martensite. The amount of martensite phase is higher in S2, S3, and S4 specimens as compared to the S1 specimen. This is due to the vibration stress induced during welding which accelerates forced cooling and results in the formation of a higher amount of martensite. 31 The phase confirmation and quantification are explored through EBSD and XRD analyses. There is no austenite phase present in any of the specimens which can be observed in Figures 4 and 7.
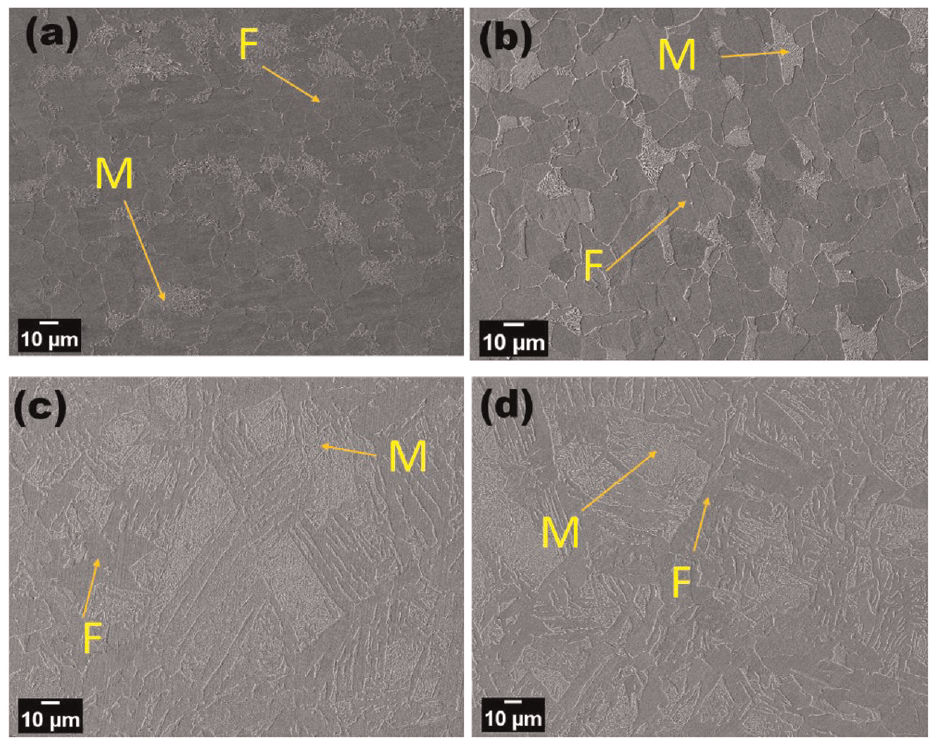
SEM micrographs of: (a) S1, (b) S2, (c) S3, and (d) S4 specimens, respectively.
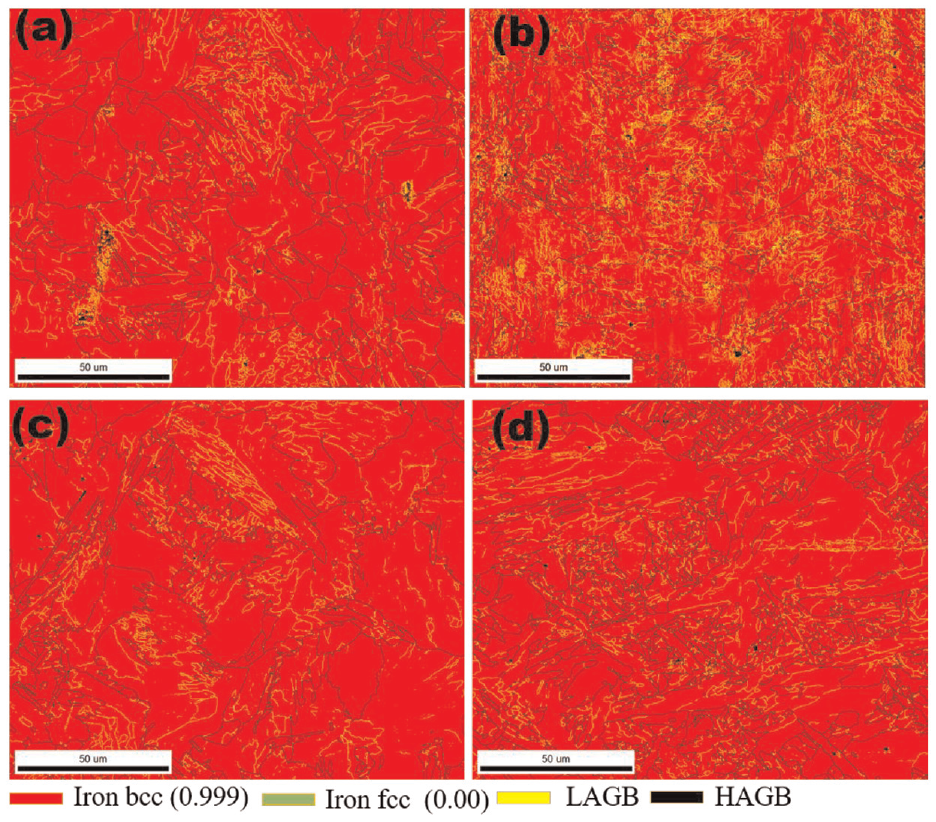
EBSD phase maps with grain boundary of: (a) S1, (b) S2, (c) S3, and (d) S4 specimens, respectively. LAGB: low angle grain boundary; HAGB: high angle grain boundary.
Figure 8 shows the variation in grain aspect ratio in the specimens under different vibration loading conditions. The results show that as the vibratory load increases from 100 to 400 N, the aspect ratio tends to decrease whereas grain orientation increases (Figure 8). It is observed from Figure 8(b) that the aspect ratio is maximum with the range from 0.2 to 0.3. Subsequently, with the increase in vibrational load, the distribution of the aspect ratio shifts toward the higher end. This is attributed to the formation of more needle-type ferrite grains when subjected to a higher load.
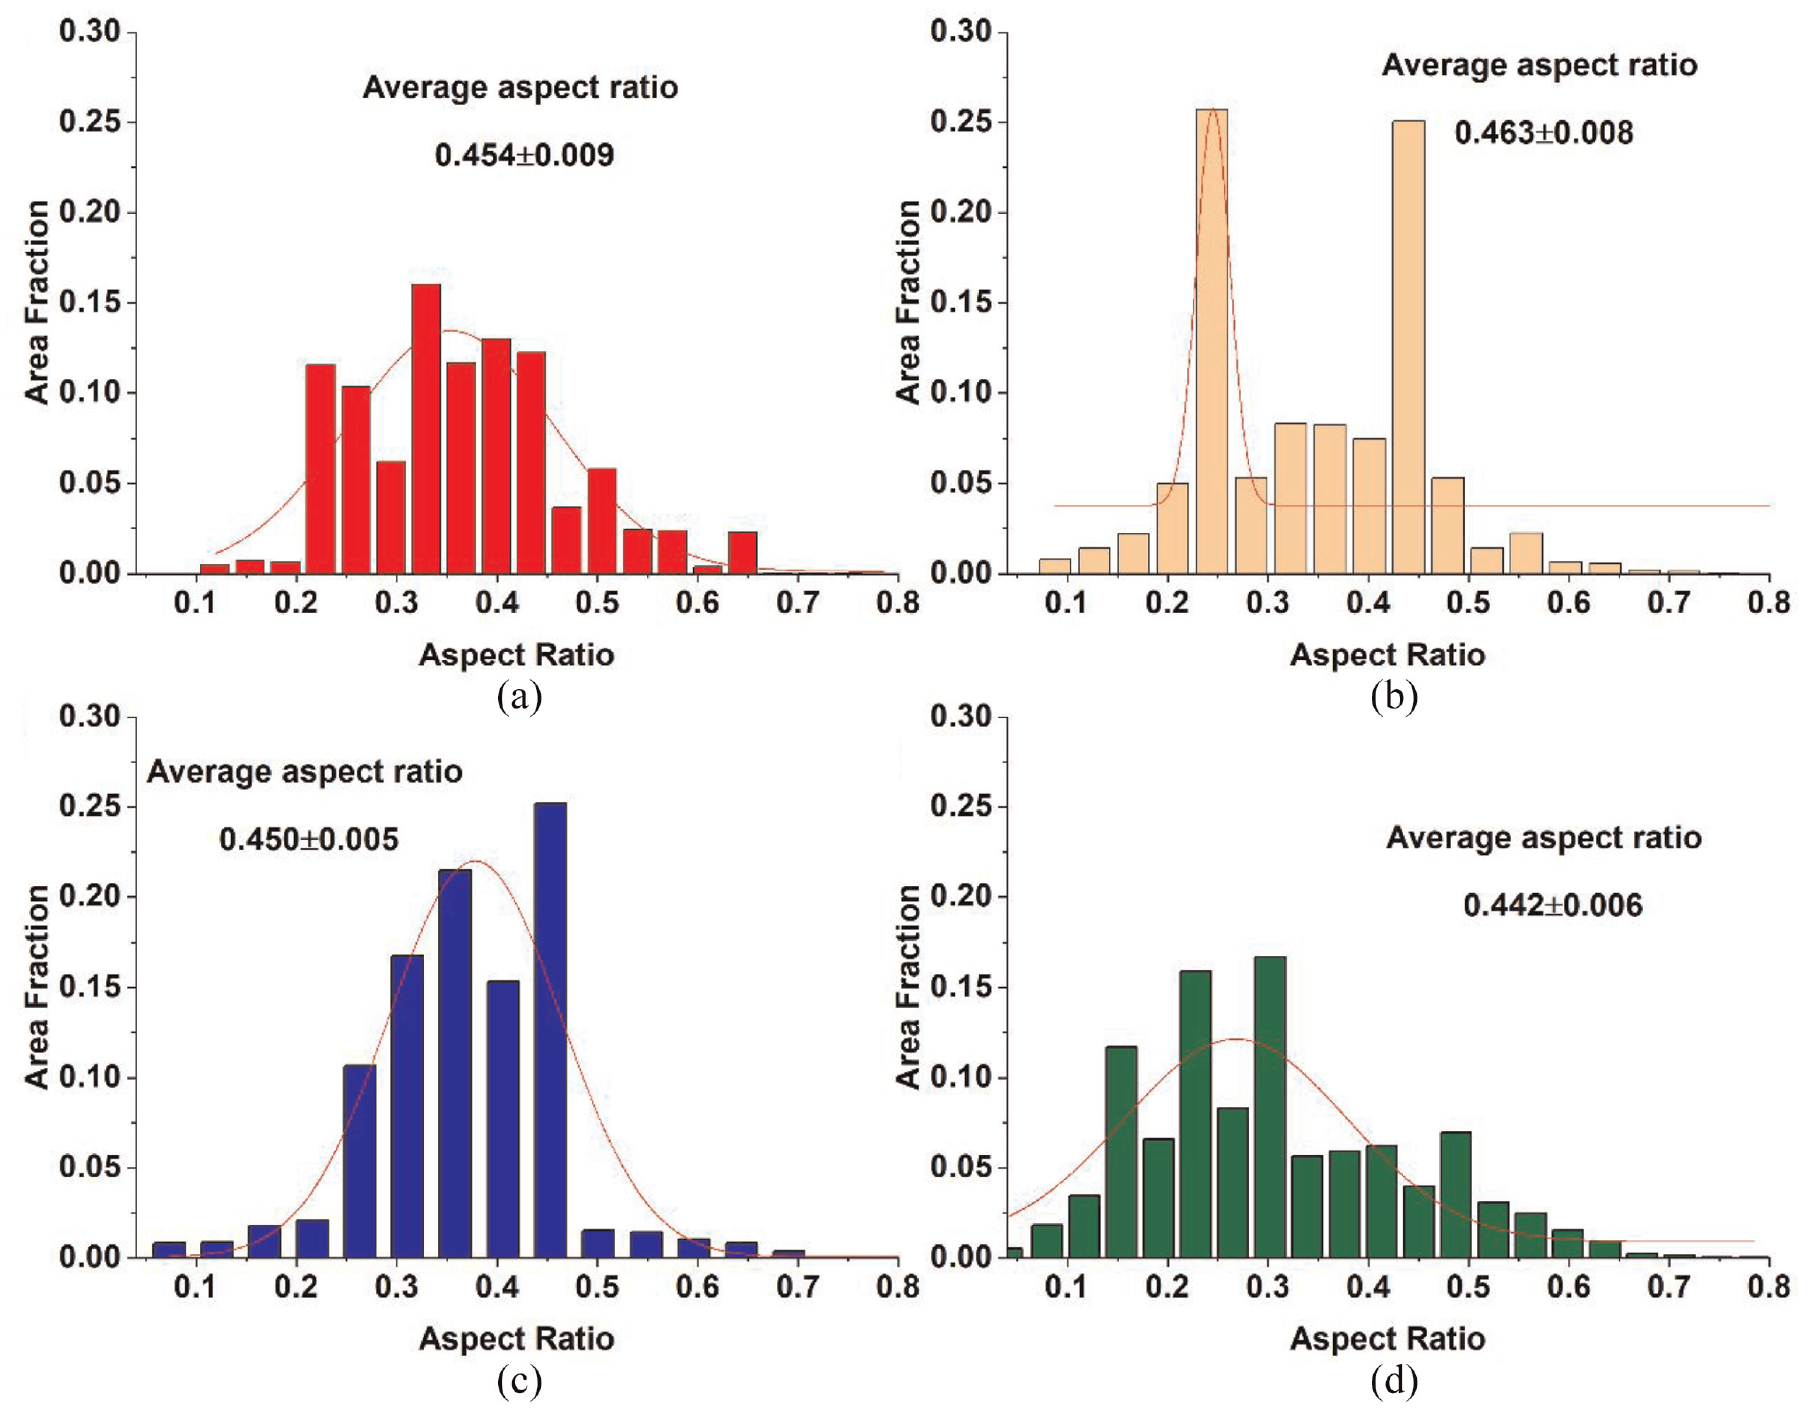
Grain aspect ratio of: (a) S1, (b) S2, (c) S3, and (d) S4 specimens, respectively.
The low angle grain boundary (LAGB) or sub-grain boundaries are formed when there is a deformation employed to the matrix or there is a stress-induced transformation in the phases present in the investigated specimen. The sub-grain boundaries varying between 2° and 15° are referred to as LAGB. Figure 9 shows the misorientation angle distribution including both LAGB (2°−15°) and HAGB (15°–62.5°). 32 The LAGB value is higher in load-induced vibratory samples as compared to the welded sample. It is observed from Figure 9(b) that the LAGB of sample S2 has a higher number fraction of 0.36 at an angle of 0°–5°. Interestingly, the trend shows the LAGB decreases with subsequent loading conditions. This is attributed to the formation of a large number of sub-size grains in the vicinity of the ferrite phase.
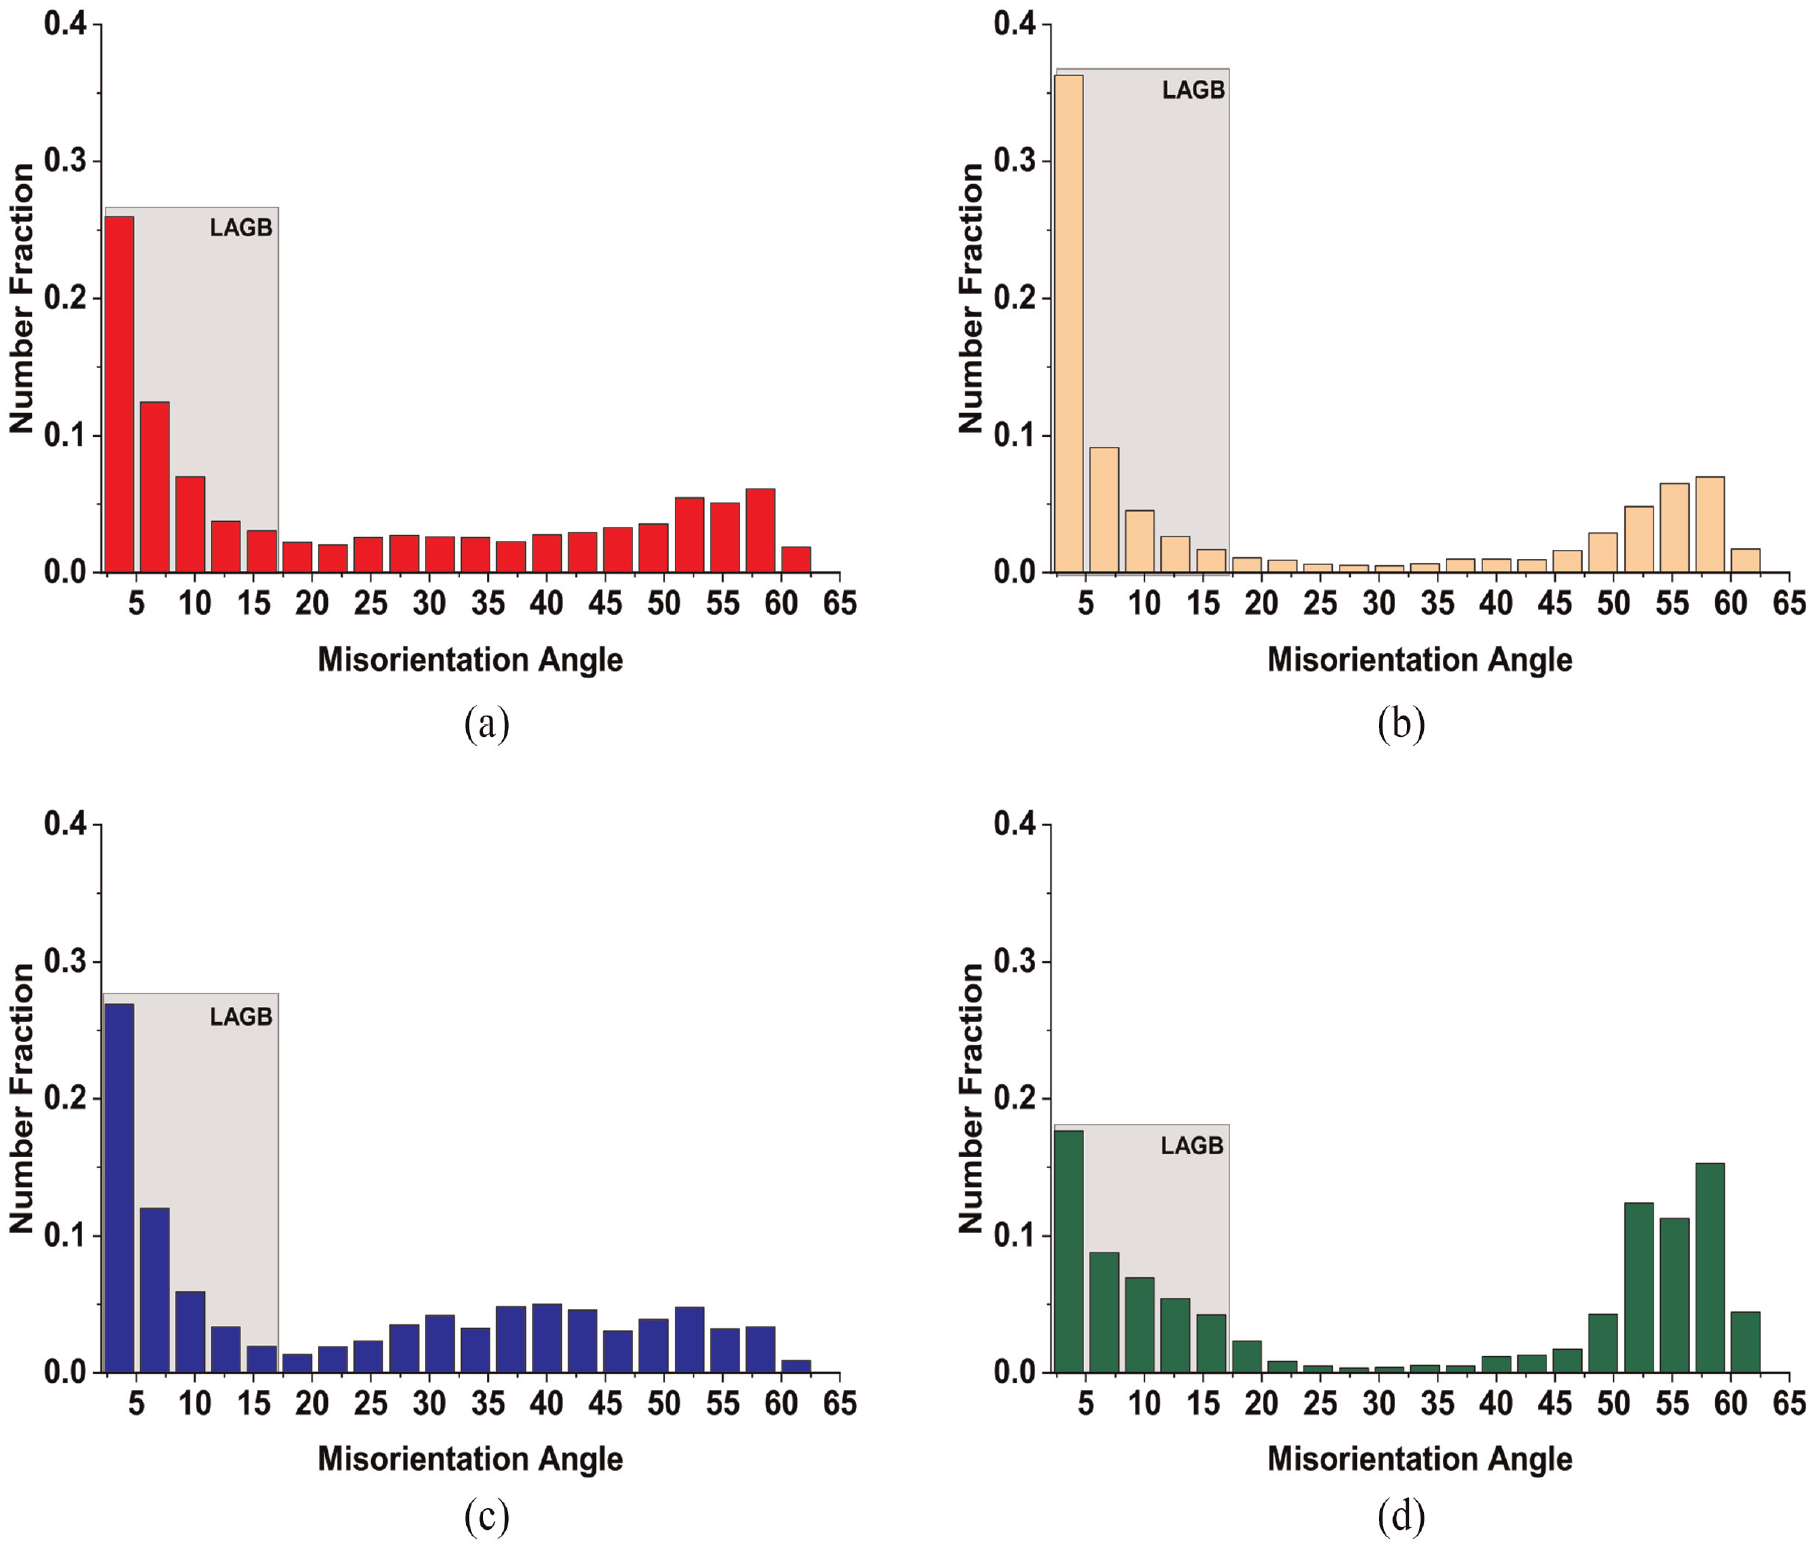
Grain misorientation distribution maps of: (a) S1, (b) S2, (c) S3, and (d) S4 specimens, respectively.
Figure 10(a)–(d) represent the grain-oriented spread (GOS) distribution of S1, S2, S3, and S4 respectively. GOS map is employed to differentiate between the recrystallized grains (0°–1°) and the deformed grains (1°−5°). The results summarize that there is a decrease in the average GOS value from 0.72 to 0.45 as the vibratory load increases from 100 to 400 N, which results in the formation of more strain-free potential sites. This is attributed to the reduction in the residual stress accumulated during welding subjected to a higher vibrational load.
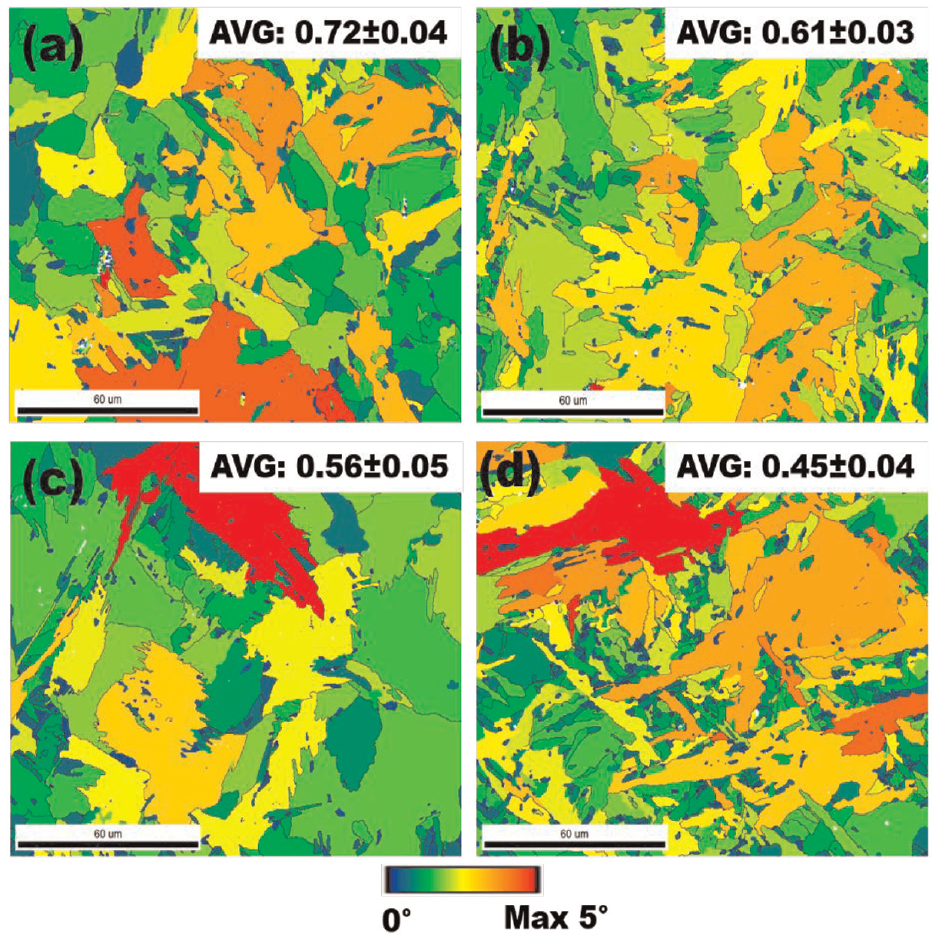
GOS map of: (a) S1, (b) S2, (c) S3, and (d) S4 specimens, respectively.
Texture study
The orientation distribution function (ODF) is a useful way to characterize the texture components present in the specimen. The ODFs (at φ2 = 0°, 45°, and 65° sections following Bunge notation) of S1, S2, S3, and S4 specimens are shown in Figure 11(a)–(l), respectively. As the vibratory load increases, the maximum intensity of the texture components increases from ∼6.4 × R (R stands for any random orientation) in S1 to ∼8.5 × R in S4. More strain-free potential sites get activated at a higher vibratory load, and thus more chance of stress relaxation is created. Accordingly, grains with more independent orientations are produced in specimen S4. Grains with random orientation are developed at the expense of detrimental rotated Goss component (S1specimen, φ1 = 90°,φ = 90°, φ2 = 45°) as the vibratory load increases from 100 to 400 N.
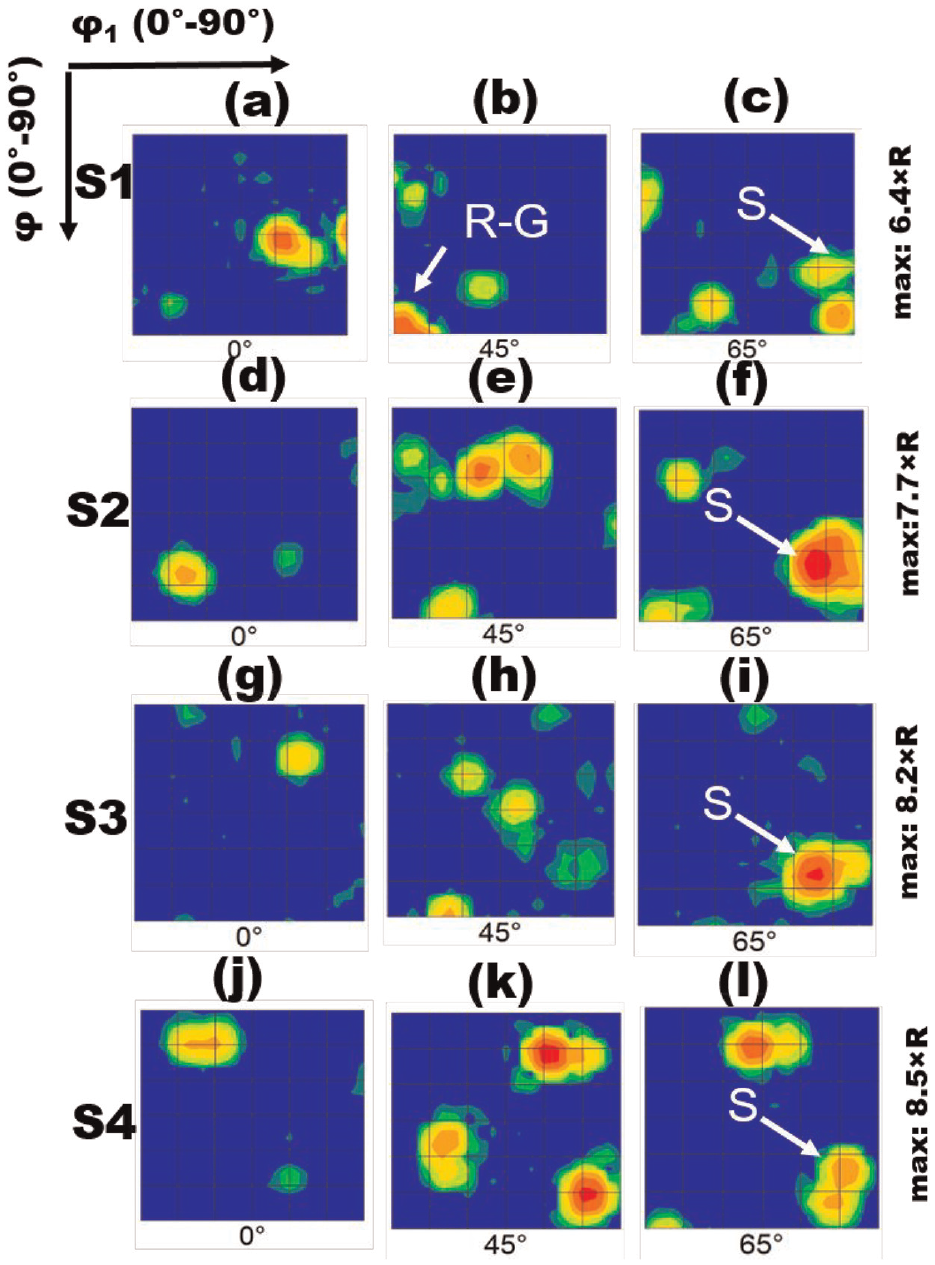
φ2 = 0° (a, d, g, and j), 45° (b, e, h, and k), and 65°(c, f, i, and l) sections of the orientation distribution function (ODF) of BCC-ferrite in (a–c) S1, (d–f) S2, (g–i) S3, and (j–l) S4, with important texture components shown within the figure. (b) Rotated Goss component {110} <110>, (c, f, i, and l) S, S-component {123} <634>.
Conclusions
In the present work, the detailed XRD, microstructural, and texture analyses of a Gas metal arc welded filet joint on a low carbon IS 2061 E250BR steel plate subjected to vibrational stress relief are systematically investigated. Based on the results, the following conclusions can be deduced:
The vibratory treatment during cooling makes a significant impact on the residual stress reduction.
The XRD measurements show a reduction of 22% in compressive residual stress.
The load induced by vibration reduces the average GOS value by ∼38% and increases strain-free potential sites.
VSR has a significant influence on the grain boundary as the LAGB value increases when the vibration is imposed and misorientation distribution increases at higher vibratory load.
The texture study reveals that the VSR treatment eliminates the detrimental rotated GOSS component.
As a future work, an extensive microstructural characterization on weld-specimen subjected to various welding parameters is required. Then an empirical relation between welding parameters and microstructural changes is to be developed.
Footnotes
Acknowledgements
Experiments presented in the paper have been carried out in Marine Structural Workshop and Micro Structural Laboratory of Indian Institute of Technology; their support is gratefully acknowledged.
Declaration of conflicting interests
The author(s) declared no potential conflicts of interest with respect to the research, authorship, and/or publication of this article.
Funding
The author(s) received no financial support for the research, authorship, and/or publication of this article.