
Abstract
The surface quality of the polishing tool is of great importance to the polishing performance, and it is usually maintained by a dressing process. The dressing parameters, which ultimately influence the effectiveness of dressing, are difficult to determine because the dressing process involves complex multiaxis motion control. To improve the machining efficiency and quality of the polishing tool, this study investigated the optimization of the process parameters. First, the grain on the grinding wheel was regarded as the research object. The trajectory model of the grain was established using multi-body theory. Subsequently, based on the above model, an optimization method was developed to optimize the process parameters. The experimental results showed that the average initial contour error of the surface of the polishing tools was 267.46 µm. When polishing tools were dressed using the worst process parameters, the surface quality was improved by an average of 67.82% to 86.06 µm. When polishing tools were dressed using the best process parameters, the surface quality of the polishing tools improved by 86.57% to 35.92 µm on average. This paper demonstrated the accuracy of the model and effectiveness of the proposed optimization method.
Introduction
Bonnet polishing has been widely utilized in precision machining because of its efficiency and controllability.1–3 Recent studies have reported that because bonnet polishing is a mechanical removal method, the polishing tool wears gradually during the process, 4 eventually affecting the machining efficiency and quality.
Generally, the removal characteristics of the worn tool can be improved by dressing. Results from previous studies5,6 show that the material removal efficiency, stability of polishing force, and profile of the polished spots of a worn bonnet tool improves after a proper dressing. The effect of the dressing process on the tool-removal characteristics is mainly determined by the suitability of the adopted process parameters. Therefore, studies on the optimization of process parameters have been widely conducted.
Lefebvre et al. 7 carried out experiments on grinding wheels dressing using different process parameters. The dressing efficiency, grain density, and their effects on the roughness and wear of the wheel during the grinding process were investigated for different truing and dressing conditions. The optimal dressing process parameters were determined based on the dressing efficiency and the surface profile of the tool after dressing.
Chowdhury et al. 8 focused on the feed speed of dresser, depth of cut, velocity ratio between the grinding wheel and rotary dresser, and the number of passes and dressing methods (up-cut or down-cut) in a rotary diamond dressing. The objective was to investigate the effect of these process parameters with their interactions for two response parameters: dressing ratio and overlapped dressed area. With regard to the response parameters, the goal was to simultaneously maximize the dressing ratio and minimize the overlapped dressed area. The significant process parameters and optimal parameter settings were determined by analyzing variance and using a multi-criteria optimization approach.
Holesocsky et al. 9 carried out wheel-dressing experiments with different process parameters. By analyzing of variance, the correspondence of different process parameters as a function of tool surface finishing quality was determined.
With the development of machine learning algorithms, process parameters optimization is also increasingly being applied based on experiments.10–12 However, this experimental method is poor adaptability and requires extensive experimental data to determine the optimal process parameters for different dressing systems. Therefore, this study proposes a grain trajectory modeling method to achieve process parameter optimization.
Feng 13 conducted a dressing study of CMP (Chemical Mechanical Polishing) polishing pads. A trajectory model of the grain motion was established based on the motion relationship of the dressing system. The trajectories of the grains were simulated for different process parameters. The trajectory distribution of the different grains on the dresser was studied, and the effects of different sizes and grain distributions of the grinding wheel on dressing trajectories were investigated.
Chen and Pham 14 conducted a dressing study of a CMP polishing pad. A trajectory model of the grain motion was established based on the motion relationship of the dressing system. The relative motion velocities of the grain and polishing pad were determined. Subsequently, the non-uniformity of pad surface topography after dressing was predicted.
Wang et al. 15 established a model of the grain motion trajectory in the dressing process of an offline bonnet polishing tool. After changing the process parameters, the grain movement trajectory distribution and its distribution law was defined through simulation analysis. The experimental results showed that the surface roughness of the bonnet was improved from 73.6 to 40.4 µm.
Pan et al. 16 established a model of the dressing process of an in-situ bonnet polishing tool based on the theory of multi-body kinematics, analyzed the relationship between the speed of the polishing tool and the grinding wheel during dressing, and determined that when the speed of the grinding wheel is faster than that of the polishing tool, the velocity of abrasive grains tends to be consistent. The material on the surface of the polishing tool was uniformly removed, as verified by the experimental results.
The grain trajectory modeling method can avoid process experiments by modeling and simulation. The obtained dressing results were also satisfactory. Models of the grain trajectory were established according to the motion relationship of the dressing system. The relative velocity of the grain under different process parameters was analyzed, but there was no way to determine the specific process parameter settings. The distribution of the grain trajectory was also evaluated intuitively in terms of its uniformity without explicit numerical reflection.
Based on the above analysis of previous studies, to optimize the dressing process for bonnet polishing tool, it is necessary to first establish and verify the trajectory model of grains, and then optimize the process parameters to improve the distribution of grains and thus improve the dressing quality. The structure of the study is shown in Figure 1.
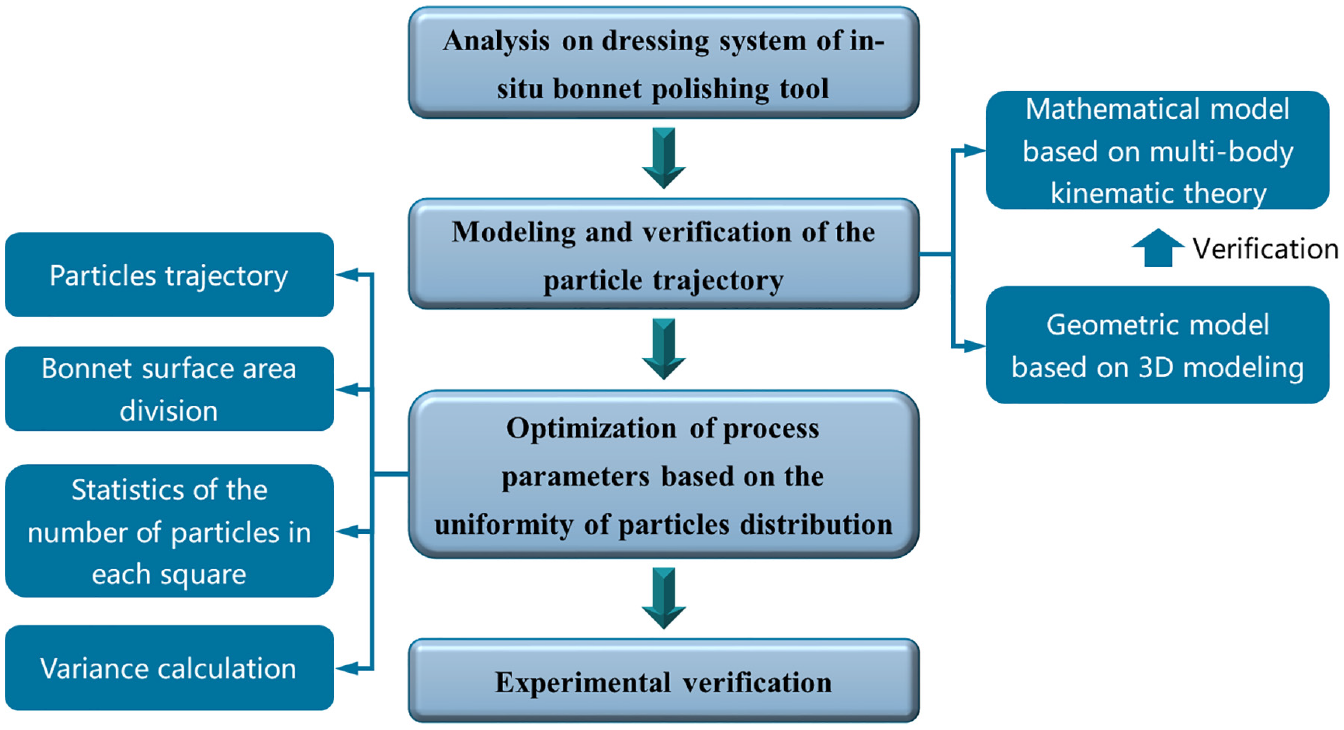
The research framework.
In Section “Analysis of the dressing process of bonnet polishing tool,” by clarifying structure of the dressing system, the grain on the grinding wheel is selected as the research object.
In Section “Modeling of grains motion trajectory and model validation,” based on multi-body kinematic theory, the motion model of the grain trajectory is established. The accuracy of the above model is verified by motion simulation of the geometric model.
In Section “Optimization of process parameters,” an optimization method that evaluates the uniformity of grains distribution is proposed to optimize the process parameters. Finally, the feasibility of the optimization method is verified through experiments, followed by discussion and conclusions.
Analysis of the dressing process of bonnet polishing tool
A schematic diagram of the bonnet polishing tool dressing system is shown in Figure 2. The dressing motion involves the rotation of the A-, B-, and G-axes.
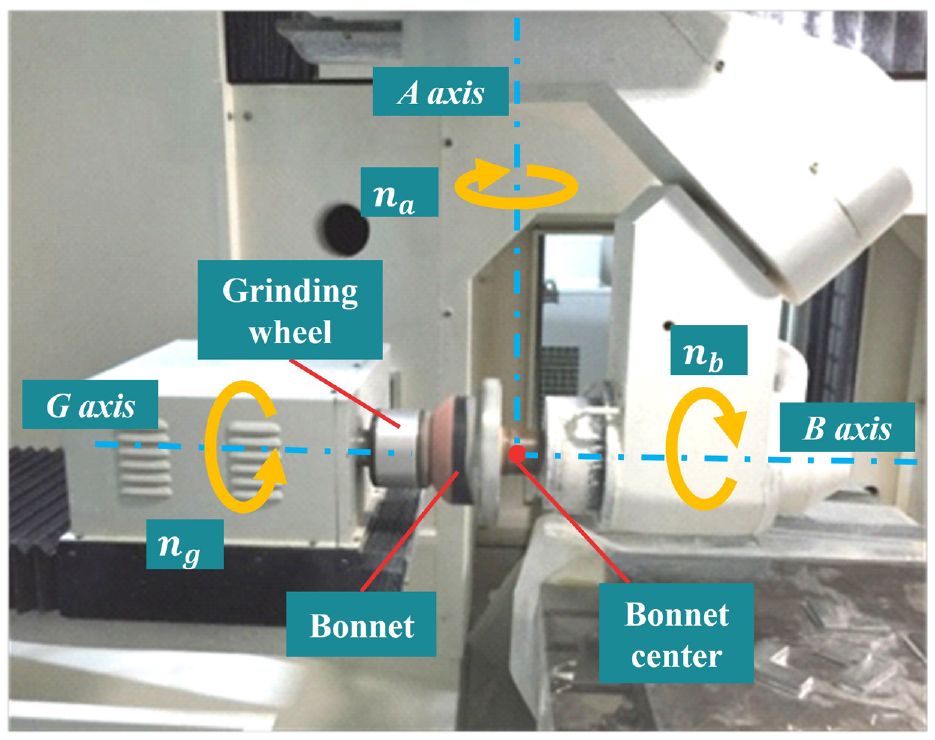
A schematic diagram of bonnet polishing tool dressing system.
A simplified schematic of the dressing system is shown in Figure 3. Each parameter in the figure is represented as follows:
In addition, the parameters in Figure 3 are presented as follows: the distance between the rotating center of the grinding wheel and bonnet center
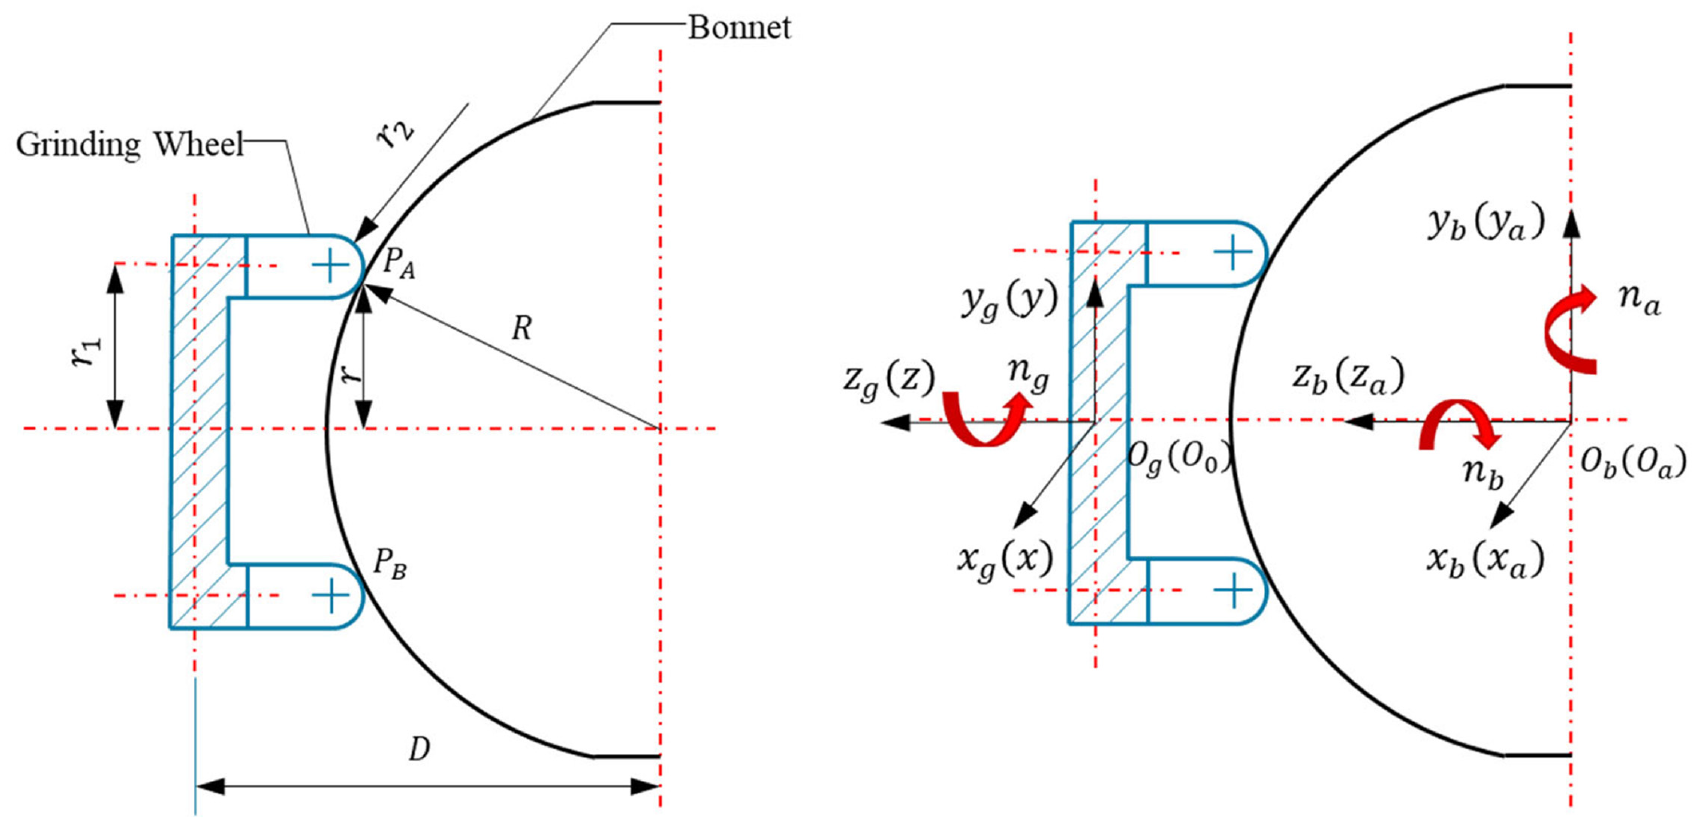
Schematic diagram of bonnet polishing tool dressing system.
As shown in Figure 3 and the above analysis, the dressing motion of a bonnet polishing tool is complex and involves several parameters. When the structural parameters of the system are fixed, the different process parameters result different grain trajectories, which have a significant influence on the final dressing effect. Therefore, it is necessary to establish a trajectory model of the grains and optimize the process parameters to improve the grain trajectory and the dressing quality.
Modeling of grains motion trajectory and model validation
Modeling of grains movement trajectory
According to Figure 3 and the multi-body kinematic theory, the topological structure diagram of the dressing system can be obtained, as shown in Figure 4.
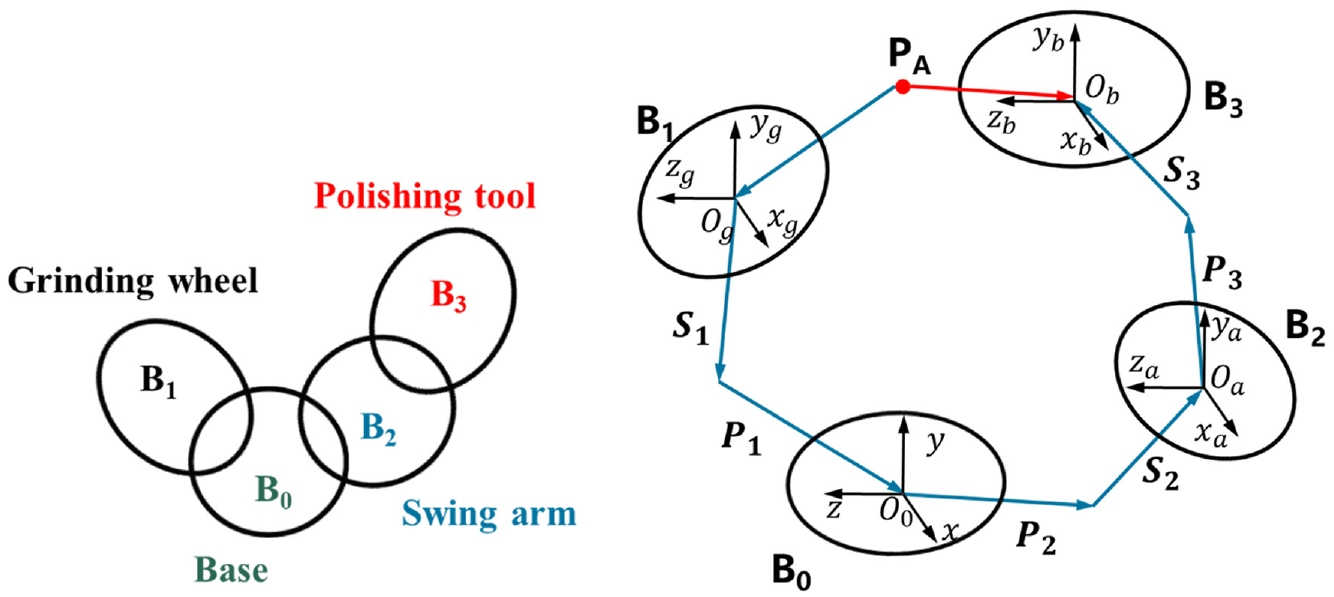
Topological diagram of structure of dressing system.
To establish the trajectory of the grain, it is necessary to obtain the coordinate values of
Based on the geometric relationships shown in Figure 3, the coordinate values of
The grinding wheel rotates around
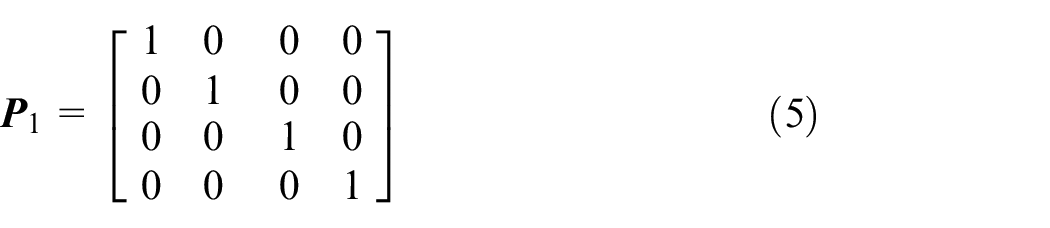
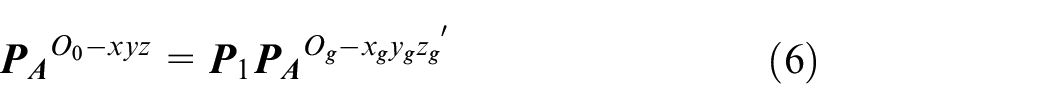
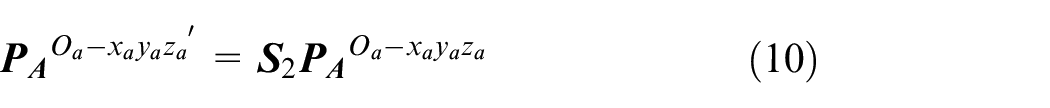
Subsequently, according to the base coordinate system and bonnet deflection coordinate system position matrix
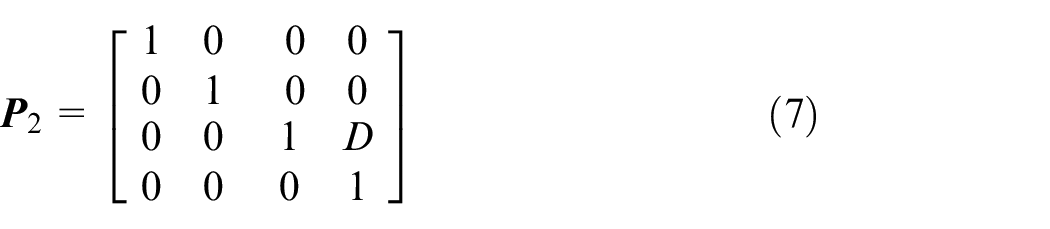
Finally, based on the bonnet deflection coordinate system and bonnet coordinate system position matrix
A trajectory model of the abrasive grains on the grinding wheel during dressing can be established. The specific modeling process is as follows:
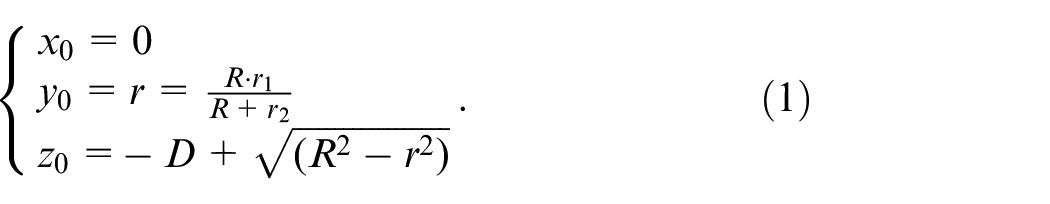
According to the schematic diagram of the dressing system in Figure 3, the coordinate values of a random grain
According to the geometric relationship, the coordinate values of
After the grinding wheel has rotated around
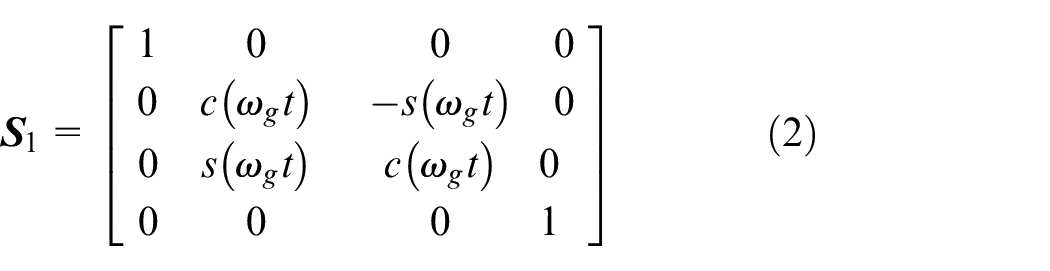
Here,
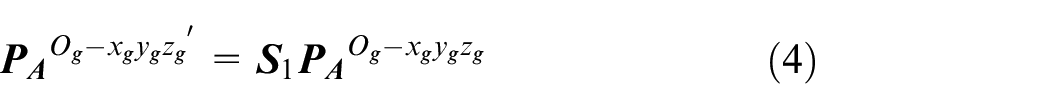
The coordinate values of
The coordinate values of

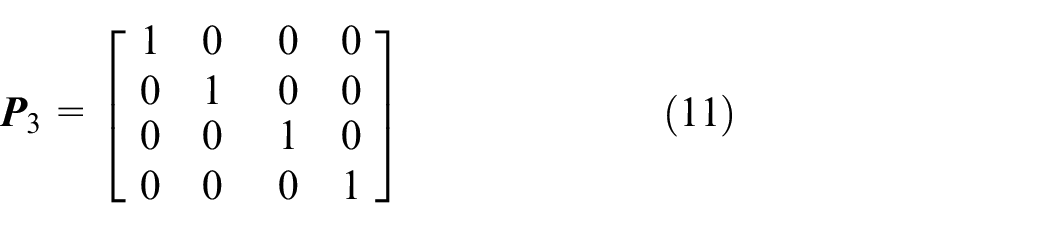
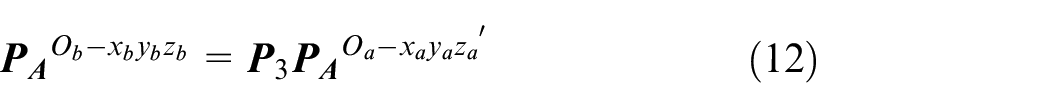
After the polishing tool deflects around
where
The coordinate values of
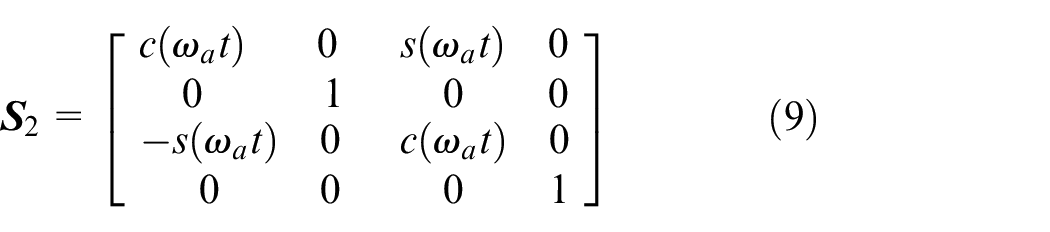
When the polishing tool rotates around
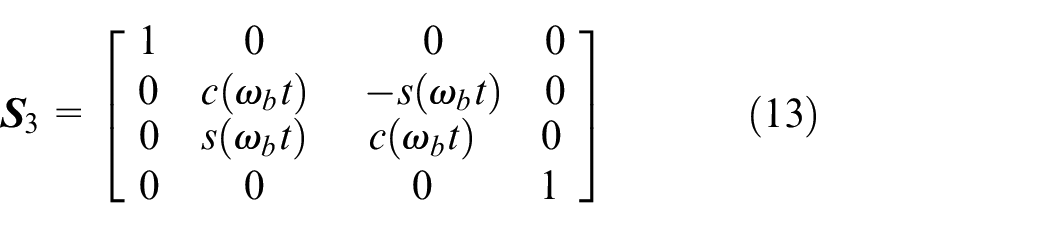
where
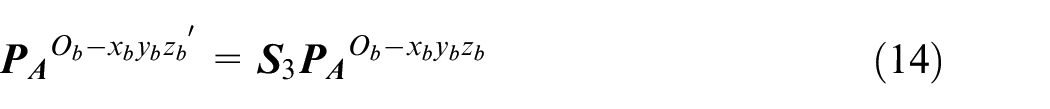
Based on the above derivation, the coordinate values of
With the change in time, a series of grain trajectory data points can be obtained according to equation (15). Thus, the grain motion trajectory model has been derived.
To verify the correctness of the mathematical model of the grain trajectory, a simulation validation was performed.
Validation of model of grains motion trajectory
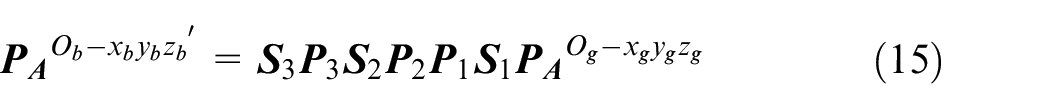
First, a geometric modeling of the dressing system was established using CAD design software Solidworks. As shown in Figure 5(b), motors 1, 2, and 3 control the grinding wheel rotation, bonnet rotation, and bonnet deflection, respectively. Their rotational speeds are
Geometric model: (a) assembly, (b) motion simulation setting, and (c) the simulation result.
The principle of validation is as follows: the simulation results of the grain motion trajectory were obtained based on the mathematical and geometric models of the dressing system, and the correctness of the mathematical model was verified by comparing the simulation results of the two models.
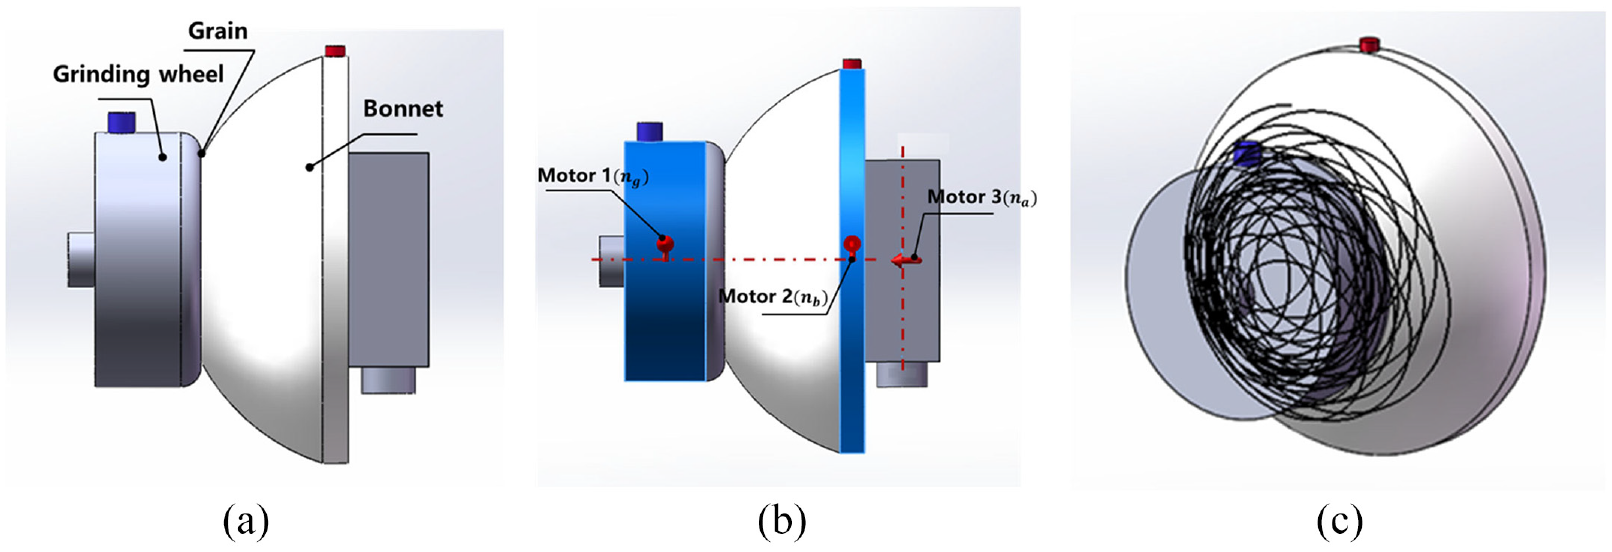
Three sets of simulation parameters were set randomly, as shown in Table 1.
Simulation parameters.
The grain trajectory was simulated according to the three sets of parameters listed in Table 1. The results obtained from the mathematical and geometric models are shown in Figure 6.
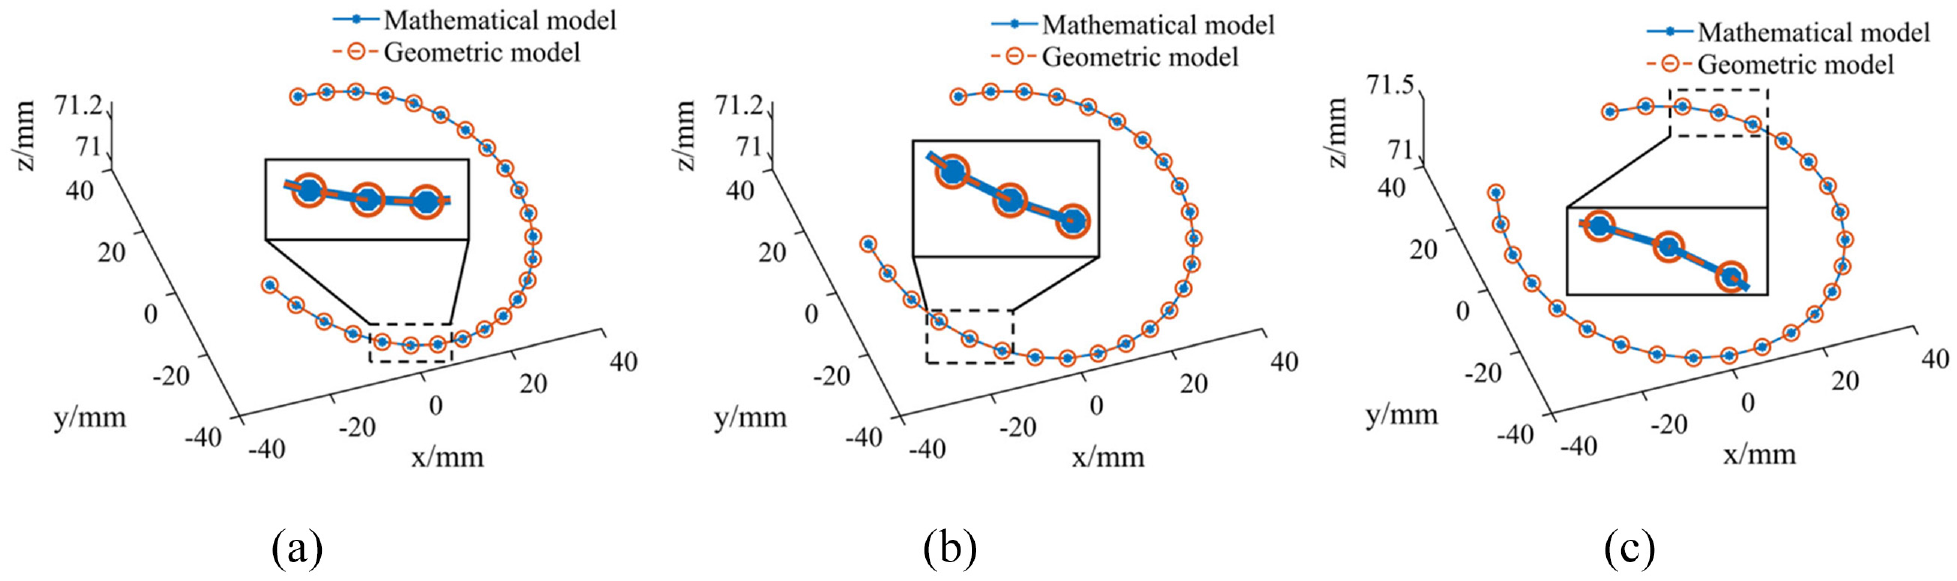
Comparison of simulation results between mathematical model and geometric model: (a)
The simulation results in Figure 6 show that the data points on the grain trajectory calculated using the mathematical and geometric models are consistent, which verifies the accuracy of the mathematical model of the dressing system established above.
After validation of the above mathematical model, optimization of the process parameters based on the mathematical model can be performed.
First, a dressing trajectory simulation and comparison were performed using different process parameters. Then, the process parameters were optimized based on the results of the grain distribution.
Optimization of process parameters
Simulation results of grains trajectory
In a previous study by Pan et al.,
16
we analyzed the relationship between
To obtain the optimized process parameters, the trajectories of the grain movement were first simulated for different process parameters, as shown in Table 2. The simulation results are shown in Figure 7.
Simulation parameters setting.
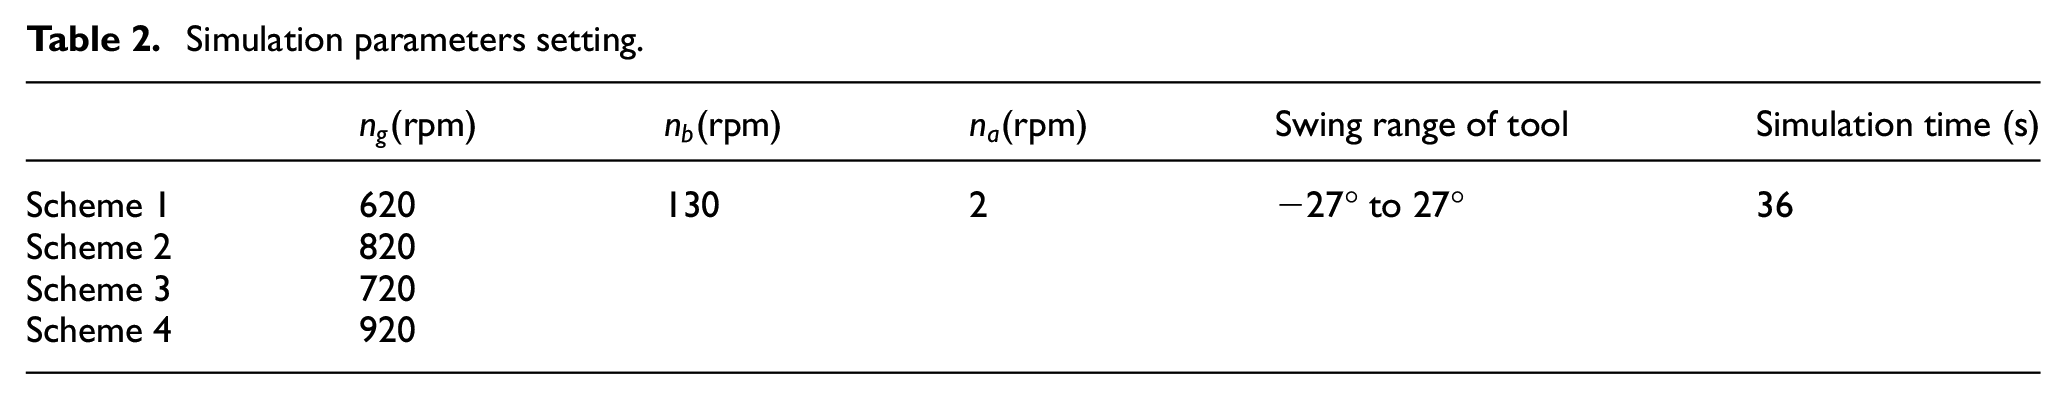
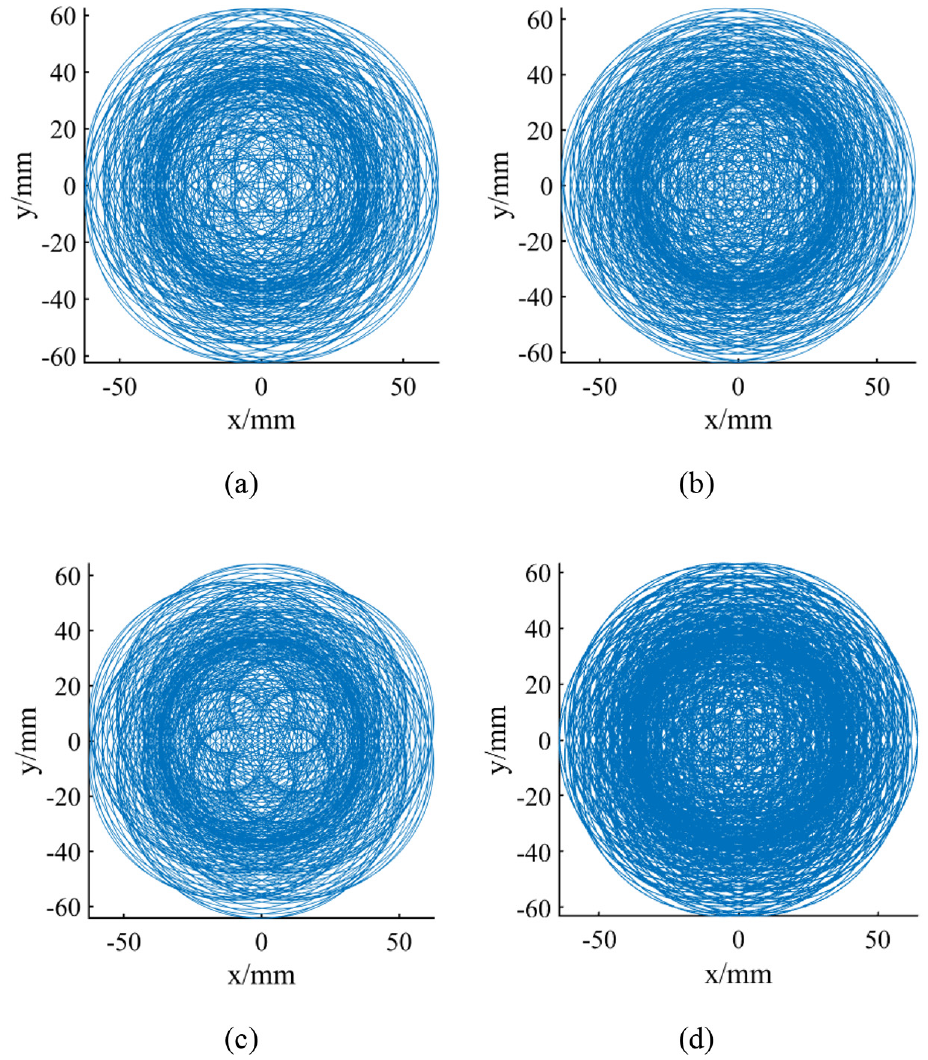
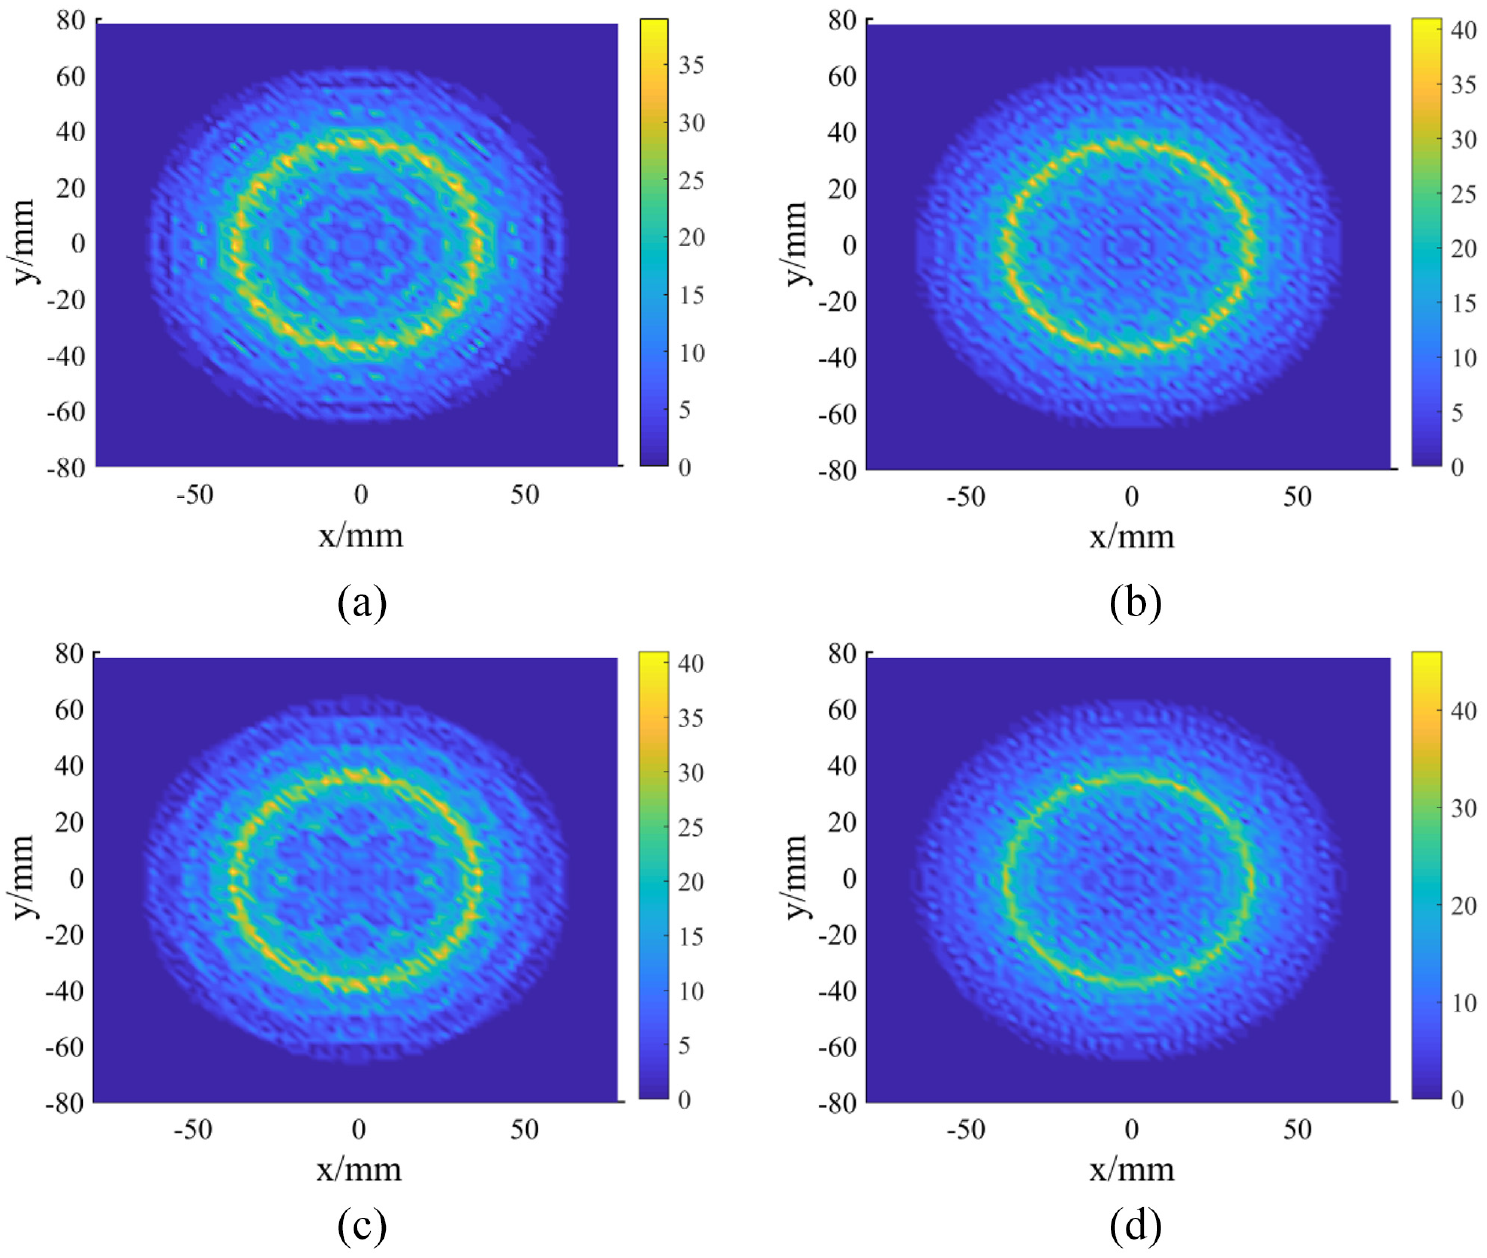
Simulation results of abrasive grain trajectory: (a) scheme 1, (b) scheme 2, (c) scheme 3, and (d) scheme 4.
By analyzing the simulation results, the uniformity in the distribution of the grain trajectory is difficult to distinguish. Therefore, an evaluation criterion for the uniformity of the grain distribution is proposed.
Optimization of process parameters
The evaluation principle is shown in Figure 8. The surface of the polishing tool was projected onto the XY plane, with the projection surface being circular. Subsequently, the projection surface is divided into many squares. The number of data points in the grain movement trajectory falling into each square is counted. If the divided area has m rows and n columns, each small square area contains
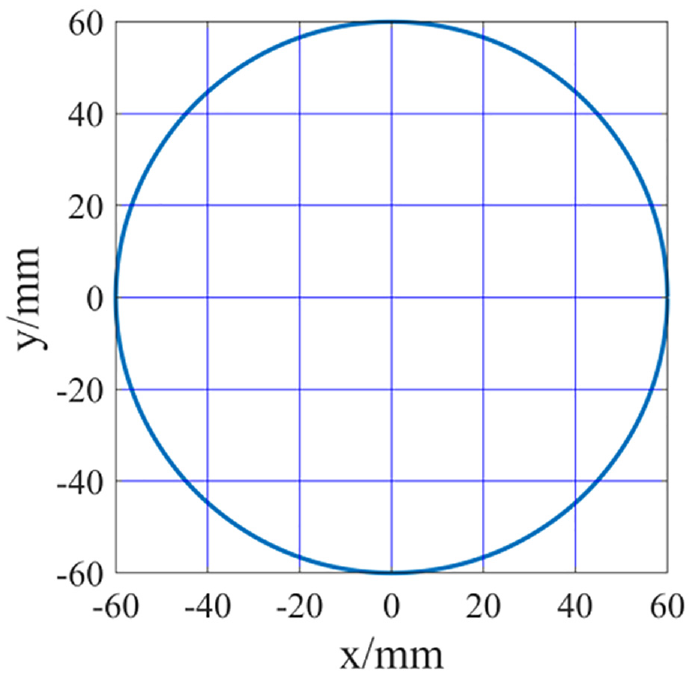
Schematic diagram of regional division.
The grid size represents different areas of the bonnet surface. Because discrete data are obtained from the simulation, there is a spacing between adjacent data points. To objectively evaluate the distribution of grains, the grid size cannot be too small or too large. On balance, 1.5 to 2.5 mm was more reasonable. Therefore, the side length of each small square was set to 2 mm. Based on the above evaluation method for the uniformity of grain distribution, corresponding to the schemes in Table 2, the obtained results are shown in Figure 9.
Simulation results of abrasive grain distribution: (a) scheme 1, (b) scheme 2, (c) scheme 3, and (d) scheme 4.
The variance results corresponding to each group in Table 2 are summarized and compared in Figure 10.
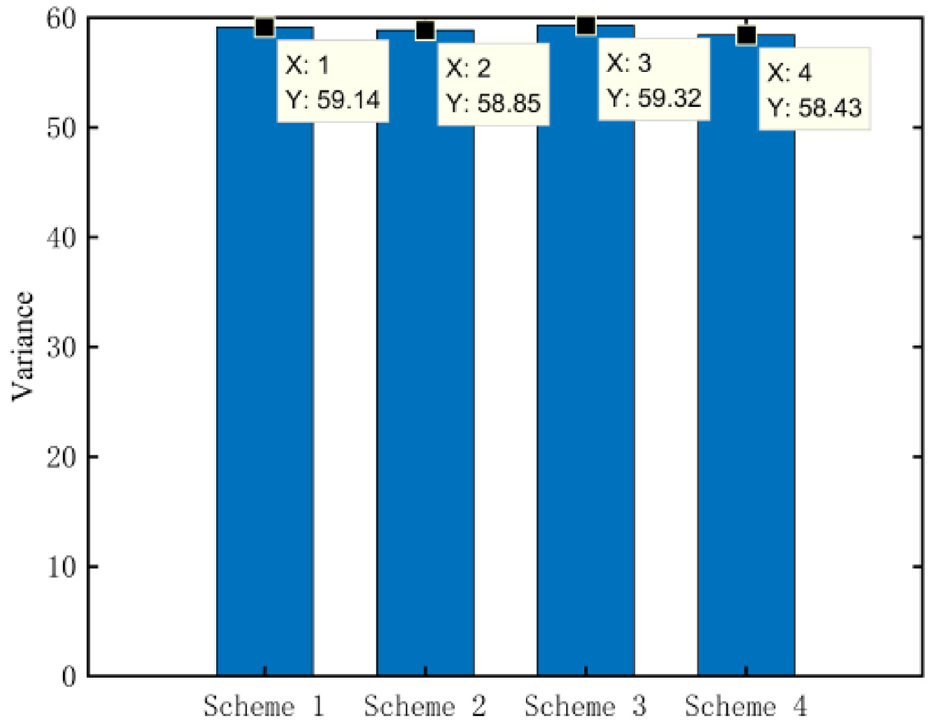
The variance results of the four schemes.
An analysis of the variance results shows that scheme 3 has the highest variance, indicating that the number of grains contained in each small square fluctuates considerably and results in an uneven distribution of grains. Among them, scheme 4 has the smallest variance. It can be predicted that scheme 4 has the best quality and scheme 3 has the worst quality after processing.
To verify the correctness of the above optimization results and evaluation method, dressing experiments were performed.
Experimental verification
Experimental details
As shown in Figure 11, the BP480, a five-axis linkage polishing machine tool was employed in this study as the bonnet polishing machine tool, and a cup-shaped grinding wheel dresser was used for dressing. The surface quality of the polishing tool was measured using a LK-H020 laser displacement sensor made in Japan.
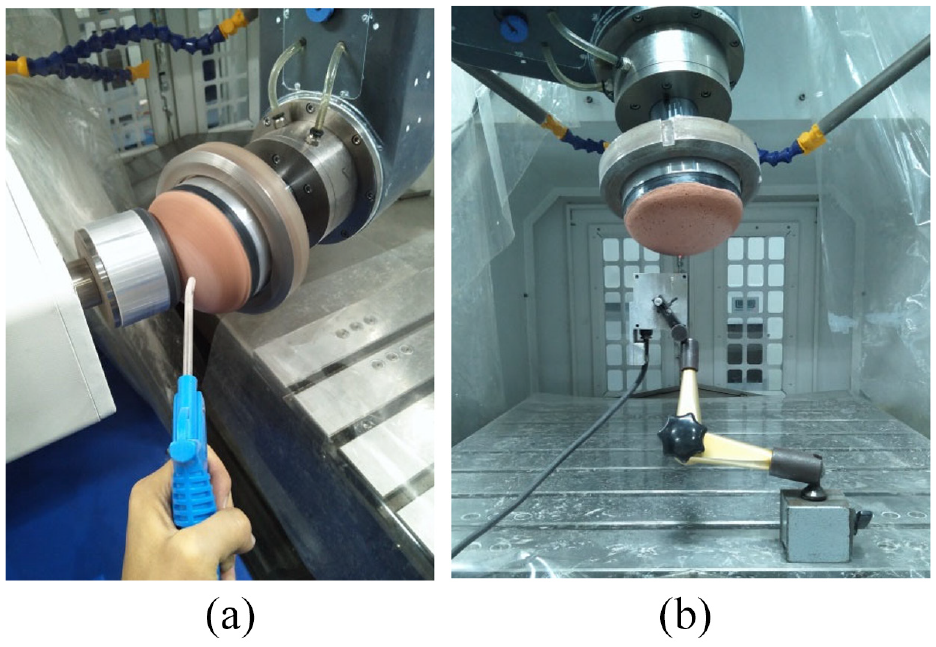
Machining and detection site: (a) bonnet dressing site and (b) detection site.
As shown in Figure 11, (a) represents the bonnet dressing site, (b) represents the detection site for the surface contour error of the bonnet polishing tool. The laser displacement sensor was fixed, the machine tool posture was adjusted to the processing posture, and the machine tool spindle rotated to detect the contour errors within one circle of the bonnet surface.
The experimental principles are as follows:
Step 1: Detection of the initial shape of the polishing tool surface.
Step 2: Pre-dressing of polishing tool.
Step 3: Dressing with the intermediate process parameters (Schemes 1 and 2 in Table 2).
Step 4: Dressing with the worst process parameters (Scheme 3 in Table 2).
Step 5: Dressing with the best process parameters (Scheme 4 in Table 2).
In this experiment, the contour error of the bonnet surface was measured before and after each step. The effect of process parameter optimization on dressing results was determined by the change in dressing quality during each step.
Corresponding to the experimental principle, the specific experimental steps are as follows:
First, the bonnet was assembled on the machine tool, and the contour error of the bonnet surface was detected.
Next, a pre-dressing experiment was carried out with the process parameters in scheme 2 to ensure that the bonnet surface contour error was below 200 µm.
According to the four schemes in Table 2, dressing experiment is carried out sequentially. During the dressing process, the bonnet was fed against the dresser. In the first nine feeds, each feed was 20 µm for rough dressing. In the last six feeds, each feed was 10 µm for fine dressing. The total feed was 240 µm. After each scheme was processed, the contour error of the bonnet surface was detected. The relevant parameters set during the detection were a spindle speed of 1200 rpm, laser displacement sensor sampling frequency of 10,000 Hz, and 5000 sampling points.
Two polishing tools were tested separately according to the above steps to verify the above analysis.
Experimental results and discussion
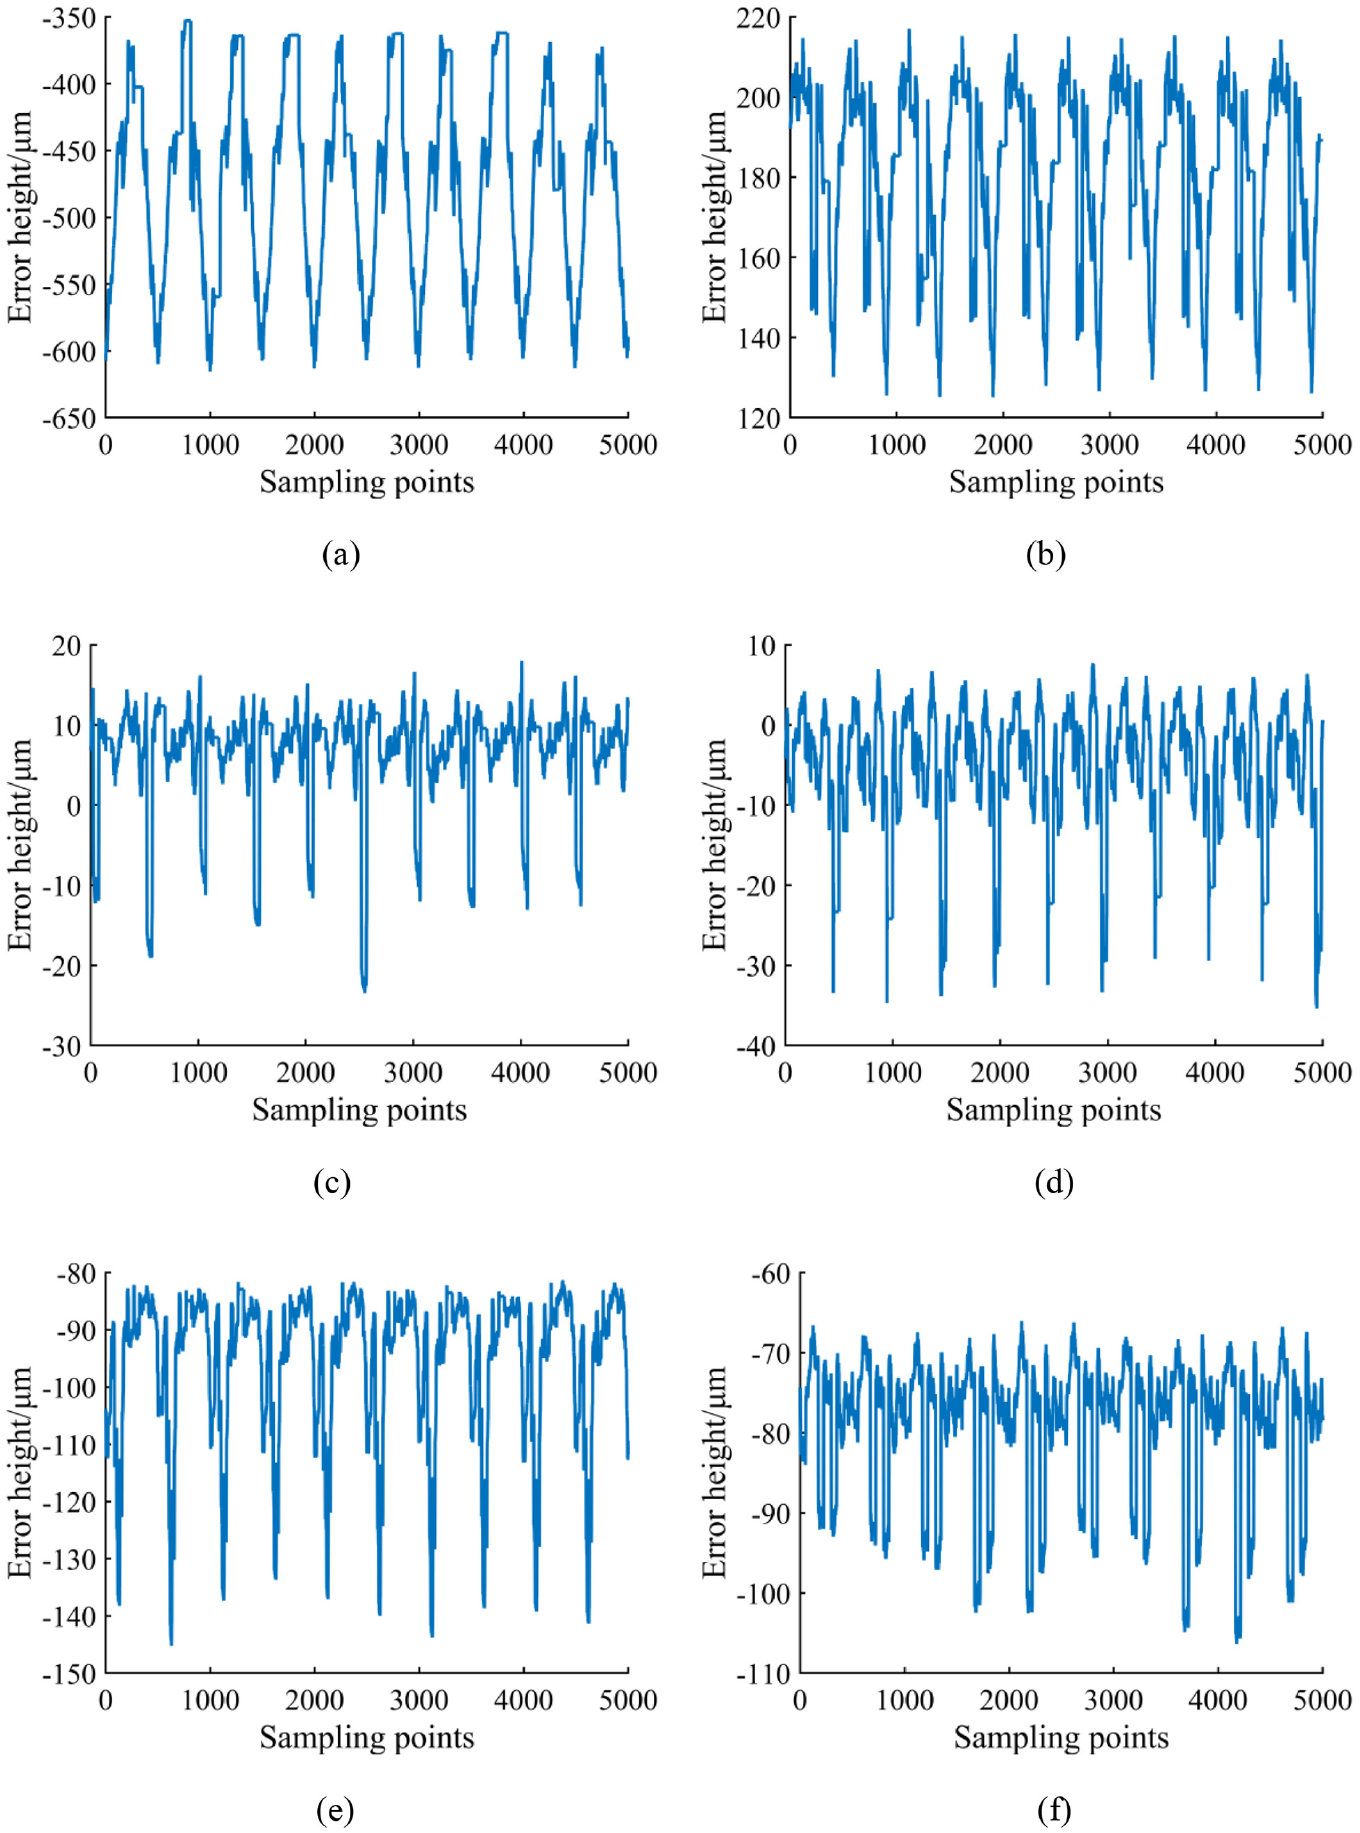
The experimental results of the first polishing tool are shown in Figure 12.
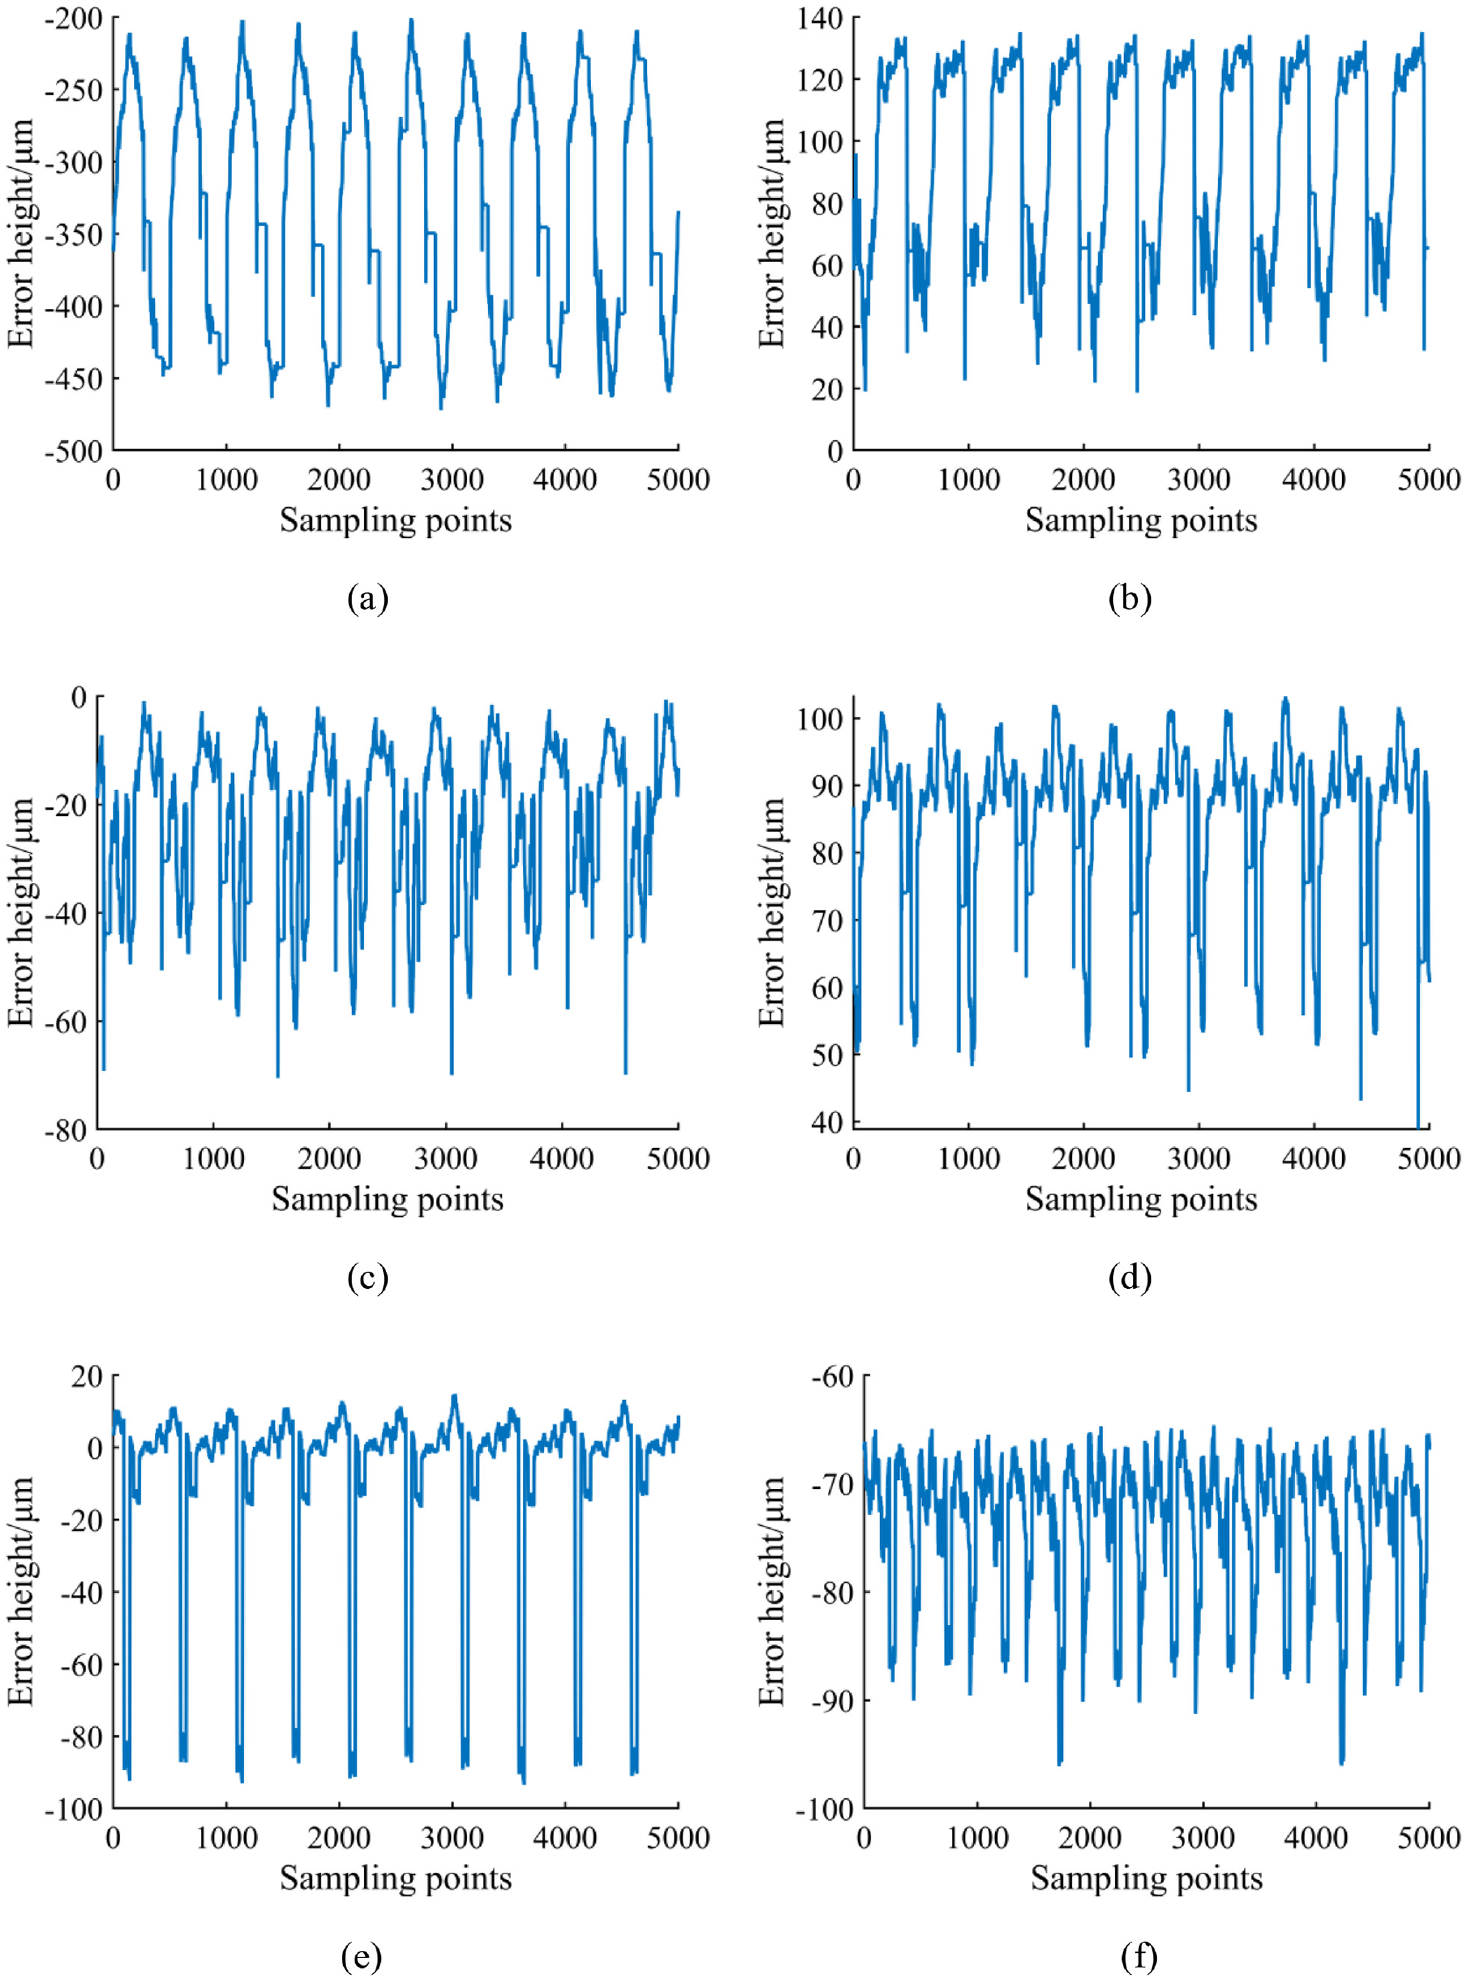
Surface contour error detection results of the first polishing tool: (a) initialization, (b) pre-dressing, (c) scheme 1,(d) scheme 2, (e) scheme 3, and (f) scheme 4.
The experimental results of the second polishing tool following the same experimental procedure are shown in Figure 13.
Surface contour error detection results of the second polishing tool: (a) initialization, (b) pre-dressing, (c) scheme 1,(d) scheme 2, (e) scheme 3, and (f) scheme 4.
The values in Figure 14 are the peak and valley values of the sub-plots in Figures 12 and 13. Figure 14 shows the numerical results of the surface contour error detection of the two polishing tools at each step during the experiment.
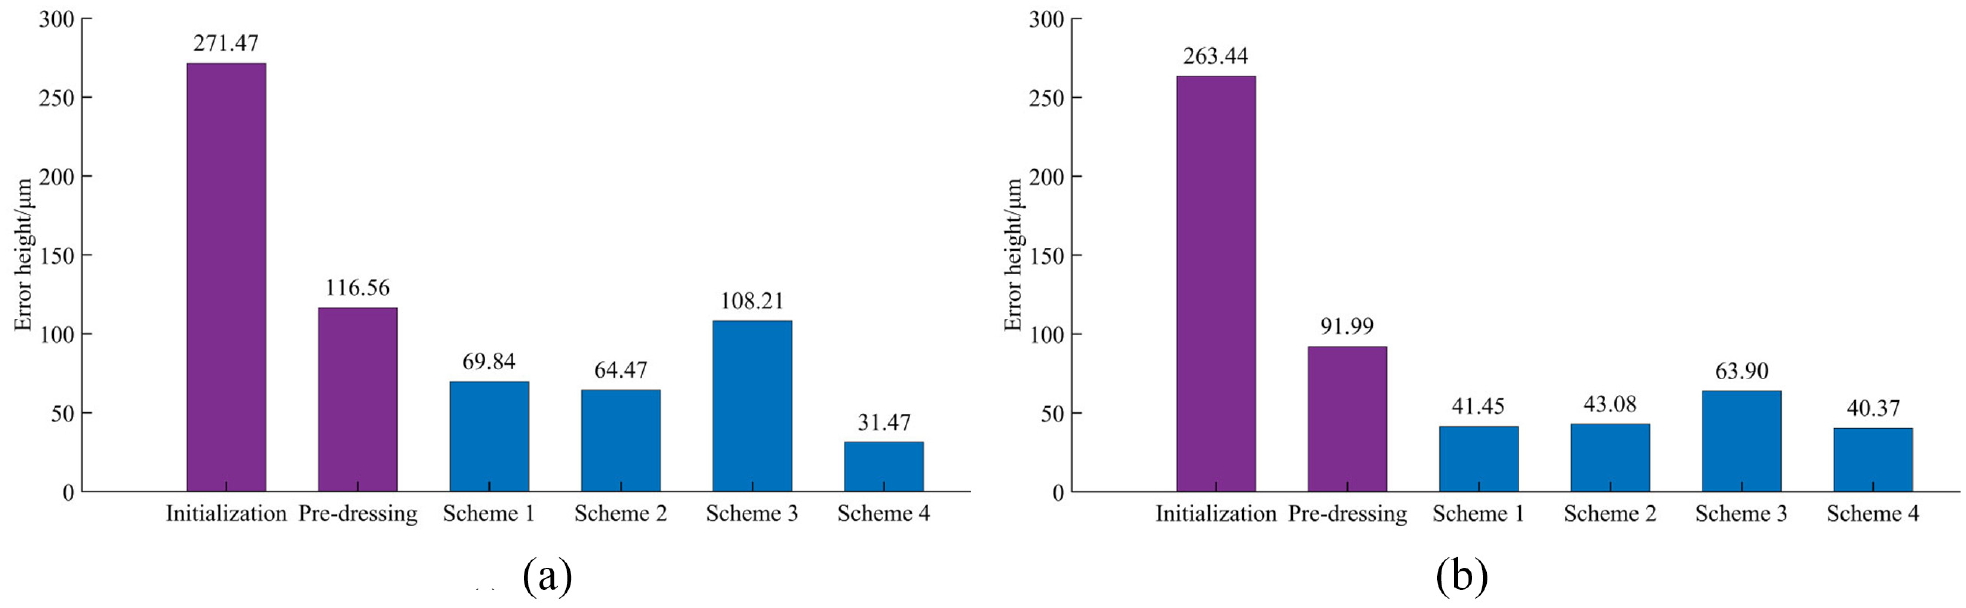
Numerical results of the contour error detection on the surface of the two polishing tools: (a) the first polishing tool and (b) the second polishing tool.
As shown in Figures 12 and 13, there are 10 cycles related to the parameter settings during detection among the results. The peaks in the figures are presumably related to the porous structure of the polishing tool surface.
From the analysis shown in Figure 14, it can be concluded that the surface quality of the polishing tool is improved after dressing with any of the process parameters in Table 2, which illustrates that the dressing is effective.
The experimental results for the first polishing tool are shown in Figure 14(a). The polishing tool was dressed using the process parameters of Schemes 1 and 2 (the intermediate process parameters) in Table 2. The surface contour error of the tool after dressing is in the region of 65 µm. The polishing tool was then dressed using the process parameters of Scheme 3 (the worst process parameters) in Table 2, which deteriorated the surface quality of the polishing tool. The surface contour error value of the polishing tool was 108.21 µm. Compared with the initial shape of the polishing tool surface (271.47 µm), the surface quality of the polishing tool was only improved by 60.14%. Finally, the polishing tool was dressed using the process parameters shown in Scheme 4 (the best process parameters), and the surface quality of the polishing tool was optimal. The surface contour error value of the polishing tool was 31.47 µm. Compared with the initial shape of the polishing tool surface, the surface quality of the polishing tool was improved by 88.4%.
The experimental results for the second polishing tool are shown in Figure 14(b). The surface quality of the polishing tool after dressing worsened using the process parameters of Scheme 3, but it improved again using the process parameters of Scheme 4. The surface contour error value of the polishing tool was 63.90 µm using the process parameters of Scheme 3. Compared with the initial shape of the polishing tool surface (263.44 µm), the improvement in the surface quality of the polishing tool was 75.74%. However, the surface contour error value of the polishing tool was 40.37 µm using the process parameters of Scheme 4. Compared with the initial shape of the polishing tool surface, the improvement in the surface quality of the polishing tool was 84.68%.
The above analysis of Figure 14 shows that the average initial contour error of the surfaces of the polishing tools was 267.46 µm. When the polishing tools were dressed using the worst process parameters (Scheme 3), the surface quality of polishing tools was improved by an average of 67.82% to 86.06 µm. When polishing tools were dressed using the best process parameters (Scheme 4), the surface quality of polishing tools improved by an average of 86.57% to 35.92 µm. For both polishing tools, different results can be obtained using the same process parameters, which may be related to the surface characteristics of the polishing tools. Nevertheless, the experimental results correspond to those predicted in Section “Optimization of process parameters.” The optimization method of the process parameters proposed in Section “Optimization of process parameters” was verified, which can effectively guide the actual production and setting of process parameters during processing.
Conclusion
To optimize the process parameters of the in-situ bonnet polishing tool dressing process, we first determined the structural parameters and movement form of the dressing system. Second, the grain on the grinding wheel was taken as the research object, and multi-body kinematic theory was used to establish the mathematical model of the movement trajectory of the grain. A geometric model of the dressing system was established using SolidWorks to verify the accuracy of the mathematical model.
The motion trajectory of the grains under different process parameters was simulated based on a mathematical model of the grain trajectory. To quantify the influence of different process parameters on the dressing quality, an evaluation method was proposed in this paper. To improve the trajectory of the grain and dressing effect, the process parameters were optimized. The simulation results showed that
The experimental results showed that dressing effectively improves the surface quality of polishing tools using any process parameter. The average initial contour errors of the surfaces of the polishing tools were 267.46 µm. When the polishing tools were dressed using the worst process parameters, the surface quality of the polishing tools improved by an average of 67.82% to 86.06 µm. When polishing tools were dressed using the best process parameters, the surface quality of the polishing tools improved by an average of 86.57% to 35.92 µm. This paper demonstrated the accuracy of the model and effectiveness of the proposed optimization method.
Footnotes
Acknowledgements
The authors would like to appreciate the invaluable expert comments and suggestions on the manuscript from all anonymous reviewers.
Declaration of conflicting interests
The author(s) declared no potential conflicts of interest with respect to the research, authorship, and/or publication of this article.
Funding
The author(s) disclosed receipt of the following financial support for the research, authorship, and/or publication of this article: This work was financially supported by the National Natural Science Foundation of China (Grant No. 52075462) and the Scientific and Technological Project of Quanzhou (Grand No.2022C004).