
Abstract
Grinding generates a lot of heat in the grinding zone area during operation. Therefore, it is important to keep the temperature under control by using various cutting fluids to get a good ground surface quality. The existence of a stiff air layer surrounding the abrasive wheel is known to waste most of the cutting fluid supply in the interface area between the abrasive wheel and workpiece. Due to the high grinding speed, stiff air layers prevent cutting fluids from entering the interface area. Hence, to enhance the grinding performance, cryogenic cooling has been introduced to improve the penetration into the stiff air layer. The current work investigates the grindability of the ground surface of AISI D2 tool steel under different environments: dry, wet, and cryogenic, regarding grinding forces (i.e. tangential and normal force), specific grinding energy, and surface characterisation. This paper also proposed a method to evaluate image-based Abbott–Firestone curve (bearing area curve) parameters to characterise the ground surface topography. Significant reductions in grinding forces (64%–67% and 44%–50% in Ft, 54%–58% and 34%–39% in Fn), low specific grinding energy (64%–67% and 44%–50%), decrease in surface roughness (46%–51% and 30%–36% in Ra, 37%–41% and 31%–35% in Rz), improved 2D and 3D roughness profiles and higher bearing area ratio (89.54%) were observed at 40 µm downfeed in cryogenic cooling environments compared to dry and wet environments, respectively. Thus, observations show the importance of cryogenic cooling across the experimental domain.
Keywords
Introduction
Recently, the use of AISI D2 cold work tool steel parts has grown virtually in modern manufacturing sectors due to their good wear resistance, high strength, non-deforming properties and enhanced hardness after the hardening process. 1 It is used to make various applications like pneumatic tools, press tools, chisels, bending and forming dies, deep drawing, cold extension dies, gauges, collets and punches, etc.2,3 As close dimensional tolerances, precise geometries and high surface quality requirements are more demanding for difficult-to-machine material. 4 The grinding technique is frequently utilised to fulfil the demanded specifications. However, the removal of material by the grinding process causes forces and temperature that affect the surface integrity of materials, resulting in machining performance. Due to the elevated temperature, the grinding under dry environment significantly impacts the ground surface in terms of surface/subsurface alteration and damage. 5 Tawakoli and Azarhoushang 6 found more wheel wear out, increased grinding energy, lower material removal rate (related to the downfeed), and poor surface quality in reference to dry grinding. Chaudhari et al. 7 conducted some experiments under dry, wet and ultrasonic grinding. They obtained higher grinding forces, more specific grinding energy and poor surface roughness under dry condition due to the generation of high temperature at the abrasive wheel-workpiece interface. For better machining performance, the cutting fluids are applied at the interface area to absorb the maximum heat energy, and the rest heat is transferred to the workpiece and abrasive wheel. 8 Their main functions are cooling and lubrication. As a consequence of the wide contact region between the abrasive wheel and the workpiece, coolant supply is challenging during the grinding operation, resulting in thermal damage to the workpiece surface. As a result, it is crucial to use a cutting fluid during the grinding operation. Types of coolant, supply methods, and discharge pressure are all important for heat to be dissipated.9,10 The main issues with cutting fluids (water-based or oil-based) are pollution in the atmosphere and operator’s health. 11 It happens due to the boiling of coolants during the grinding process. Under the circumstances, the development of harmless and non-polluting coolants to reduce cutting fluids is a contemporary research trend. Several sustainable methods exist to reduce the problems associated with the conventional machining process. The minimum quantity lubrication (MQL) approach is one of them, which applies a small amount of oil while using high-pressure air as the carrier. MQL with vegetable oil can significantly enhance the cutting process.12–14 Concerning operator health and environmental pollutants, the MQL approach is unsafe due to the emission of harmful gas during the cutting process. 15
Therefore, Cryogenic cooling (i.e. liquid nitrogen cryogen) is one of the most reliable alternative cooling, which creates a safe environment around the operator and a pollution-free atmosphere during operation.16,17 Due to better control of grinding temperature, liquid nitrogen (LN2), as a coolant, improved the development of defect-free surfaces, higher material removal rates and lower grinding forces in the grinding process. 18
Until now, numerous studies have been performed on the force, specific energy, temperature, surface texture, wheel wear, material removal rate (MRR), residual stress, microhardness and chip morphology related to grinding operations,19–22 only some literature are available on difficult-to-machine materials for these parameters under cryogenic grinding processes. According to Manimaran et al. 23 improvements in results were seen concerning surface defects (such as tears of materials, etc.), grinding forces, and grinding temperature over the ground surface by applying cryogenic coolant (LN2). Sharma et al. 24 reported that better surface roughness was found in cryogenic than wet and dry environments due to the presence of low temperature at the interface area between the abrasive wheel and workpiece. Paul and Chattopadhyay 25 studied the effect of grinding parameters on various steel types, that is, mild steel, hot die steel, cold die steel, high speed steel, high carbon steel. They found better outcomes regarding forces, specific energy, temperature and residual stress under cryogenic grinding as compared to dry and flood cooling. Ben Fathallah et al. 26 tested hardened AISI D2 steel during soluble oil and cryogenic cooling conditions to determine the cooling method’s impact over the ground surface in terms of surface integrity. Under cryogenic cooling, it was discovered that the MRR might be raised many times without altering the surface residual stresses. The magnitude of surface roughness, sub-surface defects and residual stress greatly decreased when cryogenic cooling was used. Sinha et al. 27 observed the grinding performance over the ground surface of Inconel 718 under various environments. Cryogenic cooling improves surface integrity, surface damage, grinding forces, minor oxidation and chip morphology after a set of experiments with various wheel speeds, table feed rate and downfeed. Abrasive wear flattening is obtained practically negligible in cryogenic grinding. Nguyen et al. 28 investigated grinding-induced surface integrity of steel 1045 using liquid nitrogen cryogen. An appropriate selection of grinding parameters was shown to attain phase changes during surface grinding, which resulted in hardening properties. They also achieved better surface integrity without surface oxidation and compressive surface residual stresses. Compared to dry or soluble oil or cryogenic coolant, Ben Fredj et al. 29 found that cryogenic coolants improved grindability significantly. Indeed, cryogenic cooling decreased 40% of the surface roughness, increased work hardening, lowered tensile residual stress and improved pitting corrosion and resistance to stress corrosion cracking. Grinding conditions with high table feed rates and low downfeed values increase grindability and surface integrity. Manimaran and Pradeep Kumar 30 performed the grinding experiment on AISI 316 stainless steel during dry, wet and cryogenic cooling with a sol-gel alumina abrasive wheel. They concluded that liquid nitrogen is the best coolant among different environments with respect to better cooling and lubricating effect during grinding operation on AISI 316 stainless steel. They observed a better surface finish, lowest grinding forces, and lesser temperature even at higher material removal rate under cryogenic grinding. Compared to dry and wet cooling, cryogenic cooling causes fewer surface defects. Also, the influence of liquid nitrogen pressure improved the grinding performance.
On the other hand, Chen and Tang 31 compared and examined the outcomes of grinding of C45 carbon steel using the Abbott-Firestone curve under both ultrasonic-assisted (UAG) and traditional grinding. The Abbott-Firestone curve illustrates the surface quality and wearing behaviour of ground surfaces with the help of Rk, Rpk and Rvk parameters. They found smaller values under UAG than traditional grinding. It shows that in a steady state, the ground surface produced by UAG has a shorter running-in phase and better bearing performance. According to Awale et al. 32 the surface quality of ground samples was investigated by bearing area curve analysis under MQL with vegetable oils lubricants which play a significant role in understanding the friction properties and wear characteristics.
After studying several research articles, it was found that the earlier published works in cryogenic cooling were concerned with the effects of different parameters on the surface characteristics of workpiece materials, including various types of steel and difficult-to-machine materials. But no research has been found yet on the bearing area curve analysis (ISO 13565-233) under cryogenic grinding. In this investigation, an effective and economical cryogenic grinding set-up was developed and tested to improve the grinding performance of AISI D2 tool steel. Identical grinding experimentations were performed in various environments, that is, dry, wet, and cryogenic cooling, to understand the positive influence of LN2 cryogen. The present paper also introduces a novel approach to the study of bearing area curve analysis with three subsections, that is, reduced peak height (Rpk), core roughness depth (Rk) and reduced valley depth (Rvk), and bearing area ratio, that is, smallest material ratio, Mr1 and greatest material ratio, Mr2. The effect of grinding inputs (cryogenic pressure and downfeed) with constant table feed rate on grinding outputs (grinding forces, specific grinding energy, Ra and Rz (roughness parameters), topographical characterisation) and Rpk, Rk, Rvk, Mr1 and Mr2 parameters to correspond to the quality of the bearing area curve were examined. The roughness profile was used to make the bearing area curve, which shows how much of the ground surface has anti-friction and anti-wear characteristics. However, bearing area curve analysis is most needed for industrial applications. 33
Experimental details
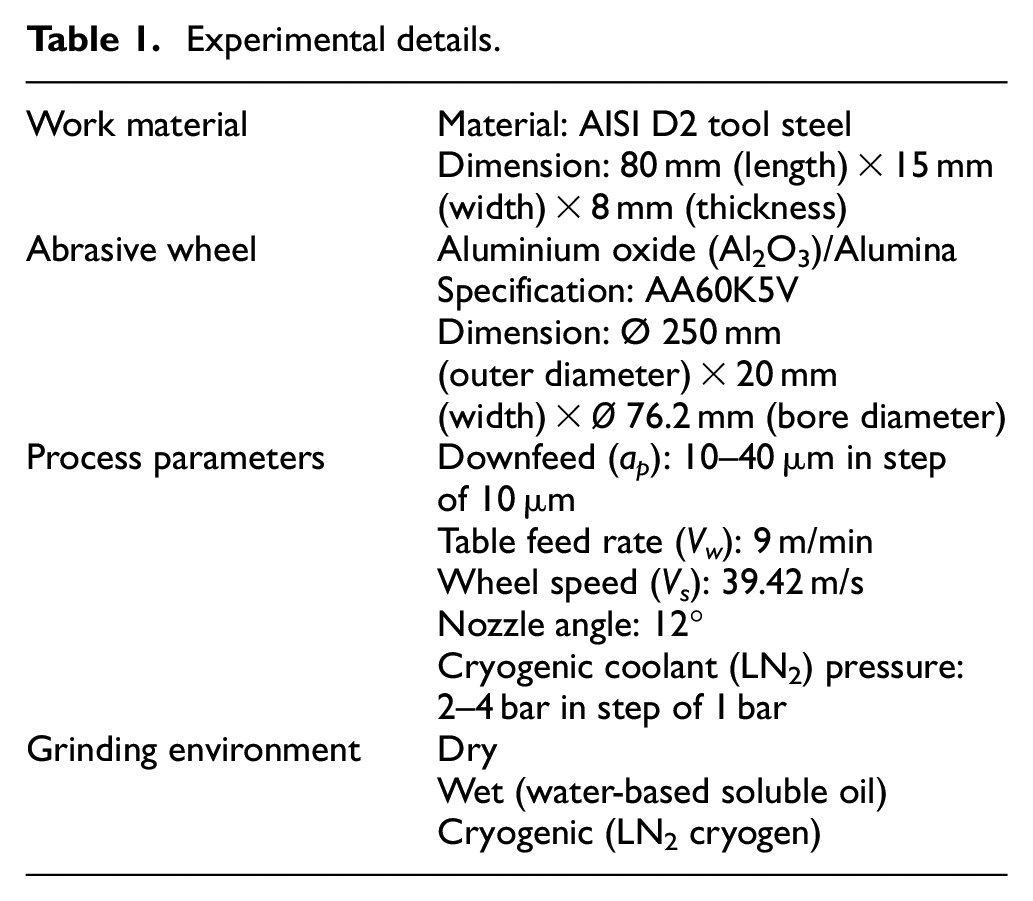
An indigenous cryogenic cooling set-up was developed to study the effect of grinding parameters on the workpiece, that is, tool steel (AISI D2), under a cryogenic environment. This set-up consists of two major components: (a) nitrogen gas cylinder and (b) TA-55 liquid nitrogen container (dewar), as shown in Figure 1. The cryogenic system uses a flat spray nozzle (Make: Spraytech Systems India Pvt. Ltd., India) with a 3 mm exit diameter to inject LN2 cryogen with flow rate of 0.2 L/min into the interface zone area between abrasive wheel-workpiece material. A 12° nozzle angle and a 50 mm stand-off distance were maintained throughout the studies. The parameters were set to allow the LN2 into the interface region between the abrasive wheel and workpiece while minimising the effect of the stiff air layer (hydrodynamic boundary layer) around the abrasive wheel during the grinding operation. The cryogenic coolant, that is, LN2, spray pressure supplied to the interface area was fixed at 2, 3, and 4 bars. A pressure gauge controlled this pressure, which produced better cooling and lubrication results. A conventional cutting fluid (water-based soluble oil) was supplied directly at the abrasive wheel-workpiece interface at a flow rate of 1.5 L/min. No coolant is used in dry grinding. Table 1 illustrates the experimental conditions in detail. Throughout the tests, surface grinding with an up-grinding mode is considered.
Experimental details.
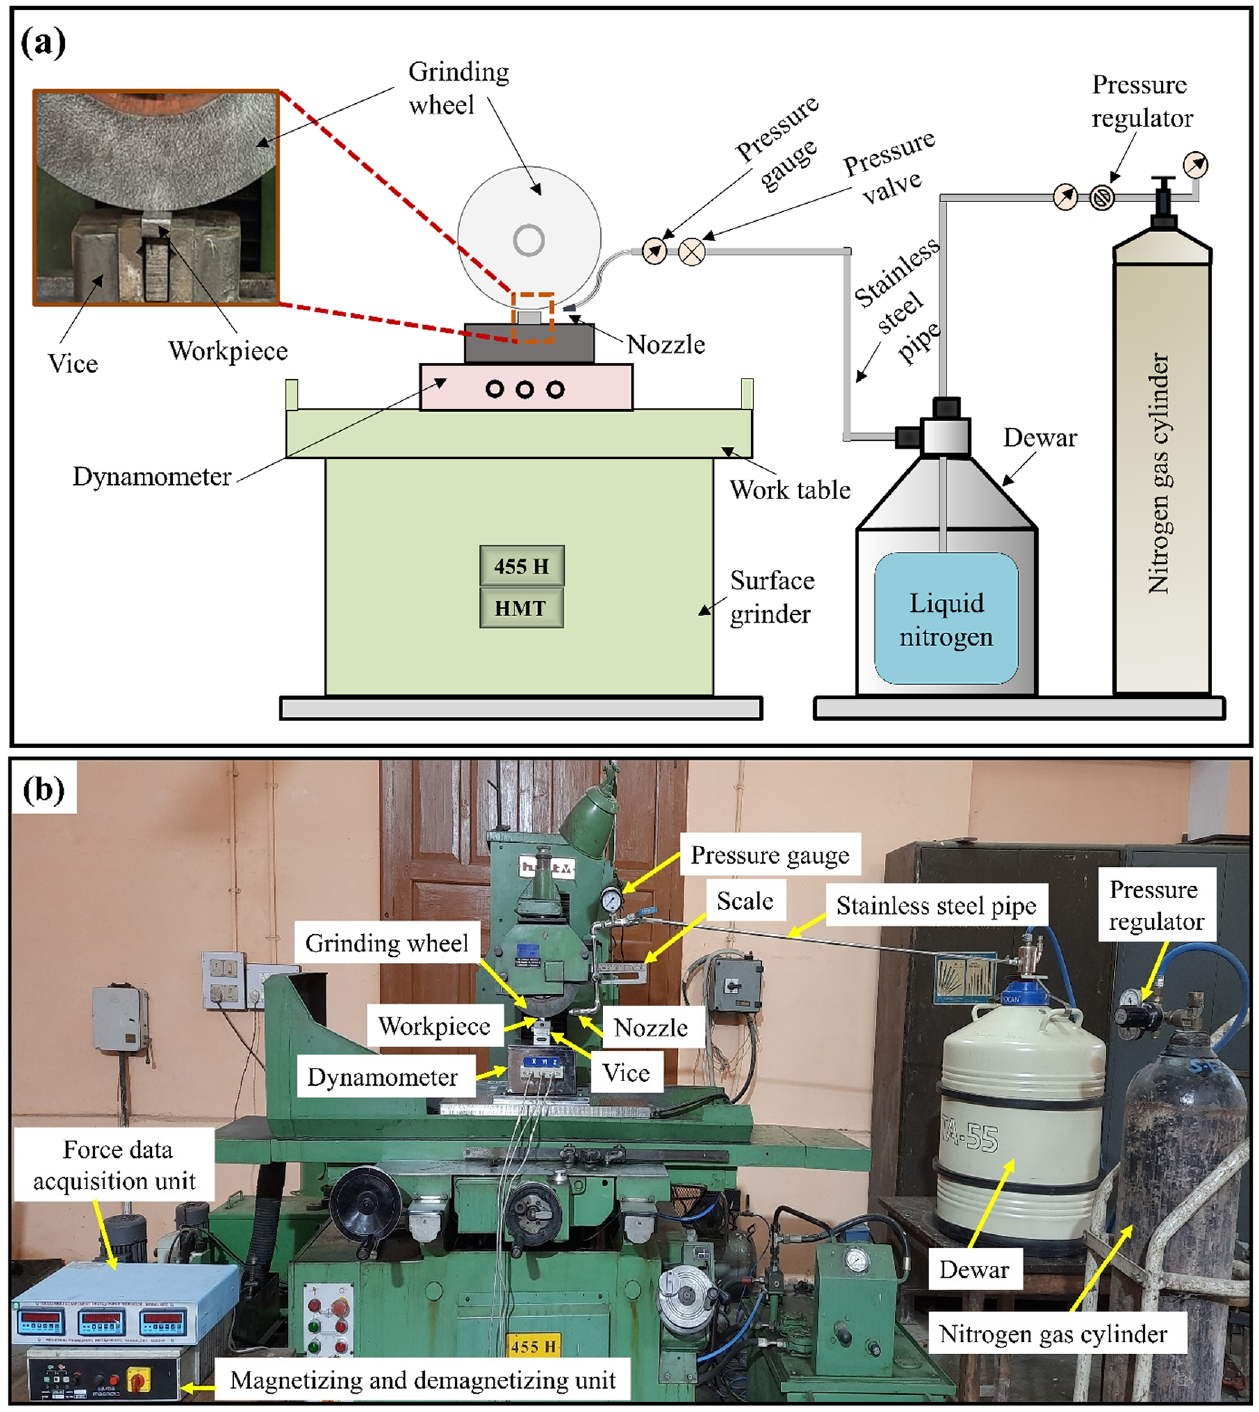
Cryogenic grinding system: (a) schematic representation and (b) real image of experimental set-up.
The material utilised in this study was 80 × 15 × 8 mm in size. Surface grinder 455 H HMT machine was used to prepare the ground sample, which was finished using an alumina wheel (dimension: 250 × 20 × 76.2 mm) with 60 grain size (Make: Carborundum Universal Ltd., India). For each condition, 12 grinding passes are performed. Before each experiment, surface topography of abrasive wheel was uniformed using single point diamond dresser with 10 µm dressing depth. Grinding process parameters such as downfeed (10, 20, 30, and 40 µm), table feed rate (9 m/min), and wheel speed (39.42 m/s) were selected under dry, wet, and cryogenic environments based on preliminary tests.
A dynamometer with three-dimensional force (IEICOS 610C) was employed to measure the forces, that is, tangential and normal grinding forces for each pass. The dynamic grinding force software was used to filter the grinding force data. This software created a graph that showed the relationship between the components and the passage of time. The workpiece was clamped above the dynamometer with the help of vice, as shown in Figure 1.
The surface roughness in the perpendicular direction of the grinding path was measured using a surface profilometer with high precision (Mitutoyo SV-2100S4). The surface roughness values were noted for each ground sample in three distinct locations. The roughness measurement specifications were 4 mm transverse length, 0.8 mm cut-off length and 0.02 mm/s traverse speed. A Wire Cut EDM Machine (Medha Enterprises Series-Ex 4032C) was used to cut the prepared ground sample with the dimension of 10 × 10 mm in the transverse direction to the path of the abrasive wheel for surface morphology (2D) and topography (3D) analysis. This machine was chosen in order to precise cutting and prevent heat damage to the prepared ground sample during the cutting process. The SEM images were taken by scanning electron microscope instruments (Zeiss EVO-18-Research). These images revealed the surface morphology of ground surface. Energy dispersive X-ray (EDX) analysis was used to characterise the elemental composition of the ground surface. For the investigation of three-dimensional (3D) surface topography with nano-level surface roughness parameters such as average roughness (Sa) and root mean square roughness (Sq), an atomic force microscope (AFM) instrument (NT-MDT NTEGRA PRIMA) was used.
Results and discussion
Grindability of an AISI D2 tool steel under dry, wet and cryogenic cooling conditions depend upon many aspects, such as grinding forces (tangential and normal), specific grinding energy, and 2D and 3D roughness parameters. These aspects were precisely examined and analysed in the investigational work to define the applicability of the cryogenic method during grinding workpieces with an alumina wheel. Later, SEM, EDX, AFM and bearing area curve analysis were used to characterise the samples of the ground surface received after grinding under various environments.
Grinding forces
Forces are created when the workpiece is ground against the abrasive wheel during the grinding operation. Grinding forces, namely, tangential force (Ft) and normal force (Fn), were measured using a 3D force dynamometer during each pass and noted the value of grinding force, as indicated in Figure 2. This figure shows increased force with an increase in the number of grinding passes in both directions of tangential and normal at low (10 µm) and high (40 µm) downfeed under dry, wet and cryogenic conditions. This may be related to the wear of abrasive grits as the number of grinding passes increases. 34 The normal force is still more elevated than the tangential force, as presented in Figure 2(a) and (b), because of more abrasive grits in the abrasive wheel with a large negative rake angle. 35 Furthermore, increased downfeed in all grinding environments led to larger grinding forces. A rise in downfeed increased wheel loading due to increased friction at the abrasive wheel and workpiece interface, resulting in high heat production. More heat generation, lack of lubrication, and grit fracture under dry grinding produced higher grinding force. Thus, wet and cryogenic cooling effectively reduced the grinding force magnitude compared to dry grinding due to better cooling and lubrication results. Compared to cryogenic cooling, wet cooling has higher grinding force, while it has lower grinding force than dry. Under high speeds grinding operation, cutting fluids failed to maintain effective cooling and lubrication in the interface zone area at a higher downfeed. Because of the wedge effect between the abrasive wheel and the workpiece surface, a stiff air layer, also known as the hydrodynamic boundary layer, may form in front of the interface zone area. Therefore, the fluid’s energy was insufficient to penetrate the stiff air boundary layer around the abrasive wheel. Li et al. 36 reported that the hydrodynamic pressure of the fluid is generated in front of the interface area owing to the wedge effect where the grinding wheel–workpiece meets. The findings demonstrated that hydrodynamic pressure increases with increased abrasive wheel speed and decreased distance between the abrasive wheel and workpiece. Thus, based on the results, they found less effective machining performance related to less penetration in the hydrodynamic boundary layer at higher downfeed. In particular, cryogenic cooling using LN2 coolant even decreased grinding forces significantly. It may be because the LN2 coolant penetrates deeper into the grinding zone, lowering the grinding temperature and friction between abrasive grit and workpiece and improving grit’s fracture and cutting edge sharpness. 30
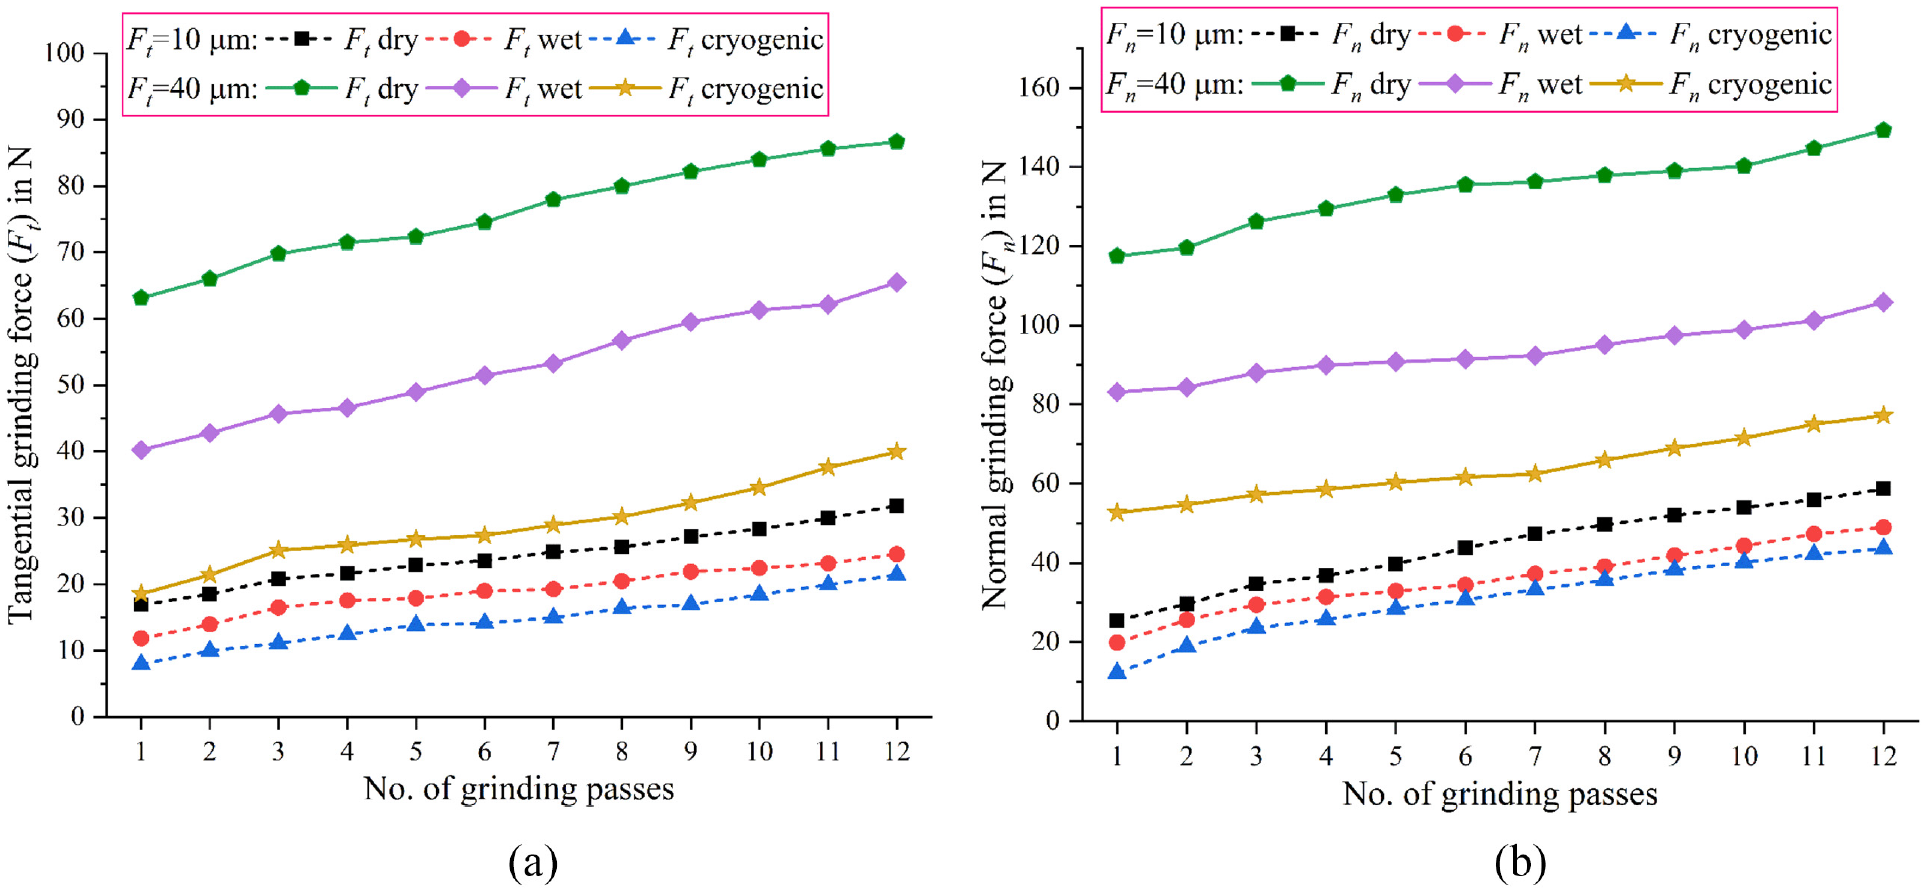
Variation of grinding forces with number of grinding passes at different downfeed: (a) tangential grinding force and (b) normal grinding force.
In other words, a lower magnitude of grinding force at low downfeed (10 µm) was obtained related to the high downfeed (40 µm), as shown in Figure 2. At higher downfeed, it happens due to the more cutting edges of abrasive grits engaged with the workpiece surface, resulting in more friction between the abrasive wheel and the workpiece interface area. Awale et al. 32 conducted a grinding experiment on AISI H13 die steel under Small Quantity Lubrication (SQL) grinding process. They reported a higher grinding force at 32 µm downfeed with each number of grinding passes in comparison to 8 µm downfeed under all SQL conditions. Owing to the maximum uncut/undeformed chip thickness or wheel loading by debris particles, a higher grinding force was found.
The grinding force is a crucial response parameter to evaluate the effectiveness of a process. Figure 3 revealed that both forces (i.e. tangential and normal) increase with an increase in downfeed; downfeed is the most influential parameter for the grinding force. These forces have decreasing trends concerning the various environments: dry, wet and cryogenic. Due to the absence of cutting fluid in dry environment, the abrasive wheel becomes worn out. Therefore, more contact was covered between the abrasive wheel and the workpiece during rubbing by dull grits over the workpiece surface, resulting in higher grinding force. The wet condition produced less wheel wear, providing a lower grinding force than the dry condition. But, in the case of the cryogenic condition, the lowest grinding forces were seen because of the generation of lower temperature at the interface zone. Owing to the low temperature, retention of the grit sharpness occurred. As shown in Figure 3, cryogenic coolant pressure is divided into three pressure ranges, that is, 2, 3 and 4 bar. Cryogenic coolant pressure is also a required factor to increase the grinding performance. Better results were noted at higher cryogenic pressure (4 bar) in both forces (i.e. tangential and normal). High pressure enhanced the more coolant at the interface area between the abrasive wheel and the workpiece than 2 and 3 bar cryogenic coolant pressure. The effect of cryogenic cooling produced a lower Ft (reduction of 64%–67% and 44%–50% in dry and wet, respectively) and Fn (reduction of 54%–58% and 34%–39% in dry and wet, respectively) at higher downfeed. Also, cryogenic coolant pressure decreased by approximate 8% and 6% in Ft and Fn at 40 µm downfeed.
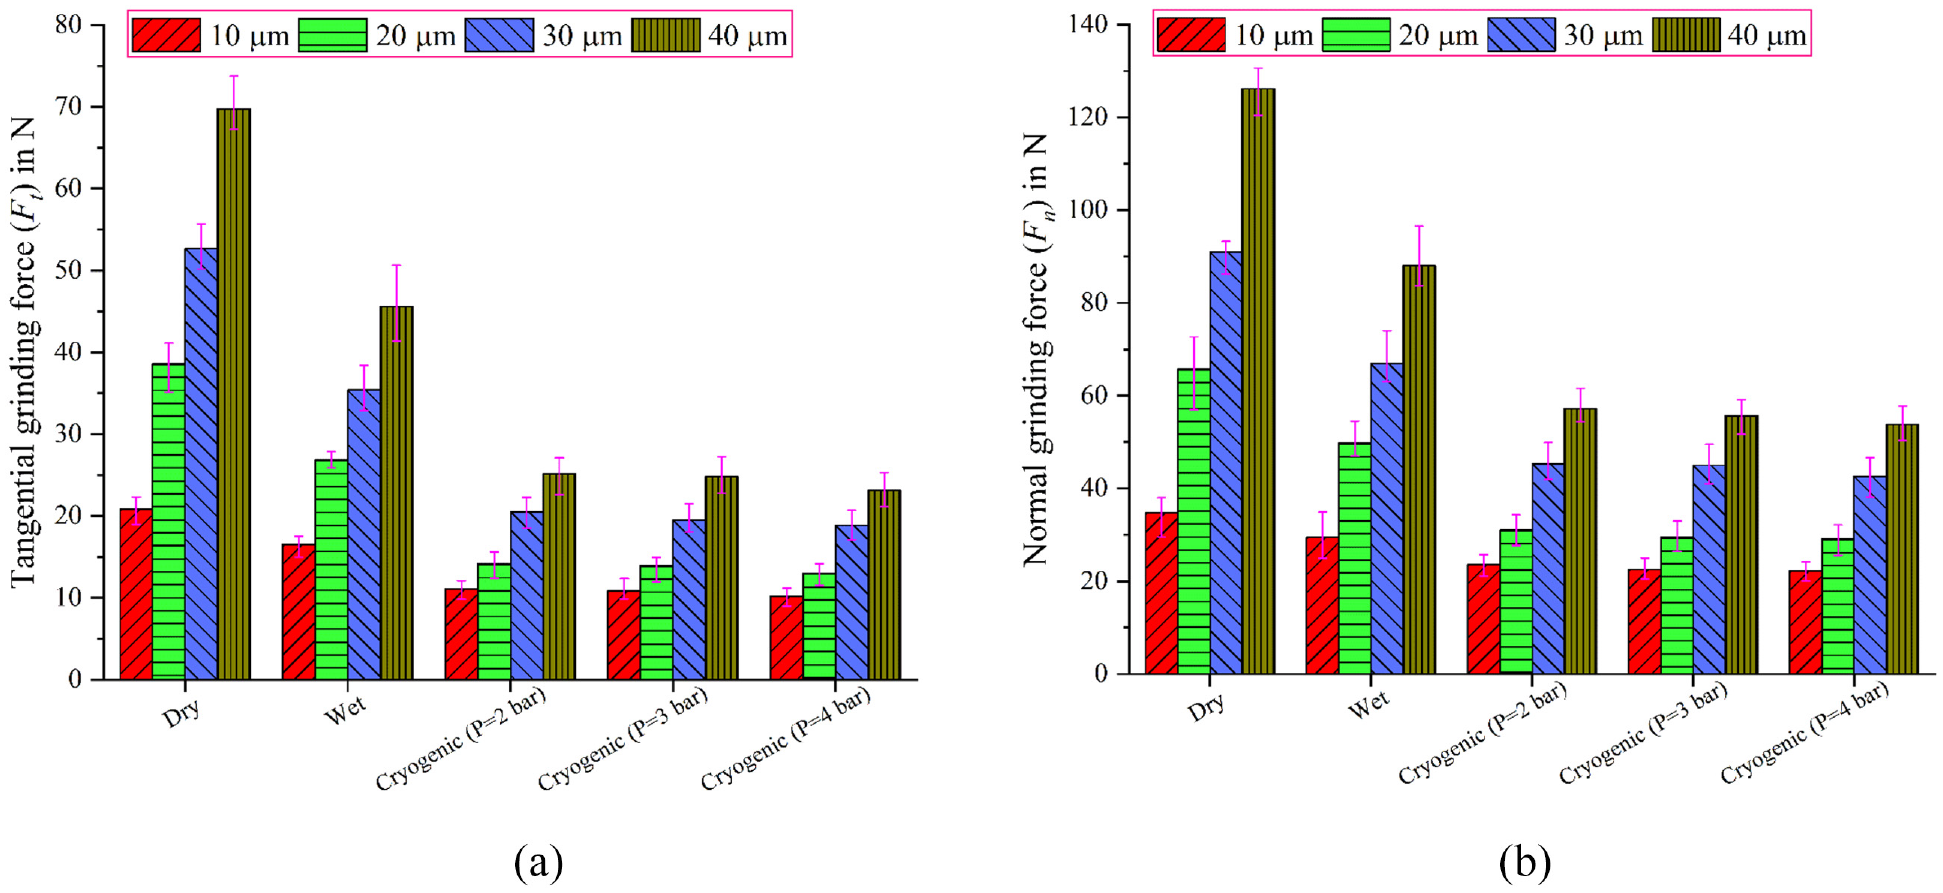
Variation of grinding forces with various environments at different downfeed: (a) tangential grinding force and (b) normal grinding force.
Specific grinding energy
Two main parameters, that is, grinding force and specific grinding energy, were used to show the frictional effects between the abrasive wheel and workpiece surface. The following equation was used to calculate the specific grinding energy, u. 37
Where, Ft = tangential force (N), Vs = abrasive wheel speed (m/s), Vw = table feed rate (m/min), ap = downfeed (μm), b = abrasive wheel width (mm).
Specific grinding energy is the most important response variable throughout the material removal process, especially when grinding difficult-to-machine materials. It varies inversely to the undeformed chip thickness and reflects the degree of interference between the workpiece and the abrasive grit. 38 It is also a measurement indicator of the fluid lubricating ability. 39 Sufficient lubrication by the fluid can decrease the friction at the abrasive wheel-workpiece interface, reduce grinding force, and induce low specific energy, resulting in good surface quality of the workpiece. In the present study, the specific grinding energy is calculated using equation (1) by substituting the tangential grinding force (Ft). Low specific grinding energy means more eco-friendly and reduced power consumption. Specific grinding energy decreased with increased downfeed in dry, wet and cryogenic environments, as seen in Figure 4. The graph trend revealed that lower specific energy created the maximum undeformed chip thickness due to dependency on the downfeed parameter. Also, outcomes of the effect of cryogenic coolant pressure on the ground surface were obtained at different downfeed conditions. According to the graph, high specific energy was seen higher at low downfeed (10 µm) under all environments due to the predominant nature of rubbing and ploughing action over the shearing action. Further, specific energy rapidly declines from 10 to 20 µm downfeed and thereafter reduces steadily from 20 to 40 µm because of the lower involvement of rubbing and ploughing action under the cryogenic condition with all pressure. At a downfeed of 10 µm, cryogenic cooling reduced specific energy by 46%–51% and 32%–39% compared to dry and wet conditions, respectively. From low to high cryogenic coolant pressure, specific energy decreased by about 8% at 10 µm downfeed under a cryogenic environment because effective cooling and lubrication produced more shearing contribution and retention of grit sharpness.
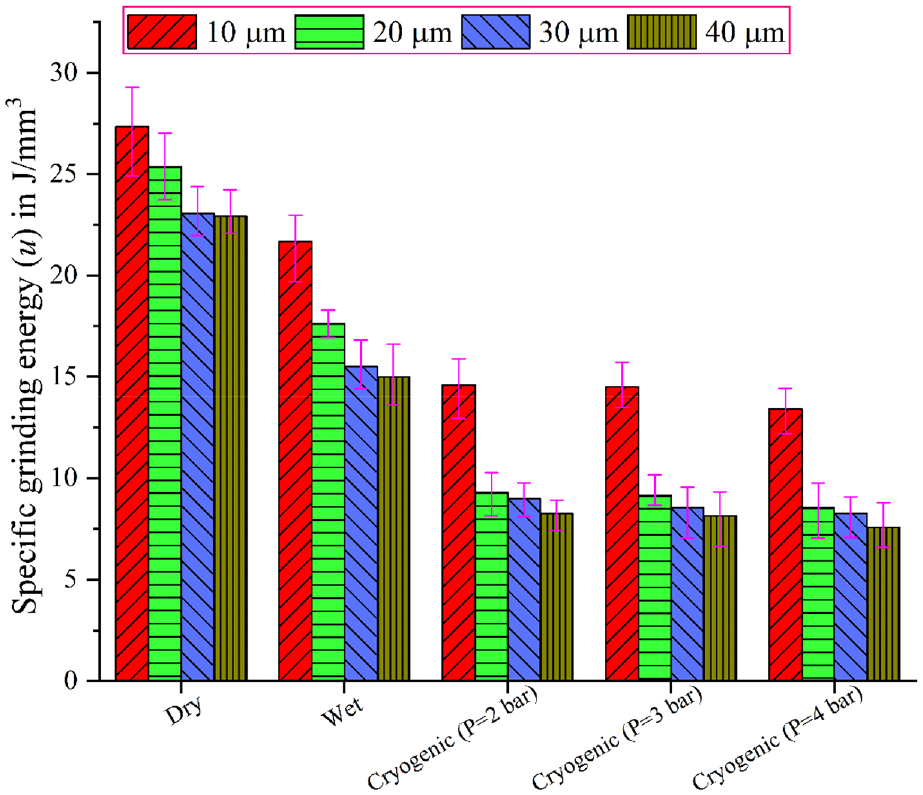
Variation in magnitude of specific grinding energy with various environments at different downfeed.
Surface roughness
Surface roughness provides information about the surface characteristics of the processed/machined component. It is a section of surface texture used to determine the peaks and valleys characteristic patterns on the machined workpiece surface. These characteristics reflect the surface quality of the workpiece after the machining operation. Arithmetic average roughness (Ra) and mean roughness depth (Rz), preferred in the manufacturing sector, are the most needed roughness parameters to determine surface quality. 40 Figure 5 reveals the effect of different environments and downfeed on the roughness parameters such as Ra and Rz. It describes how, regardless of whether the environment was used, both Ra and Rz values gradually increased with an increase in downfeed. It is revealed from this figure that Ra and Rz are substantially higher in dry than wet and cryogenic conditions. In cryogenic condition, Ra and Rz decreased by 46%–51% and 37%–41% compared to dry condition, and 30%–36% and 31%–35% than the wet condition, respectively, at a downfeed of 40 µm. It may be attributed to the interfacing of abrasive grits with the workpiece, resulting in friction appearing between both surfaces by rubbing and ploughing action. With an increase in downfeed, the number of active abrasive grits increased in the workpiece. These grits generate high temperatures, which form dull grits. As a result, increasing the grit spacing at the high downfeed produced a higher peak-to-valley roughness profile. 41 In other words, the mechanical strength of abrasive grits was improved by controlling the temperature in the interface area, resulting in sharper grits and lower surface roughness. Cryogenic coolant pressure effectively obtained better surface roughness regarding the average roughness, Ra. In the pressure range of the cryogenic coolant (2–4 bar), a 7%–9% decrease in Ra was recorded due to the deep penetration cooling at the interface area between the abrasive wheel and the workpiece.
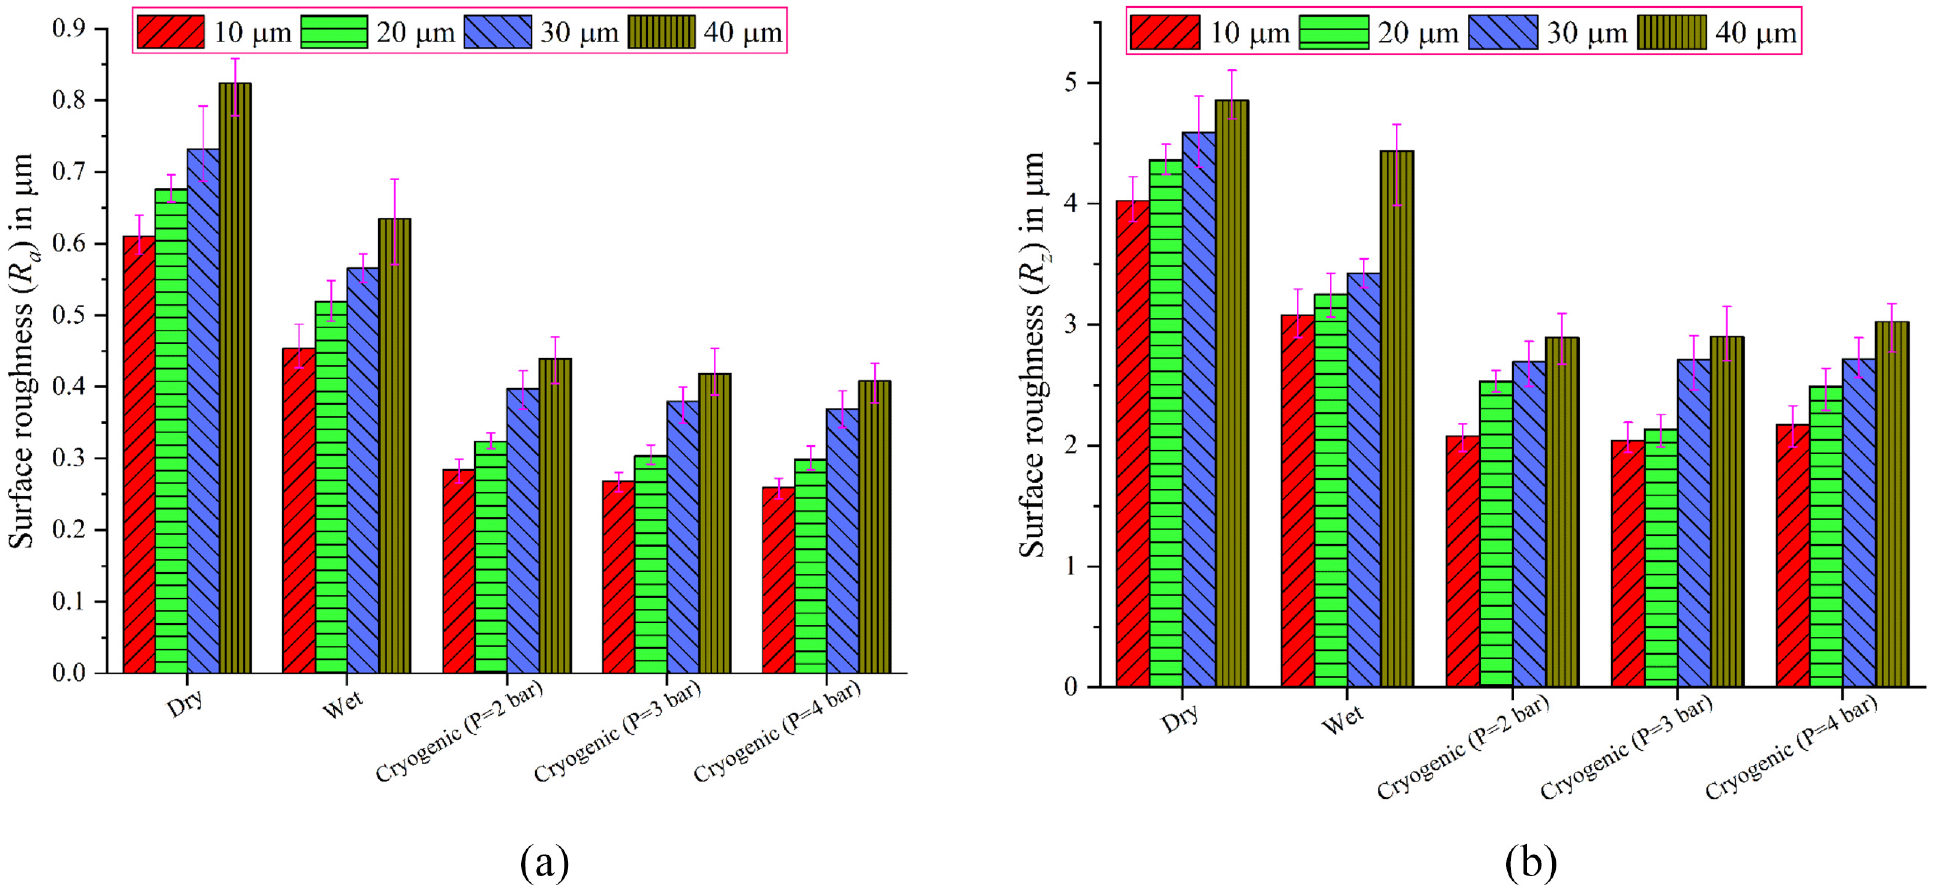
Variation of surface roughness with various environments at different downfeed: (a) surface roughness, Ra and (b) surface roughness, Rz.
Surface morphology
Figure 6 represents the SEM image of the ground surface at maximum downfeed (40 µm) under dry, wet and cryogenic conditions. Grinding marks, surface burn, redeposition, pull out and side flow materials were seen during dry grinding, as revealed in Figure 6(a). Because of the interaction of alumina grits with the workpiece surface in the lack of cooling and lubricating actions, more heat was induced in the interface zone area. Raising the workpiece’s temperature increased its adhesion to the wheel, causing metal redeposition. Also, high temperatures generated grinding marks/scratches and surface burn. Therefore, as a result of the above effects, the surface quality was diminished. In other words, with the cooling and lubricating effect of water-based soluble oil, the ground surface has fewer defects than in dry conditions, as shown in Figure 6(b). The sharpness of the grits was significantly enhanced by the coolant that was applied to the interface zone area. Thus, the higher grit sharpness provided better surface quality. 23 In order to reach a high downfeed (40 µm), wet coolants have challenges entering the interface zone. The lack of coolant raised frictional force, which raised the temperature. Hence, under wet cooling, pull out, and redeposition materials were found to decrease. As perceived in Figure 6(c), a smooth surface under cryogenic cooling was obtained due to the controlled temperature and high grits sharpness. Sharper grits lead to more shearing action. Due to better shearing or cutting action by the sharper grits, except for side flow, no further defects were noticeable.
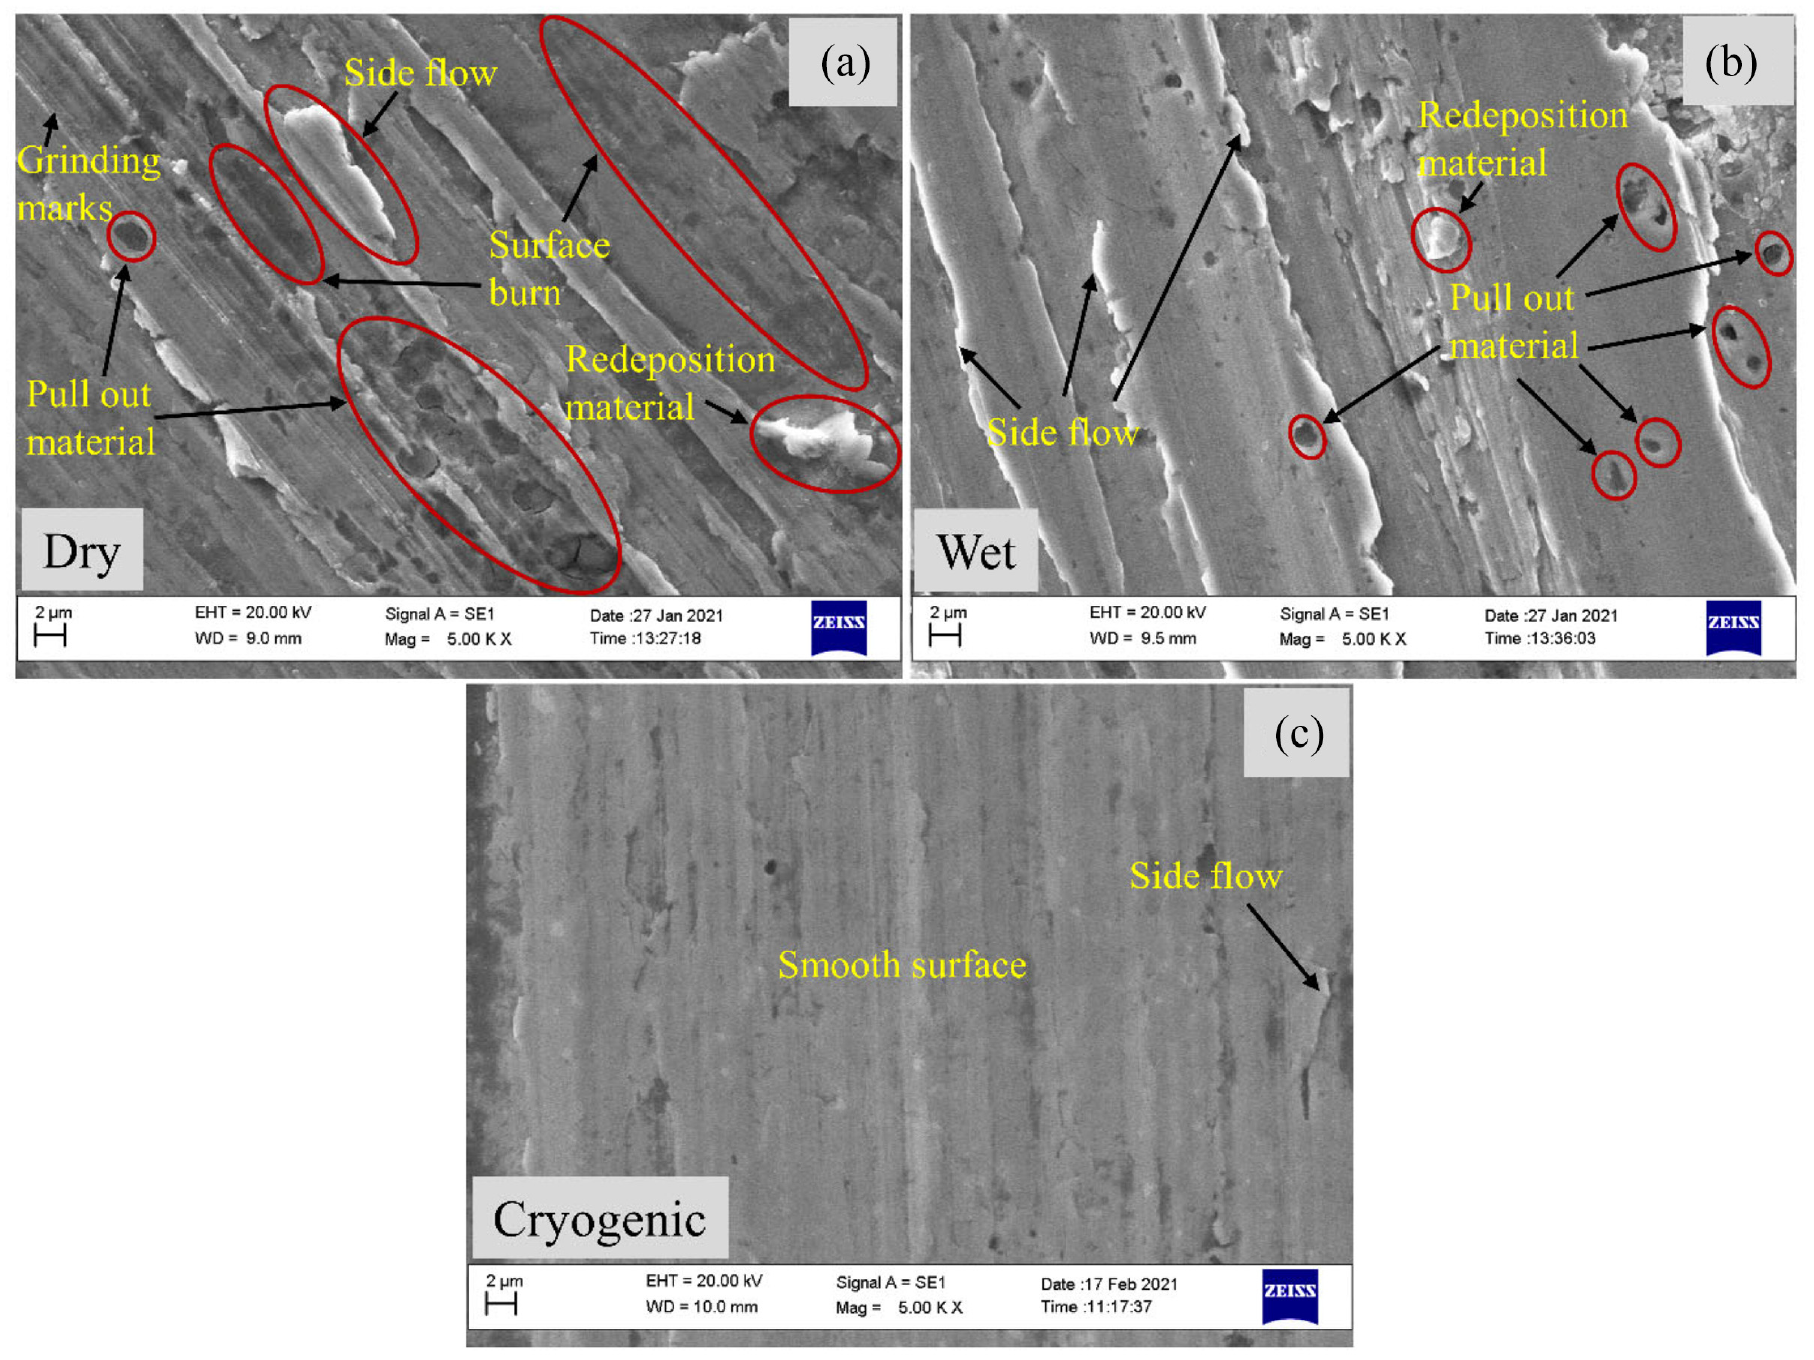
SEM images of ground surface at 40 µm downfeed under (a) dry, (b) wet and (c) cryogenic environments.
Figure 7 displays the EDX results of the ground surface under three environments, that is, dry, wet and cryogenic conditions. Under dry grinding, maximum heat was transferred to the workpiece due to the relatively poor thermal conductivity of the AISI D2 tool steel and the lack of cutting fluid. Furthermore, the redeposited grinding chips on the ground surface were oxidised or carbonised due to the intense flash heat. This redeposited layer indicates transferred atoms, with dominant C and O elements (26.14% and 6.87%). While in wet grinding, grinding chips take away the maximum amount of heat because of the high heat transfer coefficient of water. The grinding temperature in wet grinding condition was observed lower along with less carbon element (C: 20.45%) in comparison to dry grinding. Cryogenic grinding resulted in lower temperature at the grinding zone area without any thermal damage, restricting the redeposition layer over the workpiece surface. EDX results of cryogenic ground sample reported less carbon element (C: 11.40%) than dry and wet grinding. This low carbon content also indicates the absence of thermal damage in cryogenic grinding.
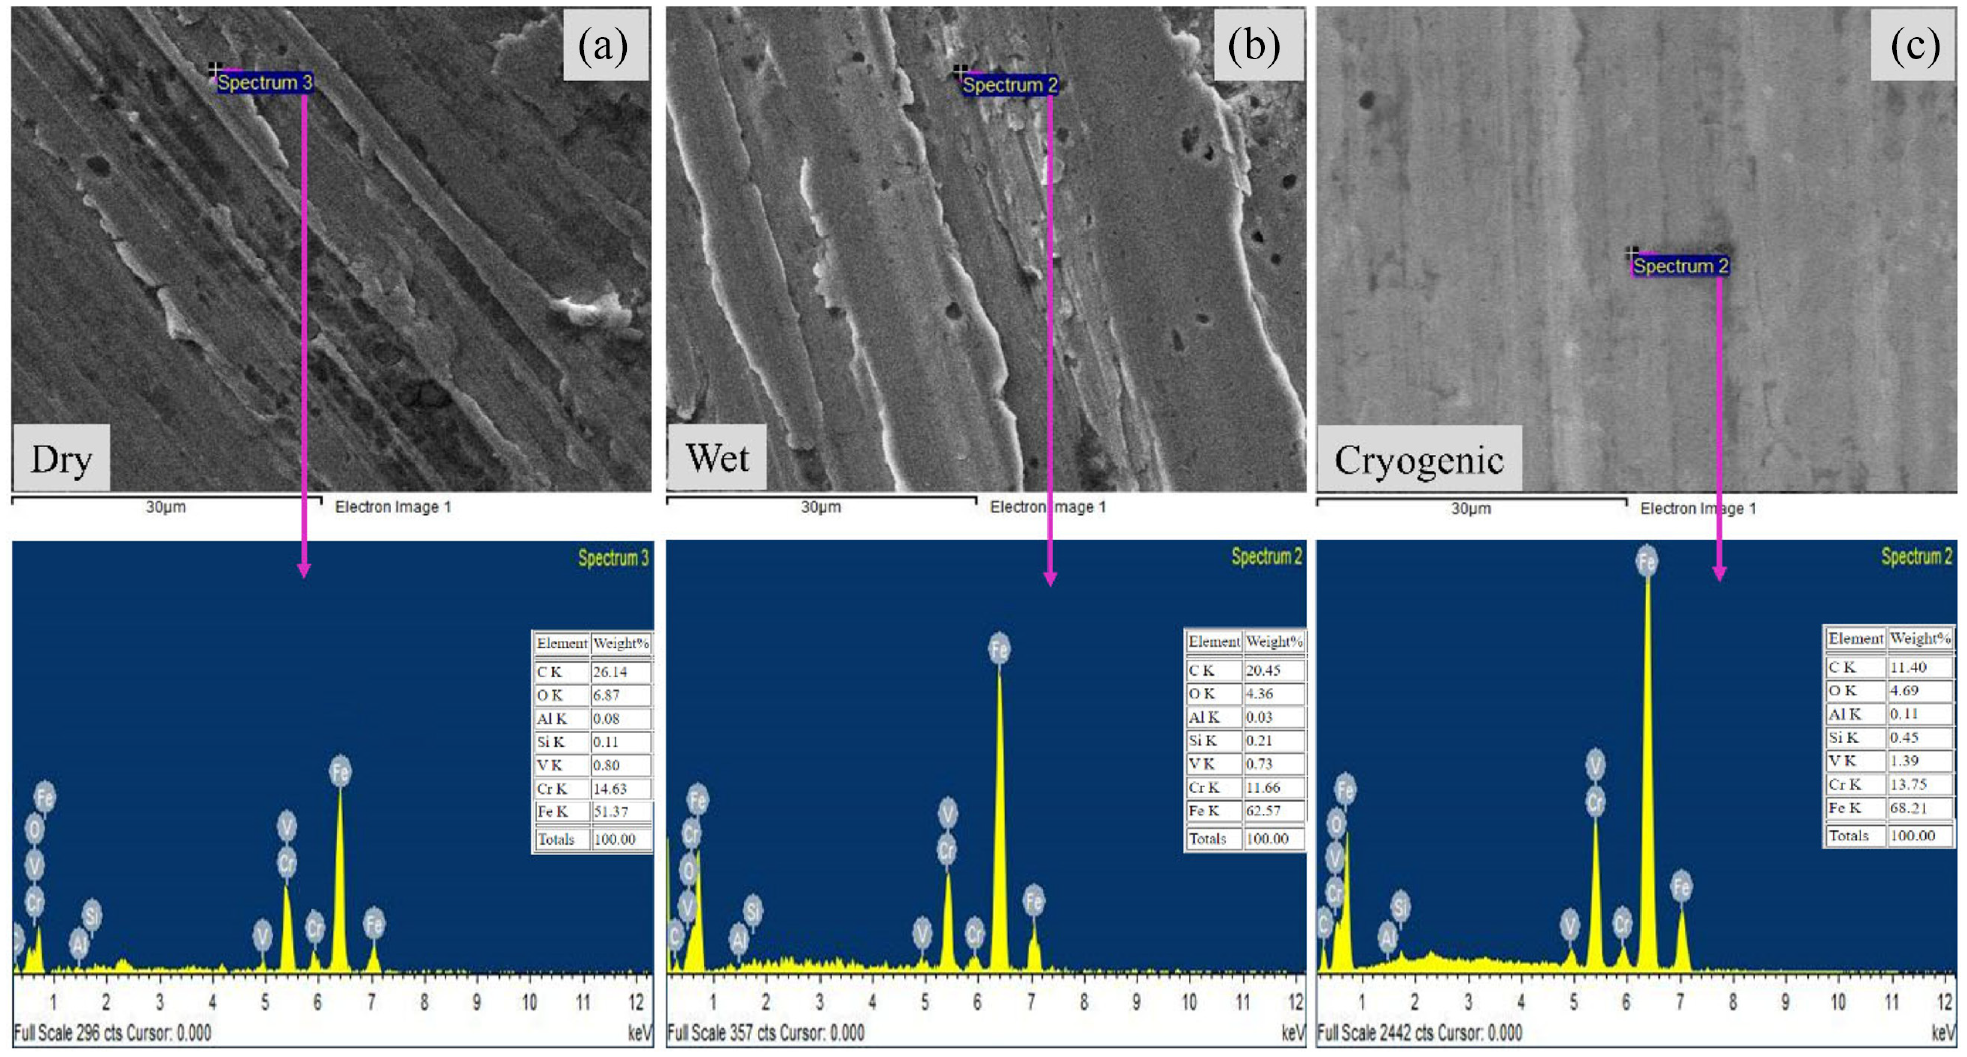
EDX analysis of ground surface at 40 µm downfeed under (a) dry, (b) wet and (c) cryogenic environments.
Surface topography
A three-dimensional atomic force micrograph (AFM) was used to examine the topography of the three-dimensional surface of the ground surface in three different environments, that is, dry, wet and cryogenic cooling (refer to Figure 8). Surface topography and surface roughness investigations at the nano-scale level were performed in different environments on an equal region of all ground samples (70 × 70 µm). Atomic force micrograph outcomes with reference to average surface roughness (Sa) and root mean square roughness (Sq) were recorded. Average surface roughness values were 517.23, 401.17 and 283.12 nm for dry, wet and cryogenic, respectively. Root mean square roughness values for dry, wet, and cryogenic values were 690.47, 464.07 and 344.05 nm, respectively. According to the Sa and Sq measured data, it was observed that temperature at the abrasive wheel–workpiece interface plays a crucial role in the grinding process because the dry grinding process has a high temperature in comparison to wet and cryogenic grinding. These findings (roughness parameters, i.e. Sa and Sq) demonstrated that cryogenic coolant performed admirable effects owing to the cooling and lubrication factors during the grinding operation. Compared to dry and wet, less height of peak and valley was found in the cryogenic environment because of the generation of low temperature at the interface area with the workpiece and abrasive grits interface.
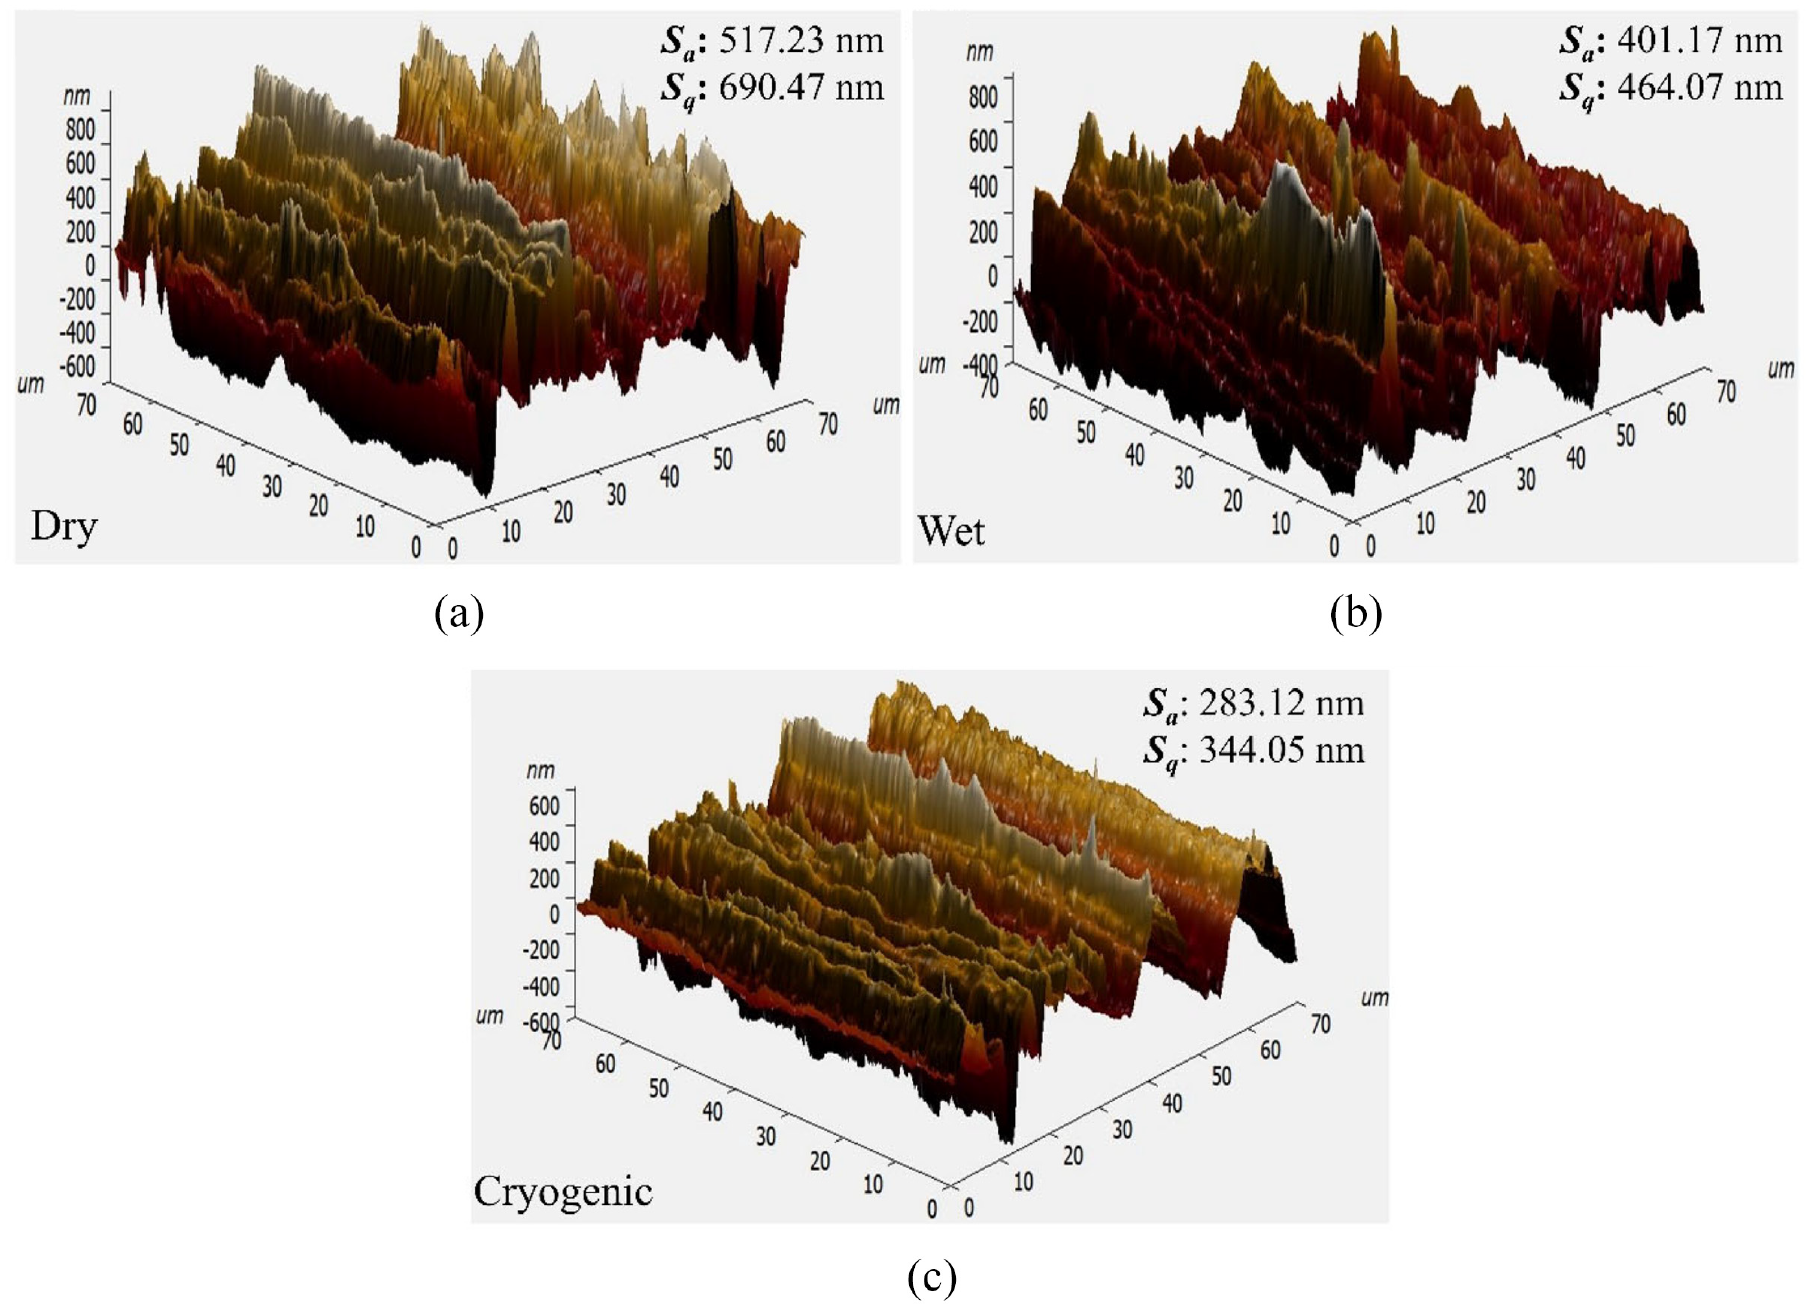
3D AFM images of ground sample at 40 µm downfeed under (a) dry, (b) wet and (c) cryogenic environments.
Bearing area curve analysis
The solid black lines depicted in the graph (refer to Figure 9(a)) reflect the bearing area curve (BAC), also called the Abbott-Firestone curve. It characterises an object’s surface texture. With regard to better perceiving the effects of roughness characteristics, it may be helpful to divide the bearing area curve into subgroups. A straight line may be drawn using a best-fit line across 40% of the bearing area curve’s centre part and then shifted along the curve until the slope is as slight as possible. 42 The divided section of the bearing area curve included reduced peak height (Rpk), core roughness depth (Rk) and reduced valley depth (Rvk). The bearing area curve and its three subgroups are depicted in Figure 9(a). Using the bearing area curve based on the ISO 13565-2 standard, 33 the parameters (Rpk, Rk, Rvk, Mr1 and Mr2) were calculated with the help of the profile of the bearing area curve. Core roughness depth, Rk, denoted the roughness profile that excludes fine protrusion peaks and deep steep-sided troughs. A 40% line was placed on the central portion of the bearing area curve by the best-fit line with the smallest gradient. The lines were then drawn to the 0% and 100% points (refer to Figure 9(a)). Reduced peak height, Rpk, represents the average height of the protrusion over the upper limit of Rk and also indicates the top region of the surface (hatched area A1) that will be rapidly worn away. An average depth of the deep steep-sided valleys profile (hatched area A2) below the lower limit of the Rk stands for reduced valley depth, Rvk, which was a subsurface that retains the lubricant. The smallest material ratio, Mr1, denoted the bearing area curve percentage that meets the core roughness’s upper limit on the profile of the bearing area curve. A similar concept, the greatest material ratio, Mr2, described the bearing area curve percentage that intersects the core roughness’s lower limit on the profile of the bearing area curve. Here, the side of the right-angle triangle represents the Rpk and Rvk parameters, calculated based on the triangle’s same area (peak area, A1 and valley area, A2) because Mr1 is the base in area A1, and 100% −Mr2 is the base in area A2, as shown in Figure 9(a). In other words, the need for a surface with a low Rpk was based on the fact that peak heights were worn away in the initial phases of operation, whereas Rk can become the long-term feature (i.e. roughness profile: peak and valley) of a surface.
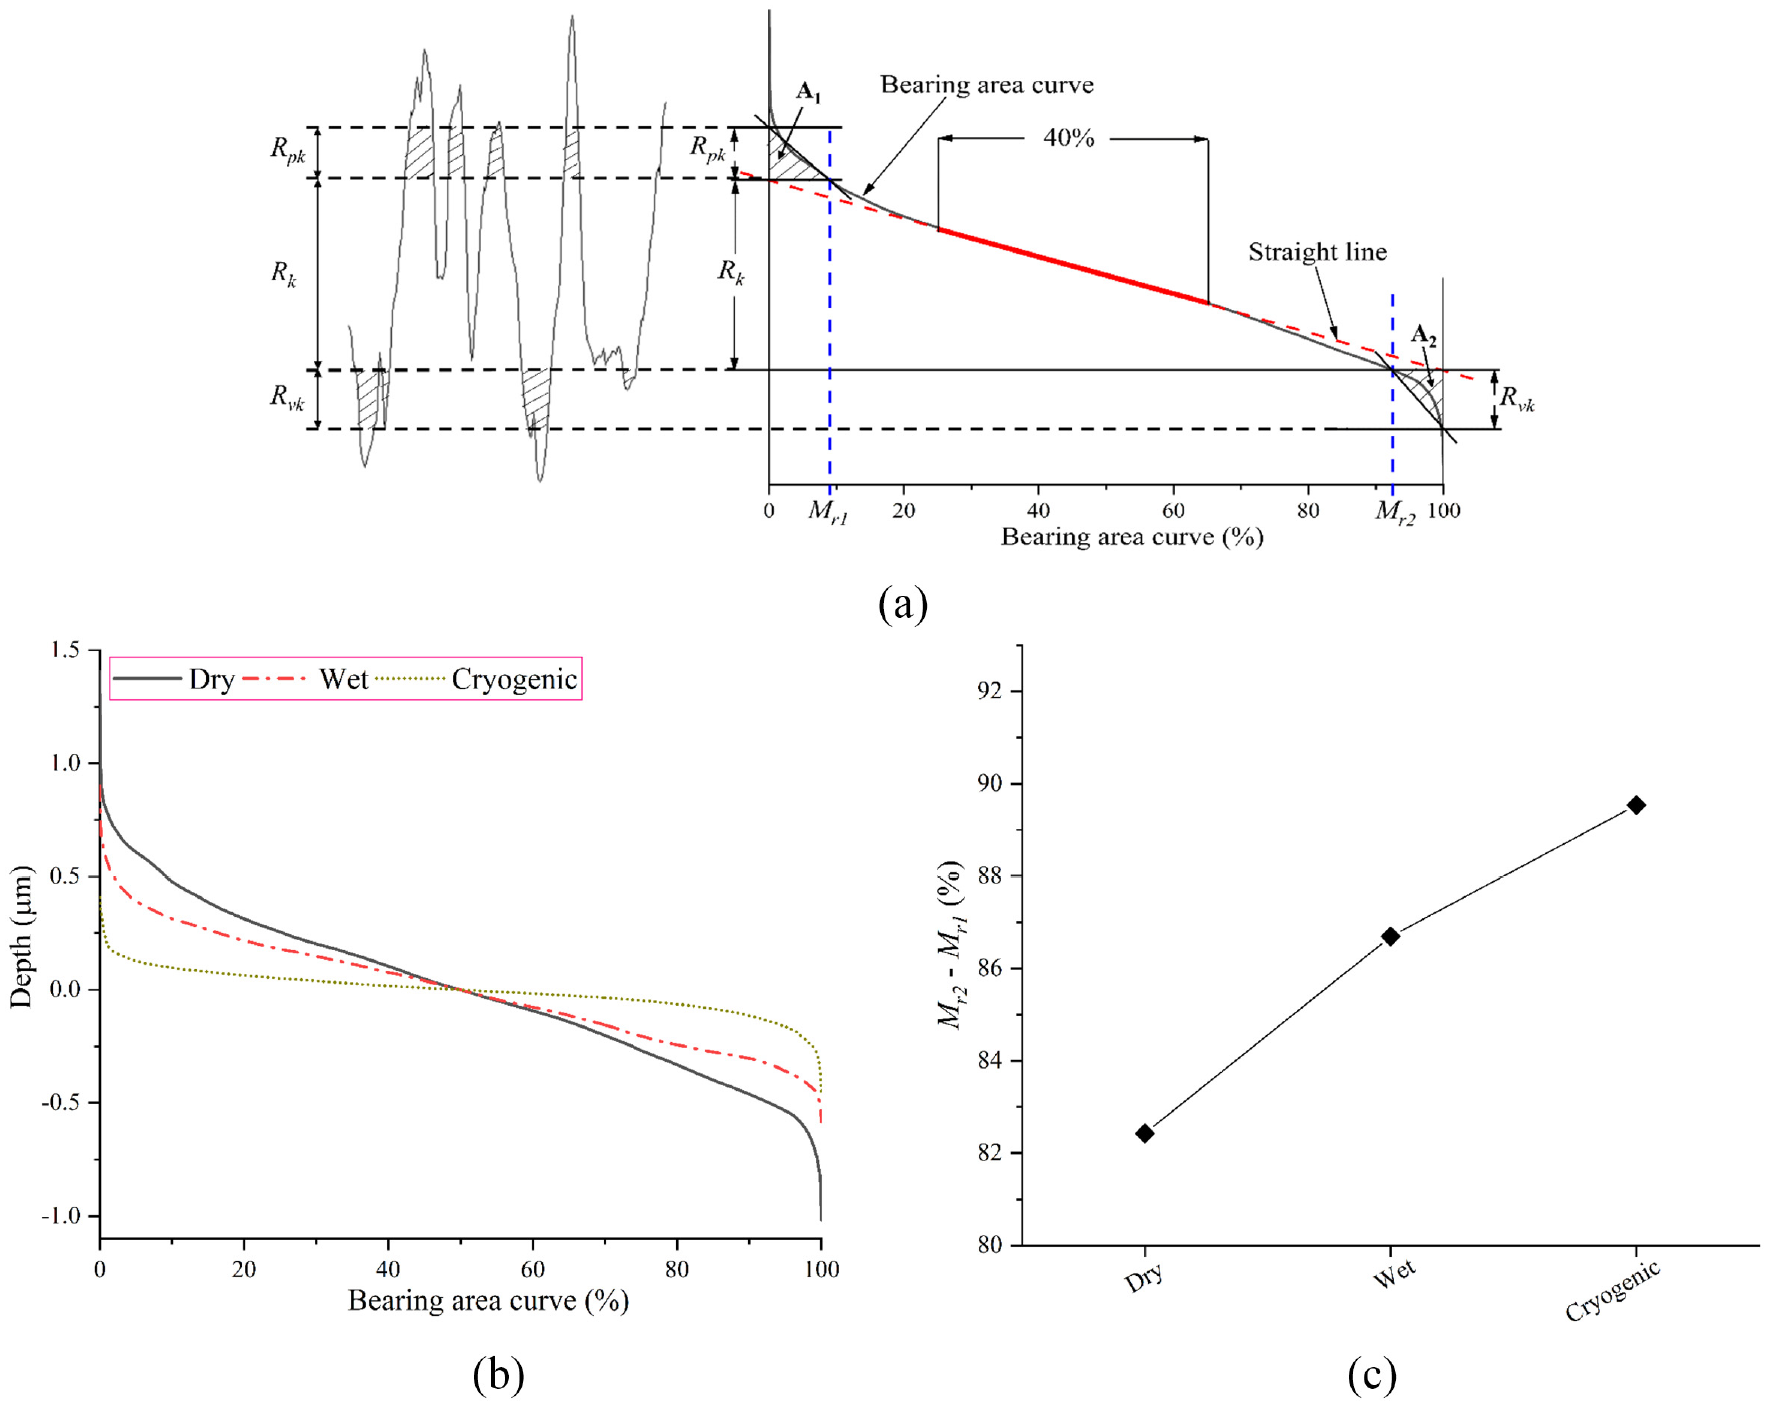
Bearing area curve analysis: (a) filtering and parameters of the bearing area curve, (b) bearing area curve at different environments, and (c) bearing area ratio at different environments.
Figure 9(b) and (c) illustrate the bearing area curve and bearing area ratio with the different environments at maximum downfeed. The measured bearing area curves were investigated and evaluated based on the previous survey. Figure 9(b) shows the ground surface curvature of different environments, that is, dry, wet and cryogenic, at 40 µm downfeed. Clearly, there was a substantial variance in the bearing area curves of the dry, wet, and cryogenic ground sample. According to Figure 9(b), the dry bearing area curve is more irregular than cryogenic but slightly irregular than wet conditions. Figure 9(c) indicates the bearing area ratio (Mr2 − Mr1) in different environments. From Figure 9(a), by crossing a line that divided the valley depth profile and peak height profile from the core roughness profile, the bearing area ratio is defined. It represents the percentage area of the bearing area curve. The bearing area ratio increased with the sequence of dry, wet, and cryogenic environments. A minimum bearing area ratio (82.43%) in dry and maximum bearing area ratio (89.54%) in cryogenic environments was noticed. The higher bearing area ratio revealed a larger bearing area, resulting in lower wear and friction in the finished parts, generating better surface roughness. 42 It generally happens due to dependence on the temperature and grit’s sharpness. Owing to more heat generation in dry condition, the sharpness of the grits become worn out (occurrence of blunt edges), which produces more friction between two surfaces (i.e. workpiece and abrasive wheel) during rubbing action. The presence of the cooling and lubrication indicated more bearing area ratio in wet and cryogenic environments as compared to dry. Compared to wet conditions, a higher bearing area ratio (refer to Figure 9(c)) was found in cryogenic due to low temperature, which provided good sharpness of grits, inducing improvement in surface roughness.
Conclusions
After conducting experimental work on AISI D2 tool steel using a cryogenic grinding set-up, the following conclusions may be taken from the findings:
The drastic reduction in grinding forces was obtained with cryogenic cooling rather than dry or wet cooling because efficiently liquid nitrogen coolant entered the grinding zone area, improving both cooling and lubrication performance. The maximum percentage reduction in Ft and Fn in cryogenic condition was 66.88% and 57.37% compared to dry condition, and 49.38% and 38.87% compared to wet condition, respectively, at 40 µm downfeed.
It was seen that specific grinding energy under cryogenic cooling, as compared to dry and wet conditions, has a low value and a decreasing trend in increasing order of 10–40 µm.
Better surface quality was attained by employing cryogenic grinding owing to the effective control of contact area temperature between the alumina wheel and workpiece. Cryogenic cooling reduced the surface roughness by about 50.47% and 35.74% in Ra, and 40.36% and 34.77% in Rz, compared to dry and wet cooling, respectively, at downfeed 40 µm and table feed rate 9 m/min.
The beneficial outcomes of high cryogenic coolant (LN2) pressure (4 bar) were seen over 2 and 3 bar pressure of LN2 cryogen. It may be related to controlled temperature by more effective penetration of LN2 cryogen at the abrasive wheel-workpiece interface.
After cryogenic cooling, SEM micrographs showed a smooth surface over dry and wet cooling, even at 40 µm downfeed. Therefore, lower height of peaks and valleys in surface topography was noticed. Also, cryogenic cooling lowered Sa and Sq values under all experimental conditions compared with other environments.
In a new surface characterisation by bearing area curve study, cryogenic cooling produced a greater bearing area ratio (89.54%). The higher bearing area ratio represents a better ground surface in terms of excellent antifriction and antiwear characteristics.
Footnotes
Appendix
Acknowledgements
The authors are thankful for the funding support received from IIT (BHU).
Declaration of conflicting interests
The author(s) declared no potential conflicts of interest with respect to the research, authorship, and/or publication of this article.
Funding
The author(s) disclosed receipt of the following financial support for the research, authorship, and/or publication of this article: The authors are grateful for the financial assistance they got from IIT (BHU) under sprouting grant (letter no. IIT (BHU)/Dec/2013-14/5110/L) and Institute Research Project (IIT(BHU)/R&D/IRP/2015-16/2832).