
Abstract
The formability of a two-layer sheet in the electromagnetic forming (EMF) process is investigated through experimental and numerical methods. The Al/Cu two-layer sheet is fabricated by using an explosive joint in the EMF process. By using the diameter changes in surface grids of specimens with various widths the forming limit diagrams used in necking and fracture conditions are calculated. The acceleration of the major strain method is used to predict the necking time in the simulation. The J-C damage constants were calibrated by using the surface response method with a 95% model fit. The Al/Cu two-layer sheet has a higher formability in the EMF process than in a static condition. The Al/Cu two-layer sheet’s formability increases when the Cu is in the outer layer. The Cu layer has a higher formability than the Al layer and has a protective role against necking. The fracture forming limit diagram is linear and has a negative slope. The fracture strain in the in-plane strain condition in the AC lay-up is 36% greater than the CA lay-up, due to Cu’s better resistance to fracture in tensile stress.
Introduction
The sheet metal forming process is widely used in industry. Formability is the inherent characteristic of a material. Forming limit diagrams (FLDs) are used to determine the formability of metallic sheets. Keeler first introdeces the FLD concept in 1961. 1 The researchers’ results have demonstrated that FLDs are affected by several factors such as strain rate, strain hardening index, and sheet thickness.2,3 By using the theory that considers necking develops in regions of the initial heterogeneity, 4 Marciniak and Kuczyński assumed that an initial geometrical non-homogeneity is shaped in the form of a groove on the sheet.4,5 The thickness in the groove zone is less than the safe zone. The groove grows and changes its direction when a force is applied.
Nowadays, two-layer metallic sheets are widely used in various industries, such as aerospace and automotive. In 2016, Hashemi and Karajibani 6 calculated the FLDs of Aluminum–Copper two-layer metallic sheets using the (M-K) theory. In their research, equations for the M-K method were used simultaneously as a set of non-linear equations. The results were in acceptable agreement with the experiment. In 2016, Karajibani et al. investigated the FLD of an Aluminum-Copper two-layer sheet. They used numerical simulation and experimental verifications for their research. By using the acceleration of the equivalent plastic strain, they found the time of necking. Results from the numerical simulations were fairly in agreement with the experiment. 7 In 2010, Tseng et al. 8 analyzed Aluminum/Copper clad metals’ formability with different thicknesses by experimenting and using the numerical method. They found that the formability of clad metal sheets can be controlled by changing the holding force and the blank diameter in deep drawing tests. In 2017, Marandi et al. 9 used the hydraulic bulge test equations to predict the bulge height. The experimental results showed that the layer’s lay-up does not affect the test results. In 2017, Darabi et al. 10 investigated the effect of layers lay-up and material properties on two-layer sheets’ formability. They developed the analytical model based on the M-K model to predict the forming limit diagram of a two-layer sheet. They found that the strain hardening exponents and the strain rate sensitivity coefficients have a major effect on the two-layer sheet’s formability. In 2019, Zahedi et al. 11 determined the necking and fracture forming limit curves of laminated Al/Cu sheets using a damaged plasticity model. They used the time-dependent method and the modified Xue–Wierzbicki damage plasticity model in the Abaqus/Explicit. They found that the thinning of the sheet occurs earlier if the outer layer is Aluminum. In this layer lay-up, the necking happens in lower strains. Therefore, the forming limit diagram of the Al/Cu two-layer sheet is higher when the Al layer is an inner layer. In 2021, Alaie et al. 12 investigated the forming limit diagram and mechanical properties of the bimetallic Al/Cu composite sheet at different temperatures. The result showed significant anisotropy in the Al/Cu composite sheet due to the explosive welding process. The Al/Cu composite sheet’s formability enhanced about 34.8% when the temperature increased from 230°C to 1200°C and 67.5% when it increased from 1200°C to 2200°C.
Using a high strain rate forming process is a way of increasing metal formability. Electromagnetic, electro-hydraulic, and explosive forming are the most practical processes in high strain rate conditions. 13 In 2008, Gerdooei and Dariani 2 investigated the effect of strain rates on sheet metal formability in an experiment. They showed that the strain rate is more effective on the Al sheet than the Steel sheet and the positive minor strain rates increase more than the negative minor strain. In 2013, Pepelnjak and Smoljanic 14 studied the impact of the strain rate on sheet metal formability at room temperature. They investigated the effect of strain on the yield stress and flow curves. They observed that the yield stress and flow curves increased with increasing the strain rate at room temperature. The localization on the critical corner of the specimen in deep drawing forming appears earlier at the small forming speed of 4 mm/s than at a five times higher forming speed of 20 mm/s. 14
The strain rate and the use of two-layer metal to increase the formability of low ductility metals have been frequently studied. However, there has been little study of the FLD of two-layer metals at a high strain rate. Thus, this research aims to evaluate the Al/Cu two-layer sheet strains at a high strain rate for necking and fracture conditions using electromagnetic forming. The acceleration of the major strain method was used to predict the necking time. The fracture strain of a two-layer sheet in finite element simulation was calculated by using the Johnson-Cook damage criterion. Numerical and experimental methods were used to calibrate the fracture model through electromagnetic sheet forming. Finally, the Al/Cu two-layer sheet was fabricated by explosive joint, and experimental tests were done to validate the simulation results.
Electromagnetic forming
Electromagnetic forming is a high-speed method to increase materials’ formability. 15 Figure 1 indicates the basis of electromagnetic sheet metal forming.
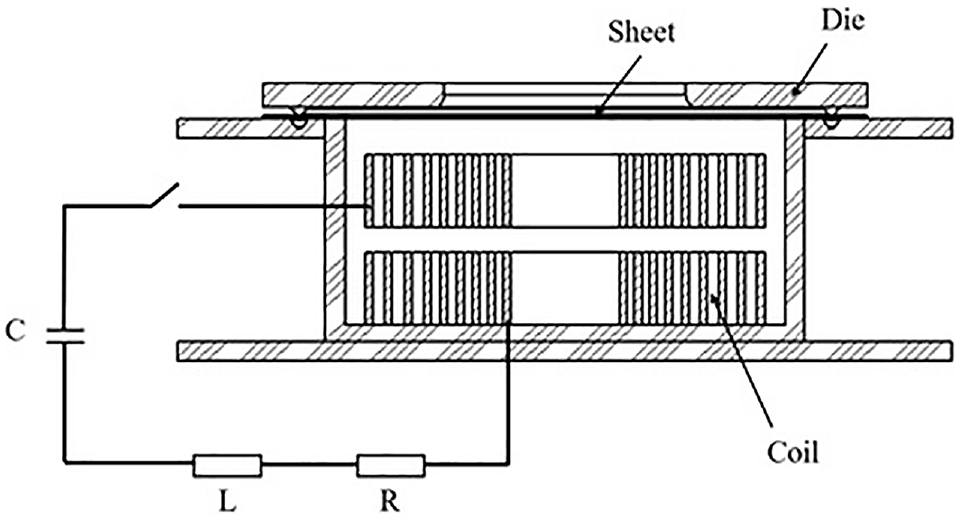
Schematic of electromagnetic sheet forming process.
In EMF, a capacitor bank stores a significant amount of electrical energy. This energy is discharged, and due to the electrical discharge current an intense transient magnetic field is created around the coil. This magnetic field is generated in the conductive workpiece as a result of the Eddy effect. A current is induced in the sheet, and it disagrees with its underlying cause. Finally, the sheet gets away from the coil and moves to the die. The force applied to the sheet is known as the Lorentz force, which is generated from the interaction between the coil and the sheet. 16 This process is used to form the sheet, expand and shrink the pipe, and connect the pieces. Golovashchenko 17 created plane strain and uniaxial tension conditions using a racetrack-shaped coil and various strips. Li et al. 18 used a double-turn coil to create uniaxial tension and plane strain conditions. According to Golovashchenko and Li’s method, different coil shapes need to produce different strain states. These methods increase the cost and time of production. In this research, a double layer coil contain strip sheets with different widths was used to create different strain conditions.
Experiment
Table 1 shows the chemical composition of Al 1050 and Cu1100 layers that were used to create a two-layer sheet
The chemical composition of Al1050 and Cu1100 used in the experiment.
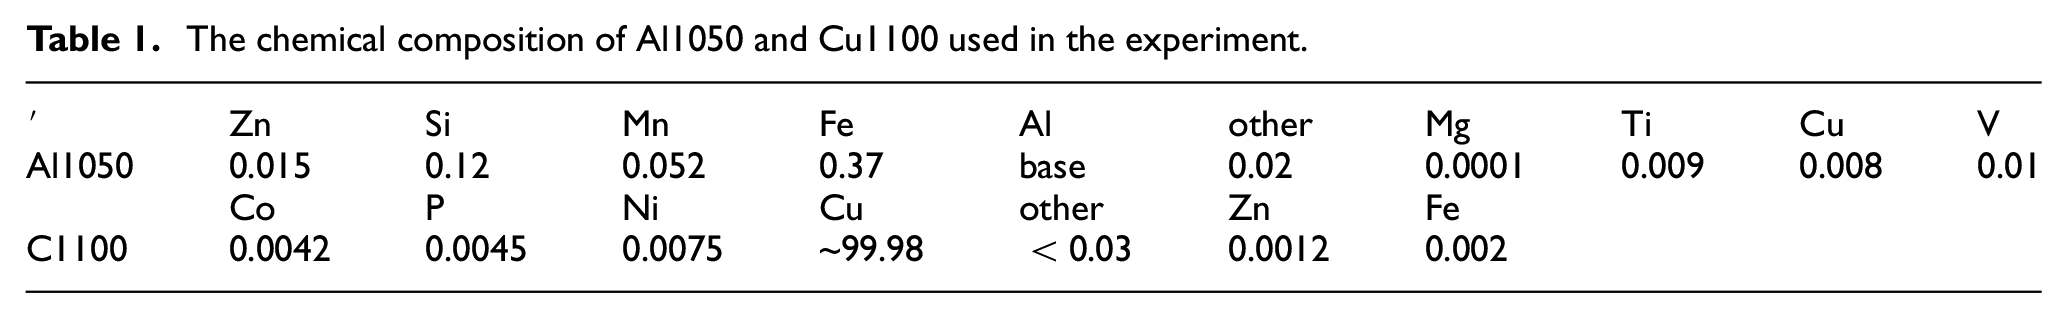
By comparing the present Aluminum and Copper’s chemical composition with the standard BS EN 573-3:2009 and BS EN 13601:2002, the type of materials used is confirmed.
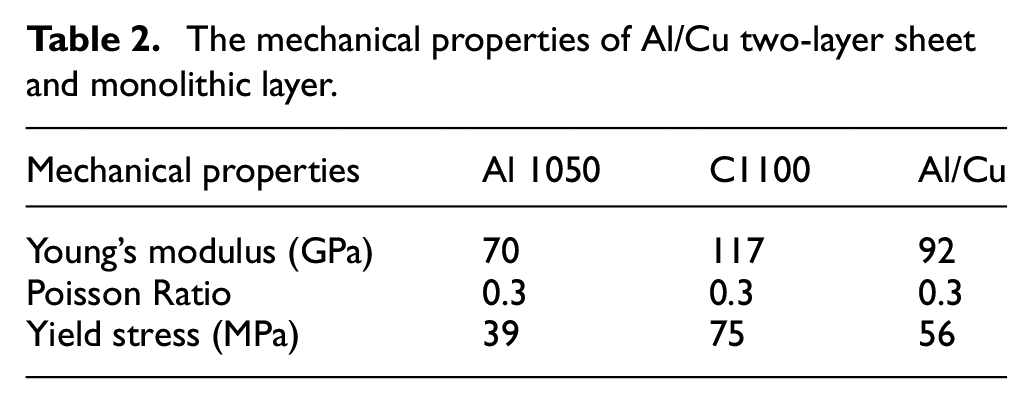
The uniaxial tensile test in rolling direction was done according to ASTM-E8 to measure the Al/Cu two-layer sheet’s mechanical properties and the monolithic Al and Cu sheet. Figure 2 shows the Al/Cu two-layer sheet’s stress and strain curve and the monolithic Al and Cu sheet. Table 2 shows the material properties of the Al/Cu two-layer sheet.
The mechanical properties of Al/Cu two-layer sheet and monolithic layer.
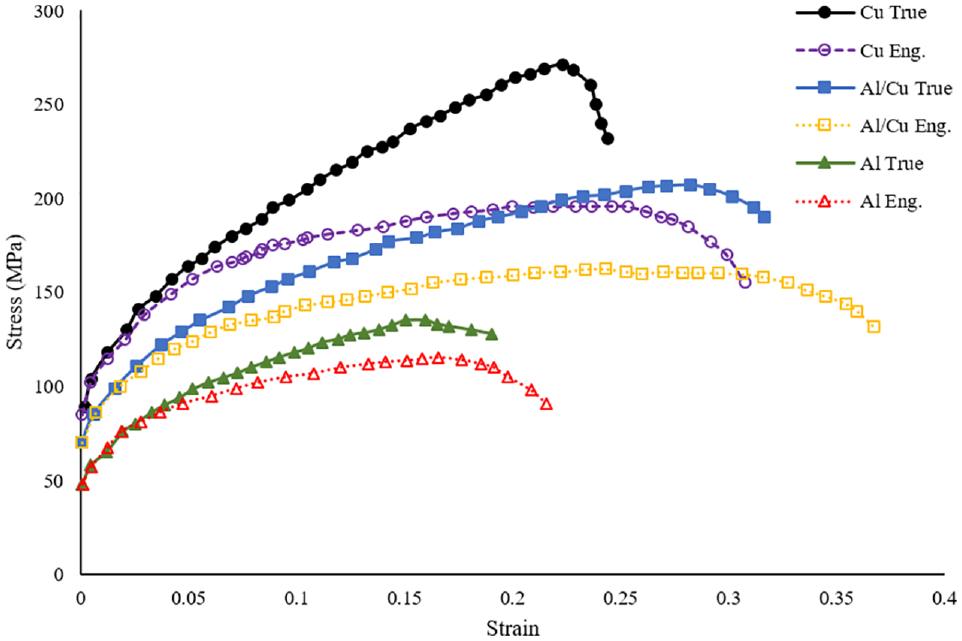
The stress-strain curve of Al/Cu two-layer sheet and monolithic Al and Cu sheet.
The forming setup was assembled, as shown in Figure 3. First, the coil was wounded nine turns in a double layer and then located in the coil bed. The coil, lower plate, upper plate, and die were assembled coaxially. Assembly details are shown in Figure 3. The insulation pad was located on the upper plate below the sheet. This pad separates the upper plate and the sheet.
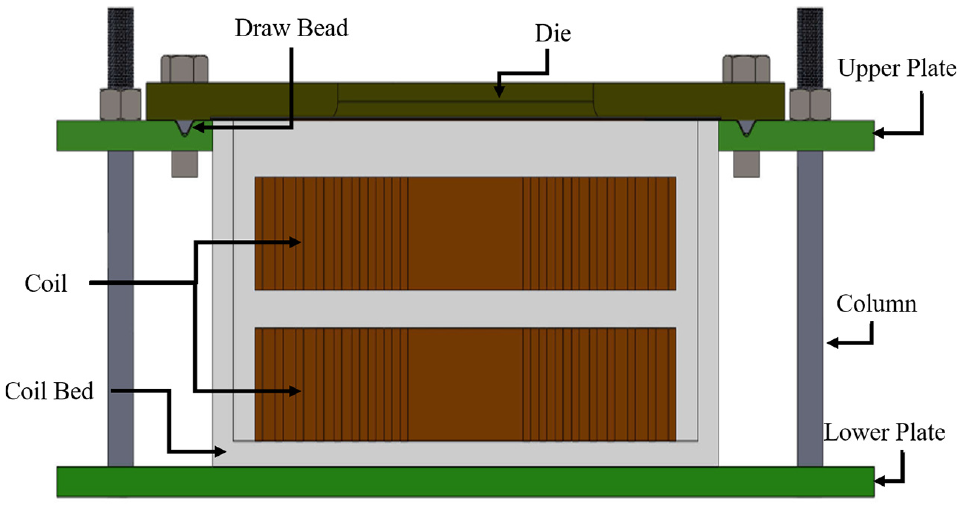
Electromagnetic tool’s structure assembly.
The two-layer sheet production used in the experiment is significant because it should not be separated during the forming process. The explosive joint was used to produce the Al/Cu two-layer sheet. The use of this method for producing a two-layer sheet provides a better bonding between the two layers, and as a result the layers do not separate during the forming process. Each layer’s thickness was determined by observing the layer under an optical microscope with 50X zoom. The thickness of Al was 0.27 mm, and the thickness of Cu was 0.23 mm.
The sheet was cut into different geometries to create different widths. Different load states were created using the different specimen’s width. Figure 4 shows the geometries of the used specimens.
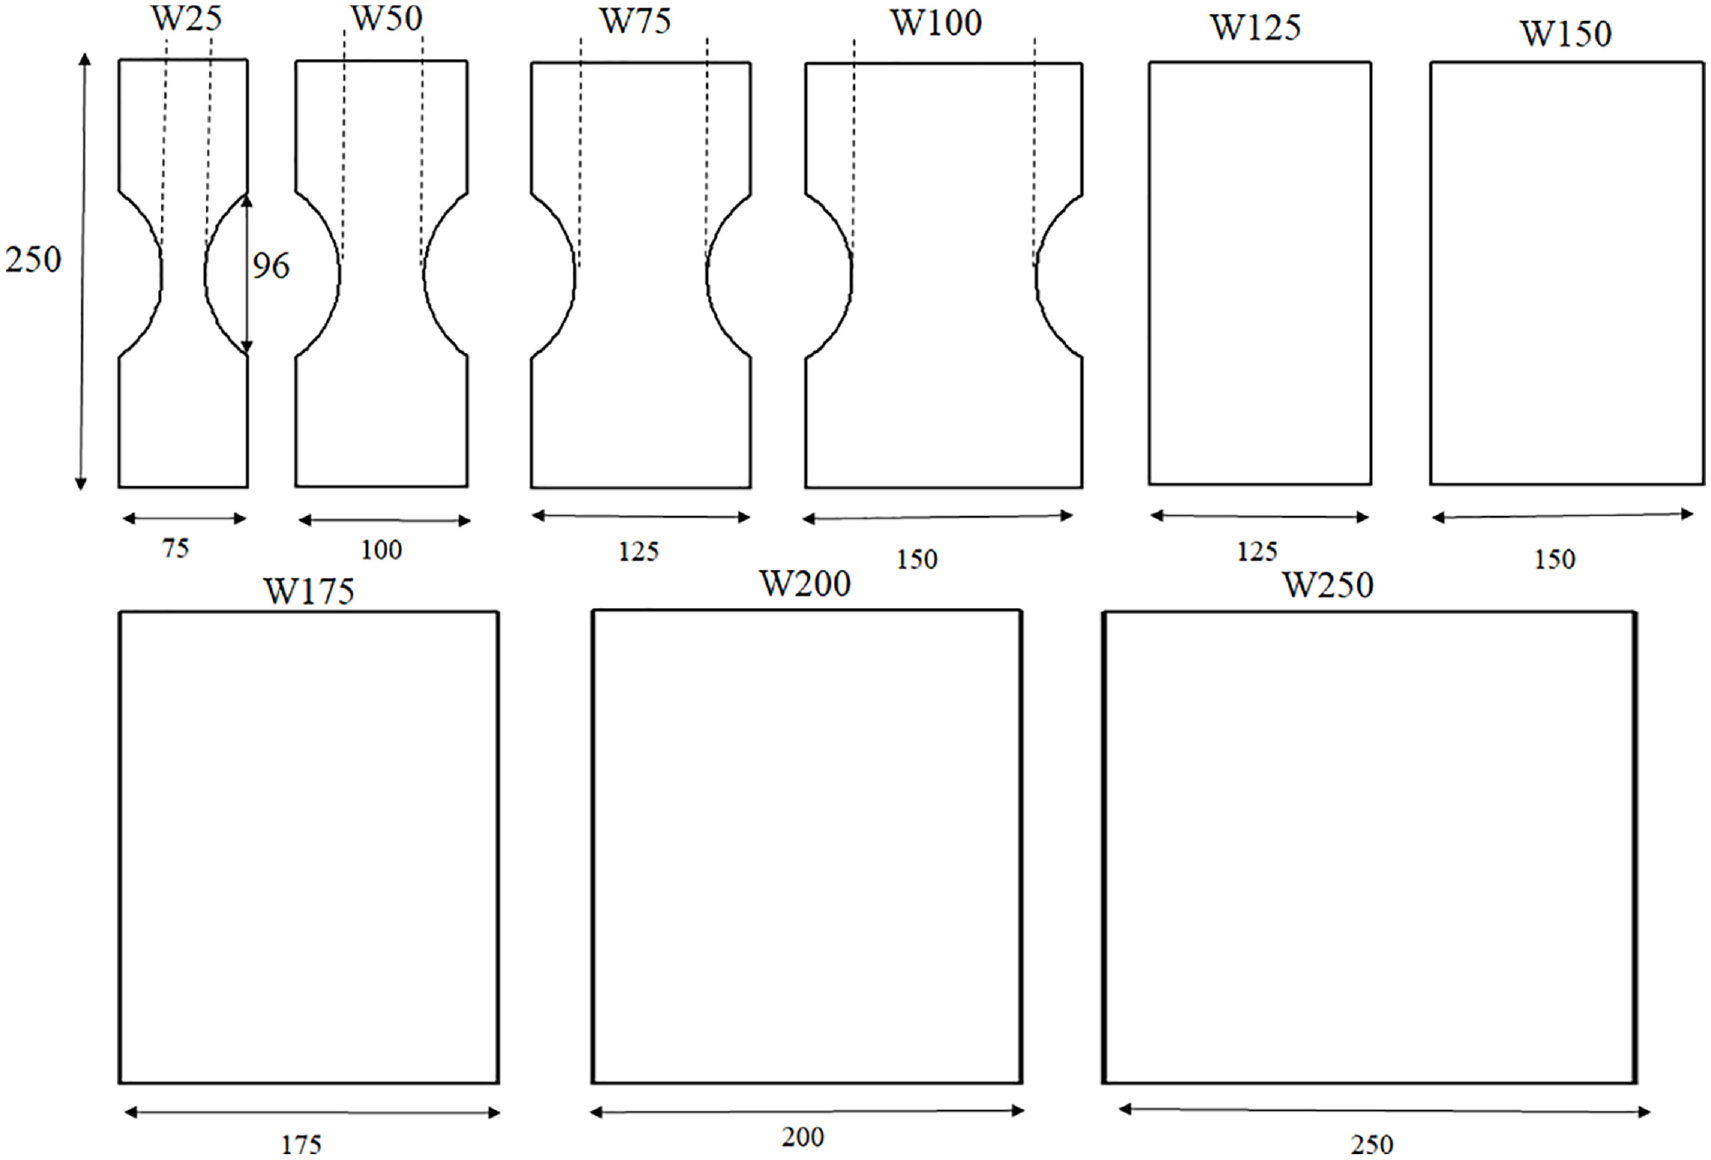
The geometries of the test samples used in the EMF.
The grids are printed on the sheet’s surface with an initial diameter of 3 mm. The major and minor strain were calculated using the Dino-light microscope by measuring the oval diameters on the sheet. Figure 5 shows the deformed workpiece with the grid on the surface.
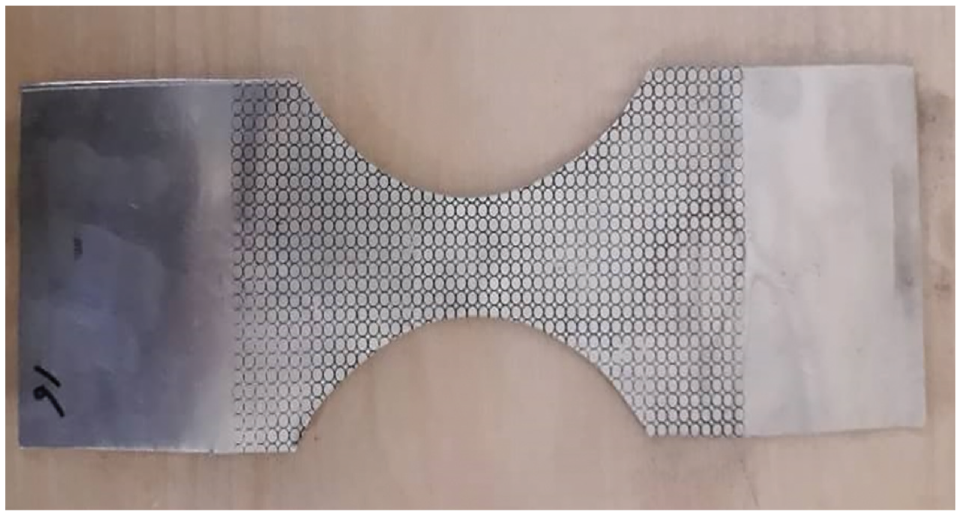
The W25 geometry workpiece with printed grids on the outer surface.
By using equations (1) and (2), the major (
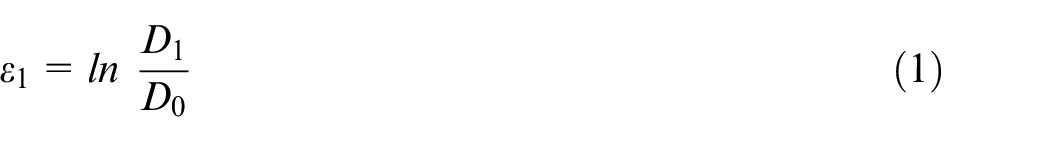
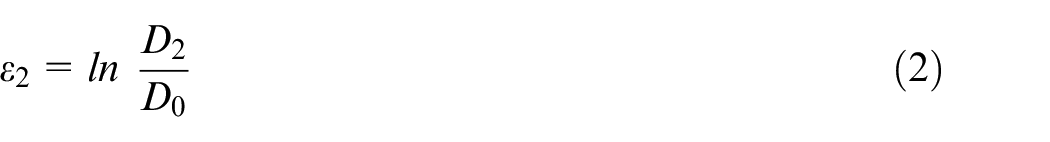
Where,
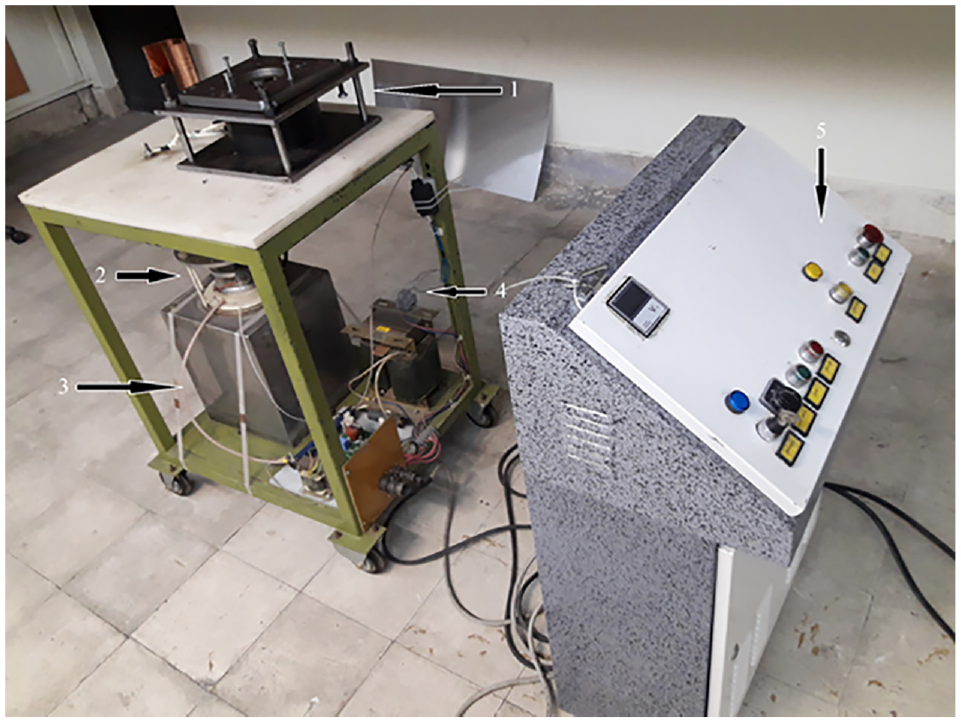
Electromagnetic forming machine.
Finite element modeling
The electromagnetic sheet forming process consists of two fields: magnetic and mechanical structure. In this study, the coupled method was employed for simulation by using Maxwell 14 and ABAQUS 6.13 commercial softwares. The coil design and magnetic simulation were done using Maxwell software. The ABAQUS software was used for the simulation of the mechanical field.
Magnetic simulation
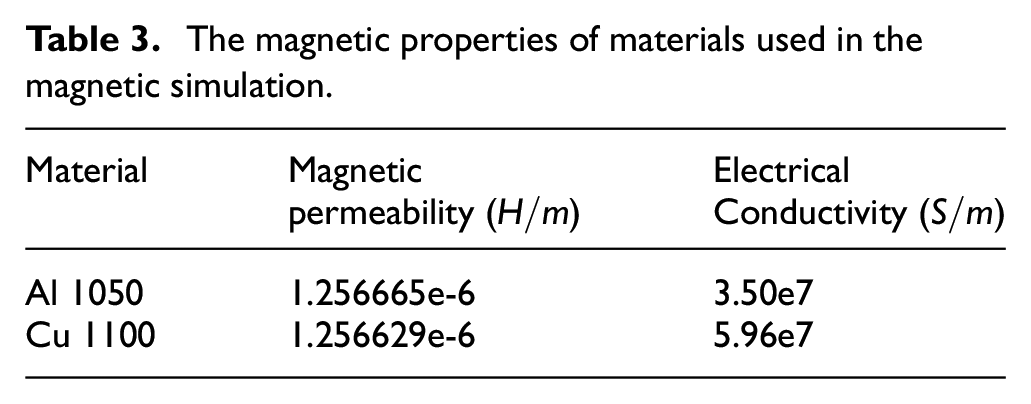
The magnetic properties of the coil and the workpiece are listed in Table 3.
The magnetic properties of materials used in the magnetic simulation.
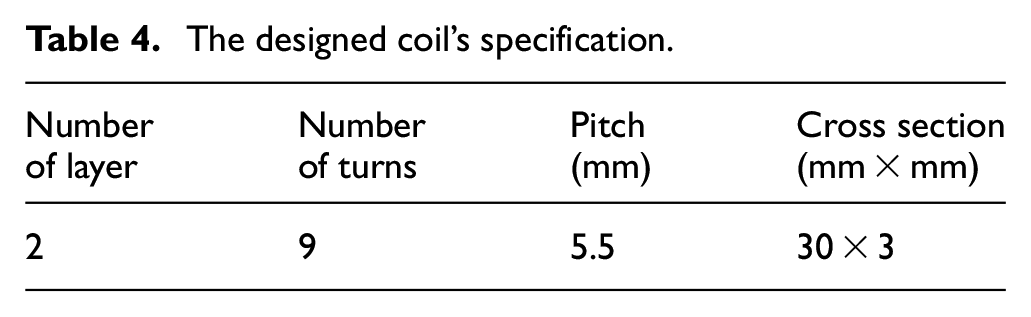
The coil is designed in 9 turns with double layers to produce sufficient magnetic pressure. The upper plate is located on the top of the coil with a 200 mm diameter hole in its center to allow the magnetic field to move through the upper plate. The sheet is placed on the upper plate, and the die is fixed on the sheet by using four screws. The coil specifications are listed in Table 4.
The designed coil’s specification.
Each section of the coil’s turn is set as one coil in MAXWELL software, then all of the coil’s turns are attributed to one winding. The winding is connected to the external circuit modeled in Maxwell circuit software with a 256 µF capacitor bank. A big cylinder of air surrounds the whole model and insulates it from the environment. The Eddy effect should be considered for the sheet, coil, and die. Meshing is done automatically in Maxwell software, and only the size of each element must be entered manually. The elements’ size is considered 50 mm for cylindrical air and 10 mm for the sheets and die in Maxwell simulation. These elements are used for the simulation of magnetic field. The skin depth effect is also considered in the mesh module. The magnetic field is calculated on the sheet at the current’s peak time. Finally, the magnetic pressure is used as a mechanical pressure in finite element software.
Mechanical simulation
The ABAQUS finite element software is used in the mechanical simulation. The explicit dynamic analysis should be considered in the ABAQUS solver because of the non-linear nature of the forming process. The sheet is modeled as a shell, and the die and upper plate are modeled as rigid bodies in ABAQUS. The composite shell section is assigned to each layer. The properties of each layer and its thickness are defined separately for each layer. The bending effect is concluded in the simulation using five integration points throughout the thickness. Due to the lack of separation of the layers during forming, the shear stress between the layers was not considered. Figure 7 shows half of the model of the sheet, die, and upper plate used in ABAQUS software.
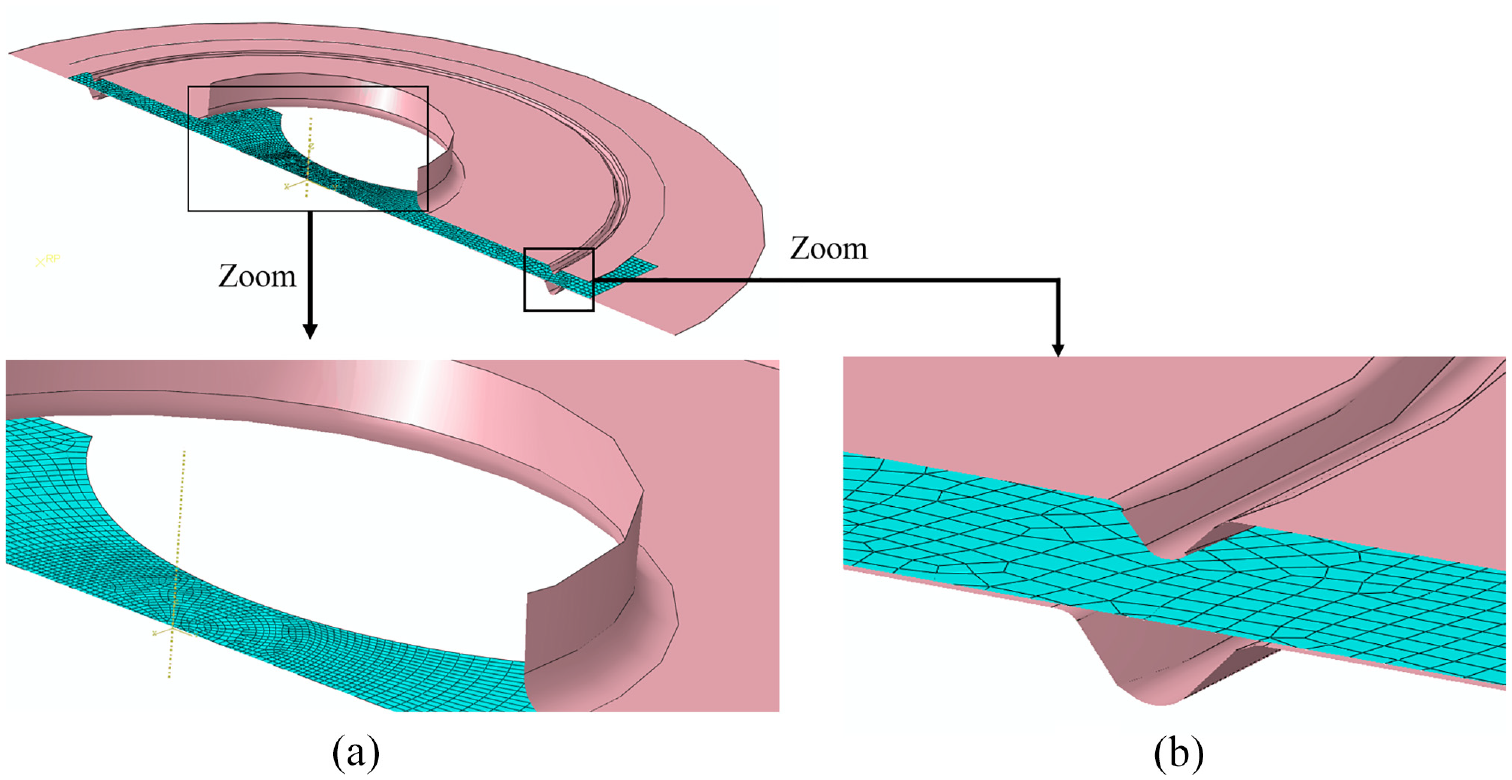
The half of the upper plate, sheet, and the die modeled in ABAQUS software (A: Zoom of the die radius and B: geometry of lock bead).
The electromagnetic forming process has a dynamic condition, and the strain rate is higher than the static condition. The tensile test results are not useful for the simulation of the electromagnetic forming process. The flow stress behavior of materials is modeled using the Johnson-Cook’s plasticity model. 19
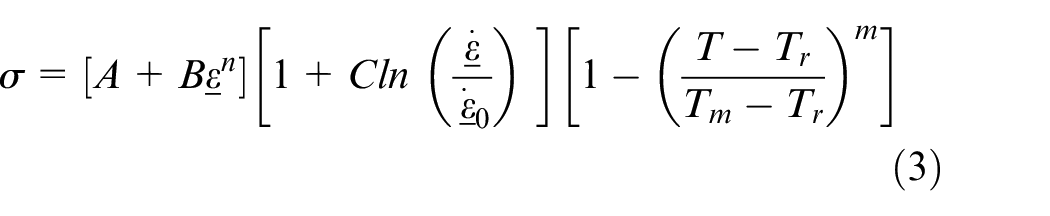
Where
The interaction between the upper plate, die, and sheet is considered a surface to surface contact with a 0.19 coefficient of friction for Aluminum to Steel and 0.15 for Copper to Steel.7,20 The contact between the sheet and the die is only in the entrance radius of the die. The simulation results showed that the effect of friction in this process is not significant because there is no contact between the pressure source and the sheet in the electromagnetic forming process. Two steps were considered to simulate the electromagnetic sheet forming process: the first step for simulating the draw bead force and the second step for the forming process. In the first step, the upper plate moves toward the die and, after that, it is fixed in its position. The draw bead force was applied through four screws and a firm contact between the specimen and the die using the lock bead.
In the second step, the pressure is applied to the sheet. The forming process take place in the discharge current peak time. So, the simulation time (100 µs) coincide with the time of the forming process.
Mesh size analysis was performed by reducing the size of the elements for the sheet (Figure 8). Finally, according to the results, the optimal element size was selected. The element size is finer in the center and larger in the rest. The fine mesh is used only in the center of the sheet instead of the entire surface. In this way, the time of simulation decreases. A circle with a 50 mm radius is considered as the fine mesh on the sheet.
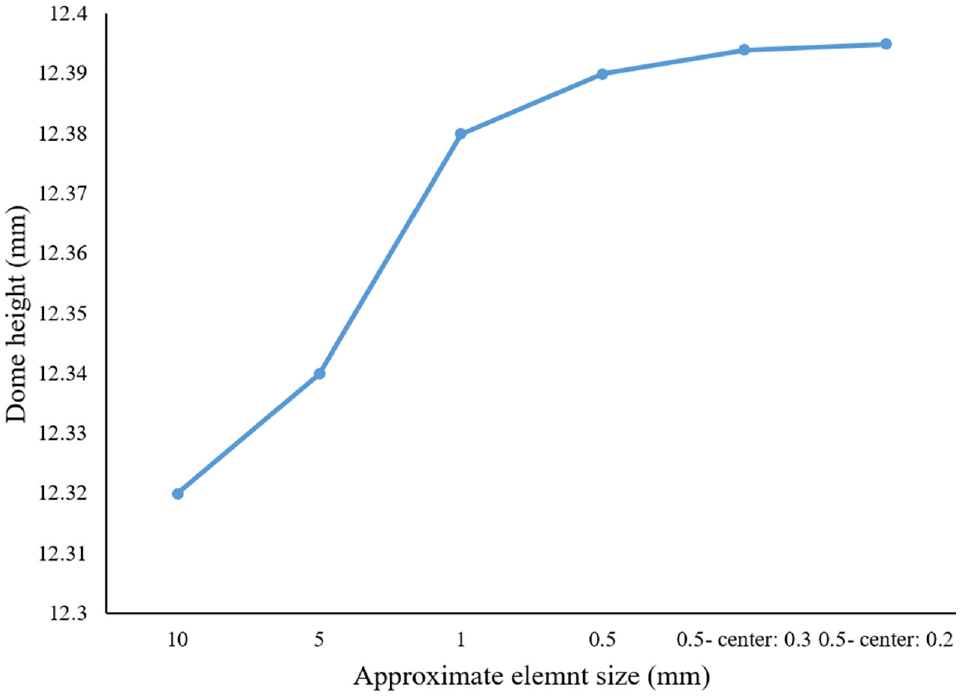
The mesh size verification in the simulation.
Finally, a 4-node doubly curved thin or thick shell, reduced integration, hourglass control, finite membrane strains is set with a size of 0.3 mm in the central section of the sheet. See the authors’ previous article for more information on simulation’s detail in ABAQUS software. 21
The major strain acceleration method is used to predict necking. 7 Figure 9 shows the major strain at various points along a section perpendicular to the necking area.
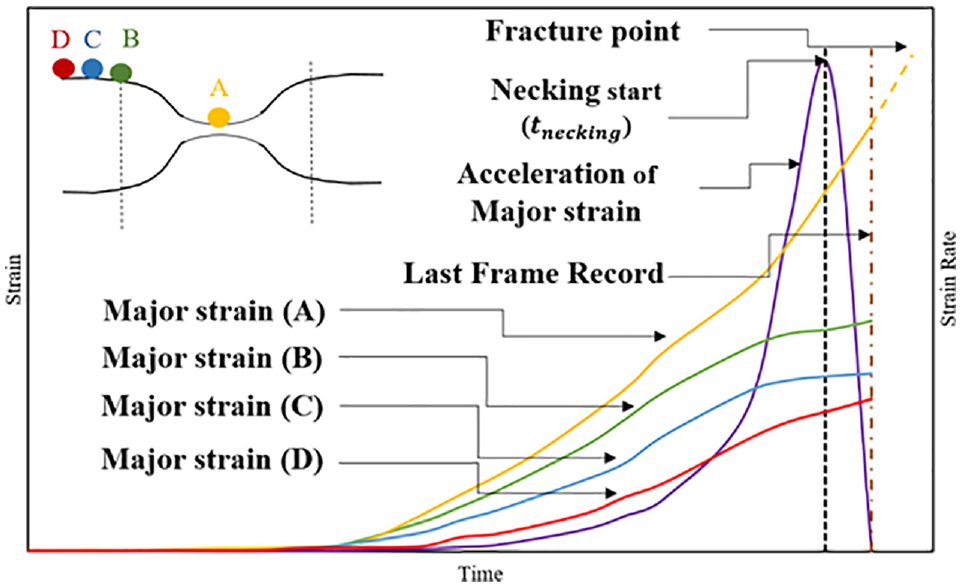
Schematic of the time evaluation of the major strain and necking criterion.
Region A shows the necking zone, and point B shows the point with the greatest strain. Point C is located in the outer region of the necking. The major strain of different points is schematically shown in Figure 9. Immediately the acceleration of the major strain reaches a maximum value for point A, and after that decreases until the fracture. The peak time of acceleration of the major strain shows the necking time. Finally, the major and minor strain for point A is calculated in the necking time and considered as one point of the forming limit diagram. The test specimens with different geometries are considered to create different strain states from uniaxial traction to balanced-biaxial traction, according to Figure 4.
Calibration of materials constants
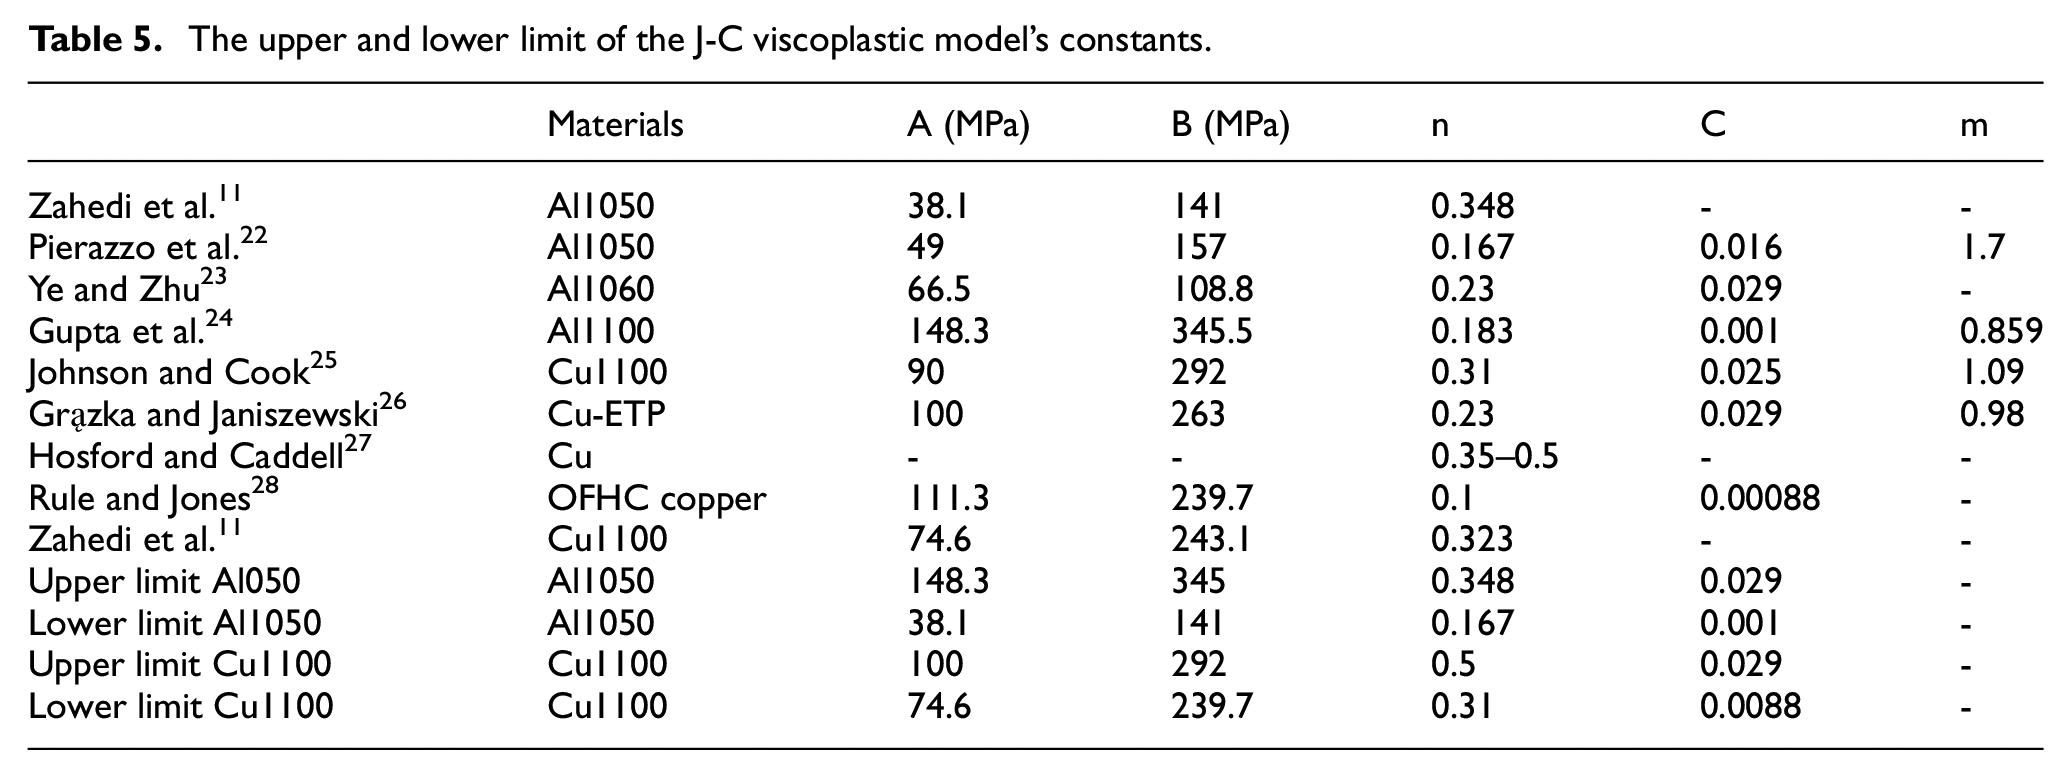
The Johnson-Cook viscoplastic model constants extracted from references are not suitable for the Al 1050 and Cu1100 used in this research. The split Hopkinson bar test is needed to calculate the material constants in a high strain rate. This test was not available for the researcher. The calibration method was done to calibrate the viscoplastic model constants for the Al and Cu sheet used in the experiment. The range of upper and lower limits for the four constants of A, B, C, and n was selected according to Table 5.
The upper and lower limit of the J-C viscoplastic model’s constants.
Response Surface Method (RSM) was used to calibrate the J-C damage constants. Response surface designs are usually used to develop, improve, and optimize a process. The minimization of a response function is used to calibrate the parameters. The response function was defined using the following equation:
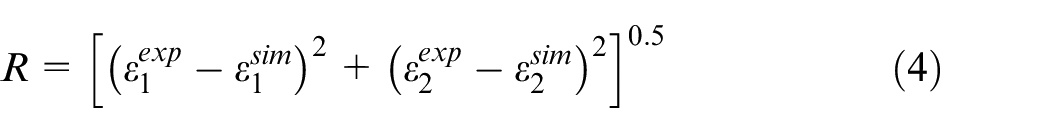
Where
The major strain, minor strain, and the response of each test for Al1050.
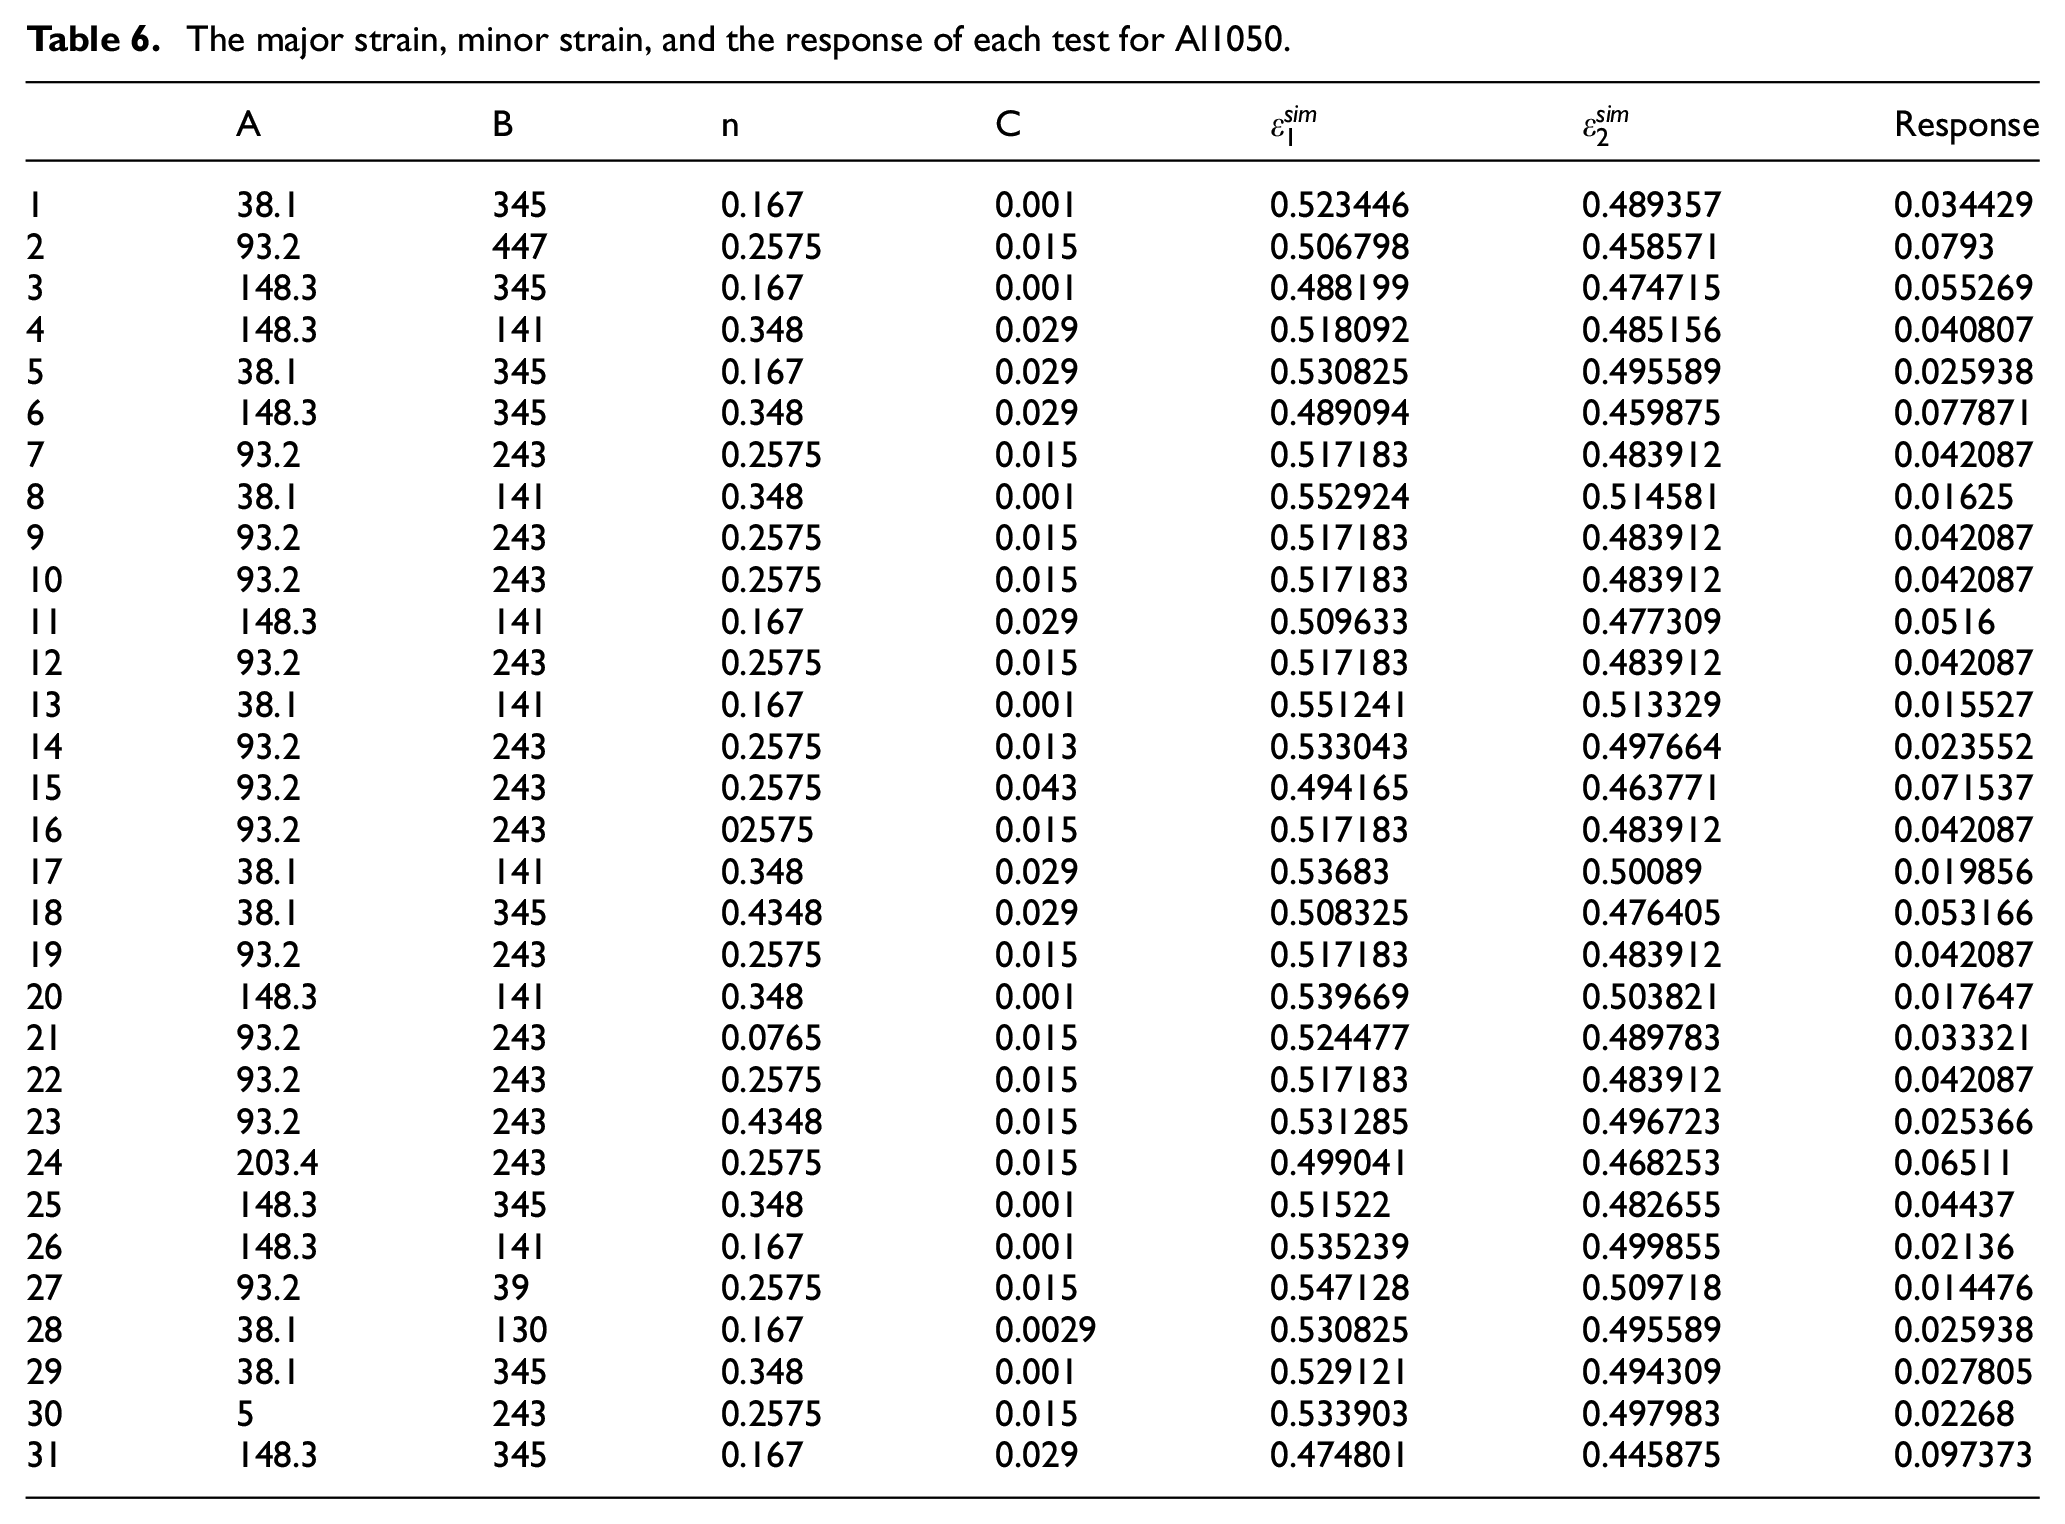
The results of the ANOVA are presented in Table 7 for Al 1050.
ANOVA table of response for calibration of J-C viscoplastic constants.
The fact that the model’s lack of fit was not significant (p > 0.1) indicates the model’s suitability. The goodness-of-fit statistics in the model examined are listed in Table 8 for Al 1050. These results are used to determine how well the model fits the data.
The regression of the selected model for the Johnson-Cook viscoplastic model’s constants.
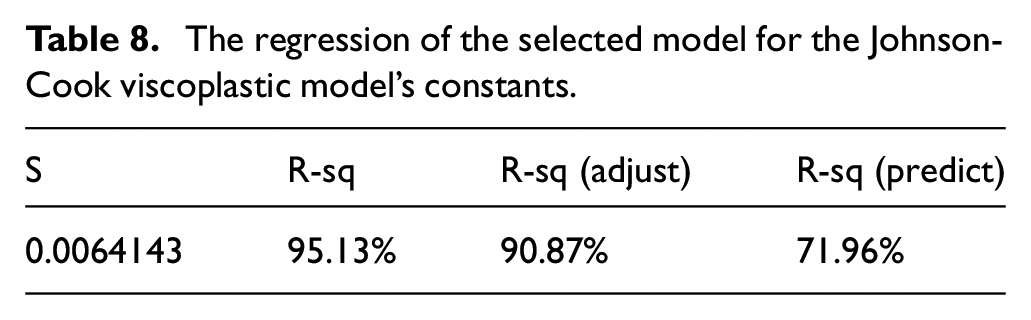
S represents the amount of difference between the data values and the true response surface. Lower values of S indicate a better description of the response model. Higher values of R indicate that the model has been able to fit more data. The adjusted R-value represents the number of predictors in the model. This value helps the researcher choose the correct model. Predicted R is more useful than the adjusted R for comparing the models. The same method was used for the Cu sheet to calibrate the J-C viscoplastic constants.
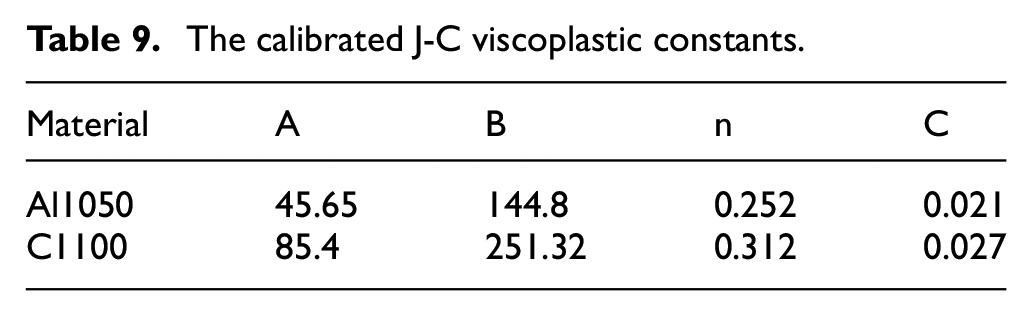
Table 9 shows the calibration results for the J-C viscoplastic constants.
The calibrated J-C viscoplastic constants.
Fracture criterion
In the sheet metal forming process, the first aim of the process is maximum deformation. Although producing a workpiece without any cracks and fractures is more important than maximum deformation. There is some criteria for predicting damage and fracture. Following Shabanpour and Fallahi Arezoodar, 16 the Johnson-Cook damage criterion for the electromagnetic forming process is in agreement with the experimental results. The constant parameters of this model for different metals are available in other studies. For predicting fracture in this process, the Johnson-Cook damage criterion was used as equation (5).
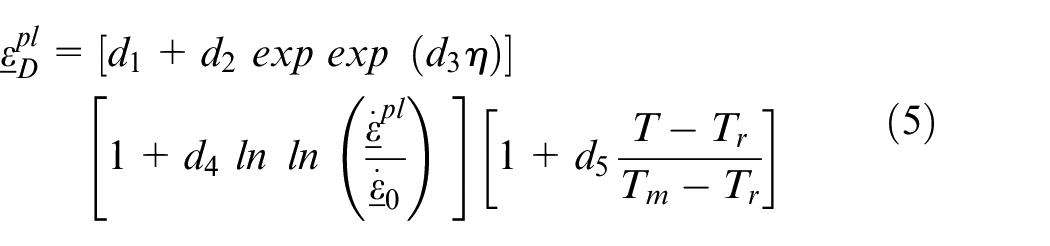
Where
Calibration of the J-C damage model’s constants
The J-C damage model constant parameters’ calibration method for fracture prediction is similar to viscoplastic constants’ calibration. The range of upper and lower limits for the four constants of
The upper and lower limit of the J-C damage model’s constants.
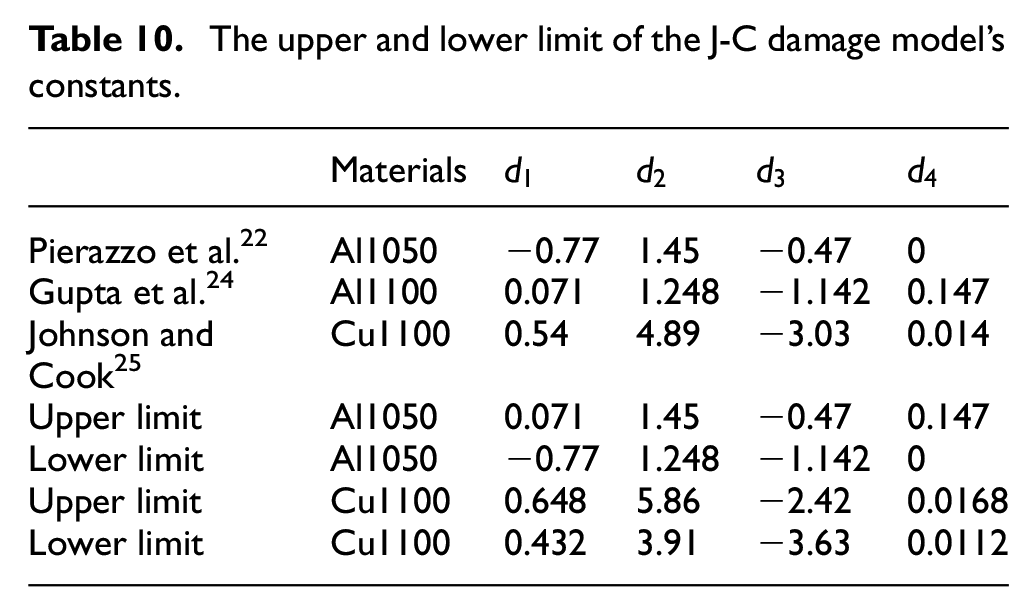
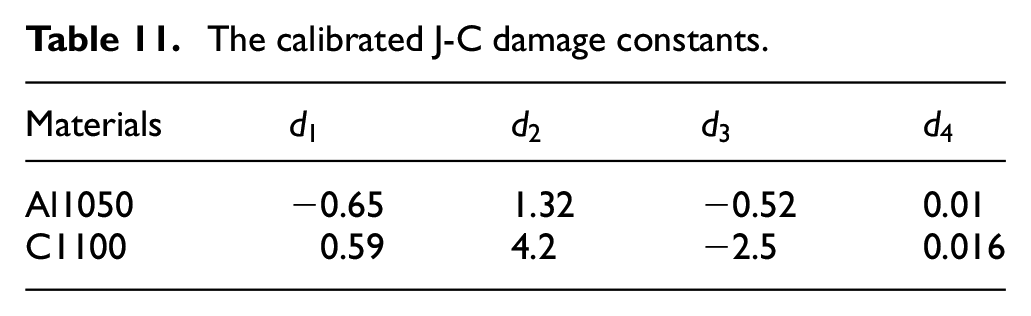
The temperature increasing is negligible in this process, so
The calibrated J-C damage constants.
After the calibration process, the simulations for Al/Cu two-layer sheet run according to the simulation section and using the J-C damage constants calibration results. The sheet became fractured when the J-C damage amount reached to one, but the process continued until the element was deleted. The fractured time was considered the time that the J-C damage reached one.
Result and discussions
In the following, the terms “AC” and “CA” are used as lay-ups in which the Aluminum and Copper layers are closer to the coil. Figure 6 shows the magnetic pressure applied to the sheet in 5500 V discharge voltage in both the AC and CA lay-up. Because of its symmetry, only half of the chart was drawn in Figure 10.
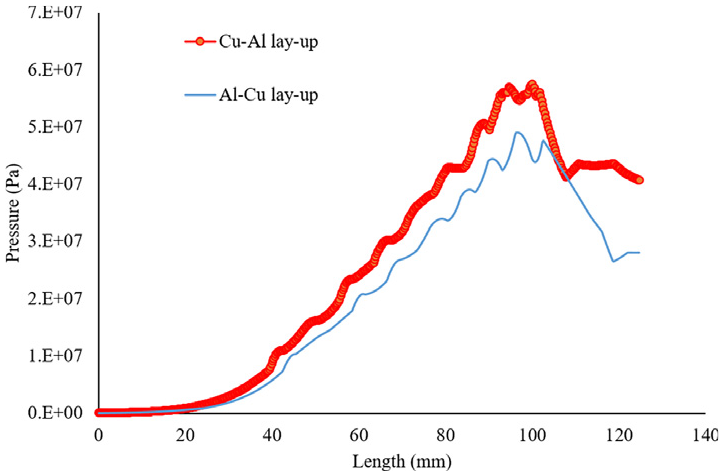
Magnetic pressure for the AC and CA lay-up in 5500 V with 0.5 mm initial layers thickness.
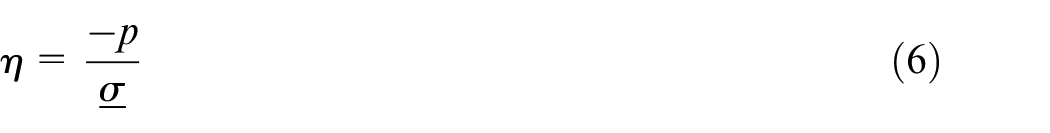
As shown in Figure 10, the CA lay-up has a higher magnetic pressure than the AC lay-up. Cu’s electrical conductivity is greater than Al, so a higher eddy current is created in the Cu layer in comparison to the Al layer. According to the Maxwell equation reported in Correia et al., 30 the magnetic field in the Cu layer increased in comparison to the Al layer. Finally, the magnetic pressure increased in the CA lay-up more than the AC lay-up. The magnetic pressure is minimum in the center of the sheet. This phenomenon occurred because of the existence of two magnetic fields intersecting on the sheet’s left and right sides. The sheet’s surroundings drive the center of the sheet. The inertial force has a vital role in forming the sheet in EMF. 31
The driver sheet was used below the two-layer sheet to eliminate the differences in the electrical layers conductivity. The driver plate is located on the coil under the two-layer sheet. The magnetic pressure is applied to the driver sheet, and the driver sheet moves away from the coil and impacts the two-layer sheet and forms it. Figure 11 shows the driver sheet and two-layer sheet in the electromagnetic forming. All of the experimental tests were done using the driver sheet below the two-layer sheet.
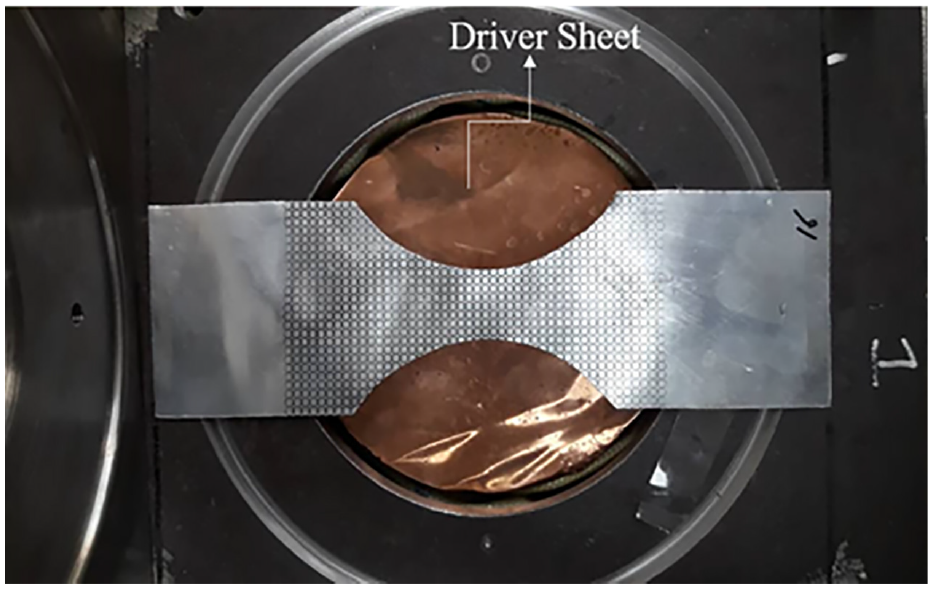
The driver sheet used to form the two-layer sheet.
Table 12 shows the experimental and simulation maximum dome height for W25 and W200 in three discharge voltages using calibrated constants.
The maximum dome height calculated in experiment and simulation for W25 and W200 workpiece in AC and CA lay-up.
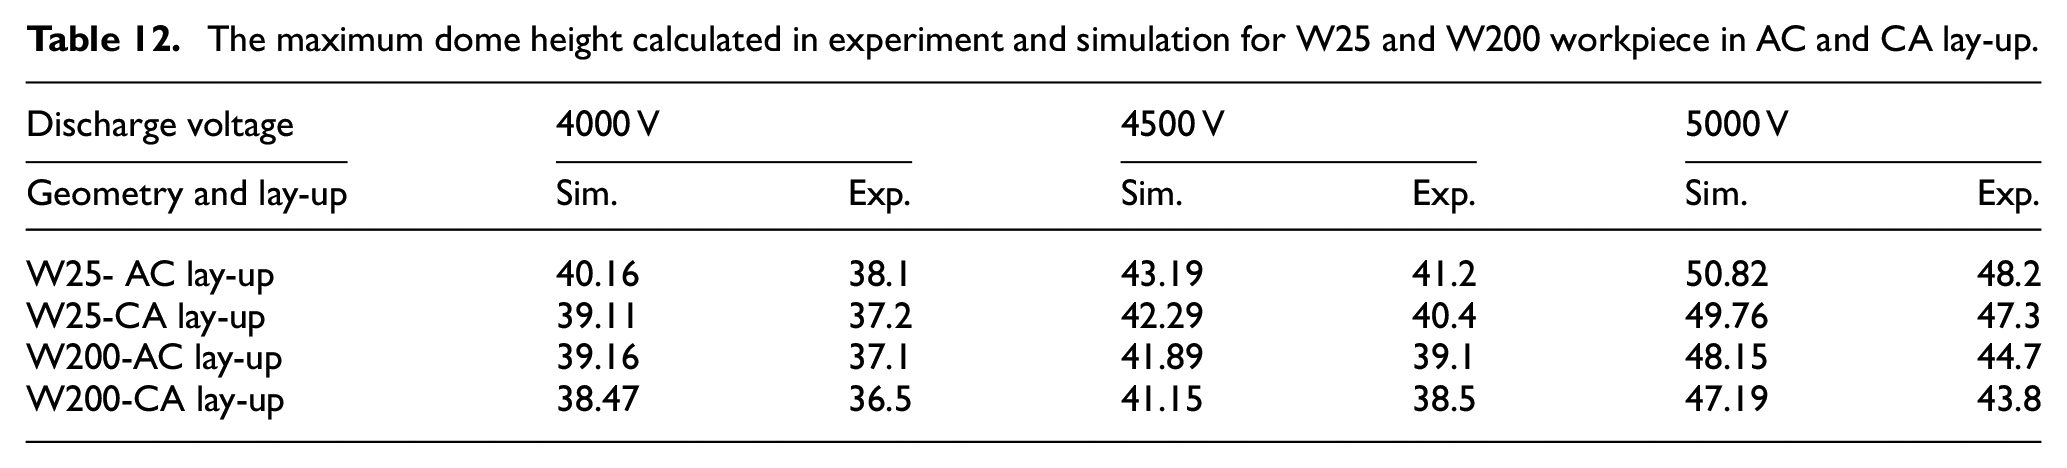
Table 12. shows that after using the calibrated J-C viscoplastic constants the error between the experimental and simulation results for the dome height is near 5.5%. This error is due to the J-C viscoplastic constants’ calibration for one geometry and the energy loss in the coil and wires throughout the experiment.
Figure 12 shows the acceleration of major strain in W150 in a two-layer sheet.
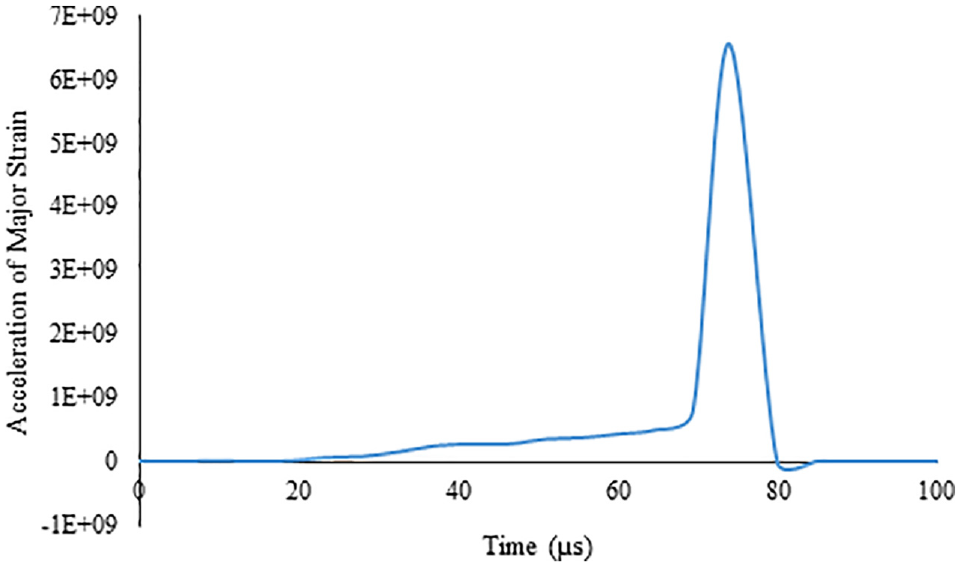
Acceleration of major strain to detect the start of necking.
As shown in Figure 8, the acceleration of the major strain gradually reduces until the acceleration of the major strain’s evolution diminishes. Therefore, the boundary of the necking zone can be determined.
Figure 13 shows the plastic strain in the W175 Al/Cu two-layer sheet for AC lay-up with an experimental test workpiece.
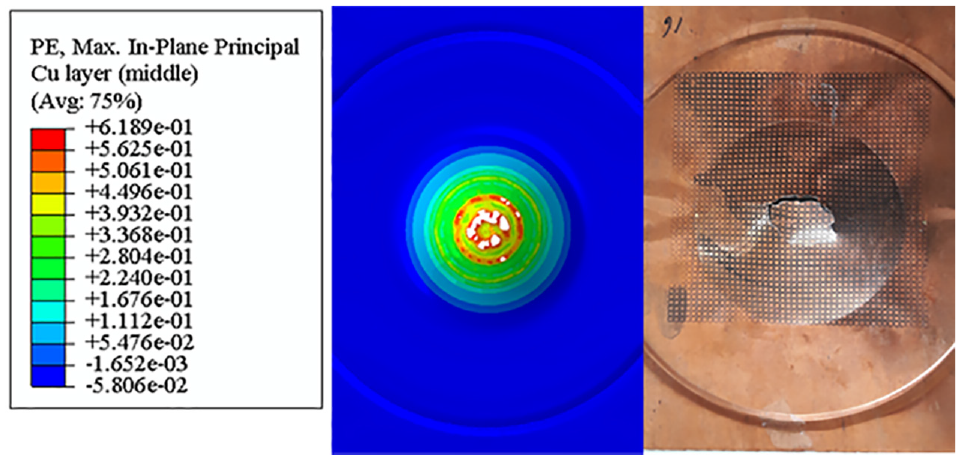
The experimental and simulated Al/Cu two-layer sheet for W175 geometry.
The location of the necking is near the center of the sheet. The plastic strain is maximum near the center, where maximum pressure is applied to the sheet. Controlling the necking is challenging in EMF because the magnetic pressure cannot be cut off during the necking time. The necking time and its discharge voltage are predicted by using simulation results for each geometry. The predicted discharge voltage was used throughout the experiment to create necking in the two-layer sheet. The error between the simulation and the experiment makes it impossible to predict the necking accurately. In this case, necking may not occur, or the sheet may fracture. The strain measured near the crack was used to create NFLD and the strain near the fracture line was used to create FFLD.
Figure 14 shows the FLD of necking for the Al/Cu two-layer sheet in the AC and CA lay-up in electromagnetic forming.
The NFLD of the two-layer sheet in the AC and CA lay-up in experiment and simulation.
It is evident from Figure 10 that the forming limit diagram of the AC lay-up is higher than the CA lay-up. The Cu layer plays a role as a protective layer for the Al layer with a lower formability. In this method, the necking occurs with a delay in the two-layer sheet. During the two-layer sheet’s electromagnetic forming, the outer layer is under tension, and the inner layer is under compression. The tensile localization occurs with delay in the two-layer sheet when the outer layer has a higher tensile strength. The two-layer sheet’s formability increased when the Cu layer was used in the Al/Cu two-layer sheet’s outer surface.
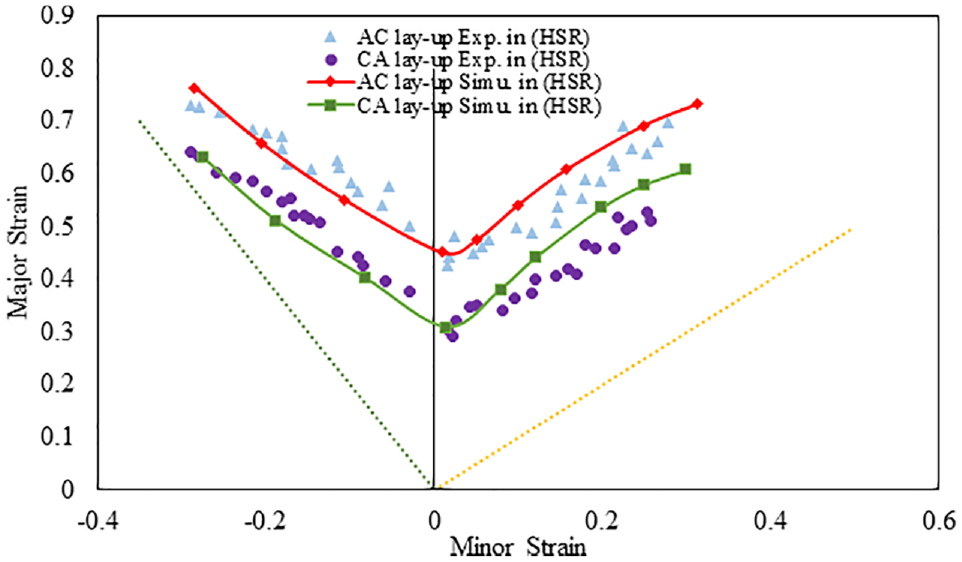
The NFLD of the Al/Cu two-layer sheet in the high strain rate process (HSR) is compared to the static condition in Figure 15. The NFLD of the Al/Cu two-layer sheet in static condition for 1 mm sheet thickness was reported in Zahedi et al. 11
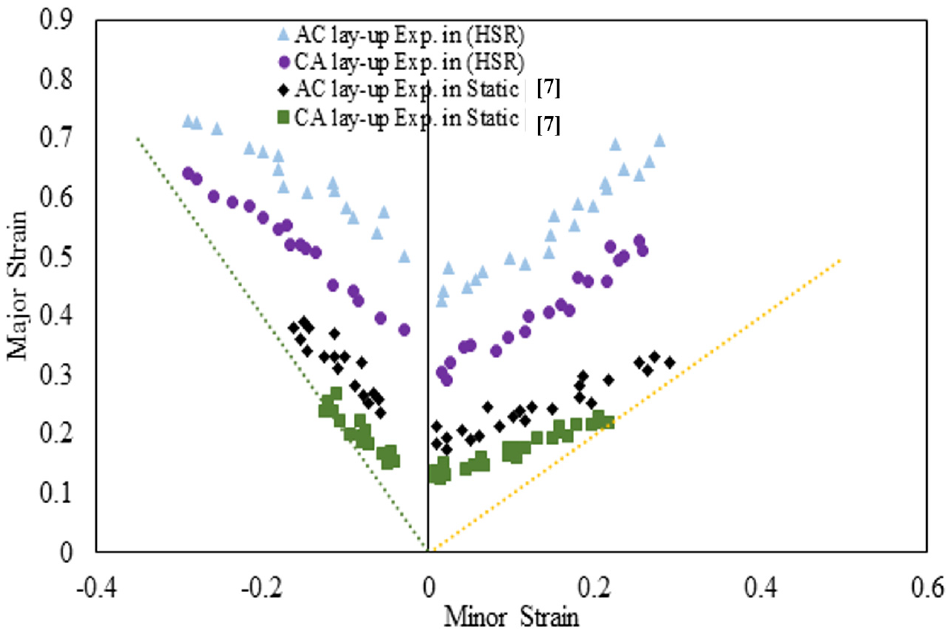
The NFLD of the two-layer sheet in the AC and CA lay-up in static and high strain rate condition.
Figure 15 shows that the NFLD of the two-layer sheet increased in the high strain rate process in comparison to static conditions. It is worth noting that the strain rate has a remarkable effect on the right-hand side of the NFLD. This effect is not notable on the left-hand side of the NFLD. The improvement of NFLD in the in-plane strain condition is about 125%.
Figure 16 shows the scanning electron microscope (SEM) image of the Al/Cu two-layer sheet’s fracture section after the electromagnetic forming process.
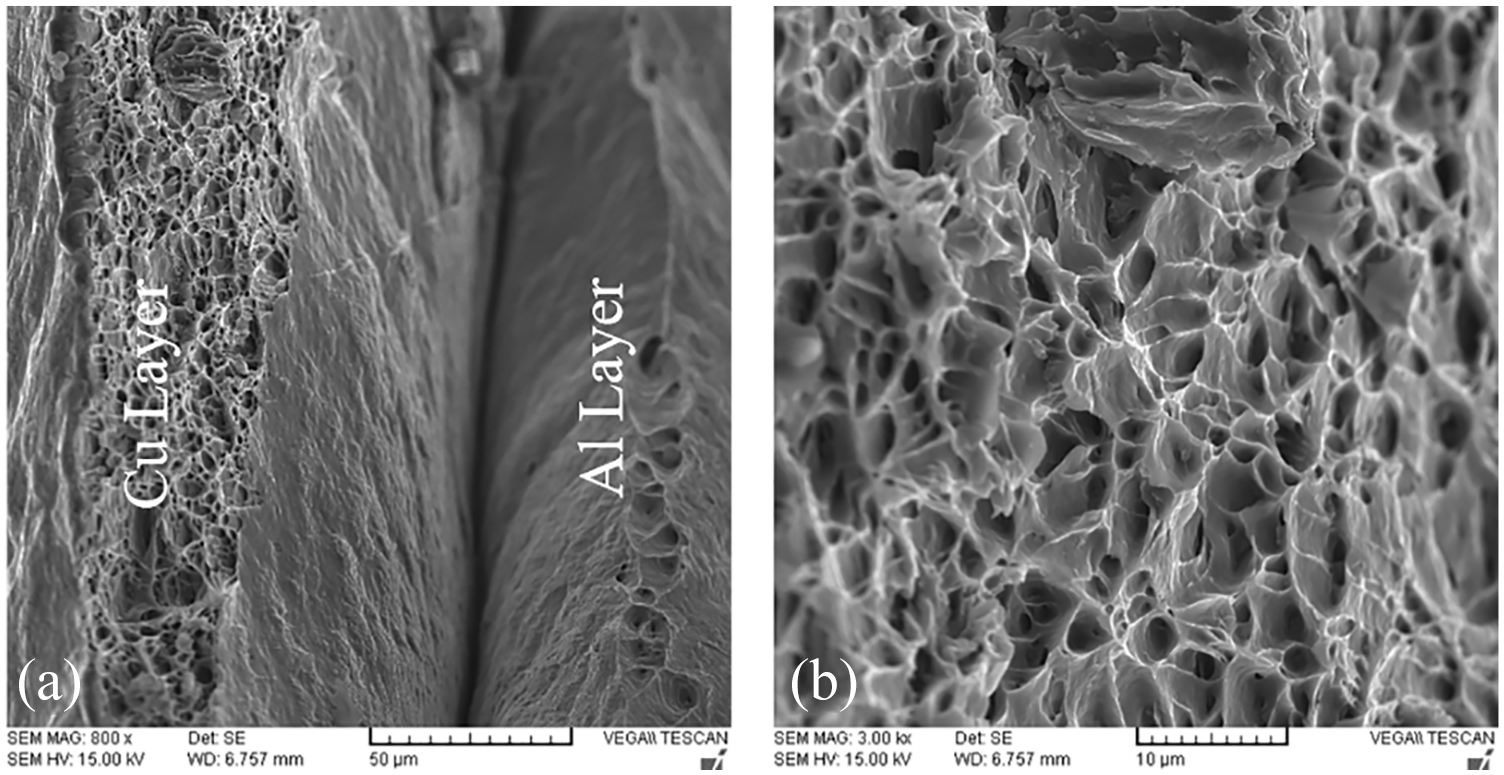
The SEM micrograph showing: (a) the Al/Cu two-layer sheet fracture section and (b) higher magnification features showing details of dimples in the Cu layer.
As shown in Figure 16, the fracture section’s dimple structure in the Cu layer indicates a ductile fracture. Cavities arise from the enlargement of inclusions. As these cavities enlarge, the material is necked between them. The Al layer has a dimple structure in some fracture sections. It is indicated that the Al layer does not have ductile fracture in all of the regions. It is also evident from Figure 16 that the separation of the layers does not occur during the forming process. The two layers stick together until the end of the process.
Figure 17 shows the fracture strains for the two-layer sheet in the AC and CA lay-up. For better comparison, the necking strains of the two-layer sheet are also drawn in the chart. The fracture strain was calculated by using the method described in the fracture section. The experimental fracture strain was measured using the changing dimension of the sheet grids that are closer to the fracture line.
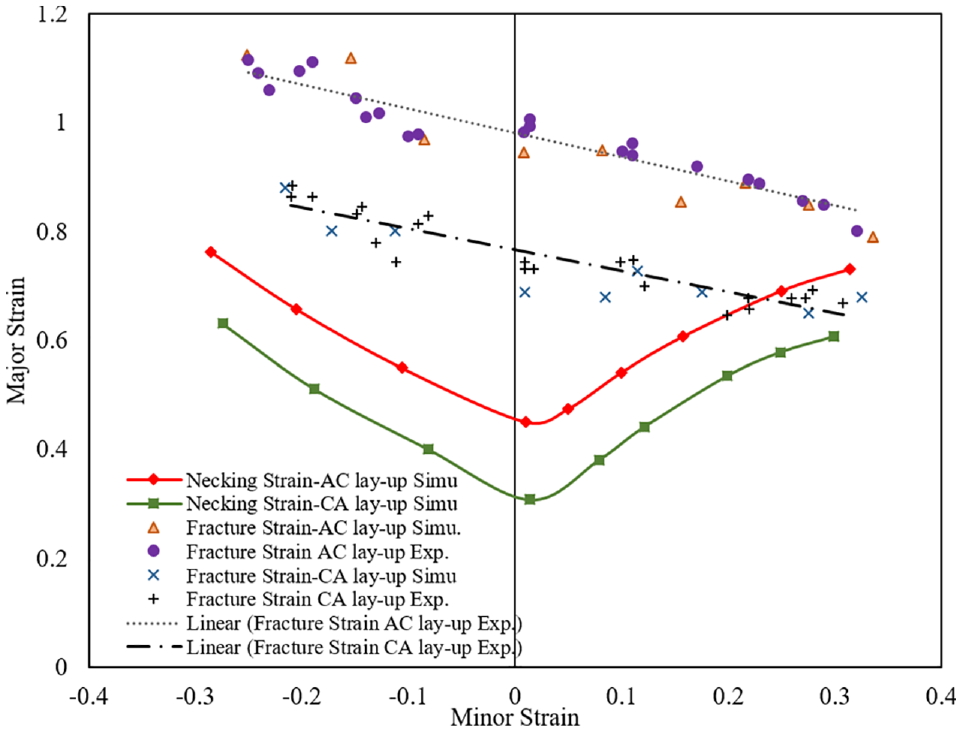
The FFLD and NFFL of Al/Cu two-layer sheet for the AC and CA lay-up in simulation and experiment.
Figure 17 shows that the two-layer sheet fracture strains in the AC lay-up are higher than the CA lay-up. As shown in Figure 17, the major strain is higher on the left side than on the right side of the FFLD. Also, the FFLD is linear and has a negative slope. The prediction of fracture strains on the left side is better than the right side in the FFLD. Generally, the simulation results are in an acceptable agreement with experimental results. The fracture strain in the plane strain condition in the AC lay-up is 36% greater than the CA lay-up due to the better resistance of copper toward fracture in tensile stress. Zahedi et al. 11 stated that this difference for the Al/Cu two-layer sheet is about 50% for the AC and CA lay-up. The difference in errors is due to different process types and different sheet thickness and test conditions.
Conclusion
The forming limit diagram of the Al/Cu two-layer sheet in high strain was investigated using electromagnetic forming. The necking strain was calculated, and the NFLD was drawn using the major strain method’s acceleration in finite element simulation. The Johnson-Cook damage model’s constants were calibrated for Al 1050 and Cu 1100 to predict fracture strain to draw the FFLD. In summary, the following results were obtained from this study:
The necking forming limit diagram and fracture forming limit diagram were predicted for the Al/Cu two-layer sheet numerically using the acceleration of major strain and the Johnson-Cook damage model, respectively.
The response surface method was used to calibrate the Johnson-Cook viscoplastic constants for a monolithic Al and Cu layer. These constants were used for Al/Cu in electromagnetic forming simulation. Under these conditions, the error between the simulation and experimental results reached about 5.5%.
The Johnson-Cook damage model was able to accurately predict the fracture time of the Al/Cu two layer sheet in electromagnetic forming. The fracture strains at the predicted time were in good agreement with the experimental results.
The plastic strain in the outer layer is always more significant than the inner layer in the Al/Cu two-layer sheet’s electromagnetic forming in both lay-ups. However, the Johnson-Cook damage is higher in the Al layer than the Cu layer due to Al’s lower formability.
The NFLD of Al/Cu two-layer sheet in the AC lay-up is higher than the CA lay-up. When Cu is in the outer layer, it plays a protective role in tensile stress, and finally, the necking occurs by delay in the AC lay-up. It is suggested that for the forming of two-layer sheets, the layer with more ductility be located on the tensile stress side.
The fracture strain for Al/Cu two-layer sheet is linear and has a negative slope. The fracture in a plane strain condition is about 36% higher for the AC lay-up than the CA lay-up. The difference between the necking strains and the fracture strains is greater for the left side than the right side of the forming limit diagram.
Footnotes
Declaration of conflicting interests
The author(s) declared no potential conflicts of interest with respect to the research, authorship, and/or publication of this article.
Funding
The author(s) received no financial support for the research, authorship, and/or publication of this article.
Availability of data and material
All data generated or analyzed during this study are included in this published article.
Code availability
Custom code is not used in this research.