
Abstract
In order to enhance FE prediction capability, researchers are presently showing interest in applications of non-associated flow rule (NAFR) coupled with Hill48 quadratic function in different sheet metal forming operations. In this work, the concept of NAFR based model was implemented for the first time in FE simulation of deep drawing of DP980-IFHS tailor welded blanks (TWBs) of coated and uncoated sheets. The NAFR model was formulated using two approaches: namely, stress-value based Hill48 as yield function and R-value based Hill48 as the plastic potential function in the first approach, and the vice-versa in the second approach. Also, the classical associated flow rule (AFR) based approach coupled with the anisotropic Hill48 yield model was implemented in the FE simulation for comparison purpose. For improving the prediction accuracy, a mixed hardening equation by combining Voce and Swift hardening law was incorporated as the constitutive equation. It was found that FE simulation implementing the NAFR approach predicted the deep drawing behaviour of the parent materials and TWBs more accurately compared to that of the AFR approach.
Introduction
Over the years, several quadratic/non-quadratic and isotropic/anisotropic yield models were proposed by the various group of researchers for the accurate modelling of material behaviour, including Hill series,1,2 Hosford series, BBC series, Barlat series and many more 3 with a gradual increase in complexity to include more anisotropic information. Both Yld2000-2D 4 and BBC2003 3 yield models, requiring eight anisotropic data, dominates the recent literature on sheet metal forming due to their accurate prediction of material flow and subsequent failure during various complex sheet forming problems. As an alternative approach, researchers implemented the non-associated flow rule (NAFR), where the yield function and the plastic potential function are not assumed to be identical. Instead of the application of classical associated flow rule (AFR), NAFR is implemented to increase the scope of involving more anisotropic parameters.5–7 One of the pioneering research on NAFR was published by Stoughton, 8 which was based on the Hill48 quadratic yield function, and the proposed approach was able to predict variation in R-values and yield strengths along RD (rolling direction), 45° to RD (diagonal direction, DD) and 90° to RD (transverse direction, TD), simultaneously. It is to be noted that the validity of AFR or NAFR cannot be experimentally established directly, and the fundamental theorems, including uniqueness of stress distribution, stability of plastic flow, and uniqueness of a strain and stress state are mostly used to validate AFR assumption. Stoughton argued the validity of NAFR by proving the same fundamental theorem using the proposed NAFR. Recently, an NAFR model based on Hill48 and Yld2000-2d yield functions was developed to successfully predict the numbers of ears in the case of cylindrical deep drawn cups from aluminium alloy AA2090-T3 (6-ears) and AA5042 (8-ears). 9 In this research work, a symmetric stiffness modulus was also developed for the NAFR formulation. Although, most of the studies related to NAFR mainly used R-value based function as yielding criterion and stress-based function as potential function. In the study reported by Kim et al., 10 stress based Hill48 was used as the yield criterion and the Lankford anisotropy based Hill48 was used as plastic potential function to describe the thinning development in the hole expansion experiment.
However, all the studies related to the application of NAFR based material model were primarily conducted on single monolithic materials. Application of NAFR based material models for tailor welded blanks (TWBs) is not reported in the available open literature. It is useful to mention that the TWBs are one of the important breakthroughs for automotive industries in achieving fuel efficiency by reducing car body weight without compromising passenger safety. 11 TWBs are composed of sheet metals of different grades, sheet gauges, and surface conditions, most preferably by laser welding or friction stir welding, to optimise material usage.12–14 In general, the component blanks of the TWB and the weld zones are modelled using AFR type material models with mostly Hill4815–17 and Yld89 models1,18 as the yield functions. Contrary to the recent trends in sheet metal forming simulation, implementation of more advanced material models (Yld2000-2d, BBC2003, etc.) is relatively rare in the case of TWBs19,20 as the requirement of the number of material data is increased, and this needs more testing.
With the above-mentioned background, it can be comprehended that the NAFR approach offers an alternative to include a greater number of anisotropic material data even with the quadratic Hill48 yield function. Hence, in the present study, the following major objectives are identified:
The development of the FE model using the Hill48 based NAFR approach in combination with mixed hardening law (Swift-Voce) for prediction of non-uniform deformation behaviour of DP980-IFHS TWBs under deep drawing conditions.
Understanding the difference in prediction with the implementation of two types of NAFR approaches: viz. the R-value based Hill48 as yield function along with stress based Hill48 as the plastic potential function in the first case, and stress based Hill48 as the yield function in combination with R-value based Hill48 as the plastic potential function in the second case.
Validation of the FE predicted results with the experimental results from the deep drawing test of DP980-IFHS TWBs such as cup edge undulation, weldline movement and thickness distribution of the cup wall.
Experimentations
Selection of materials and laser welding
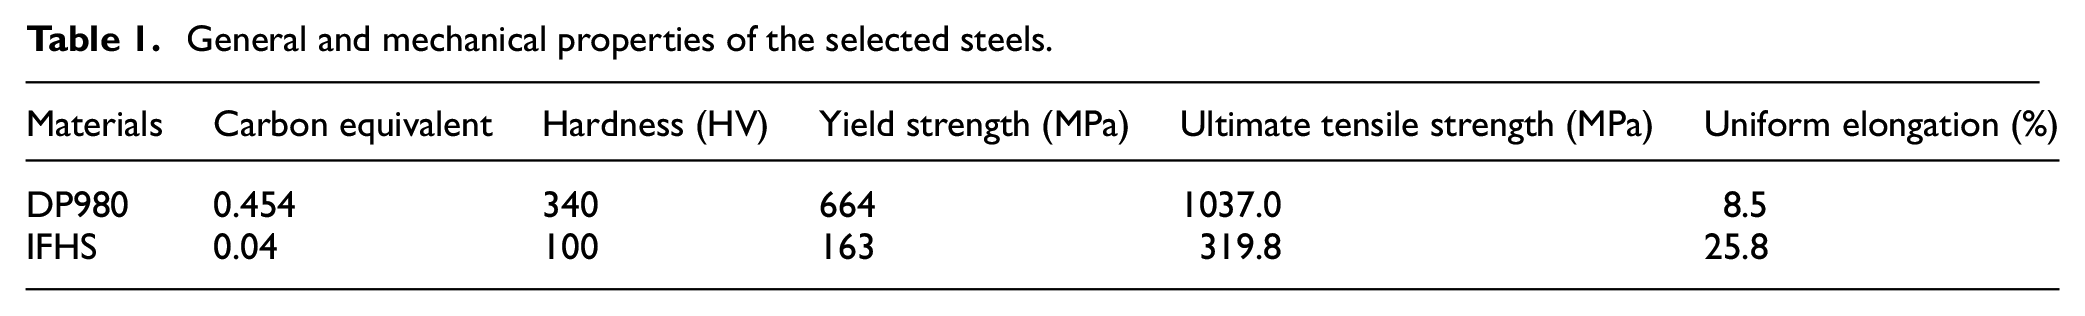
In the present study, two different automotive grade steels with a thickness of 1.2 mm were selected. Among the selected steels, one was dual phase steel, namely DP980 and the other one was interstitial free high strength (IFHS) steel. These two materials have different surface conditions, that is, the DP980 steels were galvanised, and IFHS steels were uncoated sheets. The physical properties, including carbon equivalent, hardness and mechanical properties of the steels, are listed in Table 1. The mechanical properties were evaluated along major material directions, that is, RD, DD and TD and the average values are reported.
General and mechanical properties of the selected steels.
These steels are selected due to their varying range of strength and ductility suitable for various applications, from improving crashworthiness to obtaining ergonomic shape. The DP980-IFHS TWB was fabricated using the laser welding method as it offers advantages like high power density, high aspect ratio, ease of automation etc.21–23 Keeping the sheets in butt joint configuration and employing a CO2 laser, the TWBs were welded utilising a power of 3 kW, a scan speed of 3000 mm/min and a shielding gas (Argon) with a flow rate of 20 LPM. The weld orientation was kept perpendicular to the RD.
Weld characterisation
Subsequent to the laser welding, the quality of the weld was assessed in terms of metallographic tests and cross weld tensile testing. Samples taken from TWBs were polished and observed under an optical microscope to confirm full weld penetration. Further, the microhardness tests were conducted across the weld region with 500 g load and 15 s dual time. During the microhardness test, it was observed that the hardness increased in the weld region compared to the corresponding parent metals for both the TWBs. The maximum hardness in the weld region was observed to be 398 HV. SEM micrograph confirmed predominant martensitic phases in that zone, which increased the hardness (Figure 1). The weld region was measured to have a width of 1.5 mm and was termed as a hard zone in the subsequent sections. The hardness values were observed to be reduced in the vicinity of the weld region at the DP980 side, which corroborated well with previous studies. 24 This region is termed as the soft zone (SZ).25,26 The SZ occurs due to the decomposition of the existing martensite phase in the region due to exposure to the temperature closer to but below the AC1 line. The broken martensitic structure was also observed in the present research (Figure 1). However, the micrograph at the above-right delineates a region from the weld zone and the presence of a certain amount of martensite can be seen there. The particular region is closer to the IFHS side, which is very lean in carbon equivalent, and hence hardness is lower in the region. Finally, uniaxial tensile tests keeping the weld perpendicular to the applied load direction (ASTM E8/E8M-11) were performed to estimate the weld strength. The failure was always observed on the IFHS side (Figure 1(b)). This indicated that the SZ at the DP980 side was not detrimental for the TWB.
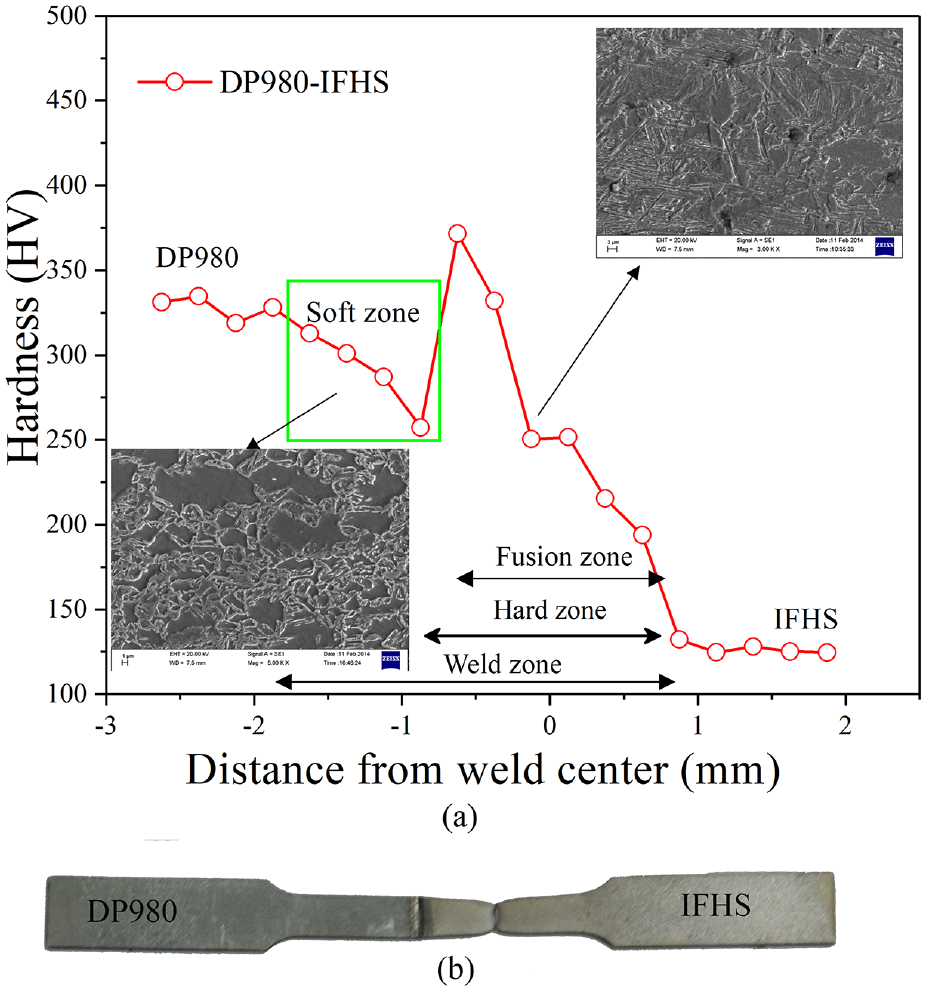
(a) Hardness and SEM microstructure and (b) failed tensile test samples.
Deep drawing experiments
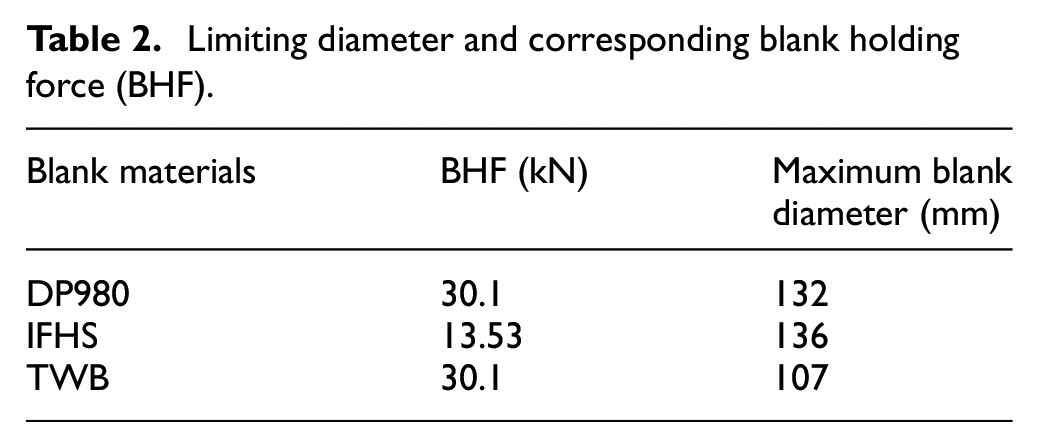
The deep drawing experiments were conducted using a flat bottom cylindrical punch with a diameter of 60 mm and a corner radius of 8 mm. The corresponding die diameter was 64 mm with a profile diameter of 10 mm (Figure 2(a)). The punch and the blank-holder for the deep drawing experiments were attached to the fixtures, which were respectively attached to the primary and secondary rams of a hydraulic press of 100-ton capacity. The die was fixed on a fixture attached to the press bed. The relative positioning of the tooling and the fixture design can be visualised elsewhere. 27 Deep drawing experiments of the parent materials were conducted to estimate the limiting drawing ratio (LDR) of the materials. The maximum blank diameters that were successfully drawn for each material are listed in Table 2, along with corresponding blank holding forces. The LDR evaluations for the TWB keeping the weld line position at the blank centre were also performed, and the results can be seen in Table 2. The drawn cups of parent materials and TWB are depicted in Figure 2(b).
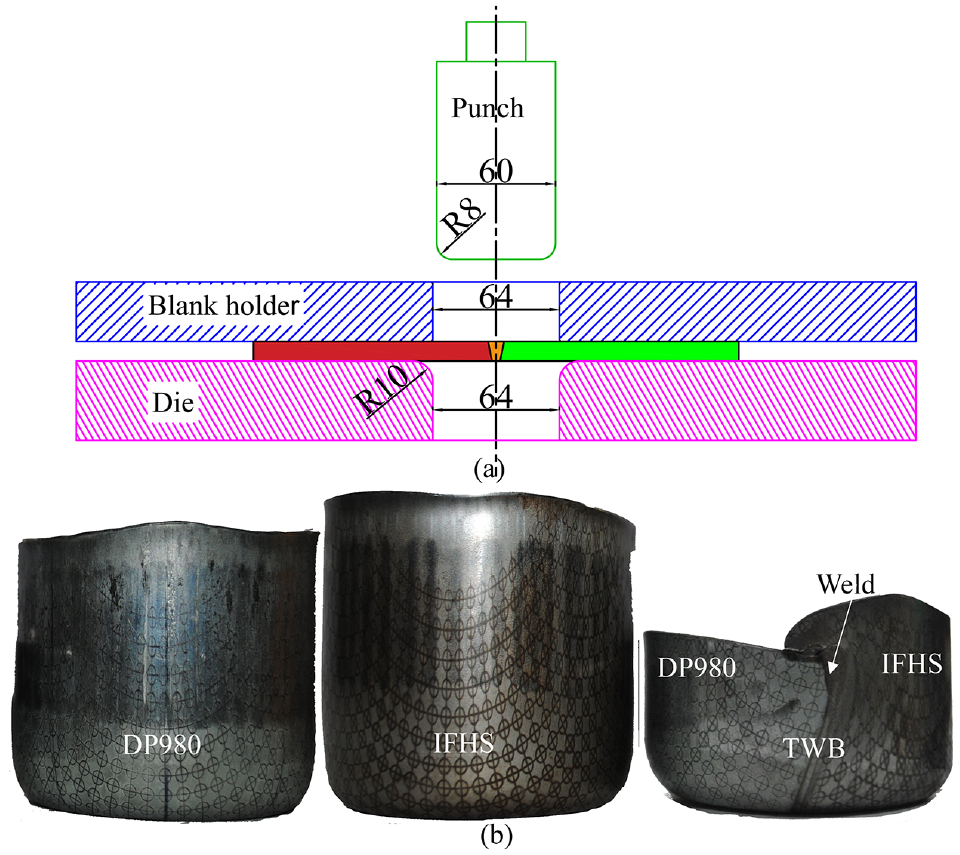
(a) Deep drawing tooling (dimensions are in mm) with the (b) drawn cups.
Limiting diameter and corresponding blank holding force (BHF).
Material modelling
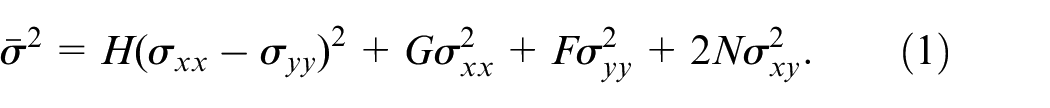
The formulation of the Hill48 in plane stress condition is shown in equation (1), where G, H, F and N are the anisotropic yield coefficients and
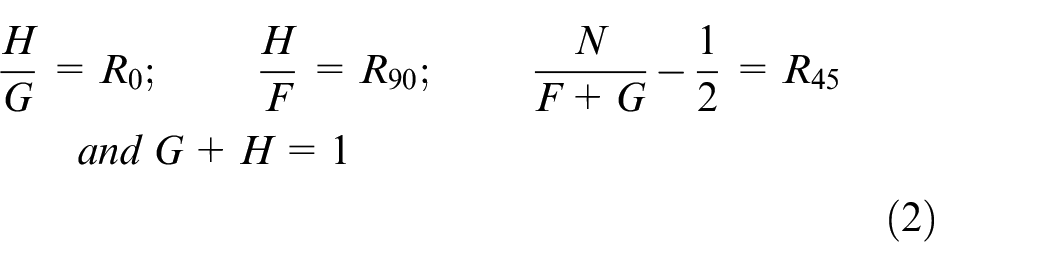
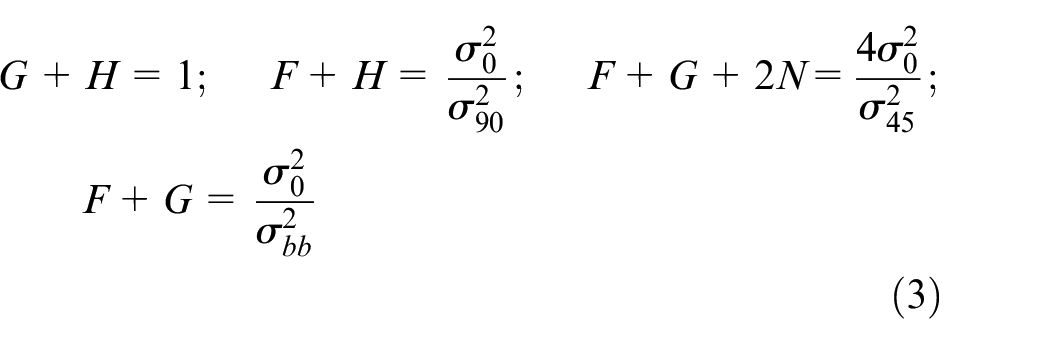
It can be seen from the above-mentioned formulations that the Hill48 material model is enabled only to consider four material anisotropies. Therefore, in this study, a non-associated flow rule (NAFR) was implemented, which enables two different yield functions to be incorporated in FE simulation as yield criterion and plastic potential function (Figure 3). Hence, both the definition of Hill48 yield model (R-value based or stress based) can be used at the same time, as a result of which the number of anisotropic parameters used in the FE modelling can be increased. Thus, if R-value based Hill48 is considered as yield function, then the normalised yield stress ratio along RD and three R-values, namely

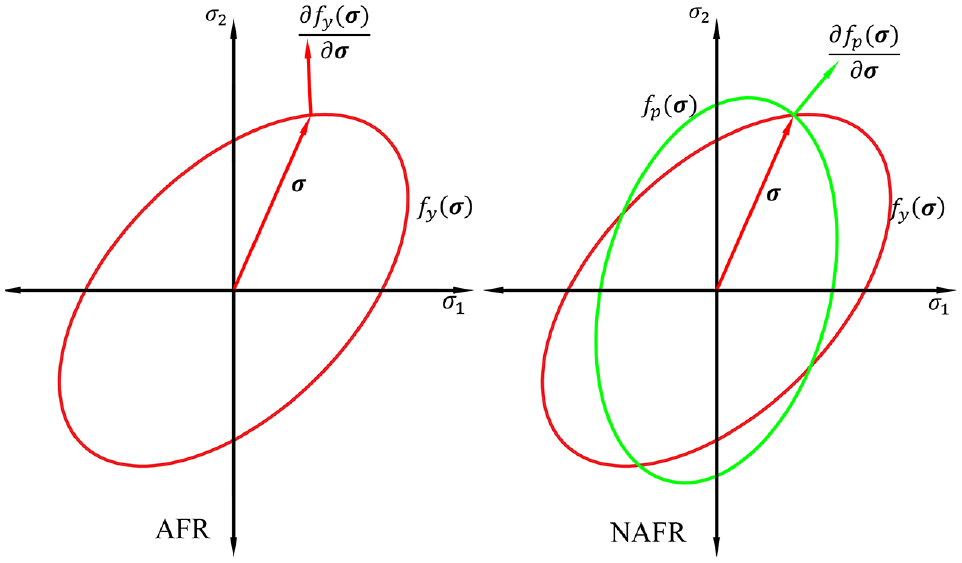
Comparison of AFR with NAFR.
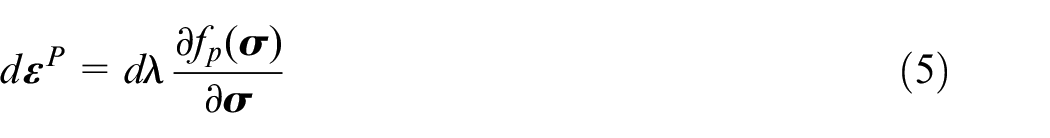
In equation (5),
A schematic diagram is shown in Figure 3 to indicate the difference in AFR and NAFR approach in the stress update algorithm employed in FE simulation.
In the case of AFR, the yield function is used to define the yielding limit of the material, and the same function is implemented to estimate the direction of the plastic strain rate increment, whereas in the case of the NAFR two independent functions are applied to define the material yielding and estimating the plastic strain rate increment.
Uniaxial tensile testings of standard ASTM E8/E8M-11 specimens along the three material directions, namely RD, DD and TD were performed to extract the details related to material anisotropy in terms of yield stress and R-values. Both R-values and yield stress values were assessed at strain values corresponding to 50% of the uniform elongation value of that particular metal.
28
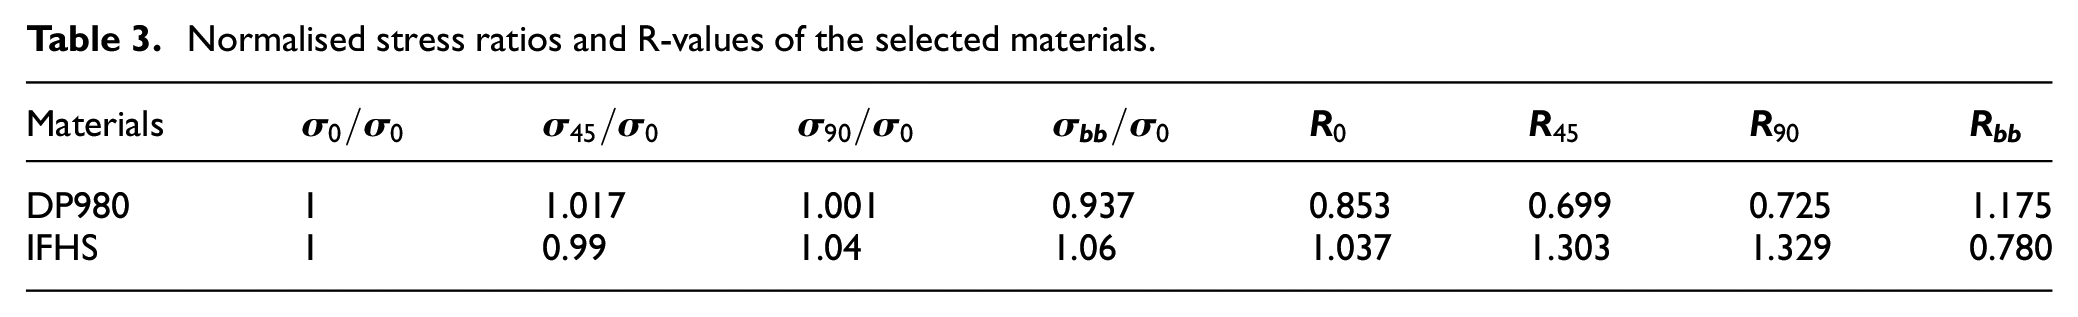
Therefore, the R-values were assessed at approximately 5% strain for DP980 and at 15% strain for IFHS. This is done to average out the evolution in anisotropic properties with an increase in plastic deformation. The evaluated values are listed in Table 3. However, yield stress (
Normalised stress ratios and R-values of the selected materials.
Hardening equations
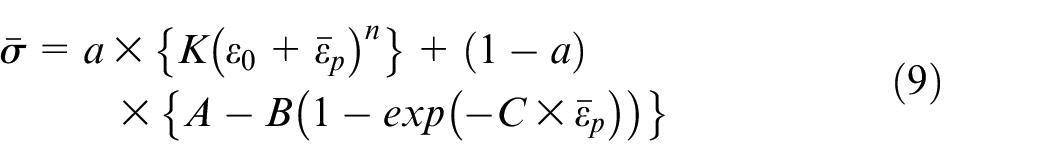
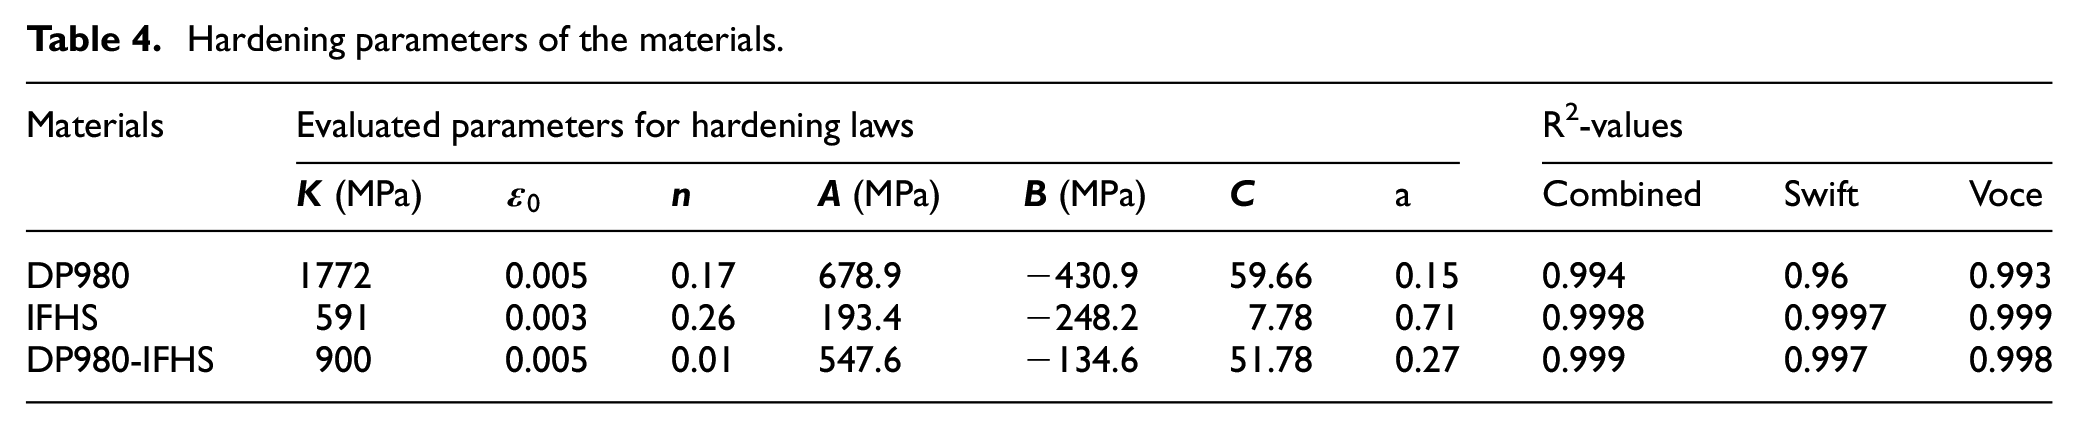
Relevant hardening parameters were obtained by fitting corresponding hardening equations to the plastic strain-true stress data obtained from the load-displacement data, which was acquired from uniaxial tensile testing of the material. For TWBs, micro tensile 30 samples along the weld were prepared for evaluating the material properties of the weld. Swift-hardening law (equation (7)), Voce-hardening law (equation (8)) and combined Swift-Voce hardening law 31 (equation (9)) were used to fit the plastic strain-true stress data collected from tensile testing results. The parameters for the combined hardening laws for all the parent metals and TWBs are reported in Table 4, along with the corresponding fitness (R2) values. It was observed that the combined hardening laws fitted very well with the experimental data compared with the Swift or Voce hardening laws, as can be seen from the reported R2 values in Table 4. The fitted curves for a parent metal (DP980) and a TWB (DP980-IFHS) were depicted in Figure 4 to highlight the nature of the fitted curves. Further, the prediction capability of all the hardening laws, including Swift, Voce and combined Swift-Voce laws, were verified with FE simulation of uniaxial tensile test. The FE tensile testing model was prepared in LSDYNA as per ASTM E8/E8M-11 standard. In the material model, three different flow curve responses were incorporated, and corresponding load-displacement curves were recorded separately for each of the input hardening curves. Finally, for IFHS parent material, the load-displacement curves predicted with the three hardening laws, are compared with the experimental data and shown in Figure 5. It can be observed that the predicted load-displacement curve obtained after incorporating the combined Swift-Voce model agreed well with experimental observation compared to the other two predicted curves. A similar observation was also obtained for DP980 material. Hence, in the present study, combined hardening laws were used in the FE simulations.


Hardening parameters of the materials.
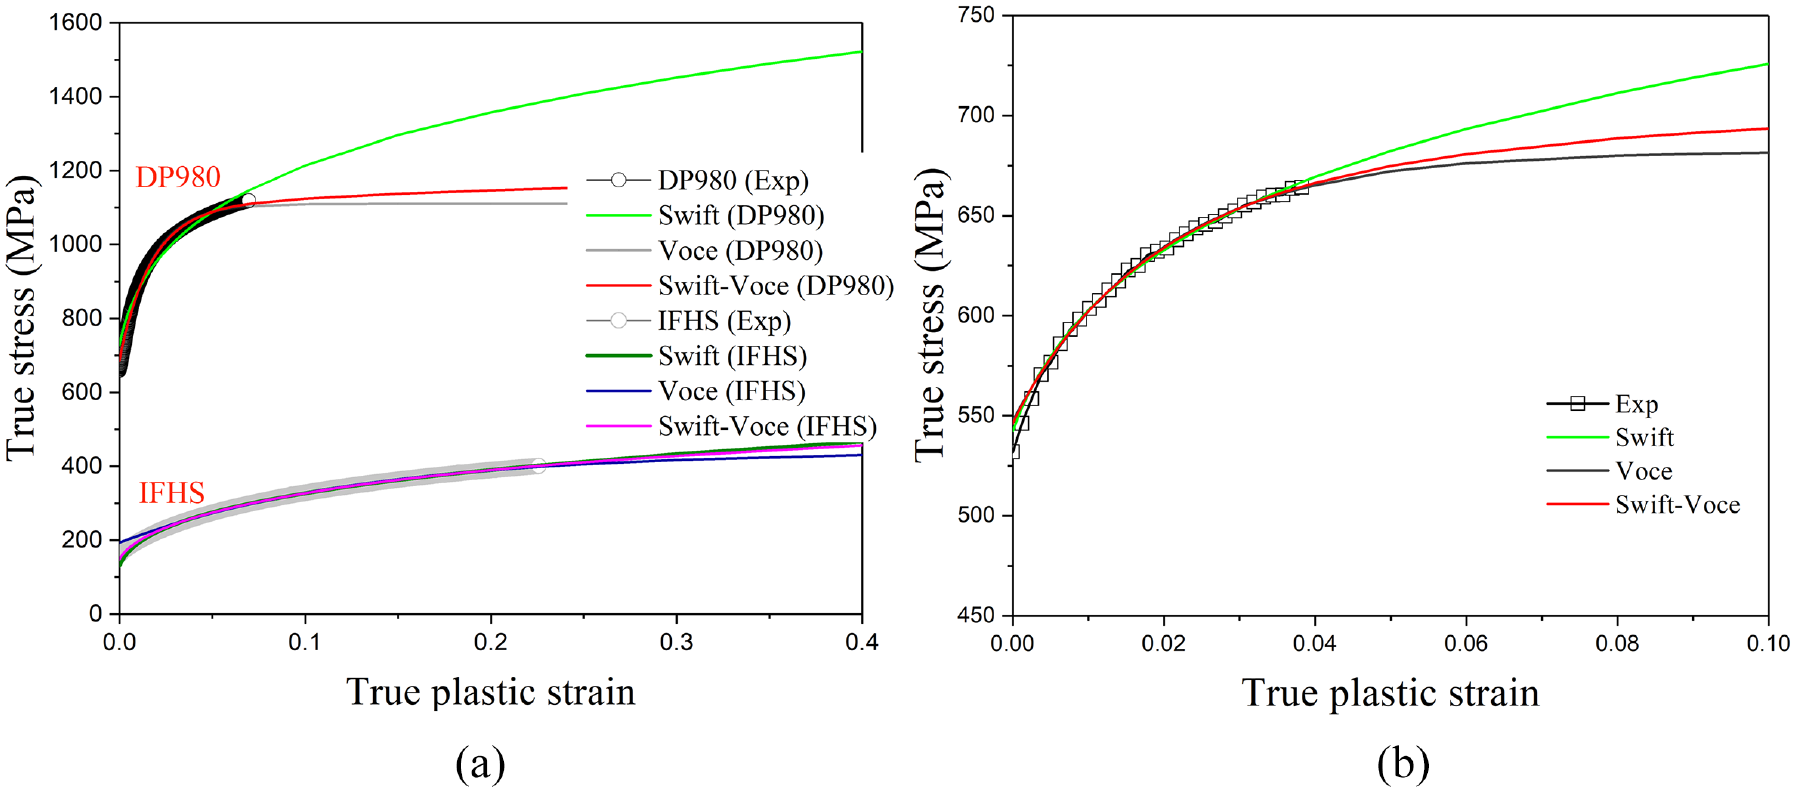
The fitted hardening models superimposed with the corresponding experimental data (a) parent materials and (b) TWB.
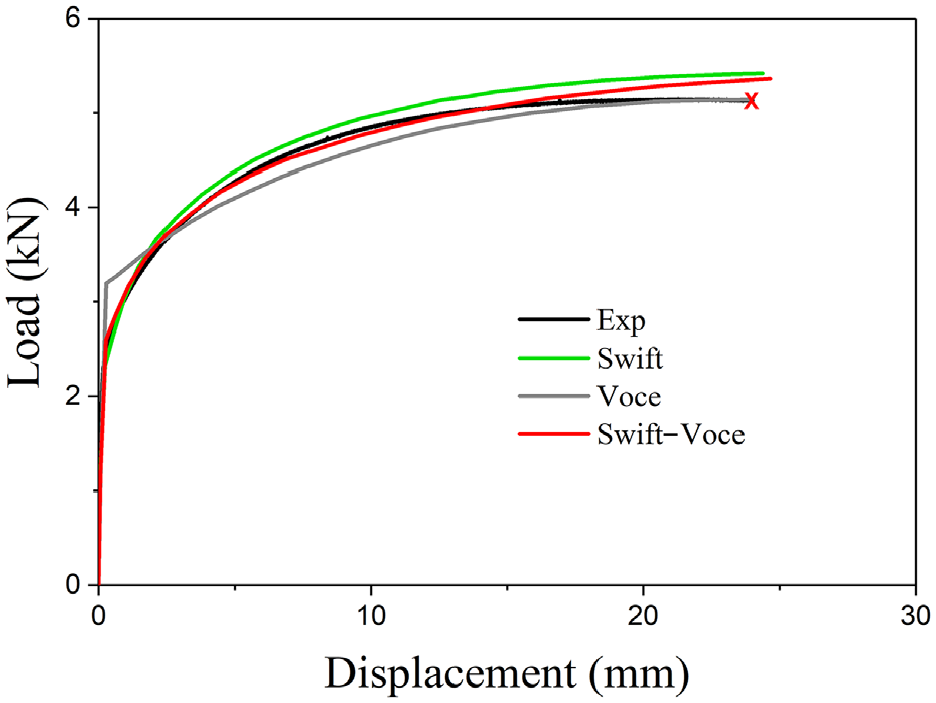
Comparison of predicted load-displacement curves from different hardening models with the experimental observation for IFHS sheet metal.
Finite element model
The finite element analysis of the deep drawing processes was performed incorporating a half symmetric tooling model for both parent metals and TWBs employing LSDYNA. The deformable blanks were discretised with a mesh size of 1.2 mm using Belytschko-Tsay shell elements,19,32,33 keeping five through thickness integration points.
34
The inbuilt re-meshing option in LSDYNA was activated to retain mesh quality during excessive deformation. However, in the soft zone and hard zone, the size of the mesh was approximately
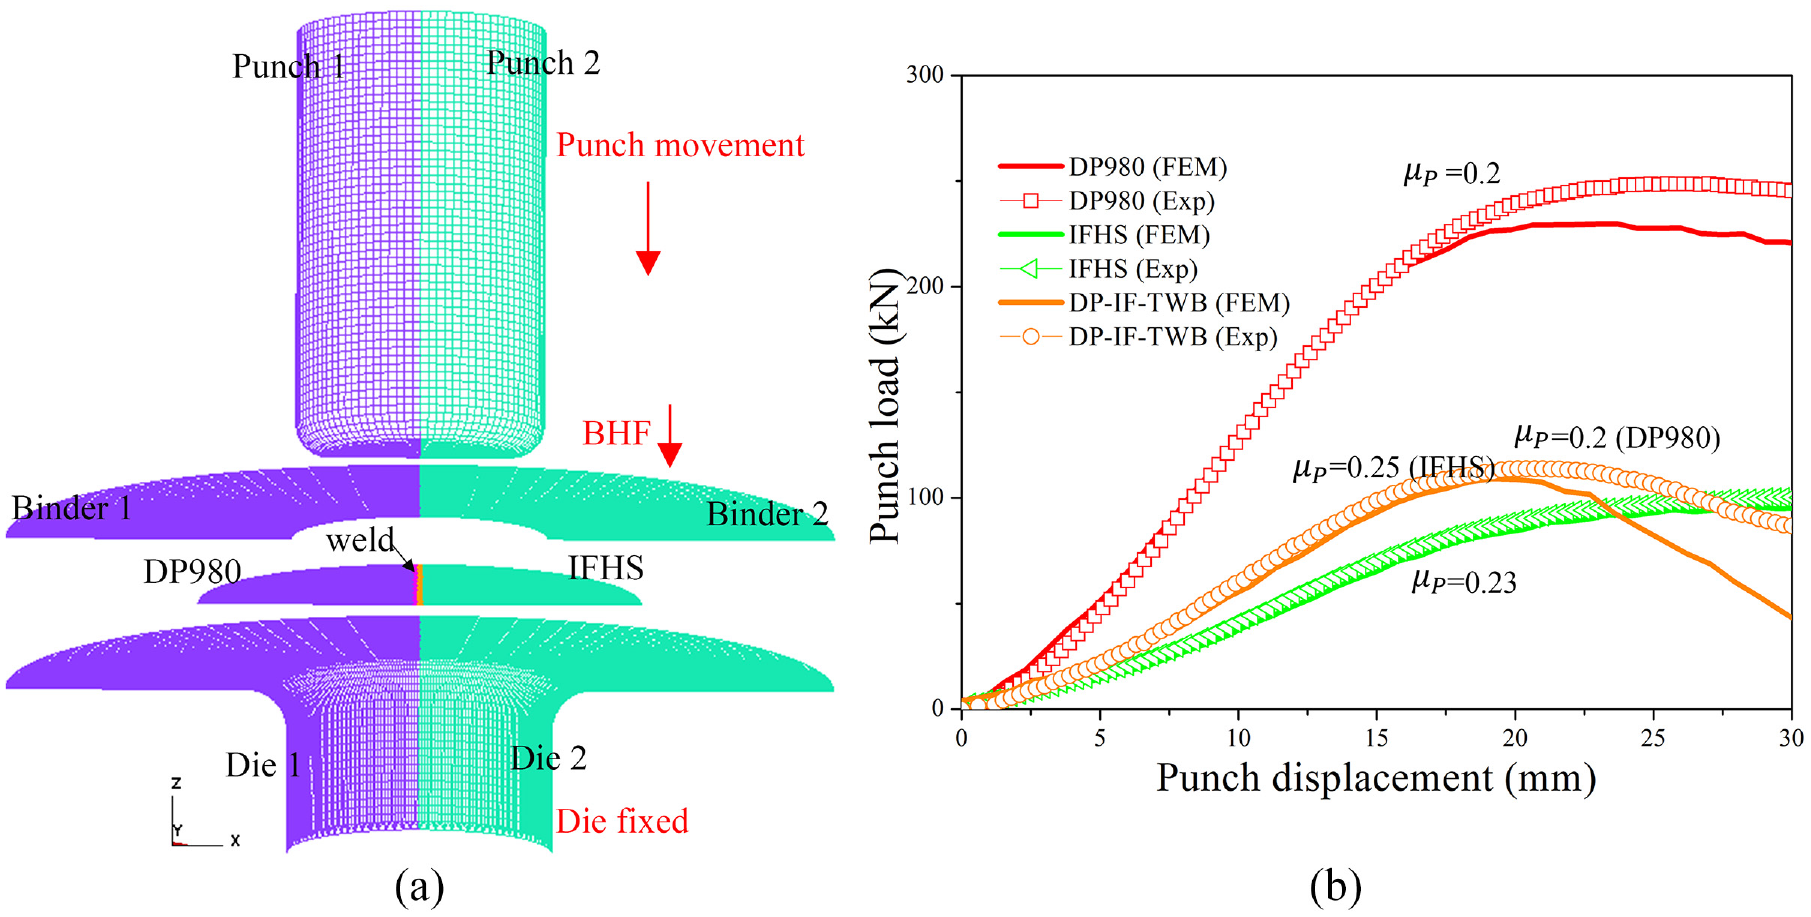
(a) Half symmetric FE model and (b) the comparison of load-displacement curves with corresponding punch friction (
In this study, a Fortran code was developed modifying the example code in LSDYNA theory manual to incorporate Hill48 in the form of NAFR along with the combined hardening model. 33
Results and discussion
Thickness distributions
The thickness distributions were measured for both the parent and TWB deformed cups to comprehend the deformation behaviour by identifying the regions with localised thinning. The thickness distributions of the deformed cups were measured after taking half section of the full drawn cups. For the parent metal, cup sections were taken along the RD, and for TWBs, sections were taken perpendicular to the weld. Also, the thickness was measured using a pointed anvil micrometre with a least count of 0.001 mm. In the case of parent cups, it was observed that the thickness at the cup bottom is almost the same as the undeformed sheets, and the thickness gradually decreased at the cup corner. 35 The sheet material thickness increases at the flange region with drawing operation due to the development of compressive stress. However, the trend differs in the case of deep drawn TWB cups, where extreme thinning (around 14% of the sheet thickness) is observed at the cup bottom of the IFHS side near the weld. Gradual thickening is observed at the cup wall on both sides of the TWB. Near the weldline, the weaker material is excessively stretched as stronger DP980 pulls the weldline towards itself, and the maximum thinning is observed. The nonuniform nature of deformation for TWB cups is clearly observed from the thickness profile of the cups, which also explains the onset of early thinning and lower LDR for the TWB.
The predicted thickness distribution for DP980 and IFHS parent cups are compared with the experimental results in Figure 7. It can be observed that the NAFR with (S + R) combination and the AFR based FE predicted the thickness distribution more accurately than the NAFR with (R + S) combination for DP980 (Figure 7(a) inset). From the Figure 7(a) inset, it can be observed that NAFR with (R + S) predicted more thickness at the same location of the cup wall compared to the other two approaches. For IFHS, predicted thickness distributions from all the simulation approaches (like NAFR with (R + S) or (S + R) and AFR) does not deviate much from each other (Figure 7(a)). In the case of DP980-IFHS cups, the predicted thickness profile from the NAFR with (S + R) combination is also marginally (with 3%−6% better prediction) closer to the experimental observation for both the sides. Overall, it is observed that the simulations based on NAFR with (S + R) combination provides marginally better prediction of the thickness distribution of deep drawn cups from parent metals and also from TWBs.
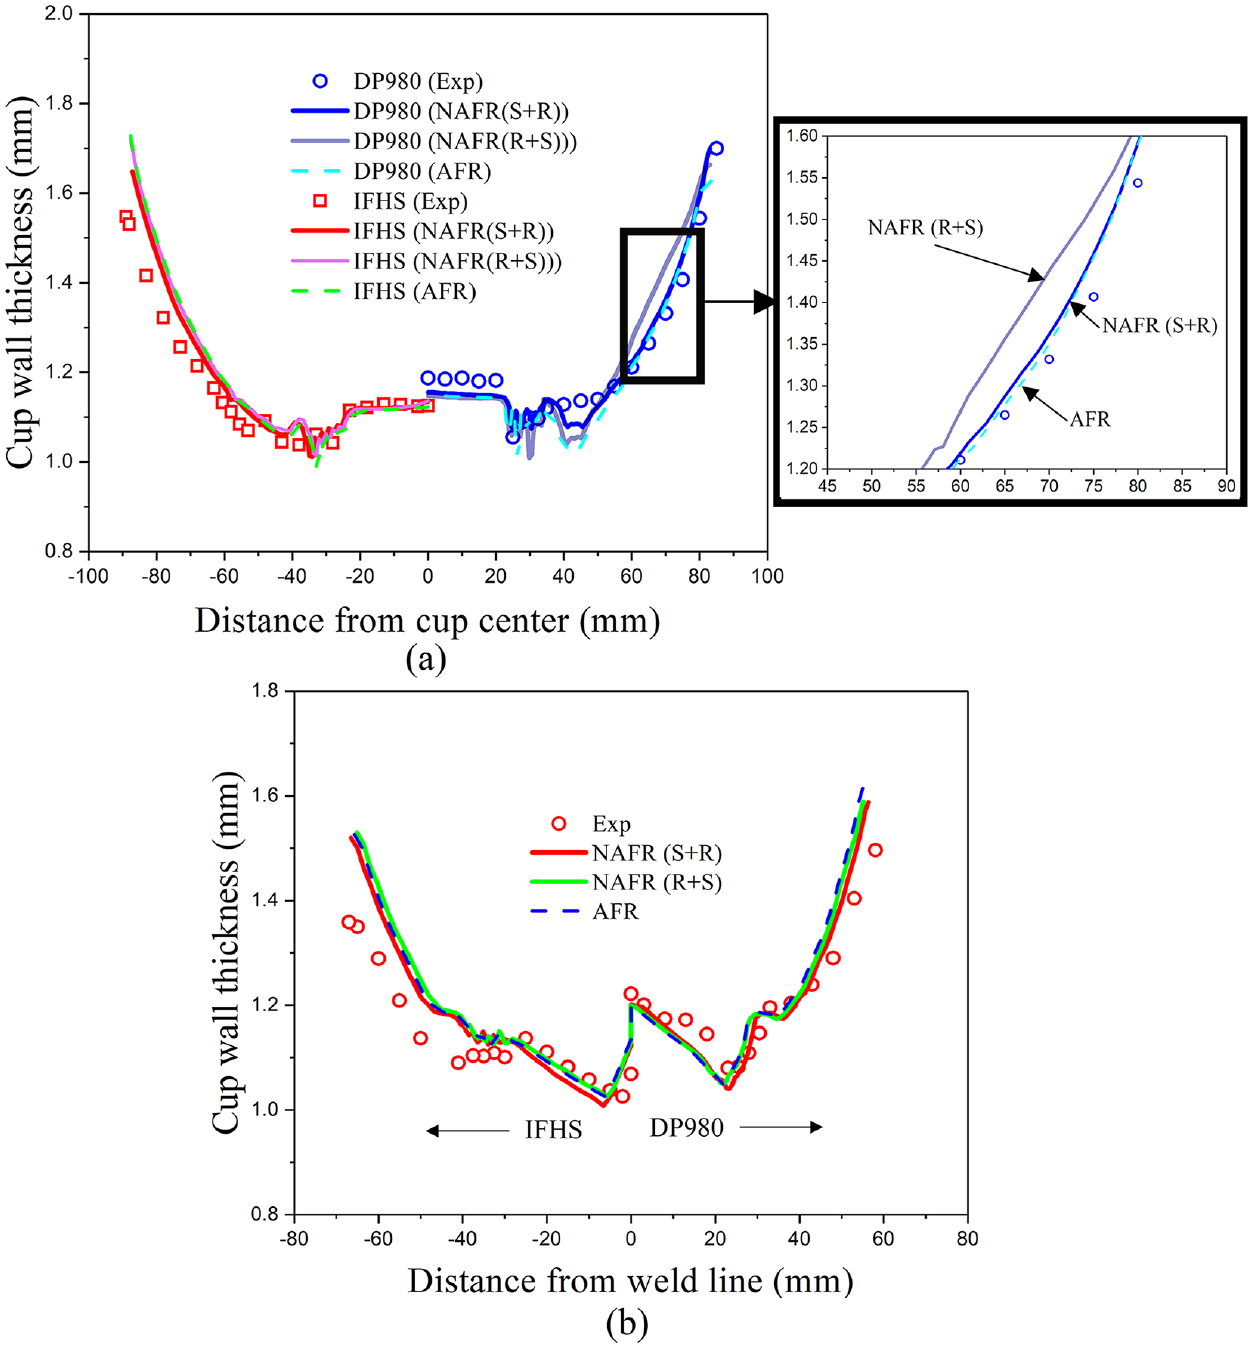
Comparison of thickness distributions (a) parent cups and (b) TWBs.
Cup edge profiles
Plastic anisotropy in the metal results in directional flow of the materials during deep drawing, and it causes the earing in the fully drawn cups.
35
The maximum earing is observed in the case of IFHS cups with a 13% variation in the cup height, while for DP980, a 4% undulation in the cup height is observed (Figure 8(a)). The earing heights can be correlated to the respective planer anisotropy
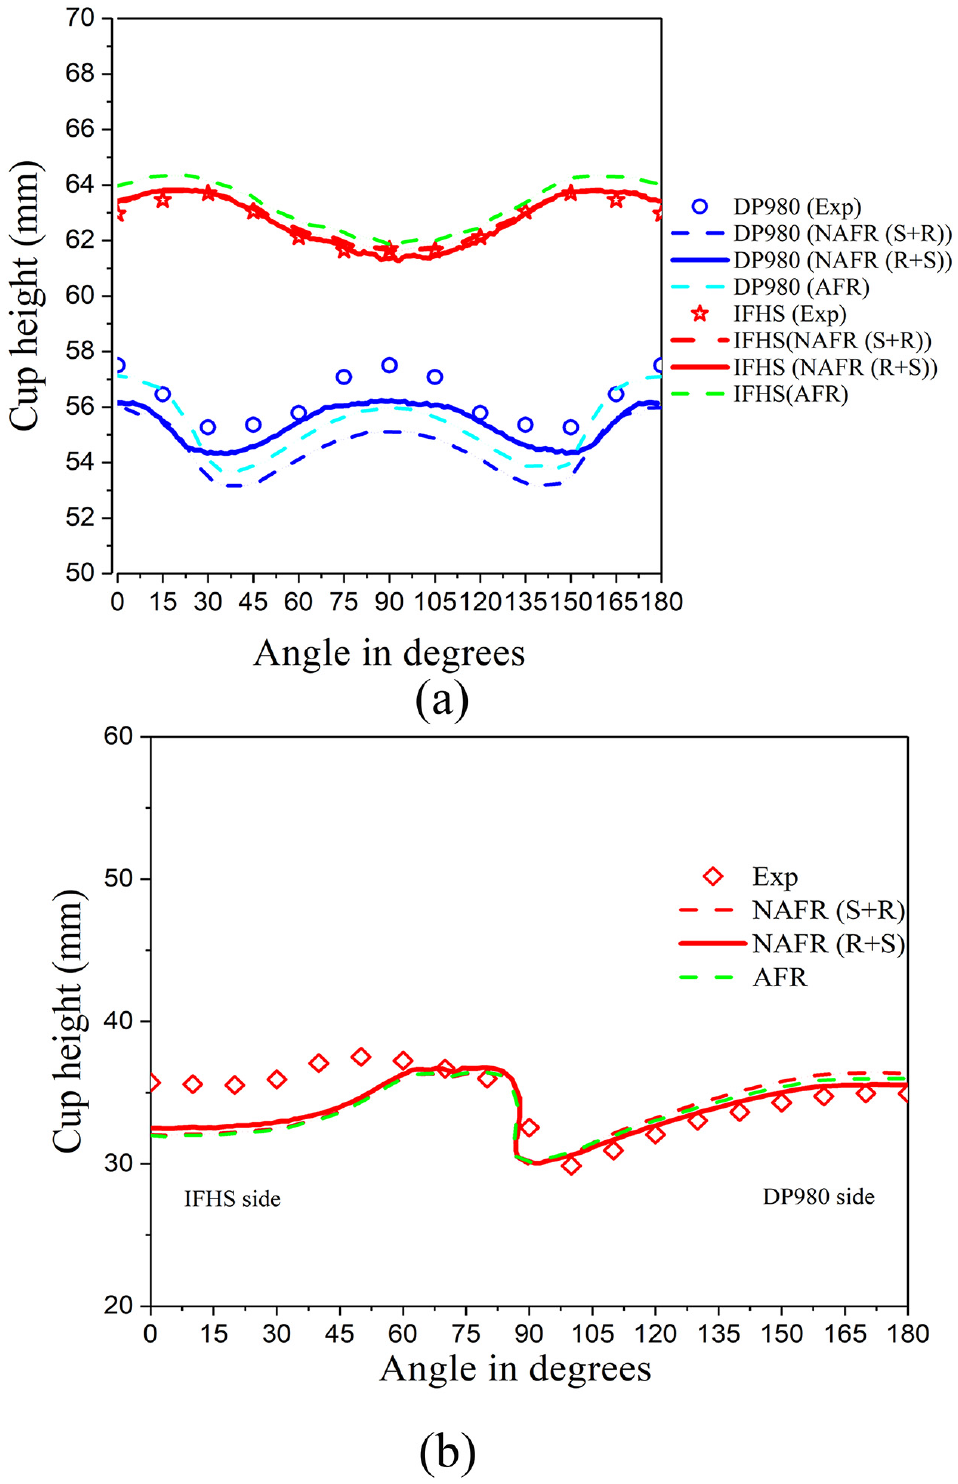
Cup height undulation of (a) parent metals and(b) TWBs (angles with respect to RD).
Figure 8 also compares the experimental cup heights with the corresponding simulation results. It can be observed that the predicted cup height results from the FE simulations are slightly different for DP980. On the one hand, a close inspection revealed that the simulation result from NAFR with (R + S) combination was able to predict the trend in cup height undulation quite properly for DP980 with a uniform deviation from the experimental values. However, the NAFR with (S + R) combination under predicted the cup height, particularly at the TD. On the other hand, the predicted cup height from AFR based simulation is close to experimental observation at RD but largely deviated along TD. In the case of IFHS cups, the predicted cup height undulation from simulations with both the NAFR combinations corroborated well with the experimental observation compared to the results obtained from AFR based simulation. In general, it is reported that FE simulation, incorporating AFR with yield function based on stress values, predicts the height variation between peak and valleys of the earing, 29 and AFR with yield function based on R-values predicts maximum cup heights only. Similarly, in this study, simulations with R-value based AFR predicted only the maximum cup height for DP980 as can be seen in Figure 8. However, incorporation of the NAFR based simulation, particularly NAFR with (R + S) combination, enhances the accuracy of the simulation results in terms of both the height variation and peak heights simultaneously. In the case of the TWBs, the undulation in the cup height is properly predicted, including the sudden change in the cup height in the IFHS side close to the weld by all the FE simulations implemented in this present study. However, close observation reveals that predicted cup height with (R + S) combination is slightly better to match the experimental observation and the improvement in earing prediction was almost 20% greater than the other two approaches.
Weldline movement
Similar to the discussion in the previous section, DP980 resists both radial tension and circumferential compressive stresses, and these two are the two predominant stress states during deep drawing. Hence at the cup bottom, weldline shifts towards DP980 from the initial position. Also, the weaker material is stretched at the cup bottom near the weld. At the cup wall, the weldline shifts towards the weaker material as DP980, being more resistive to the compressive stress, pushes the weldline towards the weaker side. The weldline takes a turn towards the DP980 side at the cup edge. Material of the IFHS side expands towards the outside at the cup edge near the weld, as explained in the previous section. This excess material pushes back the weld towards the DP980 as no material is present at the opposite side to hold out against. So, a curvilinear weld movement is observed in the case of deep drawn cups of TWBs. The weld displacement is more at the cup centre and near the top edge of the cup. In Figure 9, the weldline movement from the simulation with (R + S) based NAFR is correlated well with the experimental results.
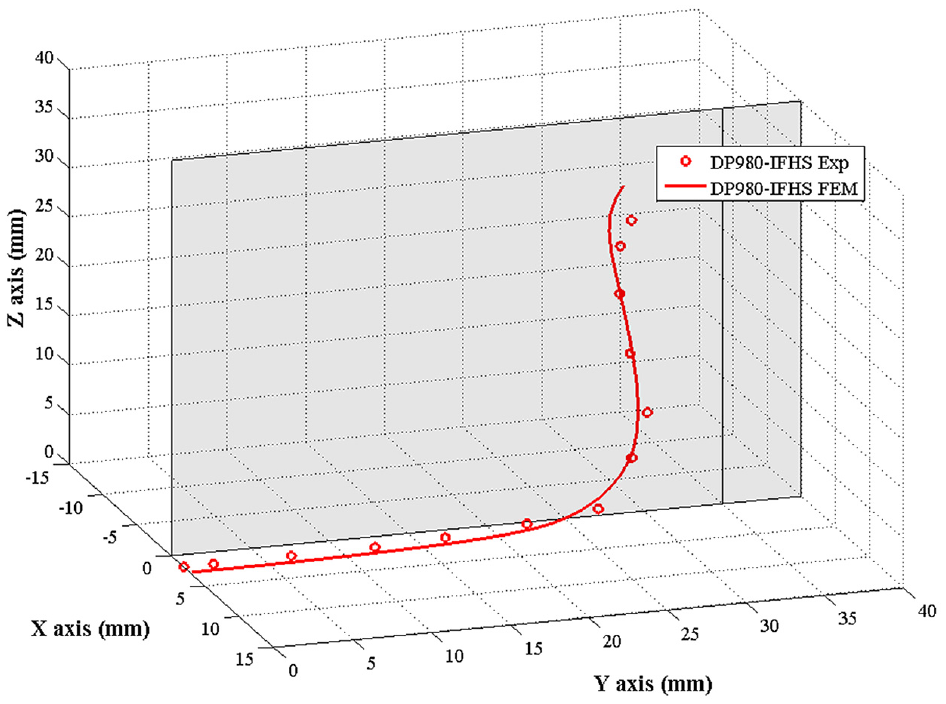
Comparison of the weldline movements for DP980-IFHS TWBs.
Stress-strain analyses of deep drawn TWB-cups
The loci of the Hill48 yield function in plane stress condition were plotted for the two parent metals using both stress value based (
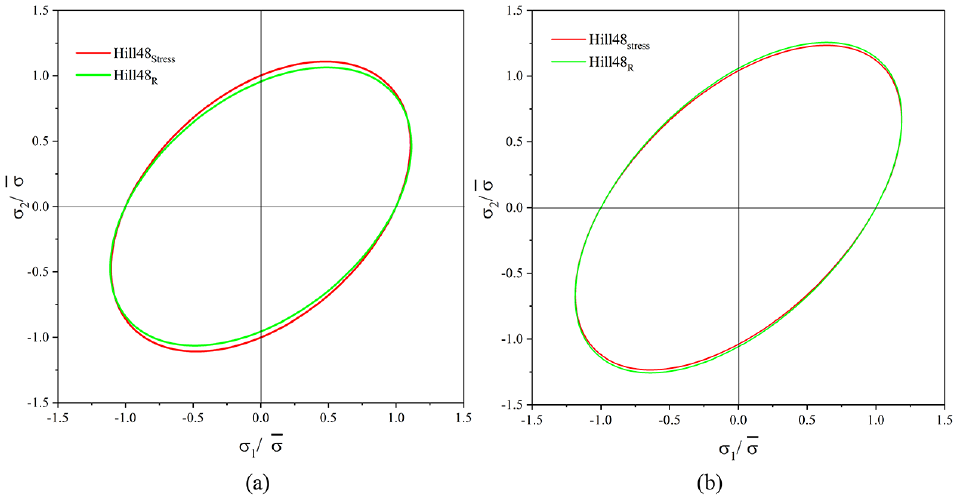
Hill48 loci for (a) DP980 and (b) IFHS.
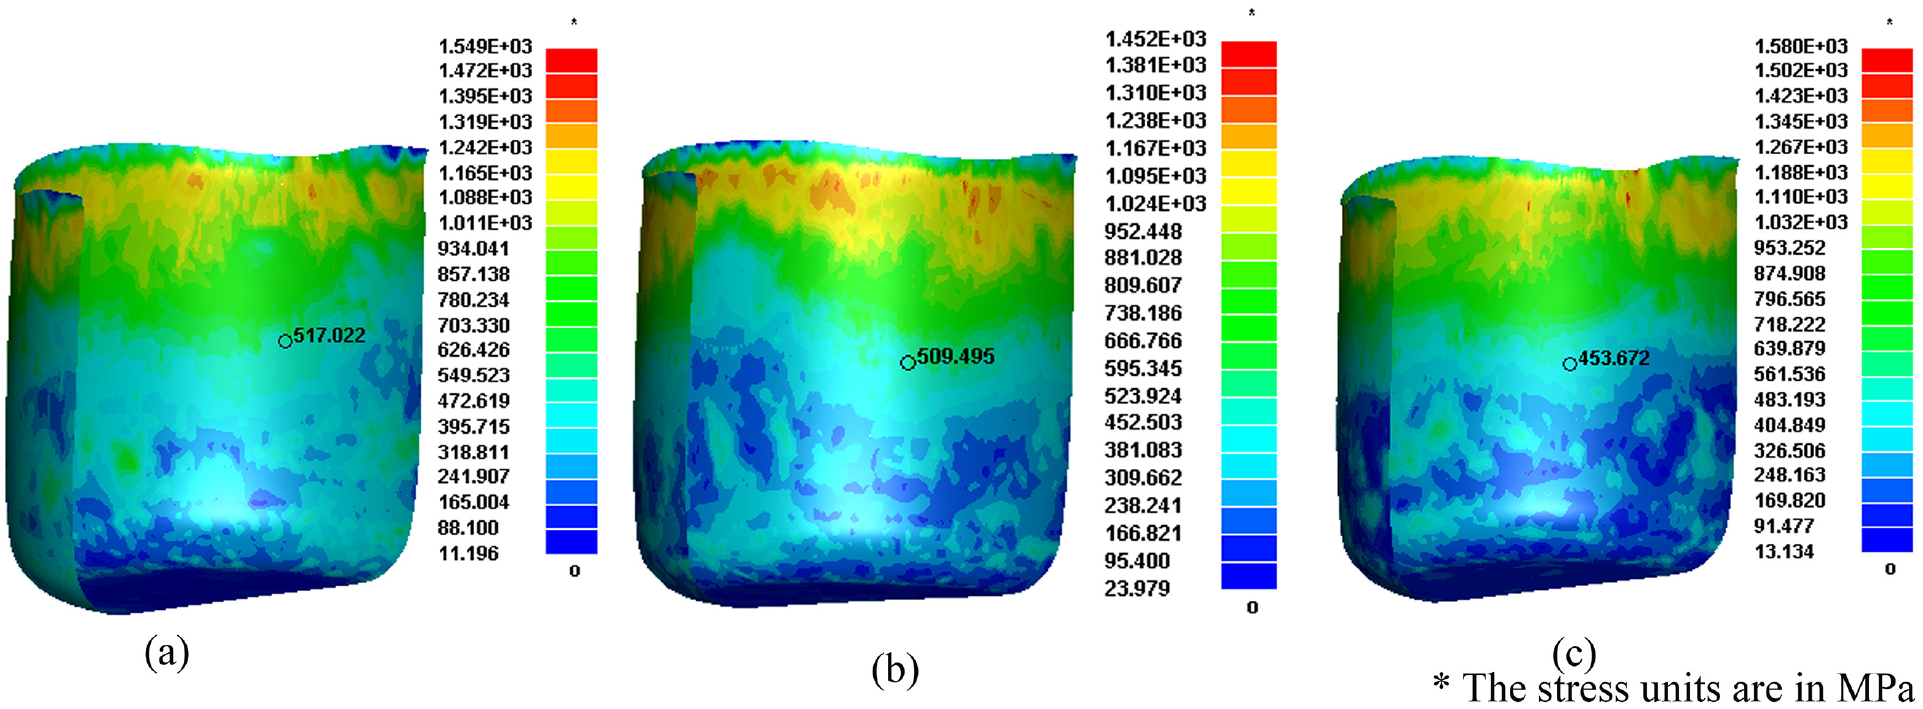
Comparison of principal stress 1 for DP980 material (a) NAFR (S + R) (b) NAFR (R + S) and (c) AFR.
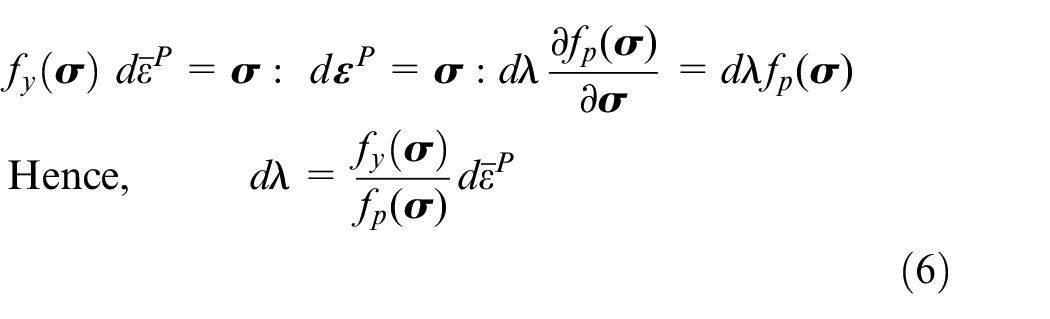
According to the stress update algorithm stress increment is expressed as
For the TWB, the predicted strain states, based on NAFR simulations with (S + R) combination, are compared in Figure 12. The strain values at four nodes were also highlighted for better comprehension. From both the figure, it can be observed that the DP980 side experiences less amount of compressive strain at the cup wall compared to the IFHS side, which results weldline movement and subsequent hump at the IFHS side (arrow marked zone in Figure 12). The hump occurs due to excessive radial deformation of IFHS just near the weld as the material flows in an outward direction to satisfy incompressibility conditions. Excessive near plane strain stretching is also observed at the cup bottom compared to the DP980 side, causing the localised thinning (Figure 7). These observations support the explanations given in the Sections 4.1 and 4.2.
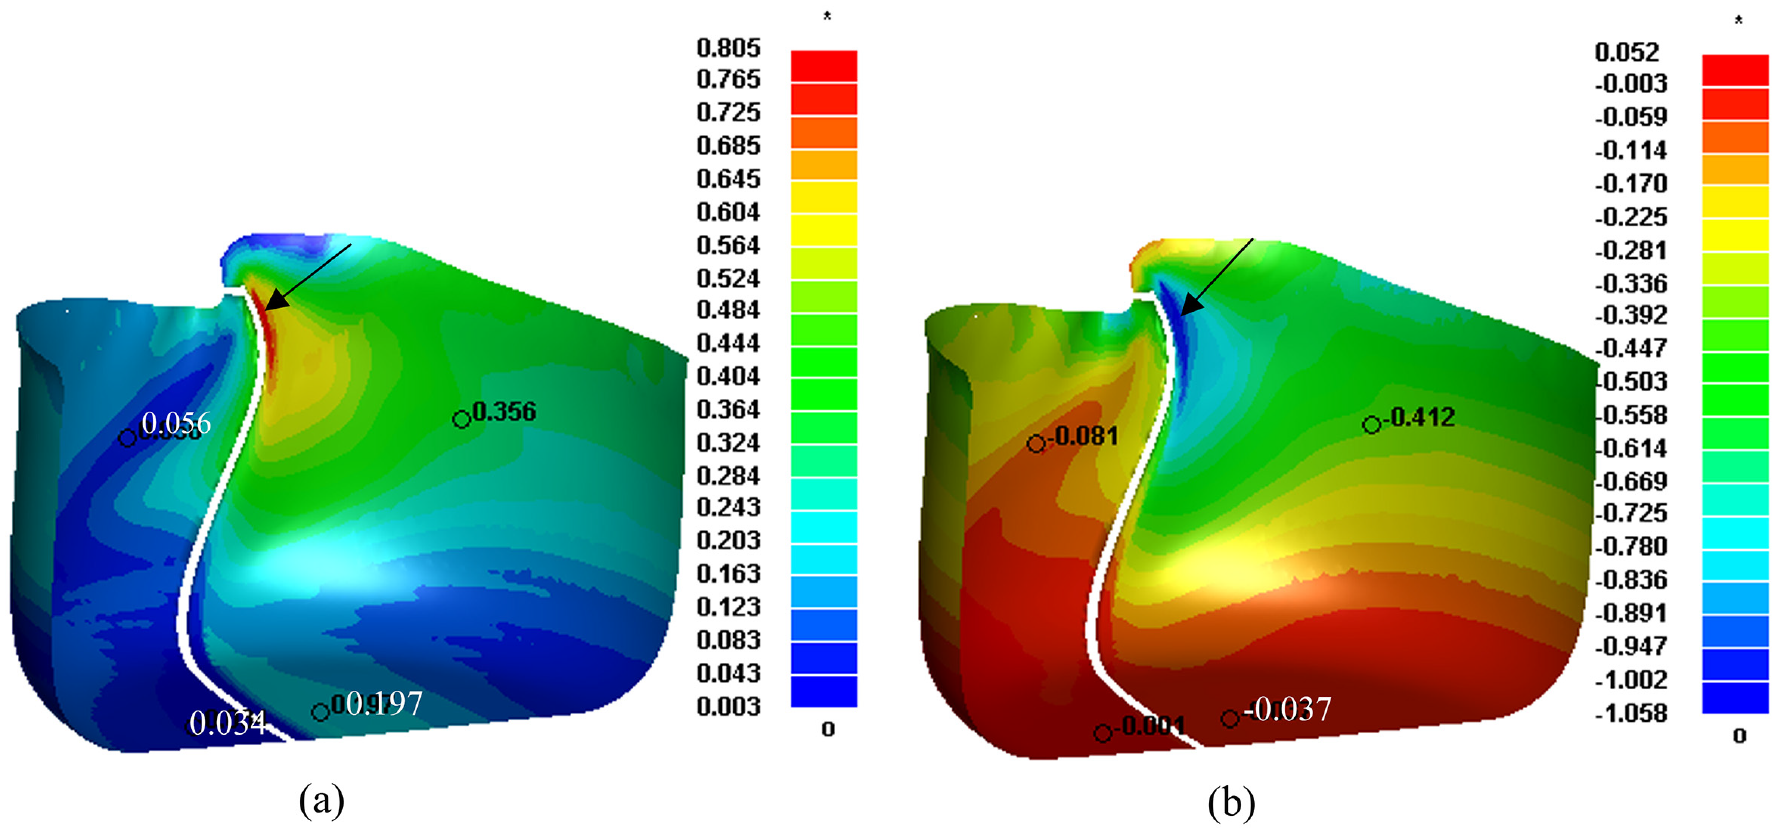
Comparison of (a) major and (b) minor strain state for NAFR with (S + R). The SZ is muted in the images to indicate the weldline.
A close observation on Figures 7(a) and 8(a) reveals that predicted results from both the NAFR based simulations and the AFR based simulations are relatively closer to one another for IFHS material. The difference in predicted results by the different simulation approaches was clearly visible for DP980, but that was not the case for IFHS. This can be attributed to the similar yield locus of Hill48 obtained from R-value and stress valued based calculation for the IFHS materials (Figure 10(b)). The use of similar yield locus as yield function and plastic potential function makes the FE predicted results similar to the results obtained from AFR based simulation. Hence, NAFR based simulation yields enhancement in prediction accuracy if the R-value and stress value based yield locus defer significantly. It is also to be noted that cup height undulation was closely predicted for IFHS cups compared to DP980 cups. This can be attributed to the intrinsic shape of the yield function. Hill48 being a quadratic yield function, has an intrinsic problem to represent material which shows
Conclusions
The following conclusions can be drawn from the present research work.
The non-uniform deformation behaviours in terms of undulated cup height, weldline movement and thickness distribution during deep drawing of TWBs were predicted by the FE model, implementing NAFR based approach reasonably well. Application of NAFR enhanced the prediction capabilities, while avoiding the use of advanced yield formulations.
The combined Swift-Voce hardening law had been successfully implemented in the FE model. Also, separate friction coefficients on either side of the TWB in contact with rigid tools were implemented. Hence, it can be concluded that the implementation of Swift-Voce combined hardening law and different coefficients of friction improved the prediction of formability results apart from the use of NAFR in the FE model.
The FE prediction accuracy was better with the use of NAFR based material model as compared to that of AFR based approach when the R-based and stress-based formulation lead to different yield loci as observed in the case of DP980 material. If the R-based and stress-based yield functions generate similar yield loci, then the FE predicted results were found to be similar in both NAFR and AFR based approaches, as observed in the case of IFHS material.
It was found that the NAFR approach with R-based yield function and stress-based potential function (R + S) yielded better prediction of the undulated cup height (for TWB, improvement in earing prediction was almost 20% greater than other two approaches), whereas the (S + R) combination predicted the thickness profile (improvement in thickness prediction 3%–6% better than other approaches) of the deep drawn cup with better accuracy. Therefore, depending upon the material, the NAFR combination should be chosen.
Footnotes
Acknowledgements
The authors acknowledge the help provided by Dr. Thirthankar Chakraborty [PhD (Comparative Literature): University of Kent, 2017], also a faculty member at IIT Bhilai for improving the English of the manuscript.
Declaration of conflicting interests
The author(s) declared no potential conflicts of interest with respect to the research, authorship, and/or publication of this article.
Funding
The author(s) received no financial support for the research, authorship, and/or publication of this article.